Bid Takers or Market Makers? The Effect of Auctioneers on ...
40
NBER WORKING PAPER SERIES BID TAKERS OR MARKET MAKERS? THE EFFECT OF AUCTIONEERS ON AUCTION OUTCOMES Nicola Lacetera Bradley J. Larsen Devin G. Pope Justin R. Sydnor Working Paper 19731 http://www.nber.org/papers/w19731 NATIONAL BUREAU OF ECONOMIC RESEARCH 1050 Massachusetts Avenue Cambridge, MA 02138 December 2013 We benefited from the comments of seminar participants at UC Berkeley, Boston University, Colgate, Cornell, MIT, Queen’s University, the University of Chicago, Toronto, Wisconsin-Madison, the Bank of Italy, and conference participants at the 2013 IZA Workshop on Behavioral Economics, the 2013 European Behavioral Economics Meeting, the 2013 NBER Summer Institute, the 2013 Stanford Institute for Theoretical Economics, and the 2013 FTC Microeconomics Conference. Special thanks to Eric Budish and Tim Van Dam for helpful comments and suggestions; and to Barb Richards of the Canadian Auction College for allowing one of the authors to attend auctioneer college classes. The views expressed herein are those of the authors and do not necessarily reflect the views of the National Bureau of Economic Research. NBER working papers are circulated for discussion and comment purposes. They have not been peer- reviewed or been subject to the review by the NBER Board of Directors that accompanies official NBER publications. © 2013 by Nicola Lacetera, Bradley J. Larsen, Devin G. Pope, and Justin R. Sydnor. All rights reserved. Short sections of text, not to exceed two paragraphs, may be quoted without explicit permission provided that full credit, including © notice, is given to the source.
Transcript of Bid Takers or Market Makers? The Effect of Auctioneers on ...

NBER WORKING PAPER SERIES
BID TAKERS OR MARKET MAKERS? THE EFFECT OF AUCTIONEERS ON AUCTIONOUTCOMES
Nicola LaceteraBradley J. Larsen
Devin G. PopeJustin R. Sydnor
Working Paper 19731http://www.nber.org/papers/w19731
NATIONAL BUREAU OF ECONOMIC RESEARCH1050 Massachusetts Avenue
Cambridge, MA 02138December 2013
We benefited from the comments of seminar participants at UC Berkeley, Boston University, Colgate,Cornell, MIT, Queen’s University, the University of Chicago, Toronto, Wisconsin-Madison, the Bankof Italy, and conference participants at the 2013 IZA Workshop on Behavioral Economics, the 2013European Behavioral Economics Meeting, the 2013 NBER Summer Institute, the 2013 Stanford Institutefor Theoretical Economics, and the 2013 FTC Microeconomics Conference. Special thanks to EricBudish and Tim Van Dam for helpful comments and suggestions; and to Barb Richards of the CanadianAuction College for allowing one of the authors to attend auctioneer college classes. The views expressedherein are those of the authors and do not necessarily reflect the views of the National Bureau of EconomicResearch.
NBER working papers are circulated for discussion and comment purposes. They have not been peer-reviewed or been subject to the review by the NBER Board of Directors that accompanies officialNBER publications.
© 2013 by Nicola Lacetera, Bradley J. Larsen, Devin G. Pope, and Justin R. Sydnor. All rights reserved.Short sections of text, not to exceed two paragraphs, may be quoted without explicit permission providedthat full credit, including © notice, is given to the source.

Bid Takers or Market Makers? The Effect of Auctioneers on Auction OutcomesNicola Lacetera, Bradley J. Larsen, Devin G. Pope, and Justin R. SydnorNBER Working Paper No. 19731December 2013JEL No. D03,D44,J24,L62,M5
ABSTRACT
A large body of research has explored the importance of auction design and information structure forauction outcomes. Much less work has considered the importance of the auction process. For example,in many auctions, auctioneers are present and can impact the process of the auction by varying startingprices, level of price adjustments, the speed of the auction, the way they interact with auction participants,or their characteristic chant that is intended to excite buyers. We explore the importance of auctionprocess by testing whether auctioneers can have a systematic difference on auction outcomes. Weanalyze more than 850,000 wholesale used car auctions and find large and significant differences inoutcomes (probability of sale, price, and auction speed) across auctioneers. The performance heterogeneitiesare stable across time and correlate with subjective evaluations of auctioneers provided by the auctionhouse. Although the available data here do not allow us to conclusively isolate mechanisms, a rangeof evidence suggests a role for tactics that generate excitement among bidders. Overall, these findingsillustrate the complexities of auction environments and how outcomes can be impacted by subtle changesin process.
Nicola LaceteraUniversity of Toronto105 St. George StreetToronto, ON M5S 2E9Canadaand [email protected]
Bradley J. LarsenStanford University579 Serra MallStanford, CA [email protected]
Devin G. PopeBooth School of BusinessUniversity of Chicago5807 South Woodlawn AvenueChicago, IL 60637and [email protected]
Justin R. SydnorUniversity of Wisconsin - Madison975 University AvenueMadison, WI 53706 [email protected]

1
1. Introduction
Auctions are central features of many markets, including those for radio spectrums, used industrial
machinery, livestock, used cars, antiques, government-owned property, procurement, debt instruments,
charity, and real estate. It is therefore not surprising that economists have developed a large body of
research on the functioning of auctions, including theoretical, experimental, and empirical studies. Much
of this work has focused on exploring the effects of different auction structures, comparing common
designs such as English, Dutch, first-price sealed-bid, and second-price auctions, and assessing their
revenue generation and efficiency. The literature has paid particular attention to how the performance of
different auction designs may depend on the underlying distributions of product valuations and the level
of information available to market participants.1
Although a large literature has explored the importance of auction structure to outcomes, the process
of running an auction (conditional on the auction design) has received much less attention. As some
auction theorists have noted (Klemperer, 2002; Milgrom, 2004), many auctions involve human
participants who may be misinformed or boundedly rational in some way. In these settings, the details
associated with how an auction is run may significantly influence outcomes.
An example of how auction process may vary from one auction to another is the leeway that a live
auctioneer has in choosing how to run an ascending-bid auction. Theoretical models of auctions largely
abstract from the role of the auctioneer in the auction process. In particular, Milgrom and Weber (1982)
modeled English auctions assuming that prices rise continuously from a low level and that all participants
hold down a button and can be observed dropping out of the auction at some point when the price rises
too high. Within that structure, there is no role for an auctioneer and the focus naturally becomes on the
information structure (e.g., private signals) of the bidders in the auction. But as Milgrom and Weber
themselves highlight, many real-world ascending-bid auctions involve human auctioneers who are
typically experienced professionals. These auctioneers may influence the process of an auction by
choosing opening bid amounts, changing the pace of price adjustment, and deciding when to stop the
bidding. In addition, many auctioneers (especially in the U.S.) interact with bidders and call out bids in a
fast-paced, rhythmic chant, attempting to create a sense of urgency and excitement among bidders.
In this paper, we explore whether these real-world details of the auction process are important for
understanding auction outcomes by studying whether auctioneers have a systematic impact on auction
outcomes. Although the impact of single individuals on organizational outcomes has been explored in
1 An overview of auction theory can be found in Bulow and Roberts (1989), Klemperer (2004), and Milgrom (2004).

2
other contexts (e.g. CEOs and bosses, judges, teachers, scientists, and political leaders),2 there has been
no systematic empirical analysis of the impact of auctioneers on relevant outcomes.3 We investigate this
question in the context of wholesale, used-car auctions. This market is well suited to studying the role of
auctioneers for several reasons. First, these are large markets – more than 10 million used cars are traded
in the U.S. at wholesale auctions each year (Manheim, 2011), totaling over $80 billion in sales (NAAA,
2009). Second, because both buyers and sellers are professionals and because these cars are high-value
goods, we expect all participants to have strong incentives. Third, as we will argue below, the institutional
features and data available allow us to capture the causal impact of individual auctioneers on prices, the
probability of sale, and other performance measures. Finally, the structure of these auctions is an
ascending auction (English-style) with a live auctioneer and no pre-determined time limit. There is a large
literature on English-style auctions that has to date made a great deal of traction while abstracting from
the details of auction process. Authors, such as Cassady (1967) have argued, however, that this is the
format in which the auctioneer has the most potential to influence the sale, and as such English auctions
and the role of auctioneers would seem a good place to begin to more systematically study the importance
of the details of how auctions are conducted.
Our data include over 850,000 cars auctioned by 60 auctioneers between 2007 and 2013 at the largest
location of a leading operator of used-car auctions in the U.S. The primary measure of auctioneer
performance we analyze is each auctioneer’s conversion rate (the fraction of cars that end in a sale). The
auction company and its auctioneers make it clear that the primary role of the auctioneer in this context is
to maximize the probability of each car selling. We also study two secondary performance metrics:
residual price (the difference between sales price and average market value) and speed of sale.
An obvious threat to the identification of auctioneer heterogeneity is that cars are not randomly
assigned to auctioneers. We discuss identification assumptions in detail below and argue that non-random
selection can be accounted for by controlling for important features of the auction (auction day, seller of
the car, car type, etc.). We also provide additional tests which include exploiting shift changes as a way to
identify the causal impact of auctioneers on outcomes.
We find significant dispersion in auctioneers’ fixed effects in each of the three performance measures.
In our preferred specification, a one-standard deviation increase in auctioneer performance corresponds to
2 See, for example, Abrams, Bertrand and Mullainathan (2013); Azoulay, Graff Zivin and Wang (2010); Bertrand and Schoar (2003); Chetty, Friedman, Hilger, and Saez (2010); Hanushek (2011); Jones and Olken (2005); Lazear, Shaw, and Stanton (2012); Malmendier and Tate (2009). 3 To our knowledge, the only two studies examining auctioneers are Capizzani (2008), who presented experimental evidence regarding the presence of a live auctioneer whose only role was to choose the public-information structure, and Cassady (1967), who provided a detailed qualitative description of auctions and auctioneers. Note, moreover, that much of the literature uses the term “auctioneer” to refer to the auction house or platform (Hossain, Khali, and Shum, 2013), or, in some cases, the seller. In this paper we reserve the term auctioneer strictly for the person calling out bids at a live auction, and the term seller strictly for the owner of the car who brings it to the auction house.

3
an increase in the probability of sale by 2.3 percentage points (the average sales probability is 53%), an
increase in residual sales price by $41.8 (the average sales price is $15,141), and an increase in speed of
sale by 6.1 seconds (the average length of sale is 103 seconds). We apply an Empirical Bayes shrinkage
correction to account for the fact that each auctioneer’s effect is noisily measured and find that the
estimated effects in general change very little, suggesting that the heterogeneity that we find is not merely
due to natural sampling variation. The performance enhancements in conversion rates due to higher-
ability auctioneers are generally comparable to those found in studies that estimate the effects of changes
in auction design, information structure, and broader macroeconomic factors on similar outcomes (Coey,
Larsen and Sweeney, 2013; Hortacsu, Matvos, Syverson, and Venkataraman., 2013; Tadelis and
Zettelmeyer, 2011). Additionally, the improvements in price are comparable to the theoretical
benchmarks of designing the auction optimally or of including an additional bidder given by Bulow and
Klemperer (1996).
A number of additional analyses and robustness checks support our findings that some auctioneers
indeed outperform others. First, the performance heterogeneity for conversion rates and time on the block
is persistent over time: on average, auctioneers who achieved higher conversion rates or faster sales in the
first half of our sample (2007-2009) also performed better in the second half (2010-2013). Second, the
different performance metrics are correlated at the individual level in that auctioneers with higher
conversion rates also achieve higher prices and are typically faster. We also find that these objective
performance metrics are correlated with subjective evaluations of auctioneers that were made available to
us by the auction house. Our metrics are also predictive of which auctioneers left the company during a
period of downsizing.
These results suggest that the way an auction is run can have a nontrivial impact on outcomes, and in
particular, human auctioneers do not simply call out prices and recognize bids. It is also important to bear
in mind that these wholesale auto auction environments involve large stakes and are conducted with
professionals who often have substantial auction experience. To us this suggests that auctioneer effects
are not a quirk related to unfamiliarity with auctions, but rather a fundamental feature of well-established
and well-functioning auction environments. The fact that we observe substantial heterogeneity across a
pool of professional auctioneers also suggests that auction houses have not found ways to transfer these
successful practices throughout their auctions.
Having documented that auctioneers vary systematically in their effects on auction outcomes, a
natural next step is to explore the mechanisms at play in generating these differences. Deeper explorations
of specific auction processes should be an interesting avenue for a whole body of future research and we
suspect that experimental methods are likely to be the best avenue for exploring these issues. As a first
step to better understanding the mechanisms at play in auctioneer success, we lay out five classes of

4
potential mechanisms. We consider the possibility that auctioneers differ in their ability to 1) convey
information about car quality, 2) convince sellers to lower their reservation values and accept auction
outcomes, 3) generate patterns of bids that reveal more information about the range of bidder valuations,
4) help reduce search frictions and match buyers to appropriate cars, and 5) exploit behavioral biases
related to issues such as excitement in auctions. These mechanisms are difficult to disentangle, because
they are not mutually exclusive and frequently observationally equivalent. Nonetheless, we present
qualitative evidence from surveys with auctioneers and also discuss patterns in our data that provide
suggestive evidence about these mechanisms. We can conclude with relative certainty that auctioneers in
this setting do not convey information about the quality of cars, and we also find little support for the idea
that they are primarily trying to persuade sellers to lower their reservation values. We have less
conclusive results about the other mechanisms that relate to changing buyer values, but the evidence
supports the idea that part of the difference in auctioneer abilities arises because some auctioneers are
better at creating excitement and competitive arousal among buyers. In particular, industry participants
often report that successful auctioneers use speed and pacing of auctions to affect the level of excitement
in ways that increase bidding, and that specific mechanism appears to be consistent with our findings that
auctioneers who run faster-paced auctions are somewhat more likely to achieve sales and higher prices.
In showing suggestive evidence that auctioneer heterogeneity resides at least in part in the ability to
generate excitement among bidders, this paper contributes to a small but growing literature exploring
behavioral factors in auction environments such as auction fever or overbidding (Ockenfels, Reiley, and
Sadrieh, 2007; Podwol and Schneider, 2011; Malmendier and Szeidl, 2008). In the literature, auction
fever—also referred to as competitive arousal or bidding frenzy—encompasses many behaviors, such as
rivalry or spite (Morgan, Steiglitz, and Reis, 2003; Ku, Malhorta, and Murnigham, 2005; Cooper and
Fang, 2008); endowment effects (Heyman, Orhun, and Ariely, 2004; Dodonova and Khoroshilov, 2009);
utility of winning (Cooper and Fang, 2008); regret/fear of losing (Cramton, Filiz-Ozbay, Ozbay, and
Sujarittanonta, 2012; Filiz-Ozbay and Ozbay, 2007); uniqueness of being first (Ku, Malhorta, and
Murnigham, 2005); and irrational limited attention (Lee and Malmandier, 2011). Documenting the
relevance of behavioral factors in auctions is particularly relevant in our context where actors are
informed professionals, as in Goldreich (2004). Our evidence is also related to work in psychology, for
example, suggesting that thought speed can have an impact on mood (Pronin and Wegner, 2006). Ku,
Malhotra, and Murnigham (2005) also studied how time pressure can affect bidding, and Malhorta (2010)
found, in a field experiment, that the combination of rivalry effects and time pressure is particularly
strong in leading to additional bidding.
The results here also provide new insights about how these complex auction interactions unfold. This
can inform auction design theory on how specific auction processes may affect, for example, revenue

5
equivalence and the strategic equivalence among auction structures. We suggest that there are important
dynamics at play in English auctions that are not captured by the classic framework and as such point to
the importance of existing work on expanding models (Harstad and Rothkopf, 2000) and econometric
approaches (Haile and Tamer, 2003) to account for the richness of real auction environments.
The rest of the paper proceeds as follows. Section 2 discusses the data and offers detail on the
institutional context. The empirical strategy and our main results are reported and discussed in Section 3.
Section 4 is dedicated to exploring the mechanisms behind the heterogeneity across auctioneers. Finally,
Section 5 offers concluding remarks.
2. Institutional Details and Data
The company for which we have data specializes in providing auction services for the wholesale used car
market. This company has many auction facilities around the U.S., where each facility holds an auction
typically once or twice per week. Bidders at these auctions are licensed used-car dealers who typically
plan to sell the cars they purchase on their personal used-car lots. The cars being sold come from two
basic sources: “dealer” sellers and “fleet/lease” sellers. The dealer sales are cars being sold by retail car
dealers and are primarily cars which were received as trade-ins that the dealer did not want to sell on his
or her own lot. The fleet/lease sales represent cars sold by rental car companies, leasing companies, or
company fleets and are typically sold in large volumes with low reservation prices. On an auction day,
cars run through one of multiple lanes which operate simultaneously. The buyers bid for cars in a standard
ascending-price (i.e., English) auction which typically lasts between one and two minutes. The highest
bidder receives the car as long as the auction price exceeds the seller’s secret reserve price. The high
bidder can personally take it back to his or her used-car lot or arrange delivery through independent
agencies which operate at the auctions.
Wholesale used car auctions are conducted by professional auctioneers. Most of them have some
formal auctioneer training from one of many auctioneer schools located nationwide, the existence of
which is by itself suggestive that auctioneer skills and training may matter.4 Auctioneers also tend to learn
the trade through an apprenticeship system and many come from families with long histories as
auctioneers. Top auctioneers in the profession are granted awards.5 Section 4 discusses the characteristics
and tools of an auctioneer that are considered important.
The auctioneers at the locations we study here work as independent contractors and receive a fixed
daily wage for each auction day they work. The auction house periodically uses small bonus incentives
4 The National Auctioneers Association website (www.auctioneers.org) lists 29 schools, and additional schools are listed elsewhere. 5 For example, the World Auto Auctioneer Championship has been held annually since 1989.

6
tied to targets like the fraction of cars sold on a lane per day. The auctioneers, however, have no
commission incentives on any particular car they auction. The auction house tells us they use this
compensation design in part so that the auctioneers are not seen by the bidders as agents of the seller, but
rather as independent market makers.
On the auction day the auctioneers are assigned to specific lanes. There are separate lanes for dealer
sales and for fleet/lease sales. Many of the fleet/lease lanes are dominated by large corporate sellers and it
is easily possible for a particular fleet/lease seller to command an entire lane on some auction days.
Because the fleet/lease sellers bring large volumes of cars to the auction, they are typically given
preferential treatment by the auction house. Of relevance for our study, the fleet/lease sellers can either
bring their own auctioneer, or often use the same auctioneer that is provided by the company week after
week. In contrast, dealers tend to sell cars in smaller volumes. Typically, dealer lanes are filled on a first-
come, first-served basis and the auction house will simultaneously run multiple lanes of dealer-car
auctions. For example, a dealer may bring in five cars the day before the auction and be slotted into lane
15, with run numbers 26-30; another dealer may then arrive with three cars and be given run numbers 31-
33 in lane 15. On average, 200-300 cars are auctioned off in each lane in a given day. The median seller
in a lane on a given day represents only 6.4% of cars being auctioned in that lane on that day.
Although the method for assigning dealer cars to lanes produces a large amount of random variation
in what cars an auctioneer will end up auctioning, the process is not entirely random. For example, larger
dealers can often influence the choice of lane, timing of their run through the lane, or even which
auctioneer is assigned to their lane.6 For this reason, it is important that we control for features of a car
(e.g. seller effects) in our empirical strategy. We will argue that the allocation of cars to auctioneers is
conditionally random after controlling for a set of important car characteristics and provide several
robustness checks to help assess this identifying assumption.
We have access to information on all cars auctioned between January 2007 and June 2013 at the
largest facility operated by the auction company for which we have data. For reasons provided above, we
drop fleet/lease cars and focus on cars being sold by dealers in these auctions.7 We take several additional
steps to clean the data before running analyses. We drop a small number of observations with missing
data or nonsensical values. We exclude observations having outlier values on our key variables (e.g. cars
that sold for less than $100 or for more than $75,000). We then restrict the sample to auctions conducted
on two specific days of the week (there are occasionally small specialty auctions conducted on other days
6 In written correspondence with the general manager of the auction facility for which we have data, we asked whether auctioneers are randomly assigned to the dealer lanes. The response was, “Sometimes it is by dealer request. We try and discourage that, because we want 40 great auctioneers...” 7 Because the fleet/lease companies bring their own auctioneer or often have the same company-provided auctioneer every week, we have very limited variation in auctioneer assignment within a seller for fleet/lease cars.

7
of the week). We eliminate rerun auctions.8 Lastly, we reduce the sample to the 60 auctioneers who
auctioned off at least 5,000 cars during our sample period. This limits the sample of auctioneers to those
that worked “full time” for at least a year or two during our sample period. Within these remaining 60
auctioneers, the median auctioneer performed just over 13,000 auctions during our sample period while
the busiest auctioneer performed approximately 30,000 auctions.
Our final dataset contains information on 859,239 cars. For each car we observe the make, model,
body style, model year, date and time at which it was auctioned, and odometer mileage as well as an
identifier for the seller of the car. We also observe whether the car sold, the sales price, the amount of
time spent auctioning off the car, and the lane in which the car was sold. Lastly, auctioneer identifiers let
us detect the specific auctioneer who was on the block in a given lane for a given car.9
Table 1 reports some basic descriptive statistics on our sample of used cars. The average car is 4.4
years old and has about 56,000 miles. About 53% of cars sell;10 in the cases when the car does not sell,
the owner may take it back to his or her dealership or to a competing auction house and attempt to sell it
there; or he may choose to auction the car again at an upcoming auction. The mean sales price for sold
cars is slightly above $15,000, and on average car auctions last 1 minute and 43 seconds.11
We consider three main performance measures for auctioneers: a) conversion rates (fraction of cars
that sold); b) the price of cars conditional on selling, and c) the time that each car is on the block. In
addition to their immediate economic rationale, conversion rates and price are important to the auction
company because it earns commission fees based on a car selling. It is also seen as important to retain
sellers, particularly large ones, to ensure volume at the auctions; as such, selling cars at somewhat higher
prices is a positive outcome. However, the company also needs to attract buyers, therefore high prices, in
and of themselves, are not the company’s primary goal. The speed at which a car is sold is also of interest
to the auction house as faster sales imply more cars can get through the lanes of the auction house on a
given day as opposed to remaining unsold in inventory to be sold at a later date.
8 If a car does not sell, sometimes it will be put through the lane one more time at the end of the day with a group of other cars that did not sell. We restrict the sample to the first time a car went through the lane on a given day. 9 At some auctions, there is also a “ringman” on the floor of the auction who assists the auctioneer in identifying bids and energizing the crowd. The auction facility for which we have data does not use a ringman. 10 Sellers either provide the auction house with a reservation price ahead of time or, more frequently, they sit by the auctioneer during the auction of their cars. Thus, the seller often makes a decision on the block as to whether or not the highest bid is more than their reservation price. We unfortunately do not have any consistent data for the reservation prices set by sellers. 11 Time on the block is calculated by subtracting the starting time stamps from consecutive car auctions on each auction lane to determine the duration of each auction. It has a smaller number of observations than the other variables because we set time on the block equal to missing if the time taken to sell the car is in the bottom or top 5 percentile. The reason we make this restriction is because it is common for a car to take a very long (or short) time to sell for factors outside of the control of the auctioneer. For example, waiting for the seller, getting the information coded into the computer, or waiting for the next car to be driven into the lane can cause an auction to last much longer than normal.

8
We specifically discussed these three measures with the general manager of the auction facility for
which we have data. It is clear that conversion rate is the most important objective to them.12 The general
manager wrote, “Conversion rate pays the bills. Sales price and speed are generally the parents of
conversion rate.” The manager indicated that as long as a car sells, the company is somewhat indifferent
regarding the price, in the same way that a stock exchange ultimately does not care if a stock price goes
up or down because they are catering to both buyers and sellers. He further specified that although speed
is important (because it allows them to sell cars more quickly on a given day), he sees speed as primarily
an input into whether a car sells or not. Specifically, he said, “Speed tends to sell and sell for a higher
price. It puts adrenaline into the mix for the buyer.” Based on these conversations regarding what makes a
“good” auctioneer for this particular company, our focus in the empirical section below is primarily on
the probability-of-sale metric. However, we also provide results on price and speed.
3. Empirical analysis
3.1 Empirical strategy
One measure of auctioneer heterogeneity would be to simply calculate the average conversion rate, price
of sale, and speed for each auctioneer in our dataset. Analyzing the variation in these averages across
auctioneers could provide an indication for the degree to which an auctioneer can impact auction
outcomes. Given the discussion of how auctioneers are allocated to lanes reported in the previous section,
a concern with this approach is that these raw comparisons may result in performance dispersion that is
due to omitted variables and not differential auctioneer ability. Therefore, our main analyses of auctioneer
heterogeneity are based on the estimation of versions of the following regression model that allow us to
control for various factors that may not be randomly assigned to auctioneers:
′ . (1)
is one of our main outcome variables: an indicator for whether the car sold, the residual sales price, or
time on the block (seconds). Individual cars are indexed by i and auctioneers by k. The vector includes,
depending on the specification, fixed effects for various characteristics of car i (sellers, auction day, lane
number, etc.). The estimates of interest are the s, the auctioneer effects.
Because the individual s will depend on which auctioneer is excluded from the regression as the
baseline, it is useful to have a normalization so that auctioneer effects are not sensitive to this
specification issue. We thus compute: 12 The recent discussion of the wholesale auto auction industry in Treece (2013) explains the importance of conversion rates to auction houses and also highlights the important role a good auctioneer can play in increasing conversion.

9
, ∑ for 2, … ;
(2)
, 0 ∑ ,
where k = 1 denotes the omitted auctioneer in Equation (1).
Our interest is in understanding whether there is substantial heterogeneity in these normalized
auctioneer effects. Statistically our question of interest is whether the coefficients are jointly different
from zero, which can be addressed through standard metrics such as F-tests. It is, however, also very
useful to be able to talk about the economic magnitude of our findings by focusing on measures such as
the spread between auctioneers with high effects versus those with low effects. A challenge here is that
even if there is no meaningful underlying heterogeneity in auctioneer ability, we would still expect
random sampling variation to generate some degree of dispersion between our estimates of the best
auctioneer and the worst auctioneer. This would especially be an issue if our effects were being estimated
off of a smaller sample size. We therefore also perform analyses using a Bayesian Shrinkage procedure
which corrects for sampling variation and has been used in many other settings such as evaluating
differences in teacher quality and organizational productivity.13 Specifically, we calculate:
, , 1 ∑ , , (3)
with ., where is the variance of the 60 normalized estimates and is the square of the
estimated standard error of each , . Because the effects are normalized, note that∑ , 0
by construction; thus the shrinkage estimator reduces to , for each k.
3.2 Heterogeneity in auctioneer performance
We begin by estimating the model in Equation (1) using probability of sale as the outcome of interest. We
estimate 8 different specifications, where each specification adds additional controls. The first
specification includes no controls (just the auctioneer fixed effects). Once again, we are interested in the
variation in auctioneer fixed effects. The first column in Table 2 provides the standard deviation of the
auctioneer fixed effects for the various specifications using probability of sale as the outcome of interest.
Specification 1 (raw values) suggests that the standard deviation in auctioneers’ ability to sell cars is .051.
Taken literally, this suggests that a one standard deviation improvement in auctioneer ability translates
into a 5.1 percentage point higher probabiliy of sale (off a base of 53%). The solid line in Figure 1
graphically presents these raw auctioneer effects by ranking the 60 auctioneers from worst to best and
plotting their associated fixed effects. There is a remarkable amount of variation across auctioneers with
13 See, among others, Chandra, Finkelstein, Sacarny, and Syverson (2013); Jacob and Lefgren (2005); and Morris (1983).

10
the two highest-performing auctioneers being able to sell cars at more than a 10 percentage point higher
rate than average.
The concern with these raw performance measures is that unobserved assignment of cars to
auctioneers could be taking place. Based on discussions with the auction house, a primary confounder
with the raw data is that certain auctioneers may be systematically assigned to sellers that have lower or
higher reservation values than other sellers. To control for this concern, we include seller fixed effects in
the second specification.14 Figure 1 illustrates how including these controls significantly reduces the
amount of variation across auctioneers. Table 2 indicates that the standard deviation of auctioneer fixed
effects is reduced from .051 to .038 when seller fixed effects are included. One question about including
these controls is whether the auctioneer fixed effects are simply dampened, or if the ranking of the
auctioneers is also signficantly changed. The second column in Table 2 provides the coefficient of
correlation between specification 2 (and the other specifications) and the previous specification and also t-
stats in brackets. The correlation coefficient of .94 suggests that including seller fixed effects reduced the
variation in auctioneer fixed effects, but did not greatly alter the rank order of the auctioneers.15
Likely due to macroeconomic factors, the probability of sale in our data changed substantially
throughout the sample period. Once again, this can bias the dispersion of auctioneer fixed effects if some
auctioneers worked more in certain periods during our sample than others. In Specification 3, we include
time controls—both auction day (day*month*year) effects and time of day (hour-by-hour) effects. Figure
1 and Table 2 indicate that these controls reduce the amount of variation in the auctioneer fixed effects.
Specification 4 includes fixed effects for the 55 lanes that operated at some point during our sample. This
produces a slight decrease in the standard deviation of auctioneer fixed effects. We continue to find that
the rank ordering of auctioneers is very similar from one specification to the next.
Specification 5 begins to include car characteristics in the model by adding car-make effects.
Specification 6 includes age interacted with make (make*age) and also a 5th-order polynomial in the
number of miles on the car’s odometer. Specification 7 adds the car model into the interaction
(make*model*age) as well as the miles polynomial. Specification 8 adds the body type of the car into the
interaction (make*model*body*age) in addition to the miles polynomial. As can be seen in Figure 1 and
in Table 2, moving from Specification 4 to Specification 8 neither impacts the standard deviation of the
auctioneer effects, nor changes meaningfully the rank ordering of the estimates.
After including the controls mentioned above, we are left with an estimate suggesting that a one
standard deviation improvement in auctioneer ability results in a 2.3 percentage point increase in the
14 We include a dummy variable for each of 1,087 sellers who sold at least 100 cars during our sample. The omitted category includes all sellers who sold less than 100 cars during our sample period. 15 The reported correlation coefficients are based on correlation of values (Pearson). Rank-correlation coefficients (Spearman) are very similar.

11
probability of selling a car (off a base of 53%). Panel B of Figure 1 provides 95% confidence intervals for
each of the auctioneer fixed effects. One remaining question is how much of this variation we would
expect due simply to sampling variation. To answer this question, we apply the Bayesian Shrinkage
procedure discussed above to these estimates. The standard deviation that we find for Specification 8 after
applying this procedure is: .0220 (compared to .0228 without the shrinkage procedure). Because of the
large sample of auctions for each auctioneer in our data, sampling variation is small relative to the amount
of variation in the estimated fixed effects.
We now turn to the other two performance metrics for auctioneers. The first is residual price, i.e. the
price that was obtained by the auctioneer for a sold car minus the wholesale blue book value as calculated
by the auction house using a proprietary formula. We “residualize” the price as a way to absorb additional
unobserved heterogeneity that may exist about the car that is hard to control. The second performance
metric is the amount of time that an auctioneer takes to run an auction (in seconds).
The results for these two metrics are presented in the second and third set of columns in Table 2. The
standard deviation in raw values across auctioneers is very large ($219) and is reduced to $55.84 after
including seller fixed effects. This suggests that some nonrandom sorting of cars to auctioneers is taking
place in this environment. The standard deviation for the residual price effects stabilizes after
Specification 4 at about $40.16 The time-on-the-block effects are fairly stable, especially after controlling
for seller fixed effects. The estimates imply that a one standard deviation increase in auctioneer speed is
associated with running an auction in 6 fewer seconds (off a base of 103 seconds). The stability in these
findings is an indication of speed being an individual characteristic or style which does not depend
heavily on the car being auctioned off, the seller, or other environmental contingencies.
Sampling variation can explain 20-25% of the variation in the residual price effects. Specifically, the
standard deviation for Specification 8 with Bayesian Shrinkage applied is $31.99 (compared to $41.78
without the shrinkage). The time effects are not very affected by sampling variation with a standard
deviation of 5.87 once shrinkage is applied (compared to 6.07 without the shrinkage). Thus, with the
exception of residual price (which was estimated to have a fairly small amount of variation in fixed
effects to begin with), sampling variation appears to have very minor effects on our outcomes of interest.
3.3 Identifying auctioneer effects from shift changes
In this section, we propose a second approach to causally identify estimates of auctioneer ability that uses
natural variation associated with work shift changes. We then compare these new auctioneer estimates
with the estimates from the previous section.
16 It is not surprising that the residual price effects are not affected by car characteristics (make, model age) because these are almost surely being taken into consideration by the wholesale blue book value that the company creates.

12
On a typical auction date, two auctioneers will be assigned to work on each lane. These two
auctioneers will take turns auctioning off cars in that lane. Auctioneers may switch at any time, but we
observe that auctioneers typically switch roughly every 30 or 60 minutes in what appear to be somewhat
regular shift-length norms. In particular, we see very few instances of an auctioneer who is on the block
for much longer than 60 minutes at a time (Appendix Figure A.1).
We can exploit the variation in auctioneers that occurs within a lane on a given day by including
lane*day fixed effects when estimating auctioneer ability.17 By looking within a lane on a given day, we
are able to control for additional unobserved factors that may exist (number of buyers at the auction
located near a given lane, unobserved characteristics about the cars/sellers assigned to that lane, etc.)
when estimating auctioneer fixed effects.
We estimate the model in Equation (1) while controlling for seller, time of day, and 13,687 lane*day
fixed effects. Figure 2 provides scatter plots of the estimates from Specification 8 in the previous section
and the estimates using the specification described here for each of our three performance metrics. The
estimates that we find are strongly correlated across identification strategies: the t-stats for probability of
sale, residual price, and time on the block are 18.9, 6.51, and 15.46 respectively. Finding similar estimates
when looking within a lane*day lends credibility to the estimates found in the previous section.
3.4 Stability of heterogeneity over time
If these estimated effects reflect persistent differences in auctioneer abilities, then we would expect them
to be fairly stable over time. In particular, an auctioneer who performed better in the first half of our
sample (2007-2009) should also perform better in the second half of our sample (2010-2013). In Figure 3
we plot the fixed effects for the 49 auctioneers who were full time employees in both the first and second
half of our sample period. We find a strong, positive correlation with probability of sale (t-stat = 4.91) and
time fixed effects (t-stat = 7.32) between the two sample periods. We do not find persistence in the
residual price fixed effects across the two periods (t-stat = -0.10). This is consistent with our other
findings which suggest that the price effects we estimate are not as strong or well-identified as the effects
on probability of sale and speed. The persistence of the probability of sale and speed effects, however,
suggests that we are detecting features of the auctioneers that are stable and robust across time.
3.5 Correlation between performance measures
17 One might be tempted to use a regression discontinuity design based on shift changes. However, because changes can occur endogenously (perhaps an auctioneer feels like he/she underperformed on the last couple of auctions and then decides to switch) and because switches likely occur at the same time as the cars being sold switch from one seller to the next, we are hesitant to try to identify off of discontinuous work shift changes.

13
As discussed earlier, the primary objective of auctioneers as seen by the auction house is to maximize the
probability of selling a car. However, it is informative to consider how auctioneers who excel in selling a
large fraction of their cars perform in the other two metrics (residual price and speed).18 It is possible that
the individual auctioneers who have the best performance for the probability of sale achieve this at the
cost of one of the other metrics. For example, perhaps it is auctioneers who go really slow and take a lot
of time to do the auction that are able to acheive better conversion rates. Conversely, a finding of a
positive correlation between conversion rates, prices, and speed would be further evidence of the
existence of an “auctioneer ability” heterogenous in the relevant population.
A concern with correlating the time-on-the-block effects with other outcomes is that there may be a
mechanical bias. The average time on the block for cars that sell is approximately 11 seconds longer than
the time on the block when the car does not sell. This may be in part due to the extra recording time that is
required when a sale occurs. Thus, if an auctioneer is able to obtain a higher probability of sale than
another auctioneer, he/she may mechanically have a longer time on the block as well. In order to avoid
this bias, we produce and use time on the block fixed effects for each auctioneer based only on cars that
sold rather than all cars. Thus, we are able to obtain a measure of how fast an auctioneer typically
performs auctions that is uncorrelated with the conversion rate of the auctioneer. Appendix Figure 2
illustrates that the time-on-the-block fixed effects using sold cars only are highly correlated with the time-
on-the-block fixed effects when using all auctions (t-stat = 22.00). An auctioneer’s fixed effects for time-
on-block for sold cars also correlates strongly with his fixed effect for time-on-block for unsold cars
(Figure A.2 Panel B). This suggests that time-on-block likely reflects systematic differences across
auctioneers in the speed with which they conduct their auctions, regardless of the auction outcome. From
this point on we will always use the time-on-the-block fixed effects from sold cars in order to avoid bias
when doing correlations.
Using Specification 8 from Section 3.2, Panel A of Figure 4 shows the correlation between
probability-of-sale fixed effects and residual-price fixed effects, Panel B shows the correlation between
probability-of-sale fixed effects and speed, and Panel C shows the correlation between residual-price
fixed effects and speed. Auctioneers with the highest fixed effects for probability of sale also have higher
than average fixed effects for prices obtained (t-stat = 3.29) and are marginally faster at selling cars as
well (t-stat = -1.62).19 We also find that auctioneers who acheive high prices for cars are faster than
18 Correlating these measures provide insight into the possible mechanisms that the best auctioneers may be using and will be discussed in further detail in Section 4. 19 A larger time-on-the-block fixed effect represents an auctioneer who takes more seconds to sell a car on average. Thus, a negative sign on the correlation between time-on-the-block and probability of sale suggests that auctioneers who sell more cars are faster than average.

14
average (t-stat = -2.52). 20 Although the statistical power to identify these correlations is somewhat
limited, we find no evidence that auctioneers who are doing well on their main objective function
(maximizing probability of sale) are doing so at a cost to secondary objectives. If anything, we find that
auctioneers who are better in one dimension are better in the other dimensions as well. This supports the
statement made by the auction house’s general manager that “sales price and speed are generally the
parents of conversion rate” and is something to which we will also refer when discussing potential
mechanisms for these effects in the next section.
3.6 Comparing the estimates with subjective measures of auctioneer performance
As another check on the validity of the estimated auctioneer effects, we compare our “objective”
estimates of auctioneer ability with “subjective” evaluations of auctioneer ability produced internally by
the auction company. At our request, the auction company produced evaluations for the 41 full-time
auctioneers working in the Fall of 2012 (prior to them seeing any auctioneer-specific results generated by
us). The evaluations they produced were based on a multidimensional subjective assessment by a panel of
three senior auctioneers. This panel considered a range of inputs of their own choosing in order to
produce a summary metric in 0.1 increments which we place on a scale from 0 (worst) to 1 (best).21 In
Figure 5 we correlate the company’s subjective rankings with our estimated fixed effects (once again
using the full model as from Specification 8 in Table 2). Panels A, B, and C provide correlations between
the subjective evaluations and fixed effects for probability of sale, residual price, and speed respectively.
We find significant correlations between their measure of who the best auctioneers are and our measure of
auctioneers who have a high probability of sale (t-stat = 4.62), who obtain high prices (t-stat = 2.09), and
who conduct fast auctions (t-stat = -2.03). The correlations we find, especially with the probability-of-sale
metric, are remarkably strong and lend additional credibility to the idea that we are identifying true
differences in auctioneer ability.
3.7 Predicting job termination decisions
Due to the recession that took place during our sample period, the company significantly downsized the
number of full-time auctioneers between the start and end of our sample. Specifically, there are 59 full-
time auctioneers at the start of our sample. Of these 59 auctioneers, 18 were no longer working for the
company by 2013 (and one new auctioneer was hired). This downsizing provides us with an additional
test for the validity and relevance of our measure of heterogeneity in auctioneer ability. We are interested
20 Simple exploratory factor analyses are consistent with the presence of a “common factor” underlying the auctioneer fixed effects on conversion rate, residual price, and time on the block. 21 The original scale elaborated by the company is from 2 (worst) to 1 (best).

15
in analyzing whether the auctioneers who stayed in the sample (“stayers”) were better than the
auctioneers let go during the downsizing who exited the sample (“goers”).22
Figure 6 displays the auctioneer effects from the fully specified model (Specification 8) for each
performance measure. The auctioneers who left the company before 2012 are highlighted in red. Note that
many of the worst-performing auctioneers in each dimension (the left tail of auctioneers in panels A and
B and the right tail of auctioneers in panel C) left the firm during the downsizing. In contrast, the large
majority of the best-performing auctioneers (the right tail in panels A and B and the left tail in panel C)
were retained by the firm. Regressions of the auctioneer fixed effects (from Specification 8 above) on a
dummy for whether the auctioneer was a stayer or not imply that stayers are, on average, more likely to
sell a car by 1.5 percentage points (t-stat = 2.53), have residual prices that are $25 higher (t-stat = 2.09),
and take 6.7 fewer seconds when selling a car (t-stat = -3.36). Again, the fact that our ability measures
significantly predict who exited the sample during a downturn provides evidence in favor of our metric
representing true ability.
3.8 Benchmarking the impact of auctioneer ability and the impact on expected revenues
Having established that heterogeneities exist among auctioneers, we now provide simple calculations,
based on the point estimates from the analyses above, to compute the impact of these estimates on some
relevant economic variables. On average, each full-time auctioneer performs approximately 2,000 car
auctions per year of our sample. An auctioneer who moves from the 10th percentile to the 90th percentile
in our probability-of-sale metric (a 5.6 percentage point increase in probability of sale off a base of 53%)
will sell approximately 123 more cars each year. Assuming an average fee to the auction house of $200
for each car sold, this translates to an increase in revenue for the auction company of $24,600.23
Similar calculations can be done for the value of auctioneers who systematically obtain higher prices
and/or go faster. In particular, the average difference in residual prices obtained by the 90th-percentile
auctioneer and the 10th-percentile auctioneer is about $96, and the difference in time on the block is 12.6
seconds (14.7 seconds for sold cars). However, it is harder to translate these values into company profit
since fees received are not based directly on these measures.
Another way to benchmark the results is to compare our estimated effects with the impact of changes
in other relevant variables in our data, as well as with results from related studies that estimate the effects
22 Unfortunately, we do not have hard data on whether the auctioneers that left the sample were fired or left voluntarily. Our discussion with the auction company suggests that the majority if not all of these auctioneers left involuntarily. To the extent that a few of the auctioneers left on their own accord, this would bias us against finding significant differences between stayers vs. goers. 23 These calculations are rough and ignore many other potentially important factors. For example, if the probability of sale increases, it could cause more sellers to bring their cars to this market suggesting that the value of the auctioneer is even higher. It is also possible that an auctioneer that is able to sell more cars is causing lower sales for the other auctioneers.

16
of certain changes in auction design and information structure on similar outcomes. Within our data, we
estimate the 90th-10th percentile difference in residual prices to correspond to the effect of a difference of
1,136 miles between two otherwise identical cars.24
As for related studies, Tadelis and Zettelmeyer (2011) estimate the impact of randomly providing
additional information about car quality from a reputable source in a wholesale car auction. They find that
additional information translates into a 6.3 percentage point increase in probability of sale and a $236
increase in average price. These effects are slightly bigger than those we estimate to be the difference in
average probability of sale and price obtained by an auctioneer at the 10th and at the 90th percentile.
Coey, Larsen and Sweeney (2013), using similar wholesale car auction data, find that excluding a last-
minute, high-value bidder, which can occur due to computer lag, results in a 6.6% decrease in the
probability of sale, again slightly larger than but similar in size to the effects we find. Similar impacts
have been found from changes in relevant economic and financial conditions at a more aggregate level;
Hortaçsu, Matvos, Syverson, and Venkataraman (2013) show that a 1000-point increase in the CDS
spread for an auto manufacturer is associated with a drop in average prices for that manufacturer’s used
cars at auctions of $68.
An important theoretical benchmark from the auction design literature to which our results can be
compared comes from Bulow and Klemperer (1996), who demonstrate that the participation of one
additional random bidder increases seller revenue more than an optimal reserve price would. Coey,
Larsen, and Sweeney (2013) present a method for calculating the effect of adding a random bidder on
final prices and find that this effect is at most $160.25 This implies that the effect we find of moving from
the 10th percentile to the 90th percentile auctioneer captures a substantial portion of the effect of increasing
competition at auctions, and, in turn, a substantial portion of the effect on seller revenue which would
come from designing the auction optimally.
4. Exploring the sources and mechanisms of auctioneer heterogeneity
The analyses in the previous section provide robust evidence that, even in a well-functioning auction
market, individual auctioneers can significantly impact key market outcomes. This suggests that
auctioneer skills are a real phenomenon. Although the primary contribution of the paper comes from
documenting the systematic variance in outcomes across auctioneers, a natural next step is to explore the
24 This estimate was obtaining by running a regression of residual price on the same right-hand side variables as in Specification 8, but with miles entered linearly. The estimated coefficient on miles is -.00845. 25 As demonstrated in Coey, Larsen and Sweeney (2013), the Bulow and Klemperer (1996) effect of adding one more random bidder to an N-bidder auction is given by scaling the average gap between the second and third-highest bids from N+1-bidder auctions by a factor of 2/(N+1). Note that the $160 estimate comes from auction sales which were primarily fleet/lease cars; the estimate could differ at dealer auctions.

17
mechanisms that might determine relative auction success. Uncovering these mechanisms is an interesting
avenue for a whole body of future research and will likely be best addressed using experimental
techniques. However, in this section we begin to explore these potential mechanisms, noting that the
nature of the available data here do not allow us to reach any fully conclusive claim about mechanisms.
We begin with a short discussion of some potential sources of heterogeneity. We then present qualitative
evidence from a survey prepared for this paper in which professional auctioneers were asked to comment
on and rank various tools and characteristics that define an effective auctioneer. Finally, we provide and
discuss quantitative evidence from our data (some of which was already presented in Section 3 above)
that helps establish the potential relevance of the various mechanisms considered here.
4.1 Potential mechanisms
We consider five broad mechanisms that could drive heterogeneity in auctioneer ability:
1. Direct information revelation. One way in which auctioneers could potentially affect market
outcomes is by directly revealing information about the products being sold. In particular, the linkage
principle (Milgrom and Weber, 1982; Milgrom, 2004) would predict that an auctioneer who could
better commit to revealing truthful information about the cars being sold could expect to generate
higher prices. However, it is important to note here that the predictions of information revelation
require that the auctioneer have private information about the value of the good being sold, which as
we discuss below is very unlikely in this market.
2. Persuading sellers to lower reservation values. The main effects documented in this paper concern
the ability of an auctioneer to achieve a sale. One of the obvious ways in which auctioneers could
differ in their ability to achieve a sale would be if they differ in an ability to persuade sellers to lower
their reservation values to match the available market price. If some auctioneers have more credibility
with sellers, they may be better at convincing sellers to lower reservation values and accept the
outcome of the auction.
3. Generating patterns of bids that increase revelation of bidder values. In Milgrom and Weber’s
(1982) model of English auctions with affiliated values, bidders reveal something about their
valuation as they are observed dropping out of the bidding, and it is this extra information that leads
to predictions of higher revenues from English auctions relative to other formats. As a number of
papers have highlighted, however, in real-world English auctions of the type we observe here, many
potential bidders remain silent during the auction and never reveal information about their valuation
(Haile and Tamer, 2003; Harstad and Rothkopf, 2000). Thus real-world English auctions may not
achieve the same revenue-enhancing benefits that one would predict from classic theory. If some

18
auctioneers are particularly good, however, at getting those with lower private signals about the
market value of the car to initially bid, they could increase the information revealed and hence raise
overall prices. For example, some auctioneers may be particularly good at choosing the starting prices
or bid increments that they call in a way that induces a greater number of initial bids from those with
low valuations. Or, perhaps some auctioneers are better at identifying low-valuation bidders and
recognizing their bids early before focusing on the bids by those who will eventually win the
auction.26
4. Reducing search frictions. Much of the activity at wholesale auto auctions occurs across a range of
auction lanes simultaneously. Bidders may face search costs and cognitive limits that affect their
ability to process information and pay attention to the available cars up for auction. Auctioneers may
then differ in their ability to help bidders “match” to cars through techniques that increase the salience
of cars for bidders who are likely to value them. For example, Steve Lang, a former award-winning
auctioneer who is now a buyer and seller at auto auctions and owner of a popular car blog, stated, “I’ll
go to my strongest buyers first. Always” (2009b), and B. J. Lewis, another award-winning auctioneer,
declared, “Knowing the buyer is really important…You’re not watching 20 people all at once. For
example, you might know that [a dealer] buys a certain kind of car” (Reynolds, 2003).
5. Exploiting behavioral biases. A final source of heterogeneity may come from variation in the ability
that auctioneers have to exploit potential behavioral biases in auction settings. Auction environments
are exciting and emotions may sway bidders. It could be that some auctioneers are better at generating
the sort of excitement that induces “irrational exuberance” and “auction fever” (Ku, Malhorta, and
Murnigham, 2005; Ockenfels, Reiley, and Sadrieh, 2007; Malmendier and Szeidl, 2008; Podwol and
Schneider, 2011). Describing his experience, Steve Lang stated, “[I] may have only been 26. But
when I was on the block or in the lane, I had the manipulative mind of a 62-year-old charmer and my
job was to use my powers of persuasion to create the urgency to buy. An inflection of voice. The right
word. The right implicit use of eye contact, hand or body gesture…” (Lang, 2010). Another
possibility is that good auctioneers may be particularly skilled at “anchoring” bidders to certain
reference points (e.g. prices) through the choice of the opening price, referred to as the fish price. At
wholesale car auctions, the auctioneer starts by calling out a high bid, then lowers the price until a
bidder indicates a willingness to pay at that price, at which point the ascending auction begins. Of this
practice, Genesove (1995) commented, “The auctioneer's initial price almost always exceeds the
winning bid. What effect it has on the subsequent bidding is an open question. One auction official,
26 Identifying buyers at auctions can be particularly challenging given what one writer called the “barely discernible sign language used by the buyers” (Reynolds, 2003). Lang (2009a) similarly argued that hand signals used by bidders at auto auctions would be confusing to a lay observer.

19
otherwise quite forthcoming about the workings of the auction, avoided discussion of the initial price,
aside from describing its choice as an important part of the auctioneer’s art.”
There are a number of reasons why it is generally challenging to disentangle the importance of these
potential mechanisms from observational data. For one thing, these forces do not have to be mutually
exclusive in any way. For example, it could be that an auctioneer who is able to generate excitement
(Mechanism 5) gets more initial low bids that reveal information (Mechanism 3) to higher-value bidders.
An auctioneer who generates excitement might also draw attention to the cars on his lane and get better
matches (Mechanism 4) and exciting auctions with many bidders may give sellers more confidence to
accept the auction price, which would look observationally a lot like Mechanism 2. Another challenge is
that many of the behaviors that successful auctioneers might employ could be related to different
mechanisms. For example, patterns of starting prices (“fish prices”) could be used to successfully induce
low-value bids (Mechanism 3) or to induce anchoring (Mechanism 5), so that simply observing
heterogeneity in patterns of fish prices across auctioneers will not be enough information to identify a
mechanism.
Despite the challenges inherent in identifying these mechanisms in a field context, we believe that it
is possible to provide a range of evidence, from both surveys and data analysis, which begins to speak to
the potential relevance of these different sources of heterogeneous ability. In the next two sub-sections we
present evidence from a survey of auctioneers and then discuss observable patterns in our data that shed
light on the mechanisms at play.
4.2 Survey evidence
Our first approach in trying to understand the mechanisms better is through an anonymous survey that the
auction house conducted with 33 of their auctioneers. The questions included on the survey were based on
preliminary discussions with the auction house and after some limited data analysis for this project. As
such, the survey is not particularly scientific, but we believe it nonetheless provides a useful starting point
for considerations of the mechanisms used by auctioneers to achieve success. The auctioneers were asked
to rank the importance of a number of skills/topics in determining a particularly effective auctioneer on a
scale from 0 (very unimportant) to 5 (very important). These rankings are reported in Figure 7. They were
also asked to choose one statement among four options which best describes the most important role of an
auctioneer when auctioning off dealer cars in the wholesale market. The resulting answers to that question
are presented in Table 3. Finally, the survey included an open response box that asked auctioneers to
think of auctioneers they found “especially effective” and to describe what made those auctioneers
different from an average auctioneer.

20
The clearest fact that emerges from these surveys, discussions with the auction house, and our own
observations of the auction process is that auctioneer performance differences are not driven by an ability
to convey relevant information about the cars being auctioned. As Table 3 shows, of the 33 auctioneers,
only one thought that the most important role of auctioneers in this setting was to provide expert
information about cars. The options “Providing information about cars not otherwise available to bidders”
and “Highlighting positive features of the car” also received low rankings reported in Figure 7. The
institutional structure of these auctions also makes the information-revelation mechanism highly unlikely.
Auctioneers rarely, if ever, discuss the features of a car during the one to two minutes while the car is on
the auction block. The bidders in these auctions are experienced used-car dealers who know a great deal
about the retail market for the cars being sold. The auctioneers do not inspect the cars they auction and
see them for the first time a few seconds before beginning the auction. Bidders, in contrast, can walk
around the car, inspect it prior to the auction, and are physically closer to the car during the auction than
the auctioneer. Thus, although theoretically relevant and empirically applicable to other contexts, direct
information revelation is highly unlikely to be an important source of auctioneer heterogeneity in this
setting.
The survey evidence also provides little support for the possibility that good auctioneers are more
successful at persuading sellers to accept fair prices. Again only 1 of 33 auctioneers (Table 3) chose that
option as the most important factor in determining auctioneer success. That mechanism also received
relatively low rankings on the 5-point scale (Figure 7).
The other three mechanisms (3 – 5) are difficult to disentangle via a simple survey, as they all
involve effects on buyer behavior. In Table 3 we see that auctioneers overwhelmingly (31/33) selected the
option that “auctioneers create a sense of excitement, competition, and urgency among buyers that
encourages more bidding” as the most important role of the auctioneer. That is consistent with the
possibility that Mechanism 5 is important, but because there were no options in that part of the survey that
addressed the other buyer-related mechanisms, it does not preclude the importance of mechanisms 3 or 4.
Of the options for important skills/tactics included in the survey, those receiving the highest ranking
(Figure 7) were “creating competitiveness between bidders,” “spotting interested but reluctant bidders,”
“having an effective chant,” and “increasing engagement and excitement by running a fast-paced
auction.” Most of these seem primarily consistent with mechanisms related to behavioral biases, though
spotting interested but reluctant bidders could reasonably be related to either Mechanism 3 or Mechanism
4. Interestingly, calling out good starting prices, which might plausibly be a way to generate bids from
those with low valuations (Mechanism 3) received low rankings.
In their open-ended comments to questions asking to describe what separates an effective auctioneer
from an average auctioneer, several respondents highlight the importance of speed and creating a sense of

21
urgency among bidders through means that appear to target “behavioral factors.” For example, one
auctioneer stated, “The most effective auctioneer's [sic] that I have seen tend to use speed as tool which
create's [sic] a sense of urgency in bidders, force's [sic] split second decisions and does not allow for
bidders to doubt or second guess their bidding decisions.” Another auctioneer stated that a good
auctioneer “knows when to slow down and give someone that extra second to think to make the sale or
for some people speed up so they get caught up in the bidding and end up paying to [sic] much.”
4.3 Quantitative evidence on potential mechanisms
In this subsection we consider patterns in our data that potentially speak to the relevant sources of
heterogeneity. We begin by recalling some of the findings reported in Section 3 (above) that offer
relevant insights on mechanisms and then turn to additional data analysis.
The patterns of correlations between auctioneer effects in conversion rates and prices can shed light
on the relevance of Mechanism 2 (persuading sellers to lower reservation values). If auctioneers differed
primarily in their ability to encourage sellers to lower their reservation values, then auctioneers with high
conversion rates should find their average sales price to be lower conditional on sale. As seen in panel A
of Figure 4, however, conversion rates and prices are positively correlated. This finding is consistent with
the survey evidence and suggests that it is unlikely that the primary mechanism consists of auctioneers
convincing sellers to lower their reserve prices.
The patterns related to the speed of auctions in Section 3 also help to speak to the relative importance
of mechanisms 3 and 5. The finding that faster auctioneers tend to perform better, as shown in Table 3
and in panels B and C of Figure 4, serves as suggestive evidence in favor of an excitement-creation story
and against the idea that good auctioneers aid in revealing information from low-valuation buyers. If
auctioneers achieve success by generating more bidding from low-valuation bidders, one would expect
the process to take a little more time than auctions where the auctioneer elicits bids closer to the final
price from the outset.27 In contrast, we observe that auctioneers who achieve better conversion rates tend
to run faster auctions. Our discussions with auctioneers and the auction house, as well as the survey
evidence, highlighted that the auctioneers believe that fast-paced auctions help to create a sense of
27 Under the hypothesis that good auctioneers reveal more information about the bids of other participants, one might also expect the total number of bids received by the auctioneer to be higher for good auctioneers. We tested this hypothesis using data on the 16 auctioneers from the secondary dataset used below in analyzing fish price effects. We found a positive but insignificant relationship between auctioneer effects for conversion and auctioneer effects for total bids received. An additional mechanism which one would expect to manifest itself in good auctioneers taking longer and receiving more bids (unlike what we see in our estimates) would be that in cases where only one bidder is left and yet the price has not reached a level at which the seller would accept, some auctioneers may be better than others at signaling to the final bidder that he must continue to bid higher. This is referred to as “taking bids off the wall,” “taking bids from the vending machine,” or “taking phantom bids” (see Ashenfelter, 1989; and Vincent, 1995).

22
excitement in bidders.28 Our findings on speed appear consistent with other work that has shown that time
pressure induced by looming auction end-times appears to increase the propensity for overbidding (Ku,
Malhorta, and Murnigham 2005 and Malhorta, 2010).29
We also search for evidence as to whether some auctioneers are better at attracting certain types of
bidders, aiding in the process of matching buyers to cars. To examine this hypothesis, we calculate three
measures for each buyer: 1) size, given by the total number of cars purchased by the buyer in our full
sample; 2) propensity to pay above market value, given by the average residual price paid by the buyer;
and 3) match propensity, given by the percent of the buyer’s purchases which were of a given make.30 We
then estimate the fully specified version of Equation (1) using these measures as outcomes. If auctioneers
differ in their propensity to recognize the types of cars buyers are looking for, that effect might be
especially relevant for buyers who buy large numbers of cars. The t-stat from a regression of auctioneer
fixed effects for the probability of sale on auctioneer fixed effects for buyer size is 1.71, suggesting that
good auctioneers may be marginally better at attracting high-volume buyers.31 Similar regressions of
auctioneer sold fixed effects on propensity to pay over market value or buyer match propensity do not
yield significant t-stats (0.41 and -0.93, respectively). Overall, we do not find strong evidence of the
auctioneer differences in ability to sell cars being explained by differential ability to match buyers to cars.
We investigate anchoring effects by exploring whether auctioneers may generate anchors for the
bidder through the “fish price,” i.e. the initial price that they call. Our auction data do not include
information on the fish price. However, we obtain partial information on initially called price from a
secondary data source which contains cars sold by 16 different auctioneers.32 In this sample, we estimate
auctioneer fixed effects for the probability of sale as well as for the residual fish price (fish price less the 28 An alternative explanation for why speed would be positively correlated with auctioneer price effects and probability-of-sale effects would be that buyers with time costs may prefer to remain in the lane of a fast auctioneer, meaning that a fast auctioneer may lead to more bidders being present, which can in turn increase prices and conversion. Note, however, that this could imply that bidders have high costs of moving between lanes. 29 Haruvy and Leszczyc (2010) and Lucking-Reiley, Bryan, Prasad, and Reeves (2007) find that on eBay, where auction duration is between one and seven days, longer-lasting auctions generate more bidder participation. However, Einav, Kuchler, Levin, and Sundaresan (2013) exploit experimentation at the seller level to find that auction duration does not affect auction outcomes on eBay. Our results, on the other hand, suggest that in the short-lived sales we examine, where the average auction duration is less than two minutes, speed can be an important factor. 30 We use this measure as an outcome in equation (1) as follows: if the make of car i is Honda, and the winner of the car is buyer j, we replace with the percent of all cars purchased by buyer j which were Hondas. 31 This marginal significance disappears, however, if instead of the actual volume of cars purchased we rank buyers according to their volume purchased and replace the outcome in equation (1) with the relative ranking of buyers. In this case, the t-stat drops to -0.12. 32 This secondary dataset is much smaller than our main dataset, containing information on dealer cars sold by 29 different auctioneers at three different auction house locations from January 2007 to March 2010. Sixteen of these auctioneers also sold cars through simulcast auctions, where the fish price is recorded (simulcast auctions are sales in which bidders could participate remotely online, although the actual auction still took place physically at the auction house and most bidders were physically present). Given that sellers at simulcast auctions are mostly fleet/lease sellers, we estimate sold effects from the dealers sample and use the simulcast sample only for estimating fish price effects. We follow similar sample restrictions as in our main dataset but restrict to auctioneers selling more than 100 cars due to the smaller sample size. This leaves us with a dataset of 68,924 cars in the dealers sample and 49,069 cars in the simulcast sample.

23
market value). Although we do find some heterogeneity (albeit noisy) among auctioneers in the (residual)
fish price that they call for otherwise identical cars, these differences do not appear to translate to
heterogeneity in conversion rates: The t-stat of a regression of auctioneer probability-of-sale effects on
auctioneer effects for fish price (both from the fully specified model) is -0.68.
Taking all of this evidence together, and combining it with the evidence from our surveys and
observations of auctioneers, a few patterns begin to emerge. First, auctioneer effects are not driven by an
ability to reveal information about cars and also are likely not primarily a result of convincing sellers to
change their patterns of reservation prices. We do not have conclusive evidence on the different
mechanisms related to changing patterns of bids. The patterns that emerge most clearly, however, point to
some role for auctioneers influencing bidder behavior through tactics that create excitement among
bidders. Further, in terms of specific mechanisms, both auctioneer surveys and patterns in the data suggest
that the use of speed and time pressure may be an important component of how auctioneers affect
bidders’ feelings of excitement and urgency during auctions.
5. Discussion and conclusion
The evidence presented in this paper shows that in well-functioning, high-stakes auctions, the specific
manner in which the auction is run can have an important impact on the outcome. Using a large dataset
from the wholesale used-car market, we find that auctioneers differ systematically in their ability to sell
cars, as well as in the prices they get and the speed in which they do it; these differences are economically
relevant.
Our results of a significant role of the auction process, and in particular of the “human” component in
auctions, speak to the role that computerized online auctions may have in coordinating economic activity.
There would seem to be strong efficiencies to computerized auctions, as they avoid the costs of
employing professional auctioneers and auction-house staff and in online formats can avoid the often
substantial transaction costs of bringing bidders and goods together in the same place. Yet recent work
has documented that the popularity of online auctions may be fading (Einav, Farronato, Levin, and
Sundaresan, 2012). Our findings suggest that human auctioneers have tactics that may improve the
efficiency of auctions and, as such, might help to explain why computerized online auctions do not yet
dominate the marketplace. Further studies into the behaviors of human auctioneers could provide
important insights that can be used to improve the performance of computerized auction mechanisms and
more generally may be useful for quantifying the potential efficiency losses from conducting naïve
computerized auction processes.
Additional work is also needed to tightly pin down the mechanisms through which auctioneers affect
outcomes, or the sources of auctioneer abilities. The evidence presented here is consistent with the
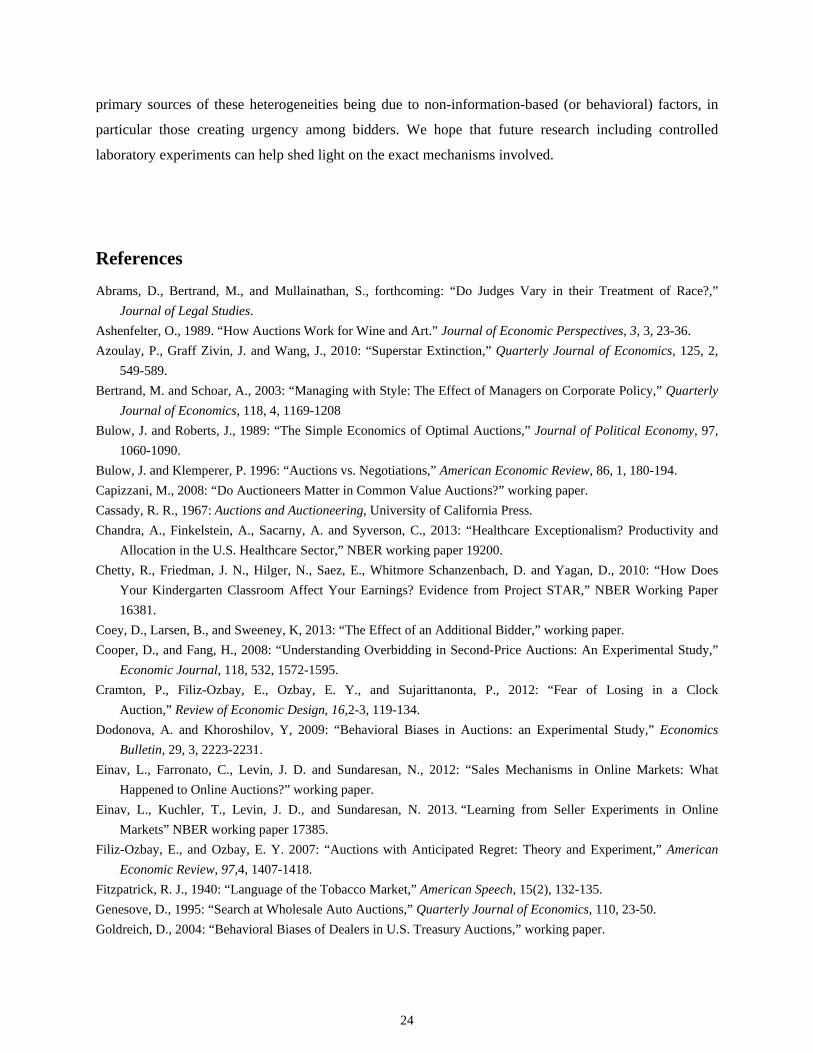
24
primary sources of these heterogeneities being due to non-information-based (or behavioral) factors, in
particular those creating urgency among bidders. We hope that future research including controlled
laboratory experiments can help shed light on the exact mechanisms involved.
References
Abrams, D., Bertrand, M., and Mullainathan, S., forthcoming: “Do Judges Vary in their Treatment of Race?,”
Journal of Legal Studies.
Ashenfelter, O., 1989. “How Auctions Work for Wine and Art.” Journal of Economic Perspectives, 3, 3, 23-36.
Azoulay, P., Graff Zivin, J. and Wang, J., 2010: “Superstar Extinction,” Quarterly Journal of Economics, 125, 2,
549-589.
Bertrand, M. and Schoar, A., 2003: “Managing with Style: The Effect of Managers on Corporate Policy,” Quarterly
Journal of Economics, 118, 4, 1169-1208
Bulow, J. and Roberts, J., 1989: “The Simple Economics of Optimal Auctions,” Journal of Political Economy, 97,
1060-1090.
Bulow, J. and Klemperer, P. 1996: “Auctions vs. Negotiations,” American Economic Review, 86, 1, 180-194.
Capizzani, M., 2008: “Do Auctioneers Matter in Common Value Auctions?” working paper.
Cassady, R. R., 1967: Auctions and Auctioneering, University of California Press.
Chandra, A., Finkelstein, A., Sacarny, A. and Syverson, C., 2013: “Healthcare Exceptionalism? Productivity and
Allocation in the U.S. Healthcare Sector,” NBER working paper 19200.
Chetty, R., Friedman, J. N., Hilger, N., Saez, E., Whitmore Schanzenbach, D. and Yagan, D., 2010: “How Does
Your Kindergarten Classroom Affect Your Earnings? Evidence from Project STAR,” NBER Working Paper
16381.
Coey, D., Larsen, B., and Sweeney, K, 2013: “The Effect of an Additional Bidder,” working paper.
Cooper, D., and Fang, H., 2008: “Understanding Overbidding in Second-Price Auctions: An Experimental Study,”
Economic Journal, 118, 532, 1572-1595.
Cramton, P., Filiz-Ozbay, E., Ozbay, E. Y., and Sujarittanonta, P., 2012: “Fear of Losing in a Clock
Auction,” Review of Economic Design, 16,2-3, 119-134.
Dodonova, A. and Khoroshilov, Y, 2009: “Behavioral Biases in Auctions: an Experimental Study,” Economics
Bulletin, 29, 3, 2223-2231.
Einav, L., Farronato, C., Levin, J. D. and Sundaresan, N., 2012: “Sales Mechanisms in Online Markets: What
Happened to Online Auctions?” working paper.
Einav, L., Kuchler, T., Levin, J. D., and Sundaresan, N. 2013. “Learning from Seller Experiments in Online
Markets” NBER working paper 17385.
Filiz-Ozbay, E., and Ozbay, E. Y. 2007: “Auctions with Anticipated Regret: Theory and Experiment,” American
Economic Review, 97,4, 1407-1418.
Fitzpatrick, R. J., 1940: “Language of the Tobacco Market,” American Speech, 15(2), 132-135.
Genesove, D., 1995: “Search at Wholesale Auto Auctions,” Quarterly Journal of Economics, 110, 23-50.
Goldreich, D., 2004: “Behavioral Biases of Dealers in U.S. Treasury Auctions,” working paper.

25
Haile, P. A. and Tamer, E., 2003: “Inference with an Incomplete Model of English Auctions,” Journal of Political
Economy, 111, 1, 1-51.
Harstad, R. M. and Rothkopf, M. H., 2000: “An ‘Alternating Recognition’ Model of English Auctions,”
Management Science, 46, 1, 1-12.
Haruvy, Ernan, and Peter T. L. Popkowski Leszczyc (2010). “The Impact of Online Auction Duration,” Decision
Analysis 7,1, 99-106.
Heyman, J., Orhun, Y., and Ariely, D., 2004: “Auction Fever: The Effect of Opponents and Quasi-Endowment on
Product Valuations,” Journal of Interactive Marketing, 18, 4, 7-21.
Hortaçsu, A., Matvos, G., Syverson, C. Venkataraman, S., 2013: “Indirect Costs of Financial Distress In Durable
Goods Industries: The Case of Auto Manufacturers,” Review of Financial Studies, 26, 5, 1248-1290.
Hossain, T., Khalil, F. and Shum, M., 2013: “Market Makers in Chittagong Tea Auctions: The Role of Trust and
Reputation,” working paper.
Jacob, B. A. and Lefgren, L., 2005: “Principals as Agents: Subjective Performance Measurement in Education,”
NBER Working Paper 11463.
Jones, B. and Olken, B., 2005: “Do Leaders Matter? National Leadership and Growth since World War II,”
Quarterly Journal of Economics, 120, 3, 835 -864.
Klemperer, P., 2004: Auctions: Theory and Practice, Princeton University Press.
Klemperer, P., 2002: "What Really Matters in Auction Design." The Journal of Economic Perspectives 16, 1, 169-
189.
Ku, G., Malhotra, D. and Murnigham, J. K., 2005: “Towards a Competitive Arousal Model of Decision-making: A
Study of Auction Fever in Live and Internet Auctions,” Organizational Behavior and Human Decision
Processes, 96, 89–103.
Kuiper, K., and Tillis, F., 1985: “The Chant of the Tobacco Auctioneer,” American Speech, 60(2), 141-149.
Lang, S., 2009a: “Hammer Time: Fast Talk,” The Truth About Cars. Url:
http://www.thetruthaboutcars.com/2009/02/hammer-time-fast-talk/. Posted Feb. 8, 2009. Retrieved Mar. 14,
2013.
Lang, S., 2009b: “Hammer Time: The Power of Nuance,” The Truth About Cars. Url:
http://www.thetruthaboutcars.com/2009/02/hammer-time-the-power-of-nuance/. Posted Feb. 24, 2009.
Retrieved Mar. 14, 2013.
Lang, S., 2010: “Hammer Time: The Trade,” The Truth About Cars. Url:
http://www.thetruthaboutcars.com/2010/05/hammer-time-the-trade/. Posted May 5, 2010. Retrieved Mar. 14,
2013.
Lucking-Reiley, D., Bryan, D., Prasad, N. and Reeves, D., 2007: “Pennies from eBay: the Determinants of Price in
Online Auctions,” Journal of Industrial Economics, 55, 2, 223-233.
Lazear, E. P., Shaw, K. L. and Stanton, C. T., 2012: “The Value of Bosses,” NBER working paper 18317.
Malhorta, D., 2010: "The Desire to Win: The Effects of Competitive Arousal on Motivation and
Behavior." Organizational Behavior and Human Decision Processes 111, 139–146.
Malmendier, U. and Szeidl, 2008: “Fishing for Fools,” working paper.
Malmendier, U. and Tate, G., 2009: “Superstar CEOs,” Quarterly Journal of Economics, 124, 4, 1593-1638.
Manheim, 2011: Used Car Market Report.
Milgrom, P., 2004: Putting Auction Theory to Work, Cambridge University Press.
Milgrom, P. and Weber, R., 1982: “A Theory of Auctions and Competitive Bidding,” Econometrica, 50, 5, 1089-
1122.

26
Morris, C. N., 1983: “Parametric Empirical Bayes Inference: Theory and Applications,” Journal of the American
Statistical Association, 78, 381, 47-55.
NAAA, 2009: 2009 Annual Review. National Auto Auction Association. www.naaa.com.
Ockenfels, A., Reiley, D. H. and Sadrieh, A., 2007: “Online Auctions,” in Handbook of Information Systems and
Economics, ed. Terrence Hendershott. Elsevier Science, 571-628.
Podwol, J. and Schneider, H. S., 2011: “Testing for Nonstandard Behavior in Auctions in the Presence of
Unobserved Demand,” working paper.
Pronin, E. and Wegner, D. M., 2006: “Manic Thinking: Independent Effects of Thought Speed and Thought Content
on Mood,” Psychological Science, 17, 807-813.
Reynolds, J., 2003: “Going Once. Going Twice…,” Amarillo Globe News. Url:
http://amarillo.com/stories/052803/new_goingonce.shtml. Posted May 28, 2003. Retrieved Mar 14, 2013.
Sawyers, A., 2012: “Used-car Drought Relief? Next Year,” Automotive News. Url:
http://www.autonews.com/apps/pbcs.dll/article?AID=/20120305/RETAIL07/303059967. Posted Mar. 5, 2012.
Retrieved Jun. 25, 2012.
Tadelis, S. and Zettelmeyer, F., 2011: “Information Disclosure as a Matching Mechanism: Theory and Evidence
from a Field Experiment,” working paper.
Treece, J. B., 2013: “Manheim Exec: Why Do So Few Sales at Auctions Close?” Automotive News.
http://www.autonews.com/article/20131202/RETAIL04/312029992/manheim-exec-why-do-so-few-sales-at-
auctions-close. Posted Dec. 2, 2013. Retrieved Dec. 2, 2013.
Vincent, D. R., 1995. “Bidding Off the Wall: Why Reserve Prices May Be Kept Secret,” Journal of Economic
Theory, 65, 2, 575-584.

27
Figure 1 ‐ Auctioneer Differences in Probability of Sale Panel A plots the normalized fixed effects for each of the 60 auctioneers in our data. The fixed effects are obtained from a regression model with no controls, and then adding seller fixed effects, auction day and time of day, lane fixed effects, and car type fixed effects (see Equation (1) above), and normalized following the procedure described in Equation (2). Panel B plots the fully specified model’s fixed effects (Specification 8 in Table 2) along with 95% confidence intervals.
A: Comparison between specifications
B: Fully specified estimates with confidence intervals
-.2
-.1
0.1
.2N
orm
aliz
ed
Au
ctio
ne
er E
ffect
s
1 10 20 30 40 50 60Auctioneer Rank Order (Worst to Best)
No Controls Seller FESeller, Day, Time FE Seller, Day, Time, Lane FESeller, Day, Time, Lane, Car FE, Miles
-.0
50
.05
.1N
orm
aliz
ed
Au
ctio
ne
er E
ffect
s
1 10 20 30 40 50 60Auctioneer Rank Order (Worst to Best)

28
Figure 2 – Comparison between Identification Strategies. The panels below provide scatterplots that show the correlation in fixed effects for auctioneers based on probability of sale (Panel A), residual price (Panel B), and time on the block (Panel C) between our two different identification strategies: the analysis within seller, auction day and time of day, lane, and car types fixed effects (Specification 8 in Table 2), and the identification based on shifts within a lane (lane*day) (Specification 9). Fitted lines are reported as well as the t‐statistics from univariate linear regressions between the auctioneer effect estimates from the two identification approaches.
A: Probability of sale (t= 16.15)
B: Residual price (t= 6.51)
C: Time on the block (t= 15.46)
-.0
50
.05
.1S
elle
r, D
ay,
Tim
e, L
an
e, C
ar
FE
, Mile
s
-.05 0 .05 .1Time, Lane*Day FE
-100
-50
05
01
001
50S
elle
r, D
ay,
Tim
e, L
an
e, C
ar
FE
, Mile
s
-100 -50 0 50 100Time, Lane*Day FE
-15
-10
-50
51
0S
elle
r, D
ay,
Tim
e, L
an
e, C
ar
FE
, Mile
s
-10 -5 0 5 10Time, Lane*Day FE

29
Figure 3 ‐ Correlation of Fixed Effects between 2007‐09 and 2010‐13. Using the identification within seller, auction day and time of day, lane, and car
types, we estimated auctioneer fixed effects separately using data for 2007‐09 and then 2010‐13. The panels below provide scatterplots that show the correlation in fixed effects between 2007‐09 and 2010‐13 for probability of sale (Panel A), residual price of sale (Panel B), and time on the block for sold cars (Panel C). Fitted lines are reported as well as the t‐statistics from univariate linear regressions between the outcomes in the two years for each measure. The analysis here is limited to the 49 auctioneers with at least 2,000 observations in each of the two time periods.
A: Probability of sale (t=4.91) B: Residual price (t=‐0.10)
C: Time on the block (t=7.32)
-.0
50
.05
.12
007-
9
-.04 -.02 0 .02 .04 .062010-13
-100
01
002
003
002
007-
9
-100 -50 0 50 100 1502010-13
-20
-10
01
02
007-
9
-20 -10 0 102010-13

30
Figure 4 ‐ Correlation between Performance Measures. The panels below provide scatterplots that show the correlation in fixed effects for auctioneers based on probability of sale, residual price, and time on the block for sold cars. All fixed effects come from the fully specified model estimates within seller, auction day and time of day, lane, and car types. Fitted lines are reported as well as the t‐statistic from univariate regressions between the outcomes for each measure.
A: Probability of sale and residual price (t=3.29) B: Probability of sale and time on the block for sold cars (t=‐1.62)
C: Residual price and time on the block for sold cars (t=‐2.52)
-.0
4-.
02
0.0
2.0
4.0
6P
roba
bilit
y o
f sa
le
-100 -50 0 50 100 150Residual price
-.0
4-.
02
0.0
2.0
4.0
6P
roba
bilit
y o
f sa
le
-20 -10 0 10Time on block for sold cars
-100
-50
05
01
001
50R
esi
dual
pri
ce
-20 -10 0 10Time on block for sold cars

31
Figure 5 – Correlation of Performance Measures with Subjective Evaluations. The panels below provide scatterplots that show the correlation in fixed effects for 41 auctioneers between the company’s subjective evaluations (on a 0 to 1 scale) and probability of sale, residual price, and time on the block for sold cars. All fixed effects come from the fully specified model within seller, auction day and time of day, lane, and car types. Fitted lines are reported as well as the t‐statistic from univariate regressions between the subjective evaluation and each performance measure.
A: Probability of sale (t= 4.62) B: Residual Price (t= 2.09)
C: Time on the block for sold cars (t‐ ‐2.03)
0.2
.4.6
.81
Su
bjec
tive
eva
luat
ion
-.04 -.02 0 .02 .04 .06Probability of sale
0.2
.4.6
.81
Su
bjec
tive
eva
luat
ion
-100 -50 0 50 100 150Residual price
0.2
.4.6
.81
Su
bjec
tive
eva
luat
ion
-20 -10 0 10Time on block for sold cars
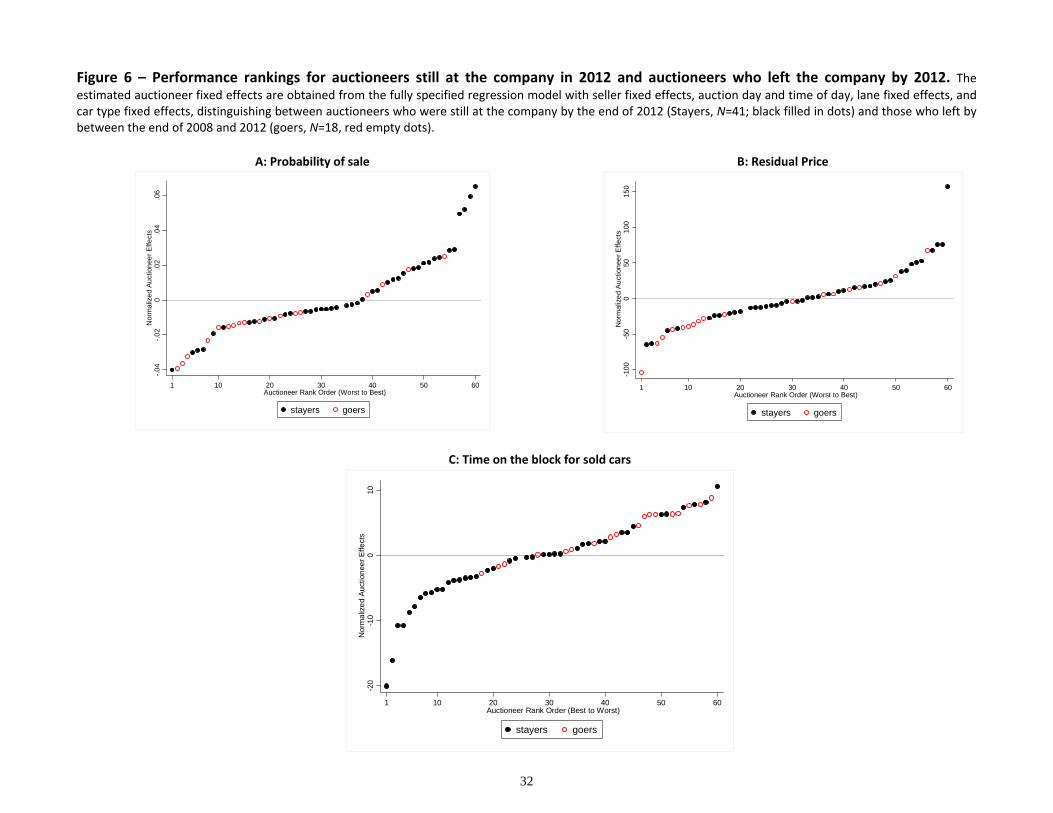
32
Figure 6 – Performance rankings for auctioneers still at the company in 2012 and auctioneers who left the company by 2012. The estimated auctioneer fixed effects are obtained from the fully specified regression model with seller fixed effects, auction day and time of day, lane fixed effects, and car type fixed effects, distinguishing between auctioneers who were still at the company by the end of 2012 (Stayers, N=41; black filled in dots) and those who left by between the end of 2008 and 2012 (goers, N=18, red empty dots).
A: Probability of sale B: Residual Price
C: Time on the block for sold cars
-.0
4-.
02
0.0
2.0
4.0
6N
orm
aliz
ed
Au
ctio
nee
r E
ffect
s
1 10 20 30 40 50 60Auctioneer Rank Order (Worst to Best)
stayers goers
-10
0-5
00
5010
015
0N
orm
aliz
ed
Au
ctio
nee
r E
ffect
s
1 10 20 30 40 50 60Auctioneer Rank Order (Worst to Best)
stayers goers
-20
-10
010
Nor
mal
ize
d A
uct
ion
eer
Effe
cts
1 10 20 30 40 50 60Auctioneer Rank Order (Best to Worst)
stayers goers

33
Figure 7 ‐ Survey results. This figure reports the average ratings received by various proposed answers to a question asking auctioneers to rate the importance of tactics for determining a "highly effective" auctioneer (from 0‐lowest to 5‐highest):

34
Table 1: Descriptive statistics
Mean
(Std. Deviation)
0.53
(0.50)
15,140.97
(9567.57)
Price ‐ Expected Price ($) 424,852 377.24
(1669.43)
103.18
(74.03)
4.43
(3.28)
56,236.51
(33,730.87)
Miles
859,240
455,224
777,960
859,239
859,240
Observations
Share of cars sold
Sale price ($)
Time on the block (s)
Age (years)

35
Table 2: Standard deviations of estimated auctioneer effects with varying controls. This table displays the effect of a one‐standard‐deviation increase in auctioneer performance as measured by the probability the car sold, residual price, and the time on the block. Each cell of the table comes from a separate regression on auctioneer fixed effects and varying degrees of controls as specified. In addition to the standard deviation, the second column for each outcome measure reports the coefficient of correlation between two consecutive specifications, and, in brackets, the t‐statistic on the coefficient estimate from a linear regression of the estimated auctioneer effects from each specification on a constant and the auctioneer effects from the subsequent specification.
Standard
deviation
Coefficient of
correlation with
previous specification
Standard
deviation
Coefficient of
correlation with
previous specification
Standard
deviation
Coefficient of
correlation with
previous specification
1 Raw values 0.051 219.633 7.48
2 Seller FEs 0.038 0.94 [21.46] 55.842 0.67 [6.89] 5.77 0.95 [24.31]
3 Seller, time of day, auction day FEs 0.025 0.73 [8.19] 52.559 0.61 [5.88] 5.75 0.81 [10.74]
4Seller, time of day, auction day, lane
FEs0.023 0.97 [31.44] 40.274 0.86 [13.14] 5.00 0.98 [36.59]
5Seller, time of day, auction day, lane,
make FEs0.023 0.99 [106.33] 40.963 0.99 [49.65] 5.26 0.99 [79.07]
6Seller, time of day, auction day, lane,
make*age FEs, miles0.024 0.99 [122.8] 41.864 0.98 [42.74] 5.23 0.99 [510.73]
7Seller, time of day, auction day, lane,
make*model*age FEs, miles0.023 0.99 [123.26] 41.619 0.99 [52.11] 5.23 0.99 [289.38]
8Seller, time of day, auction day, lane,
make*model*age*body FEs, miles0.023 0.99 [139.15] 41.776 0.98 [38.39] 5.23 0.99 [231.28]
Probability of sale Residual price Time on block

36
Table 3: Survey results from role‐of‐auctioneer question
1
Auctioneers create a sense of excitement,
competition, and urgency among buyers that
encourages more bidding
2Auctioneers provide expert information about cars
on the block that bidders do not know themselves
3Auctioneers persuade sellers to accept the fair
market price
4
Buyers know what a car is worth and will bid
accordingly. Therefore, auctioneers do not have a
large impact on auction outcomes
0
Question: “If you had to pick one of the statements below, which one do you think best describes the most important role of auctioneers at [company’s] auctions?”
OptionNumber of respondents
choosing option
31
1
1

37
Appendix Figure A.1: Distribution of auctioneer shift length on a lane and given day
0.0
05
.01
.01
5.0
2F
ract
ion
0 15 30 45 60 75 90 105 120Number of minutes on block during shift

38
Figure A.2 ‐ Correlation between time on the block and time on the block for sold cars and unsold cars
A: Time on the block and time on the block for sold cars (t=22.00)
B: Time on the block for sold cars and time on the block for unsold cars (t=10.66)
-20
-10
01
0T
ime
on
blo
ck fo
r so
ld c
ars
-15 -10 -5 0 5 10Time on block
-20
-10
01
0T
ime
on
blo
ck fo
r so
ld c
ars
-10 -5 0 5 10Time on block for unsold cars