Bicycle Leadership Conference Demographics Survey Report April … · 2013-09-16 · Bicycle...
22
Bicycle Leadership Conference Demographics Survey Report April 13-15 2010 Author: Kate Scheider, Research & Statistics Coordinator, Bikes Belong Coalition
Transcript of Bicycle Leadership Conference Demographics Survey Report April … · 2013-09-16 · Bicycle...
Bicycle Leadership Conference Demographics Survey Report
April 13-15 2010
Author: Kate Scheider, Research & Statistics Coordinator, Bikes Belong Coalition

Questions1. “Where did you buy your most recently purchased bike?”2. “How satisfied were you with your most recent bike purchasing experience?”3. Average satisfaction rating for most recent bike purchase by type of retail location 4. “What kind of bike was the most recent bike you purchased?”5. “In what year did you purchase your most recent bike?”6. Average date of most recent bike purchase by bike type7. “What kind of bike are you planning on purchasing next?”8. Most recent bike purchases compared to planned next bike purchases9. “How many bikes do you currently own?”10. “In the prime riding months of 2009, how many days per month did you ride?”11. “In addition to cycling, what other outdoor/fitness activities do you enjoy regularly (6 or more times/year)?”12. “How happy are you with the bicycling facilities (roads, paths, and trails) where you live?”13. “How often do you ride for utility/transportation/commuting purposes?”14. “Which of these factors, if any, discourage you from utility/transportation/commuting riding?”15. “Are you currently a member of a bicycle advocacy group (IMBA, League of American Bicyclists, etc)?”16. “If you are not a member of a bike advocacy group, why not?”17. “What kind of online presences do you have?“18. “What is your age?”19. “What is your gender?”20. Women: “What type of cyclist best describes you?”21. Women: “What motivates you to ride?”22. Women: “Who do you ride with most often?”23. Women: “Do you participate in women-only bike clinics, rides, or events?”24. Women: “In which categories, if any, do you own a women’s-specific bike product?”25. Women: “In which categories, if any, do you have trouble finding a product that works well for you?”26. Women: “Do you ever help other women decide what bikes or bike gear to buy?”27. Women: “Where do you shop for cycling apparel and accessories?”28. Women: “How much do you enjoy shopping for bikes and gear?”29. Women: Enjoyment shopping for bikes and gear by most frequented type of store30. Women: “How comfortable are you going into your preferred local bike shop?”31. Women: “Does your preferred local bike shop have a section devoted to products for women?”32. Women: Comfort rating in preferred local bike shop by whether or not shop has a women’s product section33. Women: “Can you find cycling clothing and gear that fit your personal style?”34. Women: “What type of cycling gear do you gravitate towards?”35: Women: “What resources do you use when deciding what bikes or gear to purchase?”36. Women: “How important are each of these factors to you?”
MethodologyThis survey was conducted online via SurveyMonkey.com from January 19, 2010 to March 1, 2010. The main survey consisted of 17 questions. Female respondents were directed to a second survey with 14 questions. Advertisements onVeloNews.com, Cyclingnews.com, Bikeradar.com, and Bicycling.com were used to solicit responses. 2,289 people started the survey and 2,173 completed it (94.9% response rate.) 1,874 U.S. respondents completed the survey. 496 of U.S. respondents who completed the survey were female and 1,378 were male.

“Where did you buy your most recently purchased bike?”
Bike shop
Pro deal/Industry hookup
Other
eBay
Online bike shop
Craigslist
1319
171
132
122
114
64
Outdoor store (REI, etc.)
Sporting goods store (Dick’s, etc.)
Mass Merchant (Target, Walmart, etc.)
26
7
5
67.3%
8.7%
6.7%
6.2%
5.8%
3.3%
1.3%
0.4%
0.3%
# %respondents
Bike shop
Craigslist
eBay
Sporting goods store (Dick’s, etc)
Mass merchant (Target, Walmart, etc.)
Outdoor store (REI, etc.)
Other
Pro deal/Industry hookup
Online bike shop
0% 10% 20% 30% 40% 50% 60% 70%Percentage of respondents
Men were more likely to buy a bike online.
67.5%66.8%
3.2%3.6%
7.9%1.4%
0.1%0.6%
7.3%1.6%
6.1%8.5%
1.1%2.0%
6.5%15.2%
0.3%0.4%
Men
Women
1

“How satisfied were you with your most recent bike purchasing experience?”
Average satisfaction rating for most recent bike purchase by type of retail location
Men
Women
Percentage of respondents
Very satisfied
Somewhat satisfied
Neutral
Somewhat unsatisfied
Very unsatisfied
0% 20% 40% 60% 80%
75.3%72.1%
18.9%19.6%
3.8%4.9%
1.4%3.0%
0.6%0.4%
91.7% of women were satisfied94.2% of men were satisfied
3.4% of women were unsatisfied2.0% of men were unsatisfied
Bike shop
eBay
Pro deal/Industry hookup
Online bike shop
Other
Mass merchant (Target, Walmart, etc.)
Outdoor store (REI, etc)
Sporting goods store (Dick's, etc)
Craigslist
3 54Neutral Somewhat
satisfiedVery
satisfied
4.68
4.66
4.65
4.60
4.60
3.60
4.27
4.29
4.55
2

“What kind of bike was the most recent bike you purchased?”
Road
Dual suspension mountain
Hardtail mountain
Cyclocross
City/Urban/Commute
Time trial/Triathlon
1176
220
138
131
62
48
Hybrid
Fixed gear/Track
42
41
35
60.0%
11.2%
7.0%
6.7%
3.2%
2.4%
2.1%
2.1%
1.8%
# %respondents
Other
Unsuspended mountain
Cruiser
Tandem
Comfort
21
19
17
10
1.1%
1.0%
0.9%
0.5%
Men
Women
0% 10% 20% 30% 40% 50%
Percentage of respondents
City/Urban/Commute
Comfort
Cruiser
Fixed gear/Track
Dual suspension
Tandem
Road
Other
Hybrid
Unsuspended mountain
Time trial/Triathlon
Cyclocross
Hardtail mountain
60% 70%
2.5%4.9%
0.3%1.0%
0.6%2.2%
6.5%7.3%
10.2%14.0%
2.2%1.8%
7.4%5.9%
1.4%4.3%
1.7%2.2%
62.4%53.0%
1.0%0.4%
2.7%1.8%
1.0%1.2%
3
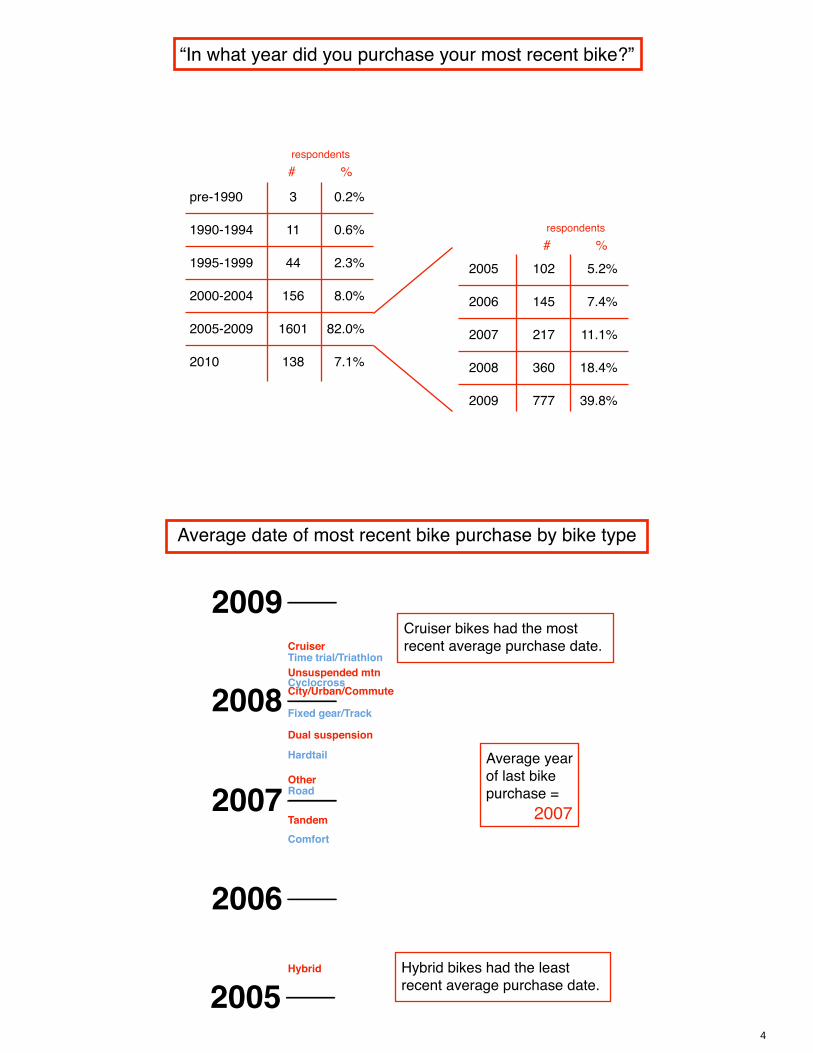
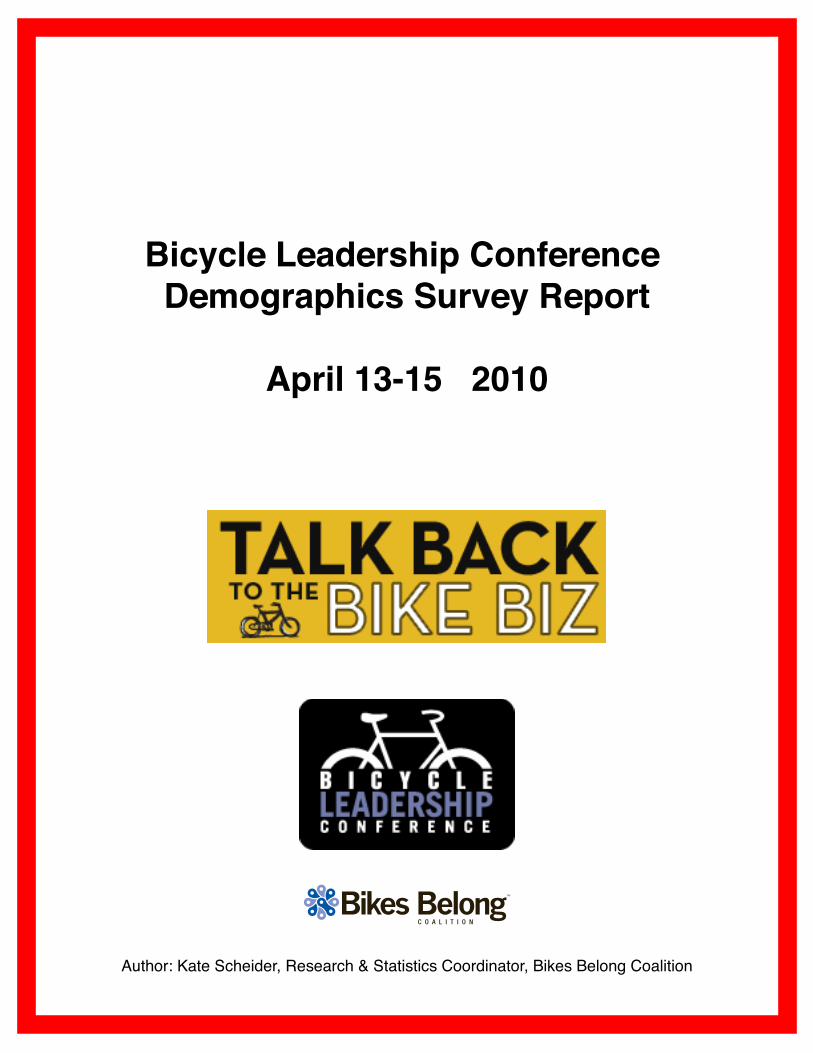
“In what year did you purchase your most recent bike?”
pre-1990
1990-1994
1995-1999
2000-2004
2005-2009
2010
3
11
44
156
1601
138
2005
2006
2007
2008
2009
102
145
217
360
777
# %respondents
0.2%
0.6%
2.3%
8.0%
82.0%
7.1%
# %respondents
5.2%
7.4%
11.1%
18.4%
39.8%
Average date of most recent bike purchase by bike type
2005
2006
2007
2008
2009
Hybrid
ComfortTandem
RoadOther
Hardtail
Dual suspension
Fixed gear/Track
City/Urban/CommuteUnsuspended mtnTime trial/Triathlon
Cyclocross
Cruiser
Average yearof last bike purchase = 2007
Cruiser bikes had the mostrecent average purchase date.
Hybrid bikes had the leastrecent average purchase date.
4
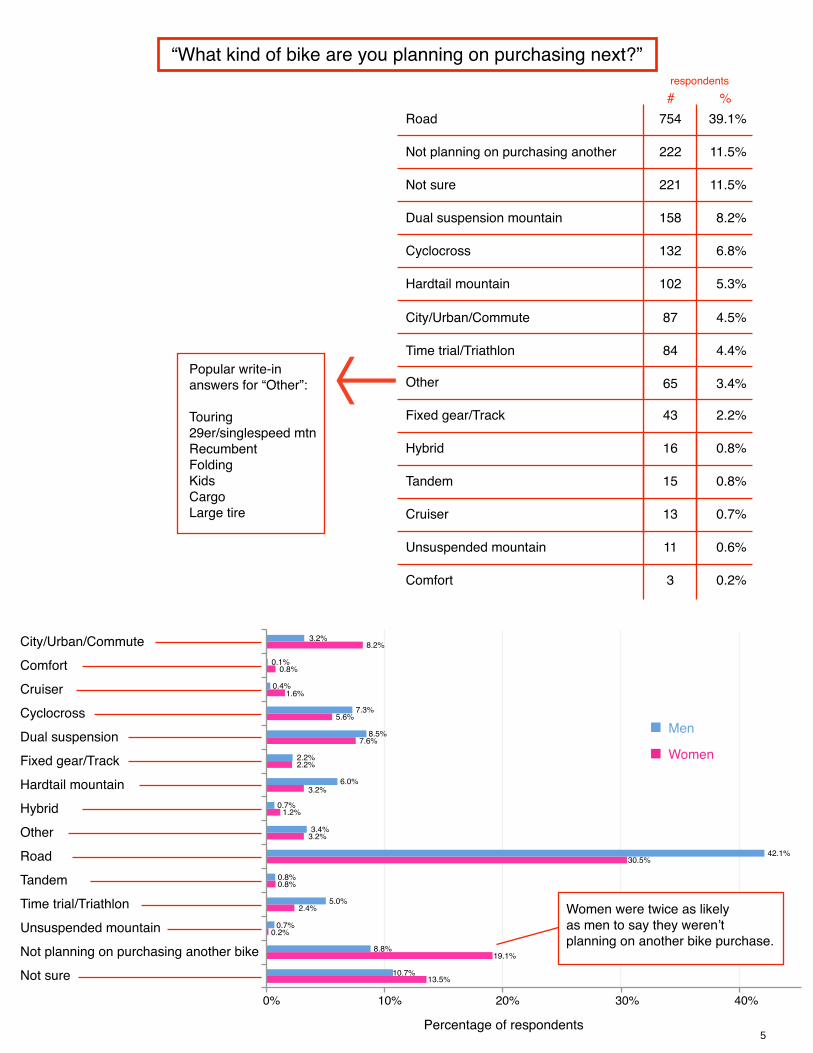
“What kind of bike are you planning on purchasing next?”
Road
Not planning on purchasing another
Not sure
Dual suspension mountain
Cyclocross
Hardtail mountain
754
222
221
158
132
102
City/Urban/Commute
Time trial/Triathlon
87
84
65
39.1%
11.5%
11.5%
8.2%
6.8%
5.3%
4.5%
4.4%
3.4%
# %respondents
Other
Fixed gear/Track
Hybrid
Tandem
Cruiser
43
16
15
13
2.2%
0.8%
0.8%
0.7%
Unsuspended mountain
Comfort
11
3
0.6%
0.2%
Popular write-inanswers for “Other”:
Touring29er/singlespeed mtnRecumbentFoldingKidsCargoLarge tire
Men
Women
0% 10% 20% 30% 40%
Percentage of respondents
City/Urban/Commute
Comfort
Cruiser
Fixed gear/Track
Dual suspension
Tandem
Road
Other
Hybrid
Not sure
Not planning on purchasing another bike
Unsuspended mountain
Time trial/Triathlon
Cyclocross
Hardtail mountain
Women were twice as likelyas men to say they weren’t planning on another bike purchase.
3.2%8.2%
0.1%0.8%
0.4%1.6%
7.3%5.6%
8.5%7.6%
2.2%2.2%
6.0%3.2%
0.7%1.2%
3.4%3.2%
42.1%30.5%
0.8%0.8%
5.0%2.4%
0.7%0.2%
8.8%19.1%
10.7%13.5%
5
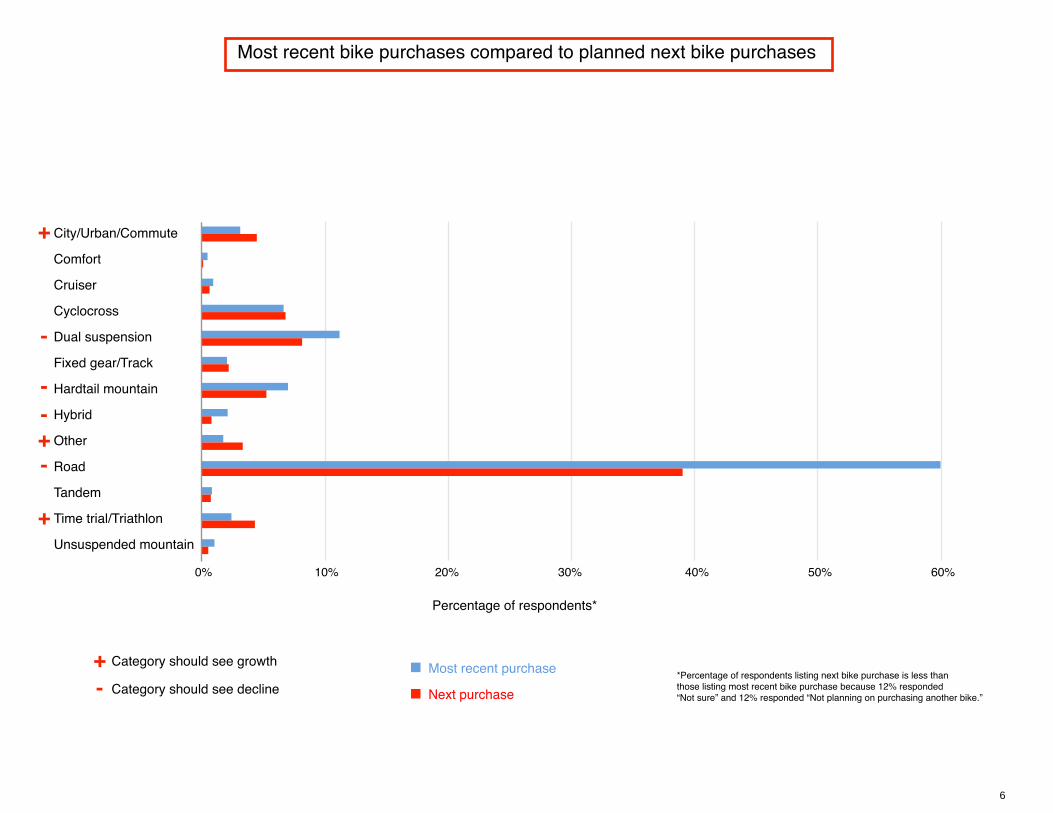
Most recent bike purchases compared to planned next bike purchases
City/Urban/Commute
Comfort
Cruiser
Dual suspension
Cyclocross
Other
Hybrid
Hardtail mountain
Fixed gear/Track
Unsuspended mountain
Time trial/Triathlon
Tandem
Road
Percentage of respondents*
Most recent purchase
Next purchase
0% 10% 20% 30% 40% 50% 60%
+
+
+
-
-
-
-
*Percentage of respondents listing next bike purchase is less thanthose listing most recent bike purchase because 12% responded “Not sure” and 12% responded “Not planning on purchasing another bike.”
+-
Category should see growth
Category should see decline
6

“How many bikes do you currently own?”
1
2
3
4
5 to 8
0
9 to 12
12+
171
515
467
319
385
2
54
25
8.8%
26.6%
24.1%
16.5%
19.9%
0.1%
2.8%
1.3%
# %respondents
bikes Men
Women
0% 10% 20% 30% 40%
Percentage of respondents
2.2%
3.2%
19.1%
10.7%13.5%
Num
ber o
f bik
es
0
1
2
3
4
5 to 8
9 to 12
12+ 1.5%0.6%
3.1%1.8%
21.6%14.8%
16.8%15.4%
25.6%19.8%
24.1%33.6%
7.0%14.0%
0.1%0.0%
Men tended to own more bicycles than women did.
“In the prime riding months of 2009, how many days per month did you ride?”
5-9
10-14
15-19
20-24
25+
0-4
228
356
419
443
350
100
12.0%
18.8%
22.1%
23.4%
18.5%
5.3%
# %respondents
daysMen
Women
Percentage of respondents
0% 10% 20% 30%
0 to 4
5 to 9
10 to 14
15 to 19
20 to 24
25+
Num
ber o
f day
s/m
onth
Women tended to ridefewer days/month than men.
19.2%16.4%
25.5%17.6%
23.1%19.4%
18.5%19.6%
9.3%19.6%
4.5%7.5%
7
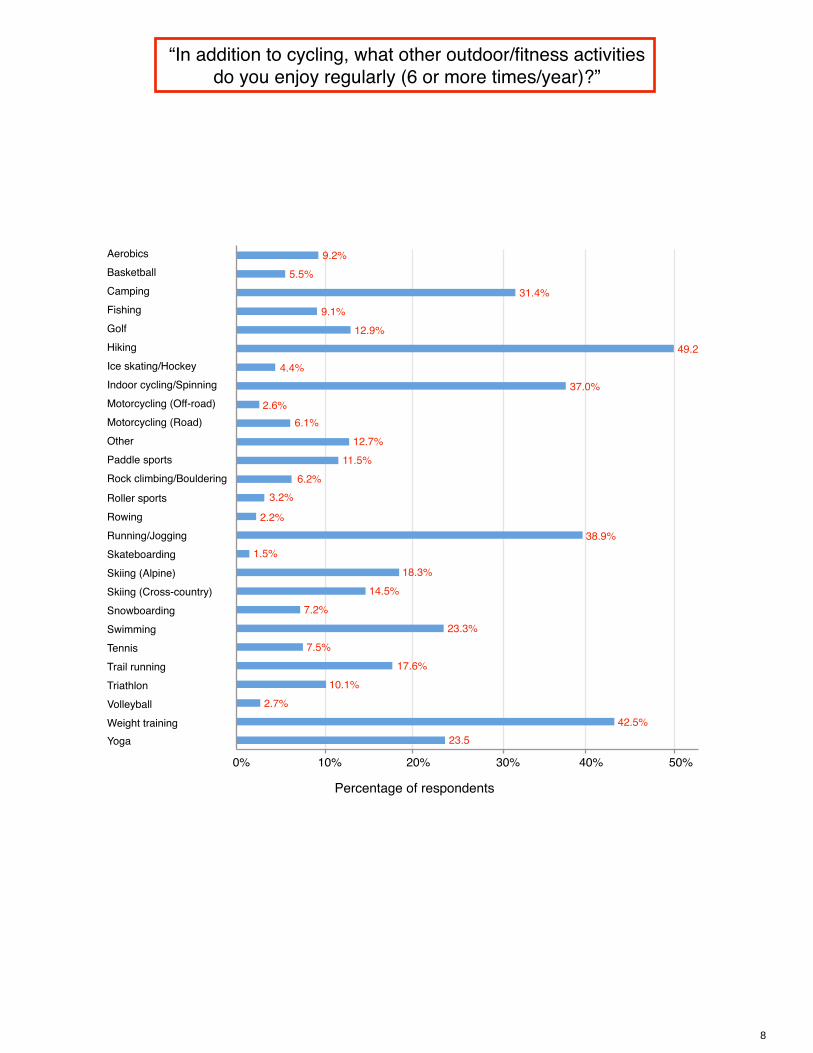
“In addition to cycling, what other outdoor/fitness activitiesdo you enjoy regularly (6 or more times/year)?”
AerobicsBasketballCamping
Golf Fishing
Motorcycling (Off-road)Indoor cycling/SpinningIce skating/HockeyHiking
Rock climbing/BoulderingPaddle sportsOtherMotorcycling (Road)
Roller sportsRowingRunning/Jogging
Skiing (Alpine)Skateboarding
TennisSwimmingSnowboardingSkiing (Cross-country)
Weight trainingVolleyballTriathlonTrail running
Yoga
Percentage of respondents
0% 10% 20% 30% 40% 50%
9.2%5.5%
31.4%
12.9%9.1%
2.6%37.0%
4.4%49.2
6.2%11.5%
12.7%6.1%
3.2%
2.2%38.9%
18.3%1.5%
7.5%23.3%
7.2%14.5%
42.5%2.7%
10.1%17.6%
23.5
8

“How happy are you with the bicycling facilities (roads, paths, and trails) where you live?”
Neutral 220
Somewhat happy 847 44.7%
11.6%
Somewhat unhappy 232 12.2%
Very unhappy 102 5.4%
Very happy 495 26.1%
# %respondents
Men
Women
Percentage of respondents
0% 20% 40%
Very happy
Somewhat happy
Neutral
Somewhat unhappy
Very unhappy
23.7%32.8%
44.7%44.5%
13.1%7.5%
12.9%10.3%
5.5%4.9%
Women tended tobe more satisfied with facilities.
“How often do you ride for utility/transportation/commuting purposes?”
Almost every day
A couple times a week
Weekly
Monthly
Occasionally
Daily
196
300
153
97
592
112
10.3%
15.8%
8.1%
5.1%
31.2%
5.9%
# %respondents
Never 446 23.5%
Men
Women
Percentage of respondents
0% 10% 30%20% 40%
Never
Occasionally
Monthly
A couple times a week
Almost every day
Weekly
Daily
24.2%21.7%
30.4%33.4%
5.2%4.9%
8.3%7.3%
15.0%18.2%
10.5%9.9%
6.4%4.5%
9
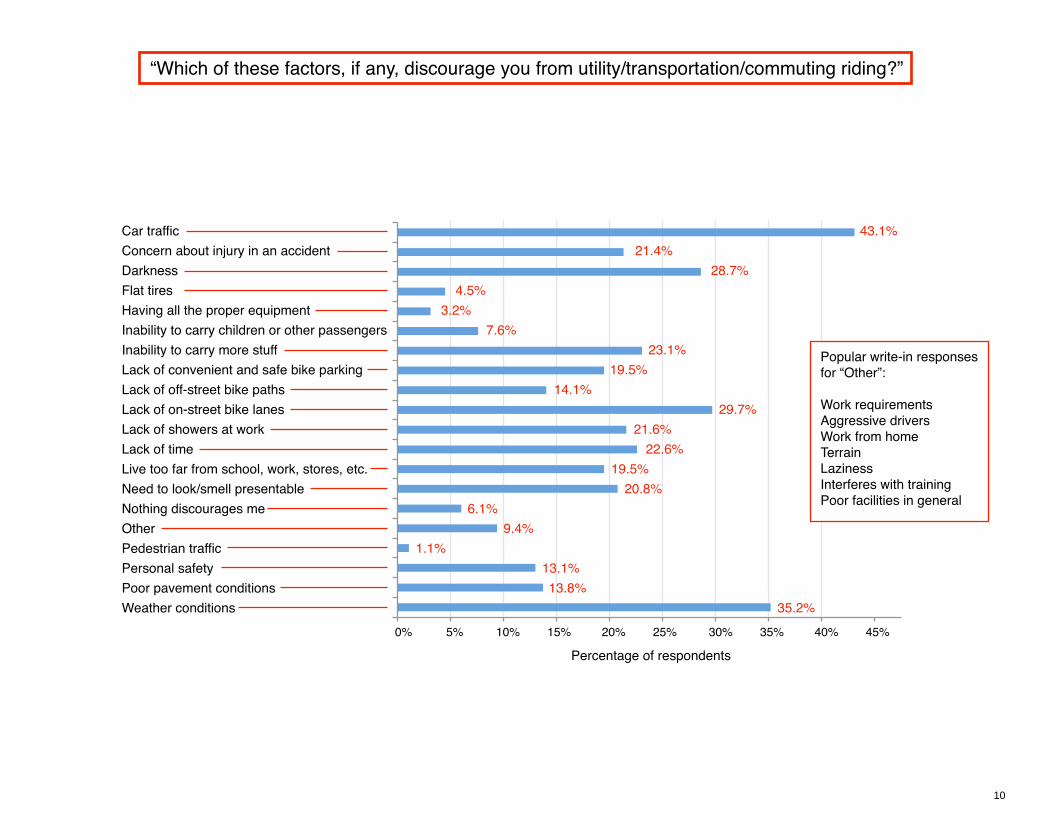
“Which of these factors, if any, discourage you from utility/transportation/commuting riding?”
Percentage of respondents
0% 10% 20% 30% 40%5% 15% 25% 35% 45%
Car trafficConcern about injury in an accidentDarkness
Having all the proper equipmentFlat tires
Lack of off-street bike pathsLack of convenient and safe bike parkingInability to carry more stuffInability to carry children or other passengers
Live too far from school, work, stores, etc.Lack of timeLack of showers at workLack of on-street bike lanes
Need to look/smell presentableNothing discourages meOther
Personal safetyPedestrian traffic
Weather conditionsPoor pavement conditions
43.1%21.4%
28.7%
3.2%4.5%
14.1%19.5%
23.1%7.6%
19.5%22.6%
21.6%29.7%
20.8%6.1%
9.4%
13.1%1.1%
35.2%13.8%
Popular write-in responses for “Other”:
Work requirementsAggressive driversWork from homeTerrainLazinessInterferes with trainingPoor facilities in general
10

“Which of these factors, if any, discourage you from utility/transportation/commuting riding?”
Men
Women
Percentage of respondents
42.1%
0% 10% 20% 30% 40% 50%
Car traffic
Concern about injury in an accident
Darkness
Having all the proper equipment
Flat tires
Lack of off-street bike paths
Lack of convenient and safe bike parking
Inability to carry more stuff
Inability to carry children or other passengers
Live too far from school, work, stores, etc.
Lack of time
Lack of showers at work
Lack of on-street bike lanes
Need to look/smell presentable
Nothing discourages me
Personal safety
Pedestrian traffic
Weather conditions
Poor pavement conditions
7.1%4.2%
33.5%43.5%
13.2%17.0%
12.7%15.8%
1.0%15.8%
20.9%23.1%
20.0%18.4%
21.2%29.4%
23.0%20.6%
30.9%30.2%
14.5%14.6%
20.4%18.8%
20.4%31.6%
7.4%18.8%
2.6%5.1%
3.6%7.7%
5.8%36.4%
20.9%25.3%
44.0%46.2%
No factors discouraged men significantly more than women.
Men were more likely to say that nothing discouraged them from utility/transportation/commuting riding.
11
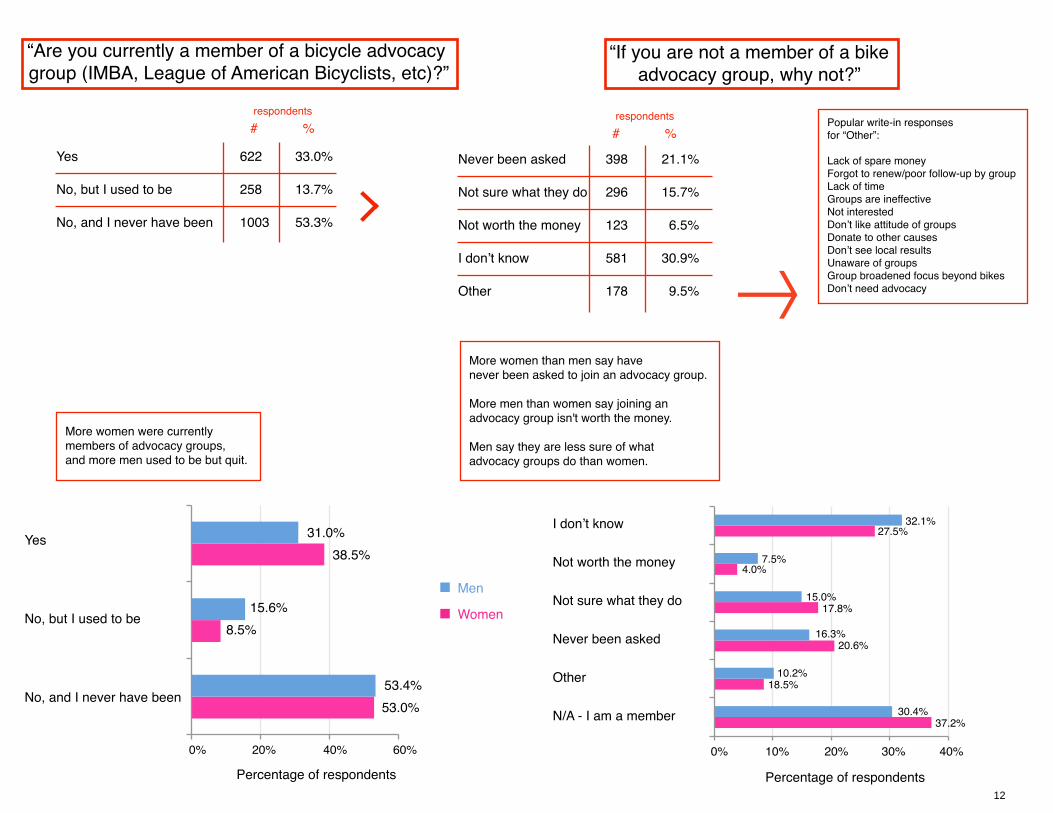
“Are you currently a member of a bicycle advocacy group (IMBA, League of American Bicyclists, etc)?”
Yes
No, but I used to be
No, and I never have been
622
258
1003
33.0%
13.7%
53.3%
# %respondents
Never been asked
Not sure what they do
Not worth the money
I don’t know
Other
398
296
123
581
178
21.1%
15.7%
6.5%
30.9%
9.5%
# %respondents Popular write-in responses
for “Other”:
Lack of spare money Forgot to renew/poor follow-up by groupLack of timeGroups are ineffectiveNot interestedDon’t like attitude of groupsDonate to other causesDon’t see local resultsUnaware of groupsGroup broadened focus beyond bikesDon’t need advocacy
“If you are not a member of a bikeadvocacy group, why not?”
More women were currentlymembers of advocacy groups, and more men used to be but quit.
0% 20% 40% 60%
Percentage of respondents
No, and I never have been
No, but I used to be
Yes 31.0%38.5%
15.6%8.5%
53.4%53.0%
Men
Women
Percentage of respondents
0% 20% 40%30%10%
N/A - I am a member
Other
Never been asked
Not sure what they do
Not worth the money
I don’t know 32.1%27.5%
7.5%4.0%
15.0%17.8%
16.3%20.6%
10.2%18.5%
30.4%37.2%
More women than men say have never been asked to join an advocacy group.
More men than women say joining an advocacy group isn't worth the money.
Men say they are less sure of what advocacy groups do than women.
12

“What kind of online presences do you have?”
“What is your age?”
A Facebook account 1314 70.1%
A LinkedIn account 678 36.2%
A MySpace account 185 9.9%
Personal blog or website 418 22.3%
None of the above 397 21.2%
A Twitter account 539 28.8%
# %respondents
Men
Women
Percentage of respondents
0% 40% 80%60%20% 100%
None of the above
Personal blog/website
A MySpace account
A LinkedIn account
A Facebook account
A Twitter account
24.5%11.3%
20.0%27.9%
9.3%11.1%
33.5%42.7%
64.3%84.6%
23.7%33.6%
Women had more of anonline presence than men.
Percentage of respondents
>8075-7970-74
60-6465-69
40-4445-4950-54
55-59
18-2425-2930-3435-39
<18
0.1%
0.1%
0.6%
6.3%
2.1%
15.0%
14.7%
16.3%
10.4%
2.9%
6.2%
10.2%
14.7%
0.2%
0% 4% 6% 8% 16%10%2% 12% 14%
Men
Women
Percentage of respondents
>8075-7970-74
60-6465-69
40-4445-4950-54
55-59
18-2425-2930-3435-39
<18
0% 5% 15%10%
Women tended to be younger than men.
respondent gender:73% male27% female
13
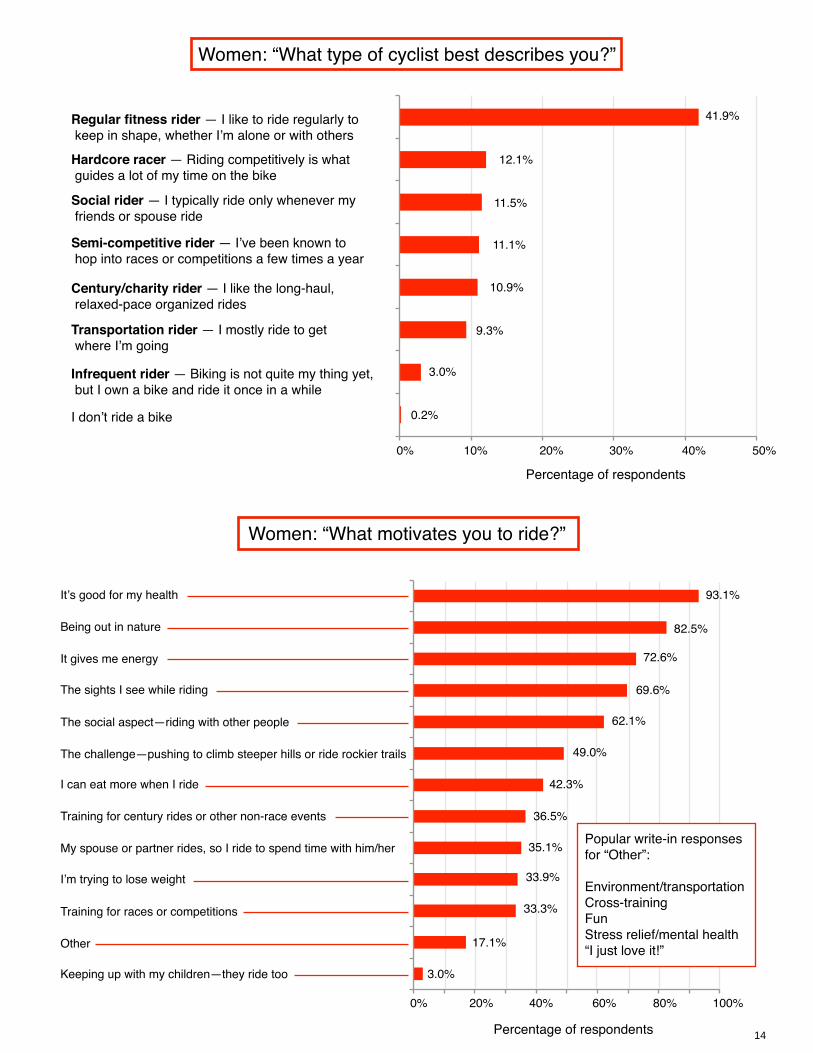
Women: “What type of cyclist best describes you?”
Women: “What motivates you to ride?”
Regular fitness rider — I like to ride regularly to keep in shape, whether I’m alone or with others
Semi-competitive rider — I’ve been known to hop into races or competitions a few times a year
Century/charity rider — I like the long-haul, relaxed-pace organized rides
Infrequent rider — Biking is not quite my thing yet, but I own a bike and ride it once in a while
Transportation rider — I mostly ride to get where I’m going
I don’t ride a bike
Social rider — I typically ride only whenever my friends or spouse ride
Hardcore racer — Riding competitively is what guides a lot of my time on the bike
0.2%
3.0%
9.3%
10.9%
11.1%
11.5%
12.1%
41.9%
0% 10% 20% 30% 40% 50%
Percentage of respondents
Percentage of respondents
0% 20% 40% 60% 80% 100%
It’s good for my health
Being out in nature
It gives me energy
The sights I see while riding
The social aspect—riding with other people
The challenge—pushing to climb steeper hills or ride rockier trails
I can eat more when I ride
Training for century rides or other non-race events
My spouse or partner rides, so I ride to spend time with him/her
I’m trying to lose weight
Training for races or competitions
Other
Keeping up with my children—they ride too
93.1%
82.5%
72.6%
69.6%
62.1%
49.0%
42.3%
36.5%
35.1%
33.9%
33.3%
17.1%
3.0%
Popular write-in responses for “Other”:
Environment/transportation Cross-trainingFunStress relief/mental health“I just love it!”
14

Women: “Who do you ride with most often?”
Women: “Do you participate in women-only bike clinics, rides, or events?”
Percentage of respondents
I usually ride alone
My spouse or partner
Friends of both genders
Female friend(s)
My kids
Coach or trainer
Male friend(s)
Other
A cycling club or group
My race teammates
0% 10% 20% 30% 40%
29.8%
22.2%
14.7%
13.7%
11.1%
2.8%
2.6%
1.8%
1.0%
0.4%
Popular write-in responses for “Other”:
DogCoworkers
No, because I haven't had the opportunity
Yes
No, because I'm not interested
39.3%
39.3%
21.2%
15

Women: “In which categories, if any, do you own a women's-specific bike product? In which categories, if any, do you have trouble finding a product that works well for you?”
Percentage of respondents
Clothing
Saddles
Shoes
Gloves
None
Bikes
Helmets
0% 20% 40% 60% 80%
25.2%86.3%
13.7%60.1%
16.7%56.3%
8.5%52.8%
15.7%46.6%
8.1%25.0%
39.1%7.1%
100%
Own this type of product
Have trouble finding product that works well
27.4%
72.6%
No
Yes
Women: “Do you ever help other women decide what bikes or bike gear to buy?”
16

Women: “How much do you enjoy shopping for bikes and gear?”
Percentage of respondents
Bike shop
Online bike shop
Outdoor store (REI, EMS)
Online women’s clothing store (Athleta, Title Nine)
eBay
Sporting goods store (Dick’s)
Other
Craigslist
Mass merchant (Target, Walmart)
0% 20% 40% 60% 80% 100%
84.7%
52.6%
42.5%
23.6%
17.1%
10.7%
9.1%
3.6%
3.4%
It’s okay
Enjoy it
Dislike it
Don’t shop for myself
37.9%54.8%
6.0%1.4%
Women: “Where do you shop for cycling apparel and accessories?”
Women: Enjoyment shopping for bikinggear by most frequented type of store
2.0 2.4 2.6 2.82.2 3.0
Average rating for enjoyment of shopping(1 = Dislike, 2 = Neutral, 3 = Enjoy)
eBay
Craigslist
Online bike shop
Bike shop
Sporting goods store
Other
Outdoor store
Mass merchant
Online women’s clothing store
2.90
2.73
2.56
2.53
2.49
2.49
2.54
2.46
2.38
17
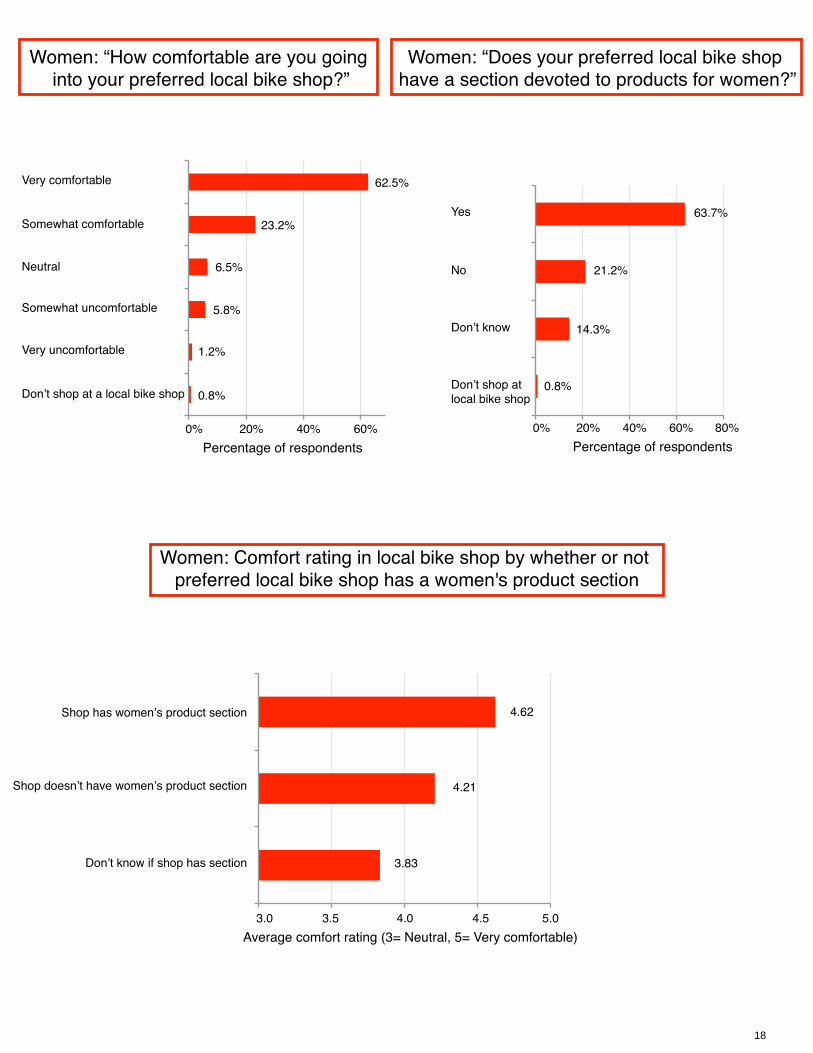
Women: Comfort rating in local bike shop by whether or not preferred local bike shop has a women's product section
Women: “How comfortable are you going into your preferred local bike shop?”
0% 40% 60%20%
Very comfortable
Somewhat comfortable
Neutral
Very uncomfortable
Don’t shop at a local bike shop
Somewhat uncomfortable
62.5%
23.2%
6.5%
5.8%
1.2%
0.8%
Percentage of respondents
Women: “Does your preferred local bike shop have a section devoted to products for women?”
Yes
No
Don’t know
Don’t shop at local bike shop
0% 40% 60% 80%20%Percentage of respondents
63.7%
21.2%
14.3%
0.8%
Shop has women’s product section
Shop doesn’t have women’s product section
Don’t know if shop has section
3.0 4.0 4.5 5.03.5Average comfort rating (3= Neutral, 5= Very comfortable)
4.62
4.21
3.83
18
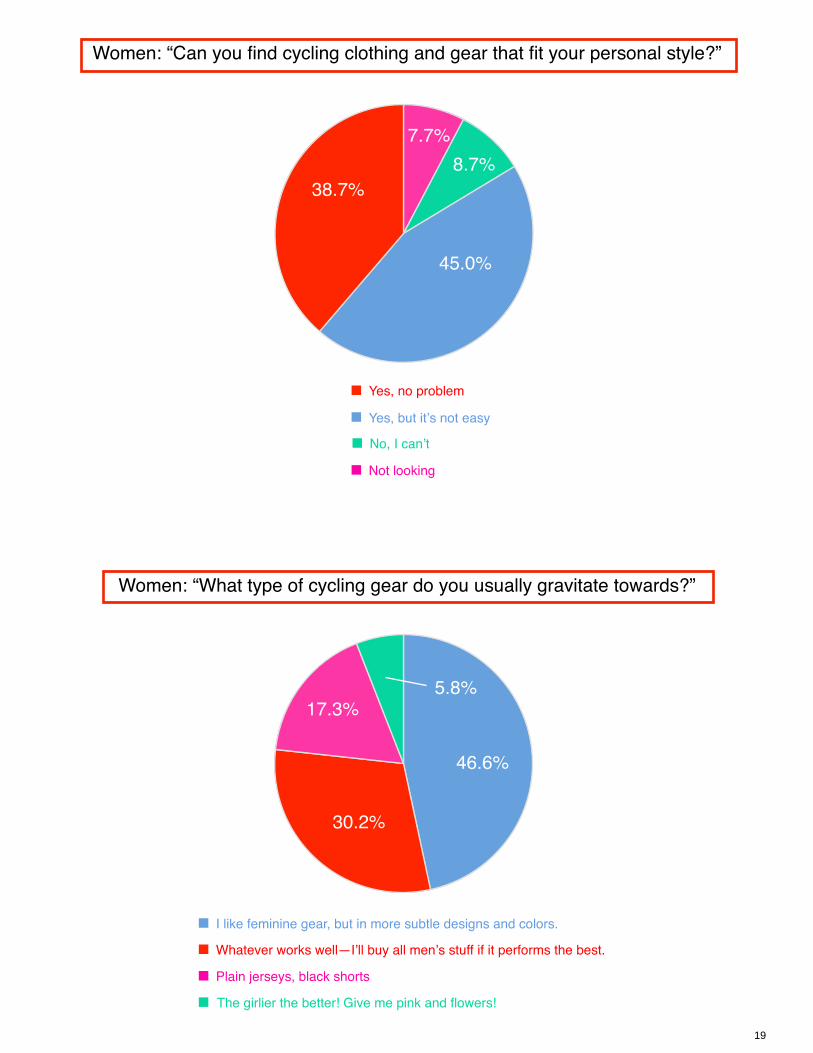
Women: “What type of cycling gear do you usually gravitate towards?”
Women: “Can you find cycling clothing and gear that fit your personal style?”
Yes, but it’s not easy
Yes, no problem
Not looking
No, I can’t
45.0%
38.7%
7.7%8.7%
I like feminine gear, but in more subtle designs and colors.
Whatever works well—I’ll buy all men’s stuff if it performs the best.
Plain jerseys, black shorts
The girlier the better! Give me pink and flowers!
46.6%
30.2%
17.3%5.8%
19
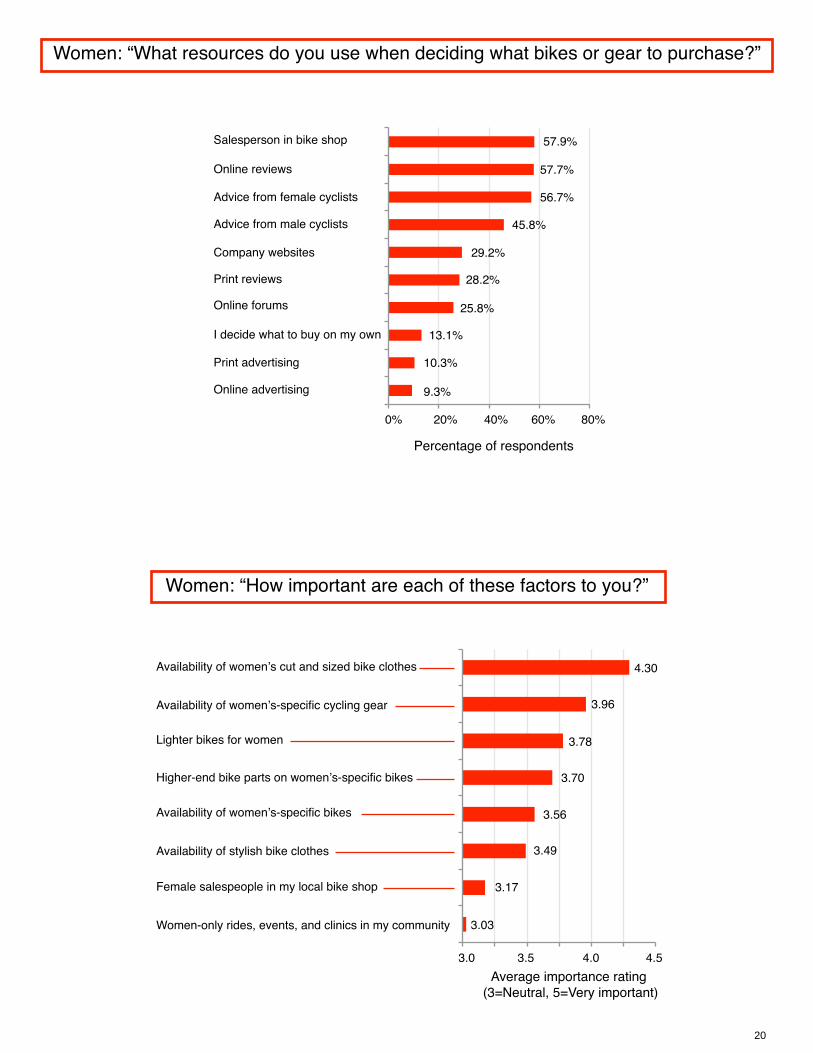
Women: “How important are each of these factors to you?”
Women: “What resources do you use when deciding what bikes or gear to purchase?”
Percentage of respondents
0% 20% 40% 60% 80%
Salesperson in bike shop
Online reviews
Advice from female cyclists
Advice from male cyclists
Company websites
Print reviews
Online forums
I decide what to buy on my own
Print advertising
Online advertising
57.9%
57.7%
56.7%
45.8%
29.2%
28.2%
25.8%
13.1%
10.3%
9.3%
Average importance rating (3=Neutral, 5=Very important)
Availability of women’s cut and sized bike clothes
Availability of women’s-specific cycling gear
Lighter bikes for women
Higher-end bike parts on women’s-specific bikes
Availability of women’s-specific bikes
Availability of stylish bike clothes
Female salespeople in my local bike shop
Women-only rides, events, and clinics in my community
4.30
3.0 3.5 4.0 4.5
3.96
3.78
3.70
3.56
3.49
3.17
3.03
20