Bicycle and Pedestrian Master Plan - Crash Data Report i ...
66
Transcript of Bicycle and Pedestrian Master Plan - Crash Data Report i ...


i | Page Bicycle and Pedestrian Master Plan - Crash Data Report
TABLE OF CONTENTS
Section Page
1.0 Introduction ..................................................................................................................................... 1 2.0 2007-2011 Countywide Crash Data ................................................................................................. 1
Bicycle Crashes ................................................................................................................................. 1 Pedestrian Crashes ........................................................................................................................... 5 Bicycle and Pedestrian Parking Lot/Private Property Crashes ......................................................... 8
3.0 High Crash Corridor Analysis .......................................................................................................... 10
General Crash Type Descriptions ................................................................................................... 13 General Countermeasures ............................................................................................................. 16 High Crash Corridors ...................................................................................................................... 22
4th Street: 9th Avenue South to 46th Avenue North ................................................................ 22 Park Boulevard: Park Street to US 19 ...................................................................................... 27 West Bay Drive/State Road 686: Indian Rocks Road to 58th Street ........................................ 31 Fort Harrison Avenue: Belleair Road to Drew Street .............................................................. 35 Seminole Boulevard: Bay Pines Boulevard to Ulmerton Road ................................................ 39 Tampa Road: Orange Street to Race Track Road .................................................................... 43 Gulf to Bay Boulevard Intersections (Belcher Road, Old Coachman Road S, US 19, and Park
Place Boulevard) .................................................................................................................. 47 34th Street (US 19) Intersections (70th Avenue, 62nd Avenue, 22nd Avenue, 5th Avenue) ......... 49 Summary Recommendations .................................................................................................. 52 St. Petersburg Road Safety Audits (4th Street, 34th Street) ...................................................... 54
Pinellas County Pedestrian Safety Action Plan .............................................................................. 56 4.0 Motorized Vehicle Policy Analysis ................................................................................................. 57
Federal Regulations ....................................................................................................................... 57 Florida Regulations ........................................................................................................................ 58 Motorized Bicycle and EPAMD Statutes in Other States ............................................................... 60 Summary Recommendations ......................................................................................................... 62
5.0 Electric Vehicle Safety .................................................................................................................... 63
LIST OF TABLES
Table Page
2-1 Parking Lot/Private Property Crashes by Type (2007-2010) ............................................................ 8
3-1 Bicycle and Pedestrian Involved Crashes along 4th Street ............................................................. 25
3-2 Summary of 4th Street Counter Measures ..................................................................................... 26
3-3 Bicycle and Pedestrian Involved Crashes along Park Boulevard .................................................... 29
3-4 Summary of Park Boulevard Counter Measures ............................................................................ 30
3-5 Bicycle and Pedestrian Involved Crashes along West Bay Drive/State Road 686 ......................... 33
3-6 Summary of West Bay Drive/SR 686 Counter Measures ............................................................... 34
LIST OF TABLES (Continued)
Table Page
ii | Page Bicycle and Pedestrian Master Plan - Crash Data Report
3-7 Bicycle and Pedestrian Involved Crashes along Fort Harrison Avenue .......................................... 37
3-8 Summary of Fort Harrison Avenue Counter Measures ................................................................. 38
3-9 Bicycle and Pedestrian Involved Crashes along Seminole Boulevard ............................................ 41
3-10 Summary of Seminole Boulevard Counter Measures .................................................................... 42
3-11 Bicycle and Pedestrian Involved Crashes along Tampa Road ........................................................ 45
3-12 Summary of Tampa Road Counter Measures ................................................................................ 46
3-13 Summary of Gulf to Bay Intersection Counter Measures .............................................................. 48
3-14 Summary of 34th Street Intersection Counter Measures ............................................................... 51
3-15 General Summary of Counter Measures ....................................................................................... 54
4-1 Vehicle Types and Permissions ...................................................................................................... 56
LIST OF FIGURES
Figure Page
2-1 Total Number of Crashes Involving a Bicycle (2007-2010) .............................................................. 2
2-2 Total Fatal and Incapacitating Crashes Involving a Bicycle (2007-2010) ......................................... 3
2-3 Age Distribution of Bicycle Involved Crashes (2007-2011) .............................................................. 4
2-4 Lighting Conditions of Bicycle Involved Crashes (2007-2011) ......................................................... 4
2-5 Total Number of Pedestrian Involved Crashes by Year (2007-2010) ............................................... 5
2-6 Pedestrian Involved Crashes Resulting in a Fatality or Serious Injury (2007-2010) ........................ 6
2-7 Age Distribution of Pedestrian Involved Crashes (2007-2011) ........................................................ 7
2-8 Lighting Condition of Pedestrian Involved Crashes (2007-2011) ..................................................... 7
2-9 Age Distribution of Bicycle or Pedestrian Involved Parking Lot/Private Property Crashes
(2007-2011) ...................................................................................................................................... 8
3-1 Pinellas County Bicycle “Hot Spots” ............................................................................................... 11
3-2 Pinellas County Pedestrian “Hot Spots” ........................................................................................ 12
3-3 4th Street: 9th Avenue South to 46th Avenue North Bicycle Crashes .............................................. 24
3-4 4th Street: 9th Avenue South to 46th Avenue North Pedestrian Crashes ........................................ 24
3-5 Park Boulevard: Park Street to US 19 Bicycle Crashes ................................................................... 28
3-6 Park Boulevard: Park Street to US 19 Pedestrian Crashes ............................................................. 29
3-7 West Bay Drive/State Road 686: Indian Rocks Road to 58th Street Bicycle Crashes ..................... 32
3-8 West Bay Drive/State Road 686: Indian Rocks Road to 58th Street Pedestrian Crashes ............... 33
3-9 Fort Harrison Avenue: Belleair Road to Drew Street Bicycle Crashes ........................................... 36
3-10 Fort Harrison Avenue: Belleair Road to Drew Street Pedestrian Crashes ..................................... 36
3-11 Seminole Boulevard: Bay Pines Boulevard to Ulmerton Road Bicycle Crashes ............................. 40
3-12 Seminole Boulevard: Bay Pines Boulevard to Ulmerton Road Pedestrian Crashes ....................... 40
3-13 Tampa Road: Orange Street to Race Track Road Bicycle Crashes ................................................. 45

1 | Page Bicycle and Pedestrian Master Plan - Crash Data Report
1.0 Introduction The Pinellas County Metropolitan Planning Organization (MPO) contracted with URS Corporation (URS) to conduct an analysis of the bicycle and pedestrian crashes within the county. The purpose of this analysis is to identify issues and trends affecting bicycle and pedestrian safety in Pinellas County as well as countermeasures aimed at reducing crash incidents. This report is a component of the MPO Bicycle and Pedestrian Master Plan update, which is scheduled for completion in 2013. The Master Plan is intended to meet the goals and objectives of the MPO Long Range Transportation Plan relative to bicycle and pedestrian travel. This report includes an examination of crash data from a countywide perspective as well as on corridors with a high incidence of bicycle and pedestrian crashes. Also included is a discussion of crash types and recommended countermeasures, an overview of laws and regulations affecting the use of motorized vehicles (e.g., electric bicycles, electric personal assistance vehicles) in public rights-of-way and a summary of issues related to electric/hybrid automobiles as they affect bicycle and pedestrian travel.
2.0 2007-2011 Countywide Crash Data The crash data analyzed for this section of the report covers the years 2007 to 2011 and was generated from the MPO Crash Database Management System (CDMS). The source of the CDMS data is the Florida Department of Highway Safety and Motor Vehicles (FDHSMV). It should be noted that the 2011 State crash data that was provided for the report is not complete. Consequently, the 2011 data is not presented in the report where annual comparisons of crash totals are shown. A bicycle and pedestrian crash record database is also maintained by the Florida Department of Transportation (FDOT). Statewide crash data referenced in this section is based on the FDHSMV 2010 Traffic Crash Statistics Report. The MPO CDMS data includes parking lot/private property crashes. The FDHSMV data does not include this. In addition, the CDMS bicycle and pedestrian crash data includes incapacitating injuries with fatalities. The FDHSMV does not include incapacitating injuries among its fatality counts. These reporting differences result in higher crash numbers in the CDMS data when compared to the FDHSMV reports. Therefore, where statewide and countywide crash incidents and rates are compared it is based entirely on the FDHSMV report. Countywide bicycle and pedestrian crash data are presented in this section for the categories listed below.
Total number of crashes
Total fatal and incapacitating crashes
Crashes with Intoxication noted
Age distribution of crashes
Lighting conditions of crashes
Bicycle Crashes Figure 2-1 represents the total number of Pinellas County crashes reported to involve a bicyclist between 2007 and 2010. The number of crash incidents remained relatively constant for this period with the exception of 2008 when the crash number spiked to 17 percent above the 2007 total. Bicycle crashes reported statewide have risen from 4,227 in 2007 to 4,600 in 2010, a nearly nine percent

2 | Page Bicycle and Pedestrian Master Plan - Crash Data Report
increase. However, it is important to note that the State’s population did increase albeit slightly during this time period, by 0.6 percent whereas Pinellas County lost 895 residents from 2007 to 2010. In terms of crash rate per 100,000 people, Pinellas County is nearly 70 percent higher than the State with 40 versus 24.5 for the State.
Figure 2-1: Total Number of Crashes Involving a Bicycle
As shown in Figure 2-2, bicycle crashes involving fatalities and incapacitating injuries mirror the trend in
total crashes shown in Figure 2-1 in that the numbers did not vary significantly from year to year
notwithstanding 2008. Statewide, bicycle crashes involving fatalities have decreased annually since
2007. There were 124 bicycle fatalities statewide in 2007 and 76 in 2010, a decrease of approximately
63 percent over the four years. The statewide rate for bicycle crashes with fatalities in 2010 was 0.4 per
100,000 compared to 0.22 for Pinellas County, which was based on two fatal crashes reported by
FDHSMV that year. In their 2010 Traffic Safety Facts Report, the FDHSMV suggested growing driver
awareness of bicyclists, education programs urging motorists to share the road and the increase in
bicycle lanes as reasons for the drop in fatalities across the State. However, Florida still had the highest
rate of bicycle fatalities in the nation in 2010 with 0.4 deaths per 100,000 people and the second highest
number of fatalities behind California.

3 | Page Bicycle and Pedestrian Master Plan - Crash Data Report
Figure 2-2: Total Fatal and Incapacitating Crashes Involving a Bicycle
From 2007 to 2011 there were 59 bicycle crashes where intoxication was noted as a factor, three percent of the total number of crashes. Alcohol or drugs were involved in approximately 16 percent of bicycle crashes involving incapacitating injuries or fatalities. Approximately six percent of all reported bicycle crashes in Florida that occurred in 2010 involved alcohol or drugs. When considering crashes involving fatalities where incapacitating injuries are excluded, the presence of alcohol/drug use as a factor increases substantially. Statewide, bicycle crashes resulting in fatalities involved intoxication in 31 percent of the cases. The National Highway Traffic Safety Administration (NHTSA) reported in their annual Traffic Safety Facts publication that alcohol/drugs were involved in 34 percent of the traffic crashes that occurred in the U.S. in 2010. It is also important to note that instances where intoxication is a factor in crashes is often under reported due to law enforcement officers not coding the incident in the alcohol/drug section of the FDHSMV crash report, no evidence that the person(s) involved in the crash are intoxicated at the time the report is completed, or the person(s) who receives medical attention as a result of the accident is not tested. Figure 2-3 shows that the highest percentage of people who were “at fault” in bicycle crashes from 2007 to 2011 were in the 40 to 54 age group, the largest segment of the population in the County. This is consistent with the statewide data which shows people within the 45 to 54 age group being involved in 19 percent of the bicycle crashes, the highest percentage reported. The FDHSMV data also indicates that 12 percent of the bicycle crashes in the State involving this age group in 2010 involved alcohol or drug consumption, the highest percentage among all the age groups reported. This age group also appears in the 2010 national data reported by NHTSA as having the highest fatality rate, 3.24 per million. It should be noted that the total number of crashes reflected in Figure 2-3 involved an “at fault” participant. Since not all crash reports involving a bicyclist or pedestrian identify an “at fault” participant, the total crashes reflected in the table are less than the total number of bicycle crashes reported from 2007 to 2011. For accidents involving non-fatal injuries, NHTSA reported the 21-24 group as having the highest rate of crashes with 377 per million followed by the 10-15 and 16-20 groups, which experienced 321 and 292

4 | Page Bicycle and Pedestrian Master Plan - Crash Data Report
crashes per million, respectively. This also parallels the trend in Pinellas County whereby the 15-24 age group is disproportionately represented in the crash data shown in Figure 2-3. Although they make up only 11 percent of the County’s population, the 15-24s are involved in 19 percent of the crashes. Another trend revealed in the NHTSA data is the disproportionately higher number of bicycle crashes involving males as compared to females even though the latter represents a lower percentage of the population. The NHTSA data shows the number of males involved in fatal bicycle crashes is more than 6.5 times higher than females and three times higher in the number of non-fatal bicycle crashes.
Figure 2-3: Age Distribution of Bicycle Involved Crashes (2007 - 2011)
Figure 2-4 reports the number of bicycle crashes by lighting condition. Although the number of crashes that occurred at night are just 25 percent of the total, that there are 518 crashes occurring in non-daylight hours is significant and warrants attention. The issue of lighting conditions as they affect bicycle and pedestrian safety are addressed later in this report. It should be noted that the total number of crashes reflected in Figure 2-4 is less than the total number of bicycle crashes reported from 2007 to 2011 since the lighting condition is not indicated on all of the crash reports.
Figure 2-4: Lighting Conditions of Bicycle Involved Crashes (2007 - 2011)
5 | Page Bicycle and Pedestrian Master Plan - Crash Data Report
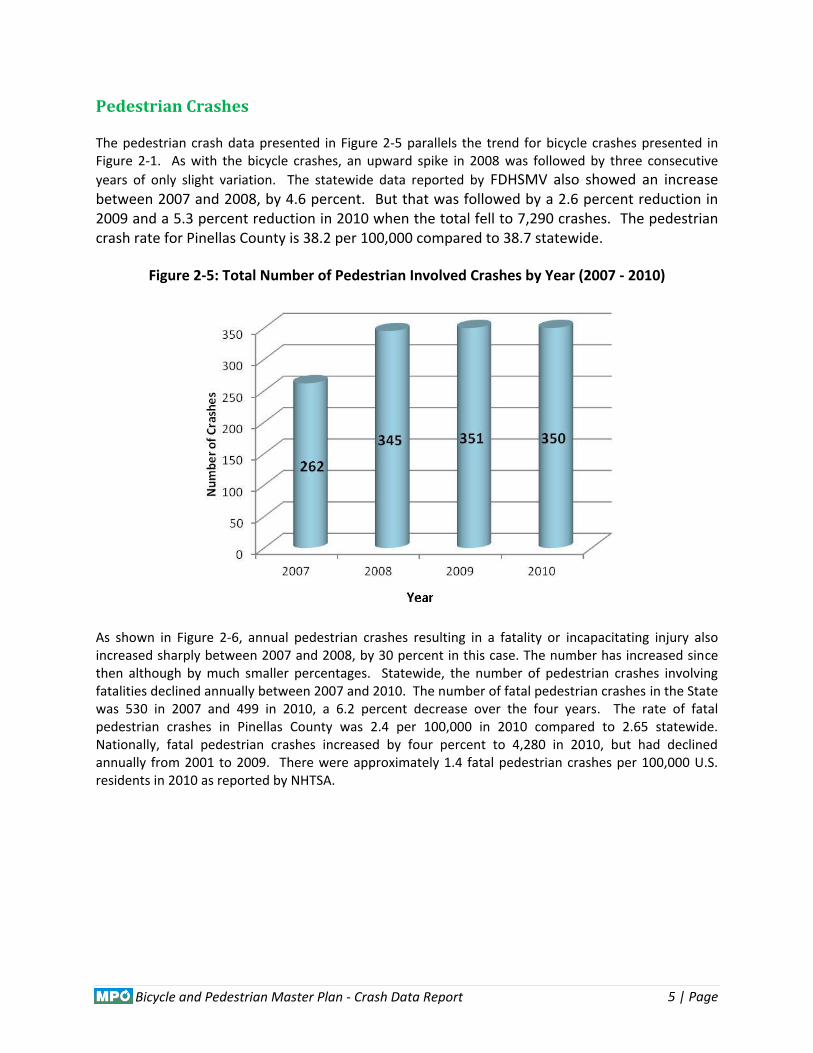
Pedestrian Crashes The pedestrian crash data presented in Figure 2-5 parallels the trend for bicycle crashes presented in Figure 2-1. As with the bicycle crashes, an upward spike in 2008 was followed by three consecutive
years of only slight variation. The statewide data reported by FDHSMV also showed an increase between 2007 and 2008, by 4.6 percent. But that was followed by a 2.6 percent reduction in 2009 and a 5.3 percent reduction in 2010 when the total fell to 7,290 crashes. The pedestrian crash rate for Pinellas County is 38.2 per 100,000 compared to 38.7 statewide.
Figure 2-5: Total Number of Pedestrian Involved Crashes by Year (2007 - 2010)
As shown in Figure 2-6, annual pedestrian crashes resulting in a fatality or incapacitating injury also increased sharply between 2007 and 2008, by 30 percent in this case. The number has increased since then although by much smaller percentages. Statewide, the number of pedestrian crashes involving fatalities declined annually between 2007 and 2010. The number of fatal pedestrian crashes in the State was 530 in 2007 and 499 in 2010, a 6.2 percent decrease over the four years. The rate of fatal pedestrian crashes in Pinellas County was 2.4 per 100,000 in 2010 compared to 2.65 statewide. Nationally, fatal pedestrian crashes increased by four percent to 4,280 in 2010, but had declined annually from 2001 to 2009. There were approximately 1.4 fatal pedestrian crashes per 100,000 U.S. residents in 2010 as reported by NHTSA.

6 | Page Bicycle and Pedestrian Master Plan - Crash Data Report
Figure 2-6: Pedestrian Involved Crashes Resulting in a Fatality or Serious Injury (2007 - 2010)
There were 167 pedestrian crashes in Pinellas County from 2007 to 2011 where intoxication was a factor. This amounted to 10.6 percent of the total pedestrian crashes that occurred during this time. This rate is comparable with the FDHSMV data, which shows that 9.4 percent of the pedestrian crashes occurring statewide in 2010 involved intoxication. The presence of alcohol or drug use in pedestrian crashes increases substantially when there are fatalities involved. There were 88 fatal and incapacitating pedestrian crashes in Pinellas County from 2007 to 2011 involving alcohol or drug use. That amounts to nearly 20 percent of the crash total. The rate climbs even higher when considering State and U.S. crash data involving fatalities only. Intoxication was a factor in 32.3 percent of the fatal pedestrian crashes reported statewide and 47 percent of the crashes reported nationwide by NHTSA in 2010. The trend shown in Figure 2-7 regarding the age distribution of pedestrian crashes parallel the bicycle crash data presented in Figure 2-3. State and national age group data for pedestrian crashes is also similar to the bicycle crash data reported by FDHSMV and NHTSA. The majority of people involved in pedestrian crashes are in the 40-54 age group, which is reflective of this group being the largest segment of the County’s population. It should be noted that, as with the bicycle crash data, the total number of crashes reflected in Figure 2-7 involved an “at fault” participant. Since not all FDHSMV crash reports involving a bicyclist or pedestrian identify an “at fault” participant, the total crashes reflected in the table are less than the total number of pedestrian crashes reported from 2007 to 2011. In addition, the 15-24 age group is disproportionately represented in the total number of pedestrian crashes. They make up 19 percent of the County’s crash incidents while representing only 11 percent of the population. The 45-54s are involved in 15.6 percent of the pedestrian crashes statewide, the highest percentage among the age groups. They’re followed by the 35-44 age group at 13.3 percent. Nationally, NHTSA reports that the 45-54 age group experienced the highest rate of fatalities in 2010 with 1.77 per million followed by the 55-64 group with 1.76 per million. The age groups with the two highest crash rates involving injury in the U.S. are the 16-20s with 38 crashes per million and the 10-15s with 36 crashes per million.
7 | Page Bicycle and Pedestrian Master Plan - Crash Data Report
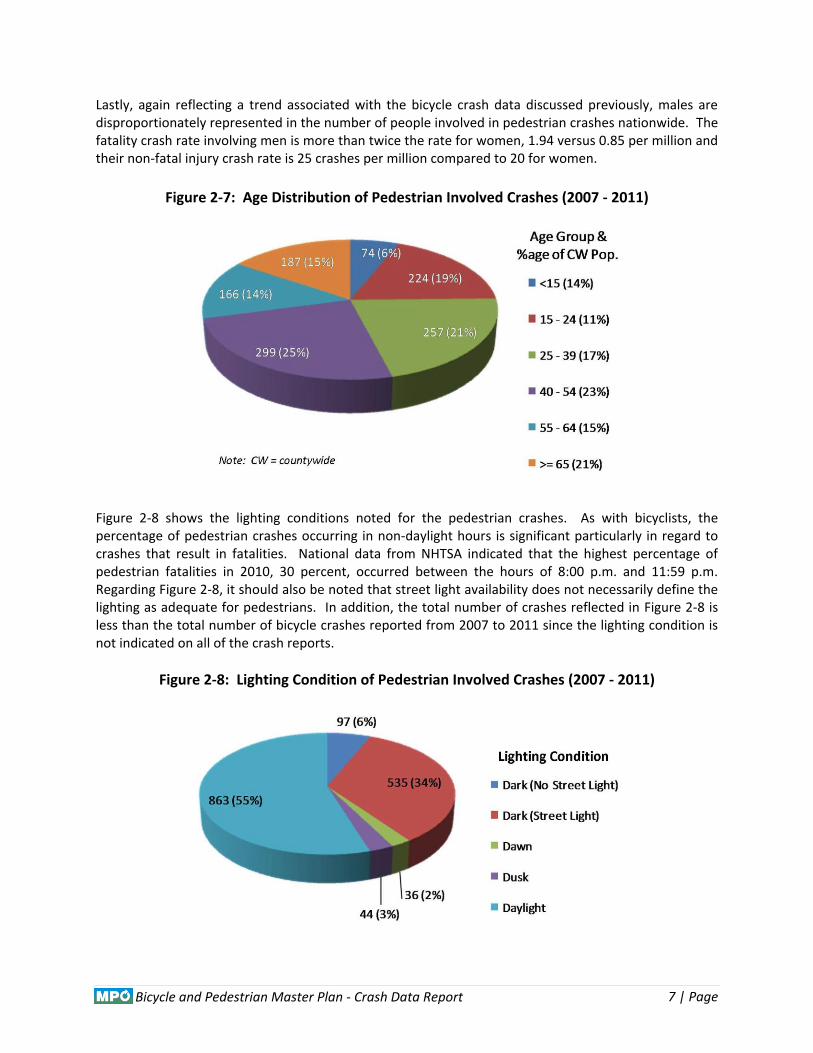
Lastly, again reflecting a trend associated with the bicycle crash data discussed previously, males are disproportionately represented in the number of people involved in pedestrian crashes nationwide. The fatality crash rate involving men is more than twice the rate for women, 1.94 versus 0.85 per million and their non-fatal injury crash rate is 25 crashes per million compared to 20 for women.
Figure 2-7: Age Distribution of Pedestrian Involved Crashes (2007 - 2011)
Figure 2-8 shows the lighting conditions noted for the pedestrian crashes. As with bicyclists, the percentage of pedestrian crashes occurring in non-daylight hours is significant particularly in regard to crashes that result in fatalities. National data from NHTSA indicated that the highest percentage of pedestrian fatalities in 2010, 30 percent, occurred between the hours of 8:00 p.m. and 11:59 p.m. Regarding Figure 2-8, it should also be noted that street light availability does not necessarily define the lighting as adequate for pedestrians. In addition, the total number of crashes reflected in Figure 2-8 is less than the total number of bicycle crashes reported from 2007 to 2011 since the lighting condition is not indicated on all of the crash reports.
Figure 2-8: Lighting Condition of Pedestrian Involved Crashes (2007 - 2011)

8 | Page Bicycle and Pedestrian Master Plan - Crash Data Report
Bicycle and Pedestrian Parking Lot/Private Property Crashes For crashes occurring along roadways, bicycles are involved in nearly 40 percent more accidents than pedestrians. However, the trend is reversed when considering crashes that occur in parking lots or on private property. As shown in Table 2-1, pedestrian crashes occurring from 2007 to 2010 outnumbered those involving bicycles by more than two to one. Among the total crashes in 2010, 7.6 percent involved fatalities. Less than five percent of the total crashes in 2007-2010 involved drugs or alcohol. But the presence of alcohol/drugs increased to 10.6 percent where these crashes resulted in fatal or incapacitating injury.
Table 2-1: Parking Lot/Private Property Crashes by Type (2007-2010)
Crash Type 2007 2008 2009 2010 Total
Bicycle 21 37 112 51 221
Pedestrian 91 143 123 107 464
Total 112 180 235 158 685
As demonstrated in Figure 2-9, individuals within the 40-54 and 25-39 age groups experience the highest number of bicycle and pedestrian crashes in parking lots and on private property. The 40-54s were also shown as the age group most affected by bicycle and pedestrian crashes occurring within public rights of way in previous sections of the report. The number of people within the 25-39 age group involved in these crashes is disproportionate to the percentage of the population they represent and higher than the number affected by crashes within public rights of way.
Figure 2-9: Age Distribution of Bicycle/Pedestrian Involved Parking Lot/Private Property Crashes (2007-2011)
9 | Page Bicycle and Pedestrian Master Plan - Crash Data Report
General Parking Lot/Private Property Safety Improvements An analysis of the specific parking lots or the parking lot/private property where the crashes noted in the previous tables and figures occurred was beyond the scope of this project. Therefore, no specific recommendations addressing issues associated with these crash locations is provided. In the absence of site specific recommendations, general best practices related to local government code requirements to enhance pedestrian and bicycle safety within parking lot/private properties are provided below.
1. Require uniform lighting across parking areas. 2. Require adequate sight lines or speed reduction measures where drive aisles are adjacent to
buildings. 3. Require that landscaping provide for adequate sight lines. 4. Require reduced widths and turning radii on driveways. Many driveways are very wide. By
reconstructing curb lines to make them consistent with FDOT driveway criteria, conflict areas can be localized and entry and exit speeds reduced.
5. Require striping and/or physical channelization to reduce occurrence of “drive where ever I feel like it” behaviors often associated with parking lot/private properties.
In addition to the above code recommendations, improving roadway conditions on adjacent streets could reduce pedestrian/bicycle cut through traffic, thus reducing crashes in parking lots/private properties.

10 | Page Bicycle and Pedestrian Master Plan - Crash Data Report
3.0 High Crash Corridor Analysis Figures 3-1 and 3-2 identify the bicycle and pedestrian “hot spots” in the County by depicting the number of crashes within ¼ mile grids adjacent to the major road network. The maps reflect the total number of bicycle and pedestrian crashes occurring in Pinellas County from 2007 to 2011. The data displayed on the maps shows the corridors listed below as having a disproportionately high concentration of crashes. Therefore, they were identified for further study and analysis.
4th Street: 9th Avenue S to 46th Avenue N
Park Boulevard: Park Street to US 19
West Bay Drive/State Road 686: Indian Rocks Road to 58th Street
Fort Harrison Avenue: Belleair Road to Drew Street
Seminole Boulevard: Bay Pines Boulevard to Ulmerton Road
Tampa Road: Orange Street to Race Track Road
Gulf to Bay Boulevard: highest crash intersections, including Belcher Road, Old Coachman Road, US 19 and Park Place Boulevard
US 19/34th Street (south of Park Boulevard): highest crash intersections, including 70th Avenue, 62nd Avenue, 22nd Avenue North and 5th Avenue North
Individual FDHSMV crash reports for these corridors were reviewed to identify trends. In addition, field reviews were conducted to analyze the crash sites, to better understand the circumstances of each crash and to help develop the recommended counter measures that included engineering, enforcement, education and/or evaluation strategies.

11 | Page Bicycle and Pedestrian Master Plan - Crash Data Report
Figure 3-1: Pinellas County Bicycle “Hot Spots”

12 | Page Bicycle and Pedestrian Master Plan - Crash Data Report
Figure 3-2: Pinellas County Pedestrian “Hot Spots”

13 | Page Bicycle and Pedestrian Master Plan - Crash Data Report
General Crash Type Descriptions As the crash reports were reviewed for the high crash corridors, the crash incidents were categorized to assist in the development of specific, appropriate countermeasures. The graphics shown below generally represent the circumstances involved in the crashes reported on the study corridors. The illustrations were developed for the Pedestrian and Bicycle Crash Analysis Tool (PBCAT), a software application designed to assist planners and engineers in addressing pedestrian and bicyclist crash issues. The PBCAT was developed by the The Federal Highway Administration (FHWA) in cooperation with NHTSA through the University of North Carolina Highway Safety Research Center (HSRC). 1. A motorist making a left turn in front of bicyclist riding in the opposite direction. This crash type
applies to all intersection types, with or without bike lanes.
2. A motorist making a right turn hits a bicyclist who is either in the adjacent bike lane or riding next to
the curb in the same direction. This is commonly called the right hook crash.
3. A motorist making a right turn from an intersecting street or a driveway hits a bicyclist who is
travelling in the opposite direction, typically on the sidewalk.
14 | Page Bicycle and Pedestrian Master Plan - Crash Data Report
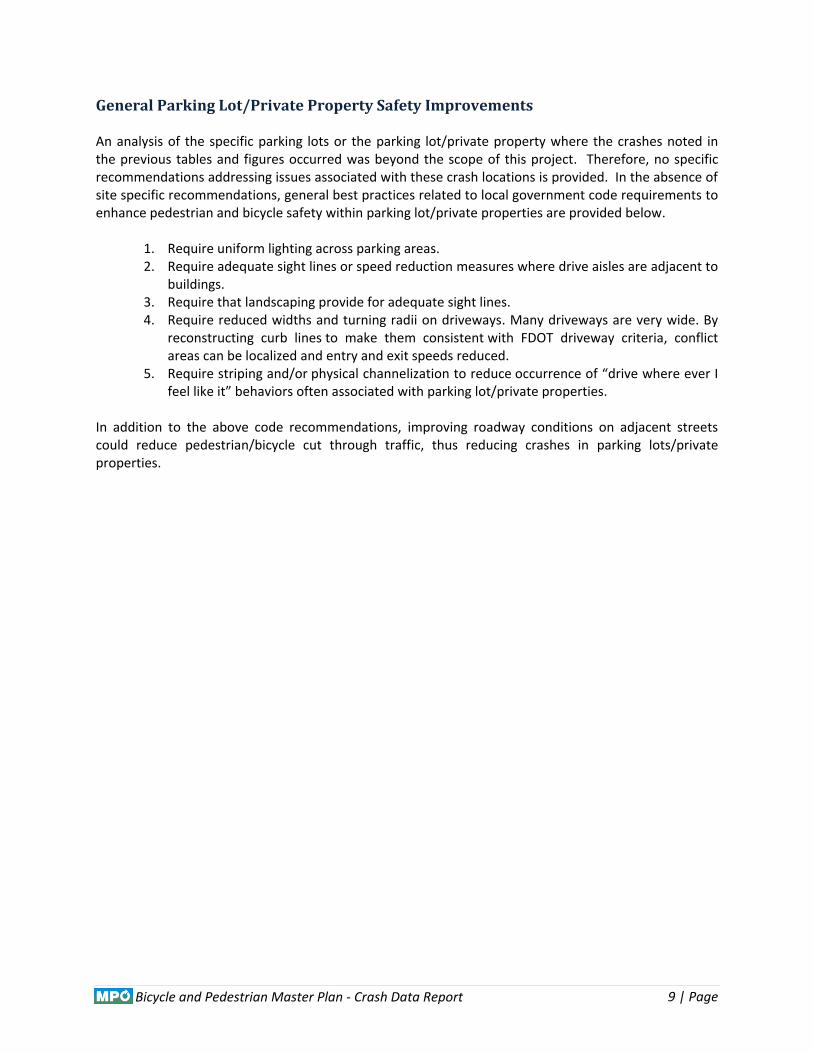
4. A motorist making a right turn hits a pedestrian who is travelling parallel to the roadway. In this crash scenario, the motorist making a right turn doesn’t see the pedestrian in the crosswalk. This can occur whether the pedestrian is travelling with or against traffic on the sidewalk.
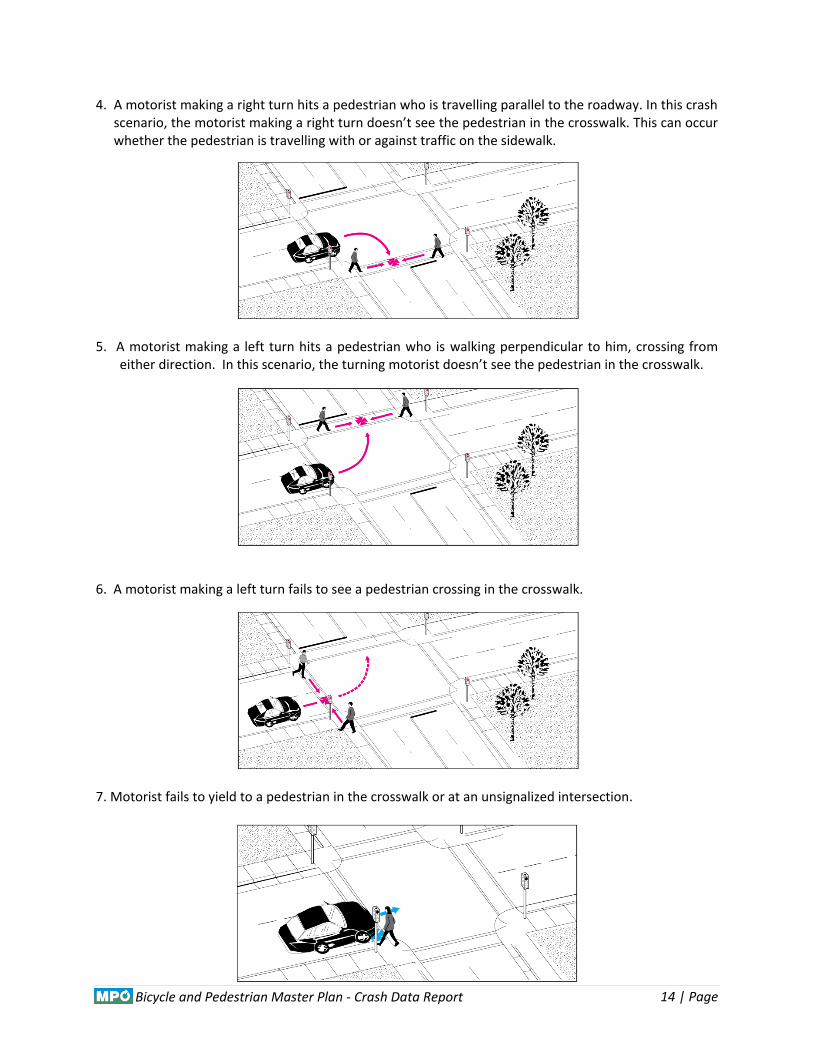
5. A motorist making a left turn hits a pedestrian who is walking perpendicular to him, crossing from
either direction. In this scenario, the turning motorist doesn’t see the pedestrian in the crosswalk.
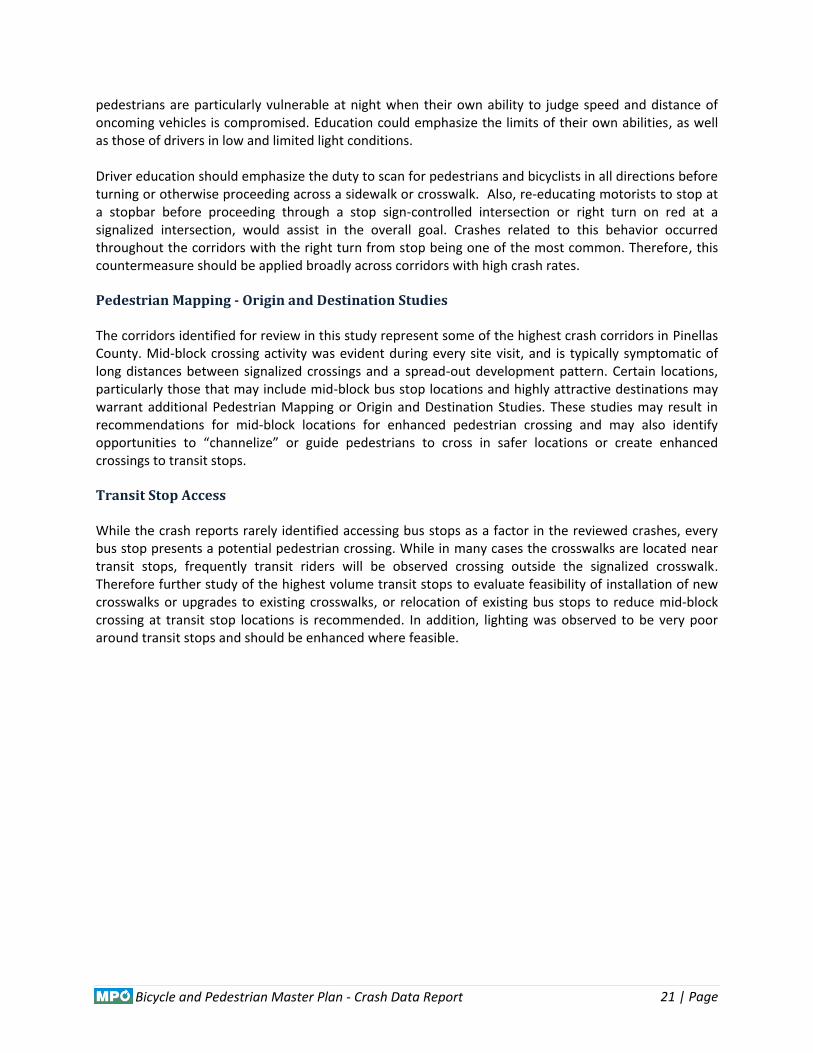
6. A motorist making a left turn fails to see a pedestrian crossing in the crosswalk.
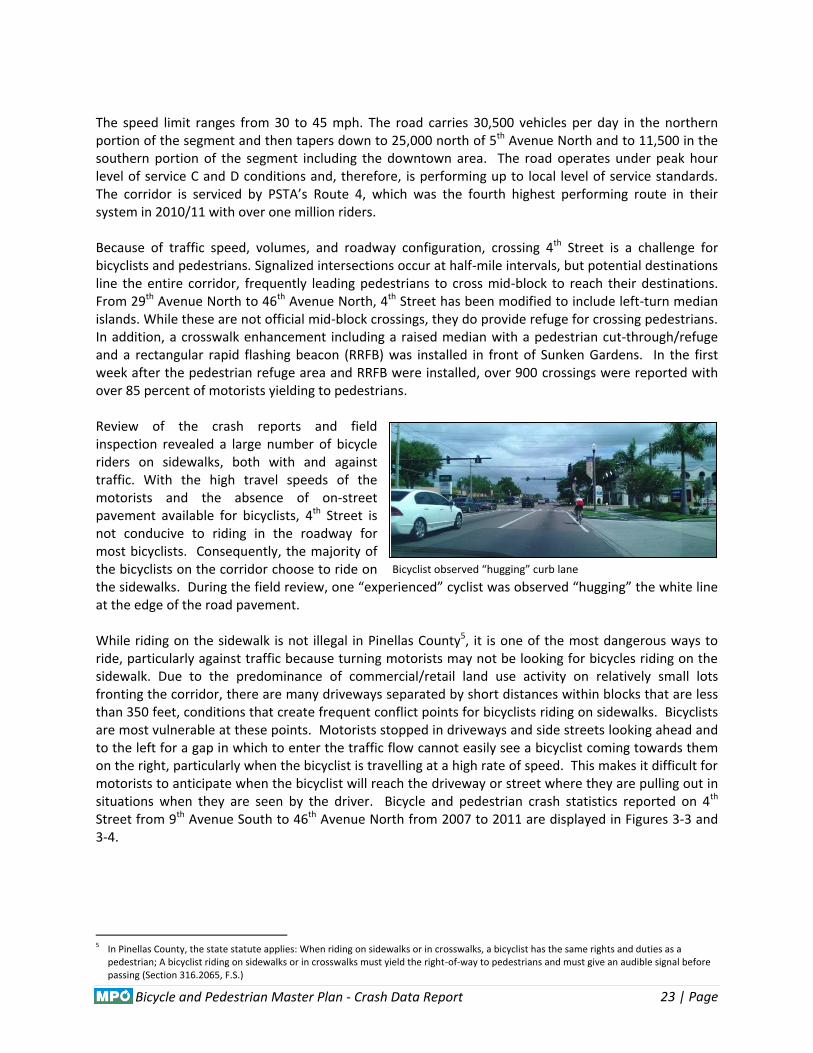
7. Motorist fails to yield to a pedestrian in the crosswalk or at an unsignalized intersection.

15 | Page Bicycle and Pedestrian Master Plan - Crash Data Report
8. In the Multiple Threat Crash situation oncoming motorists fail to see a pedestrian crossing the street due to their vision being obscured. Three different scenarios where this often occurs are described below.
The pedestrian may be attempting to cross from between two parked or stopped cars, where one is blocking the oncoming motorist’s view of him.
The pedestrian is crossing with permission, mid-block or in a crosswalk, having been seen by the first motorist. A motorist in the adjacent lane may not be able to see the crossing pedestrian because the view is obstructed by the first vehicle.
The pedestrian chooses a gap in traffic in which to cross the road and while the gap is large enough to cross the first lane of traffic, the gap is insufficient to cross the next lane(s).

16 | Page Bicycle and Pedestrian Master Plan - Crash Data Report
General Countermeasures Several countermeasures have been identified for consideration to address the common crash types described in the previous section. These include lighting improvements, highly visible lane striping, enhanced pedestrian crossings, infrastructure improvements, livable community approaches, pedestrian origin and destination studies, enforcement, safety education, and transit stop access improvements. Regarding lighting, it should be noted that Pinellas County does not assume responsibility for lighting roadways under its jurisdiction. Installation of street lighting on County roads is funded by home owners through the establishment of street lighting districts.
Lighting As shown in the previous section, a significant number of bicycle and pedestrian crashes occurred at night. Lighting is sporadic at best throughout most of the reviewed corridors. Even where street lighting exists, it is often not uniform. Dark areas intermixed with very bright areas can make pedestrians even harder to see than in areas where lighting levels are lower.
Compliance with uniformity ratios (Lavg/Lmin, Lmax/Lmin) or veiling luminance ratios as specified in the
FDOT Plans Preparation Manual (PPM) should be attained. Luminance is the measure of light reflected off the roadway surface, measured in candelas per square meter (cd/m2). Veiling luminance ratios are measurements of glare, which reduces contrast in a person’s field of view, and are dependent on the levels of vertical illuminance that reach the driver’s eyes. Veiling luminance ratios are determined by calculating the ratio of the veiling luminance to the average pavement luminance in the field of sight. Special emphasis should be placed on upgrading lighting along the study corridors in accordance with FDOT’s PPM and the FHWA Informational Report on Lighting Design for Midblock Crosswalks to help reduce the potential for crashes. It is also important to note that the lighting must be designed to illuminate the entire travel way, including the roadway, bike lanes, paths, and sidewalks. Failure to consider sidewalks and bikeways in the lighting design can result in situations where motorists are not able to see pedestrians before they begin crossing the street.
Pedestrian-Specific Lighting Poor lighting is often a contributing cause in night time pedestrian and bicyclist crashes. Roadways are frequently lit for the benefit of the vehicle, while pedestrian areas such as sidewalks are lit by commercial lighting or “leftover” roadway lighting rather than being lit to the recommended FDOT PPM standards for pedestrians. In many of the reviewed crashes coded “Dark, No Street Lights” pedestrians who tried to cross the roadway were hit by a vehicle whose driver may not have been able to see them because they were not in the area lit by vehicle headlamps and there was no other illumination of the area. In some cases, the code “Dark, No Street Lights” on the crash reports may indicate a situation where the change in lighting condition (intersection lighting or intermittent street lighting) makes it easy for a pedestrian to get lost in the shadows. In areas of higher pedestrian activity enhanced lighting should be considered to both enable pedestrians to better be able to make decisions about crossing and to allow drivers to see crossing pedestrians and those on the adjacent sidewalks.

17 | Page Bicycle and Pedestrian Master Plan - Crash Data Report
Lane Striping Roadway lane striping should be maintained to be highly visible at night. Research suggests that improving the roadway striping reduces all crashes because drivers are able to devote less attention to maintaining lane position and are better able to observe more of what is occurring within the environment.
Enhanced Pedestrian Crossing In a number of crashes, particularly in areas of higher residential density, increased crossing time may have allowed the pedestrians to safely finish crossing the roadway. The pedestrian crossing distance was once assumed to be 4.0 feet per second. The Manual on Uniform Traffic Control Devices (MUTCD) now requires pedestrian clearance intervals to allow for 3.5 feet per second walking speed. Increased pedestrian activity or an area of intense residential and business activity may justify a cycle time set to allow pedestrian crossing of 3.0 feet per second. A NO RIGHT TURN ON RED blank out sign may also be helpful at select intersections. This sign would be activated when the pedestrian activates the WALK signal to create a stop condition for right turning motorists, thus removing one of the potential conflicts at the intersection, and creating a safer opportunity to cross the street. It should be noted that approval of a NO RIGHT TURN ON RED blank out sign installation would be based on a case by case review of the jurisdictional authority, which in the case of the corridors reviewed in this report, would be FDOT or Pinellas County.
Infrastructure Improvements The challenge with many of the intersections on the major roadways in Pinellas County is the size. Pedestrians and bicyclists have to cross multiple lanes of traffic and often several turn lanes. AASHTO notes that a designer should consider “the largest design vehicle likely to use the facility with considerable frequency” (emphasis added).1 This does not require the construction of big intersections. The design vehicle should not be a large vehicle type that will only use the intersection on rare occasions. With the above guidance in mind, one of the most effective techniques that can be
1 A Policy on Geometric Design of Highways and Streets, AASHTO, 2011, 2-1
Substandard
ard
Substandard Standard

18 | Page Bicycle and Pedestrian Master Plan - Crash Data Report
implemented to assist pedestrians is to make intersections smaller. This slows down traffic and shortens crossing distances. It has been shown that motorists will frequently drive to the maximum comfortable speed so designing turns with wide turn radii, in effect, encourages them to move through the intersection quickly. In an effort to slow traffic down, reducing the opportunity for pedestrian crashes, intersection design should include smaller turn radii. The AASHTO Green Book states, “Where it is appropriate to provide for turning vehicles within minimum space, as at unchannelized intersections, the corner radii should be based on minimum turning path of the selected design vehicles.2 Because of space limitations, presence of pedestrians and generally lower operating speeds in urban areas …guidelines for right-turning radii into minor side streets in urban areas usually range from 1.5 to 9 m [5 to 30 ft] and most are between 3 and 4.5 m [10 to 15 ft]. Where a substantial number of pedestrians are present, the lower end of the ranges described below may be appropriate. Most passenger cars operating at very low speeds on lanes 3 m [10 ft] or more in width are able to make a right turn with a curb radius of about 4.5 m [15 ft] with little encroachment on other lanes. However, operation of these vehicles at increased speeds or of larger vehicles even at very low speeds generally results in substantial encroachment on adjacent lanes at either the beginning or the end of the turn, or both.”3 Another infrastructure tool that can be used is lane channelization. Also known as a right turn slip lane or characterized by a “pork chop” island, channelization is the separation or regulation of traffic movements into definite paths of travel by traffic islands or pavement markings to facilitate the orderly flow of vehicles and pedestrians. The AASHTO Green Book says channelization should be considered for a number of reasons, including to provide refuge areas for pedestrians and to separate the conflicts at an intersection. 4 Design controls for this type of device include small turn radii which slow traffic. The addition of a traffic island also means that the pedestrian has shorter crossing distances. It is important to note that any decisions regarding the installation of the aforementioned infrastructure improvements must take into account the needs of all users of the transportation system including freight carrying trucks and buses.
Livable Community Approaches The term “livable communities” is used to describe urban environments where walking, bicycling and transit service is safe, comfortable and efficient and where the physical environment offers an
2 A Policy on Geometric Design of Highways and Streets, AASHTO, 2011, 9-55
3 A Policy on Geometric Design of Highways and Streets, AASHTO, 2011, 9-92
4 See 9-93 in the Greenbook for the complete list of factors.
This curb extension is an example of an intersection treatment that increases safety for bicyclists and pedestrians.
Well designed slip lanes at a busy, wide intersection. The crosswalks are located to allow the greatest visibility between the motorists and pedestrians.

19 | Page Bicycle and Pedestrian Master Plan - Crash Data Report
interesting and unique experience from the standpoint of street, land and building design. Central to the livable communities concept is the employment of street and land design strategies that encourage these travel modes.
Complete Streets Complete Streets is a multi-modal approach to road design that incorporates some of the countermeasures previously discussed. It is intended to provide safe travel conditions for pedestrians, bicyclists and transit riders as well as motorists. Complete street treatments include the construction and installation of sidewalks, bicycle lanes, bus stops with shelters and related amenities and connections to the sidewalk network and crosswalks with pedestrian signals. Additional complete street improvements may include pedestrian refuge islands in the median, curb bulb outs and narrower or curvilinear vehicle lanes. Establishing and applying a complete streets policy is one of the most effective methods of reducing the occurrence of bicycle and pedestrian crashes. It provides a safe environment for these travel modes through engineering design while encouraging motorists to drive more cautiously.
Pedestrian, Bicycle, and Transit Friendly Land Design In addition to street design, pedestrian, bicycle and transit-friendly land development is critically important to creating a safe environment for bicyclists, pedestrians and transit users. Local governments can
facilitate the type of land design that is desirable for these travel modes through the application of land development codes that require the inclusion of development features such as those listed below.
Orientation of buildings to the front of the property with parking areas toward the side or rear.
Establish maximums rather than required minimums on parking spaces.
Require adjoining properties to share driveways and parking areas.
Provide sidewalk connections between street corridors and building entrances.
Provide landscaping with shade canopy along sidewalks.
Encourage architectural design that improves the aesthetics of the corridor.
Provide bicycle racks for customers.
Enforcement Several reports and field observations indicate bicyclists and pedestrians moving across lanes in an unsafe manner. This includes pedestrians not using crosswalks. A number of reports noted driver’s behavior, which violated the pedestrian or bicyclist’s right-of-way. Law enforcement officers could make a point to warn or cite bicyclists, pedestrians, and motorists observed operating in such ways. These behaviors were related to crashes throughout the study corridors and focused, consistent application near signalized intersections, transit stops and significant commercial destinations, along with an effective education campaign can begin to reduce the number of crashes along these corridors.

20 | Page Bicycle and Pedestrian Master Plan - Crash Data Report
Working with local governments, the FDOT District 7 Office has launched a number of initiatives to aid enforcement efforts in Pinellas County. These included the purchase of over 8,000 countdown and pedestrian signals and push button plaques in 2007 and 2008 for all roadway intersections, the installation of more than 50 school zone flashers in 2010 and securing the allocation of over $300,000 in State and Federal funding to law enforcement agencies for overtime work targeting pedestrian safety violations. In November 2012, FDOT District 7 authorized the installation of TURNING VEHICLES YIELD TO PEDESTRIAN signs (MUTCD R10-15) for placement at intersections having a high number of right turn or left turn bicycle and pedestrian crashes. In addition, as shown in the corridor study findings discussion in the next section, a common crash scenario involved vehicles turning out of driveways into the path of bicyclists and pedestrians crossing in front of them. Working with local governments, the FDOT District 7 Office recently installed WATCH FOR TURNING VEHICLE signs facing bicyclists and pedestrians approaching driveways. Fifty of these signs were installed in 2011 along US 19, Park Boulevard and 66th Street.
Safety Education Education is yet another tool that can be used by the MPO to help mitigate the circumstances that lead to many of the crashes. While the emphasis for each mode would vary, the end goal is to reduce crashes for all modes. In recent years, the FDOT District 7 Office, working in cooperation with local governments, has been actively engaged in a number of educational initiatives including a multi media “Stop and Look” campaign, Safe Routes to School Education Program for elementary and middle school students, distribution of safety “Tip Cards” and related publications and the Gulf Boulevard Flag Program. In addition, education programs such as the Center for Urban Transportation Research’s (CUTR’s) BikeSmart and Walkwise Tampa Bay have been presented to groups throughout the Tampa Bay region to raise awareness. A bicyclist riding against traffic, frequently on the sidewalk, is a common crash scenario in Pinellas County. While riding on the sidewalk is not illegal in the County, riding against on-coming traffic puts the bicyclist in a vulnerable position, particularly at driveways and intersections. Turning vehicles are not expecting a vehicle to be travelling in the opposite direction of traffic and may not be looking for them. Bicyclist education is needed across the county, focusing on the importance of riding in a predictable manner, following vehicular rules when in the street and following pedestrian rules when on the sidewalk, including the observance of pedestrian signals at crosswalks. An educational campaign could include brochures, flyers, placemats, billboards, and bus stop advertisements illustrating the crash risks associated with this type of riding and illustrative photographs could be staged locally to reflect both the local demographics and the general appearance of the corridor. Also important is that bicyclists understand their responsibility as a vehicle on the roadway. This includes the legal requirement to use front and rear lights when riding at night. Pedestrian education should emphasize the understanding of safe crossing procedures and the importance of being predictable at intersections or crossings. A number of crashes that occurred seemed to be a function of misjudging the speed at which an oncoming vehicle would cross the path of the pedestrian, so education about this particular issue could be helpful. Along the same lines,
21 | Page Bicycle and Pedestrian Master Plan - Crash Data Report
pedestrians are particularly vulnerable at night when their own ability to judge speed and distance of oncoming vehicles is compromised. Education could emphasize the limits of their own abilities, as well as those of drivers in low and limited light conditions. Driver education should emphasize the duty to scan for pedestrians and bicyclists in all directions before turning or otherwise proceeding across a sidewalk or crosswalk. Also, re-educating motorists to stop at a stopbar before proceeding through a stop sign-controlled intersection or right turn on red at a signalized intersection, would assist in the overall goal. Crashes related to this behavior occurred throughout the corridors with the right turn from stop being one of the most common. Therefore, this countermeasure should be applied broadly across corridors with high crash rates. Pedestrian Mapping - Origin and Destination Studies The corridors identified for review in this study represent some of the highest crash corridors in Pinellas County. Mid-block crossing activity was evident during every site visit, and is typically symptomatic of long distances between signalized crossings and a spread-out development pattern. Certain locations, particularly those that may include mid-block bus stop locations and highly attractive destinations may warrant additional Pedestrian Mapping or Origin and Destination Studies. These studies may result in recommendations for mid-block locations for enhanced pedestrian crossing and may also identify opportunities to “channelize” or guide pedestrians to cross in safer locations or create enhanced crossings to transit stops. Transit Stop Access While the crash reports rarely identified accessing bus stops as a factor in the reviewed crashes, every bus stop presents a potential pedestrian crossing. While in many cases the crosswalks are located near transit stops, frequently transit riders will be observed crossing outside the signalized crosswalk. Therefore further study of the highest volume transit stops to evaluate feasibility of installation of new crosswalks or upgrades to existing crosswalks, or relocation of existing bus stops to reduce mid-block crossing at transit stop locations is recommended. In addition, lighting was observed to be very poor around transit stops and should be enhanced where feasible.

22 | Page Bicycle and Pedestrian Master Plan - Crash Data Report
High Crash Corridors 4th Street: 9th Avenue South to 46th Avenue North This 3.23-mile section of 4th Street is four/six lanes. The facility is under FDOT jurisdiction with the exception of the section between 6th Avenue South and 9th Avenue South, which is under the jurisdiction of St. Petersburg. The entire corridor is within the City of St. Petersburg. The table below provides further detail on the cross sections, lane configurations and land uses for this section of 4th Street.
Segment Cross Section/Lane Cnfg. Land Use
46 Avenue North to 30th Avenue North
six lane divided, raised medians and channelized left turn lanes
general commercial/retail including Northeast Shopping Center and 4th Street Center
30th Avenue North to 5th Avenue North
four lane divided, center turn lane (south of 29th Ave N)
general commercial/retail including Coconut Grove Shopping Center. Sunken Gardens is also located along 4th Street and Crescent Lake Park is one block west
5th Avenue North to 6th Avenue South
four lane one-way, 5th Ave S to 6th Ave S includes continuous north bound right turn lane, on-street parking
commercial, office, churches, condominiums, Courtyard Hotel, post office, Williams Park and Sunshine Center to the west
6th Avenue South to 9th Avenue South
four lane divided, center turn lane through most of segment
apartments, Poynter Institute , All Children’s Hospital Complex. USF and Albert Whitted Airport located to the east
A number of the intersecting streets including 5th Avenue South, 1st Avenue North, 4th Avenue North, 30th Avenue North, and 34th Avenue North have bicycle lanes and the Pinellas Trail intersects 4th Street along 1st Avenue South. The North Bay Trail, which is part of the Pinellas Trail Loop, is located to the east along 1st Street. This section of 4th Street is a high-travel corridor for bicyclists with a wide range of skill levels although there are no on-street bicycle lanes or shoulders.
23 | Page Bicycle and Pedestrian Master Plan - Crash Data Report
The speed limit ranges from 30 to 45 mph. The road carries 30,500 vehicles per day in the northern portion of the segment and then tapers down to 25,000 north of 5th Avenue North and to 11,500 in the southern portion of the segment including the downtown area. The road operates under peak hour level of service C and D conditions and, therefore, is performing up to local level of service standards. The corridor is serviced by PSTA’s Route 4, which was the fourth highest performing route in their system in 2010/11 with over one million riders. Because of traffic speed, volumes, and roadway configuration, crossing 4th Street is a challenge for bicyclists and pedestrians. Signalized intersections occur at half-mile intervals, but potential destinations line the entire corridor, frequently leading pedestrians to cross mid-block to reach their destinations. From 29th Avenue North to 46th Avenue North, 4th Street has been modified to include left-turn median islands. While these are not official mid-block crossings, they do provide refuge for crossing pedestrians. In addition, a crosswalk enhancement including a raised median with a pedestrian cut-through/refuge and a rectangular rapid flashing beacon (RRFB) was installed in front of Sunken Gardens. In the first week after the pedestrian refuge area and RRFB were installed, over 900 crossings were reported with over 85 percent of motorists yielding to pedestrians. Review of the crash reports and field inspection revealed a large number of bicycle riders on sidewalks, both with and against traffic. With the high travel speeds of the motorists and the absence of on-street pavement available for bicyclists, 4th Street is not conducive to riding in the roadway for most bicyclists. Consequently, the majority of the bicyclists on the corridor choose to ride on the sidewalks. During the field review, one “experienced” cyclist was observed “hugging” the white line at the edge of the road pavement. While riding on the sidewalk is not illegal in Pinellas County5, it is one of the most dangerous ways to ride, particularly against traffic because turning motorists may not be looking for bicycles riding on the sidewalk. Due to the predominance of commercial/retail land use activity on relatively small lots fronting the corridor, there are many driveways separated by short distances within blocks that are less than 350 feet, conditions that create frequent conflict points for bicyclists riding on sidewalks. Bicyclists are most vulnerable at these points. Motorists stopped in driveways and side streets looking ahead and to the left for a gap in which to enter the traffic flow cannot easily see a bicyclist coming towards them on the right, particularly when the bicyclist is travelling at a high rate of speed. This makes it difficult for motorists to anticipate when the bicyclist will reach the driveway or street where they are pulling out in situations when they are seen by the driver. Bicycle and pedestrian crash statistics reported on 4th Street from 9th Avenue South to 46th Avenue North from 2007 to 2011 are displayed in Figures 3-3 and 3-4.
5 In Pinellas County, the state statute applies: When riding on sidewalks or in crosswalks, a bicyclist has the same rights and duties as a
pedestrian; A bicyclist riding on sidewalks or in crosswalks must yield the right-of-way to pedestrians and must give an audible signal before passing (Section 316.2065, F.S.)
Bicyclist observed “hugging” curb lane

24 | Page Bicycle and Pedestrian Master Plan - Crash Data Report
Figure 3-3 4th Street: 9th Avenue South to 46th Avenue North Bicycle Crashes
Figure 3-4 4th Street: 9th Avenue South to 46th Avenue North Pedestrian Crashes
Regarding Table 3-1, the same table is included in the discussion of the other corridors profiled in the later sections of this report. For 4th Street and the other corridors, the tables depict the characteristics of all crashes on the study corridor as identified in the MPO CDMS regardless of whether a FDHSMV crash report was available for review. The numbers in the tables reflect only those crashes that had complete crash reports and were consistent with countywide and corridor trends. Individual crash reports were reviewed for the corridor crash trend analysis. The table labels are based on the crash report headings.

25 | Page Bicycle and Pedestrian Master Plan - Crash Data Report
Table 3-1: Bicycle and Pedestrian Involved Crashes along 4th Street
Bike Ped Time of Day
Bike Ped Severity
1 0 Dusk 1 6 Fatal
39 27 Daylight 2 10 Incapacitating
1 0 Dawn 20 17 Non-incapacitating
6 2 Dark, not lighted 6 13 Possible injury
14 30 Dark, lighted 32 13 Non-injury* * If no injury noted in the crash report, it was assumed to be non-injury.
Recommended Counter Measures
Because 4th Street is not ideal for many bicyclists, encouraging them to use a parallel route is recommended. The low speed, low volume residential streets to the east such as 1st Street, which is the North Bay Trail route north of 30th Avenue North, 2nd Street and 3rd Street would provide through routes that are more conducive to bicycling than 4th Street. Wayfinding signage, similar to what is used for the St. Petersburg City Trails system could be used to help lead bicyclists to one of these alternative routes.
Wherever possible, replace the remaining two-way left-turn lanes on 4th Street with installation of median turn islands like is already done on parts of the corridor.
Modify regulations to require installation and maintenance of signage and landscaping so as to not obstruct driver line-of-sight. Obstructed vision was the reason identified in the crash reports for several crashes. This is a particular concern if the bicyclist is riding against traffic on the sidewalk; a driver waiting to turn is less likely to see the bicyclist than if he or she were in the roadway riding with traffic. While buildings can’t be moved to improved site lines, guidelines for plantings and other landscape elements should be revised to allow for improved site distance.
Include Leading Pedestrian Intervals (LPIs) at signals where there is a lot of pedestrian traffic. LPIs give pedestrians a few extra seconds in the crosswalk before the vehicle traffic gets the green light. These extra seconds separate them in time, giving the pedestrian, particularly those crossing in the direction of traffic, a head start.6 The LPI has been shown to reduce pedestrian conflicts with turning motorists.
Install NO RIGHT TURN ON RED blank out signs. Because a right turn on red is allowed and the reason for the crashes were frequently that the drivers didn’t see the pedestrians in the crosswalk, installing No RIGHT TURN ON RED blank out signs are recommended. These signs would be activated when a pedestrian requests the WALK signal to give him more time to
6 Leading Pedestrian Interval, Ron Van Houton, Ph.D. http://www.walkinginfo.org/pedsafe/casestudy.cfm?CS_NUM=66
Example of obstructed view

26 | Page Bicycle and Pedestrian Master Plan - Crash Data Report
clear. If the pedestrian WALK signal is not requested, vehicle drivers would be able to turn right on red as currently allowed. Additional YIELD TO PED blank out signs could be installed next to the five-section signal clusters where permissive left turns are allowed.
Table 3-2: Summary of 4th Street Counter Measures
Challenge Counter Measures
Bicycle Riding against traffic on the sidewalk Horizontal signage at driveways/Education
4th Street is likely too high speed and too high traffic volume for many bicyclists and there is insufficient room for a bicycle lane
Encourage use of secondary bike network on parallel low-volume, low-speed streets
Connectivity of 4th Street to the CityTrails network More bicycle routes, enhanced wayfinding signage on perpendicular streets
Site lines obstructed Develop and enforce policy requiring maintenance of landscaping and signage so as not to obstruct line-of-sight
Pedestrian Crossing between signals Pedestrian origins and destination study;
Installation of raised medians/pedestrian refuge
Crashes when vehicle turns right on a green light and doesn’t see pedestrian in crosswalk
Installation of LPI signal timing to give pedestrian a head start when crossing the street
Crashes when vehicle turns right on a red light and doesn’t see pedestrian in crosswalk
NO RIGHT TURN ON RED blank out sign activated when pedestrian requests WALK signal
27 | Page Bicycle and Pedestrian Master Plan - Crash Data Report
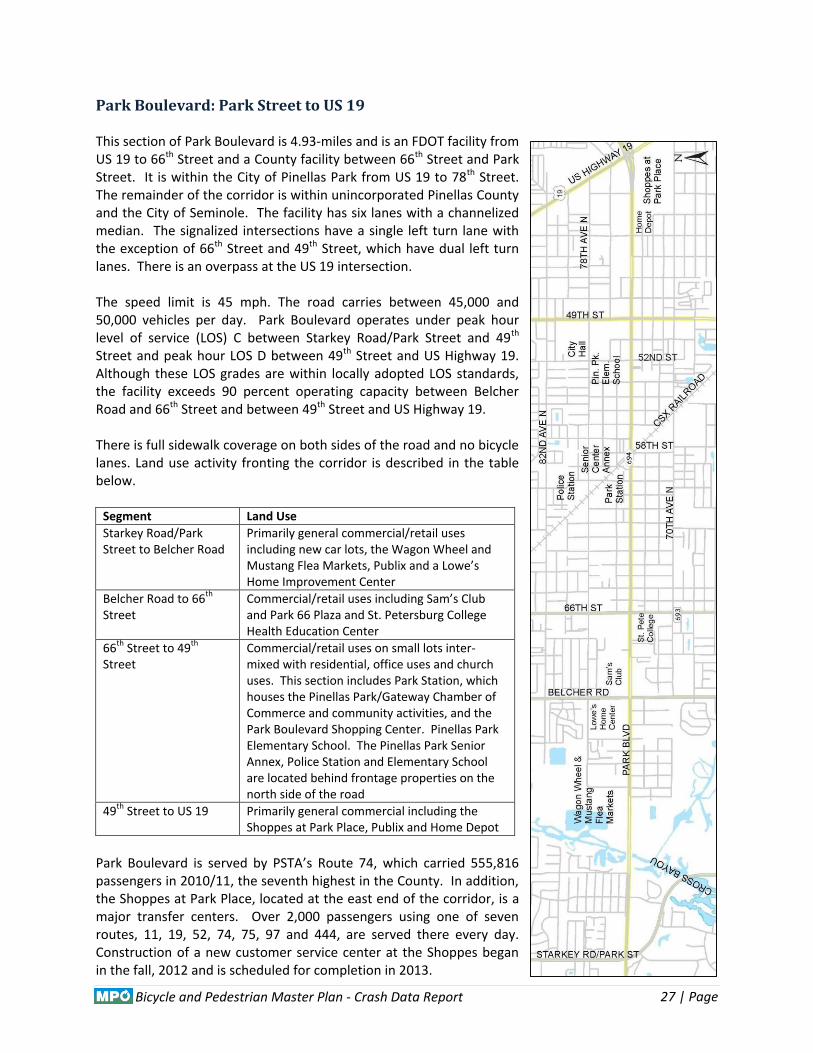
Park Boulevard: Park Street to US 19 This section of Park Boulevard is 4.93-miles and is an FDOT facility from US 19 to 66th Street and a County facility between 66th Street and Park Street. It is within the City of Pinellas Park from US 19 to 78th Street. The remainder of the corridor is within unincorporated Pinellas County and the City of Seminole. The facility has six lanes with a channelized median. The signalized intersections have a single left turn lane with the exception of 66th Street and 49th Street, which have dual left turn lanes. There is an overpass at the US 19 intersection. The speed limit is 45 mph. The road carries between 45,000 and 50,000 vehicles per day. Park Boulevard operates under peak hour level of service (LOS) C between Starkey Road/Park Street and 49th Street and peak hour LOS D between 49th Street and US Highway 19. Although these LOS grades are within locally adopted LOS standards, the facility exceeds 90 percent operating capacity between Belcher Road and 66th Street and between 49th Street and US Highway 19. There is full sidewalk coverage on both sides of the road and no bicycle lanes. Land use activity fronting the corridor is described in the table below.
Segment Land Use
Starkey Road/Park Street to Belcher Road
Primarily general commercial/retail uses including new car lots, the Wagon Wheel and Mustang Flea Markets, Publix and a Lowe’s Home Improvement Center
Belcher Road to 66th Street
Commercial/retail uses including Sam’s Club and Park 66 Plaza and St. Petersburg College Health Education Center
66th Street to 49th Street
Commercial/retail uses on small lots inter-mixed with residential, office uses and church uses. This section includes Park Station, which houses the Pinellas Park/Gateway Chamber of Commerce and community activities, and the Park Boulevard Shopping Center. Pinellas Park Elementary School. The Pinellas Park Senior Annex, Police Station and Elementary School are located behind frontage properties on the north side of the road
49th Street to US 19 Primarily general commercial including the Shoppes at Park Place, Publix and Home Depot
Park Boulevard is served by PSTA’s Route 74, which carried 555,816 passengers in 2010/11, the seventh highest in the County. In addition, the Shoppes at Park Place, located at the east end of the corridor, is a major transfer centers. Over 2,000 passengers using one of seven routes, 11, 19, 52, 74, 75, 97 and 444, are served there every day. Construction of a new customer service center at the Shoppes began in the fall, 2012 and is scheduled for completion in 2013.

28 | Page Bicycle and Pedestrian Master Plan - Crash Data Report
As on 4th Street, the review of the crash reports and the field review revealed a large number of sidewalk bicycle riders, both with and against traffic. The high vehicle speeds and traffic volume are not conducive to riding in the roadway, especially without a bicycle lane, thus leading them to choose to ride on the sidewalk. As stated previously, riding on the sidewalk is not illegal, but it does increase the chance of bicycle crashes. A shortage of signalized pedestrian street crossings is another issue that adversely affects pedestrian and bicyclist safety on this corridor. There are two 1.5 mile sections, Starkey Road to Belcher Road and 66th Street to 52nd Street, where there are no signalized intersections. Motorists are prone to exceed the speed limit in these sections and, as a result, there is limited occurrence of platooning in the traffic flow, which is necessary for bicyclists and pedestrians to safely cross the street in the absence of a signal. As noted in Figure 3-5, five bicycle crashes reported on Park Boulevard, Park Street to US 19, from 2007 to 2011 were located at uncontrolled intersections. As shown in Figure 3-6, all 16 pedestrian crashes were located at uncontrolled intersections and mid-block.
Figure 3-5 Park Boulevard: Park Street to US 19 Bicycle Crashes

29 | Page Bicycle and Pedestrian Master Plan - Crash Data Report
Figure 3-6 Park Boulevard: Park Street to US 19 Pedestrian Crashes
Table 3-3: Bicycle and Pedestrian Involved Crashes along Park Boulevard
Bike Ped Time of Day
Bike Ped Severity
2 1 Dusk 2 2 Fatal
55 21 Daylight 16 14 Incapacitating
0 0 Dawn 21 13 Non-incapacitating
2 1 Dark, not lighted 13 1 Possible injury
14 18 Dark, lighted 21 11 Non-injury* * If no injury noted in the crash report, it was assumed to be non-injury.
Recommended Counter Measures
Horizontal signage at driveways and a poster educational campaign are recommended to address the right turn from stop crash.
Bicyclists should be educated to the dangers inherent in riding on the sidewalk against traffic. Pedestrians might benefit from a campaign that highlights the dangers of mid-block crossings. While targeting bicyclists and pedestrians, these education campaigns should be developed in such a way that the message also educates drivers. Specific campaigns reminding drivers of their obligations, such as to stop for pedestrians at unsignalized intersections, stop at stopbars, and stop before right turn on red should be developed.
Review lighting conditions along this corridor. Lighting the roadway and sidewalks to FDOT PPM standards and FHWA Informational Report on Lighting Design for Midblock Crosswalks may help nighttime drivers identify crossing pedestrians while helping the pedestrians better identify safe gaps in traffic.

30 | Page Bicycle and Pedestrian Master Plan - Crash Data Report
Table 3-4: Summary of Park Boulevard Counter Measures
Challenge Counter Measures
Bicycle Riding against traffic on the sidewalk Horizontal signage at driveways/Educational
campaign
Poor lighting conditions Improve conditions per PPM standards and FHWA Informational Report on Lighting Design for Midblock Crosswalks
Pedestrian Crossing between intersections Pedestrian Origins and Destination study;
Installation of raised medians/pedestrian refuges; Make intersections feel safer
Crossing mid-block to access transit Pedestrian Origins and Destinations study at high-volume bus stops to identify opportunities for enhanced mid-block crossings and/or modify transit stop location.

31 | Page Bicycle and Pedestrian Master Plan - Crash Data Report
West Bay Drive/State Road 686: Indian Rocks Road to 58th Street West Bay Drive/State Road 686 between Indian Rocks Road and 58th Street is 6.5-miles. The section from 58th Street to Seminole Boulevard is an FDOT jurisdictional facility. The section from Seminole Boulevard to Clearwater Largo Road is under the jurisdiction of the City of Largo and the remaining section is a Pinellas County facility. The entire corridor from Indian Rocks Road to 58th Street is within the City of Largo except for the nodal properties at the intersection of Indian Rocks Beach Road, which are within the City of Belleair Bluffs. There are also some unincorporated properties along the corridor east of Belcher Road. This is a four/six lane divided facility with dual left and exclusive right turn lanes at the major intersections, including Clearwater-Largo Road (north bound), Seminole Boulevard, Keene Road, Belcher Road and US 19. The corridor has a dual center turn lane west of Clearwater-Largo Road and channelized raised medians to the east of it. The speed limit is 45 mph. There is full sidewalk coverage on both sides of the road and there are no bicycle lanes. The table below identifies lane configurations, average daily trips, peak hour level of service and adjacent land uses associated with this section of West Bay Drive/State Road 686.
Segment Lane Cnfg.
Avg. Daily Trips
Peak Hr. LOS
Land Use
Indian Rocks Rd to Clwtr-Largo Rd
4L Div. 21,903 C Commercial/retail and offices including Raymond James Office Center, Largo Medical Center and surrounding medical offices, Publix Shopping Center at the east end and the Bluffs Shopping Center on the west end. Belleair Bluffs City Hall is also located proximate to the corridor along Indian Rocks Road. The Pinellas Trail intersects the eastern portion of this segment
Clwtr-Largo Rd to Seminole Blvd
4L Div. 21,903 F Dowtown Largo corridor includes commerical/retail shops, church, and residential uses
Seminole Blvd to Keene Rd
6L Div. 43,500 - 58,500
D (vol/cap ratio >.9)
Commercial/retail, municipal uses, and high density residential. These Include Hampton Inn and Suites, Largo Central Park and Cultural Center, Largo Public Library, Winn Dixie Marketplace, condominiums, senior living facilities, and Keene Plaza at the east end. Also proximate to the corridor at the west end is Largo Central Elementary School, Largo High School, Largo City Hall and the Highland Recreation Center
Keene Rd to Belcher Rd
6L Div. 58,500 F Commercial/retail, office uses and mobile home park, including East Bay Plaza and Publix Supermarket at the east end and Sweetbay Supermarket and East Bay Junction Shopping Center at the west end
Belcher Rd to US 19 6L Div. 58,500 F Commercial/retail, offices, church and condominiums, including Tri-City Shopping Center at east end
US 19 to 58th St 4L Div. 46,000 C Commercial/retail, offices, residential, mobile home park. Uses include planned Walmart and PSTA station and Carmax at west end and Hospice of Florida at the east end

32 | Page Bicycle and Pedestrian Master Plan - Crash Data Report
West Bay Drive/State Road 686 is served by PSTA Route 66 from Clearwater Largo Road to Indian Rocks Road and Route 52 and 98 to the east. Route 66 provided 300,597 rides in 2010/11, below the average ridership, 408,344, for the system. Route 52 provided approximately 1.3 million rides in 2010/11, third highest ridership in the system. Route 98, which is a peak hour service, provided 31,529 rides. As with the other corridors, the review of the crash reports and the field inspections revealed a large number of sidewalk bicycle riders, both with and against traffic. The high vehicle speeds and traffic volumes are not conducive to riding in the roadway, especially without a bicycle lane, thus leading them to choose to ride on the sidewalk. Figures 3-7 and 3-8 present the bicycle and pedestrian crash statistics reported from 2007 to 2011 on West Bay Drive/State Road 686, Indian Rocks Road to 58th Street.
Figure 3-7 West Bay Drive/State Road 686: Indian Rocks Road to 58th Street Bicycle Crashes
33 | Page Bicycle and Pedestrian Master Plan - Crash Data Report
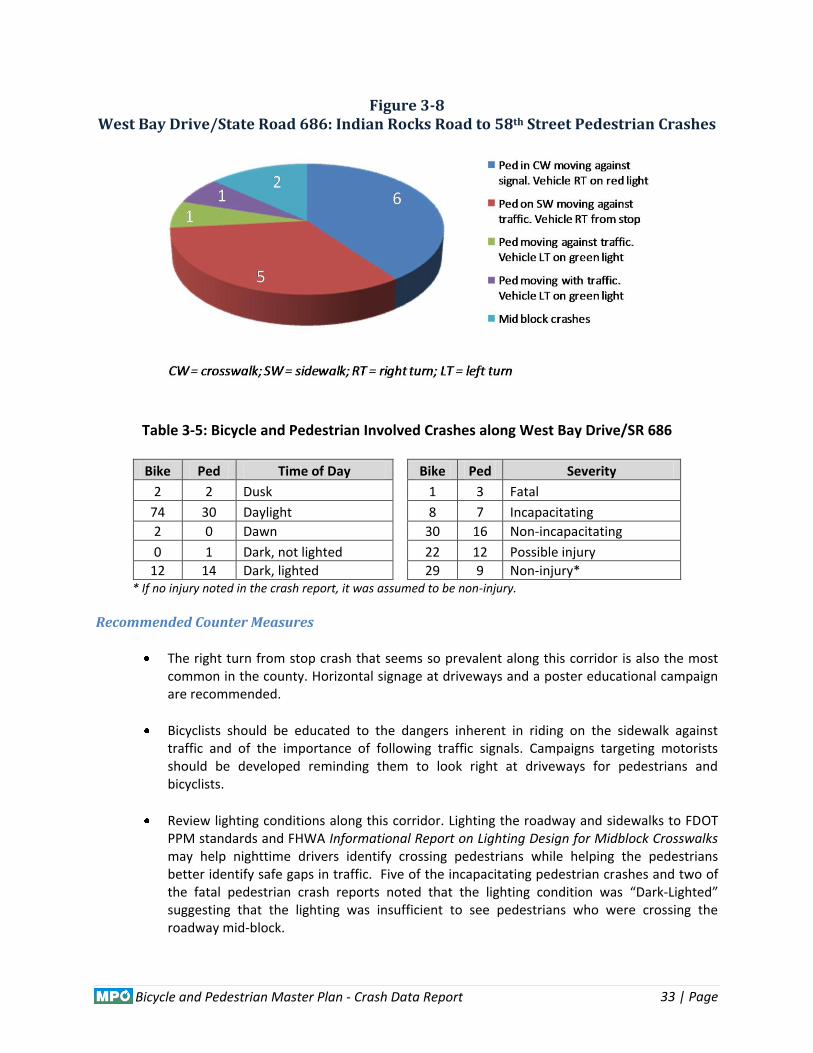
Figure 3-8 West Bay Drive/State Road 686: Indian Rocks Road to 58th Street Pedestrian Crashes
Table 3-5: Bicycle and Pedestrian Involved Crashes along West Bay Drive/SR 686
Bike Ped Time of Day
Bike Ped Severity
2 2 Dusk 1 3 Fatal
74 30 Daylight 8 7 Incapacitating
2 0 Dawn 30 16 Non-incapacitating
0 1 Dark, not lighted 22 12 Possible injury
12 14 Dark, lighted 29 9 Non-injury* * If no injury noted in the crash report, it was assumed to be non-injury.
Recommended Counter Measures
The right turn from stop crash that seems so prevalent along this corridor is also the most common in the county. Horizontal signage at driveways and a poster educational campaign are recommended.
Bicyclists should be educated to the dangers inherent in riding on the sidewalk against traffic and of the importance of following traffic signals. Campaigns targeting motorists should be developed reminding them to look right at driveways for pedestrians and bicyclists.
Review lighting conditions along this corridor. Lighting the roadway and sidewalks to FDOT PPM standards and FHWA Informational Report on Lighting Design for Midblock Crosswalks may help nighttime drivers identify crossing pedestrians while helping the pedestrians better identify safe gaps in traffic. Five of the incapacitating pedestrian crashes and two of the fatal pedestrian crash reports noted that the lighting condition was “Dark-Lighted” suggesting that the lighting was insufficient to see pedestrians who were crossing the roadway mid-block.

34 | Page Bicycle and Pedestrian Master Plan - Crash Data Report
Consider Pedestrian Origin and Destination studies around high volume mid-block bus stops to identify opportunities for enhanced mid-block crossings.
Modify regulations to require installation and maintenance of signage and landscaping so as to not obstruct driver line-of-sight. Obstructed vision was the reason identified in the crash reports for several crashes. This is a particular concern if the bicyclist is riding against traffic on the sidewalk; a driver waiting to turn is less likely to see the bicyclist than if he or she were in the roadway riding with traffic. While buildings can’t be moved to improve site lines, guidelines for plantings and other landscape elements should be revised to allow for improved site distance.
Table 3-6: Summary of West Bay Drive/SR 686 Counter Measures
Challenge Counter Measures
Bicycle Riding against traffic on the sidewalk Horizontal signage at driveways/Education
Poor lighting conditions Improve conditions per PPM standards and FHWA Informational Report on Lighting Design for Midblock Crosswalks
Pedestrian Crossing mid-block or at uncontrolled intersections Education for pedestrian and driver about safe
crossing and yielding
Crossing mid-block to access transit Pedestrian Origins and Destinations study at high-volume bus stops to identify opportunities for enhanced mid-block crossings and/or modify transit stop locations

35 | Page Bicycle and Pedestrian Master Plan - Crash Data Report
Fort Harrison Avenue: Belleair Road to Drew Street
The Belleair Road to Drew Street section of Fort Harrison Avenue is 2.11 miles and under the jurisdiction of the City of Clearwater. It also lies within the City’s municipal boundaries except for the area on the west side of the road including and south of the Belleview Biltmore Golf and Country Club, which is within the City of Belleair. Fort Harrison Avenue is a two-lane divided facility with a center turn lane with the exception of the segment south of Belleview Road where it
converts to a three/four-lane undivided road. The speed limit is 40 mph from Belleair Road to Jeffords Street and 30 mph from Jeffords Street to Drew Street. The road carries 16,081 vehicle trips per day and operates at LOS F. There is full sidewalk coverage on both sides of the street along the entire corridor. From Jeffords Street to Belleview Boulevard there is only a bicycle lane on the northbound side. There are bicycle lanes on both sides of Fort Harrison Avenue from Jeffords Street to Court Street. The Pinellas Trail parallels the corridor to the west from Belleair Road to Belleview Road. It crosses the street at the Belleview intersection and follows the sidewalk on the east side of Fort Harrison Avenue for two blocks before veering to the east as an off-road asphalt facility and then extending north parallel to Fort Harrison Avenue. Motorists entering Clearwater using Fort Harrison Avenue see an ENTERING HIGH PEDESTRIAN
AREA sign that alerts drivers to increased pedestrian activity in the downtown area. Adjacent land uses from Drew Street to Chestnut Street include a mix of commercial/retail as well as the Peace Memorial Presbyterian Church, Fort Harrison Hotel, government service buildings, the original County Courthouse and a Publix anchored shopping center. Located one-half block to the west on Court Street, is the main County Courthouse and the Clearwater Public Library and Harborview Center are located a block to the west on Osceola Street. One block to the east of this segment is PSTA’s Park Street Terminal. Adjacent land uses on the Chestnut Street to Belleair Road section include commercial/retail, office and residential. The Morton Plant Hospital complex and the Belleview Biltmore Golf and Country Club are also located along the corridor. Fort Harrison Avenue is served by PSTA routes 66, 98 and 52. The Park Street Terminal is a major hub for the system serving 12 routes including the Beach Trolley and the Jolley Trolley. The Beach Trolley serves Gulf Boulevard passengers from Clearwater Beach to St. Petersburg Beach and the Jolley Trolley transports passengers between downtown Clearwater and Clearwater Beach.
36 | Page Bicycle and Pedestrian Master Plan - Crash Data Report
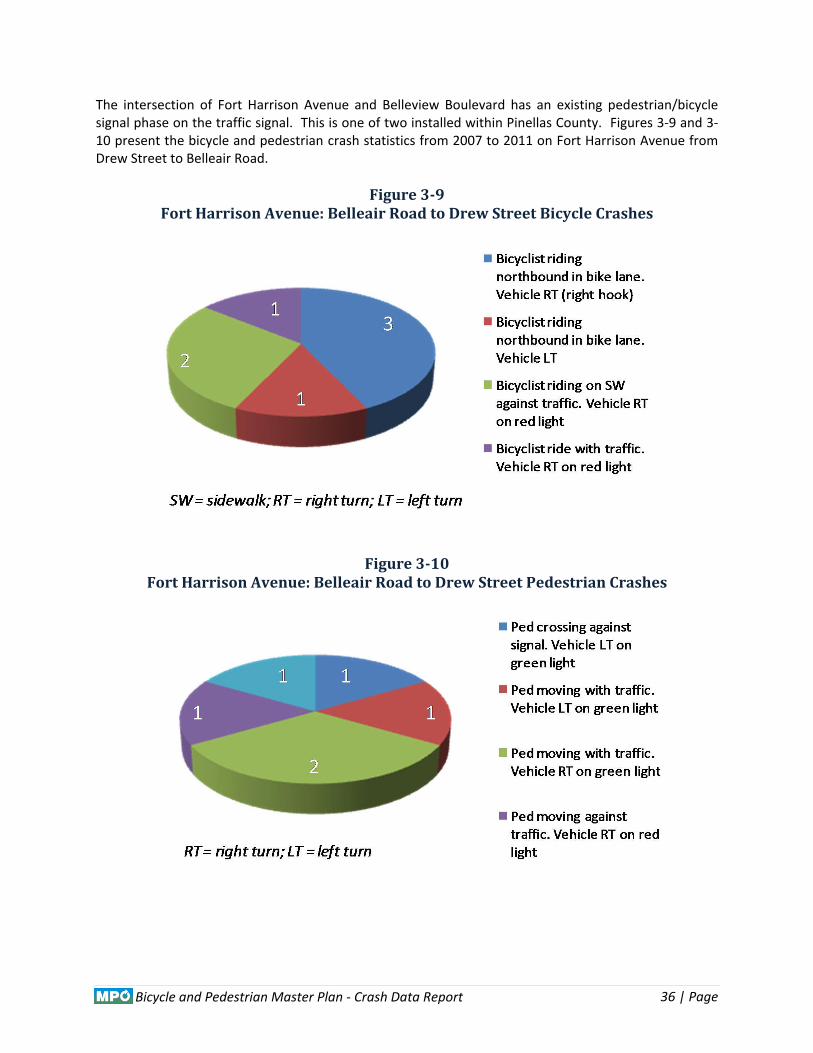
The intersection of Fort Harrison Avenue and Belleview Boulevard has an existing pedestrian/bicycle signal phase on the traffic signal. This is one of two installed within Pinellas County. Figures 3-9 and 3-10 present the bicycle and pedestrian crash statistics from 2007 to 2011 on Fort Harrison Avenue from Drew Street to Belleair Road.
Figure 3-9 Fort Harrison Avenue: Belleair Road to Drew Street Bicycle Crashes
Figure 3-10
Fort Harrison Avenue: Belleair Road to Drew Street Pedestrian Crashes

37 | Page Bicycle and Pedestrian Master Plan - Crash Data Report
Table 3-7: Bicycle and Pedestrian Involved Crashes along Fort Harrison Avenue
Bike Ped Time of Day
Bike Ped Severity
0 0 Dusk 0 1 Fatal
9 7 Daylight 1 1 Incapacitating
0 0 Dawn 4 1 Non-incapacitating
0 1 Dark, not lighted 3 5 Possible injury
2 5 Dark, lighted 3 5 Non-injury* * If no injury noted in the crash report, it was assumed to be non-injury.
Recommended Counter Measures One unique feature of this corridor is the marked bicycle lane. Perhaps coincidently there were a higher number of right-hook crashes along this roadway. It is noteworthy that there were three right-hook crashes and one crash where the motorist was turning left and hit a bicyclist who was travelling northbound with traffic in the bicycle lane. In most of these cases, the vehicle driver didn’t realize how quickly the bicyclist was approaching from behind. In the case of the left turning motorist, there was no comment about the visibility of the bicyclist but the same issue may have been a factor. The position of the bicycle lane relative to the travel lane means, by design, turning vehicles will have to cross the bicycle lane. It is the responsibility of the driver to make the right turn from as close as practical to the right most curb; where a bike lane is present, this means crossing the bike lane. The skip dash stripping preceding a signalized intersection should alert the driver to this condition and in the case of the right-hook crash, the vehicle isn’t in the appropriate position on the roadway. The improper roadway position can be enforced by police. This inherent vulnerability also means that bicycle riders must stay alert at driveways and intersections to the possibility of turning motorists. An education campaign that stresses sharing the road or the presence of bicyclists may help heighten the awareness.
Pedestrians and particularly bicyclists need to be educated to the dangers inherent in riding on the sidewalk against traffic and the need to follow traffic signals. Particularly where there is a bicycle lane, vehicle drivers need to be educated about proper right turning procedures. Additional education campaigns to alert drivers to bicyclists and pedestrians on the sidewalk, particularly travelling against traffic should be developed.
One of the crashes noted in Table 3-7 occurred at the intersection of Fort Harrison Avenue and Belleview Road. It involved a vehicle entering the bicycle lane. At this intersection the lanes shift to the left and a bike lane begins. Although signage prior to the intersection alerts motorists to the beginning of a bicycle lane, the field visit revealed that many motorists drive in the bike lane before moving to the left into the travel lane. Additional lane stripping is recommended to guide drivers across the intersection into the vehicle travel lanes.
Install additional wayfinding signage guiding bicycle riders to the nearby Pinellas Trail.
The right and left turn on green crashes reported occurred at Court Street and Pinellas Street. In all cases, the motor vehicle violated the pedestrian right-of-way, as the pedestrian was crossing with the WALK signal. As recommended along 4th Street, timing the signals with an LPI giving the pedestrian a head start at the intersection is recommended.

38 | Page Bicycle and Pedestrian Master Plan - Crash Data Report
Installing raised medians in place of the center turn lane should also be considered where balance between safety and vehicle access needs can be achieved. Raised medians have been shown to reduce vehicle crashes while enhancing pedestrian safety.
Table 3-8: Summary of Fort Harrison Avenue Counter Measures
Challenge Counter Measures
Bicycle Riding against traffic on the sidewalk Horizontal signage at driveways/Education
Right-hook crashes Signage, education
Pedestrian Right or left turns on green crashes Signal timing: LPI
Crossing against signal Education
Pedestrians getting caught in turn lane waiting for a gap in traffic
Raised median islands (where balance between safety and vehicle access can be achieved)

39 | Page Bicycle and Pedestrian Master Plan - Crash Data Report
Seminole Boulevard: Bay Pines Boulevard to Ulmerton Road This section of Seminole Boulevard is 5.3-miles and traverses the cities of Seminole and Largo as well as unincorporated Pinellas County. The entire facility is under FDOT jurisdiction as State Road 595/Alternate US 19. The road has six lanes and single left turn lanes at the signalized intersections and channelized medians. The facility carries 31,500 vehicles per day between Bay Pines Boulevard and Park Boulevard and between 33,000 and 37,000 on the remaining sections. The road operates near free flow conditions, LOS B/C, during peak hour periods. The speed limit is 45 mph. There is full sidewalk coverage on both sides and there are no bicycle lanes. Multiple sidewalk obstructions (e.g., utility poles, benches, etc.) and potentially improperly designed curb ramps exist on either side of the corridor. The Pinellas Trail intersects Seminole Boulevard via an overpass south of Park Boulevard. Regarding transit use, the corridor is served by PSTA’s Route 18, which carried over 1.3 million passengers in 2010/11. This was the second highest number of passengers of all routes in the system for that year. Adjacent land uses include general commercial/retail, professional and medical offices, mobile home parks, mini storage facilities and single and multi-family residential. With the exception of the intersection areas and the east side of the section between 102nd Avenue and Park Boulevard, the frontage properties are abutted by low density residential land uses. As with the other corridors, the review of the crash reports and the field inspections revealed a large number of sidewalk bicycle riders, both with and against traffic. Figures 3-11 and 3-12 present the bicycle and pedestrian crash statistics for Seminole Boulevard, Bay Pines Boulevard to Ulmerton Road, from 2007 to 2011.

40 | Page Bicycle and Pedestrian Master Plan - Crash Data Report
Figure 3-11 Seminole Boulevard: Bay Pines Boulevard to Ulmerton Road Bicycle Crashes
Figure 3-12 Seminole Boulevard: Bay Pines Boulevard to Ulmerton Road Pedestrian Crashes

41 | Page Bicycle and Pedestrian Master Plan - Crash Data Report
Table 3-9: Bicycle and Pedestrian Involved Crashes along Seminole Boulevard
Bike Ped Time of Day
Bike Ped Severity
1 0 Dusk 1 4 Fatal
38 26 Daylight 3 9 Incapacitating
1 1 Dawn 16 13 Non-incapacitating
1 4 Dark, not lighted 10 6 Possible injury
5 13 Dark, lighted 16 12 Non-injury* * If no injury noted in the crash report, it was assumed to be non-injury.
Recommended Counter Measures
Horizontal signage at driveways and a poster educational campaign are recommended to address the right turn from stop crashes.
Review lighting along this corridor. A number of the mid-block and uncontrolled intersection crashes may be attributed to poor lighting conditions. Lighting the roadway and sidewalks to FDOT PPM standards and FHWA Informational Report on Lighting Design for Midblock Crosswalks may help nighttime drivers identify crossing pedestrians and help crossing pedestrians better identify safe gaps in traffic. Two of the fatal pedestrian crashes were mid-block in dark-lighted conditions suggesting that improved roadway lighting could have helped the pedestrian and the driver see each other better.
Pedestrians and particularly bicyclists need to be educated to the dangers inherent in travelling on the sidewalk against traffic and the need to follow traffic signals. Motorist education should include awareness of the presence of bicyclists on sidewalks and to remind them of their obligation to stop before crossing a sidewalk to enter the roadway.
Review sidewalk design and construction standards in the Florida Greenbook and American Association of State Highway and Transportation Officials (AASHTO) Pedestrian Guide, as well as Americans with Disabilities Act Accessibility Guidelines (ADAAG) for compliance on mitigating visual shields.
54th Avenue: Extend islands, pull back crosswalks on right turn slip lanes. This places crossing pedestrians in a more visible position relative to turning motorists.
Park Boulevard: Sign on southwest corner, extend walk signal time crossing Seminole Boulevard. The green time provided to Park Boulevard at this intersection far exceeds the WALK/Flashing DON’T WALK time.
102nd Avenue: Replace static sign with NO RIGHT TURN ON RED blank out sign on the southbound approach that is either timed to match the school zone timing or is activated when a pedestrian requests the signal.

42 | Page Bicycle and Pedestrian Master Plan - Crash Data Report
Table 3-10: Summary of Seminole Boulevard Counter Measures
Challenge Counter Measures
Bicycle Riding against traffic on the sidewalk Horizontal signage at driveways/Education
targeted at the bicyclist, but message appropriate for motorists
Pedestrian Poor lighting conditions Improve conditions per FDOT PPM standards and
FHWA Informational Report on Lighting Design for Midblock Crosswalks
Crossing between signals Pedestrian origins and destination study to identify high visibility crossing treatment opportunities; close coordination with PSTA to assess pedestrian access to transit stops
Increasing visibility of pedestrians crossing 54th Avenue relative to turning motorists
Extend islands, pull back crosswalks on right turn slip lanes
Green time provided to Park Boulevard far exceeds the WALK/Flashing DON’T WALK time
Sign on southwest corner, extend walk signal time crossing Seminole Boulevard
Improve crossing conditions at 102nd Avenue Replace static sign with NO RIGHT TURN ON RED blank out sign on the southbound approach that is either timed to match the school zone timing or is activated when a pedestrian requests the signal

43 | Page Bicycle and Pedestrian Master Plan - Crash Data Report
Tampa Road: Orange Street to Race Track Road Tampa Road is an 8.5-mile segment that is within unincorporated Pinellas County between Orange Street and East Lake Road. The north side of the road between East Lake Road and Forest Lakes Boulevard is mostly unincorporated County and the remaining land area between East Lake Road and Race Track Road is within the City of Oldsmar. It is a County jurisdictional facility between Orange Street and Curlew Road and an FDOT facility east of Curlew Road. The road includes two, four, six and eight lane sections. Dual left turn lanes exist at the intersections of US 19, East Lake Road, Curlew Road, Forest Lakes Boulevard, State 580 and Race Track Road. The sections east of Alternate US 19 have channelized medians. The speed limit is 25 mph between Orange Street and Alternate US 19, 40 mph between Alternate US 19 and US 19 and 45 mph from US 19 to Race Track Road. The table below provides further information on the corridor regarding lane configuration, traffic volumes, level of service and adjacent land use activity.
Segment Lane Cnfg.
Avg. Daily Trips
Peak Hour LOS
Land Use
Orange St to Alt. US 19
2L undivided No data available
No data available
Single family, RV park, Ozona Elementary School, multi-family, industrial uses. The Palm Harbor Post Office is located north of the corridor on Alt. US 19.
Alt. U S 19 to US 19 4L divivded 21,787 C Single family, general commercial/retail at intersections including Sweetbay Supermarket, churches, office, retirement home, Palm Harbor Middle School, preschool, and car dealership. Palm Harbor Elementary School is located north of the corridor on 15th Street.
US 19 to East Lake Rd 6L divivded 38,304 D Single family, general commercial/retail at intersections including Shoppes at Clover Place and the Shoppes of Boot Ranch, medical offices, professional offices, HCA ManorCare health and Morton Plant Mease Healthcare and assisted living facilities
East Lake Road to Curlew Road
6L divivded 38,818 B General commercial/retail including East Lake Woodlands Plaza, Woodlands Square, Canal Park Sports Complex, golf course, condominiums
Curlew Road to SR 580
6L divivded 54,500 F General commercial/retail including Forest Lakes Shopping Center, industrial uses including Lockheed Martin Tactical, car dealership, Oldsmar Post Office, apartments, Walmart Super Center. Oldsmar Elementary School and Oldsmar Senior Center are located south of the corridor along SR 580
SR 580 to Race Track Rd
8L divivded 51,077 C General commercial/retail, office, industrial, Oldsmar Flea Market, hotels. Oldsmar City Hall is located to the south
Route 67 is the only transit service provided on the corridor albeit only in the Oldsmar area. The route carried 162,851 riders in 2010/11, less than one-half of the average for the system. There is full

44 | Page Bicycle and Pedestrian Master Plan - Crash Data Report
sidewalk coverage on both sides of the road, with a gap on the north side between Orange Street and Alternate US 19. Bicycle lanes exist from Alternate US 19 to McMullen Booth Road. As with the other corridors, the review of the crash reports and the field inspections revealed a large number of sidewalk bicycle riders, both with and against traffic. The high vehicle speeds and traffic volumes are likely a deterrent from bicycling on the road although there are bicycle lanes on most of the corridor. Figure 3-13 illustrates the bicycle crash statistics for Tampa Road, Orange Street to Race Track Road, from 2007 to 2011. Only two pedestrian crashes were reported on the corridor. Both involved a vehicle making a right turn from a stop and a pedestrian walking against traffic. One of the crashes may have been partially caused by line-of-sight obstruction.

45 | Page Bicycle and Pedestrian Master Plan - Crash Data Report
Figure 3-13 Tampa Road: Orange Street to Race Track Road Bicycle Crashes
Table 3-11: Bicycle and Pedestrian Involved Crashes along Tampa Road
Bike Ped Time of Day
Bike Ped Severity
2 0 Dusk 0 4 Fatal
43 10 Daylight 8 5 Incapacitating
1 0 Dawn 22 1 Non-incapacitating
1 2 Dark, not lighted 11 4 Possible injury
6 4 Dark, lighted 12 2 Non-injury* * If no injury noted in the crash report, it was assumed to be non-injury.
Recommended Counter Measures
Horizontal signage at driveways and a poster educational campaign are recommended to address right turn from stop crashes.
Review lighting along this corridor. A number of the mid-block and uncontrolled intersection crashes may be attributed to poor lighting conditions. Lighting the roadway and sidewalks to FDOT PPM standards and FHWA Informational Report on Lighting Design for Midblock Crosswalks may help nighttime drivers identify crossing pedestrians and help crossing pedestrians better identify gaps in traffic that present an opportunity to safely cross the road. Two of the fatal pedestrian crashes occurred mid-block with lighting conditions noted as “dark-not lighted” and a third one noted “dark-lighted conditions” suggesting that the lighting along this corridor should be further analyzed.
Pedestrians and particularly bicyclists need to be educated to the dangers inherent in riding on the sidewalk against traffic and the need to follow traffic signals. Motorist education

46 | Page Bicycle and Pedestrian Master Plan - Crash Data Report
should include reminders to look right when exiting driveways and to stop before crossing the sidewalk to enter the roadway.
Review US 19 and Tampa Road intersection for possible improvements, such as channelization, as discussed in the earlier section of general counter measures.
Table 3-12: Summary of Tampa Road Counter Measures
Challenge Counter Measures
Bicycle
Riding against traffic on the sidewalk Horizontal signage at driveways/Education
Pedestrian Poor lighting conditions Improve conditions per PPM standards and FHWA
Informational Report on Lighting Design for Midblock Crosswalks
Crossing between signals Pedestrian origins and destination study to identify high visibility crossing treatment opportunities

47 | Page Bicycle and Pedestrian Master Plan - Crash Data Report
Gulf to Bay Boulevard Intersections (Belcher Road, Old Coachman Road, US 19, and Park Place Boulevard) This section of Gulf-To-Bay Boulevard is an FDOT jurisdictional facility within the City of Clearwater. It is a six lane divided road with single left turn lanes at the Belcher Road, Old Coachman Road, US 19 and Park Place Boulevard intersections. The road carries 52,000 vehicles per day and operates at peak hour LOS E between Belcher Road and US 19. The section east of US 19 carries 59,500 vehicles per day and operates under LOS F conditions. These LOS grades represent severely congested conditions. The posted speed ranges from 40 mph to 45 mph. Gulf-to-Bay Boulevard serves PSTA Route 60 and the Hillsborough Area Regional Transit (HART) Route 200x, which transports passengers between the two counties. Ridership on Route 60 in 2010/11 was 551,615, which exceeds the average for the system. There is complete sidewalk coverage on both sides of Gulf-To-Bay Boulevard. There are no bicycle facilities. Adjacent land uses along this section of the corridor are heavily commercial and include the Clearwater Mall, Sam’s Club, Holiday Inn Express, Home Depot, Gulf-To-Bay Plaza, an Albertson’s Supermarket and a planned Walmart at the nodes of the aforementioned intersections. The Progress Energy Trail intersects the corridor near Old Coachman Road. The Belcher Road, Old Coachman Road, US 19, and Park Place Boulevard intersections are locations where crashes occurring on the corridor are concentrated. A review of the crash reports and field visits suggested that while there are no specific trends associated with the crashes, the right turn from stop crash is a particular challenge here as it is on other major corridors in the County, mainly due to the high number of driveways. Recommended Counter Measures
At Gulf to Bay Boulevard and Belcher Road there is a visual screen at the southeast corner that may be a factor in the crashes with pedestrians and/or bicyclists on the sidewalk. A potential conflict arises particularly for north bound motorists on Belcher Road turning right on red. The utility box and pole and the vegetation create a screen from certain angles. Accounting for the speed at which bicyclists may be travelling on the sidewalk and the driver’s focus on looking for a gap in traffic to turn, negotiating this corner could be challenging for motorists as well as bicyclists, although this recommendation would improve the safety of pedestrians as well.
In order to minimize the opportunity for a pedestrian or bicyclist to be struck while crossing Gulf to Bay Boulevard by a left turning motorist, it is recommended that the signal timing be reviewed and the permissive left on green be replaced with a left on the green arrow only for Gulf-To-Bay Boulevard traffic.
At the Old Coachman Road and Gulf to Bay Boulevard intersection there were two right turn after stop crashes where the driver hit the bicyclist who was travelling against traffic on the

48 | Page Bicycle and Pedestrian Master Plan - Crash Data Report
sidewalk; a right turn on red crash and one crash where the bicyclist was crossing in the crosswalk against the DON’T WALK signal. Adding horizontal signage along sidewalk as noted on the other corridors would help address this.
At Gulf to Bay Boulevard and Park Place Boulevard, add crosswalk on west approach.
Table 3-13: Summary of Gulf to Bay Boulevard Intersection Counter Measures
Intersection Challenge Counter Measures
Belcher Road Visual screen (looking northeast); permissive green and walk signal timing
Landscape maintenance
Gulf to Bay Boulevard Pedestrians/bicyclists crossing Gulf to Bay Boulevard
Review signal timing and replace permissive left on green with a left on green arrow only for Gulf-To-Bay Boulevard traffic
Old Coachman Road Right turn from stop at driveways
Horizontal signage at driveways/education
US 19 Speeding motorists Review signal timing; reduce entrance and exit ramp turning radii
Park Place Boulevard No crosswalk on west approach
Install crosswalk

49 | Page Bicycle and Pedestrian Master Plan - Crash Data Report
34th Street (US 19) Intersections (70th Avenue, 62nd Avenue, 22nd Avenue North, 5th
Avenue North) The section of 34th Street from 70th Avenue to 62nd Avenue is within the City of Pinellas Park and the section between 22nd Avenue North and 5th Avenue North is within the City of St. Petersburg. The FDOT jurisdictional facility is part of US 19, which traverses the length of the County. It is a six-lane divided facility with single left turn lanes at the signalized intersections and channelized medians. The road carries 42,250 vehicles daily between Gandy Boulevard and 54th Avenue North, which includes the intersections of 70th Avenue and 62nd Avenue. This section operates at peak hour LOS D. The section between 22nd Avenue North and 5th Avenue North carries 34,500 vehicles per day and operates under peak hour LOS C conditions. Peak hour LOS C and D are within local LOS standards. The posted speed for the corridor ranges from 40 mph to 45 mph. The corridor is served by PSTA Route 19. With total ridership over 1.5 million in 2010/11, Route 19 carries the most passengers of any in PSTA’s fixed route system. There is complete sidewalk coverage on both sides of the road and there are no bicycle lanes. The adjacent land uses along the 70th Avenue to 62nd Avenue section include commercial/retail, public storage and industrial. The Shoppes at Park Place and a Walmart Neighborhood Market are among the adjacent uses in this section. Adjacent land uses along the section between 22nd Avenue North and 5th Avenue North include hotels, commercial/retail, industrial and an auto dealership. A Sweetbay Supermarket and the Times Publishing Company facility is located along this section of the corridor. The intersections of 70th Avenue, 62nd Avenue, 22nd Avenue North, and 5th Avenue North are locations where crashes on the corridor are concentrated. A review of the crash reports and field visits suggested that while there are no specific trends, the right turn from stop crash is a common crash scenario, mainly due to the high number of driveways. Recommended Counter Measures
There were eight permissive left crashes in which the pedestrian or bicyclist was crossing in the crosswalk on a WALK signal. This was also a problem along Seminole Boulevard, particularly in areas of higher pedestrian activity. The roadway configuration along this corridor is the typical six lane plus turn lanes and a permissive green allows left turning vehicles to turn when they find a sufficient gap in oncoming traffic. This requires that the drivers pay attention to both the crosswalk and three lanes of on-coming traffic and the end result is frequently a crash. To minimize this opportunity for crashes and simplify the turn movement, installation of a protected left turn arrow may be considered although it is recognized that this would likely be precluded by the relatively short length of the turn

50 | Page Bicycle and Pedestrian Master Plan - Crash Data Report
lanes. It is also understood that a flashing yellow arrow would need to be tried before installation of a protected left turn arrow. Installation of YIELD TO PEDESTRIAN blank out signs may be a more practical option in this situation.
Review lighting along this corridor. A number of the mid-block and uncontrolled intersection crashes may be attributed to poor lighting conditions. Lighting the roadway and sidewalks to FDOT PPM standards and in accordance with the Federal Highway Administration’s 2008 publication, Informational Report on Lighting Design for Midblock Crosswalks may help nighttime drivers identify crossing pedestrians while helping pedestrians identify gaps in traffic allowing them to cross the road safely.
There were six right turn on red crashes at various intersections along 34th Street, including two at 62nd Avenue, in which the pedestrian was walking against traffic. A NO RIGHT ON RED blank out sign that is active when the pedestrian requests a WALK signal is recommended.
Horizontal signage at driveways and a poster educational campaign are recommended to address the right turn from stop crashes.
Install high visibility crosswalks at intersections along the corridor including 70th Avenue and 22nd Avenue.
Remove the acceleration lane northbound 34th Street at 70th Avenue and install high visibility crosswalks at that intersection. Confirm with the installation of pedestrian signal that right turn is now signal controlled.
Pedestrians and particularly bicyclists need to be educated about the importance of following traffic signals and about the second, and in many cases the third, threat dangers of crossing mid-block. Mid-block crossing is a challenge in all of the corridors given the roadway configuration. But it becomes more problematic on a facility like 34th Street, which has six lanes, carries a high volume of traffic and where motorists frequently move in and out of the many commercial driveways located along the corridor. While the first vehicle may see a pedestrian or bicyclist crossing, often times, the next driver does not or cannot see the pedestrian or bicyclist because he or she is blocked from view by the vehicle that is stopped for the crossing individual. Unsignalized mid-block crossings are better at addressing this circumstance than having no crosswalk, but both situations depend on the pedestrian or bicyclist being seen by all lanes of traffic. Sufficient lighting may help mitigate the night time crash dangers by allowing motorists and bicyclists/pedestrians to see each other and act accordingly. Enhanced mid-block crossings that include a signal can address this issue with a preceding stop bar that lets drivers know where to stop when the signal is activated. The Federal Highway Administration’s Course on Bicycle and Pedestrian Transportation: Mid Block Crossings suggests pavement word symbols, large overhead signs, flashing beacons, bulb-outs, and flashing overhead signs as tools to consider for enhanced mid-block crossings. An RRFB may also be considered subject to review by the City of St. Petersburg and FDOT.

51 | Page Bicycle and Pedestrian Master Plan - Crash Data Report
Table 3-14: Summary of 34th Street Intersection Counter Measures
Location Challenge Counter Measures
70th Avenue, 62nd Avenue, 22nd Avenue North, 5th Avenue North
Permissive left increase chances of crashes involving pedestrian on crosswalk
Install YIELD TO PEDESTRIAN blank out signs
Along corridor Poor lighting conditions. Crossing mid-block, against signals
Improve conditions per PPM standards and FHWA Informational Report on Lighting Design for Midblock Crosswalks. Education; Pedestrian Origins and Destination study to identify high visibility crossing treatment opportunities
Along corridor, particularly 62nd Avenue
Right turning motorist hits pedestrian in crosswalk
Install NO RIGHT TURN ON RED blank out signs
Along corridor, particularly at 22nd, 70th 71st and 72nd
Avenues
Better pedestrian visibility Install high visibility crosswalks
70th Avenue No crosswalk; Wide crossing includes acceleration lane for northbound motorists creates high speed situation; painted islands provide no pedestrian refuge
Install signalized crossing; remove acceleration lane, which will reduce crossing time; add crosswalk on north side of intersection; southbound right needs to be signalized

52 | Page Bicycle and Pedestrian Master Plan - Crash Data Report
Summary Recommendations The most common development pattern along the study corridors tends to be commercial and retail, occasionally grouped in strip malls, but frequently with each on its own site. This style of development is noteworthy because it tends to include a lot of curb cuts for driveways that are conflict points for bicycle or pedestrian traffic and motor vehicles. Common characteristics of the roadways themselves also tend to be 30 mph to 45 mph speed limits, minimum four travel lanes with frequent separation by one or two left-turn lanes. Crossing opportunities are concentrated at signalized intersections, at minimum half-mile intervals. As stated previously, the most common crash type in Pinellas County involved the pedestrian or bicyclist travelling against traffic on the sidewalk being hit as the motorist turns right on red or from a stop sign at a driveway. The optimum condition for alleviating this type of crash would be one where the driver stops, as legally required, in advance of the sidewalk then sees that it is all clear before pulling head into a buffer “staging” area and making the turn. This separation of facilities allows the potential conflicts to be separated into individual movements. For example, the driver yielding to the bicyclist crossing the driveway is one movement; the vehicle turning right is another. By separating the two, the opportunity for the crash is reduced, as the driver is able to identify any conflicts at the first point and address them before proceeding to the next one. For most existing urban and suburban roadways, this buffer configuration is not possible due to lack of right-of-way. In addition, the Florida Greenbook only stipulates a five-foot sidewalk and buffer or a six-foot sidewalk from back of curb. Therefore, given the existing conditions and guidance, one of the most effective approaches to avoiding these conflicts is to alert bicyclists and pedestrians to the dangers of this situation. This approach may include any of the following:
Horizontal signage at driveways;
Public information campaign to heighten awareness; and
Enforcement. The graphic at right is an example of horizontal signage that could be placed at driveways to alert bicyclists and walkers to the dangers of drivers turning right. Signage like this is being recommended to mitigate similar crashes in Hillsborough County. It should be noted that the LOOK FOR TURNING VEHICLES horizontal signs will require MUTCD approval to begin use on a trial basis. An education campaign including flyers or advertising on bus shelters and/or benches may also be an effective way to educate bicyclists that they are riding in a position that is not safe and to be aware of the potential for such conflicts. This sort of campaign will also help remind drivers to be aware of bicyclists riding on the sidewalk and to look right. A stop bar can be installed at the edge of the sidewalk to remind motorists to stop before entering the roadway but this should be done in tandem with an education campaign because simply stopping at a stop bar is not enough to remind them to look for biyclists on the sidewalk. Motorists, by law, must yield to traffic on the sidewalk prior to crossing it. An enforcement campaign, possibly a sting operation, could
Horizontal signage concept

53 | Page Bicycle and Pedestrian Master Plan - Crash Data Report
be developed to address the motorists’ failure to yield to sidewalk traffic. Motorists could at least be cited for this violation by law enforcement officers when this type of crash occurs. Vehicle speed and the number of travel lanes have been proven to have an impact on the severity of crashes with pedestrians and bicyclists. Pinellas County, like much of Florida, has been developed with an extensive network of collector and arterial roadways. This configuration benefits drivers at a tremendous cost to other modes. While lowering the speed limit may not be a feasible option, finding other ways to facilitate slower driving speeds will benefit the residents that live nearby or adjacent to these high-speed corridors. Timing the traffic signals in such a way that speed is “managed” to the speed limit or to 85 percent of the speed limit with signage alerting motorists to the benefit of driving at a certain speed, perhaps using SIGNALS TIMED FOR XX MPH signs, could serve to reduce vehicle crashes, as well as pedestrian and bicycle crashes.
While sidewalk coverage along the studied corridors was in most cases 100 percent, designated bicycle facilities were rare. Four-foot bicycle lanes should be included in each direction on all roadways where there is room to do so. Often, travel and two-way left-turn lanes can be reduced to 11 feet to allow for the restriping of the roadway to include a bicycle lane. Shared lane markings (SLMs) to help correctly position the cyclist on the roadway should be installed in situations where there is insufficient lane width for bicycle lanes and where traffic conditions are conducive to safe bicycle travel (e.g., speed limit 35 mph or less, absence of frequent curb cuts/driveways). A study being conducted by FDOT and scheduled for completion in 2013 may provide insight into using SLMs on higher speed roadways. If a bicycling lane terminates because there is no longer room and SLMs are not installed, SHARE THE ROAD signs may be considered. Improved pedestrian access to transit stops should also be pursued in coordination with PSTA.
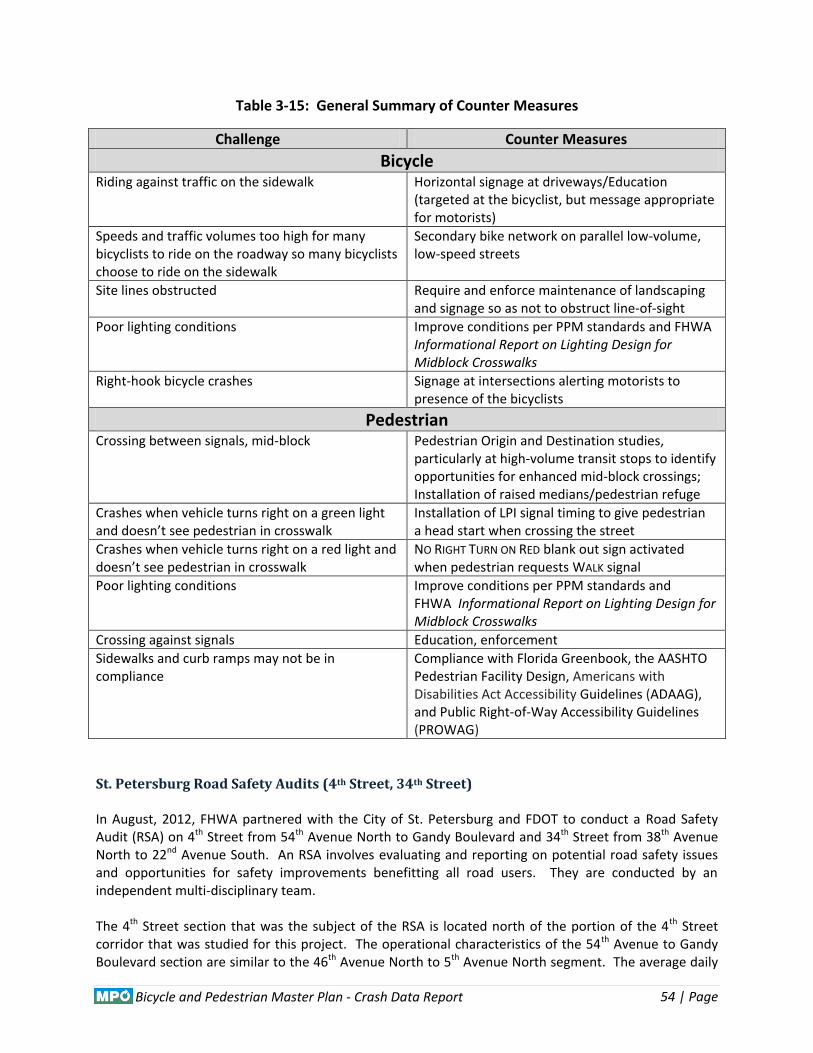
54 | Page Bicycle and Pedestrian Master Plan - Crash Data Report
Table 3-15: General Summary of Counter Measures
St. Petersburg Road Safety Audits (4th Street, 34th Street) In August, 2012, FHWA partnered with the City of St. Petersburg and FDOT to conduct a Road Safety Audit (RSA) on 4th Street from 54th Avenue North to Gandy Boulevard and 34th Street from 38th Avenue North to 22nd Avenue South. An RSA involves evaluating and reporting on potential road safety issues and opportunities for safety improvements benefitting all road users. They are conducted by an independent multi-disciplinary team. The 4th Street section that was the subject of the RSA is located north of the portion of the 4th Street corridor that was studied for this project. The operational characteristics of the 54th Avenue to Gandy Boulevard section are similar to the 46th Avenue North to 5th Avenue North segment. The average daily
Challenge Counter Measures
Bicycle
Riding against traffic on the sidewalk Horizontal signage at driveways/Education (targeted at the bicyclist, but message appropriate for motorists)
Speeds and traffic volumes too high for many bicyclists to ride on the roadway so many bicyclists choose to ride on the sidewalk
Secondary bike network on parallel low-volume, low-speed streets
Site lines obstructed Require and enforce maintenance of landscaping and signage so as not to obstruct line-of-sight
Poor lighting conditions Improve conditions per PPM standards and FHWA Informational Report on Lighting Design for Midblock Crosswalks
Right-hook bicycle crashes Signage at intersections alerting motorists to presence of the bicyclists
Pedestrian
Crossing between signals, mid-block Pedestrian Origin and Destination studies, particularly at high-volume transit stops to identify opportunities for enhanced mid-block crossings; Installation of raised medians/pedestrian refuge
Crashes when vehicle turns right on a green light and doesn’t see pedestrian in crosswalk
Installation of LPI signal timing to give pedestrian a head start when crossing the street
Crashes when vehicle turns right on a red light and doesn’t see pedestrian in crosswalk
NO RIGHT TURN ON RED blank out sign activated when pedestrian requests WALK signal
Poor lighting conditions Improve conditions per PPM standards and FHWA Informational Report on Lighting Design for Midblock Crosswalks
Crossing against signals Education, enforcement
Sidewalks and curb ramps may not be in compliance
Compliance with Florida Greenbook, the AASHTO Pedestrian Facility Design, Americans with Disabilities Act Accessibility Guidelines (ADAAG), and Public Right-of-Way Accessibility Guidelines (PROWAG)
55 | Page Bicycle and Pedestrian Master Plan - Crash Data Report
traffic is 35,000, posted speeds are 35-45 miles per hour and the land uses fronting the road are largely commercial/retail. The 34th Street section of the RSA overlaps a portion of the corridor that was studied for this project. The RSA section that does not overlap is from 5th Avenue North to 22nd Avenue South. There are 37,000 vehicles per day travelling between 5th Avenue North and Central Avenue, which operates at peak hour LOS D, and 28,500 vehicles per day travelling between Central Avenue and 22nd Avenue South, which operates at peak hour LOS C. Posted speeds are 35-45 miles per hour and the land uses fronting the road are also primarily commercial/retail. The 4th Street and 34th Street RSAs revealed similar crash trends as those raised in this report. A disproportionate number of crashes involved pedestrians and bicyclists on sidewalks, particularly those moving against traffic, being struck by a driver pulling out of a driveway or side street. The RSA corridors also do not have bicycle lanes or shoulders to accommodate bicyclists, thereby causing most of them to travel on the sidewalk. The RSAs indicated a need for increased enforcement of bicycle and pedestrian signal compliance at intersections, vehicle speeds, and yield requirements. Education measures identified included posting placards on stop signs and distribution of print materials and coordination with various safety campaigns and initiatives to discourage wrong-way bicycling on sidewalks. The RSA also called for improved lighting at intersection quadrants, median modifications, tree trimming, and crosswalk markings on side street approaches.
In addition, the RSAs indicated a disproportionate number of crashes occurring at mid-block and unsignalized intersections. Sixty and 70 percent of the crashes on 34th Street and 4th Street, respectively, occurred at unsignalized intersections. Various treatments were recommended on 4th and 34th Street to address this situation. On 4th Street, improvements and modifications were recommended at the intersections of 62nd Avenue, 73rd Avenue, 74th Avenue, Koger Boulevard and Gandy Boulevard. These included installation of crosswalks and stop bars; curb modifications to increase the radius of right turn movements; elimination of an acceleration lane; closing and modifying median islands to provide pass through and refuge space for pedestrians; replacement of a striped median with a raised one; creation of a pedestrian zone with warning signs, flashing beacons and speed feedback signs; and changing lane markings and intersection geometry. On 34th Street, the RSA recommended modifications to the intersections of 8th Avenue South, 1st Avenue North, Central Avenue and 1st Avenue South. These included intersection modifications involving the installation of a traffic signal and turn lanes, removing and extending left turn lanes; installing a stop bar; improving crosswalks; relocating bus stops; extending an existing sidewalk; consideration of constructing crosswalks with pedestrian pass through/refuge area in the median; and constructing bulb outs at an intersection to increase the radius for turning movements.

56 | Page Bicycle and Pedestrian Master Plan - Crash Data Report
Pedestrian Safety Action Plan
The Pinellas County Pedestrian Safety Action Plan was published in 2009 for the purpose of helping local governments address pedestrian crash issues specific to their jurisdictions with a proven set of tools and strategies. The Plan was developed by FDOT in coordination with the MPO, Pinellas County, the cities of Clearwater and St. Petersburg, Pinellas County Community Traffic Safety Team, Pinellas County Sheriff’s Office, PSTA, Pinellas County School Board and FHWA. The Plan outlined several objectives associated with the following goal statements:
1) Improve transportation system infrastructure (through the implementation of strategic countermeasures and construction of new transportation facilities) to optimize the safety of all users;
2) Change the “culture” of drivers and pedestrians to increase compliance with existing laws and
encourage mutual respect and courtesy; 3) Reduce real and perceived conflicts between the need to efficiently move automobiles and
pedestrian safety and mobility through private investment in compact, mixed‐use developments; and
4) Coordinate 4E (i.e., engineering, enforcement, education and emergency medical services)
activities with the full support of elected and appointed leaders. Among its major findings, the Plan recognized that most pedestrian crashes involve situations where they are attempting to cross major roads at mid-block and signalized intersections. To address this issue, the Plan identified a set of “core” objectives, which are listed below. Implementation of the recommendations in this report should consider these as well as the Plan’s goals and associated objectives.
Roadway maintaining agencies should identify potential opportunities to improve pedestrians’ ability to safely cross major roadways through the following activities: o Installing enhanced mid‐block crosswalks; o Installing raised medians and traffic control islands along roadways without raised medians; o Making signing, striping, and traffic signal operational improvements to signalized
intersections; and o Improving street lighting at signalized intersections, major transit stops, high crash corridors,
and mid‐block crossing locations.
Concurrent with resurfacing or reconstruction projects, reconstruction of major intersections should be considered.
Resurfacing and capacity projects, along high pedestrian crash corridors, should include a Pedestrian Safety Audit prior to design scoping.
Retrofits and future enhancements should primarily focus on major transit routes and stops.

57 | Page Bicycle and Pedestrian Master Plan - Crash Data Report
4.0 Motorized Vehicle Policy Analysis Laws and regulations for bicycles, electric bicycles, and electric personal assistance mobility devices (EPAMDs) vary from state to state. Table 4-1 depicts various non-automobile motorized vehicles examined for this report, as well whether they are permitted in various types of public rights-of-way in Florida.
Table 4-1: Vehicle Types and Permissions
Permitted on
Vehicle type Multi-use trail Sidewalk Bike lane Roadway
Bicycle x x x x
Electric bicycle x* x* x x
Gas powered bicycle
Scooter/Moped (50cc and under)+ x* x* x x
Scooter/Motorcycle (50cc and over) x
Segway/Electric Personal Assistance Mobility Device (EPAMD) x x x x
Motorized wheelchair x x x** x** * Under human power only ** If there is no sidewalk present +Includes DUI scooter Note: cc = cubic centimeters, referring to engine size
Federal Regulations Bicycle and pedestrian legislation in Title 23 of the United States Code (U.S.C.) defines a number of aspects of the federally-supported bicycle and pedestrian program including the use of federal funds for bicycle and pedestrian transportation facilities. It is important to note that, where federal funds have been used in the construction of a bicycle or pedestrian path, electric bicycles, and electric personal assistive mobility devices are not permitted unless state or local regulations permit. This does not apply to “other power-driven mobility devices (OPDMDs), which are defined under the Americans with Disabilities Act (ADA) as any mobility device powered by batteries, fuel, or other engines— whether or not designed primarily for use by individuals with mobility disabilities— that is used by individuals with mobility disabilities for the purpose of locomotion. This includes golf carts, electronic personal assistance mobility devices (EPAMDs), such as the Segway, or any mobility device designed to operate in areas without defined pedestrian routes, but that is not a wheelchair within the meaning of this section,” 508(c)(2) of the ADA, 42 U.S.C. 12207(c)(2). This definition was the result of a 2011 Department of Justice ruling.
Title 23, U.S.C. Section 217 (h) (4)7 includes the provisions below.
(h) Use of Motorized Vehicles --Motorized vehicles may not be permitted on trails and pedestrian walkways under this section, except for --
1. maintenance purposes;
7 http://www.fhwa.dot.gov/environment/bikeped/sec217.htm

58 | Page Bicycle and Pedestrian Master Plan - Crash Data Report
2. when snow conditions and state or local regulations permit, snowmobiles; 3. motorized wheelchairs; 4. when state or local regulations permit, electric bicycles; and 5. other circumstances as the Secretary deems appropriate.
Note: OPDMD would also be an exception based on the Department of Justice ruling. (j) Definitions.--The following are federal Code definitions:
1. Bicycle transportation facility --The term “bicycle transportation facility” means a new or improved lane, path, or shoulder for use by bicyclists and a traffic control device, shelter, or parking facility for bicycles.
2. Electric bicycle.--The term “electric bicycle” means any bicycle or tricycle with a low-powered electric motor weighing under 100 pounds, with a top motor-powered speed not in excess of 20 mph.
Florida Regulations As stated in the 2011 Florida Statutes (F.S.), Section 316.1995, driving upon a sidewalk or bicycle path is only permissible by human powered vehicles. An exception is made for motorized wheelchairs.8 Italics have been added in the citations that follow for emphasis.
(1) Except as provided in § 316.008 or § 316.212(8)9, a person may not drive any vehicle other than by human power upon a bicycle path, sidewalk, or sidewalk area, except upon a permanent or duly authorized temporary driveway. (2) A violation of this section is a noncriminal traffic infraction, punishable as a moving violation as provided in chapter 318. (3) This section does not apply to motorized wheelchairs.
This prohibits all motorized vehicles, including electric-helper motor assisted bicycles/“DUI scooters,” Segways, mopeds and motorized scooters from using a bicycle path, sidewalk, or sidewalk area. The Florida Statutes (§316.003) contain the following definitions:
(2) BICYCLE.—Every vehicle propelled solely by human power, and every motorized bicycle propelled by a combination of human power and an electric helper motor capable of propelling the vehicle at a speed of not more than 20 miles per hour on level ground upon which any person may ride, having two tandem wheels, and including any device generally recognized as a bicycle though equipped with two front or two rear wheels. The term does not include such a vehicle with a seat height of no more than 25 inches from the ground when the seat is adjusted to its highest position or a scooter or similar device. No person under the age of 16 may operate or ride upon a motorized bicycle. (21) MOTOR VEHICLE.—Any self-propelled vehicle not operated upon rails or guideway, but not including any bicycle, motorized scooter, electric personal assistive mobility device, or moped. (42) ROADWAY.—That portion of a highway improved, designed, or ordinarily used for vehicular travel, exclusive of the berm or shoulder. In the event a highway includes two or more separate roadways, the term “roadway” as used herein refers to any such roadway separately, but not to all such roadways collectively.
8 http://www.leg.state.fl.us/statutes/index.cfm?mode=View%20Statutes&SubMenu=1&App_mode=Display_Statute&Search_
String=bicycle&URL=0300-0399/0316/Sections/0316.1995.html 9 FL § 316.212(8) is one of series of regulations enacted to manage the use of golf carts.

59 | Page Bicycle and Pedestrian Master Plan - Crash Data Report
(63) BICYCLE PATH.— Any road, path, or way that is open to bicycle travel, which road, path, or way is physically separated from motorized vehicular traffic by an open space or by a barrier and is located either within the highway right-of-way or within an independent right-of-way. (75) VEHICLE.—Every device, in, upon, or by which any person or property is or may be transported or drawn upon a highway, excepting devices used exclusively upon stationary rails or tracks (77) MOPED.—Any vehicle with pedals to permit propulsion by human power, having a seat or saddle for the use of the rider and designed to travel on not more than three wheels; with a motor rated not in excess of 2 brake horsepower and not capable of propelling the vehicle at a speed greater than 30 miles per hour on level ground; and with a power-drive system that functions directly or automatically without clutching or shifting gears by the operator after the drive system is engaged. If an internal combustion engine is used, the displacement may not exceed 50 cubic centimeters. (82) MOTORIZED SCOOTER.—Any vehicle not having a seat or saddle for the use of the rider, designed to travel on not more than three wheels, and not capable of propelling the vehicle at a speed greater than 30 miles per hour on level ground. (83) ELECTRIC PERSONAL ASSISTIVE MOBILITY DEVICE (EPAMD).—Any self-balancing, two-non tandem-wheeled device, designed to transport only one person, with an electric propulsion system with average power of 750 watts (1 horsepower), the maximum speed of which, on a paved level surface when powered solely by such a propulsion system while being ridden by an operator who weighs 170 pounds, is less than 20 miles per hour. Electric personal assistive mobility devices are not vehicles as defined in this section.
Shared-use paths are not defined in Florida Statutes though the Florida Greenbook and the PPM both include shared-use path definitions. In the absence of a specific definition for shared-use paths, the facility falls under the definition of bike path which also includes “road or path that is open to bicycle travel.” Bicycles are defined as vehicles under the Statutes and are allowed on roadways except where expressly prohibited. Gas powered bicycles are considered motor vehicles and as such need to be registered with the state. But there is no statutory requirement to register or license bicycles. Therefore, bicycles with gas powered motors are illegal to drive on roadways and shared-use paths. According to 316.003(83), EPAMDs may be operated on the following:
(a) Road or street where the posted speed limit is 25 miles per hour or less; (b) Marked bicycle path; (c) Any street or road where bicycles are permitted; (d) At an intersection to cross a road or street even if the road or street has a posted speed limit of more than 25 miles per hour; and (e) Sidewalk, if the person operating the device yields the right-of-way to pedestrians and gives an audible signal before overtaking and passing a pedestrian.
A county or municipality may prohibit the operation of EPAMDs on any road, street or bicycle path under its jurisdiction if the governing body of the county or municipality determines that such a prohibition is necessary in the interest of safety. In addition, The Department of Transportation may prohibit the operation of EPAMDs on any road under its jurisdiction if it determines that such operation is necessary in the interest of safety.
60 | Page Bicycle and Pedestrian Master Plan - Crash Data Report
There is nothing in the Florida Statutes that require EPAMDs to operate as vehicles or as pedestrians, although the Statutes regulate how they use the roadway under different circumstances. EPAMDs fall under the definition of vehicle; however, and as such are obligated to abide by the laws that apply to vehicles (e.g., driving on the right, methods of making turns, obedience to traffic control devices). Additionally, on July 1, 2012, §316.2068 was amended to allow municipalities to regulate the operation of EPAMDs on any road, street, sidewalk, or bicycle path under its jurisdiction if it is deemed a matter of public safety. As a result of this change to the law, sidewalks are now an area of operation that can be regulated by local agencies. Regarding Segways, regulation of these vehicles is handled primarily at the state level, either as its own device or included in the broader EPAMD category. Fourty-four states and the District of Columbia have enacted legislation allowing the use of Segways or EPAMDs. In many cases, Segway riders are subject to pedestrian laws. As noted in Florida Statutes Section 316.003(83) and 316.2068, an EPAMD may be operated on a marked bicycle path, on any street or road where bicycles are permitted, and on a sidewalk, if the person operating the device yields the right-of-way to pedestrians and gives an audible signal before overtaking and passing a pedestrian. This provision may be prohibited by the local agency or by DOT and will apply to sidewalks as well beginning in July. Other states have similar statutes in place regulating their use.
Motorized Bicycle and EPAMD Statutes in Other States Arizona10 Under Arizona law, motorized electric bicycles and tricycles meeting the definition under the applicable statute are not subject to title, licensing, insurance, or registration requirements, and may be used upon any roadway authorized for use by conventional bicycles, including use in bike lanes integrated with motor vehicle roadways. According to Arizona state statute 28-2516 (6) they may not be operated on multi-use paths or trails, nor upon paths designated for the exclusive use of bicycles. A "motorized electric bicycle or tricycle" is legally defined as a bicycle or tricycle that is equipped with a helper motor that may be self-propelled, which is operated at speeds of less than 20 mph. A second class of electric bicycles that can be operated at speeds of 20 to 25 mph may be registered for legal use on the roadways as “mopeds,” and above 25 mph as a registered moped with an “M” endorsement on the operator's driving license. A motorized electric or gas powered bicycle may use designated bicycle lanes but not shared use paths since they are not designed exclusively for bicycles. Mopeds are prohibited from using bike lanes on motor vehicle roadways. The Arizona statute governing motorized electric bicycles does not prohibit local jurisdictions from adopting an ordinance that further regulates or prohibits the operation of motorized electric bicycles or tricycles.11
California The California Vehicle Code states that electric bicycles are to be operated like conventional bicycles with several exceptions including a helmet requirement and speed limitations. The California Department of Motor vehicles prohibits motorized bicycles on all bicycle paths or trails, unless permitted by the local authority and then only if operated next to the roadway:
10
http://azbikelaw.org/excerpts.html 11
http://azbikelaw.org/blog/moped-and-motorized-bicycles-in-arizona/

61 | Page Bicycle and Pedestrian Master Plan - Crash Data Report
21207.5. Notwithstanding Sections 21207 and 23127 of this code, or any other provision of law, no motorized bicycle may be operated on a bicycle path or trail, bikeway, bicycle lane established pursuant to Section 21207, equestrian trail, or hiking or recreational trail, unless it is within or adjacent to a roadway or unless the local authority or the governing body of a public agency having jurisdiction over such path or trail permits, by ordinance, such operation.12
Colorado Motorized bicycles or low-powered scooters may be operated on roadways, except as stated in the Colorado State Statutes § 42-4-1412(b) where such use of bicycles or electrical assisted bicycles is prohibited by official traffic control devices or local ordinances, and in bicycle lanes within such roadways. Use of the motor is prohibited when riding on bike and pedestrian paths unless allowed by local government ordinance. Local regulations may be applied to the use of electric bicycles by each city or county. Boulder, Colorado has banned electric bikes over 400W from bike lanes.
Massachusetts In Massachusetts, according to Section 1B of the General Laws regulating motorized bicycles and operations, motorized bicycle drivers must have a driver’s license and be over the age of 16. Operators have access to all public ways in the state but must not be ridden at speeds over 25 mph. They may be operated in bicycle lanes but are prohibited from off-street recreational paths.13
New Jersey In New Jersey, motorized bicycles fall under the moped definition and are, therefore, subject to license and registration requirements.
New York State Electric bicycles are banned by state law.
Texas In Texas, electric bicycles are regulated by the Texas Transportation Code, Chapter 551. Section 106 states that the local authority may not prohibit the use of electric bicycles on a highway14 that is used by motor vehicles. That same authority may prohibit the use of electric bicycles on a highway used primarily by pedestrians.15 Section 551.202 applies to EPAMDs. Based on the provisions shown below, Segways as well as EPAMDs are allowed on bicycle paths.
Sec. 551.202. OPERATION ON ROADWAY. (a) A person may operate an electric personal assistive mobility device on a residential street,
roadway, or public highway with a speed limit of 30 miles per hour or less only: (1) while making a direct crossing of a highway in a marked or unmarked crosswalk; (2) where no sidewalk is available; or
12
http://dmv.ca.gov/pubs/vctop/d11/vc21207_5.html 13
http://www.malegislature.gov/Laws/GeneralLaws/PartI/TitleXIV/Chapter90/Section1B 14
Highway or street means the width between the boundary lines of a publicly maintained way any part of which is open to the public for vehicular travel.
15 http://www.statutes.legis.state.tx.us/docs/TN/htm/TN.551.htm

62 | Page Bicycle and Pedestrian Master Plan - Crash Data Report
(3) when so directed by a traffic control device or by a law enforcement officer. (b) A person may operate an electric personal assistive mobility device on a path set aside for
the exclusive operation of bicycles. (c) Any person operating an electric personal assistive mobility device on a residential street,
roadway, or public highway shall ride as close as practicable to the right-hand edge. (d) Except as otherwise provided by this section, provisions of this title applicable to the
operation of bicycles apply to the operation of electric personal assistive mobility devices.
Washington Electric bicycles may not be used on sidewalks and may be used on multi-purpose trails or bike lanes except as regulated by local jurisdictions.16
Summary Recommendations Motorized Bicycles Per § 316.1995, Florida Statutes are clear about the use of human powered vehicles on sidewalks and bike paths. Other cities in Florida and other states have used signage to remind users of the prohibition of motorized vehicles, and it is also a matter of enforcement. An electric bicycle used under human power is allowed. But with the motor running it is not. A sign from the MUTCD R5 series indicating HUMAN POWERED BICYCLES ONLY or something similar could be posted at strategic locations along the various trails in the county. Signs within the R5 series are exclusionary (e.g., “Do Not Enter”, “Wrong Way”, etc.).
Segways or EPAMDs Because Florida Statute § 316.2068 gives municipalities the opportunity to regulate the operation of EPAMDs on sidewalks, it is recommended that the Pinellas county local governments adopt ordinances that require that EPAMDs to follow all the rules and regulations pertaining to bicycles when ridden on the sidewalk.
16
http://apps.leg.wa.gov/RCW/default.aspx?cite=46.61.710
63 | Page Bicycle and Pedestrian Master Plan - Crash Data Report
5.0 Electric Vehicle Safety Without the noise that accompanies traditional internal combustion engine (ICE) vehicles, hybrid electric (HE) vehicles pose an added threat to bicyclists and pedestrians and, particularly, to walkers who are blind. There is no engine noise to warn bicyclists and walkers when an HE vehicle they cannot see is approaching. The National Highway Traffic Safety Administration (NHTSA) released a report, Incidence of Pedestrian and Bicyclist Crashes by Hybrid Electric Passenger Vehicles, which found that an HE vehicle is two times more likely to be involved in a pedestrian crash than an ICE vehicle. This report was updated in 2011 with a finding that an HE vehicle is 35 percent more likely to be involved in a crash with a pedestrian and 57 percent more likely to be involved in an incident with a bicycle than an ICE vehicle.17 Many groups including the National Federation for the Blind (NFB) petitioned the U.S. Congress to address this issue. In response, Congress passed the Pedestrian Safety Enhancement Act of 2010.18 This requires the NHTSA to issue federal standards for a pedestrian safety sound system on electric cars. The final rule is expected in 2014. The NHTSA is going to prepare an environmental assessment for the Pedestrian Safety Enhancement Act of 2010 rulemaking.19 Though many groups support these findings, some are against adding sound to electric vehicles. The groups NoiseOff.org20 and the Noise Pollution Clearinghouse have spoken out against adding noise to the vehicles. Many car manufacturers have been proactive, studying the concept of adding sound to their vehicles. Automakers have been turning to Hollywood sound studios and Facebook to help make their decisions. Some have proposed using futuristic sounds or sounds that are similar to an ICE vehicle. One idea that is particularly popular is the concept of ringtones for cars. People could personalize the sound of their car.21
17
Incidence Rates of Pedestrian and Bicyclist Crashes by Hybrid Electric passenger vehicles: An Update, NHTSA, October 2011. 18
http://www.govtrack.us/congress/bills/111/s841 19
http://www.nhtsa.gov/Laws+&+Regulations/Quiet+Car+Notice+of+Intent/ 20
http://noiseoff.org/evs.php 21
http://www.theworld.org/2011/06/adding-noise-to-electric-cars/