Beyond Rio: Sustainable energy scenarios for the...
16
Beyond Rio: Sustainable energy scenarios for the 21st century David L. McCollum, Volker Krey and Keywan Riahi Abstract Reaching the economic, environmental and sustainability objectives of all societies requires overcoming several major energy challenges; it necessitates rapid progress in multiple areas. The scenario pathways presented in this paper describe transformative changes toward these goals, taking a broad view of the four main energy challenges faced by society in the 21st century: providing universal access to modern energy for all; reducing the impacts of energy production on human health and the environment; avoiding dangerous climate change; and enhancing energy security.The overarching objective of the paper is to provide policy guidance on how to facilitate the transformation of the energy system to achieve these multiple energy objectives. Particular focus is given to the required pace of the transformation at both the global and regional levels, and to the types of financial and policy measures that will be needed to ensure a successful transition. Synergies and trade-offs between the objectives are identified, and co-benefits quantified. The paper makes an important contribution to the scenario literature by approaching the global transition toward sustainable development in a more integrated, holistic manner than is common in other studies. Keywords: Energy access; energy security; climate change mitigation; air pollution; integrated assessment. 1. The challenges ahead: Energy for sustainable development Our society currently faces immense challenges across a number of different dimensions in the area of energy, which include: providing universal access to affordable clean cooking fuels and electricity for the poor; limiting air pollution and health damages from energy use; avoiding dangerous climate change by limiting greenhouse gas emissions; improving energy security through supply diversity and independence; and reducing energy’s impact on natural ecosystems (land, water, biodiversity, minerals). Solutions for overcoming these hurdles are by no means simple: indeed, the global transition toward energy sustainability has no clear path. It is precisely for this reason, however, that scenario analyses utilizing integrated, systems-level modeling tools have consistently proven helpful in shedding light on the most critical issues. This paper synthesizes a multitude of strategic insights deriving from just such an exercise — the transformational scenario pathways developed within the framework of the Global Energy Assessment (Riahi et al., 2012). These pathways approach the global transition toward sustainable development in an integrated, holistic manner, taking a broad view of the main energy challenges facing society. In so doing, the work goes beyond earlier assessments of the future energy system, which have focused primarily on either a particular topic or on single objectives. Our overarching objective is to provide guidance on how to facilitate the transformation of the global energy system to achieve the multiple energy objectives, with regard to technical measures, policies, and related costs and benefits. 2. Sustainability targets to drive the energy transition The transition pathways are designed to meet specific quantitative targets for those sustainable energy objectives highlighted specifically in Figure 1. In other words, each of these objectives is configured as a target that must be met at a particular level of stringency and by a certain point in time (Table 1). For the sustainability concerns that are not treated in this explicit way, we discuss at the end of the paper how they would be impacted by our scenario pathways. Because the objectives of energy poverty, air pollution and health, and energy security are generally thought of as near-term problems, achieving them in the 2030-2050 timeframe is envisioned. In contrast, targets for climate change are set for the medium to long term, since that is when its impacts David L. McCollum, Volker Krey and Keywan Riahi are at the International Institute for Applied Systems Analysis, Laxenburg, Austria. E-mails: [email protected], [email protected] and [email protected] Natural Resources Forum 36 (2012) 215–230 © 2012 The Authors. Natural Resources Forum © 2012 United Nations
Transcript of Beyond Rio: Sustainable energy scenarios for the...

Beyond Rio: Sustainable energy scenarios for the 21st century
David L. McCollum, Volker Krey and Keywan Riahi
Abstract
Reaching the economic, environmental and sustainability objectives of all societies requires overcoming several major energychallenges; it necessitates rapid progress in multiple areas. The scenario pathways presented in this paper describetransformative changes toward these goals, taking a broad view of the four main energy challenges faced by society in the 21stcentury: providing universal access to modern energy for all; reducing the impacts of energy production on human health andthe environment; avoiding dangerous climate change; and enhancing energy security. The overarching objective of the paperis to provide policy guidance on how to facilitate the transformation of the energy system to achieve these multiple energyobjectives. Particular focus is given to the required pace of the transformation at both the global and regional levels, and tothe types of financial and policy measures that will be needed to ensure a successful transition. Synergies and trade-offsbetween the objectives are identified, and co-benefits quantified. The paper makes an important contribution to the scenarioliterature by approaching the global transition toward sustainable development in a more integrated, holistic manner than iscommon in other studies.
Keywords: Energy access; energy security; climate change mitigation; air pollution; integrated assessment.
1. The challenges ahead: Energy for sustainabledevelopment
Our society currently faces immense challenges across anumber of different dimensions in the area of energy, whichinclude: providing universal access to affordable cleancooking fuels and electricity for the poor; limiting airpollution and health damages from energy use; avoidingdangerous climate change by limiting greenhouse gasemissions; improving energy security through supplydiversity and independence; and reducing energy’s impacton natural ecosystems (land, water, biodiversity, minerals).
Solutions for overcoming these hurdles are by no meanssimple: indeed, the global transition toward energysustainability has no clear path. It is precisely for thisreason, however, that scenario analyses utilizing integrated,systems-level modeling tools have consistently provenhelpful in shedding light on the most critical issues. Thispaper synthesizes a multitude of strategic insights derivingfrom just such an exercise — the transformational scenariopathways developed within the framework of the GlobalEnergy Assessment (Riahi et al., 2012). These pathwaysapproach the global transition toward sustainable
development in an integrated, holistic manner, taking abroad view of the main energy challenges facing society. Inso doing, the work goes beyond earlier assessments of thefuture energy system, which have focused primarily oneither a particular topic or on single objectives. Ouroverarching objective is to provide guidance on how tofacilitate the transformation of the global energy systemto achieve the multiple energy objectives, with regardto technical measures, policies, and related costs andbenefits.
2. Sustainability targets to drive the energytransition
The transition pathways are designed to meet specificquantitative targets for those sustainable energy objectiveshighlighted specifically in Figure 1. In other words, each ofthese objectives is configured as a target that must be met ata particular level of stringency and by a certain point in time(Table 1). For the sustainability concerns that are not treatedin this explicit way, we discuss at the end of the paper howthey would be impacted by our scenario pathways. Becausethe objectives of energy poverty, air pollution and health,and energy security are generally thought of as near-termproblems, achieving them in the 2030-2050 timeframe isenvisioned. In contrast, targets for climate change are setfor the medium to long term, since that is when its impacts
David L. McCollum, Volker Krey and Keywan Riahi are at theInternational Institute for Applied Systems Analysis, Laxenburg, Austria.E-mails: [email protected], [email protected] and [email protected]
bs_bs_banner
Natural Resources Forum 36 (2012) 215–230
© 2012 The Authors. Natural Resources Forum © 2012 United Nations
Harold
Highlight
Harold
Highlight
Harold
Highlight
Harold
Highlight
Harold
Highlight
Harold
Highlight
Harold
Highlight
Harold
Highlight
Harold
Highlight
Harold
Highlight
will largely be felt. We drew from the current policyenvironment and ongoing discussions to define the specifictargets: the Copenhagen Accord for the global warminglimit, under the United Nations Framework Convention onClimate Change (UNFCCC, 2009); the World HealthOrganization (WHO) Tier I Levels for air quality; theUnited Nations (UN) Secretary-General’s vision statementfor universal energy access (UN, 2011); and observednational-level actions for energy security (Sovacool andBrown, 2010). The targets and their timing are of centralimportance in the scenario pathways, since they define theambitiousness and the magnitude and pace of the requiredenergy system transformation. They act as the major driversof the pathways, defining the policy stringency andportfolio of measures that are necessary to simultaneouslyrespond to the multiple energy challenges. Because theenergy objectives are strongly normative, the targets are alldesigned to be ambitious. The pathways nevertheless make
clear that all the targets can be reached, if appropriatepolicies are introduced and energy investments are scaledup considerably.
3. Sustainable pathways: Taking a holistic approachto energy
The sustainable energy pathways we develop can beregarded as alternative interpretations of a singleoverarching scenario storyline, in which the normativesustainability targets for the four energy objectives aresimultaneously achieved. In other words, the pathwayshighlight different degrees of freedom and routes toachieving these goals, considering various technologicaland socio-political uncertainties. All of the pathways sharea common median demographic projection. Globalpopulation peaks at over 9 billion by mid-century (UN,2009), and real per capita incomes grow at a global averagerate of 2%/yr over the next few decades (Riahi et al., 2012).1
The full suite of pathways is structured according to a“branch-and-tree” framework, wherein the pathways differby the varying potential of supply- and demand-sidemeasures to transform the energy system (Table 2).Although some combination of both will ultimately benecessary, emphasis on either one constitutes an importantpoint of divergence between policy choices that drive thefuture energy system in different directions. A critical factoris to what extent demand-side efficiency measures, togetherwith lifestyle and behavioural changes can reduce theamount of energy used for mobility, housing, and industrialservices. If energy demand is low, any of a number ofalternative supply-side configurations might be able tofulfill the multiple energy objectives. By contrast, a weakeremphasis on reducing energy demand will require a muchmore rapid expansion of a broader portfolio of supply-sideoptions. Hence, the successful implementation of demand-side policies increases the flexibility of supply-side options,and, vice versa, more rapid transformation of the supplyside increases flexibility on the demand side. To analyzethese and other energy system changes in a commonscenario framework, we used the MESSAGE (Model forEnergy Supply Strategy Alternatives and their GeneralEnvironmental Impact) integrated assessment model (Riahiet al., 2007).2 The Appendix briefly describes our modelingapproach; however, the reader is further encouraged toconsult Chapter 17 of the Global Energy Assessment (Riahi
1 Economic growth (measured in gross domestic product) of thismagnitude ensures significant development in the 50 or so poorestcountries in the world, consistent with global aspirations toward asustainable future.2 The IMAGE integrated assessment model (Bouwman et al., 2006) wasalso used to develop a subset of pathways in the Global EnergyAssessment. However, the current paper focuses exclusively on thepathways developed using MESSAGE.
Energy Access
Energy Security
Air Pollution and Health
Climate Change Energy forSustainable
Development
Figure 1. Sustainable development involves solving the four mainenergy challenges.
Source: Authors’ elaboration.
Table 1. Targets for the four main energy challenges
Objective Target and timeline
Improve energyaccess
Near-universal access to electricity and cleancooking fuels (i.e., non-traditional biomass andother liquid and gaseous fuels) by 2030
Reduce airpollution andimprove humanhealth
Achieve global compliance with WHO air qualitystandards (PM2.5 concentration < 35 mg/m3) by2030
Avoid dangerousclimate change
Limit global average temperature change to 2°Cabove pre-industrial levels with a likelihood>50%
Enhance energysecurity
Limit energy trade; increase diversity andresilience of energy supply(by 2050)
Source: Authors’ elaboration.Note: PM2.5 refers to fine particulate matter with a diameter of lessthan 2.5 microns.
216 David L. McCollum, Volker Krey and Keywan Riahi / Natural Resources Forum 36 (2012) 215–230
© 2012 The Authors. Natural Resources Forum © 2012 United Nations
Harold
Highlight

et al., 2012), where all of our data, assumptions, findings,and conclusions are described in much greater detail thancan be done here.
A wide range of factors will ultimately shape andconstrain the individual potentials of the various supply-side options available to meet the world’s future energydemands. The clearest determinants are cost, efficiency,resource availability, and other performance attributes. Inour sustainable energy pathways, additional factors comeinto play, given the ambitiousness of the sustainabilityobjectives and the energy transition required to reach theassociated targets. For instance, energy access objectivesconstrain the use of traditional fuels in developingcountries; energy security objectives limit the amount ofenergy trade and foster increasing diversity of energysupply; climate change objectives constrain the use ofcarbon-intensive energy forms; and health objectivesensure low emissions of harmful air pollution. Otherfactors, such as public acceptance, influence the projectedsuccess of the various supply-side options. Nuclear energyin certain countries is an obvious example, thoughsimilar concerns exist — or could potentially arise — forlarge-scale hydropower, bioenergy, wind power (both on-and off-shore) and carbon capture and storage (CCS). Totest the flexibility of different supply-side configurationsin certain pathways we prohibit and/or limit theavailability of specific technologies and resources,including electric and hydrogen vehicles, nuclear power,CCS, modern biomass, and other renewable energysources (Table 2).
Our broadly-encompassing scenario developmentmethodology ensures that the transition pathways span aconsiderable portion of the future scenario space, in termsof assumed levels of demand and technological availability.Detailed information on these individual pathways — for avariety of energy, environmental, and economic metrics,including region-specific results — can be found in thepublicly-available IIASA (International Institute for
Applied Systems Analysis) GEA Scenario Database (Box1). While the pathways exhibit an array of markeddifferences, they also share a number of key characteristics.These commonalities can be interpreted as key ingredientsof a sustainable energy transition that must beginimmediately if the multi-dimensional sustainability targetsare to be achieved. Table 3 presents a general summary ofthe most important characteristics shared by the suite oftransition pathways. Characteristics specific to theindividual energy objectives (climate, access, security, andair pollution and health) are highlighted in Table 5.
Above all, our transition pathways make clear thatreducing wasteful energy use in buildings, transport andindustry is the single most important strategy for achievingenergy sustainability, especially in the near and mediumterm. This finding is robust, principally because thetempering of global energy demand growth contributes tothe simultaneous achievement of all four sustainabilityobjectives (energy access, energy security, climatemitigation, and air pollution reduction). One can identifythree broad and interrelated approaches to tackling demand-side challenges in the energy system: (1) Improvetechnological efficiency, for example, increase vehicle fuelefficiency; (2) Change the structure of energy servicesdemand, for example, substitute physical mobility with“virtual” mobility enabled by electronic communications;and (3) Reduce the level of energy services demand, forexample, reduce travel needs by living closer to work oramenities. Although all three of these approaches areexplored in the pathways as means of reducing final demandfor energy, energy efficiency is a particularly attractiveoption for two reasons: first, efficiency improvements canpotentially lead to a decoupling of energy demand fromeconomic growth, and second, efficiency represents acentral lever for policy to target.
Rapid energy intensity improvements are feasible withcurrently available technologies. The necessary magnitudeand pace of change represents a radical departure from
Table 2. Branching points of the Global Energy Assessment (GEA) transition pathways
Branching point 1: What is the levelof energy demand?
Branching point 2: What are the dominanttransportation fuels and technologies?
Branching point 3: How diverse is the portfolio ofsupply-side options?
GEA-Efficiency (low demand)GEA-Supply (high demand)GEA-Mix (intermediate demand)
Conventional(transportation sector continues to be dominated by
liquid fuels)Advanced
(transition to electricity and/or hydrogen dominatedtransportation sector)
Full portfolio (all options)Restricted portfolio (excludes or limits particular options):
No CCSNo Biomass with CCSNo enhanced carbon sinksNo nuclearNo nuclear and no CCSLimited intermittent renewablesLimited biomassLimited biomass and intermittent renewablesLimited biomass, no Biomass with CCS, no enhanced
carbon sinks
Source: Adapted from Riahi et al. (2012).
217David L. McCollum, Volker Krey and Keywan Riahi / Natural Resources Forum 36 (2012) 215–230
© 2012 The Authors. Natural Resources Forum © 2012 United Nations
historical trends and will therefore require a fundamentalshift in the way energy is used across all major sectors ofthe economy, undoubtedly necessitating concerted anddedicated demand-side policies and measures (Table 4 andTable 5). The GEA-Efficiency group of transition pathwaysassumes a successful, rapid and widespread implementationof such measures over the next several decades, leading toan approximate doubling of the historical rate of energyintensity improvement worldwide. As a result, final energydemands are substantially reduced below levels that wouldotherwise be expected in an “efficiency-as-usual” baselinescenario (Figure 3).
Aggressive efforts to improve end-use efficiency on thedemand side would have important implications on thesupply side as well, with respect to system flexibility. Infact, a headline conclusion of our analysis is that the lowlevel of energy demand in the GEA-Efficiency group ofpathways makes it possible to reach the sustainabilitytargets in the absence of both nuclear energy and CCS.
Another important insight is that the significant efficiencyimprovements of these scenarios enable an energy transitionwith limited contributions from bioenergy, without relyingon carbon sink management, and in the absence of biomassenergy conversion technologies equipped with CCS(“BioCCS”). All of these land use-related climatemitigation options could have potentially adverse impactson the global environment, and for this reason they remaincontroversial. Moreover, the diverse set of pathwaysindicates that if the 2°C climate target is to be reached in thelong term, energy-related CO2 emissions must peak in thenear term (by 2020 or soon thereafter) and then be reduced30-70% (from 2000 levels) by 2050. Yet, the speed andurgency of the supply-side transition need not be so rapidwhen there is a major push for efficiency. In 2030, forexample, with the exception of wind and solar (whichwould need to grow considerably in absolute terms), theprimary energy supply mix is only modestly different fromthat of today. If there is less of a focus on efficiency,
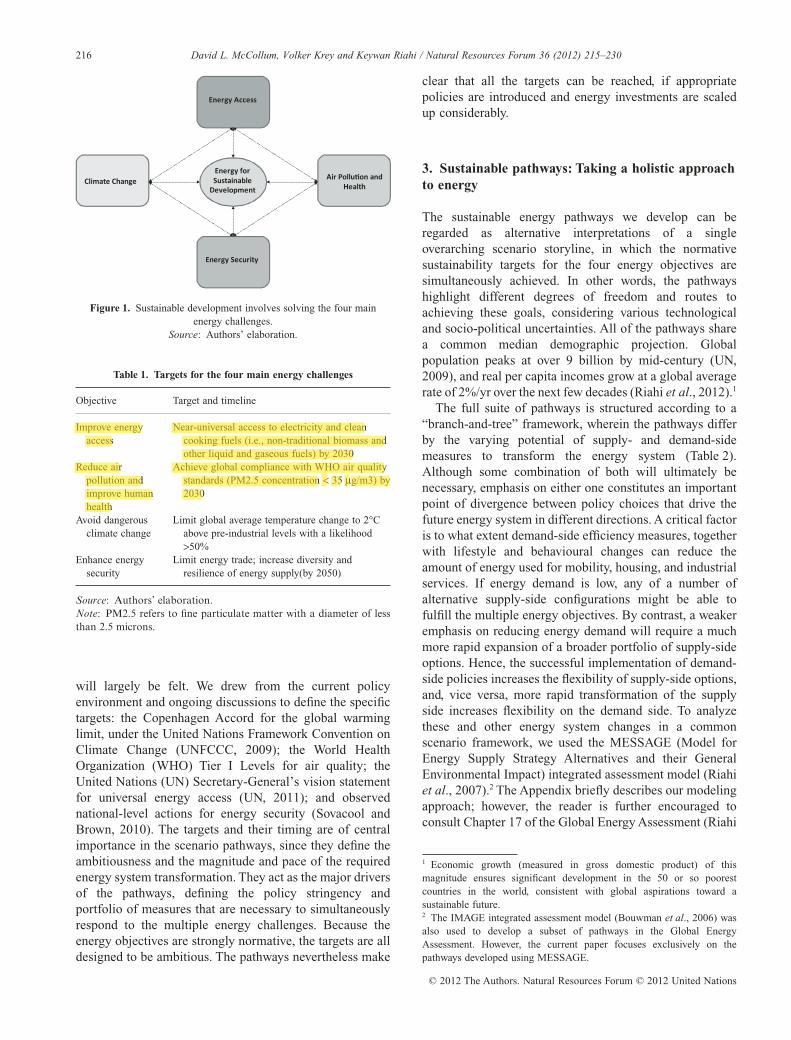
Figure 2. Example screenshot of the IIASA Global Energy Assessment (GEA) Scenario Database.Source: www.iiasa.ac.at/web-apps/ene/geadb.
Box 1. A scenario database for exploring the sustainable transition pathways
Detailed scenario data for the individual transition pathways are publicly available in a web-based database (Figure 2). Thisdata includes socio-economic indicators; resource, fuel, and technology utilization profiles; emissions trajectories andconcentration pathways; prices of resources and fuels; and various other types of information — measured both globallyand regionally. The database provides interactive features for data visualization and a user interface for the download ofscenario information in different formats.
218 David L. McCollum, Volker Krey and Keywan Riahi / Natural Resources Forum 36 (2012) 215–230
© 2012 The Authors. Natural Resources Forum © 2012 United Nations

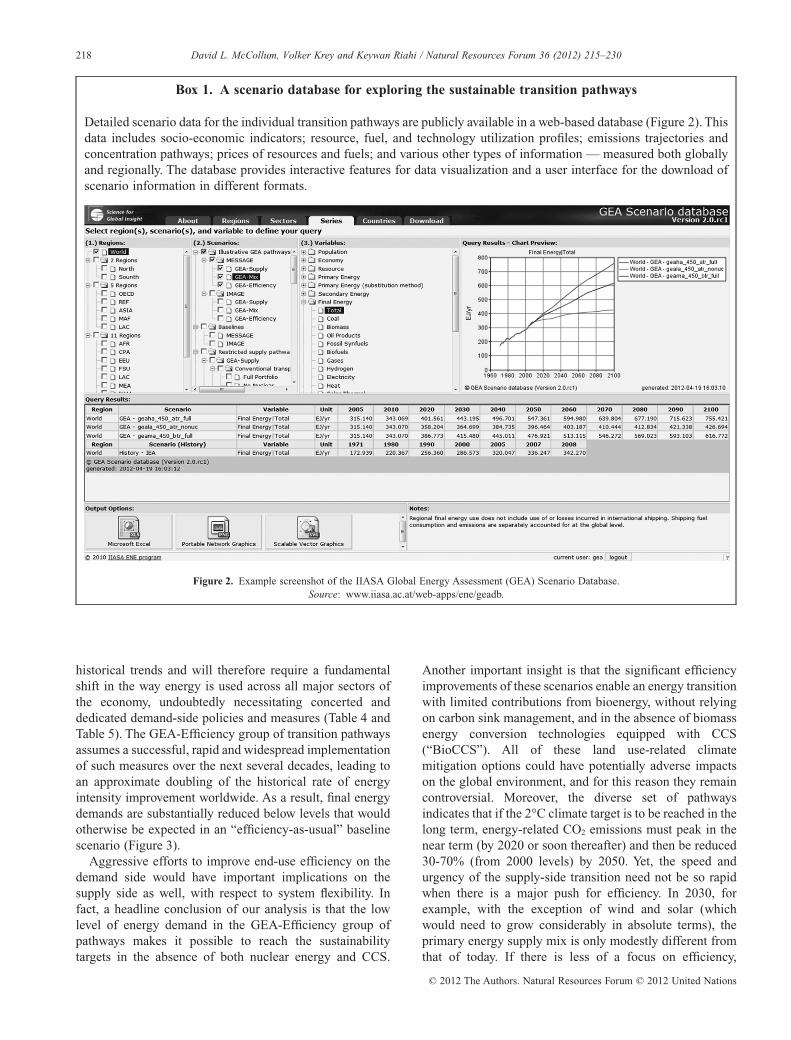
however, leading to levels of energy demand that areconsiderably higher, more radical changes in energy supplywill be required over the next two decades, and nuclearand/or CCS technologies may be needed. Figure 4 providesan illustrative glimpse into a single GEA-Efficiencypathway, highlighting a variety of energy, environmentaland economic indicators that describe its main components.
4. Financing and incentivizing the sustainableenergy transition
The transition pathways make clear that simultaneouslyachieving the multiple objectives for energy sustainability— along the dimensions of climate change, energy access,energy security, and air pollution and health — will requirea scaling up of global energy investments by almost a factorof two compared with today,3 corresponding to annual
investments of between US$ 1.7 trillion and US$ 2.2 trillionper year, or about 1.8-2.3% of cumulative global GDP(using market exchange rates) over the next few decades.The effect of such investment patterns on themacroeconomy would be relatively small in this case.Compared to a counterfactual (baseline) scenario withoutpolicy interventions to achieve the sustainability targets, theprojected loss to global consumption (another measureof economic development, similar to GDP) by 2050would range from 0.6% to 2.0%, with the lower end of therange representing the pathways with a stronger efficiencyandconservation focus. This should be compared with200% growth in overall consumption over the sameperiod.
3 At the present time, total global energy supply-side investments areestimated at about US$ 960 billion (Riahi et al., 2007), corresponding toapproximately 2% of global GDP, a relatively small share, but one thatvaries greatly among countries at different stages of economicdevelopment. At 3.5% of GDP on average, energy investments are a muchlarger part of the economy in the developing world than in theindustrialized world, where they average just 1.3% of GDP. Power sector
investments (generation, transmission, and distribution) represent thesingle biggest category, followed by upstream fossil fuel extraction andproduction (exploration, drilling, mining, refining, etc.). The magnitude ofinvestments is considerably more uncertain on the demand-side, because ofa lack of reliable statistics and difficulties in clearly defining whatconstitutes a purely energy-related investment; present estimates arearound US$ 300 billion. The composition of energy sector investments hasbeen especially dynamic in the past few years. Renewable energyinvestment, in particular, grew at an unprecedented rate of more than 50%annually between 2004 and 2008, and is presently about US$ 190 billion(of which US$ 160 billion was in power generation). By comparison,investment in fossil power generation in 2010 was about US$ 110 billion.
Table 3. Shared characteristics of the sustainable transition pathways
Focal area Commonalities among the sustainable transition pathways
Energy efficiency andconservation
Improvements to at least the historical rate of energy intensity reduction (1.2%/year since the early-1970s, measured inmegajoules per US dollar of GDP)
More rapid improvements in energy intensity, and thus aggressive efforts to improve end-use efficiency, would increasethe flexibility of supply as well as the overall cost-effectiveness of the energy system transformation
Energy poverty and access A rapid shift from traditional biomass (e.g., charcoal and firewood) to widely accessible, clean, flexible energy forms(e.g., kerosene, liquefied petroleum gas (LPG), and natural gas)
Low-carbon energy supplytechnology development
Utilization of a broad portfolio of supply-side options (if available), focusing on low-carbon energy from renewables,bioenergy, nuclear, and CCS
Across all pathways, 60-90% of total global primary energy supply comes from low-carbon sources by 2050.Strong growth in renewable energy beginning immediately; a rising requirement for storage technologies to support the
integration of intermittent wind and solar power into electrical grids.Strong bioenergy growth in the medium term, with extensive use of agricultural residues and, in the medium term,
nonagricultural feedstocks (second-generation bioenergy), to mitigate adverse impacts on land use and foodproduction.
Nuclear energy as an important part of the supply-side portfolio in many transition pathways, although it is also feasibleto phase out nuclear completely.
CCS as an optional bridging or transitional technology in the medium term—unless energy demand is high, in whichcase CCS becomes necessary.
Electric sectordecarbonization
A rapid phase-out of conventional coal power (i.e., without CCS).Natural gas power as a bridging or transitional technology in the short to medium term.The global low-carbon threshold is in the range of 40%-60% by 2020, starting from today’s share of around 35% (mostly
from nuclear and hydropower).Transport sector
decarbonizationOil continues to dominate the production of liquid and gaseous fuels in the short and medium term.The threshold level of low-carbon energy grows to 10% by 2020, a significant increase considering the roughly 0%
starting point at present. By 2050, low-carbon energy shares in transport have to reach a range of 35-75%, dependingon the demand level.
Strong growth in liquid biofuels in the medium term; thereafter the mix of liquid and gaseous fuels depends ontransportation system choices and technological breakthroughs.
At least some electrification of the transportation sector, even if the current liquid fuels-based system remains dominant.
Source: Authors’ elaboration.
219David L. McCollum, Volker Krey and Keywan Riahi / Natural Resources Forum 36 (2012) 215–230
© 2012 The Authors. Natural Resources Forum © 2012 United Nations
Harold
Highlight

Tab
le4.
Ene
rgy
inve
stm
ents
need
edto
achi
eve
GE
Asu
stai
nabi
lity
obje
ctiv
esan
dill
ustr
ativ
epo
licy
mec
hani
sms
for
mob
ilizi
ngfin
anci
alre
sour
ces
Ave
rage
Ann
ual
Inve
stm
ents
(bil
lion
sof
US
$/ye
ar)
Poli
cym
echa
nism
s
2010
2010
-205
0R
egul
atio
n,st
anda
rds
Ext
erna
lity
pric
ing
Car
eful
lyde
sign
edsu
bsid
ies
Cap
acit
y-bu
ildi
ng
End
-use
Effi
cien
cyn.
a.a
290-
800b
Ess
enti
al(e
lim
inat
ion
ofle
ssef
fici
ent
tech
nolo
gies
ever
yfe
wye
ars
thro
ugh
effi
cien
cyst
anda
rds,
labe
ling
,et
c.)
Ess
enti
al(c
anno
tac
hiev
edr
amat
icef
fici
ency
gain
sw
itho
utpr
ices
that
refl
ect
full
cost
s)
Com
plem
ent
(ine
ffec
tive
wit
hout
pric
ere
gula
tion
,m
ulti
ple
inst
rum
ents
poss
ible
)c
Ess
enti
al(e
xper
tise
need
edfo
rne
wte
chno
logi
es)
Nuc
lear
5-40
d15
-210
Ess
enti
al(w
aste
disp
osal
regu
lati
onan
d,of
fuel
cycl
e,to
prev
ent
prol
ifer
atio
n)
Unc
erta
in(G
HG
pric
ing
help
snu
clea
rbu
tpr
ices
refl
ecti
ngnu
clea
rri
sks
wou
ldhu
rt)
Unc
erta
in(h
asbe
enim
port
ant
inth
epa
st,
but
wit
hG
HG
pric
ing
perh
aps
not
need
ed)
Des
ired
(nee
dto
corr
ect
the
loss
ofex
pert
ise
ofre
cent
deca
des)
e
Ren
ewab
les
190
260-
1010
Com
plem
ent
(ren
ewab
lepo
rtfo
lio
stan
dard
sca
nco
mpl
emen
tG
HG
pric
ing)
Ess
enti
al(G
HG
pric
ing
iske
yto
rapi
dde
velo
pmen
tof
rene
wab
les)
Com
plem
ent
(fee
d-in
tari
ffan
dta
xcr
edit
sfo
rR
&D
orpr
oduc
tion
can
com
plem
ent
GH
Gpr
icin
g)
Ess
enti
al(e
xper
tise
need
edfo
rne
wte
chno
logi
es)
CC
S<1
0-64
Ess
enti
al(C
CS
requ
irem
ent
for
all
new
coal
plan
tsan
dph
ase-
inw
ith
exis
ting
)
Ess
enti
al(G
HG
pric
ing
ises
sent
ial,
but
even
this
isun
like
lyto
suffi
cein
near
term
)
Com
plem
ent
(wou
ldhe
lpw
ith
firs
tpl
ants
whi
leG
HG
pric
eis
stil
llo
w)
Des
ired
(exp
erti
sene
eded
for
new
tech
nolo
gies
)e
Infr
astr
uctu
ref
260
310-
500
Ess
enti
al(s
ecur
ity
regu
lati
oncr
itic
alfo
rso
me
aspe
cts
ofre
liab
ilit
y)
Unc
erta
in(n
eutr
alef
fect
)E
ssen
tial
(cus
tom
ers
mus
tpa
yfo
rre
liab
ilit
yle
vels
they
valu
e)
Ess
enti
al(e
xper
tise
need
edfo
rne
wte
chno
logi
es)
Acc
essg
n.a.
36-4
1E
ssen
tial
(ens
ure
tech
nolo
gyst
anda
rdiz
atio
nth
atdo
esno
thi
nder
deve
lopm
ent)
Unc
erta
in(c
ould
redu
ceac
cess
byin
crea
sing
cost
sof
foss
ilfu
elpr
oduc
ts)
Ess
enti
al(g
rant
sfo
rgr
id,
mic
rofi
nanc
ing
for
appl
ianc
es,
subs
idie
sfo
rco
okin
gfu
els)
Ess
enti
al(c
reat
een
abli
ngen
viro
nmen
t:te
chni
cal,
lega
l,in
stit
utio
nal,
fina
ncia
l)
Not
es:
aG
loba
linv
estm
ents
into
effic
ienc
yim
prov
emen
tsfo
rth
eye
ar20
10ar
eno
tav
aila
ble.
Not
e,ho
wev
er,t
hat
the
best
-gue
sses
tim
ate
from
Cha
pter
24of
the
Glo
balE
nerg
yA
sses
smen
t(G
EA
,201
2)fo
rin
vest
men
tsin
toen
ergy
com
pone
nts
ofde
man
d-si
dede
vice
sis
byco
mpa
riso
nab
out
US$
300
billi
onpe
rye
ar.T
his
incl
udes
,for
exam
ple,
inve
stm
ents
into
the
engi
nes
inca
rs,b
oile
rsin
build
ing
heat
ing
syst
ems,
and
com
pres
sors
,fa
ns,
and
heat
ing
elem
ents
inla
rge
hous
ehol
dap
plia
nces
.U
ncer
tain
tyra
nge
isbe
twee
nU
S$10
0bi
llion
and
US$
700
billi
onan
nual
lyfo
rin
vest
men
tsin
com
pone
nts.
Acc
ount
ing
for
the
full
inve
stm
ent
cost
sof
end-
use
devi
ces
wou
ldin
crea
sede
man
d-si
dein
vest
men
tsby
abou
tan
orde
rof
mag
nitu
de.
bE
stim
ate
incl
udes
effic
ienc
yin
vest
men
tsat
the
mar
gin
only
and
isth
usan
unde
rest
imat
eco
mpa
red
wit
hde
man
d-si
dein
vest
men
tsin
toen
ergy
com
pone
nts
give
nfo
r20
10(s
eeno
tea)
.c
Effi
cien
cyim
prov
emen
tsty
pica
llyre
quir
ea
bask
etof
finan
cing
tool
sin
addi
tion
tosu
bsid
ies,
incl
udin
g,fo
rex
ampl
e,lo
w-o
rno
-int
eres
tloa
nsor
,in
gene
ral,
acce
ssto
capi
tala
ndfin
anci
ng,g
uara
ntee
fund
s,th
ird-
part
yfin
anci
ng,p
ay-a
s-yo
u-sa
vesc
hem
es,o
rfe
ebat
esas
wel
las
info
rmat
ion
and
educ
atio
nali
nstr
umen
tssu
chas
labe
ling,
disc
losu
rean
dce
rtifi
cati
onm
anda
tes
and
prog
ram
s,tr
aini
ngan
ded
ucat
ion,
and
info
rmat
ion
cam
paig
ns.
dL
ower
-bou
ndes
tim
ate
incl
udes
only
trad
itio
nal
depl
oym
ent
inve
stm
ents
inab
out
2G
Wca
paci
tyad
diti
ons
in20
10.
Upp
er-b
ound
esti
mat
ein
clud
es,
inad
diti
on,
inve
stm
ents
for
plan
tsun
der
cons
truc
tion
,fue
lrep
roce
ssin
g,an
des
tim
ated
cost
sfo
rca
paci
tylif
etim
eex
tens
ions
.e
Not
eth
ela
rge
rang
eof
requ
ired
inve
stm
ents
for
CC
San
dnu
clea
rin
2010
-205
0.D
epen
ding
onth
eso
cial
and
polit
ical
acce
ptab
ility
ofth
ese
opti
ons,
capa
city
-bui
ldin
gm
aybe
com
ees
sent
ialf
orac
hiev
ing
the
high
esti
mat
eof
futu
rein
vest
men
ts.
fO
vera
llel
ectr
icit
ygr
idin
vest
men
ts,i
nclu
ding
inve
stm
ents
for
oper
atio
nsan
dca
paci
tyre
serv
es,b
ack-
upca
paci
ty,a
ndpo
wer
stor
age.
gA
nnua
lcos
tsfo
ral
mos
tun
iver
sala
cces
sby
2030
(inc
ludi
ngel
ectr
icit
ygr
idco
nnec
tion
san
dfu
elsu
bsid
ies
for
clea
nco
okin
gfu
els)
.S
ourc
e:A
dapt
edfr
omR
iahi
etal
.(20
12).
220 David L. McCollum, Volker Krey and Keywan Riahi / Natural Resources Forum 36 (2012) 215–230
© 2012 The Authors. Natural Resources Forum © 2012 United Nations

In addition to the need to scale up investment, all thetransition pathways depict significant changes in thestructure of the investment portfolio (Table 4). The rangesvary widely in some categories due to the effects of demandlevel and supply technology availability (see Table 2). Onthe supply-side, the transformation of the system isachieved through pronounced shifts of investment awayfrom the upstream fossil fuel sector to downstreamelectricity generation and transmission. Among all options,the largest increase in investment needs is for renewablepower generation. A priority area for future investment istherefore electricity transmission and distribution systemswith sufficient operation and capacity reserves to increasereliability, as well as in power storage to allow theintegration of intermittent renewables.
Coming close to meeting the target of universal energyaccess by 2030 requires that US$ 36-41 billion be spent
Table 5. The four main energy challenges, key characteristics of the corresponding transition pathways that achieve them, and illustrativeexamples of policies and investments
Objective Pathway characteristics Examples of policies and investments
Improve energyaccess
Diffusion of clean and efficient cooking appliancesExtension of both high-voltage electricity grids and
decentralized microgridsIncreased financial assistance from industrialized countries to
support clean energy infrastructure
Microcredits and grants for low-emission biomass and LPGstoves in combination with LPG and kerosene fuel subsidiesfor low-income populations
Estimated cost to provide clean cooking: US$ 17 billion toUS$ 22 billion per year to 2030
Grants for high-voltage grid extensions and decentralizedmicrogrids
Estimated cost to provide rural grid connections: about US$19 billion per year to 2030
Reduce airpollution andimprove humanhealth
Tightening of technology standards across transportation andindustrial sectors (e.g., vehicles, shipping, power generation,industrial processes)
Combined emissions pricing and quantity caps (with trading)Fuel switching from traditional biomass to modern energy
forms for cooking in developing countries
Vehicles: Euro 3-4 standards for vehicles in developingcountries by 2030 (e.g., –60% NOx, PM reductions by2030)
Shipping: Revised MARPOL Annex VI and NOx TechnicalCode 2008 (–80% SOx, NOx reductions by 2030)
Industry/power: rapid desulfurization, de-NOx, and PM controlaround the world by 2030
Estimated cost to meet air pollution targets: US$ 200 billionto US$ 350 billion/year in 2030 (about 12% of energycosts); co-benefits of stringent climate mitigation policiesreduce overall pollution control costs by about 50-65%
Avoid dangerousclimate change
Widespread diffusion of zero- and low-carbon energy supplytechnologies, with substantial reductions in energy intensity
Energy-related CO2 emissions peak by 2020 or soon thereafterand are reduced 30-70% (from 2000 levels) by 2050
Globally comprehensive mitigation efforts covering all majoremitters
Financial transfers from industrialized countries to supportdecarbonization
Combination of cap-and-trade and carbon taxes (with initialcarbon price >US$ 30/tCO2, increasing over time)
Upscaling of investments into low-carbon technologies andefficiency measures to >US$ 600 billion/year to 2050
Additional financial transfers to developing countries of about3-12% of total energy systems costs to 2050, depending onthe domestic commitment of industrialized countries
Enhance energysecurity
Increase in local energy supply options (e.g., renewables toprovide 30-75% of primary energy by 2050)
Greater diversity of imported fuels and reduction independency (e.g., reduce share of oil imports in primaryenergy by 30-80% by 2050 from 2000 level)
Infrastructure expansion and upgrades to supportinterconnections and backup, including increased capacityreserves, stockpiles, and energy storage technologies
Public procurement strategies and regulations to support localsupplies (e.g., renewable obligations)
Interconnection and back-up agreements between energynetwork operators
Stockpiling of critical energy resources for coordinated releaseduring acute market shortages
Estimated cost of infrastructure upgrades for the electricitygrid: >US$ 310 billion/year by 2050,co-benefits of stringentclimate mitigation policies reduce overall security costs(import dependency and diversity) by more than 75%.
Source: Adapted from Riahi et al. (2012).
0
100
200
300
400
500
600
700
800
900
2010 2020 2030 2040 2050
EJ /
yr
GEA-Efficiency
Industry
Buildings
Transport
Figure 3. Illustration of final energy demand growth in an“efficiency-as-usual” scenario and potential reductions in 2050 realized
through full implementation of a variety of sectoral measures to improveend-use efficiency.
Source: Authors’ elaboration.
221David L. McCollum, Volker Krey and Keywan Riahi / Natural Resources Forum 36 (2012) 215–230
© 2012 The Authors. Natural Resources Forum © 2012 United Nations
Harold
Highlight
Harold
Highlight
Harold
Highlight
Harold
Highlight
Harold
Highlight
Harold
Highlight
Harold
Highlight
Harold
Highlight
Harold
Highlight
Harold
Highlight
annually over the next two decades. About half of thatamount would be needed to improve access to electricityand the rest to improve access to clean cooking fuels. At theglobal level, costs of this magnitude are exceedingly small(less than 5% of global energy sector investment today)whereas the benefits would be large in terms of improvedlivelihoods and opportunities for the world’s poorest.However, at the regional level, for example in sub-SaharanAfrica, where the largest share of this spending (more thana third of the total cost to achieve clean cooking fuel accessand two-thirds of the electrification bill) will need to occur,this could mean up to a doubling of energy investmentscompared to today, emphasizing the need for financial andinstitutional support in the region to support energy access.Energy access policies and measures will bring some 3billion people into the 21st century — from an energyperspective — and will result in averting 0.6-1.8 million
premature deaths, on average, every year until 2030, or asavings of over 24 million disability-adjusted life years(DALYs)4 annually. Additional benefits include substantialtime savings for women and children and the potential forimproved livelihood opportunities. Interestingly, theimplications of universal access policies on greenhouse gasemissions, and thus climate change, are found to benegligible. In fact, emissions would marginally decline,thanks to the rapid adoption of improved biomass stoves(which double the efficiency of combustion) and a shift
4 Disability-adjusted life years (DALYs) represent a time-based measureof health impacts that combines years of life lost due to prematuremortality and years of life lost due to time lived in states of less than fullhealth. We estimate the health impacts from outdoor air pollution using themethodology explained in Rao et al. (2012), which is itself based onavailable World Health Organization (WHO) Comparative RiskAssessment methodologies (WHO, 2002).
Figure 4. A glimpse into the illustrative GEA-Efficiency pathway, global level: (a) Primary energy consumption (substitution-eq. method); (b) Energyinvestments; (c) Emissions of air pollutants and greenhouse gases; and (d) Health impacts from outdoor (industrial sources, urban areas) and household
(indoor sources, rural areas) air pollution.Note: The substitution method is used to back-calculate primary energy. This is done because of the well-recognized problem of how best to includenoncombustible energy forms (e.g., non-biomass renewables and nuclear energy) in reporting primary energy supply. In our case, we assign a 35%
efficiency for electricity generation from noncombustible sources, and 85% for heat generation.Source: Authors’ elaboration.
222 David L. McCollum, Volker Krey and Keywan Riahi / Natural Resources Forum 36 (2012) 215–230
© 2012 The Authors. Natural Resources Forum © 2012 United Nations
Harold
Highlight
Harold
Highlight
Harold
Highlight
Harold
Highlight
Harold
Highlight
Harold
Highlight
Harold
Highlight
Harold
Highlight
Harold
Highlight
Harold
Highlight

away from biomass to more efficient LPG for cooking andfrom kerosene to electricity for lighting.
The scale and scope of energy investments will vary quitedramatically by region over the course of the next severaldecades. Notably, with their rapidly growing economies andpopulations, the investment needs in the developing worldwill be much larger than in currently industrializedcountries. Yet, where exactly these capital flows originate isnot yet certain, as it will depend on internationalagreements, financial markets, and a number of otherfactors. Indeed, by mid-century the world will lookdecidedly different from today. Current distinctionsbetween low- and high-income countries will be largelyobsolete, as even the regions with the lowest per capitaincomes today (sub-Saharan Africa and South Asia) willhave advanced to lower-middle-income levels (annual percapita incomes in 2005 dollars of US$ 5,000-10,000), whileother developing regions (centrally planned Asia and China,Latin America and the Caribbean) will have attainedmiddle-class incomes and lifestyles (US$ 15,000-20,000)characteristic of many OECD countries in the 1990s. Ourtransition pathways thus describe a pattern of conditionalconvergence in incomes. Given this increasing affluenceworldwide, the biggest challenges revealed by our analysiswill not be faced by energy consumers, who can confidentlyexpect expanded and improved levels of energy services inthe future, but rather entrepreneurs and policymakers.These stakeholders will need to embrace markedly differentviews from those widely held today, to focus on energyservices provision rather than mistakenly view technology-and policy-dependent levels of primary energy use asimmutable, given consumer demand.
Although the transition pathways reveal considerableuncertainty about future needs for investment in specifictechnology options, they clearly illustrate that presentinvestment in energy is neither sufficient nor compatiblein structure with a sustainable investment portfolio.Mobilizing the required financial resources for thetransformation will thus be a major challenge, especially inthe near term. An important characteristic of the energysector is its long-lived capital stock, with lifetimes forinfrastructure and energy conversion facilities of 30 to 60years and sometimes longer. This longevity translates intohigh inertia in energy supply systems, impeding rapidtransformation. Hence, the energy investment decisions ofthe next several years are of central importance, since theywill have long-lasting implications and will critically shapethe direction of the energy transition path for many years tocome.
Increasing investment in the energy system requires thecareful consideration of a wide portfolio of policies in orderto create the necessary financial incentives. This portfolioneeds to include regulations and technology standards insectors with relatively low price elasticity, in combinationwith externality pricing, to avoid rebound effects, as well astargeted subsidies to promote specific “no-regrets” options
while addressing affordability. In addition, attention needsto be given to building an enabling technical, institutional,legal, and financial environment to complement traditionaldeployment policies (particularly in the developing world).Such a mixture of policies and measures, one combiningboth sticks and carrots (e.g., stricter building, appliance,and vehicle efficiency standards; changes in relative pricesthrough taxes, subsidies, and feed-in tariffs), would open upnew business opportunities (e.g., for energy servicescompanies), thereby creating new markets (e.g., forefficiency technologies) and leveraging the power of marketforces to respond to social concerns and inform publicpolicy choices.
Table 4 identifies effective combinations of policies forspecific technology options and puts these in the context ofthe required future investment needs. Different types oftechnologies and objectives will require differentcombinations of policy mechanisms to attract the necessaryinvestment. The table thus distinguishes among variousmechanisms: “essential” policy mechanisms are those thatmust be included for a specific option to achieve the rapidenergy system transformation; “desired” policymechanisms are those that would help but are not anecessary condition; “uncertain” policy mechanisms arethose where the outcome will depend on the policyemphasis and thus might favour or disfavour a specificoption; and “complement” policies are those that areinadequate on their own but could complement otheressential policies. Table 5 summarizes the required policyand investments in a slightly different way, focusing insteadon the scale and scope of measures needed to achieve eachof the four sustainable energy targets.
5. Harnessing synergies between multiple energyobjectives
The sustainable transition pathways discussed in this papershow that the future of the energy system is by no meanscertain. Policies and measures of all different types will playa key role in dictating how things evolve over time. Two ofthe determining factors will be the emphasis put on energyefficiency and the pace of technological innovation anddiffusion. Yet, the pathways discussed up to this point onlygive a small glimpse into our energy future, as each isdesigned to simultaneously achieve the multiple energysustainability objectives — climate change mitigation,improved air quality and health, universal energy access,and enhanced energy security. In reality, however, theenergy system could potentially develop in a number ofdifferent directions, depending on how society and itsdecision makers prioritize a variety of objectives, includingthe ones focused on here but also many others. Far too oftenpolicymakers approach energy issues with a single-mindedviewpoint; this often leads to costlier solutions thannecessary. An integrated, holistic perspective that
223David L. McCollum, Volker Krey and Keywan Riahi / Natural Resources Forum 36 (2012) 215–230
© 2012 The Authors. Natural Resources Forum © 2012 United Nations
Harold
Highlight

recognizes the important synergies between objectiveswould be more advantageous. Such synergies tend to beoverlooked at present, or they are simply not understoodand subsequently ignored. Compounding the problem isthat in many countries separate policy institutions areresponsible for dealing with each of the objectives; hence,they often find themselves competing for attention in thepolicy world.
In an effort to illuminate the major synergies and, to alesser extent, the trade-offs among the various energyobjectives, as well as to understand the dynamicrelationships between them under a diverse array ofprevailing worldviews, we extended the pathway analysisdescribed above. More specifically, the illustrative GEA-Mix pathway (intermediate demand growth) was used as astarting point for generating several hundred alternatescenarios that attempt to cover a large portion of the fullscenario space across several different dimensions. (SeeMcCollum et al., forthcoming, for the methodologicaldescription.) For instance, some scenarios push climatechange mitigation while ignoring security and air pollution.Within this space, many of the scenarios are unsustainableby the standards spelled out in Table 1, as each meets (orfails to meet) the targets for energy sustainability to varyingdegrees. Because the fulfillment of each of the individualobjectives can be measured in their own unique way, weadopted a simple framework to describe the scenario spaceacross the different dimensions (Table 6). The frameworkdefines three levels of satisfaction — weak, intermediateand stringent — for each of the three energy objectives.Successful achievement of the energy access objective is acommon feature of all the scenarios.5 Specific numericalranges are given for what constitutes each of these levels interms of the relevant indicators. Note that the minimumallowable indicator values corresponding to the Stringentlevel derive directly from the sustainability targets definedin Table 1.
By adopting a holistic and integrated perspective thataddresses all of the objectives simultaneously, we find that
cost-effective climate-pollution-security policies are likelyto lead to substantial co-benefits, in terms of costs avoidedand the achievement of societal objectives for sustainability.Under stringent climate policies, for instance, globally-aggregated DALYs can be reduced by up to 22 million by2030. At the same time, stringent climate policies can helpto further the energy security goals of individual countriesand regions by promoting energy supply diversification andthe increased use of domestically available renewableenergy sources. The result would be energy systems that areboth more resilient and have a higher degree of sovereignty,especially compared to those that rely to a large extent onimports of fossil energy commodities. In sum, climatechange mitigation can be an important entry point forachieving society’s multiple objectives for energysustainability.
Moreover, the combined costs of climate changemitigation, energy security, and air pollution control come ata significantly reduced total energy bill when the multiplebenefits of each are properly accounted for in the calculationof total energy system costs. Global pollution control costscan be reduced by up to US$ 500 billion annually by 2030, asthe stringency of climate policy increases and the utilizationof low-carbon, pollution-free (thus, pollution control-free)technologies rises. Similarly, under increasingly aggressivelevels of decarbonization, the added costs of energy securitycan be reduced by up to US$ 130 billion annually by 2030. InFigure 5, we emphasize these synergies by summarizing thecosts of achieving the objectives under different policyprioritization frameworks. A simple way of visualizing thesynergies in the figure is to note how the sum of the threeleftmost cost bars (single-minded policy approaches) ismuch larger than the rightmost bar (integrated policyapproach).
Although our analysis indicates that the complexrelationships between the multiple energy objectives aredominated by synergies, there are certain trade-offs thatshould not be ignored. Perhaps the most important one hasto do with the impact of climate change mitigation onreduced air pollutant emissions: because certain types ofpollutants, namely aerosols, have a cooling effect on theclimate (Solomon et al., 2007), releasing fewer of them to
5 All scenarios were developed to meet the energy access targets ofTable 1, including the corresponding counterfactual (baseline) scenario.This simplification was made because energy access, compared with theother objectives, has the lowest impacts on energy use and GHG emissions(Table 5). 6 See Appendix for further discussion of the energy security indicator.
Table 6. Indicators for climate change, pollution and health, and energy security, and levels of satisfaction within the Weak-Intermediate-Stringent framework
FulfillmentClimate change [probability of staying within
2°C warming limit]Air pollution and health [million disability-adjusted
life years (DALYs), 2030]Energy security6 [compound
diversity indicator, 2030]
Weak <20% >33 <1.40Intermediate 20-50% 15-33 1.40-1.50Stringent >50% <15 >1.50
Source: Adapted from Riahi et al. (2012).
224 David L. McCollum, Volker Krey and Keywan Riahi / Natural Resources Forum 36 (2012) 215–230
© 2012 The Authors. Natural Resources Forum © 2012 United Nations

the atmosphere leads to increased warming, all else beingequal. The climate feedbacks of air pollution are rathercomplex, and policymakers must be careful to ensure thatcontrol strategies reduce some specific pollutantsproportionally more than others (e.g., warming componentsreduced more than the main cooling components, sulfurdioxide and organic carbon), in an effort to preserve theoverall cooling effect of aerosols and, thus, to produce a netgain for the climate, or to at least remain radiant energy-neutral (Ramanathan and Xu, 2010; UNEP, 2011). Newanalysis tools can help decision makers better understandthe synergies and trade-offs between objectives (Box 2).
6. Considering the other critical issues of energysustainability
The transformational scenario pathways discussedthroughout this paper touch upon several criticaldimensions of energy sustainability (see Figure 1). In thebroadest sense of the concept, however, sustainabledevelopment should incorporate other core concerns,including, but not limited to, impacts on land, food,biodiversity, water, nutrients, minerals and rare earthelements. No matter how the global energy system evolves
over the next several decades, these concerns will be withus for quite a while. Pursuing society’s sustainabledevelopment goals, energy or otherwise, could thereforelead to some difficult choices, given the multitude ofsynergies and trade-offs involved. The following discussionhighlights some of the most pressing issues recognized bypolicymakers and the scientific community and how theseother sustainability concerns would fare in our scenariopathways, mostly from a qualitative perspective.
6.1. Land, food and biodiversity
To feed and nourish a continuously growing population, wewill need to dramatically increase our capacity to producecrops and livestock. At the same time, preservation of theplanet’s rich biodiversity demands that natural habits beprotected and, by extension, that expansion of agriculturallands is limited. Achieving these dual goals will only bepossible through a marked increase in agriculturalproductivity. Though, this option is not without a downside:too much intensification can lead to overexploitation ofcroplands and, ultimately, degradation of this valuableresource. A complementary strategy is to reduceinefficiencies in the global food supply chain: about one-third of all food produced for human consumption is lost or
Figure 5. Costs of achieving societal objectives for energy sustainability under different policy prioritization frameworks.Notes: Policy costs represent the net financial requirements (energy-system and pollution-control investments, variable costs, and operations and
maintenance costs) over and above baseline energy-system development, which itself is estimated at 2.1% of globally-aggregated GDP. Triangularschematics summarize the performance of scenarios that achieve ‘stringent’ fulfillment only for the objective(s) targeted under the corresponding policy
frameworks (axis values normalized from 0 to 1 based on the full range of scenario ensemble outcomes.CC = Climate Change, ES = Energy Security, PH = Air Pollution and Health.
Source: Adapted from Figure 1 in McCollum et al. (2011).
225David L. McCollum, Volker Krey and Keywan Riahi / Natural Resources Forum 36 (2012) 215–230
© 2012 The Authors. Natural Resources Forum © 2012 United Nations

wasted globally each year, a staggering 1.3 billion tonnes(Gustavson et al., 2011). Waste primarily occurs at theconsumer level in medium- and high-income countries (i.e.,food is discarded even if still fit for human consumption)and as post-harvest losses in the early and middle stages ofthe supply chain in low-income countries (e.g., foodspoilage due to suboptimal storage, packaging and transportconditions). Future demand for biofuels and bioenergy,which is envisioned in most sustainable developmentscenarios (including ours), could potentially add to thegrowing concerns over land, food and biodiversity. Even ifevery effort is made to use agricultural residues as afeedstock and to source purpose-grown biomass fromdegraded or marginal lands so that it does not compete withfood crops, our pathways do foresee a marginal increase inland use (<10% globally in 2050) as a result of bioenergyproduction, particularly in the tropical biomes of sub-Saharan Africa, Latin America and Southeast Asia. Thisimplies at least some further biodiversity loss and landscarcity going forward. To guard against these and other
effects (e.g., increased food prices) to the maximum extentpossible, clear policies with respect to land use planningand other sustainability criteria will need to be put in place.That being said, if society were to make absolutely no effortto pursue a more sustainable future, then a dramatic loss ofthe world’s natural ecosystems, and thus its richbiodiversity, would likely occur anyway — and probably toa much greater extent — as a result of unbridled climatechange (IPCC, 2007).
6.2. Water
As with land — and not independent from it — the world’sfreshwater resources find themselves under increasingpressure from humanity. Nearly three billion people nowlive in designated areas of water scarcity, either economic(where human capacity or financial resources areinsufficient to develop adequate water resources) orphysical (where there is simply not enough water to satisfyall demands) (Molden, 2007). If current trends continue —a rapidly growing population, further settlement in water-
Figure 6. Example screenshot of the IIASA Energy — Multi Criteria Analysis Policy Tool (ENE-MCA).Source: www.iiasa.ac.at/web-apps/ene/GeaMCA.
Box 2. The IIASA Energy-Multi Criteria Analysis (ENE-MCA) Policy Tool
The ENE-MCA tool (Figure 6) provides energy decision makers and planners with a comprehensive and interactiveoverview of the various synergies and trade-offs involved in attaching priorities to four of the main energy sustainabilityobjectives — climate change, energy security, air pollution and health, and affordability. ENE-MCA allows users to seehow alternative worldviews can lead to qualitatively different energy system futures.
226 David L. McCollum, Volker Krey and Keywan Riahi / Natural Resources Forum 36 (2012) 215–230
© 2012 The Authors. Natural Resources Forum © 2012 United Nations
Harold
Highlight
scarce areas, increased agricultural and industrial activities,and underinvestment in water-related infrastructure — theglobal water situation is likely to worsen even further. Ofthe roughly 4,000 cubic kilometres of freshwater that iswithdrawn from rivers, wetlands, lakes and groundwatersources globally each year, irrigation in agricultureaccounts for approximately 70%, energy and industry for20%, and municipal consumption (households andbusinesses) for 10%. Water use in energy and industry isgrowing particularly quickly, as a result of increasedthermal cooling loads at power plants, refineries, chemicalfacilities, and factories. Climate change, and the warmertemperatures it will bring, will not do much to help thissituation. An advantage of renewable energy deployment —brought about by efforts to reach certain sustainabledevelopment goals — is that many of those technologies(e.g., solar PV and wind power) require little to no water intheir operation. On the other hand, bioenergy productioncould have potentially adverse effects on the global watersituation; this is one of the main trade-offs with bioenergy,along with concerns over land use (see above). Based on anex post analysis of our sustainable energy pathways, weestimate that additional bioenergy production couldincrease enough to consume about 3 to 6% of globalfreshwater resources.7 At the upper end, this corresponds toroughly three-quarters of current water use worldwide. It isnot yet clear whether this vastly increased level of waterdemand would exacerbate the global water problem, since itwill depend entirely on the types of biomass feedstock thatare grown and where exactly the production takes place.Many regions of the world have ample water resources,including vast areas of North America, South America,Russia, Indonesia and parts of sub-Saharan Africa. Water isnot likely to pose a hard constraint to bioenergydevelopment in these regions,8 although other concerns —such as land use — could become the limiting factor.Biomass production could lead to further water stress inother parts of the globe. For this reason, any energy andclimate policies, particularly those related to biomass andbiofuels, must take into account issues of watersustainability, in order to ensure that they have the intendedeffect. Similarly, policy has an important role to play inensuring that both existing and future water infrastructureare as efficient as possible; in promoting investment inwater efficiency research, development and training; inmotivating (or mandating) the increased recycling of
wastewater; in requiring the utilization of advanced watercooling technologies at energy and industrial facilities; andin limiting the extent of agricultural areas that are irrigated.
6.3. Nutrients, minerals and rare earth elements
If history is any indication, a more populated, wealthier,higher-tech world will consume a substantially greaterquantity of nutrient fertilizers, minerals, and rare earthmetals than it does today. But is the future destined to looklike the past? The answer is mixed. Application offertilizers, for example, has become indispensable to themodern agricultural system in recent decades, and withoutit there would be almost no way to feed the world’s growingpopulation. Fertilizers can help farmers substantiallyincrease their agricultural productivity — something that isnecessary if agricultural land expansion is to be minimizedgoing forward. However, there is an important trade-off:excessive use of nutrient fertilizers can lead to increasedlevels of nitrogen, phosphorous and potassium run-off inground and surface water, resulting in the eutrophication offragile ecosystems. Furthermore, there are sustainabilityconcerns surrounding the production of the inorganicfertilizers themselves. For instance, even though globalphosphorous supplies are thought to be large, it isnevertheless a non-renewable, and therefore ultimatelylimited, resource. Synthetically-produced fertilizers, suchas nitrogen manufactured from coal and natural gas, havetheir own issues, namely that their production leads to non-negligible energy consumption and greenhouse gasimpacts, and the fact that the most inexpensive and easilyaccessible (thus posing the lowest risk of environmentaldamage) fossil fuel deposits have limits to them.
In a more sustainable world, one of the promisingstrategies to reduce nutrient fertilizer use will be tosubstantially increase the application and recycling ofanimal manure and human waste in agricultural systems. Atthe same time, reducing inefficiencies in the global foodsupply chain (see above) will also help tremendously. Yetfertilizer demand could grow if pursuing othersustainability goals (e.g., climate change, energy security)lead to an increase in bioenergy production. A similar storycould play out for a variety of minerals and rare earthelements9 if sustainable development policies are successfulat motivating the penetration of certain clean energytechnologies, namely wind turbines, thin film solarphotovoltaics, electric and fuel cell vehicles, andfluorescent lighting (DOE, 2011). Recent years havealready witnessed an upsurge in the demand for theseadvanced materials, due to their increased utilization inconsumer products such as cell phones, computers, and flatpanel televisions. Unless consumer tastes change
7 Water consumption calculations are approximate, as no explicitmodeling of the global water cycle has been carried out. Our estimates arebased on calculations in Chapter 22 of Graedel and Voet (2010), where theauthors use the IEA’s 2008 BLUE Map 2050 scenario, which sees biomassproduction growing to 150 EJ/yr in 2050, to estimate that this level ofbioenergy demand would require 6% of global renewable freshwater and82% of current total global water use. The level of bioenergy production inour transition pathways is of a similar order of magnitude (80 to 140 EJ/yr),hence the estimates we arrive at here.8 Water resources are in a state of low stress as long as withdrawals remainless than 20% of the available resource (Alcamo and Henrichs, 2002).
9 The rare earth elements we refer to include lanthanum, cerium,praseodymium, neodymium, europium, terbium, dysprosium, and yttrium.Minerals include indium, gallium, tellurium, cobalt, lithium, manganese,nickel, and platinum.
227David L. McCollum, Volker Krey and Keywan Riahi / Natural Resources Forum 36 (2012) 215–230
© 2012 The Authors. Natural Resources Forum © 2012 United Nations

dramatically, these current trends are likely to continue intothe future, regardless of sustainability concerns. Theproblem with minerals and rare earth metals is that they areultimately a limited resource; in fact, several elements couldface supply risks in the near to medium term (to 2025).Strategies to guard against these risks include adiversification of global supply chains; expanded researchinto substitutes for certain minerals and rare earth metals;and increased recycling and reuse efforts.
7. Conclusions
The scenario analysis described in this paper shows that thereare numerous pathways for achieving society’s multipleobjectives for energy sustainability. Doing so will require adramatic transformation of the global energy system over thenext several decades, something that appears to betechnically possible, as long as the right policies andincentive mechanisms are in place. Getting from here tothere is predicated, however, on certain non-negotiable, non-discretionary components of a sustainable energy transitionthat must begin immediately. Commonalities of this sort,deriving from the rich set of pathways we develop in ourstudy, include aggressive efforts to improve end-useefficiency on the demand side, a rapid up-scaling of low-carbon energy sources on the supply side, and a push toeradicate energy poverty among the three billion among uswho still lack adequate access to basic energy services. Theend result of pursuing such a path will be a reduction in airpollutant emissions (thus improved health globally),enhanced energy security among individual countries andregions (via reduced imports and increased supply diversity),and lower greenhouse gas emissions (hence a smaller risk ofdangerous climate change).
Our analyses show the synergies between the multiplesustainability objectives to be so large that they can nolonger afford to be ignored. Climate change mitigation, inparticular, offers a unique entry point for simultaneouslyachieving the diverse set of goals. Such findings demand amore integrated and holistic approach to energysustainability than what we see in policy circles today: onethat fully recognizes that making progress in one dimensioncan lead to both synergies and trade-offs (e.g., with land,water, biodiversity, and minerals) in others. Indeed, the pathtoward sustainable development, especially for the energysystem, will require a broad suite of clear policies andmeasures. A number of options are available and ready forimplementation, but enacting them is contingent uponsufficient political will and the priorities of decisionmakers.
Acknowledgements
This paper describes work partially undertaken within theframework of the Global Energy Assessment. The paper has
benefitted greatly from the support and assistance ofnumerous individuals, particularly those involved in theGlobal Energy Assessment, such as Arnulf Grubler, NebojsaNakicenovic, Peter Kolp, Pat Wagner, Mathis Rogner,Shonali Pachauri, Oscar van Vliet, and Yu Nagai, amongothers. The authors also wish to thank the followingsponsors: Global Environment Facility (GEF), UnitedNations Industrial Development Organization (UNIDO),International Institute for Applied Systems Analysis(IIASA), and Research Institute of Innovative Technologyfor the Earth (RITE).
References
Alcamo, J., Henrich, T., 2002. Critical regions: A model-based estimationof world water resources sensitive to global changes. Aquatic Sciences— Research Across Boundaries, 64(4): 352–362.
Bouwman, A.F., Keam, T., Klein-Goldewijk, K., 2006. IntegratedModelling of Global Environmental Change. An Overview of IMAGE2.4. Netherlands Environmental Assessment Agency, Bilthoven.
DOE, 2011. Critical Materials Strategy. US Department of Energy,Washington, DC.
GEA, 2012. Global Energy Assessment — Toward a Sustainable Future.Cambridge University Press, Cambridge.
Graedel, T.E., Voet, E.V.D. (Eds.), 2010. Linkages of Sustainability. MITPress, Cambridge, MA.
Gustavson, J., Cederberg, C., Sonesson, U., Van Otterdijk, R., Meybeck,A., 2011. Global Food Losses and Food Waste: Extent, Causes andPrevention. Food and Agriculture Organization of the United Nations(FAO), Rome.
IPCC, 2007. Climate Change 2007 — Fourth Assessment Report.Intergovernmental Panel on Climate Change, Geneva.
Jansen, J.C., Arkel, W.G.V., Boots, M.G., 2004. Designing Indicators ofLong-term Energy Supply Security. Energy Research Centre of theNetherlands (ECN), Petten.
Kruyt, B., Van Vuuren, D.P., De Vries, H.J.M., Groenenburg, H., 2009.Indicators for energy security. Energy Policy, 37(6): 2166–2181.
McCollum, D., Krey, V., Riahi, K., 2011. An integrated approach to energysustainability. Nature Climate Change, 1(7): 428–429.
McCollum, D., Krey, V., Riahi, K., Kolp, P., Grubler, A., Makowski, M.,Nakicenovic, N., forthcoming. Climate policies can help resolveenergy security and air pollution challenges.
Messner, S., Strubegger, M., 1995. User’s guide for MESSAGE III.Working Paper WP-95-069. International Institute for Applied SystemsAnalysis (IIASA), Laxenburg.
Molden, D. (Ed.) 2007. Comprehensive Assessment of Water Managementin Agriculture. Earthscan and Colombo, International WaterManagement Institute, London.
Nakicenovic, N., Swart, R., 2000. IPCC Special Report on EmissionsScenarios. Cambridge University Press, Cambridge.
Ramanathan, V., Xu, Y., 2010. The Copenhagen Accord for limiting globalwarming: Criteria, constraints, and available avenues. Proceedings ofthe National Academy of Sciences, 107(18): 8055–8062.
Rao, S., Chirkov, V., Dentener, F., Dingenen, R.V., Pachauri, S., Purohit, P.,Amann, M., Heyes, C., Kinney, P., Kolp, P., Klimont, Z., Riahi, K.,Scheopp, W., 2012. Environmental modeling and methods forestimation of the global health impacts of air pollution. EnvironmentalModeling & Assessment. doi: 10.1007/s10666-012-9317-3.
Riahi, K., Dentener, F., Gielen, D., Grubler, A., Jewell, J., Klimont, Z.,Krey, V., McCollum, D., Pachauri, S., Rao, S., Van Ruijven, B., VanVuuren, D.P., Wilson, C., 2012. Energy Pathways for SustainableDevelopment, in Global Energy Assessment: Toward a SustainableFuture. IIASA, Laxenburg, and Cambridge University Press,Cambridge.
228 David L. McCollum, Volker Krey and Keywan Riahi / Natural Resources Forum 36 (2012) 215–230
© 2012 The Authors. Natural Resources Forum © 2012 United Nations
Harold
Highlight
Harold
Highlight
Harold
Highlight
Harold
Highlight

Riahi, K., Grübler, A., Nakicenovic, N., 2007. Scenarios of long-termsocio-economic and environmental development under climatestabilization. Technological Forecasting and Social Change, 74(7):887–935.
Solomon, S., Qin, D., Manning, M., Allen, R.B., Berntsen, T., Bindoff,N.L., Chen, Z., Chidthaisong, A., Gregory, J.M., Hegerl, G.C.,Heimann, M., Hewitson, B., Hoskins, B.J., Joos, F., Jouzel, J., Kattsov,V., Lohmann, U., Matsuno, T., Molina, M., Nicholls, N., Overpecy, J.,Raga, G., Ramaswamy, V., Ren, J., Rusticucci, M., Somerville, R.,Socker, T.F., Whetton, P., Wood, R.A., Wratt, D., 2007. Technicalsummary, climate change 2007: The physical science basis. In:Solomon, S., Qin, D., Manning, M., Chen, Z., Marquis, M., Averyt,K.B., Tignor, M., Miller, H.L. (Ed.). Contribution of Working Group Ito the Fourth Assessment Report of the Intergovernmental Panel onClimate Change. Cambridge University Press, Cambridge.
Sovacool, B.K., Brown, M.A., 2010. Competing dimensions of energysecurity: An international perspective. Annual Review of Environmentand Resources, 35(1): 77–108.
UN, 2009. World Population Prospects: The 2008 Revision. PopulationDivision of the Department of Economic and Social Affairs of theUnited Nations Secretariat, New York.
UN, 2011. A Vision Statement by Ban Ki-moon, Secretary-General of theUnited Nations. United Nations, New York.
UNEP, 2011. Near-term Climate Protection and Clean Air Benefits:Actions for Controlling Short-Lived Climate Forcers. United NationsEnvironment Programme, Nairobi.
UNFCCC, 2009. Copenhagen Accord, COP 15 Draft Decision. UnitedNations Framework Convention on Climate Change, Copenhagen.
WHO, 2002. World Health Report 2002: Reducing Risks, PromotingHealthy Life. World Health Organization, Geneva.
WIGLEY, T.M.L., 2008. MAGICC/SCENGEN 5.3: User Manual (version2). National Center for Atmospheric Research, Boulder, CO.
Appendix
MESSAGE Integrated Assessment Modeling FrameworkThe MESSAGE (Model for Energy Supply StrategyAlternatives and their General Environmental Impact)integrated assessment model (IAM) is a global systemsengineering optimization model used for medium- to long-term energy system planning, energy policy analysis, andscenario development (Messner and Strubegger, 1995,Riahi et al., 2007). Developed at the International Institutefor Applied Systems Analysis (IIASA) for more than twodecades, MESSAGE is an evolving framework that, likeother global IAMs in its class (e.g., MERGE, ReMIND,IMAGE, WITCH, GCAM, etc.), has gained widerecognition over time through its repeated utilization indeveloping global energy and emissions scenarios, forexample its use in previous IPCC reports (e.g., seeNakicenovic and Swart, 2000).
MESSAGE divides the world up into eleven regions in anattempt to represent the global energy system in a simplifiedway, yet with many of its complex interdependencies, fromresource extraction, imports and exports, conversion,transport, and distribution, to the provision of energy end-use services such as light, space conditioning, industrialproduction processes, and transportation. Trade flows(imports and exports) between regions are monitored,capital investments and retirements are made, fuels are
consumed, and emissions are generated. In addition to theenergy system, the model includes also the other maingreenhouse-gas emitting sectors, agriculture and forestry.MESSAGE tracks a full basket of greenhouse gases andother radiatively active gases — CO2, CH4, N2O, NOx,volatile organic compounds (VOCs), CO, SO2, PM, BC, OC,NH3, CF4, C2F6, HFC125, HFC134a, HFC143a, HFC227ea,HFC245ca, and SF6 — from both the energy and non-energysectors (e.g., deforestation, livestock, municipal solid waste,manure management, rice cultivation, wastewater, and cropresidue burning). In other words, all Kyoto gases plusseveral others are accounted for.
Important inputs for MESSAGE are resource potentials,technology costs and technology performance assumptions(e.g., efficiencies and investment, variable, and O&Mcosts). For the scenarios included in this paper, technical,economic and environmental parameters for over 100energy technologies are specified explicitly in the model.Assumptions concerning the main energy conversiontechnologies can be found in the following references: Riahiet al. (2007), Nakicenovic and Swart (2000), and Riahiet al. (2012). In particular, the current study drewextensively upon the bottom-up analyses described in theresource- and technology-specific chapters of the GlobalEnergy Assessment (GEA, 2012).
MESSAGE is further linked to a macro-economic modelof the global economy so that price-induced changes inenergy demand and GDP can be captured. For example,higher energy prices lead to a suppression of demand, andincreased energy sector investments mean there is lesscapital available for investment into other sectors. Thiscombined framework is known as MESSAGE-MACRO.
After running MESSAGE-MACRO to estimate theenergy system changes and cost impacts of our scenarios,we use the Model for the Assessment of Greenhouse-gasInduced Climate Change (MAGICC) climate model to studythe effect of the resulting levels of emissions. MAGICC is areduced-complexity coupled global climate-carbon cyclemodel, in the form of a user-friendly software package thatruns on a personal computer (Wigley, 2008). In its standardform, MAGICC calculates internally consistent projectionsfor atmospheric concentrations, radiative forcing, globalannual-mean surface air temperature, ice melt, and sea levelrise, given emissions trajectories of a range of gases (CO2,CH4, N2O, CO, NOx, VOCs, SO2, and various halocarbons,including HCFCs, HFCs, PFCs, and SF6), all of which areoutputs from the MESSAGE energy systems model. Thetime horizon of the model extends as far back as 1750(back-casting) and can make projections as far forward as2400. The climate model in MAGICC is an upwelling-diffusion, energy-balance model, which produces output forglobal- and hemispheric-mean temperature and for oceanicthermal expansion. Climate feedbacks on the global carboncycle are accounted for through the interactive coupling ofthe climate model and a range of gas-cycle models. Themodeling package has been used in all IPCC Assessment
229David L. McCollum, Volker Krey and Keywan Riahi / Natural Resources Forum 36 (2012) 215–230
© 2012 The Authors. Natural Resources Forum © 2012 United Nations

reports, dating back to 1990, and its strength lies in its abilityto replicate the more complex global climate models that runon supercomputers. For our analysis, we use a version of thesoftware that is consistent with the IPCC Fourth AssessmentReport, Working Group 1, except that the model has beenslightly modified to permit the explicit treatment of blackand organic carbon (BC and OC) and their impacts on theglobal climate.10
Energy security indicators
Energy security is a difficult concept to define, andtherefore to measure (Kruyt et al., 2009; Sovacool andBrown, 2010). The portfolio approach, that is, diversity ofsupply offers one strategy for achieving system resilience,whereas supplying an increasing quantity of energy fromdomestic sources (i.e., reducing imports) leads to improvedsovereignty. This analysis measures energy security using acompound diversity indicator (Equation A1), aggregated at
the global level (Jansen et al., 2004). The indicator takesinto account the diversity of primary energy resources, aswell as where those resources are sourced, that is, whetherimported into geographically and socio-economicallysimilar regions or produced internally. The diversityindicator rises with increasing diversity of the energysystem but falls at higher levels of import dependency. Insum, the higher the compound diversity indicator, the moresecure the energy system.
I m p pj j jj
= − −( )⋅ ⋅( ){ }∑ 1 ln (A1)
where: I is the compound energy diversity indicator(resources + imports); pj is the share of primary energyresource j in total primary energy consumption; mj is theshare of primary energy resource j that is supplied by (net)imports (at the global level, imports are replaced by thetraded quantities)11
10 We gratefully acknowledge Dr. Steve Smith of the Pacific NorthwestNational Laboratory (USA) for sharing a modified version of MAGICC(v5.3), which explicitly takes user-specified trajectories of BC and OC asinputs.
11 mj is constrained to be between 0 and 1 to ignore the contribution ofresources that are net exported (i.e., with negative mjs); otherwise, thediversity indicator of exporting regions would be artificially improved.
230 David L. McCollum, Volker Krey and Keywan Riahi / Natural Resources Forum 36 (2012) 215–230
© 2012 The Authors. Natural Resources Forum © 2012 United Nations