BEYOND LENDING: MDB’S FINANCIAL ROLE AFTER THE CRISIS
15
BEYOND LENDING: MDB’S FINANCIAL ROLE AFTER THE CRISIS Guillermo Perry Center for Global Development Innovative Financial Solutions for Development AFD, WB and Gates Foundation Paris, March 4-5
-
Upload
elijah-logan -
Category
Documents
-
view
30 -
download
1
description
BEYOND LENDING: MDB’S FINANCIAL ROLE AFTER THE CRISIS. Guillermo Perry Center for Global Development Innovative Financial Solutions for Development AFD, WB and Gates Foundation Paris, March 4-5. THE FACTS: Growing access of emerging countries to private markets, but with high volatility. - PowerPoint PPT Presentation
Transcript of BEYOND LENDING: MDB’S FINANCIAL ROLE AFTER THE CRISIS

BEYOND LENDING:MDB’S FINANCIAL ROLE
AFTER THE CRISIS
Guillermo Perry
Center for Global Development
Innovative Financial Solutions for Development
AFD, WB and Gates Foundation
Paris, March 4-5
THE FACTS: Growing access of emerging countries to private markets, but with high volatility
Cyclical Component and Trend of Net Private Flows to Emerging Developing Countries (1970-2008)
Source: Own estimates, WB, Bloomberg
1970
1972
1974
1976
1978
1980
1982
1984
1986
1988
1990
1992
1994
1996
1998
2000
2002
2004
2006
2008
0
100
200
300
400
500
600
700
800
900
1000
-300
-200
-100
0
100
200
300
Trend Cycle (right axis)
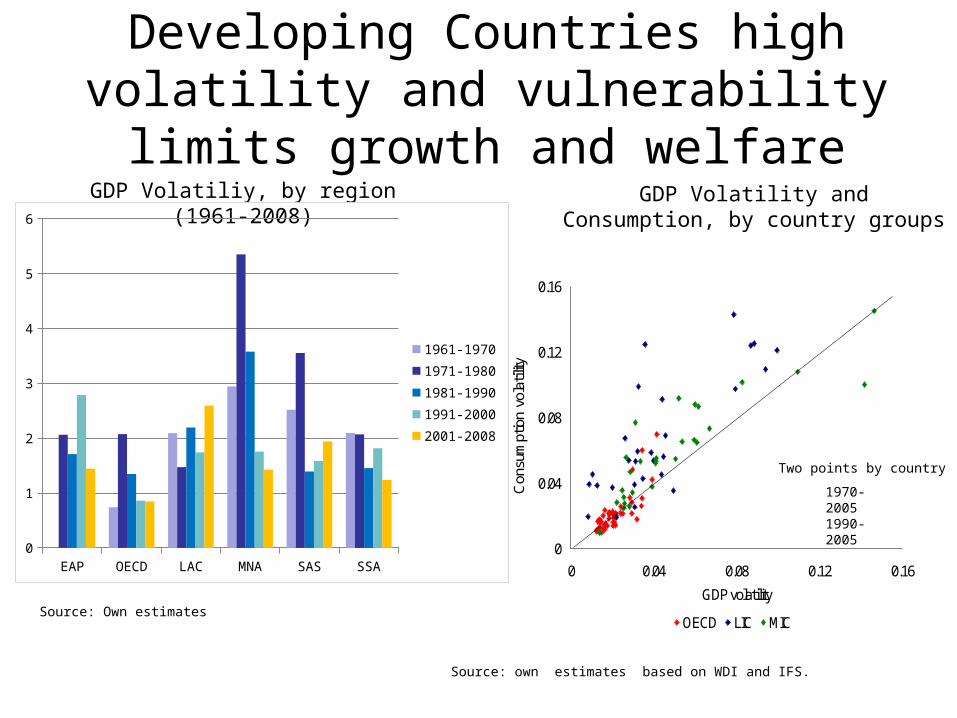
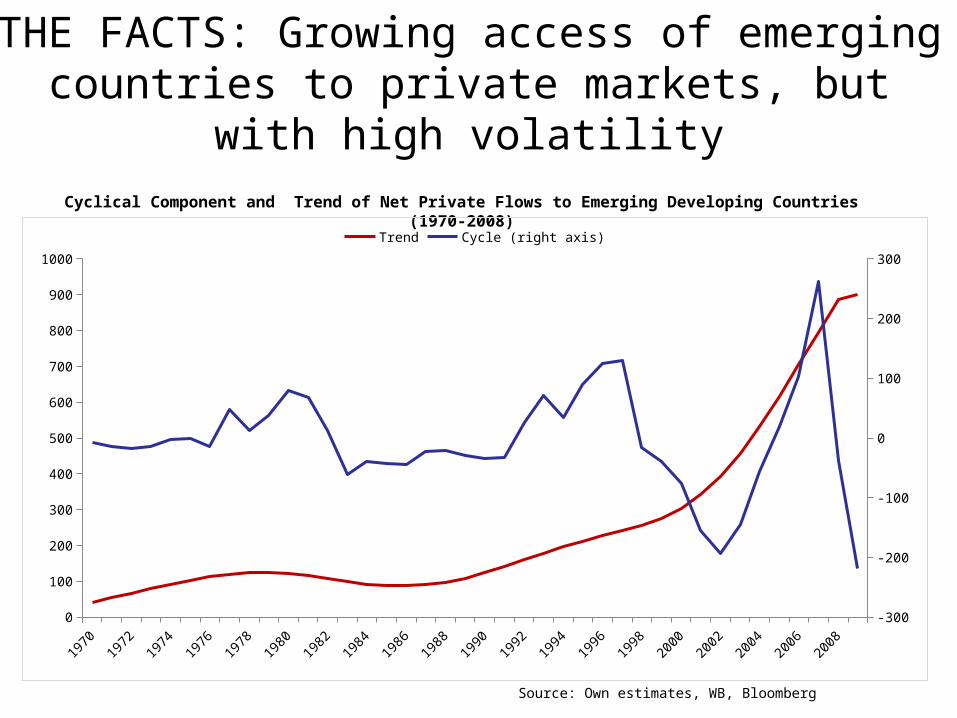
THE PROBLEM TO SOLVE: Developing Countries high volatility and vulnerability limits growth and welfare
Source: Own estimates
GDP Volatiliy, by region (1961-2008) GDP Volatility and Consumption, by country groups
Two points by country
1970-20051990-2005
0
0.04
0.08
0.12
0.16
0 0.04 0.08 0.12 0.16
Con
sum
ptio
n vo
latil
ity
GDP volatility
OECD LIC MIC
Source: own estimates based on WDI and IFS.
EAP OECD LAC MNA SAS SSA0
1
2
3
4
5
6
1961-1970
1971-1980
1981-1990
1991-2000
2001-2008

Developing Countries excess volatility is due to exogenous and endogenous causes
Source: Own calculations.
1975-2005 1990-2005
Oil; 1%Capital Flows Volatility; 9%
Financial Development; 51%
Terms of Trade Volatil-ity; 17%
Fiscal Volatility; 21%
Money Growth Volatility; -1%
Fiscal Volatility; 22%
Money Growth volatil-ity; 16%
Financial Development; 12%Capital Flows volatility; 8%
Terms of trade Volatility; 36%

Higher exposure to Exogenous Shocks
Volatility of Terms of Trade1975-2005
Frequency of natural disasters 1975-2005
Crisis Episodes
0
1
2
3
4
5
6
7
8
9
1979
1980
1981
1982
1983
1984
1985
1986
1987
1988
1989
1990
1991
1992
1993
1994
1995
1996
1997
1998
1999
2000
2001
2002
EM´s CrisisAsian Crisis
Crisis of the European Monetary System
LAC debt crsis
Source: Cavallo and Frankel (2006).
Source: Calderón, C, WB (2007)Source: Calderón, C, World Bank. (2007).
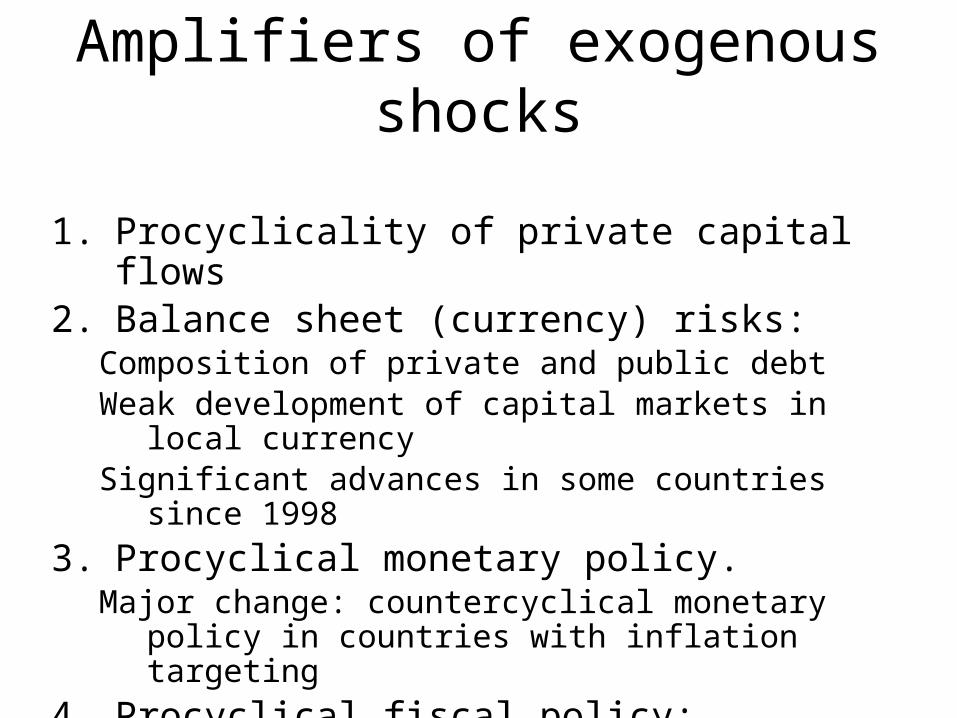
Amplifiers of exogenous shocks
1. Procyclicality of private capital flows2. Balance sheet (currency) risks:
Composition of private and public debtWeak development of capital markets in local currencySignificant advances in some countries since 1998
3. Procyclical monetary policy. Major change: countercyclical monetary policy in
countries with inflation targeting
4. Procyclical fiscal policy: With few exceptions (e.g. Chile)

Dealing with exogenous shocks:potential options
Source: Own elaboration
Action
Shock
Coping after the fact
Prevention: Risk Reduction
Self Insurance: Saving
Market Insurance/Hedging
Terms of Trade
Current Account and (pro cyclical) fiscal adjustment, Aid
DiversifyExports
Stabilization Funds Commodity Price Futures, Forwards and Options/Indexed Debt (TOT, CP)
Natural Disasters
Aid, Fiscal adjustment
ZoningBuilding codes
Emergency Funds Insurance & Reinsurance/CAT’s
Capital Flows Current Account and (pro cyclical) fiscal adjustment, Aid
Debt level & compositionCapital Market DevelopmentDe dollarization
International Reserves
Contingent Credit LinesCurrency and interest derivativesIndexed Debt (GDP)External debt in domestic currencies
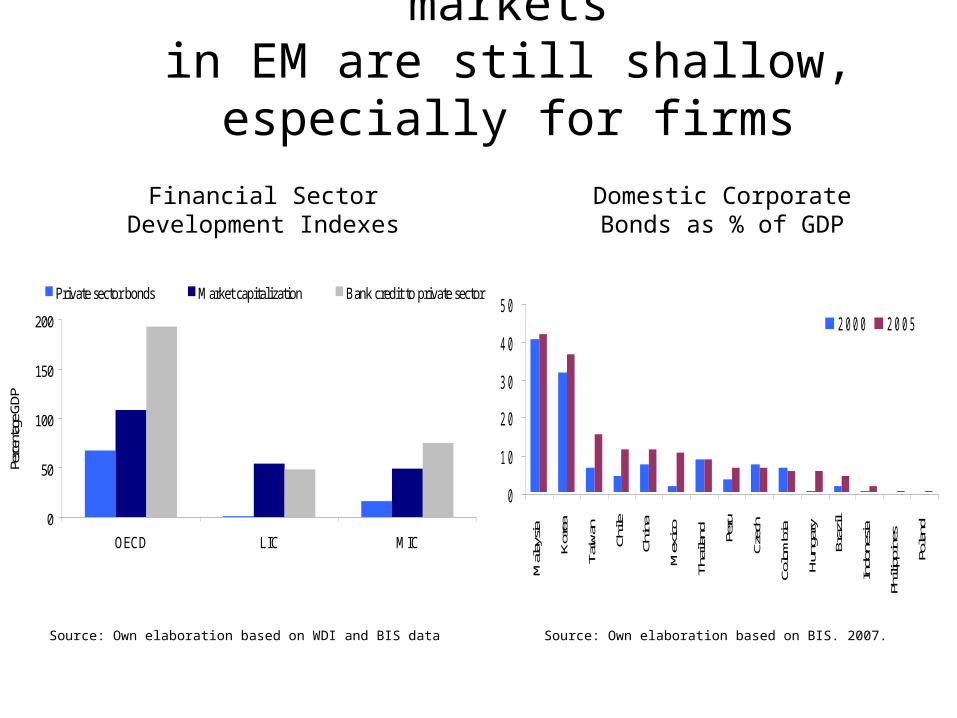
CHALLENGE: Domestic capital marketsin EM are still shallow, especially for firms
0
1 0
2 0
3 0
4 0
5 0
Mala
ysia
Kore
a
Taiw
an
Chile
Chin
a
Mex
ico
Thail
and
Peru
Czec
h
Colo
mbi
a
Hung
ary
Braz
il
Indo
nesia
Phili
ppin
es
Polan
d
2 0 0 0 2 0 0 5
Domestic Corporate Bonds as % of GDP
Source: Own elaboration based on BIS. 2007. Source: Own elaboration based on WDI and BIS data
Financial Sector Development Indexes
0
50
100
150
200
OECD LIC MIC
Perc
entag
e GDP
Private sector bonds Market capitalization Bank credit to private sector

CHALLENGE: Use of currency derivatives by EM’s still very low
0
0 . 3
0 . 6
0 . 9
1 . 2
L a t i n A m e r i c a A s i a C e n t r a l E u r o p e O E C D
1 9 9 8 2 0 0 1 2 0 0 4
0
1
2
3
4
5
L a t in A m e r ic a A s ia C e n t r a l E u r o p e O E C D
1 9 9 8 2 0 0 1 2 0 0 4
0
0 .2
0 .4
0 .6
L a t in A m e r ic a A s ia C e n t r a lE u r o p e
O E C D
1 9 9 8 2 0 0 1 2 0 0 4
FX Forwards as % GDP FX Swaps as % GDP
FX Options as % GDP
Source: Own elaboration based on BIS. 2007. “Financial stability and local currency bond markets”.
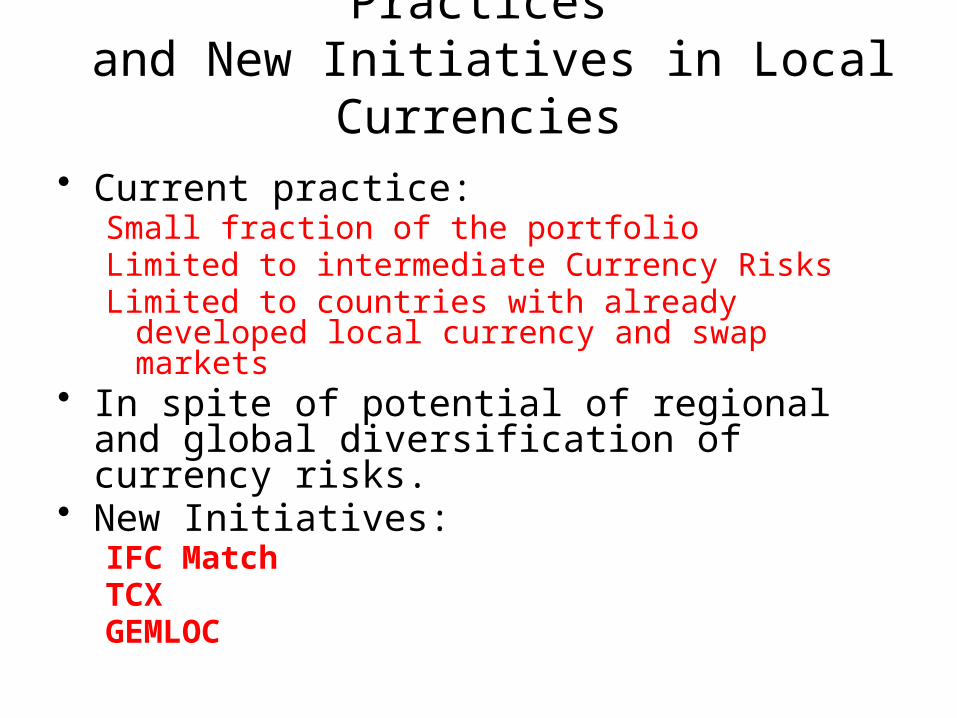
OPPORTUNITY: MDB’s Current Practices and New Initiatives in Local Currencies• Current practice:
Small fraction of the portfolioLimited to intermediate Currency RisksLimited to countries with already developed local
currency and swap markets• In spite of potential of regional and global
diversification of currency risks.• New Initiatives:
IFC MatchTCXGEMLOC

OPPORTUNITY: High Stabilizing Potential of GDP indexed bonds
1986
1987
1988
1989
1990
1991
1992
1993
1994
1995
1996
1997
1998
1999
2000
2001
-0.15
-0.1
-0.05
0
0.05
0.1
0.15 Am Am Est. Cycle
1985
1986
1987
1988
1989
1990
1991
1992
1993
1994
1995
1996
1997
1998
1999
2000
-0.1
-0.05
0
0.05
0.1
0.15
Amort AmortEst Cycle
1985
1986
1987
1988
1989
1990
1991
1992
1993
1994
1995
1996
1997
1998
1999
-0.2
-0.15
-0.1
-0.05
0
0.05
0.1
0.15
0.2AM AM Est Cycle
Argentina Mexico
Indonesia
Fuente: Cálculos propios, WDI, IMF.
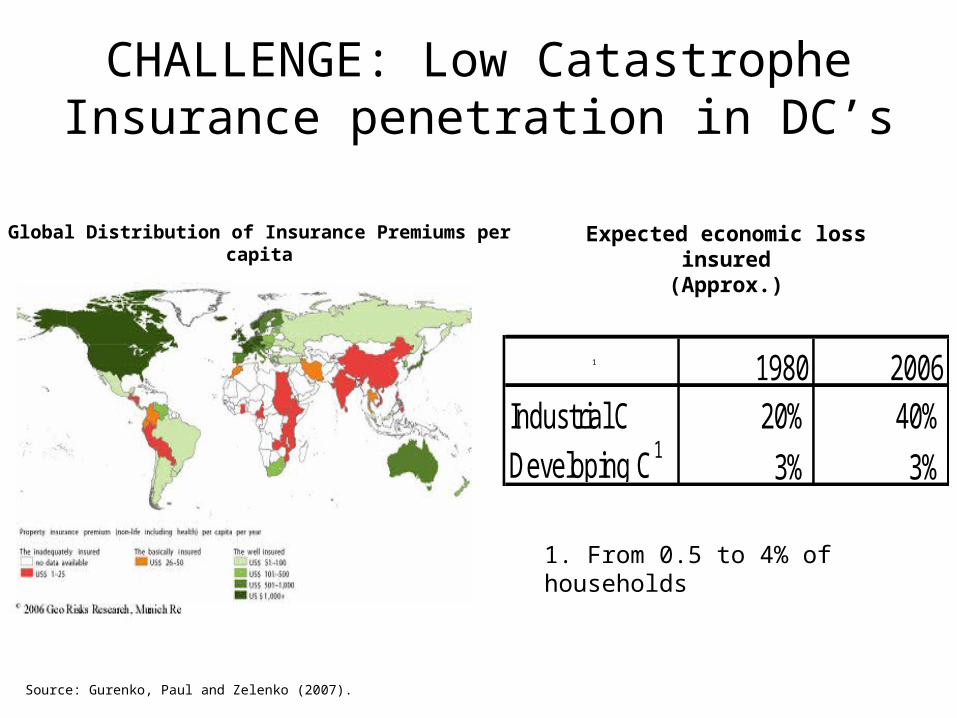
CHALLENGE: Low Catastrophe Insurance penetration in DC’s
Source: Gurenko, Paul and Zelenko (2007).
Global Distribution of Insurance Premiums per capita
Expected economic loss insured
(Approx.)
1 1980 2006Industrial C 20% 40%
Developing C13% 3%
1. From 0.5 to 4% of households

CHALLENGE: High and volatile fees of Catastrophe Reinsurance
Source: Lane Financial (2007) and Cordella and Levy yeyati, WB, (2007)
US catastrophe reinsurance price indices
Yucatán Peninsula South Pacific
Gulf of Mexico Interior
Homes 0.35% 0.12% 0.15% 0.08%
0.60% 0.30% 0.30% 0.08%
Buildings 0.35% 0.13% 0.15% 0.12%
1.40% 0.50% 0.50% 0.12%
Industrial Property 0.60% 0.25% 0.30% 0.14%
1.60% 0.80% 0.80% 0.14%
*/ -500 m from hide tide on the beach. Red numbers are values for 2004, black color for 2006
Zoning (Insured Property Location)
Zone Alfa 1
Mexico Insurance premia of hidrometeorological risk
As percentage of insured values
OPPORTUNITY: WB recent and potential initiatives in catastrophic insurance
• Sovereign Short Term Cash Needs:Contingent loans: a second best solution.Caribbean Catastrophic Reinsurance Facility (CCRF):
significant price reduction.Global CAT Mutual Bond (GCMB)
• Issue: Shifting AID from ex post relief to ex ante insurance
• Private Sector Insurance PenetrationGlobal Catastrophic Reinsurance Facility (GCRF)

CONCLUSIONS
• MDB´s have a key potential role in helping to develop insurance and hedging instruments and markets for developing countries.
• Thus helping them reduce vulnerabilities and macro volatility, that hinder long term growth, welfare and poverty reduction.
• The current urgent liquidity needs of EM’s should not lead MDB’s into complacency and set back efforts in financial innovation that were taking place before the crisis.