
Between the Flags Program - NSW Health · The program uses the analogy of Surf Life Saving...
14
Between the Flags Program INTERIM EVALUATION REPORT April 2013 Report prepared by Malcolm Green Program Leader, Between the Flags
-
Upload
truongkiet -
Category
Documents
-
view
214 -
download
0
Transcript of Between the Flags Program - NSW Health · The program uses the analogy of Surf Life Saving...
Between the Flags Program
INTERIM EVALUATION REPORT
April 2013
Report prepared by Malcolm Green
Program Leader, Between the Flags

2 | P a g e D12/17695 Between the Flags Program Interim Evaluation Report – April 2013
This page has been left intentionally blank
3 | P a g e D12/17695 Between the Flags Program Interim Evaluation Report – April 2013
Introduction
Failure to recognise and appropriately respond to patients who are clinically deteriorating is a
significant issue not only in NSW but in hospitals around the world.
This report provides a summary of the evidence obtained to evaluate the implementation of the
state-wide Between the Flags Program, which was designed to provide a safety net system to
improve recognition and response to deteriorating patients. Evaluation of the Program will inform
the introduction of such systems nationally and internationally.
Background
The Between the Flags Program was implemented in response to a recommendation from a major
health review, the Garling Commission of Inquiry, which identified the Clinical Excellence
Commission’s program as an opportunity to improve recognition and response to deteriorating
patients.
In January 2010, NSW Health introduced the state-wide Between the Flags program, with the aim to:
Improve early recognition and response to clinical deterioration and thereby reduce
potentially preventable deaths and serious adverse events in patients who receive their care
in NSW public hospitals.
The program uses the analogy of Surf Life Saving Australia’s lifeguards and lifesavers who keep
swimmers safe by observing them and ensuring they don’t venture into unsafe areas; and if they get
into trouble, that rescue occurs rapidly.
The Between the Flags (BTF) program is the largest and most comprehensive of its kind anywhere in
the world, and on the expert advice of the BTF Steering Committee introduced a five-element
strategy in all public hospitals across the state which together provide a safety net for deteriorating
patients, including:
governance structures to ensure ongoing support and sustainability for the program;
standardised calling criteria (incorporating a suite of standard observation charts);
Clinical Emergency Response Systems (CERS), including minimum standards for escalation
including processes for both Clinical Review and Rapid Response;
specially developed education materials, designed to address a gap in knowledge and skills
regarding the recognition and response to deteriorating patients
and standard key performance indicators,
4 | P a g e D12/17695 Between the Flags Program Interim Evaluation Report – April 2013
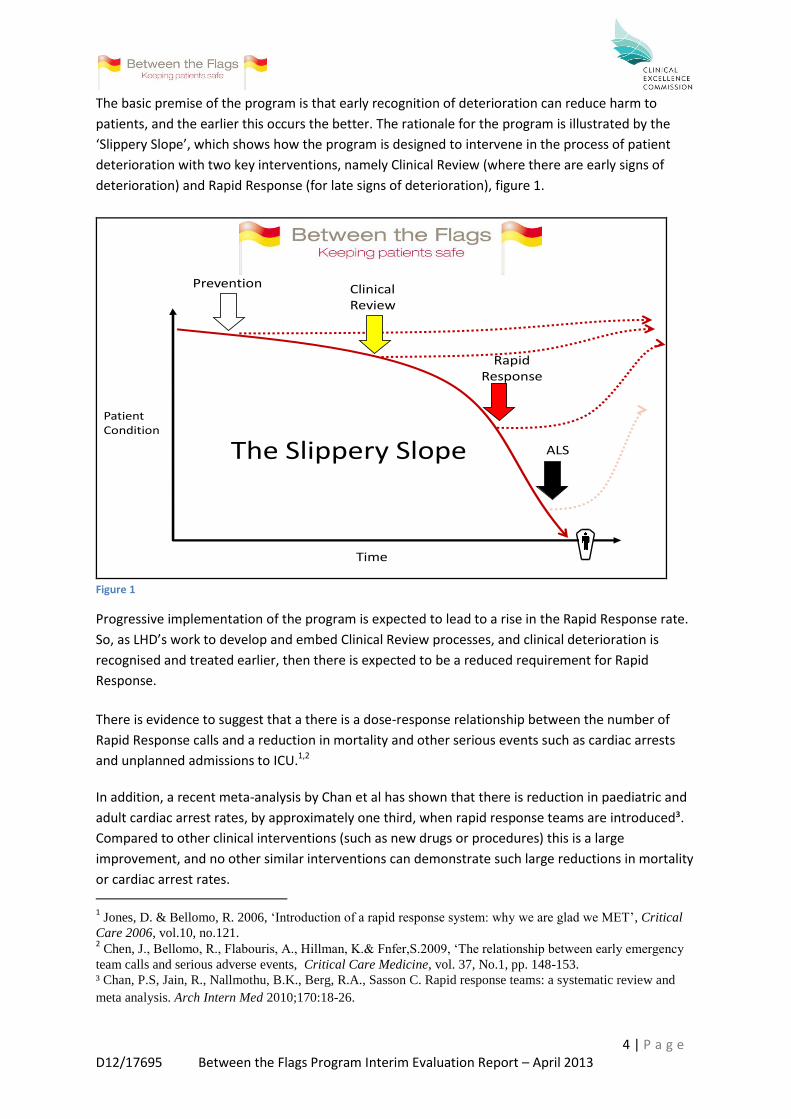
The basic premise of the program is that early recognition of deterioration can reduce harm to
patients, and the earlier this occurs the better. The rationale for the program is illustrated by the
‘Slippery Slope’, which shows how the program is designed to intervene in the process of patient
deterioration with two key interventions, namely Clinical Review (where there are early signs of
deterioration) and Rapid Response (for late signs of deterioration), figure 1.
The Slippery Slope
PatientCondition
Time
ClinicalReview
ALS
Prevention
RapidResponse
Figure 1
Progressive implementation of the program is expected to lead to a rise in the Rapid Response rate.
So, as LHD’s work to develop and embed Clinical Review processes, and clinical deterioration is
recognised and treated earlier, then there is expected to be a reduced requirement for Rapid
Response.
There is evidence to suggest that a there is a dose-response relationship between the number of
Rapid Response calls and a reduction in mortality and other serious events such as cardiac arrests
and unplanned admissions to ICU.1,2
In addition, a recent meta-analysis by Chan et al has shown that there is reduction in paediatric and
adult cardiac arrest rates, by approximately one third, when rapid response teams are introduced³.
Compared to other clinical interventions (such as new drugs or procedures) this is a large
improvement, and no other similar interventions can demonstrate such large reductions in mortality
or cardiac arrest rates. 1 Jones, D. & Bellomo, R. 2006, ‘Introduction of a rapid response system: why we are glad we MET’, Critical
Care 2006, vol.10, no.121. 2 Chen, J., Bellomo, R., Flabouris, A., Hillman, K.& Fnfer,S.2009, ‘The relationship between early emergency
team calls and serious adverse events, Critical Care Medicine, vol. 37, No.1, pp. 148-153.
³ Chan, P.S, Jain, R., Nallmothu, B.K., Berg, R.A., Sasson C. Rapid response teams: a systematic review and
meta analysis. Arch Intern Med 2010;170:18-26.

5 | P a g e D12/17695 Between the Flags Program Interim Evaluation Report – April 2013
The current evidence does not suggest what the optimal rapid response rate should be for individual
hospitals or different kinds of hospital. A target of > 20 rapid response calls per 1000 separations has
been set as a bench mark across the state. However, Jones and Bellomo1 report that the Rapid
Response rate stabilised at 40 rapid response calls/ 1000 admissions in their study. It is likely a rapid
response rate of about this level is necessary for an effective system.
The initial roll out of the Between the Flags Program was preceded by the establishment of an
administrative structure to oversee the implementation and sustainability of the program in each of
the State’s acute hospitals. In January 2010, the Standard Adult General Observation (SAGO) chart
was introduced across NSW, together with a standardised template for the introduction of a Clinical
Emergency Response System, and two tiers of the education package (an awareness presentation
and the DETECT education materials). The program was then underpinned by the release of the NSW
Policy Directive Recognition and Management of Patients who are Clinically Deteriorating in May
2010. Consolidation of the program has continued with the introduction of the Standard Paediatric
Observation Charts (SPOC) in January 2011, the Standard Maternity Observation Chart (SMOC) in
January 2012, and the Adult Emergency Department Observation Chart in November 2012.
In collaboration with HealthShare, the CEC has designed and developed the standard observation
charts within the electronic Medical Record (eMR), and together with a suite of age specific
Paediatric Emergency Department Observation Charts and the DETECT Junior education materials,
have been rolled out in early 2013.
6 | P a g e D12/17695 Between the Flags Program Interim Evaluation Report – April 2013
Evaluation Design
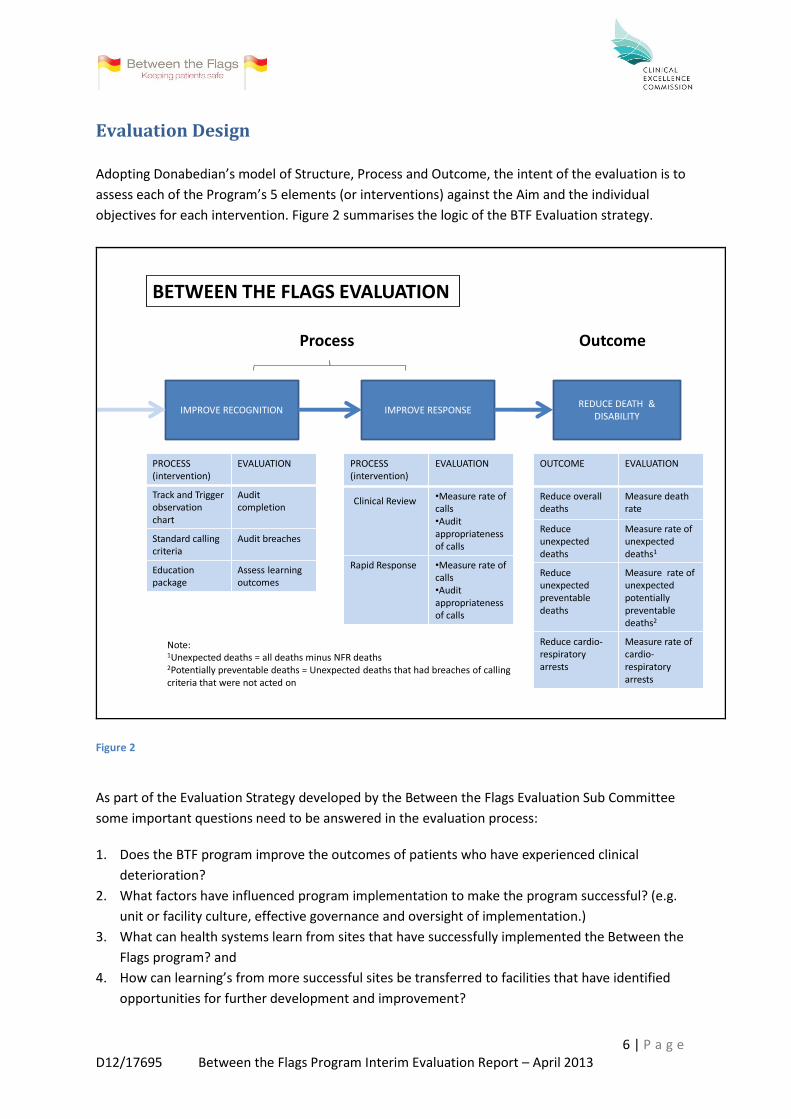
Adopting Donabedian’s model of Structure, Process and Outcome, the intent of the evaluation is to
assess each of the Program’s 5 elements (or interventions) against the Aim and the individual
objectives for each intervention. Figure 2 summarises the logic of the BTF Evaluation strategy.
Process Outcome
PROCESS(intervention)
EVALUATION
Track and Trigger observationchart
Audit completion
Standard callingcriteria
Audit breaches
Education package
Assess learning outcomes
REDUCE DEATH & DISABILITY
IMPROVE RESPONSEIMPROVE RECOGNITION
PROCESS(intervention)
EVALUATION
Clinical Review •Measure rate of calls•Audit appropriatenessof calls
Rapid Response •Measure rate of calls•Audit appropriatenessof calls
BETWEEN THE FLAGS EVALUATION
Note:1Unexpected deaths = all deaths minus NFR deaths2Potentially preventable deaths = Unexpected deaths that had breaches of calling criteria that were not acted on
OUTCOME EVALUATION
Reduce overall deaths
Measure death rate
Reduce unexpected deaths
Measure rate of unexpected deaths1
Reduce unexpected preventabledeaths
Measure rate of unexpected potentiallypreventable deaths2
Reduce cardio-respiratory arrests
Measure rate of cardio-respiratoryarrests
Figure 2
As part of the Evaluation Strategy developed by the Between the Flags Evaluation Sub Committee
some important questions need to be answered in the evaluation process:
1. Does the BTF program improve the outcomes of patients who have experienced clinical
deterioration?
2. What factors have influenced program implementation to make the program successful? (e.g.
unit or facility culture, effective governance and oversight of implementation.)
3. What can health systems learn from sites that have successfully implemented the Between the
Flags program? and
4. How can learning’s from more successful sites be transferred to facilities that have identified
opportunities for further development and improvement?

7 | P a g e D12/17695 Between the Flags Program Interim Evaluation Report – April 2013
Methods and Data Sources
As outlined in the evaluation strategy, each of the 5 elements of the Between the Flags Program are
being evaluated against the original aim of the program. To evaluate the Program this report
combines data from a variety of sources including:
BTF Program team visits to facilities across NSW*
the NSW Quality Systems Assessment (QSA) (see CEC website for method)
the NSW RCA Review Committee
LHD audit data
the KPI data supplied from the Ministry of Health**, and
the EPSIS pilot report from the UNSW
*Note: The Clinical Excellence Commission commenced visits to Local Health Districts (LHDs) in 2010,
and repeated the process in 2012, seeking the opportunity to visit hospitals and meet with staff to
review the implementation of the Between the Flags Program. The purpose of these visits was to:
provide an opportunity for LHD staff to provide direct feedback to the Between the Flags program
team, and; for the Between the Flags program team to identify improvement opportunities to
program tools and materials that will assist LHD’s to overcome barriers to successful implementation
of the 5 elements of the Between the Flags Program.
**Key Performance Indicators (KPIs) were added to the Local Health District’s performance
agreements in July 2010 to evaluate the BTF Program. The two KPIs are the Rapid Response
Calls/1000 separations and Cardiorespiratory Arrest Calls/1000 separations.
Results and Findings
Overall Support for the Program
The BTF visits to local health services have shown that the BTF Program is firmly embedded in NSW
hospitals. Interviews with clinicians and managers at all levels in the facilities visited demonstrate
the degree to which the program is part of normal practice, with the Program becoming part of
everyday language amongst clinicians. For example, it is commonplace for staff to describe patients
who have observations within normal limits (i.e. not breaching the Yellow or Red zones on the SAGO
Chart) as being ‘Between the Flags’. The fact that the Program is widely supported by clinicians and
is seen as a positive quality improvement program is reflected in the QSA data below (figure 4).
Between the Flags is the largest programme implemented to date by the CEC. The Independent
Panel3 wrote “the feedback on BTF has been very encouraging and is a positive reflection on the
collaborative approach taken by the DoH and the CEC to engage with clinicians and health services
to roll out this program in an efficient and effective way “and KPMG wrote in a review of the Patient
Safety Programme “Nearly every consultation group highlighted Between the Flags as being one of
the most effective projects associated with the CEC.”
3 The Independent Panel was appointed to review progress against the Special Commission of Enquiry into
Acute Care Services (November 2008) chaired by Peter Garling SC.
8 | P a g e D12/17695 Between the Flags Program Interim Evaluation Report – April 2013
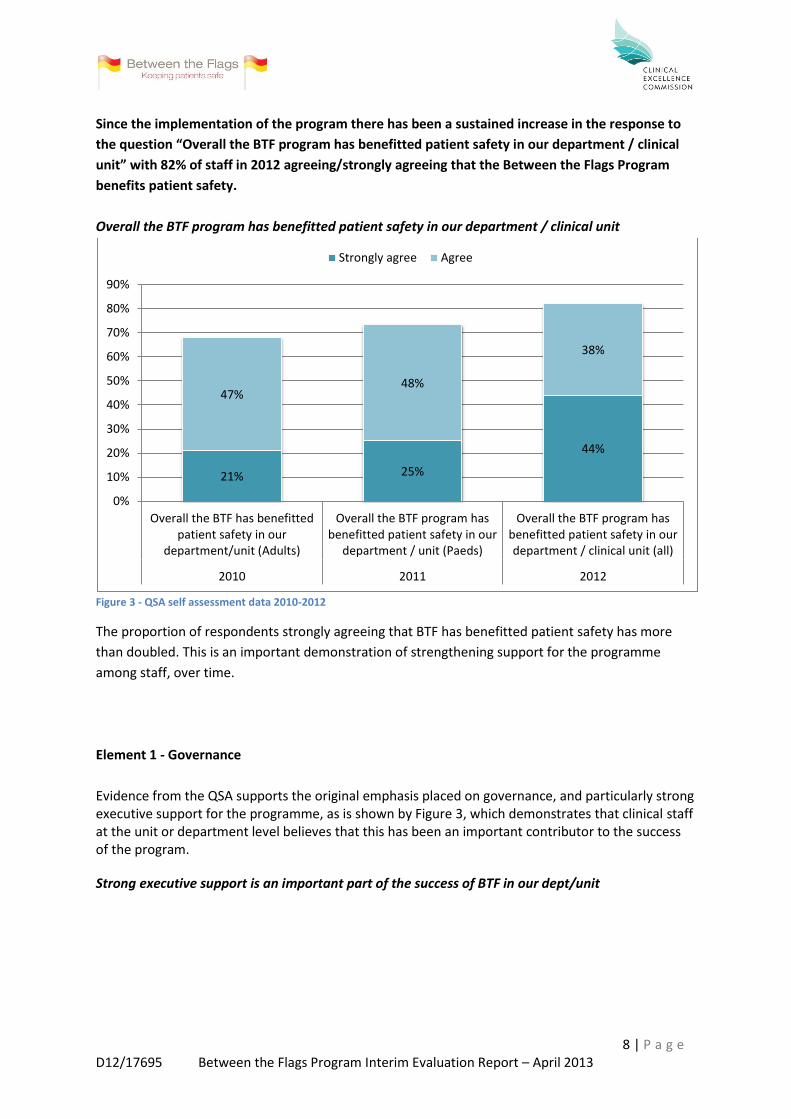
Since the implementation of the program there has been a sustained increase in the response to
the question “Overall the BTF program has benefitted patient safety in our department / clinical
unit” with 82% of staff in 2012 agreeing/strongly agreeing that the Between the Flags Program
benefits patient safety.
Overall the BTF program has benefitted patient safety in our department / clinical unit
Figure 3 - QSA self assessment data 2010-2012
The proportion of respondents strongly agreeing that BTF has benefitted patient safety has more
than doubled. This is an important demonstration of strengthening support for the programme
among staff, over time.
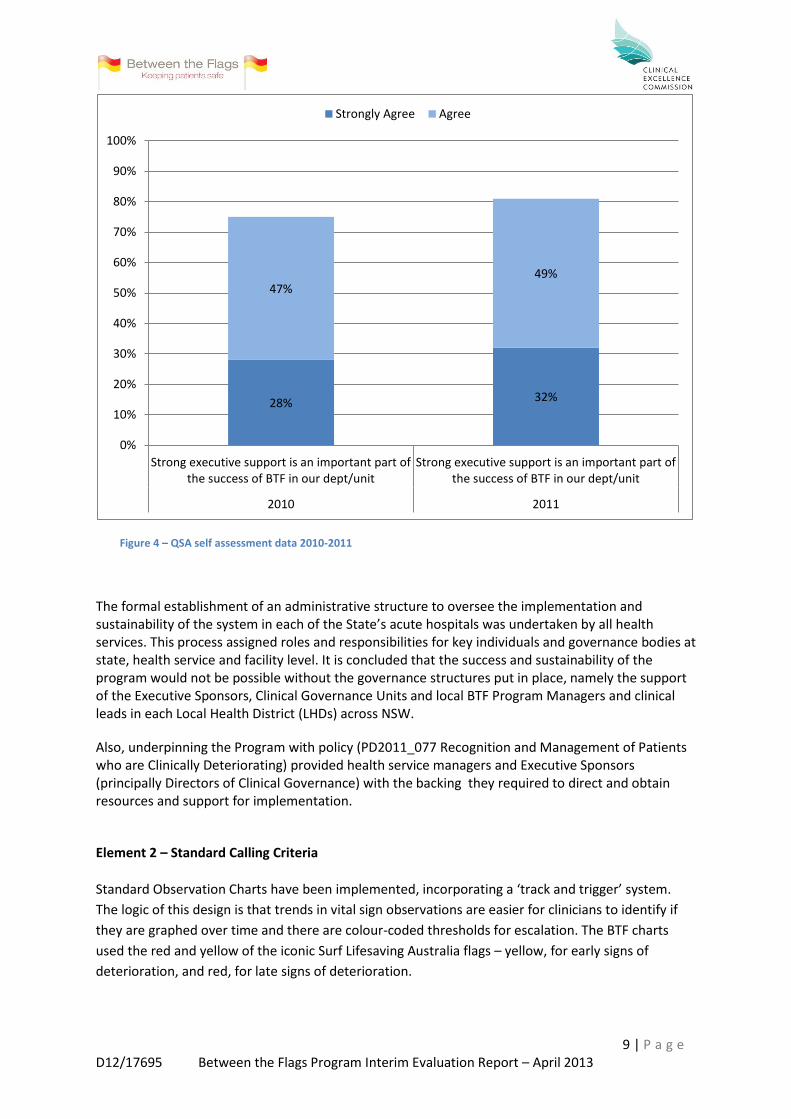
Element 1 - Governance
Evidence from the QSA supports the original emphasis placed on governance, and particularly strong executive support for the programme, as is shown by Figure 3, which demonstrates that clinical staff at the unit or department level believes that this has been an important contributor to the success of the program.
Strong executive support is an important part of the success of BTF in our dept/unit
21% 25%
44%
47% 48%
38%
0%
10%
20%
30%
40%
50%
60%
70%
80%
90%
Overall the BTF has benefittedpatient safety in our
department/unit (Adults)
Overall the BTF program hasbenefitted patient safety in our
department / unit (Paeds)
Overall the BTF program hasbenefitted patient safety in ourdepartment / clinical unit (all)
2010 2011 2012
Strongly agree Agree
9 | P a g e D12/17695 Between the Flags Program Interim Evaluation Report – April 2013
Figure 4 – QSA self assessment data 2010-2011
The formal establishment of an administrative structure to oversee the implementation and sustainability of the system in each of the State’s acute hospitals was undertaken by all health services. This process assigned roles and responsibilities for key individuals and governance bodies at state, health service and facility level. It is concluded that the success and sustainability of the program would not be possible without the governance structures put in place, namely the support of the Executive Sponsors, Clinical Governance Units and local BTF Program Managers and clinical leads in each Local Health District (LHDs) across NSW.
Also, underpinning the Program with policy (PD2011_077 Recognition and Management of Patients who are Clinically Deteriorating) provided health service managers and Executive Sponsors (principally Directors of Clinical Governance) with the backing they required to direct and obtain resources and support for implementation.
Element 2 – Standard Calling Criteria
Standard Observation Charts have been implemented, incorporating a ‘track and trigger’ system.
The logic of this design is that trends in vital sign observations are easier for clinicians to identify if
they are graphed over time and there are colour-coded thresholds for escalation. The BTF charts
used the red and yellow of the iconic Surf Lifesaving Australia flags – yellow, for early signs of
deterioration, and red, for late signs of deterioration.
28% 32%
47% 49%
0%
10%
20%
30%
40%
50%
60%
70%
80%
90%
100%
Strong executive support is an important part ofthe success of BTF in our dept/unit
Strong executive support is an important part ofthe success of BTF in our dept/unit
2010 2011
Strongly Agree Agree

10 | P a g e D12/17695 Between the Flags Program Interim Evaluation Report – April 2013
The original intent of the program was to provide a safety net system for all hospital patients. Vital
sign thresholds for deterioration differ between adults and children and these have to be age-
specific. The physiology of pregnancy also affects vital sign thresholds in pregnant women. This
means that different observation charts are needed for different patient groups based on their
physiology. Therefore a range of Standard Observation Charts have been designed and implemented
in stages:
Standard Adult General Observation (SAGO) Chart – January 2010
Standard Paediatric Observation Chart (SPOC) – January 2011 (5 age specific charts)
Standard Newborn Observation Chart (SNOC) – January 2011
Standard Maternity Observation Chart (SMOC) – December 2011
Adult Emergency Department Observation Chart – November 2012
Paediatric Emergency Department Observation Chart – April 2013
Data from individual facilities also shows that introducing the Standard Observation Charts was associated with unexpected but significant changes of care processes such as increased documentations of vital signs, improved patient safety culture, and more proactive initiation of
advanced and end-of-life care. Department / clinical unit self assessments - Summary of chart implementation
Figure 5 - QSA self assessment data 2012
NOTE: there are 5 hospitals in NSW with research site status that are yet to implement the SAGO chart
Element 3 – Clinical Emergency Response Systems (CERS)
CERS consist of an "afferent limb," the mechanism by which team responses are triggered and an
"efferent limb," the team of clinicians that responds to an event. Traditionally the afferent limb is
triggered by late warning signs of deterioration and the responders are a Medical Emergency or
Cardiac Arrest team. The BTF CERS defines minimum standards for escalation of concern and
response to clinical deterioration, and the Program includes processes for both Clinical Review by
0%
10%
20%
30%
40%
50%
60%
70%
80%
90%
100%
SAGO SPOC SMOC
2012 Standard Observation Chart implementation

11 | P a g e D12/17695 Between the Flags Program Interim Evaluation Report – April 2013
the patient’s admitting team (Yellow Zone criteria based on early warning signs) and an immediate
Rapid Response (Red Zone criteria based on late warning signs).
Interviews with clinicians suggest that implementation of the Program has empowered them to
escalate care of patients in NSW by clearly defining and improving recognition of the patient who is
clinically deteriorating. Support for the introduction of the Yellow Zone criteria and the subsequent
Clinical Review response to early warning signs of deterioration is evidenced in both the QSA Self
Assessment data from 2011 and the EPSIS study pilot report of late 2012 respectively, as is
demonstrated by the following:
70% of staff agreed/strongly agreed that “the ‘Yellow Zone’ on Between the Flags charts has
assisted earlier detection and management of patients at risk. QSA self assessment data 2011
80% of staff agreed/strongly agreed that “the Clinical Emergency Response Systems (CERS) policy
has improved the system for obtaining urgent assistance when a patient is clinically deteriorating” QSA self assessment data 2012
And,
87% of staff agreed/strongly agreed that Yellow Zone assisted in earlier detection & management
of patients at risk of deterioration
82% of staff that agreed/strongly agreed that the extra tier (Clinical Review) has improved patient
safety overall EPSIS online survey – pilot results 2012
Element 4 – Education
A three tiered BTF Program education strategy was implemented in 2010 and has been underpinned by the education curriculum.
Tier 1
An online awareness training package was developed and was made compulsory for all staff,
including non-clinicians, to raise awareness of the program and its purpose and elements. These two
e-learning modules are currently being re-designed in collaboration with HETI.
Tier 2
The DETECT/DETECT Junior education materials were commissioned specifically to address what the
BTF Steering Committee recognised as a gap in knowledge for all clinical staff, to provide education
in recognition and response to deteriorating patients.
Tier 3
Specific training, including advanced life support, for all staff that are required to provide a formal
Rapid Response to a patient with observations in the Red Zone.

12 | P a g e D12/17695 Between the Flags Program Interim Evaluation Report – April 2013
Evaluation of the BTF education has proved difficult. Tier 1 education is completed by all staff as part
of hospital orientation yet program managers advise that participation in Tier 2 education remains
predominantly by nursing staff with a relative lack of medical participation across the state.
DETECT Junior has been implemented in March 2013 and Tier 2 education for Allied Health is
currently being trialled in two local health districts.
Data from the 2012 QSA self assessment and the preliminary data from the 2012 EPSIS online survey
– pilot results supports the aim of the BTF Tier 2 education.
Department / clinical unit self assessments EPSIS survey
QSA self assessment data 2012 EPSIS online survey – pilot results 2012
Element 5 – Evaluation
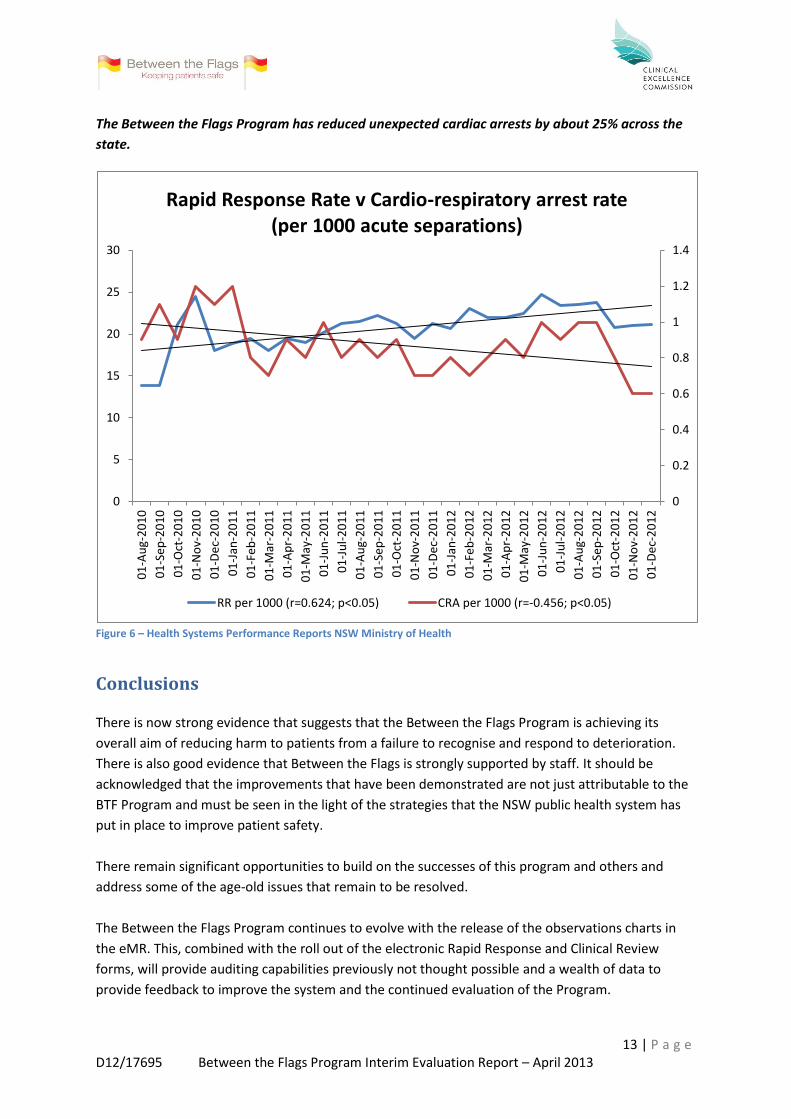
As outlined in the evaluation strategy, two Key Performance Indicators (KPIs) have been collected
across NSW: Rapid Response Calls/1000 separations (a process indicator that may provide
information about the workload associated with provision of a Rapid Response System as well as an
indicator of the uptake and maturity of the Rapid Response system); and Cardiorespiratory Arrest
Calls/1000 separations (an outcome indicator that is intended to demonstrate the impact of the
Program on preventing the progression of clinical deterioration to a cardiopulmonary arrest.
Preliminary analysis of this data (Figure 6) shows that there is a statistically significant correlation
between a rise in the Rapid Response Call Rate and a decline in the Cardiac Arrest Rate in NSW
hospitals with the introduction of the BTF Program. This supports the premise that implementation
of the 5 elements of the BTF program, including a consistent approach to the Clinical Emergency
Response Systems, has had an impact on cardiac arrests in these hospitals.
47%
38%
0%10%20%30%40%50%60%70%80%90%
100%
The DETECT program has contributed toimproving the knowledge and skills ofstaff in recognising and responding to
the deteriorating patient
Strongly agree Agree % of staff that agreed/strongly agreed that DETECT training improved their knowledge & skills in recognising and responding to the deteriorating patient
73%
% of staff that have completed DETECT face to face training
87%
Agreed/strongly agreed that DETECT training was delivered in an efficient & effective manner
89%
Agreed/strongly agreed that DETECT training was relevant to their specific role
85%
13 | P a g e D12/17695 Between the Flags Program Interim Evaluation Report – April 2013
The Between the Flags Program has reduced unexpected cardiac arrests by about 25% across the
state.
Figure 6 – Health Systems Performance Reports NSW Ministry of Health
Conclusions
There is now strong evidence that suggests that the Between the Flags Program is achieving its
overall aim of reducing harm to patients from a failure to recognise and respond to deterioration.
There is also good evidence that Between the Flags is strongly supported by staff. It should be
acknowledged that the improvements that have been demonstrated are not just attributable to the
BTF Program and must be seen in the light of the strategies that the NSW public health system has
put in place to improve patient safety.
There remain significant opportunities to build on the successes of this program and others and
address some of the age-old issues that remain to be resolved.
The Between the Flags Program continues to evolve with the release of the observations charts in
the eMR. This, combined with the roll out of the electronic Rapid Response and Clinical Review
forms, will provide auditing capabilities previously not thought possible and a wealth of data to
provide feedback to improve the system and the continued evaluation of the Program.
0
0.2
0.4
0.6
0.8
1
1.2
1.4
0
5
10
15
20
25
30
01
-Au
g-2
01
0
01
-Se
p-2
01
0
01
-Oct
-20
10
01
-No
v-2
01
0
01
-De
c-2
01
0
01
-Jan
-20
11
01
-Fe
b-2
01
1
01
-Mar
-20
11
01
-Ap
r-2
01
1
01
-May
-20
11
01
-Ju
n-2
01
1
01
-Ju
l-2
01
1
01
-Au
g-2
01
1
01
-Se
p-2
01
1
01
-Oct
-20
11
01
-No
v-2
01
1
01
-De
c-2
01
1
01
-Jan
-20
12
01
-Fe
b-2
01
2
01
-Mar
-20
12
01
-Ap
r-2
01
2
01
-May
-20
12
01
-Ju
n-2
01
2
01
-Ju
l-2
01
2
01
-Au
g-2
01
2
01
-Se
p-2
01
2
01
-Oct
-20
12
01
-No
v-2
01
2
01
-De
c-2
01
2
Rapid Response Rate v Cardio-respiratory arrest rate (per 1000 acute separations)
RR per 1000 (r=0.624; p<0.05) CRA per 1000 (r=-0.456; p<0.05)
14 | P a g e D12/17695 Between the Flags Program Interim Evaluation Report – April 2013
Many lessons have been learned from the implementation of the Program not the least being the
absolute necessity of Executive Sponsor support for the success and sustainability of the program.
The 5 elements of the Program being introduced simultaneously and underpinned by policy have
proved a successful strategy for implementation. Furthermore, the implementation of the BTF
Program has placed hospitals in NSW ahead of the curve in their assessment against the National
Safety and Quality Health Service Standard 9 – Recognising and responding to clinical deterioration
in Acute Health Care.
The program has unearthed the age old issues of failure to rescue and the barriers to escalation, the
effect of organizational culture on implementing patient safety programs, as well as current
inadequacies in the way we care for the dying patient. The 2012 QSA self assessment identified the
barriers to escalation in NSW facilities and the BTF Executive Sponsors and Clinical Leads forum
continues to work on state-wide strategies to overcome these barriers. The CEC has also been
involved with the development of a “Care of the Dying” observation chart which incorporates the
BTF principles and is being trialled in Hunter New England LHD.
The Clinical Excellence Commission continues to work with the Simpson Centre for Health Services
Research at the UNSW which is undertaking the Evaluation of a Patient Safety Improvement System
(EPSIS) study with a grant from the NHMRC. The study aims to evaluate the implementation of the
Between the Flags Program and its impact on reducing hospital mortality and other adverse events
(a population-based mixed-method study). An online survey is complete with over 1800 responses
and focus groups are underway, with reports being made available by UNSW to individual LHDs and
the CEC in mid 2013. These reports and subsequent research papers will provide independent
analysis and evaluation of the Between the Flags Program.
Moving forward, the CEC, in partnership with the LHDs, will place a stronger focus on the evaluation
of the novel ‘Yellow Zone’ criteria and ‘Clinical Review’ response to evaluate the impact of the BTF
Program on NSW hospitals. Together with UNSW there is also an opportunity to further investigate
the impact of culture on the implementation of the program. Lastly, the CEC is working to release an
electronic version of Chartbook, which will provide the LHDs with up to date KPI data that can be
compared across the state and over time to feedback to those implementing the program.
Lastly, the Between the Flags Program has provided a foundation on which to build improved patient
safety and quality systems in NSW.