Bett er Chicken for a Bett er Life
124
Beer Chicken for a Beer Life Annual Report 2018
Transcript of Bett er Chicken for a Bett er Life
Bett er Chicken for a Bett er Life
Annual Report 2018
B
ContentsOur vision 1
This is Scandi Standard 2
The year in brief 4
CEO statement 6
Trends and drivers 10
Our markets 12
Strategic direction 14
Financial targets 19
Operations and value chain 21
Sustainability Report 30
Auditor’s report on the statutory sustainability report 41
The Scandi Standard share 42
Administration report 45
Consolidated fi nancial statements 56
Parent company fi nancial statements 59
Notes to the consolidated and to the parent
company’s fi nancial statements 61
Proposed appropriation of earnings, and the Board of Directors’ and the Managing Director’s assurance 97
Auditor’s report 98
Four-year summary 102
Segment information by quarter 103
Alternative KPIs 104
Defi nitions 105
Corporate governance report 106
Auditor’s report on the corporate governance statement 113
Board of Directors 114
Group Management 116
Annual General Meeting 118
1
Better Chicken for a Better Life
We all strive for better choice of food. Food that tastes better and is provided using best practices. We want to know that what we eat has been produced ethically and responsibly. We demand a level of transparency in our food production that reveals high quality levels, sustainable production practices and values we would be happy to call our own.
We believe that through our values, vision and commitment to better food production, Scandi Standard can produce Better Chicken.
Better Chicken for a Better Life
We all strive for a better life for ourselves, our loved ones and our community. We want to take conscious, meaningful steps towards achieving a better way to live and work every day. We can do this by taking part in making smart life choices – choices that are healthy for us and better for our planet, because adopting a sustainable lifestyle is essential for today and tomorrow.
We believe Scandi Standard can help people achieve a Better Life for themselves, their families and the planet.
This is Scandi Standard
3
12
1
1
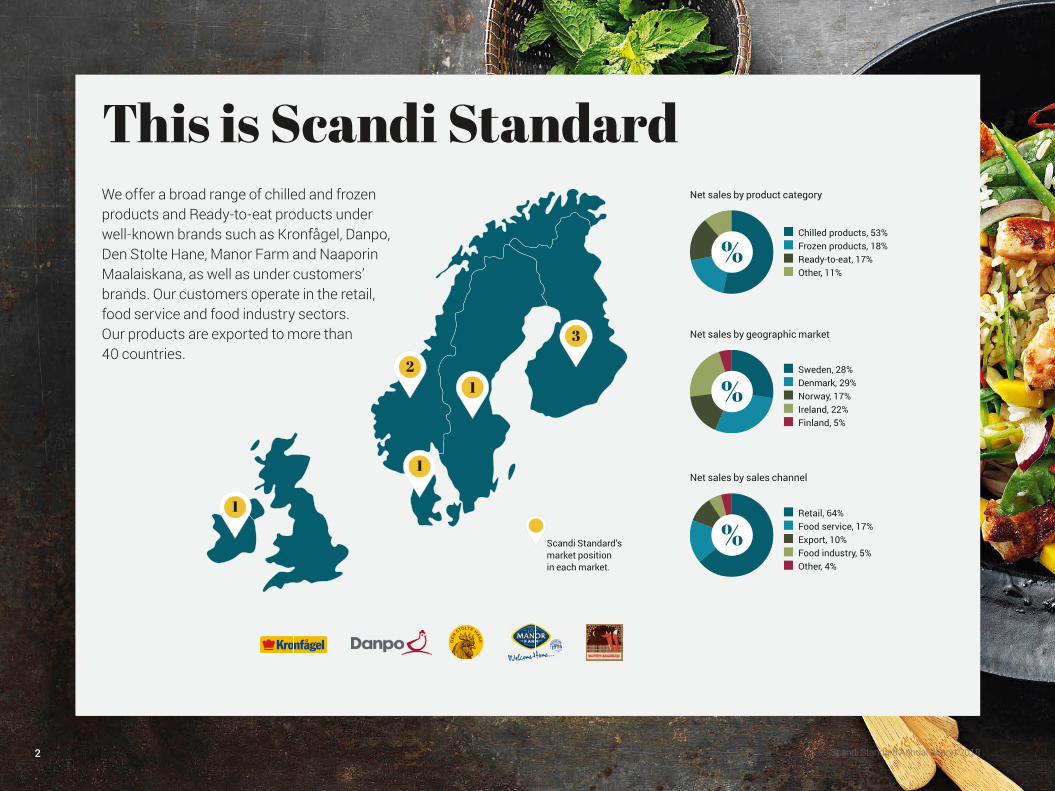
We offer a broad range of chilled and frozen products and Ready-to-eat products under well-known brands such as Kronfågel, Danpo, Den Stolte Hane, Manor Farm and Naaporin Maalaiskana, as well as under customers’ brands. Our customers operate in the retail, food service and food industry sectors. Our products are exported to more than 40 countries.
Scandi Standard’smarket position in each market.
Net sales by geographic market
Net sales by product category
Net sales by sales channel
Sweden, 28%Denmark, 29%Norway, 17% Ireland, 22% Finland, 5%
Chilled products, 53%Frozen products, 18%Ready-to-eat, 17% Other, 11%
Retail, 64%Food service, 17%Export, 10% Food industry, 5% Other, 4%
Scandi Standard Annual Report 20182
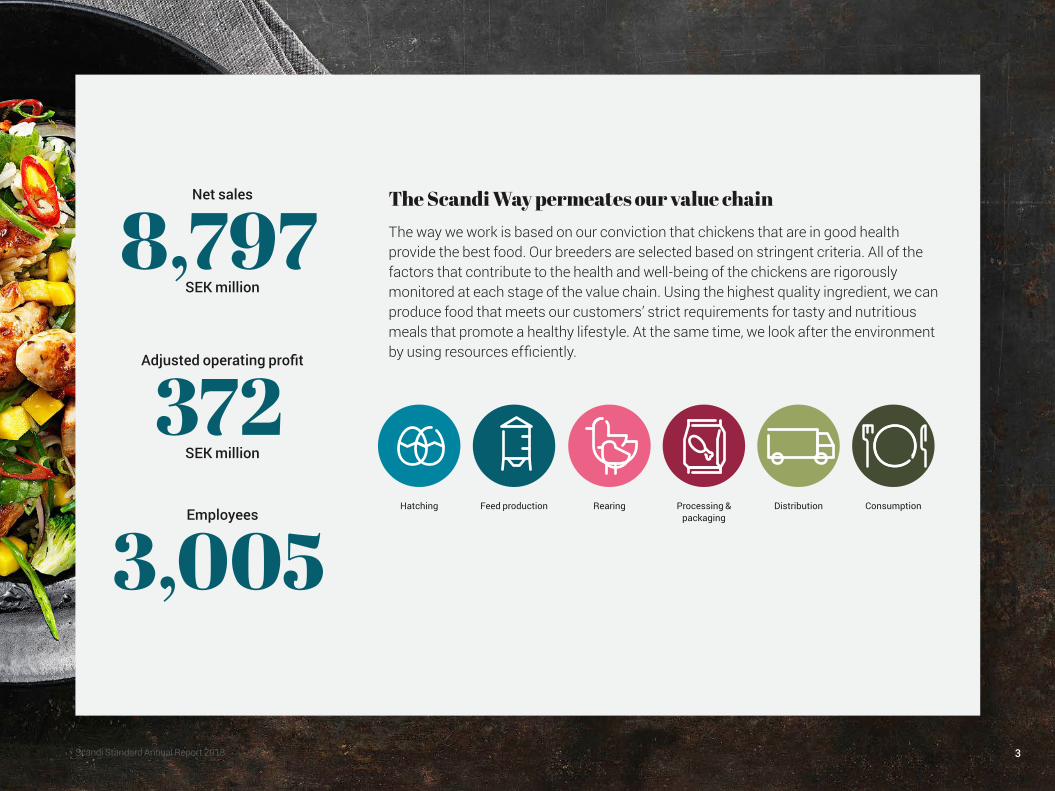
The Scandi Way permeates our value chainThe way we work is based on our conviction that chickens that are in good health provide the best food. Our breeders are selected based on stringent criteria. All of the factors that contribute to the health and well-being of the chickens are rigorously monitored at each stage of the value chain. Using the highest quality ingredient, we can produce food that meets our customers’ strict requirements for tasty and nutritious meals that promote a healthy lifestyle. At the same time, we look after the environment by using resources efficiently.
Net sales
8,797SEK million
Adjusted operating profit
372SEK million
Employees
3,005Hatching Feed production Rearing Processing &
packagingDistribution Consumption
Scandi Standard Annual Report 2018 3
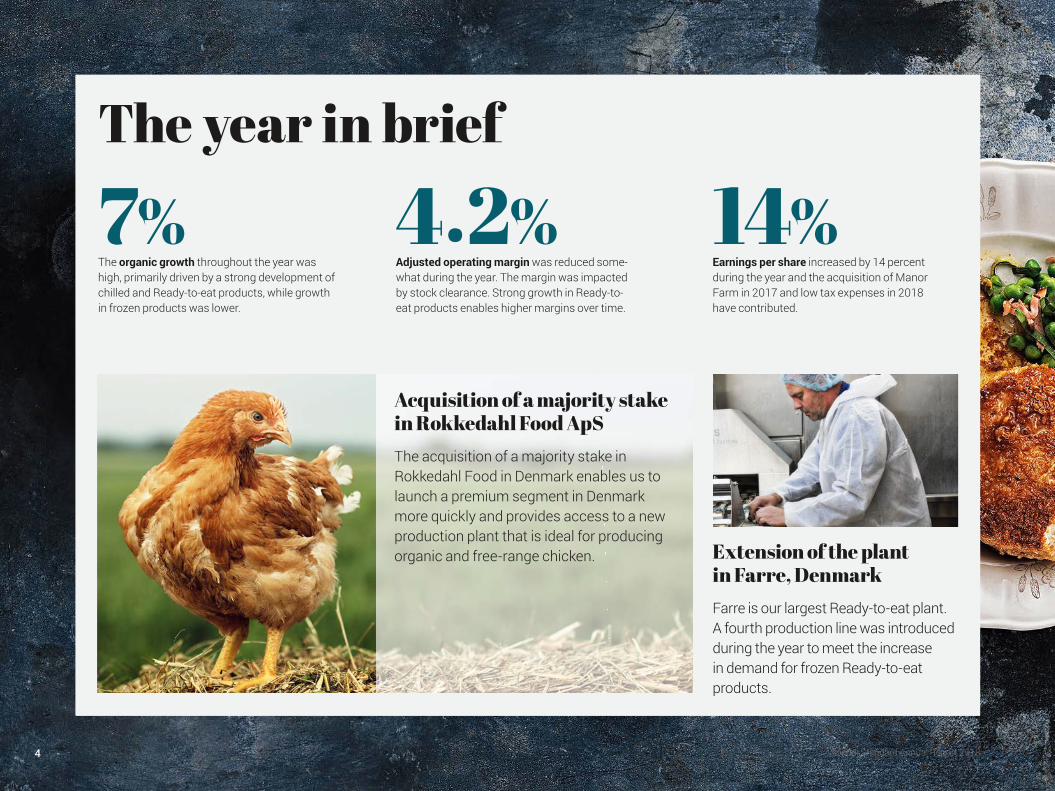
7%The organic growth throughout the year was high, primarily driven by a strong development of chilled and Ready-to-eat products, while growth in frozen products was lower.
4.2%Adjusted operating margin was reduced some-what during the year. The margin was impacted by stock clearance. Strong growth in Ready-to-eat products enables higher margins over time.
14%Earnings per share increased by 14 percent during the year and the acquisition of Manor Farm in 2017 and low tax expenses in 2018 have contributed.
Extension of the plant in Farre, DenmarkFarre is our largest Ready-to-eat plant. A fourth production line was introduced during the year to meet the increase in demand for frozen Ready-to-eat products.
The year in brief
Scandi Standard Annual Report 20184
Acquisition of a majority stake in Rokkedahl Food ApSThe acquisition of a majority stake in Rokkedahl Food in Denmark enables us to launch a premium segment in Denmark more quickly and provides access to a new production plant that is ideal for producing organic and free-range chicken.
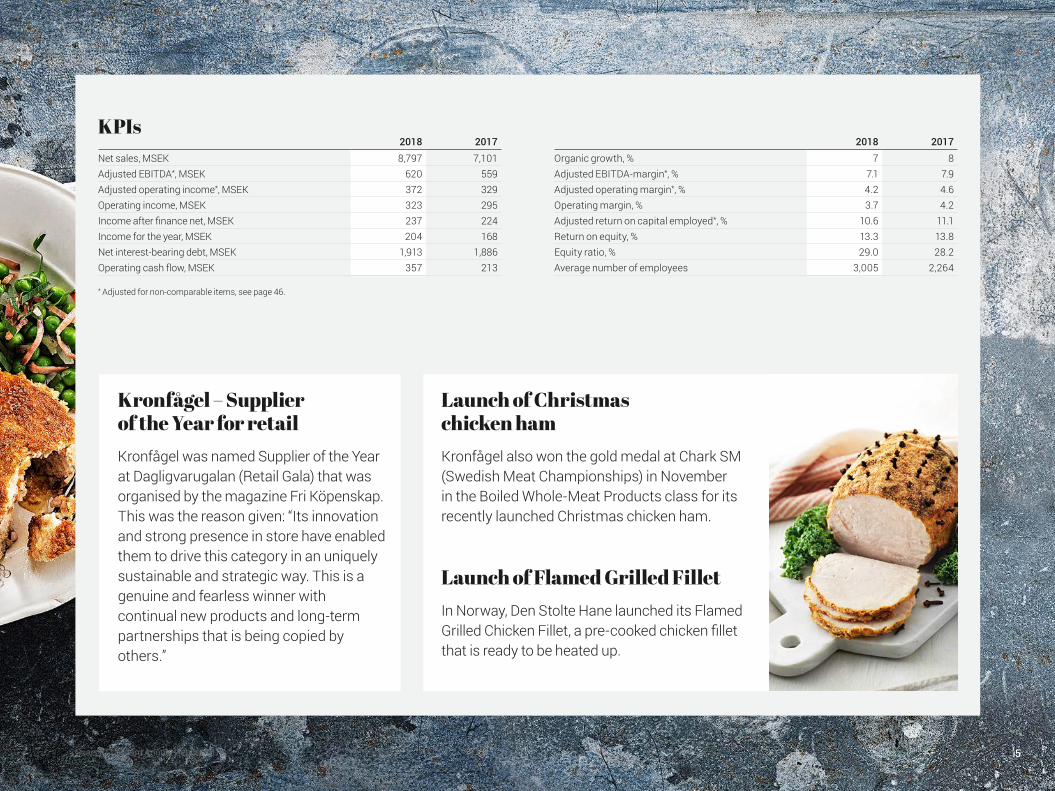
Kronfågel – Supplier of the Year for retailKronfågel was named Supplier of the Year at Dagligvarugalan (Retail Gala) that was organised by the magazine Fri Köpenskap. This was the reason given: “Its innovation and strong presence in store have enabled them to drive this category in an uniquely sustainable and strategic way. This is a genuine and fearless winner with continual new products and long-term partnerships that is being copied by others.”
Launch of Christmas chicken ham Kronfågel also won the gold medal at Chark SM (Swedish Meat Championships) in November in the Boiled Whole-Meat Products class for its recently launched Christmas chicken ham.
Launch of Flamed Grilled Fillet In Norway, Den Stolte Hane launched its Flamed Grilled Chicken Fillet, a pre-cooked chicken fillet that is ready to be heated up.
Scandi Standard Annual Report 2018 5
KPIs2018 2017
Net sales, MSEK 8,797 7,101Adjusted EBITDA*, MSEK 620 559Adjusted operating income*, MSEK 372 329Operating income, MSEK 323 295Income after finance net, MSEK 237 224Income for the year, MSEK 204 168Net interest-bearing debt, MSEK 1,913 1,886Operating cash flow, MSEK 357 213
2018 2017Organic growth, % 7 8Adjusted EBITDA-margin*, % 7.1 7.9Adjusted operating margin*, % 4.2 4.6Operating margin, % 3.7 4.2Adjusted return on capital employed*, % 10.6 11.1Return on equity, % 13.3 13.8Equity ratio, % 29.0 28.2Average number of employees 3,005 2,264
* Adjusted for non-comparable items, see page 46.

Scandi Standard Annual Report 2018
CEO statement
6
“Better Chicken for a Better Life”The standard of living and food habits are improving in many parts of the world. Awareness is increasing, with more people demand-ing nutritious food that is simple to prepare and good to eat. In our part of the world people are becoming more health-conscious and environmentally-aware, and want to be sure that the food they are eating has been produced with respect for the well-being of living creatures.
Scandi Standard was formed in 2013 to create a focused pro-ducer and supplier of chicken products that could make full use of the opportunities offered by chicken. The advantages of chicken include the efficient production methods and the fact that it is a varied and high-quality food source. This kind of company is also in a strong position to participate in and promote the desirable consolidation of the market and the development of both animal husbandry and production, focusing on what is best for the animal, people and the environment.
New visionOver the past year we have intensified our work on sustainability based on three themes: Chicken, People and Planet. This per-meates everything we do. We are continually starting projects to improve animal welfare, food safety, resource efficiency and healthy products. For example, we have updated and clarified our policies for animal welfare and the use of antibiotics.
We have formulated a new vision in “Better Chicken for a Better Life”. This vision summarises what we stand for and what we strive for every day in our operations. We are working on continu-ally developing animal welfare, healthy products, the work environ-ment and resource efficiency so that we can be a stable, long-term company with good profitability.
Chicken is an excellent source of protein that can be produced in a more resource-efficient and eco-friendly way than other animal protein sources. This makes it suitable to be used to meet the increasing needs of a growing global population. Chicken is a healthy food that meets the demands that come from greater awareness of the benefits of a balanced and nutritious diet.
We also strongly believe that animals that live in healthy and comfortable conditions produce better quality food. We want our chickens to feel good and we use rigorously tested methods and processes in our work. Everything we do is monitored and evalu-ated at every stage. This results in healthy chickens that produce good food with the lowest possible impact on the environment. This is The Scandi Way.
Delivering on our strategyWe have three strategic priorities: to promote organic growth; to improve efficiency throughout the supply chain; and to actively search for and participate in acquisitions and partnerships. We have helped to increase demand for chicken on our domestic markets by showing immense curiosity and being incredibly innovative. By working in a structured way with a joint function for developing and streamlining production processes, we have achieved significant cost reductions in production. Finally, our acquisitions have defi-nitely contributed to strengthening our market positions both in terms of our geographic locations and our products. In other words, we have delivered on our strategic priorities.
Change from withinThis year we took one step forward in our work to develop uniform and scalable operations that are continually developed and improved. We have restructured our organisation to facilitate and encourage the exchange of knowledge and experiences between different parts of the Group. This has enabled us to achieve Best Practice for the Group as a whole. Although we are keeping our country organisations, our focus will be more on the product categories that our operations are based on. They comprise Ready-to-cook, which is divided into chilled products (accounting for 53 percent of sales) and frozen products (accounting for 18 percent of sales) and Ready-to-eat (accounting for 17 percent of sales).
ResultsIn 2013, the Group’s first financial year, the business as a whole reported sales of more than SEK 5.2 billion. In the five years since then we have increased sales by an average of 11 percent per year.
CEO statement
Scandi Standard Annual Report 2018
CEO statement
7
We have been able to do this because of our strong positions on our domestic markets and because we have improved our competitiveness by sharing Best Practice between the various businesses in the Group. We have also carried out targeted acquisitions, both within niche markets such as organic produc-tion, and on new markets, like Ireland.
Financial developmentWe saw a strong improvement in Ready-to-cook in Ireland and Finland in 2018, capturing market shares on both of these markets. In Sweden we emerged from a challenging market situation in 2017, which improved in 2018. However, during the year we were still affected by the clearance sales of stock (our stock and our competitor’s stock) which resulted in pressure on prices. The market in Denmark remains challenging, but the launch of our new brand De Danske Familiegårde has been successful and we are expecting this investment to have a positive impact over the com-ing year. It is also worth mentioning that Finland reached an impor-tant milestone in the final quarter by reporting a positive adjusted operating profit.
In 2018 strong growth continued in the Ready-to-eat category. This has been driven by the restaurant sector still reporting good market growth, along with a high rate of innovation with several new products in both the retail sector and the food service seg-ment. Our investment in expanding the Ready-to-eat plant in Farre will support the continued profitable growth in this category.
Costs for feed increased significantly in the second half of the year, which meant that costs increased for our chickens. We have been successful in our work to compensate for these increases, even though some negotiations are still underway. We expect to fully compensate for this situation, although it will take a little longer in Ireland.
AcquisitionsThe integration of Manor Farm in Ireland which was acquired in 2017 is continuing according to plan and this business definitely had a positive impact on the Group during the year. In 2019 we are planning to make some of the investments that we identified to
increase capacity and efficiency and to further strengthen food safety and animal welfare.
During the year we acquired a majority stake in Rokkedahl Food ApS and merged our sales within the organic and free-range seg-ment with Rokkedahl. This will create a business that has a strong position and better conditions for efficient production. Through this acquisition we have gained access to a production plant that is adapted for organic production.
We continually monitor the structural changes in our industry and believe that we are in a strong position to play a role in the consolidation of the European chicken industry. The acquisition of Manor Farm is a good example of how we can create value and stability for our shareholders. This acquisition has helped our geographic diversification and we are positive about the range of improvement measures that have come from sharing experiences across borders.
ProspectsOur new vision and our in-depth sustainability work mean that we are well-equipped to continue our positive development into the future. We are also continuing our work to achieve our financial goals, which will help us lay the foundations for stable cash flows. For us, proactively evaluating structural opportunities in this industry is a natural part of this work.
I would like to thank our employees, customers and partners for a year that was filled with challenges and positive changes. Together we are in a great position to see the Group develop in a positive direction. I would also like to underline our new vision: Better Chicken for a Better Life.
Leif Bergvall HansenManaging Director and CEO
“ We strongly believe that animals that live in healthy and comfortable conditions produce better quality food.”
Scandi Standard Annual Report 2018
CEO statement
8
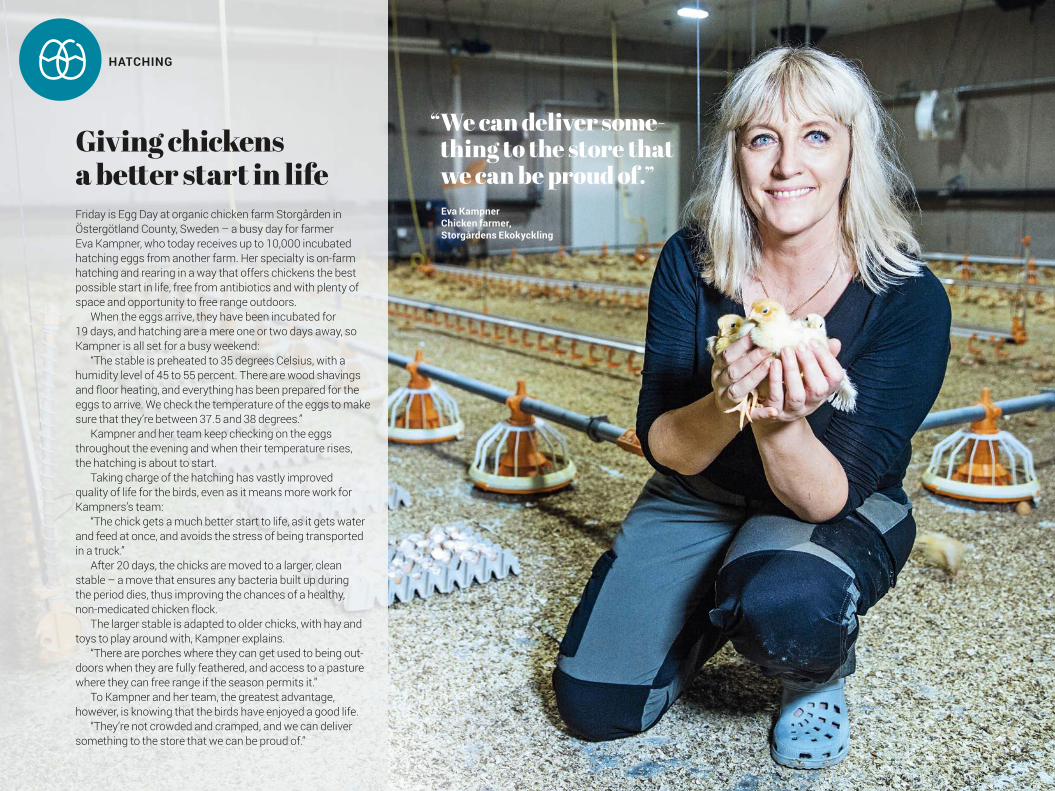
Giving chickens a bett er start in lifeFriday is Egg Day at organic chicken farm Storgården in Östergötland County, Sweden – a busy day for farmer Eva Kampner, who today receives up to 10,000 incubated hatching eggs from another farm. Her specialty is on-farm hatching and rearing in a way that offers chickens the best possible start in life, free from antibiotics and with plenty of space and opportunity to free range outdoors.
When the eggs arrive, they have been incubated for 19 days, and hatching are a mere one or two days away, so Kampner is all set for a busy weekend:
“The stable is preheated to 35 degrees Celsius, with a humidity level of 45 to 55 percent. There are wood shavings and floor heating, and everything has been prepared for the eggs to arrive. We check the temperature of the eggs to make sure that they’re between 37.5 and 38 degrees.”
Kampner and her team keep checking on the eggs throughout the evening and when their temperature rises, the hatching is about to start.
Taking charge of the hatching has vastly improved quality of life for the birds, even as it means more work for Kampners’s team:
“The chick gets a much better start to life, as it gets water and feed at once, and avoids the stress of being transported in a truck.”
After 20 days, the chicks are moved to a larger, clean stable – a move that ensures any bacteria built up during the period dies, thus improving the chances of a healthy, non-medicated chicken flock.
The larger stable is adapted to older chicks, with hay and toys to play around with, Kampner explains.
“There are porches where they can get used to being out-doors when they are fully feathered, and access to a pasture where they can free range if the season permits it.”
To Kampner and her team, the greatest advantage, however, is knowing that the birds have enjoyed a good life.
“They’re not crowded and cramped, and we can deliver something to the store that we can be proud of.”
“ We can deliver some-thing to the store that we can be proud of.”Eva KampnerChicken farmer,Storgårdens Ekokyckling
HATCHING

Scandi Standard Annual Report 2018
CEO statement
9
“ There’s a real satis faction in seeing the birds perform to their full potential.”Christopher McHugh Quality Feed Manager, Manor Farms
Great feed, healthy chickensChickens need quality feed to grow from chicks into healthy birds, and high-standard feed cannot be produced without strategic planning, cutting- edge tools and calculated collaboration. There are myriad tests that are done throughout the feed production process and serious considerations placed on traceability and control. This is because, as Manor Farms’ Quality Feed Manager Christopher McHugh says: “You cannot place a price on feed security”.
Indeed. At the Kolbe feed mill where he works in Shercock, Ireland, more than 40,000 tests are carried out on the sourced raw materials and the fi nished feed at the laboratory on site, including Near Infrared Spectroscopy (NIRS) which can provide instant data for nutrient value analysis.
“Consisting primarily of wheat, soya meal and maize, each individual pellet of feed is produced – without using antibiotics – to provide everything the chick requires to develop and perform,” says McHugh. “It’s part of our vertical integration, where we control one of the biggest and most important parts of the supply chain, reassuring the customer and consumer.”
McHugh overseas mill operations and main-tains constant communication with his lab techni-cian, head of agriculture, fi eld advisors and individ-ual farmers to maintain an overview of the feed at every stage of its production, ensuring an effi cient production cycle. Producing feed effi ciently affects the entire supply chain as it results in fewer trips needed to transport the feed which means fewer emissions, fewer investments and lower costs.
FEED PRODUCTION
Scandi Standard Annual Report 2018
Trends and drivers
10
The economic growth in developing countries and a more efficient rearing process have resulted in a higher propor-tion of the population being able to afford to eat meat pro-tein, while the population as a whole is increasing in many parts of the world as more people are living longer. Greater awareness of health and the environment has also been a key contributing factor in the increase in demand.
The higher economic growth in developing countries leads to a higher standard of living and a more cost-con-scious population who demand better and more nutritional food that is safe and healthy. Chicken is relatively low in calories and high in protein and is considered to be health-ier for us humans than red meat. Food recommendations from around the world unanimously indicate that a health-ier diet should contain more white meat and less red meat.
Urbanisation and changes in living patterns also result in greater environmental awareness among the population and a willingness to contribute to sustainable develop-ment by making conscious and smart decisions in day-to-day life. An increasing number of people realise that chicken is an affordable source of protein for individuals, society and the environment. The short growing period of chicken implies, for example, a lower feed and energy usage than for other types of meat, which translates into lower production costs.
Greater awareness of climate and environmental issues is helping to increase the demand for locally produced products. Chicken is mainly produced for the local market, which requires less transport and shorter transport distances. As chicken is mostly produced and consumed in the local markets, there is also a high level of trans-parency in the supply chain.
As a result of the low feed to meat conversion ratio, chicken is one of the most environmentally friendly sources of meat protein in terms of greenhouse gas emissions per kg weight of meat produced. Chicken feed requires small cultivation areas. The production of chicken also has a lower climate impact than the production of red meat. OECD estimates that approximately half of the world’s consumption of protein in 2050 will comprise chicken, an increase from around 39 percent in 2013–2015.1)
In a world where globalisation is constantly increasing, people from different cultures and religions are living side by side. Although various traditions, customs and food habits remain, some other habits change; for example, many people in the West who used to eat red meat and pork are turning away from them for both health and envi-ronmental reasons. It is extremely challenging for schools, hospitals, staff canteens and other food service compa-
nies that want to be able to offer delicious and nutritional food that is suitable for everyone. Chicken is the perfect solution to this problem as it is accepted as food by all of the major religions in the world.
Tradition and trends are an integral part of cooking. Over time these trends become tradition, and chicken, which was not used particularly often in North-European cooking a few decades ago, is now enjoying an unthreat-ened position as an affordable, healthy and varied main ingredient in food for a continually growing percentage of Nordic households. People are also travelling more and further away than previous generations and have got used to new taste experiences, often with strong and exotic spices. Chicken is easy and good to use in spicy dishes.
Food habits are changing in many different ways. Increasing urbanisation and new living standards tend to increase demand for ready-made food. The growth in the market for ready-made food and increased eating out supports chicken consumption, as chicken is easy to use and more affordable than other types of meat.
Trends and drivers in the global market for chickenGlobal demand for chicken has increased steadily in recent decades. Chicken is a good and healthy type of food that is rich in protein, lean in fat, easy to cook and whose flavour can be varied. Production can be on both a large and small scale and is more resource-efficient than other kinds of animal husbandry, particularly when looking at nutritional value in relation to the amount of resources used.
1) Source: OECD.
Scandi Standard Annual Report 2018
Trends and drivers
11
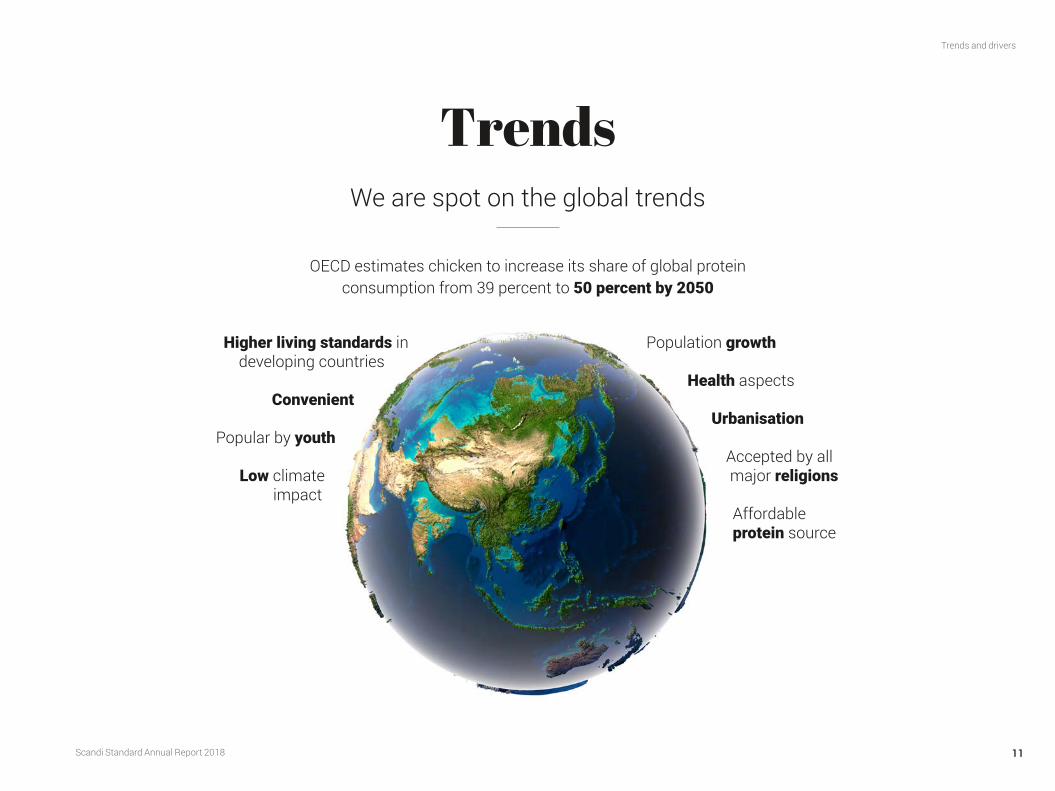
TrendsWe are spot on the global trends
Higher living standards in developing countries
Convenient
Popular by youth
Low climate impact
OECD estimates chicken to increase its share of global protein consumption from 39 percent to 50 percent by 2050
Population growth
Health aspects
Urbanisation
Accepted by all major religions
Affordable protein source

Scandi Standard Annual Report 2018
Our markets
12
Our markets
RetailRetail comprises approximately 64 percent of our sales and growth is highest in chilled products and Ready-to-eat products. Our markets are characterised by a high degree of consolidation among a few established companies with strong market positions in each market. In recent years, these established actors have been challenged first by low-price chains and now by online shop-ping, even though online shopping continues to represent a small share of retail.
Strict regulations and laws on animal welfare are important prerequisits for high consumer confidence. There is a high level of confidence, in particular for locally produced products. The count-ries where we operate are also basically free from salmonella.
SwedenA high proportion of the sales in Sweden have traditionally been in frozen products with little processing. In recent years the trend has moved towards a higher proportion of chilled products; a trend that is expected to continue as consumers shop more often and more spontaneously. We are also seeing a higher trend towards processed products as they offer more convenience.
The Swedish retail market has a relatively high proportion of branded products, with Scandi Standard’s Kronfågel brand enjoying a strong position. The market is also characterised by a strong preference for domestically produced products. Imports are primarily frozen products with a low-price profile.
Organic products remain a niche product, but demand is expected to increase in the future as a result of a higher focus on sustainability and health among consumers.
DenmarkThe Danish retail market is characterised by a strong focus on prices and squeezed margins. Surveys show that Danish consum-ers are willing to pay more for products of a higher quality. On the basis of this, we launched new concepts just over a year ago under the De Danske Familiegårde brand. These products are of a higher quality, focusing on animal welfare with chickens hatched in pens and that grow more slowly. This launch has so far been a success.
We have also launched free-range and organic chickens under this brand. In order to further enhance the offering to retail in these premium categories, we acquired a majority stake in Rokkedahl Food ApS in the autumn of 2018, which has a production plant that is ideal for these products.
NorwayThe Norwegian retail market is impacted by the fact that Norway as a non-EU member has import duties on food. This basically means that there is no imported chicken in the Norwegian market. Retail is more concentrated than on other markets where we operate, with a greater focus on the stores’ own brands.
In recent years, there has been a strong trend towards cooked products, which means that the proportion of processed products is higher than in other markets. There is a strong focus on chilled prod-ucts and the proportion of frozen products in store is relatively low.
IrelandIreland is our most recent addition and has a retail market that is characterised by pride in domestically produced products. Several of the major retailers only sell domestic chicken products. Chicken
The market for chicken is characterised by strong organic growth, particularly in the Nordic markets. Chicken consumption remains relatively low, giving potential for this strong growth to continue.
Global consumption of poultry
0
30
60
90
120
150
23222120191817161514
Million tonnes
Forecast Source: OECD-FAO
Growth potentialChicken consumption per capita and yearKg
15
20
25
30
35
40
45
3%1%−1%
Source: Association of Poultry Processors and Poultry Trade within the EU, the Swedish Board of Agriculture, and others, and the company’s estimates.
Average for the EU
Annualgrowth

Scandi Standard Annual Report 2018
Our markets
13
consumption is relatively high in Ireland compared with the other markets where we operate. The stores primarily offer the stores’ own brands and Scandi Standard mostly supplies under these brands.
Ireland also has specialised meat stores called “butcher’s shops”, which often sell chicken and other meat products at relatively low prices. The proportion of imports tends to be higher there.
FinlandRetail in Finland is dominated by two major companies, although low-price retail has taken large shares in recent times. This market is characterised almost exclusively by chilled products, while processing is relatively low.
Scandi Standard has entered this market in recent years and introduced a number of new products. Scandi Standard delivers both under the stores’ own brands and under its own brand Naapurin Maalaiskana.
Food serviceThis channel relates to sales to restaurant wholesalers and cater-ing such as schools, hospitals and retirement homes, etc., but also directly to restaurants in some instances. The restaurant channel
has a higher underlying growth than the retail channel, and the number of restaurant visits is continuing to increase in all our markets. Experience shows that chicken accounts for a higher proportion of consumption in restaurants than in meals at home.
Traditionally the proportion of imports has been higher in this channel than in retail as the origin is not clarified in the same way. We are seeing signs in some of our markets that awareness is increasing among restaurant visitors, so the origin of the food is becoming more important.
This channel accounts for 17 percent of Scandi Standard’s sales. It is a priority segment that is expected to become more important. Investments will be made in more Ready-to-eat products for this channel and in marketing coordination.
Scandi Standard is also a major supplier to many fast-food chains in several countries in Europe, including McDonald’s. The Group’s processing plant in Denmark is certified for deliveries to McDonald’s.
ExportsScandi Standard mostly exports to retail chains and restaurant wholesalers in Europe outside our domestic markets, and surplus products such as wings and feet are also exported, primarily to Asia.
Change in the retail market for chicken products in 20181)
Our markets 2018 Sweden Denmark Norway Ireland Finland
The retail market for chicken products BSEK 4.3 BDKK 2.3 BNOK 2.7 MEUR 250 MEUR 320Share of chilled products, % 45 78 89 99 95Share of frozen products, % 55 22 11 1 5Scandi Standard’s market position 1 1 2 1 3Largest competitors Guldfågeln
AtriaHK Scan Nortura
Norsk KyllingWestern Brand
ShannonvaleHK Scan
Atria
+5%Sweden
0%Denmark
+2%Norway
+3%Ireland
+4%Finland
1) Sources: Sweden, Denmark, Norway: Nielsen; Ireland: Kantar; Finland: Broiler barometer
2 Improve effi ciency throughout the supply chain1 Drive organic growth
3 Strategic acquisitions and partnerships
Scandi Standard Annual Report 201814
Strategic direction
Our strategy for profi table growth
Scandi Standard Annual Report 2018
Strategic direction
15
1 Drive organic growth
Increase investments in product development Scandi Standard’s mission is to contribute to the joy of food and sustainable food production.
The investments in product development have gradu-ally increased in recent years, which have contributed to both growth and an increase in processed products. The product range has been broadened with additional catego-ries, everything from new cuts to ready-made products. Examples include chicken bacon, chicken sausages, minced chicken, strips and sliced products that are ready to cook, pre-fried and ready-to-eat products with different flavours and seasonings, marinated grilled products, as well as free-range and organic chicken.
The most important trends that drive the development work are the demand for tasty, easy-to-cook and healthy products based on locally produced chicken.
The Group has a product development plan covering the coming 18–36 months with major launches two to three times per year in each country. The development process is based on market segmenting and consumer insight. Product innovation can also be driven by inno-vations in production, such as new equipment and new processes.
Product development is primarily conducted locally in each country as the taste and product preferences to some extent differ between the markets. The coordination and exchange of ideas and concepts between the coun-tries have increased in recent years.
Strengthen the brandsThe Group’s products are sold both under its own brands and under customers’ own brands, referred to as ‘private labels.’ In 2018 sales of private labels accounted for approximately 55 (50) percent of net sales.
Of the Group’s brands, the Kronfågel brand in Sweden and the Danpo brand in Denmark have leading positions in their respective markets. Surveys show that consumers have higher awareness of both these brands than the largest competitors’. According to surveys in 2018 the spontaneous brand awareness of Kronfågel was approxi-mately 60 percent, and approximately 38 percent for Danpo.
Den Stolte Hane is the second biggest chicken brand in Norway. Our brand in Finland is Naapurin Maalaiskana, which is a new brand that will be built up in the coming years. Our Irish brand is Manor Farm, which is the market leader in Ireland.
A number of different measures, including investments in product development, are being taken to strengthen our position in all of these countries. Danpo’s premium range, under the brand De Danske Familiegårde, was strengthened this year through the acquisition of Rokkedahl Food ApS.
The Group also has a number of brands focused on specific product segments, such as Bosarpskyckling in Sweden and De Danske Familiegårde in Denmark within organic and free-range chicken, Ivars in Sweden, Chicky World in Denmark. The sale of private labels results in economies of scale and contributes to creating customer relations within retail.
Strong position within organic chicken Although organic chicken still accounts for a small proportion of the total market, growth is higher than for traditional chicken. In Denmark, a majority stake of Rokkedahl Food ApS was acquired during the year, which has operated in this segment over a long period of time.
STRATEGY 1
• Increase investments in product development and meet the demand for healthy food that is easy to cook.
• Grow in the premium segments and within processed products.
• Strengthen the brands.
• Develop the chicken category in collaboration with retailers.
• Grow within the food service segment.
Scandi Standard Annual Report 2018
Strategic direction
16
Develop the chicken category in collaboration with retailersThe retail sector is Scandi Standard’s largest sales channel representing more than half of total sales. For a long time, the Group has been the main supplier of a number of large retailers in Sweden, Denmark, Norway and Ireland.
The Group manages continuous projects together with important customers for changes in stores in order to stimulate the demand for chicken and drive the development of this category.
Grow within the food service channelThe food service channel includes fast-food restau-rants, hotels, restaurants and catering within the public and private sector. The channel accounted for approximately 17 percent of the Group’s net sales in 2018.
Sales in this channel have increased in recent years driven by people eating out more frequently and consumers regarding chicken as healthier than other types of meat. Chicken is also more affordable and considered as being easier to cook than other types of meat. In addition to this, chicken is expanding the customer base of fast-food retailers to include more health-conscious consumers.
For many years the Group has been one of five suppliers of McDonald’s in Europe.
Given the Group’s size and long-standing experi-ence as a leading supplier, there are good further growth opportunities within food service in the whole of northern Europe. The expansion at our plant in Farre in Denmark will enable this kind of growth.
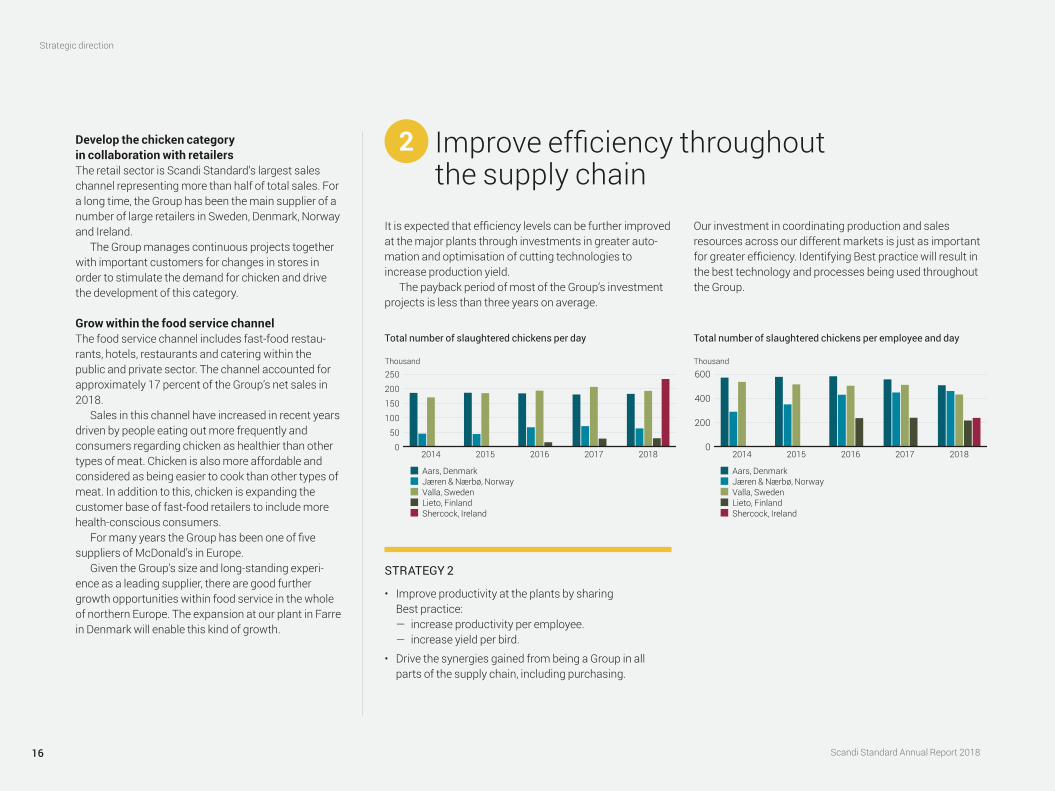
2 Improve efficiency throughout the supply chain
It is expected that efficiency levels can be further improved at the major plants through investments in greater auto-mation and optimisation of cutting technologies to increase production yield.
The payback period of most of the Group’s investment projects is less than three years on average.
Our investment in coordinating production and sales resources across our different markets is just as important for greater efficiency. Identifying Best practice will result in the best technology and processes being used throughout the Group.
STRATEGY 2
• Improve productivity at the plants by sharing Best practice: — increase productivity per employee. — increase yield per bird.
• Drive the synergies gained from being a Group in all parts of the supply chain, including purchasing.
Total number of slaughtered chickens per employee and dayTotal number of slaughtered chickens per day
0
200
400
600
20182017201620152014
Thousand
0
50
100
150
200
250
20182017201620152014
Thousand
Aars, DenmarkJæren & Nærbø, NorwayValla, SwedenLieto, FinlandShercock, Ireland
Aars, DenmarkJæren & Nærbø, NorwayValla, SwedenLieto, FinlandShercock, Ireland
Scandi Standard Annual Report 2018
Strategic direction
17
Kronfågel
2017
2015
2013
2012
2012
Naapurin Maalaiskan
a
Danpo
Manor Farm
Den Stolte Hane
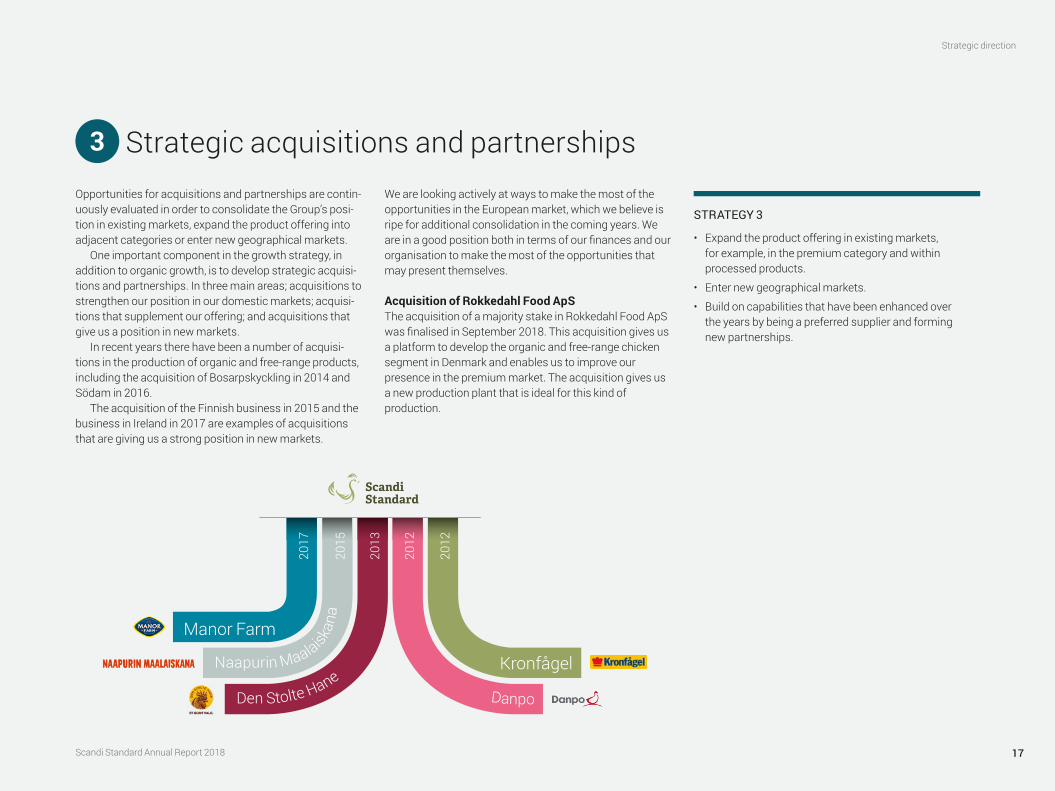
3 Strategic acquisitions and partnershipsOpportunities for acquisitions and partnerships are contin-uously evaluated in order to consolidate the Group’s posi-tion in existing markets, expand the product offering into adjacent categories or enter new geographical markets.
One important component in the growth strategy, in addition to organic growth, is to develop strategic acquisi-tions and partnerships. In three main areas; acquisitions to strengthen our position in our domestic markets; acquisi-tions that supplement our offering; and acquisitions that give us a position in new markets.
In recent years there have been a number of acquisi-tions in the production of organic and free-range products, including the acquisition of Bosarpskyckling in 2014 and Södam in 2016.
The acquisition of the Finnish business in 2015 and the business in Ireland in 2017 are examples of acquisitions that are giving us a strong position in new markets.
We are looking actively at ways to make the most of the opportunities in the European market, which we believe is ripe for additional consolidation in the coming years. We are in a good position both in terms of our fi nances and our organisation to make the most of the opportunities that may present themselves.
Acquisition of Rokkedahl Food ApSThe acquisition of a majority stake in Rokkedahl Food ApS was fi nalised in September 2018. This acquisition gives us a platform to develop the organic and free-range chicken segment in Denmark and enables us to improve our presence in the premium market. The acquisition gives us a new production plant that is ideal for this kind of production.
STRATEGY 3
• Expand the product offering in existing markets, for example, in the premium category and within processed products.
• Enter new geographical markets.
• Build on capabilities that have been enhanced over the years by being a preferred supplier and forming new partnerships.

Scandi Standard Annual Report 201818
Growing bett er togetherThirty-three days. That’s the average time Den Stolte Hane’s Growth Supervisor Hallstein Bø spends with each new flock. About eight times a year, a new flock of chickens roams freely around his 1 500-square-meter breeding house on a sawdust-covered floor, eating, exercising and growing into healthy birds. So, what kind of exercise do chickens like?
“We installed ramps around 40 centi meters above the floor and at both ends the chickens can walk up whenever they want,” says Bø.
“They really like it, and it’s a part of our mantra that a chicken that has had a good life will grow right.”
Bø ensures the standards and requirements set for each chicken’s health needs are met, and often surpassed.
“One of the most important measurements is humidity,” says Bø.
“Once we get rid of the humidity, their waste becomes very dry. It mixes with the sawdust to become like a powder.”
This is extremely important as wet waste causes infections under their feet and healthy feet are a sign of a good upbringing.
“We like to brag that we have maybe the cleanest chickens in world,” says Bø.
“We do not use antibiotics at all and we have the best growth rate, all because we have high-quality demands and we care.”
Hallstein BøGrowth Supervisor & Chicken farmer,Den Stolte Hane
REARING
Kjell Ingar Bø, Breeder
Scandi Standard Annual Report 2018
Financial targets
19
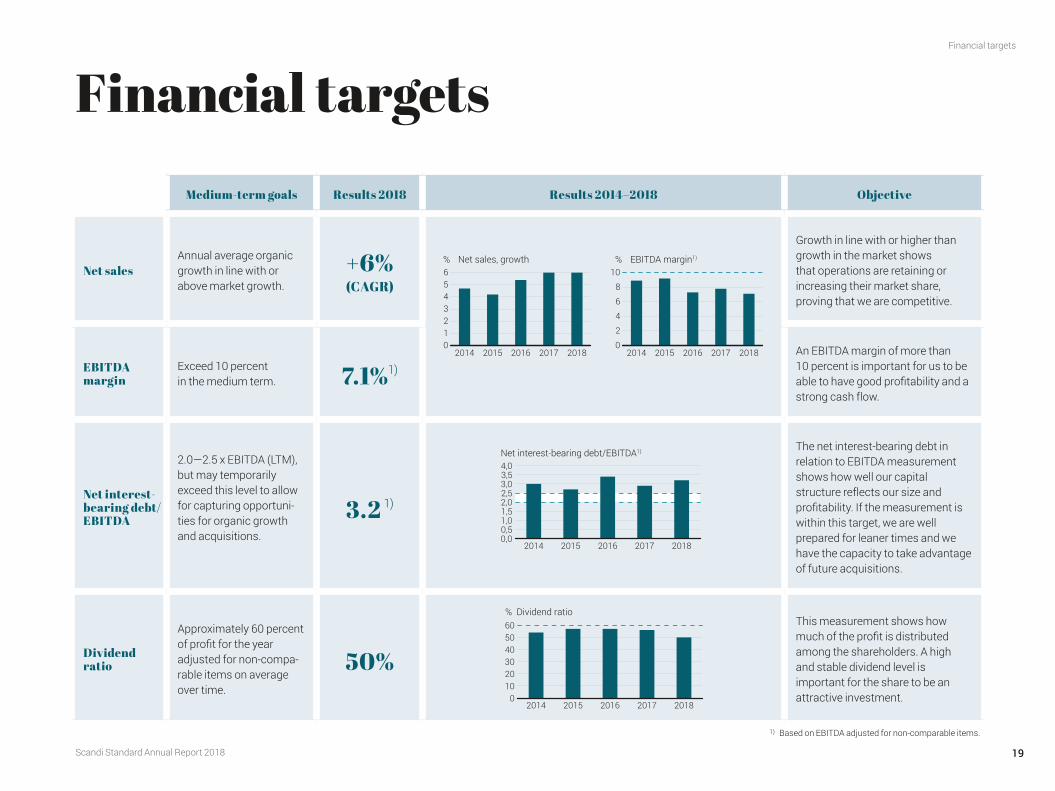
Financial targetsMedium-term goals Results 2018 Results 2014–2018 Objective
Net salesAnnual average organic growth in line with or above market growth.
+6% (CAGR)
Growth in line with or higher than growth in the market shows that operations are retaining or increasing their market share, proving that we are competitive.
EBITDA margin
Exceed 10 percent in the medium term. 7.1%1)
An EBITDA margin of more than 10 percent is important for us to be able to have good profitability and a strong cash flow.
Net interest-bearing debt/ EBITDA
2.0—2.5 x EBITDA (LTM), but may temporarily exceed this level to allow for capturing opportuni-ties for organic growth and acquisitions.
3.2 1)
The net interest-bearing debt in relation to EBITDA measurement shows how well our capital structure reflects our size and profitability. If the measurement is within this target, we are well prepared for leaner times and we have the capacity to take advantage of future acquisitions.
Dividend ratio
Approximately 60 percent of profit for the year adjusted for non-compa-rable items on average over time.
50%
This measurement shows how much of the profit is distributed among the shareholders. A high and stable dividend level is important for the share to be an attractive investment.
1) Based on EBITDA adjusted for non-comparable items.
0123456
201820172016201520140
2
4
6
8
10
20182017201620152014
% Net sales, growth EBITDA margin1)%
0,00,51,01,52,02,53,03,54,0
20182017201620152014
Net interest-bearing debt/EBITDA1)
0102030405060
20182017201620152014
% Dividend ratio
Scandi Standard Annual Report 201820
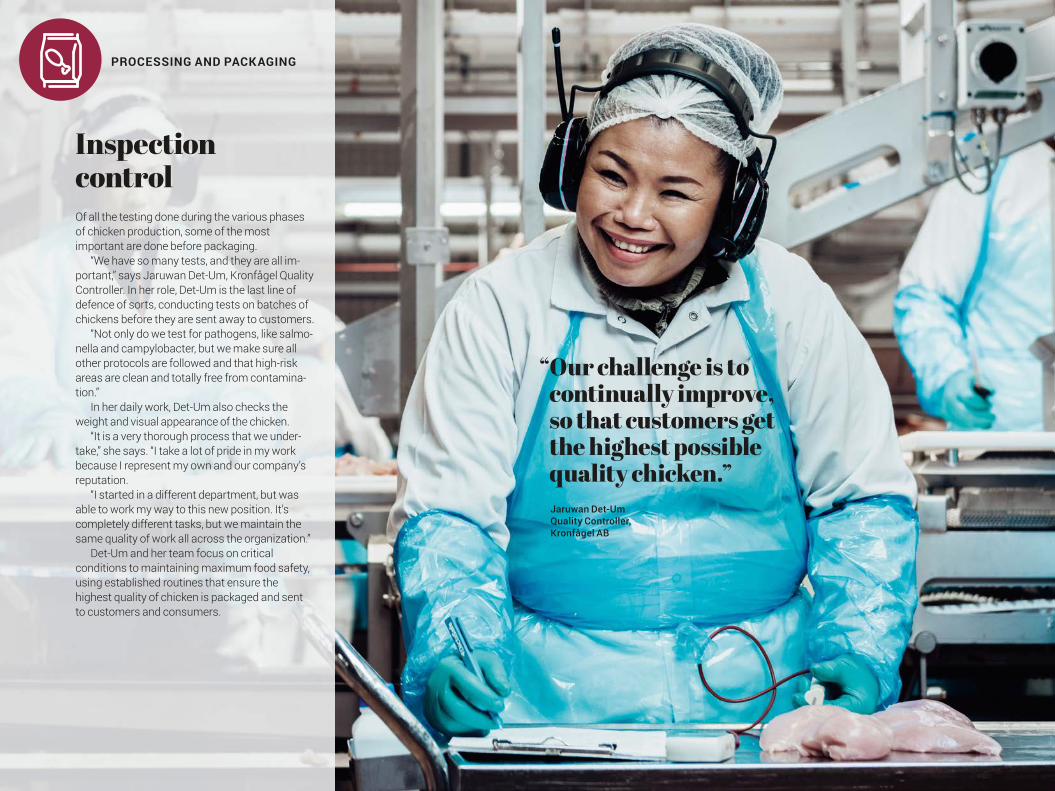
Inspection controlOf all the testing done during the various phases of chicken production, some of the most important are done before packaging.
“We have so many tests, and they are all im -portant,” says Jaruwan Det-Um, Kronfågel Quality Controller. In her role, Det-Um is the last line of defence of sorts, conducting tests on batches of chickens before they are sent away to customers.
“Not only do we test for pathogens, like salmo-nella and campylobacter, but we make sure all other protocols are followed and that high-risk areas are clean and totally free from contamina-tion.”
In her daily work, Det-Um also checks the weight and visual appearance of the chicken.
“It is a very thorough process that we under-take,” she says. “I take a lot of pride in my work because I represent my own and our company’s repu tation.
“I started in a different department, but was able to work my way to this new position. It’s completely different tasks, but we maintain the same quality of work all across the organization.”
Det-Um and her team focus on critical conditions to maintaining maximum food safety, using established routines that ensure the highest quality of chicken is packaged and sent to customers and consumers.
“ Our challenge is to continually improve, so that customers get the highest possible quality chicken.”Jaruwan Det-UmQuality Controller,Kronfågel AB
PROCESSING AND PACKAGING
Scandi Standard Annual Report 2018
Operations and value chain
21
Operations and value chain
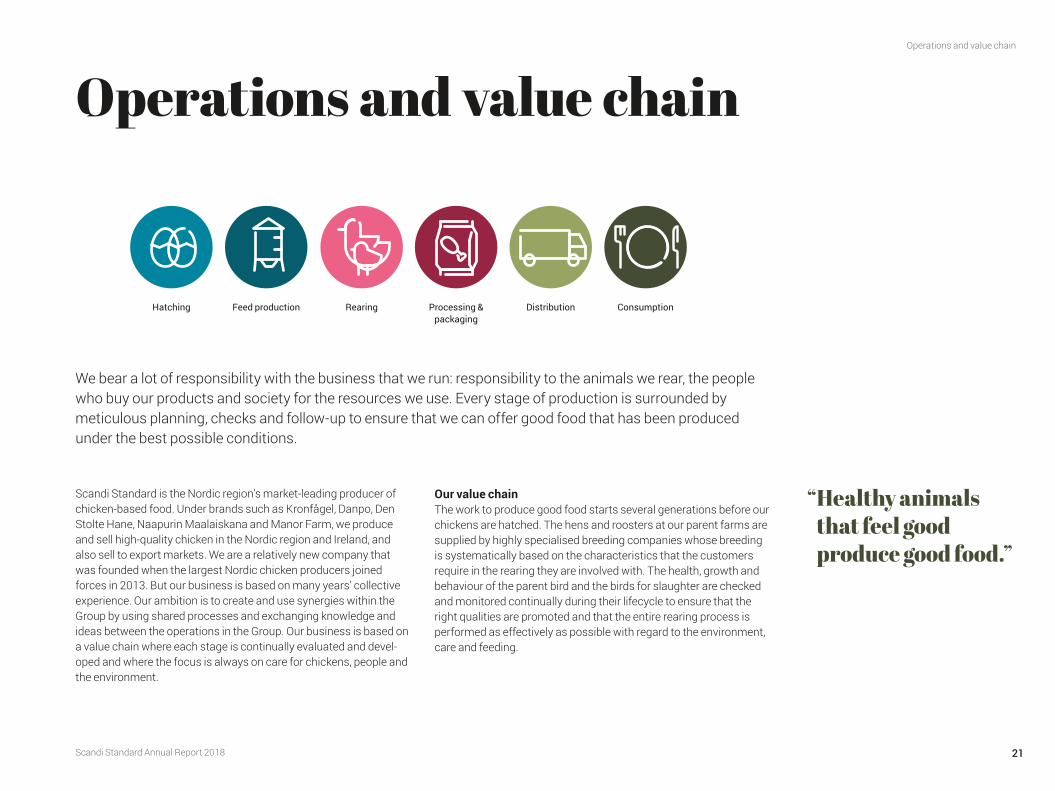
Scandi Standard is the Nordic region’s market-leading producer of chicken-based food. Under brands such as Kronfågel, Danpo, Den Stolte Hane, Naapurin Maalaiskana and Manor Farm, we produce and sell high-quality chicken in the Nordic region and Ireland, and also sell to export markets. We are a relatively new company that was founded when the largest Nordic chicken producers joined forces in 2013. But our business is based on many years’ collective experience. Our ambition is to create and use synergies within the Group by using shared processes and exchanging knowledge and ideas between the operations in the Group. Our business is based on a value chain where each stage is continually evaluated and devel-oped and where the focus is always on care for chickens, people and the environment.
Our value chainThe work to produce good food starts several generations before our chickens are hatched. The hens and roosters at our parent farms are supplied by highly specialised breeding companies whose breeding is systematically based on the characteristics that the customers require in the rearing they are involved with. The health, growth and behaviour of the parent bird and the birds for slaughter are checked and monitored continually during their lifecycle to ensure that the right qualities are promoted and that the entire rearing process is performed as effectively as possible with regard to the environment, care and feeding.
We bear a lot of responsibility with the business that we run: responsibility to the animals we rear, the people who buy our products and society for the resources we use. Every stage of production is surrounded by meticulous planning, checks and follow-up to ensure that we can offer good food that has been produced under the best possible conditions.
Hatching Feed production Rearing Processing & packaging
Distribution Consumption
“ Healthy animals that feel good produce good food.”

Scandi Standard Annual Report 2018
Operations and value chain
22
Parent bird farm The parent birds live in pens where light, temperature and moisture are checked and adapted continually to ensure that the flocks are healthy and can live under conditions that are as natural as possible. Both here and at later stages in the production chain, it is important for the animals to be of the same age and size to ensure that flocks operate as effectively as possible. The hens have access to enclosed nests where they go to lay their eggs. Most hens lay an average of one egg per day. From the conveyor belt the eggs are loaded onto crates and are taken to a temperature-con-trolled egg warehouse before being transported to the hatchery.
Hatching and feed productionAt the hatchery the eggs are first inspected to check that they have been fertilised and contain the embryo. The eggs are then placed on trays that are put on an incubator trolley, where the tempera-ture, moisture and carbon dioxide content in the air are carefully regulated. When the hen herself sits on her eggs, she turns them several times a day to make sure the yoke (the embryo) is pro-tected in the centre of the egg. In the hatchery, the egg is tilted for-wards and backwards by machine in the trays to achieve the same effect. After 18 days on the incubator trolley, the eggs are placed in hatching trays to await hatching. Hatching starts on the egg’s 20th day in the hatchery and the process is completed just past the 21st day. An average of 85 percent of eggs produces a live chicken. When they are dry, the newly hatched chickens are separated from the remnants of the shell, their quality is checked, and it is then time to transport the day-old chicken to a rearing farm.
Our operations in Ireland also include producing our own feed for rearing chickens. When the feed is being produced, meticulous checks are carried out on its composition and nutritional content.
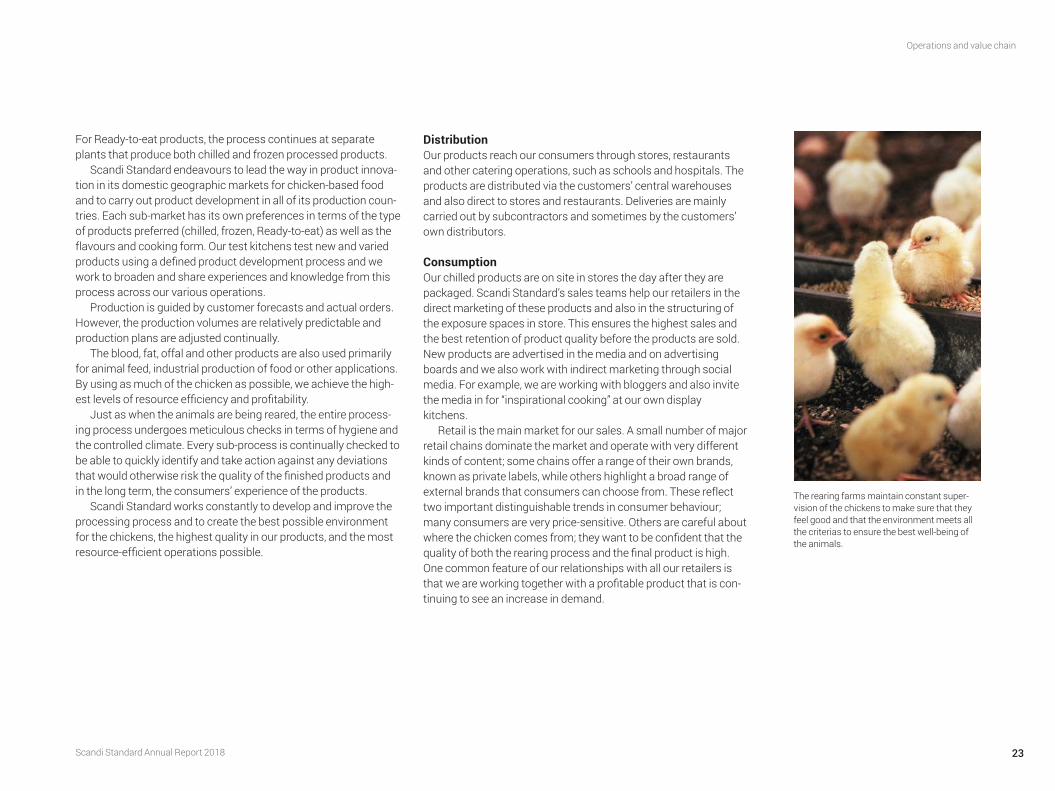
RearingThe rearing farms maintain constant supervision of the chickens to make sure that they feel good and that the environment meets all the criteria to ensure the best well-being of the animals. The chickens live in flocks of the same age and are fed with carefully tested feed to ensure optimal growth. When the chickens come to the rearing farm, they weigh an average of 40 grammes. Before they are slaughtered after 35 days, they weigh an average of 2.1 kg. During the five weeks at the rearing farm, they have eaten approximately 3.3 kg feed and drunk 5 litres of water. It is impor-tant for the feed to maintain an even quality over time, which is the reason for the nutritional content of the feed is continually tested.
Processing and packagingTransport to the slaughter house must be as calm as possible for the chickens. The chickens are normally collected in the early morning when they are feeling calm after a night’s rest. When they arrive at the slaughter house, they are placed in a peaceful and dark environment for a few hours in order to minimise their stress. Before they are killed, the chickens are stunned with carbon diox-ide gas which renders them almost unconscious. Death is caused by a machine severing their carotid artery. After this their insides and feet are removed. The plucked and drawn chickens then pass through a chilling tunnel to be cooled down before they go to be cut. The chickens that are going to be sold as whole chickens go directly to packaging. The other chickens move on to the main automated cutting process. Wings, legs and fillets are separated and either go in their natural state to packaging, or to be seasoned, where they are tumbled in a marinade before being packaged. The fillets are checked before packaging to make sure they are com-pletely bone-free.
“ Our operations are based on a value chain, where the focus is always on care for chickens, people and the environment.”
Scandi Standard Annual Report 2018
Operations and value chain
23
For Ready-to-eat products, the process continues at separate plants that produce both chilled and frozen processed products.
Scandi Standard endeavours to lead the way in product innova-tion in its domestic geographic markets for chicken-based food and to carry out product development in all of its production coun-tries. Each sub-market has its own preferences in terms of the type of products preferred (chilled, frozen, Ready-to-eat) as well as the flavours and cooking form. Our test kitchens test new and varied products using a defined product development process and we work to broaden and share experiences and knowledge from this process across our various operations.
Production is guided by customer forecasts and actual orders. However, the production volumes are relatively predictable and production plans are adjusted continually.
The blood, fat, offal and other products are also used primarily for animal feed, industrial production of food or other applications. By using as much of the chicken as possible, we achieve the high-est levels of resource efficiency and profitability.
Just as when the animals are being reared, the entire process-ing process undergoes meticulous checks in terms of hygiene and the controlled climate. Every sub-process is continually checked to be able to quickly identify and take action against any deviations that would otherwise risk the quality of the finished products and in the long term, the consumers’ experience of the products.
Scandi Standard works constantly to develop and improve the processing process and to create the best possible environment for the chickens, the highest quality in our products, and the most resource-efficient operations possible.
DistributionOur products reach our consumers through stores, restaurants and other catering operations, such as schools and hospitals. The products are distributed via the customers’ central warehouses and also direct to stores and restaurants. Deliveries are mainly carried out by subcontractors and sometimes by the customers’ own distributors.
ConsumptionOur chilled products are on site in stores the day after they are packaged. Scandi Standard’s sales teams help our retailers in the direct marketing of these products and also in the structuring of the exposure spaces in store. This ensures the highest sales and the best retention of product quality before the products are sold. New products are advertised in the media and on advertising boards and we also work with indirect marketing through social media. For example, we are working with bloggers and also invite the media in for “inspirational cooking” at our own display kitchens.
Retail is the main market for our sales. A small number of major retail chains dominate the market and operate with very different kinds of content; some chains offer a range of their own brands, known as private labels, while others highlight a broad range of external brands that consumers can choose from. These reflect two important distinguishable trends in consumer behaviour; many consumers are very price-sensitive. Others are careful about where the chicken comes from; they want to be confident that the quality of both the rearing process and the final product is high. One common feature of our relationships with all our retailers is that we are working together with a profitable product that is con-tinuing to see an increase in demand.
The rearing farms maintain constant super-vision of the chickens to make sure that they feel good and that the environment meets all the criterias to ensure the best well-being of the animals.
Scandi Standard Annual Report 201824
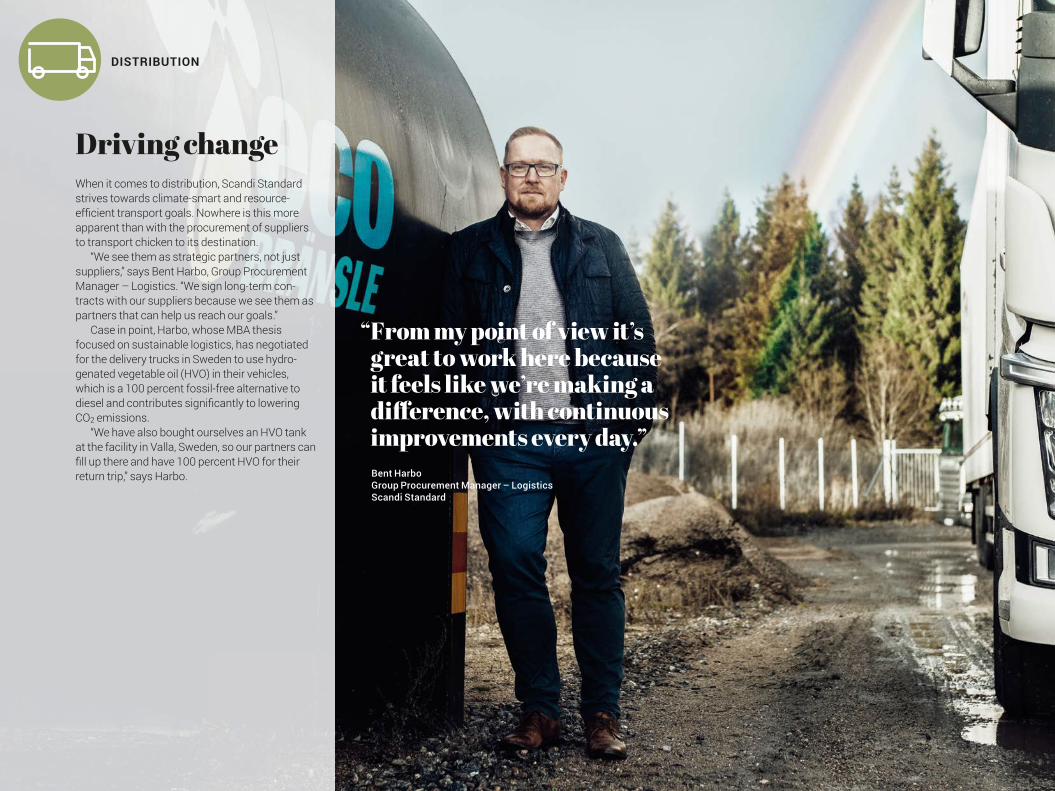
“ From my point of view it’s great to work here because it feels like we’re making a diff erence, with continuous improvements every day.” Bent HarboGroup Procurement Manager – LogisticsScandi Standard
Driving changeWhen it comes to distribution, Scandi Standard strives towards climate-smart and resource- effi cient transport goals. Nowhere is this more apparent than with the procurement of suppliers to transport chicken to its destination.
“We see them as strategic partners, not just suppliers,” says Bent Harbo, Group Procurement Manager – Logistics. “We sign long-term con-tracts with our suppliers because we see them as partners that can help us reach our goals.”
Case in point, Harbo, whose MBA thesis focused on sustainable logistics, has negotiated for the delivery trucks in Sweden to use hydro-genated vegetable oil (HVO) in their vehicles, which is a 100 percent fossil-free alternative to diesel and contributes signifi cantly to lowering CO2 emissions.
“We have also bought ourselves an HVO tank at the facility in Valla, Sweden, so our partners can fi ll up there and have 100 percent HVO for their return trip,” says Harbo.
DISTRIBUTION
Scandi Standard Annual Report 2018
Operations and value chain
25
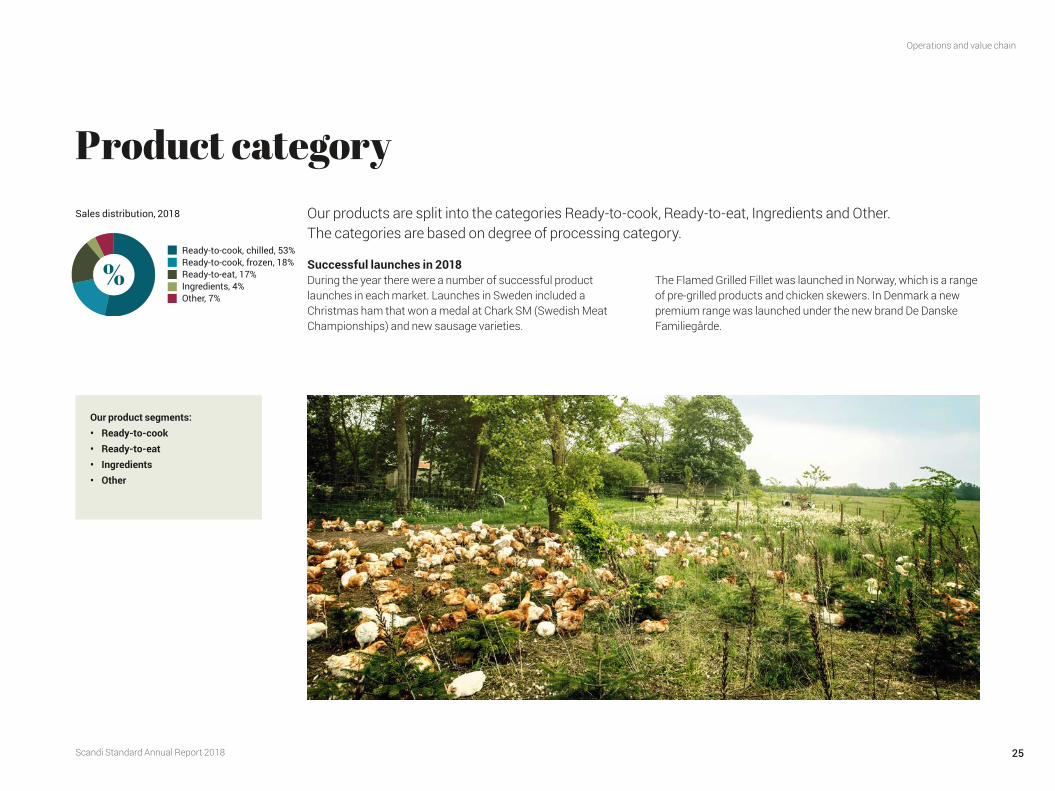
Product categoryOur products are split into the categories Ready-to-cook, Ready-to-eat, Ingredients and Other. The categories are based on degree of processing category.
Successful launches in 2018During the year there were a number of successful product launches in each market. Launches in Sweden included a Christmas ham that won a medal at Chark SM (Swedish Meat Championships) and new sausage varieties.
The Flamed Grilled Fillet was launched in Norway, which is a range of pre-grilled products and chicken skewers. In Denmark a new premium range was launched under the new brand De Danske Familiegårde.
Sales distribution, 2018
Our product segments:• Ready-to-cook• Ready-to-eat• Ingredients• Other
Ready-to-cook, chilled, 53%Ready-to-cook, frozen, 18%Ready-to-eat, 17%Ingredients, 4%Other, 7%

Scandi Standard Annual Report 2018
Operations and value chain
26
Ready-to-cookReady-to-cook (RTC) is our largest product category and comprises products that have not been cooked. They can be whole birds, cuts of meat, deboned and seasoned, or marinated products. Sales are to both retail and the food service channels. Some of the production is also exported.
Ready-to-cook is divided between frozen and chilled products. Chilled products are sold fresh to customers, so there are stricter requirements for production planning and logistics.
Frozen products are quick-frozen after production. The products are frozen before they are fi nally packaged and most products are frozen individually to make them easier to thaw. Although products are sometimes frozen at the production plant, they are generally frozen at the freezer warehouse.
We also sell chicken that is grilled in store in some markets. This means that chickens that have been prepared to be grilled in store are sold to the stores and sold over the counter freshly grilled.
The biggest selling product in all of our markets is the natural chicken fi llet. There is always a risk of overproducing wing and leg products, as the demand for these products does not keep up with the demand for fi llets. There needs to be what is known as an ‘anatomical balance’ in the sales mix. This is why we are working
intensely with the innovation of products that use other parts of the chicken, for example, by deboning them. Bone-free products are more attractive and command a higher price, for example, Chicken Steak which is a deboned chicken leg. We are also working on processing charcuterie products, such as bacon and sausages, where other types of cuts can be used.
Share of total sales
Sales/land for RTC products
Product innovation: Chicken Steak is an example of an innovation that improves the utilization of the whole chicken.
Strategic priorities• Increase the share of chilled products• Maintain a high pace in product innovation• Increase the sales to Foodservice
7%6,260 MSEKOrganic growthNet sales
71%
Sweden, 29%Denmark, 14%Norway, 14% Ireland, 37% Finland, 6%

Scandi Standard Annual Report 2018
Operations and value chain
27
Ready-to-eatReady-to eat (RTE) are products that have been cooked in the processing process, which means that they can be consumed directly or after being heated up. Production mostly takes place at our own plants.
We produce Ready-to-eat products at three plants that focus on slightly different products.
Farre in Denmark is our largest Ready-to-eat plant. In 2018 the plant was expanded by adding another production line, increasing the number from three to four. This plant produces frozen Ready-to-eat products, mostly coated products like nuggets and burgers, but also other fried products. One common factor in all of its production is that freezing is part of the production process.
A high share of the production goes to McDonald’s and other fast-food customers. The plant in Farre produces products that are based on chickens that have been slaughtered and cut at our own plants, as well as using raw material that have been purchased externally.
We also have a processing plant in Sweden connected to the slaughter house in Valla, which produces chilled processed products. The plant has been operating for three years and is growing steadily. Our plant in Stokke in Norway also produces pre-grilled chilled products.
Product innovation: Ready-to-eat chicken meat balls is a climat smart and convenient alternative.
Strategic priorities• Maintain a high pace in product innovation • Expand the range of chilled Ready-to-eat products• Review the potential for Ready-to-eat in Ireland
1,529 MSEKNet sales
13%Organic growth
Share of total sales
Sales/country for RTE products
17%
Sweden, 19%Denmark, 64%Norway, 16% Ireland, 0% Finland, 1%
Scandi Standard Annual Report 2018
Operations and value chain
28
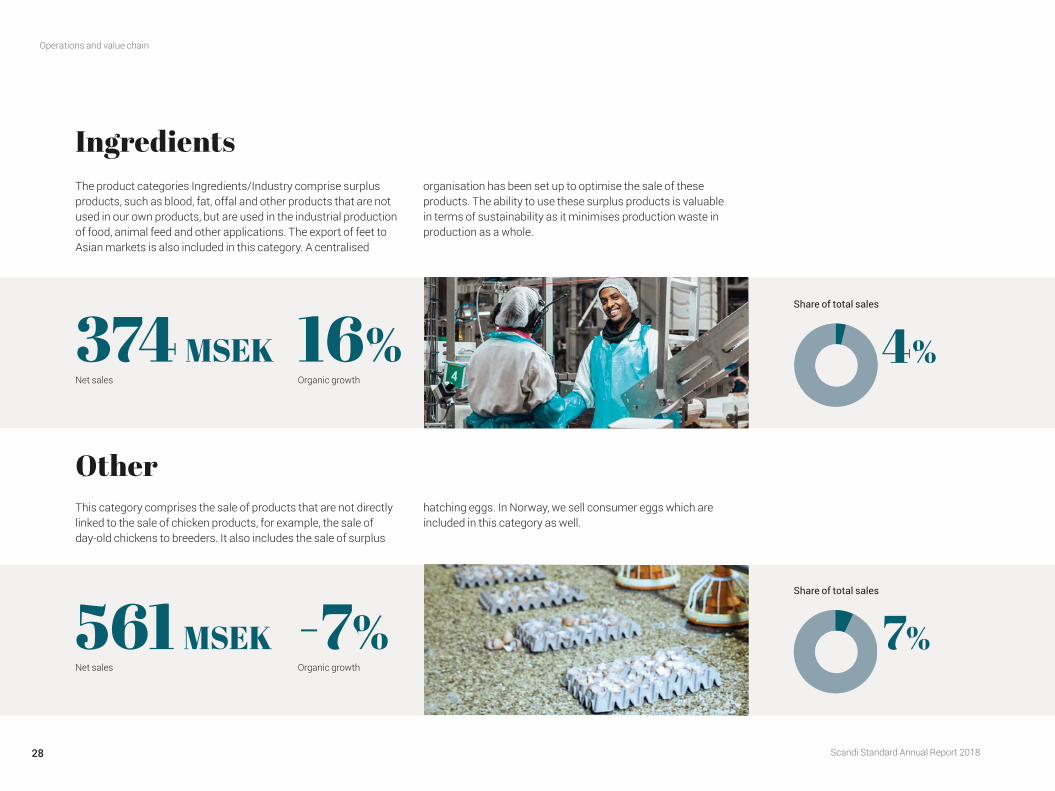
IngredientsThe product categories Ingredients/Industry comprise surplus products, such as blood, fat, offal and other products that are not used in our own products, but are used in the industrial production of food, animal feed and other applications. The export of feet to Asian markets is also included in this category. A centralised
organisation has been set up to optimise the sale of these products. The ability to use these surplus products is valuable in terms of sustainability as it minimises production waste in production as a whole.
OtherThis category comprises the sale of products that are not directly linked to the sale of chicken products, for example, the sale of day-old chickens to breeders. It also includes the sale of surplus
hatching eggs. In Norway, we sell consumer eggs which are included in this category as well.
Share of total sales
Share of total sales
16%Organic growthNet sales
374 MSEK 4%
7%-7%Organic growthNet sales
561 MSEK
Scandi Standard Annual Report 2018
Operations and value chain
29
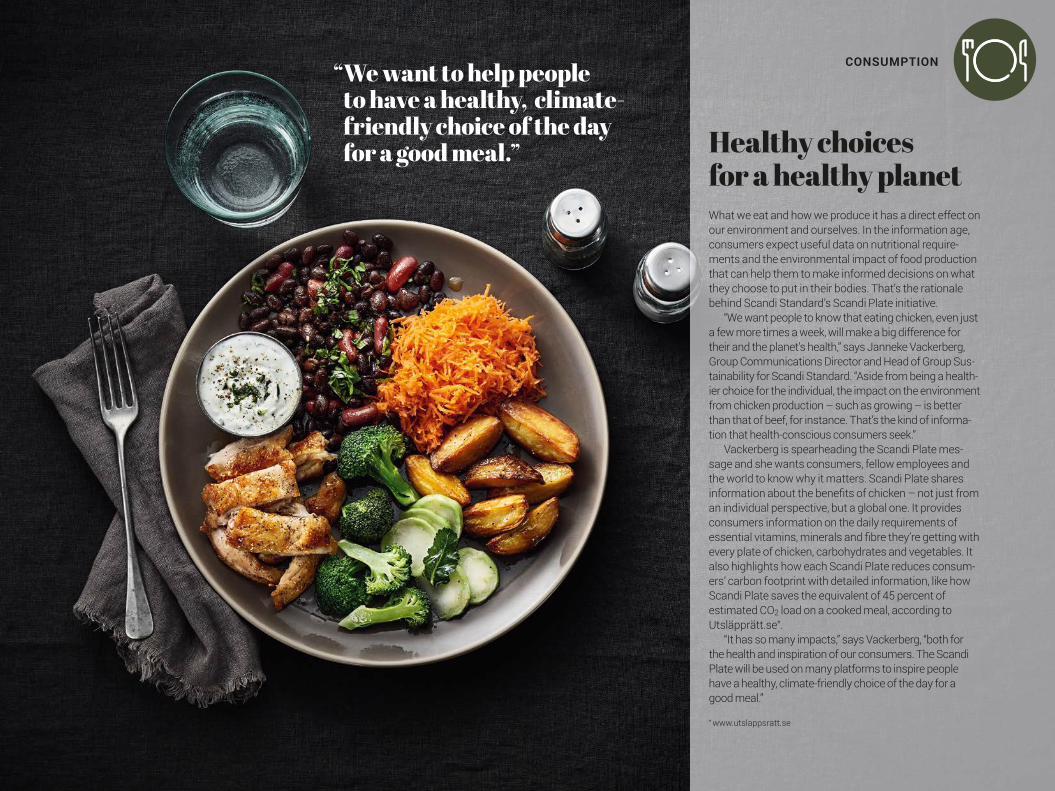
Healthy choices for a healthy planetWhat we eat and how we produce it has a direct effect on our environment and ourselves. In the information age, consumers expect useful data on nutritional require-ments and the environmental impact of food production that can help them to make informed decisions on what they choose to put in their bodies. That’s the rationale behind Scandi Standard’s Scandi Plate initiative.
“We want people to know that eating chicken, even just a few more times a week, will make a big difference for their and the planet’s health,” says Janneke Vackerberg, Group Communications Director and Head of Group Sus-tainability for Scandi Standard. “Aside from being a health-ier choice for the individual, the impact on the environment from chicken production – such as growing – is better than that of beef, for instance. That’s the kind of informa-tion that health-conscious consumers seek.”
Vackerberg is spearheading the Scandi Plate mes-sage and she wants consumers, fellow employees and the world to know why it matters. Scandi Plate shares information about the benefi ts of chicken – not just from an individual perspective, but a global one. It provides consumers information on the daily requirements of essential vitamins, minerals and fi bre they’re getting with every plate of chicken, carbohydrates and vegetables. It also highlights how each Scandi Plate reduces consum-ers’ carbon footprint with detailed information, like how Scandi Plate saves the equivalent of 45 percent of estimated CO2 load on a cooked meal, according to Utsläpprätt.se*.
“It has so many impacts,” says Vackerberg, “both for the health and inspiration of our consumers. The Scandi Plate will be used on many platforms to inspire people have a healthy, climate- friendly choice of the day for a good meal.”
* www.utslappsratt.se
“ We want to help people to have a healthy, climate-friendly choice of the day for a good meal.”
CONSUMPTION

Scandi Standard Annual Report 2018
Sustainability report
30
We have high ambitions: we want to be the industry leader in animal welfare; healthy, safe products; and environmental and social responsibility. This means that we have to work proactively to identify and manage risks, drive development and improvement work throughout the value chain, and make the most of the added values while meeting higher expectations and addressing new consumer trends. For example, we recognise the potential of greater awareness of the antibiotics issue and products with a lower climate footprint.
The Scandi WayWe have developed a strategic framework for sustainable business development called The Scandi Way, based on priority responsibility and sustainability issues that were identified in 2017–2018. This framework sets the standard for the Group’s sustainability work on key Group-wide issues. Each country and plant can also choose to adopt a higher level of ambition where appropriate and where possible.
Goals and managementThe focus this year was on implementing and communicating this framework in the organisation, establishing goals and perfor-mance indicators, and following them up. The starting point has been to integrate issues surrounding responsibility and sustaina-bility into business strategies, current areas of responsibility, processes and working methods. KPIs have been unanimously decided for all areas, including a joint system for monthly data
reporting. Goals and activities have been established for several areas, while they are still being developed for others.
There is a steering group for Sustainability at Group level that is responsible for coordinating and monitoring priority activities, and for reporting to the Group Management team. A strategic project manager has been appointed for each area who will work with local representatives to drive and implement the activities that have been decided.
Materiality analysis – focus on what is most importantWork on responsibility and sustainable development covers a wide spectrum of issues, with the main focus on the areas where we have the greatest impact, where we can make a difference, and that are the most important for our stakeholders.
Priority issues and target areas in The Scandi Way have been identified based on a materiality analysis that was compiled in 2017. This analysis was performed internally and featured a broad representation of key people from every part of the business. It was based on the impact of operations through the value chain, the expectations of the stakeholders, the mission and overall goals. The input vales for this work included looking at the work that is currently being carried out and accumulated knowledge from stakeholder dialogues and risk analyses, as well as market analyses and external frameworks, such as Agenda 2030. The materiality analysis is a living process. The results were checked during the year against the standard market and risk analyses, and in dialogue with other investors and customers.
Our responsibility and contribution to sustainable developmentFor Scandi Standard, sustainable development is about promoting profitable growth over time by creating genuine value for stakeholders and society as a whole. We will contribute to the joy of food and a sustainable food supply, by providing healthy, innovative chicken products that are produced in a responsible and resource-efficient way. This also forms the basis for our new vision that was formulated during the year: Better Chicken for a Better Life.
Scandi Standard and Agenda 2030Scandi Standard supports Agenda 2030 in its entirety and understands that we have both the responsibility and the opportunity to contribute to several goals through our operations. Some goals and sub-goals are directly linked to our business, for example: Goal 2 on a sustainable food supply and safe and nutritious food; Goal 3 for good health and well-being; and Goal 12 on sustainable production and consumption.

Scandi Standard Annual Report 2018
Sustainability report
31
The Scandi Way shows how we are working every day to make a difference and contribute to the health and well-being of people, chickens and our shared planet.
PEOPLESafe, healthy products that contribute and inspire to a
sustainable lifestyle
Attractive and healthy workplace
Responsible supplier relations and business ethics
CHICKENHigh quality farmers
Healthy chickens
Feed quality and feed effi ciency
PLANETClimate smart and resource
effi cient operations
Sustainable packaging
Reduced food waste
Scandi Chicken Quality Program
The Scandi Way
Scandi Standard Annual Report 2018
Sustainability report
32
Our most important promise to consumers is that our food products are safe and good to eat. Consumers must also feel con-fident that the chickens are healthy, feel good and are well treated. We want to inspire people to eat healthy and more climate-smart meals as well.
Product quality and food safetyProduct quality and food safety are top of the list of priorities within Scandi Standard. We work continually to improve processes and management. Working methods and equipment at our plants meet the requirements for Good Manufacturing Practices (GMP) and we also observe specific requirements from various custom-ers. The challenges that we need to address include the risks of unwanted bacteria and food fraud when purchasing ingredients.
The work on food safety requires expertise, accuracy, self-checks and clear management. Since 2017 we have strengthened this work further, with a new role being set up to lead this work: the Group Manager for Biosafety. 10 KPIs are continually measured to check the product quality and identify any deviations. These include temperature and cleanliness at the plants, the incidence of bacteria, checking the finished products and complaints.
Focus on minimising the risk of bacteriaThe incidence of pathogenic bacteria is monitored and tested continually. Our chicken must be completely free from salmonella, and there must be the absolute minimum levels of campylobacter. During the year we saw the results of a greater focus on washing and cleanliness control of the equipment and freight boxes at our plant in Valla.
We are working with experts and researchers to continue to develop our work on food safety. Kronfågel has been working with the Swedish University of Agricultural Sciences to start a study to investigate the potential of reducing pathogenic bacteria at specific stages of the slaughtering process.
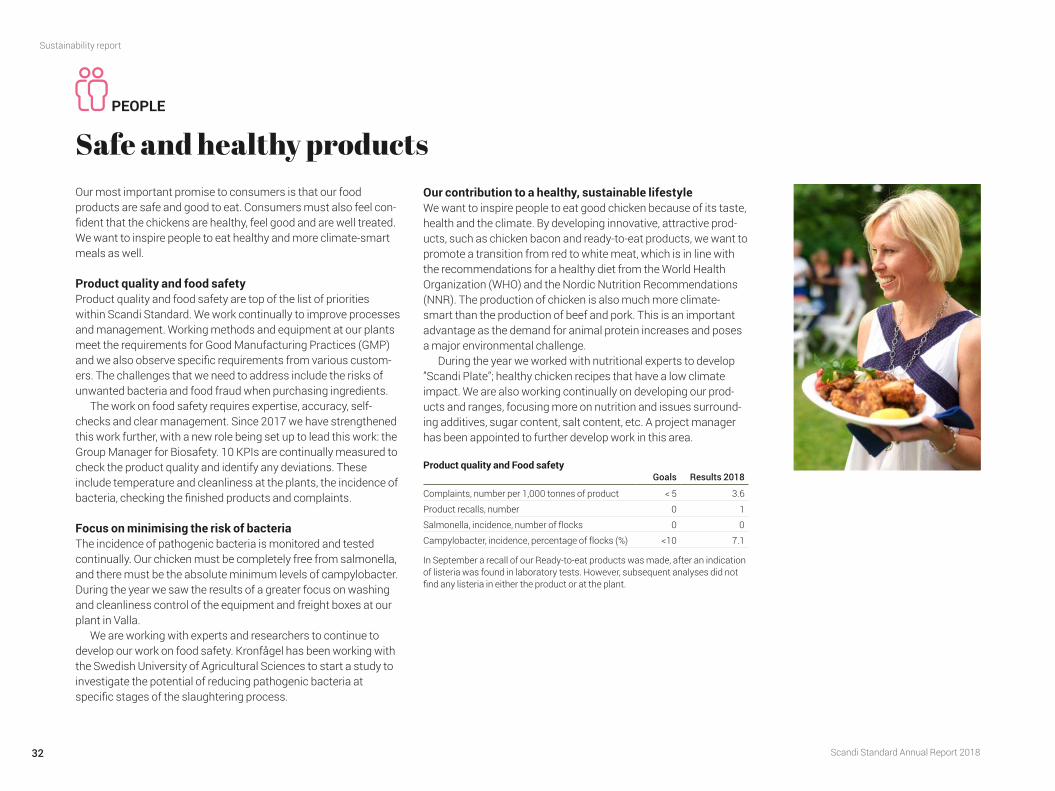
Our contribution to a healthy, sustainable lifestyleWe want to inspire people to eat good chicken because of its taste, health and the climate. By developing innovative, attractive prod-ucts, such as chicken bacon and ready-to-eat products, we want to promote a transition from red to white meat, which is in line with the recommendations for a healthy diet from the World Health Organization (WHO) and the Nordic Nutrition Recommendations (NNR). The production of chicken is also much more climate- smart than the production of beef and pork. This is an important advantage as the demand for animal protein increases and poses a major environmental challenge.
During the year we worked with nutritional experts to develop ”Scandi Plate”; healthy chicken recipes that have a low climate impact. We are also working continually on developing our prod-ucts and ranges, focusing more on nutrition and issues surround-ing additives, sugar content, salt content, etc. A project manager has been appointed to further develop work in this area.
Product quality and Food safetyGoals Results 2018
Complaints, number per 1,000 tonnes of product < 5 3.6
Product recalls, number 0 1
Salmonella, incidence, number of flocks 0 0
Campylobacter, incidence, percentage of flocks (%) <10 7.1
In September a recall of our Ready-to-eat products was made, after an indication of listeria was found in laboratory tests. However, subsequent analyses did not find any listeria in either the product or at the plant.
PEOPLE
Safe and healthy products
Scandi Standard Annual Report 2018
Sustainability report
33
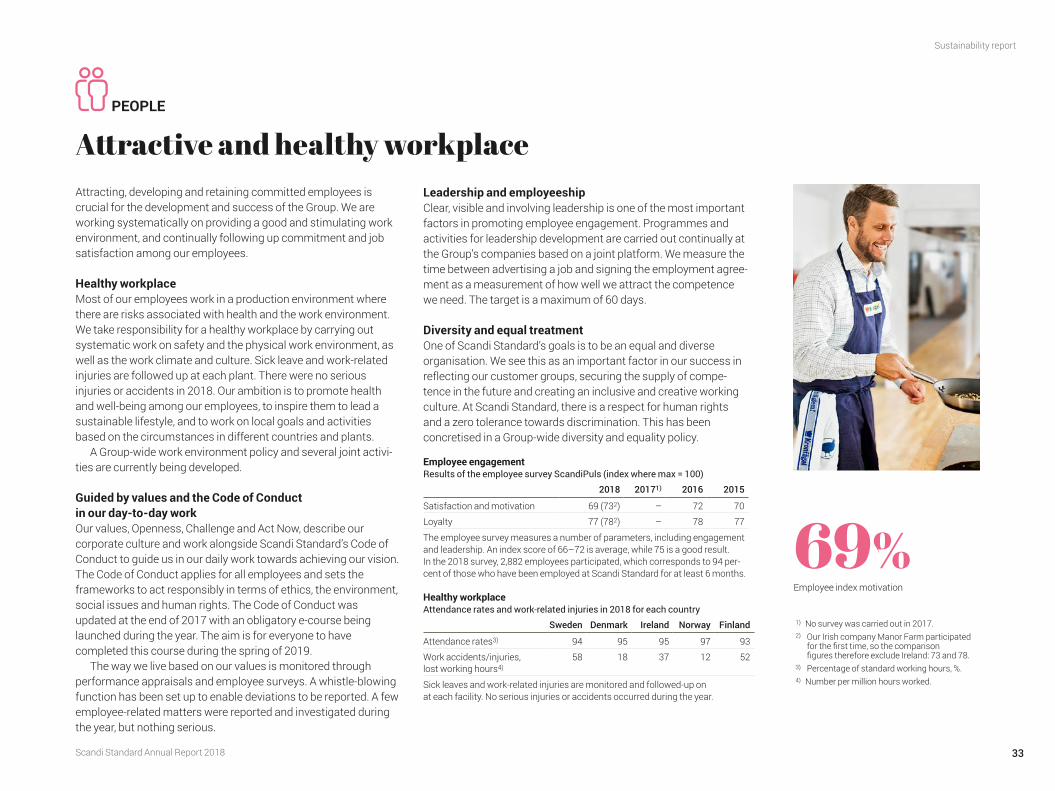
Attracting, developing and retaining committed employees is crucial for the development and success of the Group. We are working systematically on providing a good and stimulating work environment, and continually following up commitment and job satisfaction among our employees.
Healthy workplaceMost of our employees work in a production environment where there are risks associated with health and the work environment. We take responsibility for a healthy workplace by carrying out systematic work on safety and the physical work environment, as well as the work climate and culture. Sick leave and work-related injuries are followed up at each plant. There were no serious injuries or accidents in 2018. Our ambition is to promote health and well-being among our employees, to inspire them to lead a sustainable lifestyle, and to work on local goals and activities based on the circumstances in different countries and plants.
A Group-wide work environment policy and several joint activi-ties are currently being developed.
Guided by values and the Code of Conduct in our day-to-day workOur values, Openness, Challenge and Act Now, describe our corporate culture and work alongside Scandi Standard’s Code of Conduct to guide us in our daily work towards achieving our vision. The Code of Conduct applies for all employees and sets the frameworks to act responsibly in terms of ethics, the environment, social issues and human rights. The Code of Conduct was updated at the end of 2017 with an obligatory e-course being launched during the year. The aim is for everyone to have completed this course during the spring of 2019.
The way we live based on our values is monitored through performance appraisals and employee surveys. A whistle-blowing function has been set up to enable deviations to be reported. A few employee-related matters were reported and investigated during the year, but nothing serious.
Leadership and employeeshipClear, visible and involving leadership is one of the most important factors in promoting employee engagement. Programmes and activities for leadership development are carried out continually at the Group’s companies based on a joint platform. We measure the time between advertising a job and signing the employment agree-ment as a measurement of how well we attract the competence we need. The target is a maximum of 60 days.
Diversity and equal treatmentOne of Scandi Standard’s goals is to be an equal and diverse organisation. We see this as an important factor in our success in reflecting our customer groups, securing the supply of compe-tence in the future and creating an inclusive and creative working culture. At Scandi Standard, there is a respect for human rights and a zero tolerance towards discrimination. This has been concretised in a Group-wide diversity and equality policy.
Employee engagementResults of the employee survey ScandiPuls (index where max = 100)
2018 20171) 2016 2015
Satisfaction and motivation 69 (732) – 72 70
Loyalty 77 (782) – 78 77
The employee survey measures a number of parameters, including engagement and leadership. An index score of 66–72 is average, while 75 is a good result. In the 2018 survey, 2,882 employees participated, which corresponds to 94 per-cent of those who have been employed at Scandi Standard for at least 6 months.
Healthy workplaceAttendance rates and work-related injuries in 2018 for each country
Sweden Denmark Ireland Norway Finland
Attendance rates3) 94 95 95 97 93
Work accidents/injuries, lost working hours4)
58 18 37 12 52
Sick leaves and work-related injuries are monitored and followed-up on at each facility. No serious injuries or accidents occurred during the year.
PEOPLE
Attractive and healthy workplace
69%Employee index motivation
1) No survey was carried out in 2017.2) Our Irish company Manor Farm participated
for the first time, so the comparison figures therefore exclude Ireland: 73 and 78.
3) Percentage of standard working hours, %.4) Number per million hours worked.
Scandi Standard Annual Report 2018
Sustainability report
34
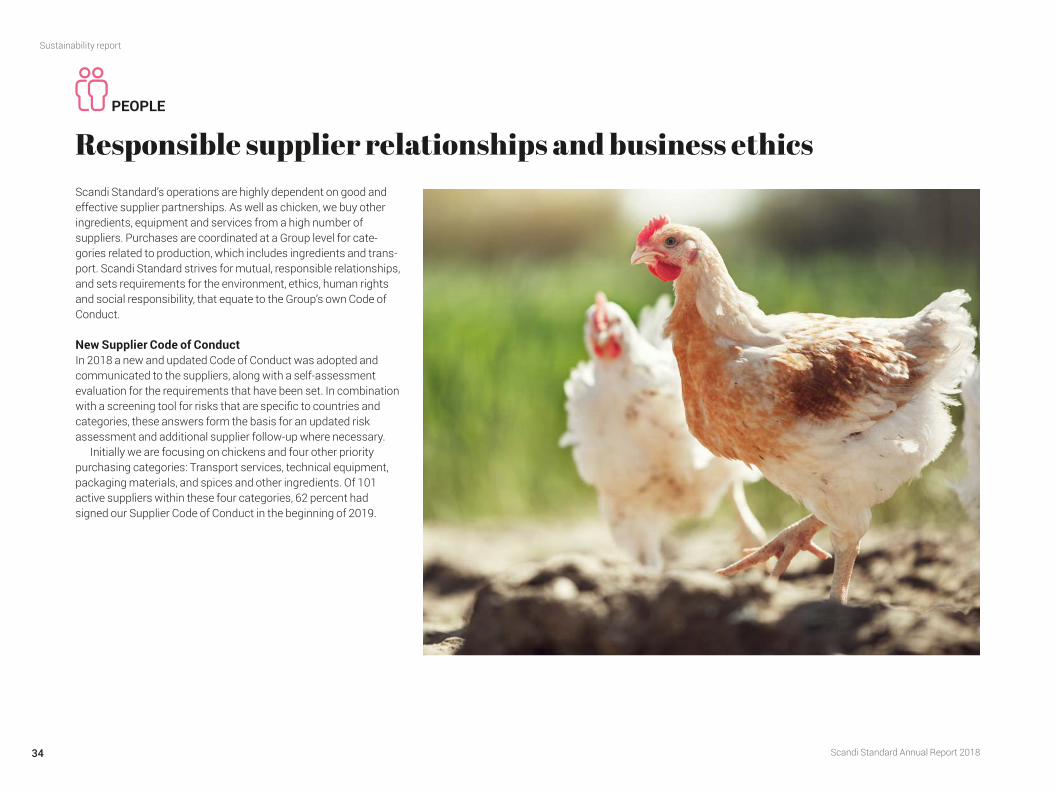
Scandi Standard’s operations are highly dependent on good and effective supplier partnerships. As well as chicken, we buy other ingredients, equipment and services from a high number of suppliers. Purchases are coordinated at a Group level for cate-gories related to production, which includes ingredients and trans-port. Scandi Standard strives for mutual, responsible relationships, and sets requirements for the environment, ethics, human rights and social responsibility, that equate to the Group’s own Code of Conduct.
New Supplier Code of ConductIn 2018 a new and updated Code of Conduct was adopted and communicated to the suppliers, along with a self-assessment evaluation for the requirements that have been set. In combination with a screening tool for risks that are specific to countries and categories, these answers form the basis for an updated risk assessment and additional supplier follow-up where necessary.
Initially we are focusing on chickens and four other priority purchasing categories: Transport services, technical equipment, packaging materials, and spices and other ingredients. Of 101 active suppliers within these four categories, 62 percent had signed our Supplier Code of Conduct in the beginning of 2019.
PEOPLE
Responsible supplier relationships and business ethics
Scandi Standard Annual Report 2018
Sustainability report
35
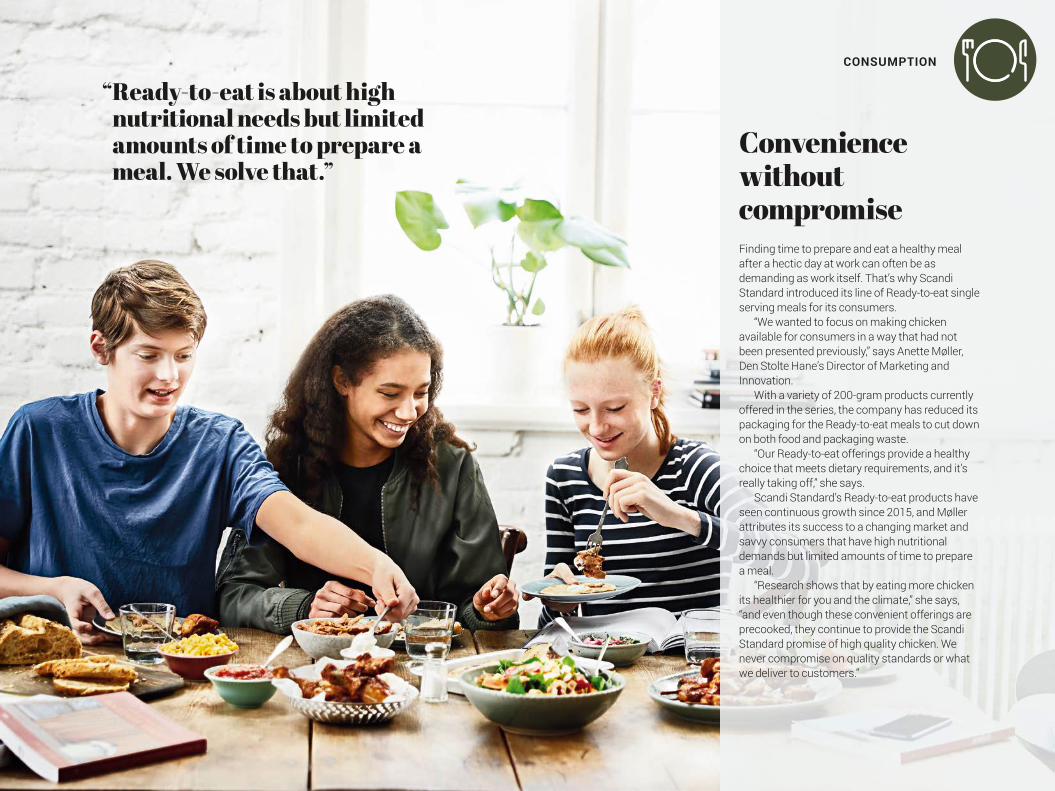
Convenience without compromiseFinding time to prepare and eat a healthy meal after a hectic day at work can often be as demanding as work itself. That’s why Scandi Standard introduced its line of Ready-to-eat single serving meals for its consumers.
“We wanted to focus on making chicken available for consumers in a way that had not been presented previously,” says Anette Møller, Den Stolte Hane’s Director of Marketing and Innovation.
With a variety of 200-gram products currently offered in the series, the company has reduced its packaging for the Ready-to-eat meals to cut down on both food and packaging waste.
“Our Ready-to-eat offerings provide a healthy choice that meets dietary requirements, and it’s really taking off,” she says.
Scandi Standard’s Ready-to-eat products have seen continuous growth since 2015, and Møller attributes its success to a changing market and savvy consumers that have high nutritional demands but limited amounts of time to prepare a meal.
“Research shows that by eating more chicken its healthier for you and the climate,” she says, “and even though these convenient offerings are precooked, they continue to provide the Scandi Standard promise of high quality chicken. We never compromise on quality standards or what we deliver to customers.”
“ Ready-to-eat is about high nutritional needs but limited amounts of time to prepare a meal. We solve that.”
CONSUMPTION
Scandi Standard Annual Report 2018
Sustainability report
36
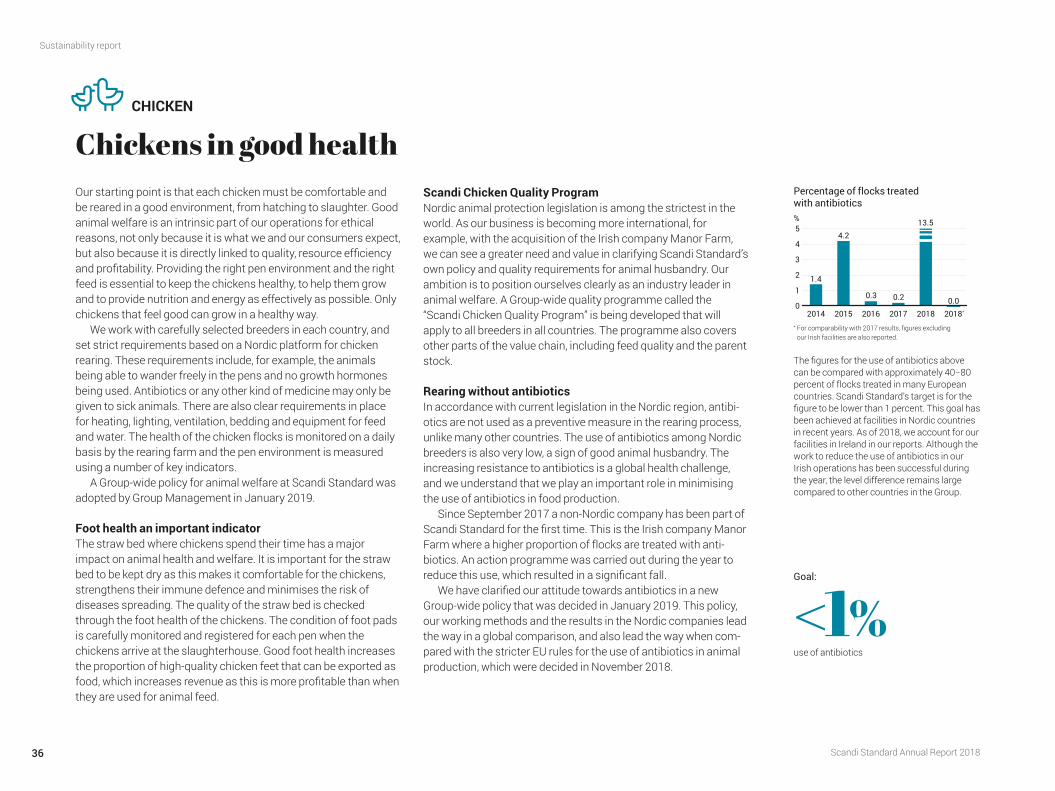
CHICKEN
Our starting point is that each chicken must be comfortable and be reared in a good environment, from hatching to slaughter. Good animal welfare is an intrinsic part of our operations for ethical reasons, not only because it is what we and our consumers expect, but also because it is directly linked to quality, resource efficiency and profitability. Providing the right pen environment and the right feed is essential to keep the chickens healthy, to help them grow and to provide nutrition and energy as effectively as possible. Only chickens that feel good can grow in a healthy way.
We work with carefully selected breeders in each country, and set strict requirements based on a Nordic platform for chicken rearing. These requirements include, for example, the animals being able to wander freely in the pens and no growth hormones being used. Antibiotics or any other kind of medicine may only be given to sick animals. There are also clear requirements in place for heating, lighting, ventilation, bedding and equipment for feed and water. The health of the chicken flocks is monitored on a daily basis by the rearing farm and the pen environment is measured using a number of key indicators.
A Group-wide policy for animal welfare at Scandi Standard was adopted by Group Management in January 2019.
Foot health an important indicator The straw bed where chickens spend their time has a major impact on animal health and welfare. It is important for the straw bed to be kept dry as this makes it comfortable for the chickens, strengthens their immune defence and minimises the risk of diseases spreading. The quality of the straw bed is checked through the foot health of the chickens. The condition of foot pads is carefully monitored and registered for each pen when the chickens arrive at the slaughterhouse. Good foot health increases the proportion of high-quality chicken feet that can be exported as food, which increases revenue as this is more profitable than when they are used for animal feed.
Scandi Chicken Quality ProgramNordic animal protection legislation is among the strictest in the world. As our business is becoming more international, for example, with the acquisition of the Irish company Manor Farm, we can see a greater need and value in clarifying Scandi Standard’s own policy and quality requirements for animal husbandry. Our ambition is to position ourselves clearly as an industry leader in animal welfare. A Group-wide quality programme called the “Scandi Chicken Quality Program” is being developed that will apply to all breeders in all countries. The programme also covers other parts of the value chain, including feed quality and the parent stock.
Rearing without antibioticsIn accordance with current legislation in the Nordic region, antibi-otics are not used as a preventive measure in the rearing process, unlike many other countries. The use of antibiotics among Nordic breeders is also very low, a sign of good animal husbandry. The increasing resistance to antibiotics is a global health challenge, and we understand that we play an important role in minimising the use of antibiotics in food production.
Since September 2017 a non-Nordic company has been part of Scandi Standard for the first time. This is the Irish company Manor Farm where a higher proportion of flocks are treated with anti-biotics. An action programme was carried out during the year to reduce this use, which resulted in a significant fall.
We have clarified our attitude towards antibiotics in a new Group-wide policy that was decided in January 2019. This policy, our working methods and the results in the Nordic companies lead the way in a global comparison, and also lead the way when com-pared with the stricter EU rules for the use of antibiotics in animal production, which were decided in November 2018.
Chickens in good health
* For comparability with 2017 results, figures excluding our Irish facilities are also reported.
The figures for the use of antibiotics above can be compared with approximately 40−80 percent of flocks treated in many European countries. Scandi Standard’s target is for the figure to be lower than 1 percent. This goal has been achieved at facilities in Nordic countries in recent years. As of 2018, we account for our facilities in Ireland in our reports. Although the work to reduce the use of antibiotics in our Irish operations has been successful during the year, the level difference remains large compared to other countries in the Group.
Percentage of flocks treated with antibiotics
0
1
2
3
4
5
201820182017201620152014
13.5
1.4
4.2
0.3 0.2 0.0
%
<1%use of antibiotics
Goal:
*
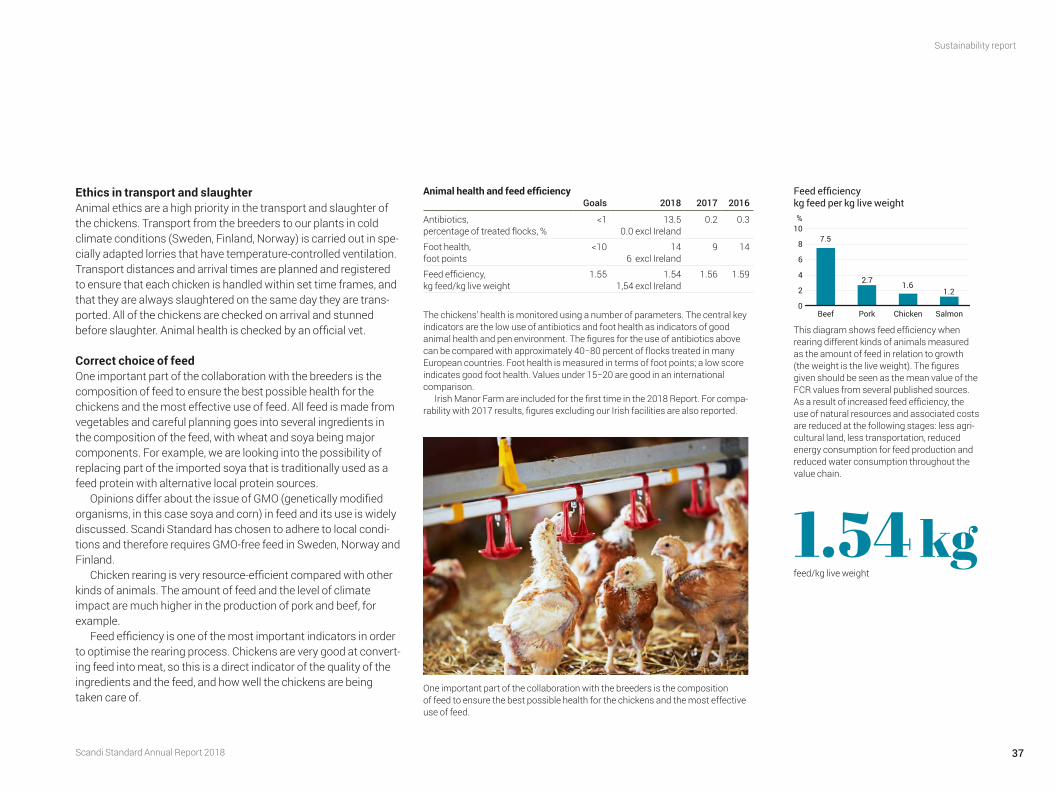
Scandi Standard Annual Report 2018
Sustainability report
37
Ethics in transport and slaughterAnimal ethics are a high priority in the transport and slaughter of the chickens. Transport from the breeders to our plants in cold climate conditions (Sweden, Finland, Norway) is carried out in spe-cially adapted lorries that have temperature-controlled ventilation. Transport distances and arrival times are planned and registered to ensure that each chicken is handled within set time frames, and that they are always slaughtered on the same day they are trans-ported. All of the chickens are checked on arrival and stunned before slaughter. Animal health is checked by an official vet.
Correct choice of feed One important part of the collaboration with the breeders is the composition of feed to ensure the best possible health for the chickens and the most effective use of feed. All feed is made from vegetables and careful planning goes into several ingredients in the composition of the feed, with wheat and soya being major components. For example, we are looking into the possibility of replacing part of the imported soya that is traditionally used as a feed protein with alternative local protein sources.
Opinions differ about the issue of GMO (genetically modified organisms, in this case soya and corn) in feed and its use is widely discussed. Scandi Standard has chosen to adhere to local condi-tions and therefore requires GMO-free feed in Sweden, Norway and Finland.
Chicken rearing is very resource-efficient compared with other kinds of animals. The amount of feed and the level of climate impact are much higher in the production of pork and beef, for example.
Feed efficiency is one of the most important indicators in order to optimise the rearing process. Chickens are very good at convert-ing feed into meat, so this is a direct indicator of the quality of the ingredients and the feed, and how well the chickens are being taken care of.
Animal health and feed efficiencyGoals 2018 2017 2016
Antibiotics, percentage of treated flocks, %
<1 13.5 0.0 excl Ireland
0.2 0.3
Foot health, foot points
<10 14 6 excl Ireland
9 14
Feed efficiency, kg feed/kg live weight
1.55 1.54 1,54 excl Ireland
1.56 1.59
The chickens’ health is monitored using a number of parameters. The central key indicators are the low use of antibiotics and foot health as indicators of good animal health and pen environment. The figures for the use of antibiotics above can be compared with approximately 40−80 percent of flocks treated in many European countries. Foot health is measured in terms of foot points; a low score indicates good foot health. Values under 15−20 are good in an international comparison.
Irish Manor Farm are included for the first time in the 2018 Report. For compa-rability with 2017 results, figures excluding our Irish facilities are also reported.
This diagram shows feed efficiency when rearing different kinds of animals measured as the amount of feed in relation to growth (the weight is the live weight). The figures given should be seen as the mean value of the FCR values from several published sources. As a result of increased feed efficiency, the use of natural resources and associated costs are reduced at the following stages: less agri-cultural land, less transportation, reduced energy consumption for feed production and reduced water consumption throughout the value chain.
Feed efficiency kg feed per kg live weight
0
2
4
6
8
10
SalmonChickenPorkBeef
%
7.5
2.7 1.61.2
1.54 kgfeed/kg live weight
One important part of the collaboration with the breeders is the composition of feed to ensure the best possible health for the chickens and the most effective use of feed.
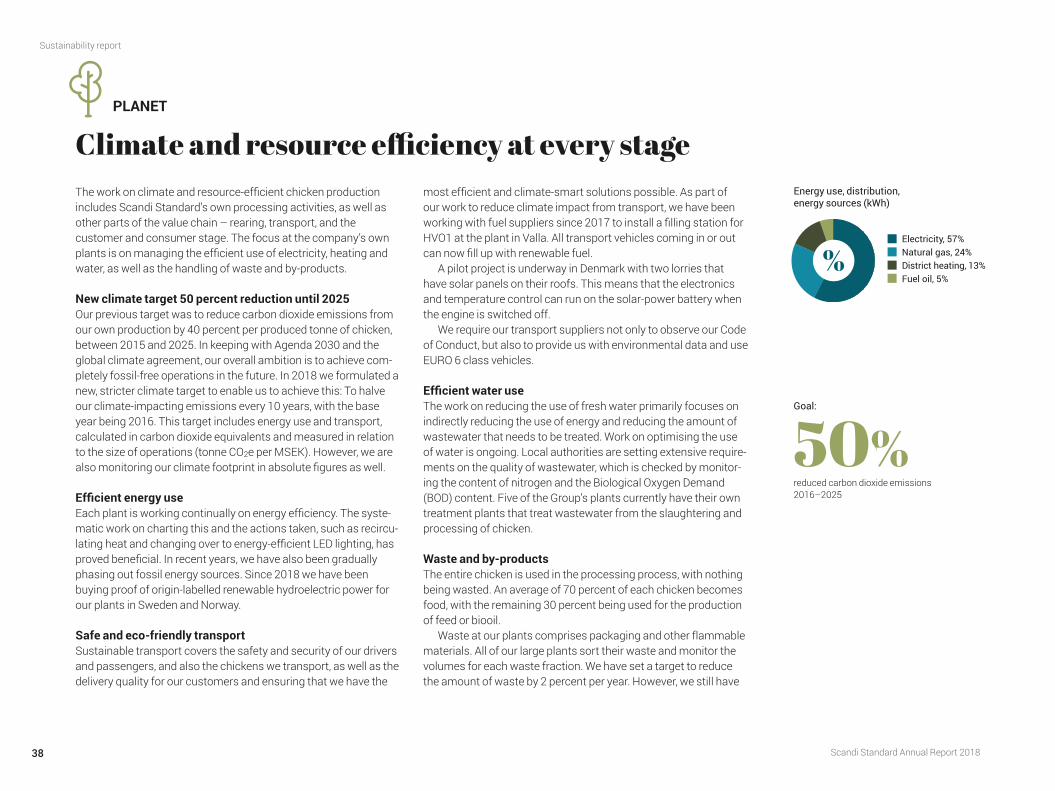
Scandi Standard Annual Report 2018
Sustainability report
38
The work on climate and resource-effi cient chicken production includes Scandi Standard’s own processing activities, as well as other parts of the value chain – rearing, transport, and the customer and consumer stage. The focus at the company’s own plants is on managing the effi cient use of electricity, heating and water, as well as the handling of waste and by-products.
New climate target 50 percent reduction until 2025 Our previous target was to reduce carbon dioxide emissions from our own production by 40 percent per produced tonne of chicken, between 2015 and 2025. In keeping with Agenda 2030 and the global climate agreement, our overall ambition is to achieve com-pletely fossil-free operations in the future. In 2018 we formulated a new, stricter climate target to enable us to achieve this: To halve our climate-impacting emissions every 10 years, with the base year being 2016. This target includes energy use and transport, calculated in carbon dioxide equivalents and measured in relation to the size of operations (tonne CO2e per MSEK). However, we are also monitoring our climate footprint in absolute fi gures as well.
Effi cient energy useEach plant is working continually on energy effi ciency. The syste-matic work on charting this and the actions taken, such as recircu-lating heat and changing over to energy-effi cient LED lighting, has proved benefi cial. In recent years, we have also been gradually phasing out fossil energy sources. Since 2018 we have been buying proof of origin-labelled renewable hydroelectric power for our plants in Sweden and Norway.
Safe and eco-friendly transport Sustainable transport covers the safety and security of our drivers and passengers, and also the chickens we transport, as well as the delivery quality for our customers and ensuring that we have the
most effi cient and climate-smart solutions possible. As part of our work to reduce climate impact from transport, we have been working with fuel suppliers since 2017 to install a fi lling station for HVO1 at the plant in Valla. All transport vehicles coming in or out can now fi ll up with renewable fuel.
A pilot project is underway in Denmark with two lorries that have solar panels on their roofs. This means that the electronics and temperature control can run on the solar-power battery when the engine is switched off.
We require our transport suppliers not only to observe our Code of Conduct, but also to provide us with environmental data and use EURO 6 class vehicles.
Effi cient water useThe work on reducing the use of fresh water primarily focuses on indirectly reducing the use of energy and reducing the amount of wastewater that needs to be treated. Work on optimising the use of water is ongoing. Local authorities are setting extensive require-ments on the quality of wastewater, which is checked by monitor-ing the content of nitrogen and the Biological Oxygen Demand (BOD) content. Five of the Group’s plants currently have their own treatment plants that treat wastewater from the slaughtering and processing of chicken.
Waste and by-products The entire chicken is used in the processing process, with nothing being wasted. An average of 70 percent of each chicken becomes food, with the remaining 30 percent being used for the production of feed or biooil.
Waste at our plants comprises packaging and other flammable materials. All of our large plants sort their waste and monitor the volumes for each waste fraction. We have set a target to reduce the amount of waste by 2 percent per year. However, we still have
PLANET
Climate and resource effi ciency at every stageEnergy use, distribution, energy sources (kWh)
50%reduced carbon dioxide emissions2016–2025
Goal:
Electricity, 57%Natural gas, 24%District heating, 13%Fuel oil, 5%
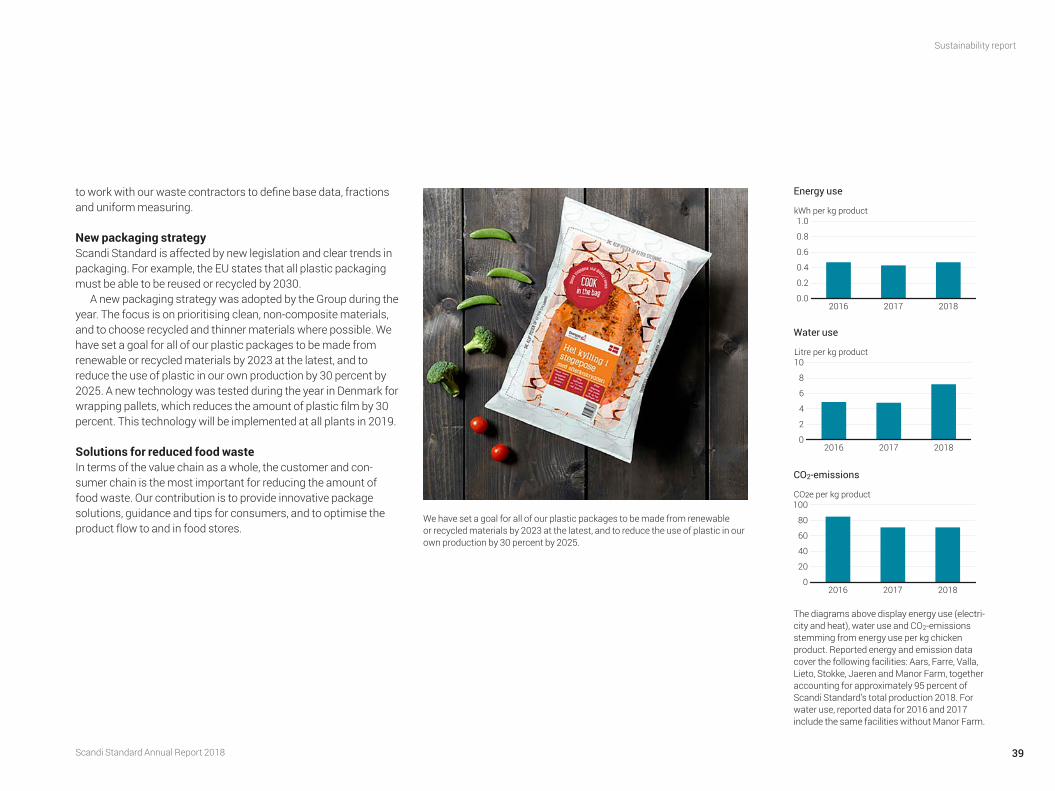
Scandi Standard Annual Report 2018
Sustainability report
39
to work with our waste contractors to define base data, fractions and uniform measuring.
New packaging strategy Scandi Standard is affected by new legislation and clear trends in packaging. For example, the EU states that all plastic packaging must be able to be reused or recycled by 2030.
A new packaging strategy was adopted by the Group during the year. The focus is on prioritising clean, non-composite materials, and to choose recycled and thinner materials where possible. We have set a goal for all of our plastic packages to be made from renewable or recycled materials by 2023 at the latest, and to reduce the use of plastic in our own production by 30 percent by 2025. A new technology was tested during the year in Denmark for wrapping pallets, which reduces the amount of plastic film by 30 percent. This technology will be implemented at all plants in 2019.
Solutions for reduced food wasteIn terms of the value chain as a whole, the customer and con-sumer chain is the most important for reducing the amount of food waste. Our contribution is to provide innovative package solutions, guidance and tips for consumers, and to optimise the product flow to and in food stores.
The diagrams above display energy use (electri-city and heat), water use and CO2-emissions stemming from energy use per kg chicken product. Reported energy and emission data cover the following facilities: Aars, Farre, Valla, Lieto, Stokke, Jaeren and Manor Farm, together accounting for approximately 95 percent of Scandi Standard’s total production 2018. For water use, reported data for 2016 and 2017 include the same facilities without Manor Farm.
We have set a goal for all of our plastic packages to be made from renewable or recycled materials by 2023 at the latest, and to reduce the use of plastic in our own production by 30 percent by 2025.
Energy use
0.0
0.2
0.4
0.6
0.8
1.0
201820172016
kWh per kg product
Water use
0
2
4
6
8
10
201820172016
Litre per kg product
CO2-emissions
0
20
40
60
80
100
201820172016
CO2e per kg product
Scandi Standard Annual Report 2018
Sustainability report
40
About the Sustainability ReportScandi Standard is subject to the requirement for sustain-ability reporting in accordance with the Swedish Annual Accounts Act. As well as this section, our Sustainability Report also includes the sections Our responsibility on pages 30–39 and Risk management on pages 51–55. The Sustainability Report addresses Scandi Standard’s material sustainability issues and risks, describing our work on them and the related policies. In 2017–2018 the Group set the structure for joint systematic sustainability work, establishing goals, key indicators and monitoring for priority areas. They have not been fully established and implemented in some areas, which are still under development.
Business modelFor Scandi Standard, sustainable development is about promoting profitable growth over time by creating genuine value for stakeholders and society as a whole. Our mission is to contribute to the joy of food and a sustainable food supply, by providing healthy, innovative chicken products that are produced in a responsible and resource-efficient
way. This is also described in the company’s vision: Better Chicken for a Better Life. For a more detailed description of our mission, value chain, operations and market, see pages 1–3 and 21–23.
Material sustainability aspects and risksIn 2017 Scandi Standard identified material sustainability aspects and risks by conducting a materiality analysis. This can be summarised under the following headings: Health, Food safety and hygiene, Animal welfare, Climate and resource efficiency, Good workplace and Good business ethics. The analysis of material sustainability aspects and risks is constantly changing and has been reconciled with company intelligence and risk assess-ments as well as with the dialogue the Group has with investors, customers and other interest groups. The table on the next page provides an overview of Scandi Standard’s sustainability impact, based on the sustain-ability areas in the Swedish Annual Accounts Act as well as the results of the materiality analysis and risk mapping for the Group.
Sustainability policyScandi Standard’s Code of Conduct constitutes the Group’s general sustainability policy and applies to every employee and all parts of our company, as well as to members of the Board. The Code of Conduct states that environmental, economic and social responsibility is an integral part of the business strategy and describes the approaches and guidelines that apply to material sustainability aspects in the areas of environment, social conditions, human resources, respect for human rights and anti-corruption. A whistle-blowing system is estab-lished since 2017 for reporting any potential deviations and violations of the Code of Conduct. A few employee- related matters were reported and investigated during the year, but nothing serious.
Scandi Standard’s Supplier Code of Conduct imposes corresponding requirements on the Group’s suppliers and partners.
Scandi Standard Annual Report 2018
Sustainability report
41
Sustainability aspect Scandi Standard’s impact Comment/reference regarding governance, risk management and KPIs
Social conditions Health (for employees and consumers)
Food safety and hygiene, Animal welfare (product responsibility)
Responsibility in the supply chain
Description: Page 32 Safe and healthy products, Page 33 Attractive and healthy workplace, Pages 36–37 Healthy chickens.Risks and risk management: Pages 51–55.Policy: Code of Conduct, section Code of Conduct, section Social conditions, Environment/Animal welfare, and Products.KPIs: Pages 32–33, 36–37.
Environment Climate and resource efficiency (energy, transport, water and waste management in production, feed efficiency, etc.)
Description: Pages 38–39 Climate and resource-efficiency at all stages.Risks and risk management: Pages 51–55.Policy: Code of Conduct, section Environment. Permits and notifications under national and local environmental legislation
for each plant. KPIs: Pages 38–39.
Human resources Good workplace (work environment, health, safety, gender equality and diversity)
Description: Page 33 Attractive and healthy workplace.Risks and risk management: Pages 51–55.Policy: Code of Conduct, section Social conditions (incl. human rights, working conditions and work environment).
Diversity and equality policy.KPIs: Page 33.
Respect for human rights Good workplace
Responsibility in the supply chain
Description: Page 34 Responsible supplier relations, Page 33 An attractive and healthy workplace.Risks and risk management: Pages 51–55.Policy: Code of Conduct, section Social conditions (incl. human rights, working conditions and work environment).
Diversity and equality policy Supplier Code of Conduct.KPIs: Follow-up is carried out through the employee survey as well as through follow-up and deviation reporting concerning
the Code of Conduct and Supplier Code of Conduct, Group-wide KPIs are missing.
Anti-corruption Good business ethics Description: Ethical business risks occur in relationships with customers, suppliers and partners, as well as in the subcontractor chain.Risks and risk management: Pages 51–55.Policy: Code of Conduct, section Business Ethics, Supplier Code of Conduct.KPIs: Follow-up and deviation reporting regarding the Code of Conduct and the Supplier Code of Conduct,
supported by the whistle-blowing function. Group-wide KPIs are missing.
To the Annual General Meeting of the shareholders of Scandi Standard AB (publ), corporate identity number 556921-0627
Assignment and responsibilityIt is the Board of Directors that is responsible for the Sustainability Report for the year 2018 on pages 30–41 and for ensuring that it has been prepared in accordance with the Swedish Annual Accounts Act.
The scope of the auditOur examination has been conducted in accordance with FAR’s auditing standard RevR 12 The auditor’s opinion regarding the statutory sustainability report. This means that our examination of the sustainability report is substantially different and less in scope than an
audit conducted in accordance with International Standards on Auditing and generally accepted auditing standards in Sweden. We believe that the examination has provided us with a sufficient basis for our opinion.
OpinionA sustainability report has been prepared.
Stockholm, 2 April 2019Öhrlings PricewaterhouseCoopers AB
Bo LagerströmAuthorised Public Accountant
Auditor’s report on the statutory sustainability report
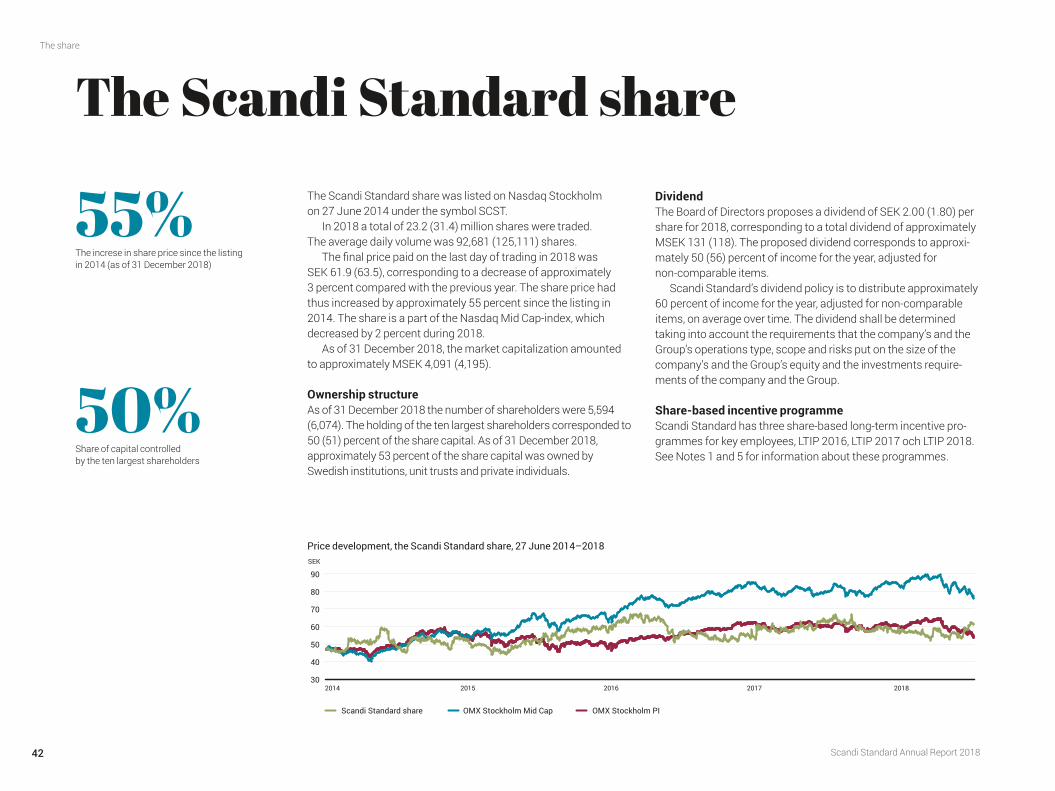
Scandi Standard Annual Report 2018
The share
42
The Scandi Standard share was listed on Nasdaq Stockholm on 27 June 2014 under the symbol SCST.
In 2018 a total of 23.2 (31.4) million shares were traded. The average daily volume was 92,681 (125,111) shares.
The final price paid on the last day of trading in 2018 was SEK 61.9 (63.5), corresponding to a decrease of approximately 3 percent compared with the previous year. The share price had thus increased by approximately 55 percent since the listing in 2014. The share is a part of the Nasdaq Mid Cap-index, which decreased by 2 percent during 2018.
As of 31 December 2018, the market capitalization amounted to approximately MSEK 4,091 (4,195).
Ownership structureAs of 31 December 2018 the number of shareholders were 5,594 (6,074). The holding of the ten largest shareholders corresponded to 50 (51) percent of the share capital. As of 31 December 2018, approximately 53 percent of the share capital was owned by Swedish institutions, unit trusts and private individuals.
DividendThe Board of Directors proposes a dividend of SEK 2.00 (1.80) per share for 2018, corresponding to a total dividend of approximately MSEK 131 (118). The proposed dividend corresponds to approxi-mately 50 (56) percent of income for the year, adjusted for non-comparable items.
Scandi Standard’s dividend policy is to distribute approximately 60 percent of income for the year, adjusted for non-comparable items, on average over time. The dividend shall be determined taking into account the requirements that the company’s and the Group’s operations type, scope and risks put on the size of the company’s and the Group’s equity and the investments require-ments of the company and the Group.
Share-based incentive programmeScandi Standard has three share-based long-term incentive pro-grammes for key employees, LTIP 2016, LTIP 2017 och LTIP 2018. See Notes 1 and 5 for information about these programmes.
30
40
50
60
70
80
90
SEK
Scandi Standard share OMX Stockholm Mid Cap
2014 2016 20182017
OMX Stockholm PI
2015
Price development, the Scandi Standard share, 27 June 2014–2018
The Scandi Standard share
55%The increse in share price since the listing in 2014 (as of 31 December 2018)
50%Share of capital controlled by the ten largest shareholders
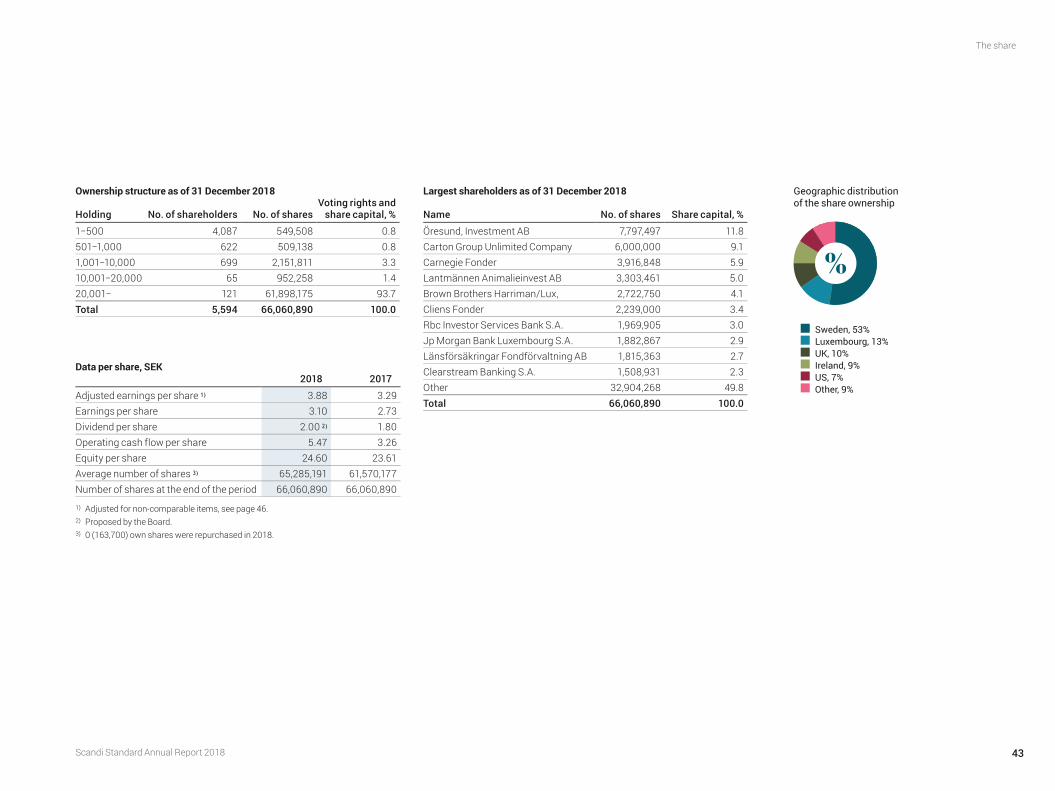
Scandi Standard Annual Report 2018
The share
43
Ownership structure as of 31 December 2018
Holding No. of shareholders No. of sharesVoting rights and
share capital, %
1−500 4,087 549,508 0.8501−1,000 622 509,138 0.81,001−10,000 699 2,151,811 3.310,001−20,000 65 952,258 1.420,001− 121 61,898,175 93.7Total 5,594 66,060,890 100.0
Data per share, SEK2018 2017
Adjusted earnings per share 1) 3.88 3.29Earnings per share 3.10 2.73Dividend per share 2.00 2) 1.80Operating cash flow per share 5.47 3.26Equity per share 24.60 23.61Average number of shares 3) 65,285,191 61,570,177Number of shares at the end of the period 66,060,890 66,060,890
1) Adjusted for non-comparable items, see page 46.2) Proposed by the Board. 3) 0 (163,700) own shares were repurchased in 2018.
Largest shareholders as of 31 December 2018
Name No. of shares Share capital, %
Öresund, Investment AB 7,797,497 11.8Carton Group Unlimited Company 6,000,000 9.1Carnegie Fonder 3,916,848 5.9Lantmännen Animalieinvest AB 3,303,461 5.0Brown Brothers Harriman/Lux, 2,722,750 4.1Cliens Fonder 2,239,000 3.4Rbc Investor Services Bank S.A. 1,969,905 3.0Jp Morgan Bank Luxembourg S.A. 1,882,867 2.9Länsförsäkringar Fondförvaltning AB 1,815,363 2.7Clearstream Banking S.A. 1,508,931 2.3Other 32,904,268 49.8Total 66,060,890 100.0
Geographic distribution of the share ownership
Sweden, 53%Luxembourg, 13%UK, 10%Ireland, 9%US, 7%Other, 9%
Financial statements
44
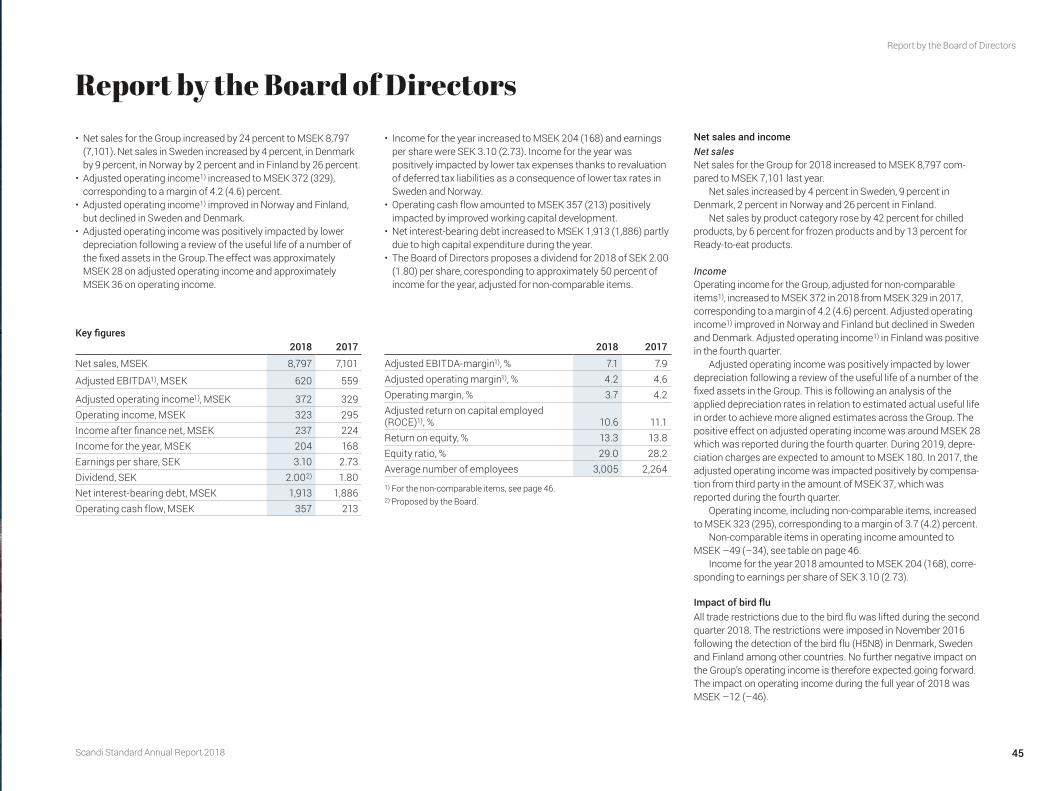
Report by the Board of Directors• Net sales for the Group increased by 24 percent to MSEK 8,797
(7,101). Net sales in Sweden increased by 4 percent, in Denmark by 9 percent, in Norway by 2 percent and in Finland by 26 percent.
• Adjusted operating income1) increased to MSEK 372 (329), corresponding to a margin of 4.2 (4.6) percent.
• Adjusted operating income1) improved in Norway and Finland, but declined in Sweden and Denmark.
• Adjusted operating income was positively impacted by lower depreciation following a review of the useful life of a number of the fixed assets in the Group.The effect was approximately MSEK 28 on adjusted operating income and approximately MSEK 36 on operating income.
• Income for the year increased to MSEK 204 (168) and earnings per share were SEK 3.10 (2.73). Income for the year was positively impacted by lower tax expenses thanks to revaluation of deferred tax liabilities as a consequence of lower tax rates in Sweden and Norway.
• Operating cash flow amounted to MSEK 357 (213) positively impacted by improved working capital development.
• Net interest-bearing debt increased to MSEK 1,913 (1,886) partly due to high capital expenditure during the year.
• The Board of Directors proposes a dividend for 2018 of SEK 2.00 (1.80) per share, coresponding to approximately 50 percent of income for the year, adjusted for non-comparable items.
Net sales and incomeNet sales Net sales for the Group for 2018 increased to MSEK 8,797 com-pared to MSEK 7,101 last year.
Net sales increased by 4 percent in Sweden, 9 percent in Denmark, 2 percent in Norway and 26 percent in Finland.
Net sales by product category rose by 42 percent for chilled products, by 6 percent for frozen products and by 13 percent for Ready-to-eat products.
IncomeOperating income for the Group, adjusted for non-comparable items1), increased to MSEK 372 in 2018 from MSEK 329 in 2017, corresponding to a margin of 4.2 (4.6) percent. Adjusted operating income1) improved in Norway and Finland but declined in Sweden and Denmark. Adjusted operating income1) in Finland was positive in the fourth quarter.
Adjusted operating income was positively impacted by lower depreciation following a review of the useful life of a number of the fixed assets in the Group. This is following an analysis of the applied depreciation rates in relation to estimated actual useful life in order to achieve more aligned estimates across the Group. The positive effect on adjusted operating income was around MSEK 28 which was reported during the fourth quarter. During 2019, depre-ciation charges are expected to amount to MSEK 180. In 2017, the adjusted operating income was impacted positively by compensa-tion from third party in the amount of MSEK 37, which was reported during the fourth quarter.
Operating income, including non-comparable items, increased to MSEK 323 (295), corresponding to a margin of 3.7 (4.2) percent.
Non-comparable items in operating income amounted to MSEK –49 (–34), see table on page 46.
Income for the year 2018 amounted to MSEK 204 (168), corre-sponding to earnings per share of SEK 3.10 (2.73).
Impact of bird flu All trade restrictions due to the bird flu was lifted during the second quarter 2018. The restrictions were imposed in November 2016 following the detection of the bird flu (H5N8) in Denmark, Sweden and Finland among other countries. No further negative impact on the Group’s operating income is therefore expected going forward. The impact on operating income during the full year of 2018 was MSEK –12 (–46).
2018 2017
Net sales, MSEK 8,797 7,101
Adjusted EBITDA1), MSEK 620 559
Adjusted operating income1), MSEK 372 329Operating income, MSEK 323 295Income after finance net, MSEK 237 224Income for the year, MSEK 204 168Earnings per share, SEK 3.10 2.73Dividend, SEK 2.002) 1.80Net interest-bearing debt, MSEK 1,913 1,886Operating cash flow, MSEK 357 213
2018 2017
Adjusted EBITDA-margin1), % 7.1 7.9Adjusted operating margin1), % 4.2 4.6Operating margin, % 3.7 4.2Adjusted return on capital employed (ROCE)1), % 10.6 11.1Return on equity, % 13.3 13.8Equity ratio, % 29.0 28.2Average number of employees 3,005 2,264
1) For the non-comparable items, see page 46.2) Proposed by the Board.
Key figures
Scandi Standard Annual Report 2018
Report by the Board of Directors
45
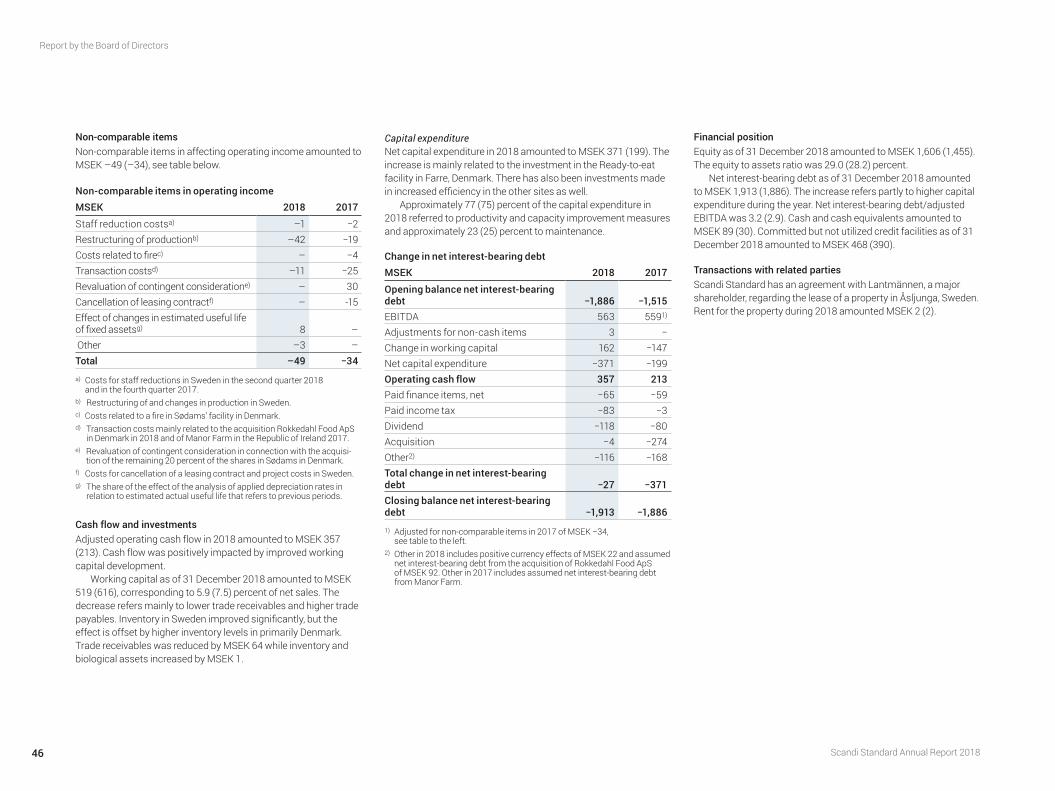
Non-comparable itemsNon-comparable items in affecting operating income amounted to MSEK –49 (–34), see table below.
Non-comparable items in operating incomeMSEK 2018 2017
Staff reduction costsa) –1 −2Restructuring of productionb) –42 −19Costs related to firec) – −4Transaction costsd) –11 −25Revaluation of contingent consideratione) – 30Cancellation of leasing contractf) – -15Effect of changes in estimated useful life of fixed assetsg) 8 – Other –3 –Total –49 −34
a) Costs for staff reductions in Sweden in the second quarter 2018 and in the fourth quarter 2017.
b) Restructuring of and changes in production in Sweden.c) Costs related to a fire in Sødams’ facility in Denmark. d) Transaction costs mainly related to the acquisition Rokkedahl Food ApS
in Denmark in 2018 and of Manor Farm in the Republic of Ireland 2017.e) Revaluation of contingent consideration in connection with the acquisi-
tion of the remaining 20 percent of the shares in Sødams in Denmark. f) Costs for cancellation of a leasing contract and project costs in Sweden.g) The share of the effect of the analysis of applied depreciation rates in
relation to estimated actual useful life that refers to previous periods.
Cash flow and investmentsAdjusted operating cash flow in 2018 amounted to MSEK 357 (213). Cash flow was positively impacted by improved working capital development.
Working capital as of 31 December 2018 amounted to MSEK 519 (616), corresponding to 5.9 (7.5) percent of net sales. The decrease refers mainly to lower trade receivables and higher trade payables. Inventory in Sweden improved significantly, but the effect is offset by higher inventory levels in primarily Denmark. Trade receivables was reduced by MSEK 64 while inventory and biological assets increased by MSEK 1.
Capital expenditureNet capital expenditure in 2018 amounted to MSEK 371 (199). The increase is mainly related to the investment in the Ready-to-eat facility in Farre, Denmark. There has also been investments made in increased efficiency in the other sites as well.
Approximately 77 (75) percent of the capital expenditure in 2018 referred to productivity and capacity improvement measures and approximately 23 (25) percent to maintenance.
Change in net interest-bearing debtMSEK 2018 2017
Opening balance net interest-bearing debt −1,886 −1,515EBITDA 563 5591)
Adjustments for non-cash items 3 −Change in working capital 162 −147Net capital expenditure −371 −199Operating cash flow 357 213Paid finance items, net −65 −59Paid income tax −83 −3Dividend −118 −80Acquisition −4 −274Other2) −116 −168Total change in net interest-bearing debt −27 −371Closing balance net interest-bearing debt −1,913 −1,886
1) Adjusted for non-comparable items in 2017 of MSEK −34, see table to the left.
2) Other in 2018 includes positive currency effects of MSEK 22 and assumed net interest-bearing debt from the acquisition of Rokkedahl Food ApS of MSEK 92. Other in 2017 includes assumed net interest-bearing debt from Manor Farm.
Financial positionEquity as of 31 December 2018 amounted to MSEK 1,606 (1,455). The equity to assets ratio was 29.0 (28.2) percent.
Net interest-bearing debt as of 31 December 2018 amounted to MSEK 1,913 (1,886). The increase refers partly to higher capital expenditure during the year. Net interest-bearing debt/adjusted EBITDA was 3.2 (2.9). Cash and cash equivalents amounted to MSEK 89 (30). Committed but not utilized credit facilities as of 31 December 2018 amounted to MSEK 468 (390).
Transactions with related partiesScandi Standard has an agreement with Lantmännen, a major shareholder, regarding the lease of a property in Åsljunga, Sweden. Rent for the property during 2018 amounted MSEK 2 (2).
Scandi Standard Annual Report 2018
Report by the Board of Directors
46
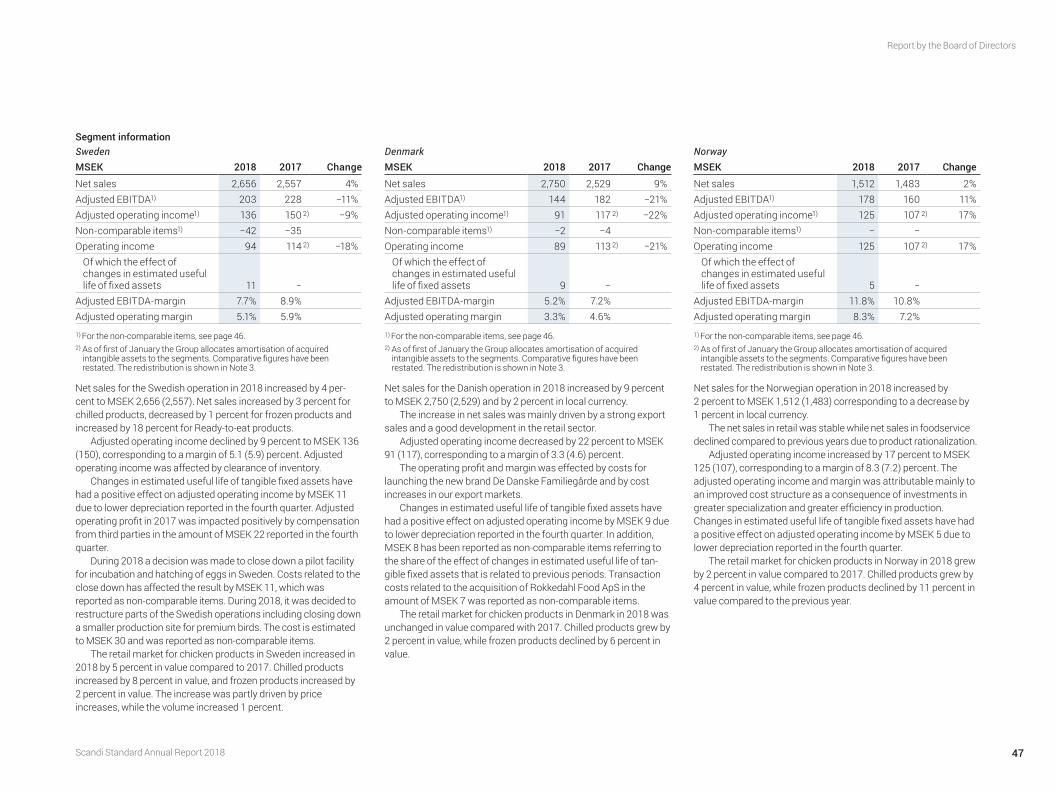
Segment informationSwedenMSEK 2018 2017 Change
Net sales 2,656 2,557 4%Adjusted EBITDA1) 203 228 −11%Adjusted operating income1) 136 150 2) −9%Non-comparable items1) −42 −35Operating income 94 114 2) −18%
Of which the effect of changes in estimated useful life of fixed assets 11 −
Adjusted EBITDA-margin 7.7% 8.9%Adjusted operating margin 5.1% 5.9%
1) For the non-comparable items, see page 46.2) As of first of January the Group allocates amortisation of acquired
intangible assets to the segments. Comparative figures have been restated. The redistribution is shown in Note 3.
Net sales for the Swedish operation in 2018 increased by 4 per-cent to MSEK 2,656 (2,557). Net sales increased by 3 percent for chilled products, decreased by 1 percent for frozen products and increased by 18 percent for Ready-to-eat products.
Adjusted operating income declined by 9 percent to MSEK 136 (150), corresponding to a margin of 5.1 (5.9) percent. Adjusted operating income was affected by clearance of inventory.
Changes in estimated useful life of tangible fixed assets have had a positive effect on adjusted operating income by MSEK 11 due to lower depreciation reported in the fourth quarter. Adjusted operating profit in 2017 was impacted positively by compensation from third parties in the amount of MSEK 22 reported in the fourth quarter.
During 2018 a decision was made to close down a pilot facility for incubation and hatching of eggs in Sweden. Costs related to the close down has affected the result by MSEK 11, which was reported as non-comparable items. During 2018, it was decided to restructure parts of the Swedish operations including closing down a smaller production site for premium birds. The cost is estimated to MSEK 30 and was reported as non-comparable items.
The retail market for chicken products in Sweden increased in 2018 by 5 percent in value compared to 2017. Chilled products increased by 8 percent in value, and frozen products increased by 2 percent in value. The increase was partly driven by price increases, while the volume increased 1 percent.
DenmarkMSEK 2018 2017 Change
Net sales 2,750 2,529 9%Adjusted EBITDA1) 144 182 −21%Adjusted operating income1) 91 117 2) −22%Non-comparable items1) −2 −4Operating income 89 113 2) −21%
Of which the effect of changes in estimated useful life of fixed assets 9 −
Adjusted EBITDA-margin 5.2% 7.2%Adjusted operating margin 3.3% 4.6%
1) For the non-comparable items, see page 46.2) As of first of January the Group allocates amortisation of acquired
intangible assets to the segments. Comparative figures have been restated. The redistribution is shown in Note 3.
Net sales for the Danish operation in 2018 increased by 9 percent to MSEK 2,750 (2,529) and by 2 percent in local currency.
The increase in net sales was mainly driven by a strong export sales and a good development in the retail sector.
Adjusted operating income decreased by 22 percent to MSEK 91 (117), corresponding to a margin of 3.3 (4.6) percent.
The operating profit and margin was effected by costs for launching the new brand De Danske Familiegårde and by cost increases in our export markets.
Changes in estimated useful life of tangible fixed assets have had a positive effect on adjusted operating income by MSEK 9 due to lower depreciation reported in the fourth quarter. In addition, MSEK 8 has been reported as non-comparable items referring to the share of the effect of changes in estimated useful life of tan-gible fixed assets that is related to previous periods. Transaction costs related to the acquisition of Rokkedahl Food ApS in the amount of MSEK 7 was reported as non-comparable items.
The retail market for chicken products in Denmark in 2018 was unchanged in value compared with 2017. Chilled products grew by 2 percent in value, while frozen products declined by 6 percent in value.
NorwayMSEK 2018 2017 Change
Net sales 1,512 1,483 2%Adjusted EBITDA1) 178 160 11%Adjusted operating income1) 125 107 2) 17%Non-comparable items1) − −Operating income 125 107 2) 17%
Of which the effect of changes in estimated useful life of fixed assets 5 −
Adjusted EBITDA-margin 11.8% 10.8%Adjusted operating margin 8.3% 7.2%
1) For the non-comparable items, see page 46.2) As of first of January the Group allocates amortisation of acquired
intangible assets to the segments. Comparative figures have been restated. The redistribution is shown in Note 3.
Net sales for the Norwegian operation in 2018 increased by 2 percent to MSEK 1,512 (1,483) corresponding to a decrease by 1 percent in local currency.
The net sales in retail was stable while net sales in foodservice declined compared to previous years due to product rationalization.
Adjusted operating income increased by 17 percent to MSEK 125 (107), corresponding to a margin of 8.3 (7.2) percent. The adjusted operating income and margin was attributable mainly to an improved cost structure as a consequence of investments in greater specialization and greater efficiency in production. Changes in estimated useful life of tangible fixed assets have had a positive effect on adjusted operating income by MSEK 5 due to lower depreciation reported in the fourth quarter.
The retail market for chicken products in Norway in 2018 grew by 2 percent in value compared to 2017. Chilled products grew by 4 percent in value, while frozen products declined by 11 percent in value compared to the previous year.
Scandi Standard Annual Report 2018
Report by the Board of Directors
47
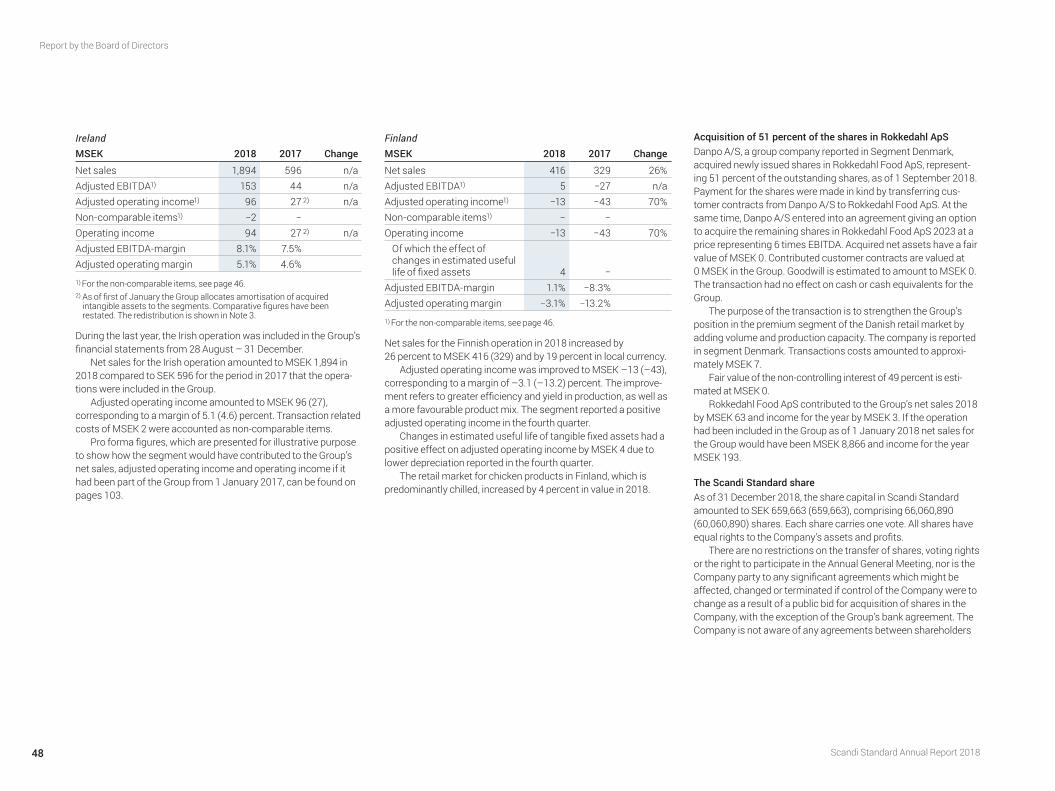
IrelandMSEK 2018 2017 Change
Net sales 1,894 596 n/aAdjusted EBITDA1) 153 44 n/aAdjusted operating income1) 96 27 2) n/aNon-comparable items1) −2 −Operating income 94 27 2) n/aAdjusted EBITDA-margin 8.1% 7.5%Adjusted operating margin 5.1% 4.6%
1) For the non-comparable items, see page 46.2) As of first of January the Group allocates amortisation of acquired
intangible assets to the segments. Comparative figures have been restated. The redistribution is shown in Note 3.
During the last year, the Irish operation was included in the Group’s financial statements from 28 August – 31 December.
Net sales for the Irish operation amounted to MSEK 1,894 in 2018 compared to SEK 596 for the period in 2017 that the opera-tions were included in the Group.
Adjusted operating income amounted to MSEK 96 (27), corresponding to a margin of 5.1 (4.6) percent. Transaction related costs of MSEK 2 were accounted as non-comparable items.
Pro forma figures, which are presented for illustrative purpose to show how the segment would have contributed to the Group’s net sales, adjusted operating income and operating income if it had been part of the Group from 1 January 2017, can be found on pages 103.
FinlandMSEK 2018 2017 Change
Net sales 416 329 26%Adjusted EBITDA1) 5 −27 n/aAdjusted operating income1) −13 −43 70%Non-comparable items1) − −Operating income −13 −43 70%
Of which the effect of changes in estimated useful life of fixed assets 4 −
Adjusted EBITDA-margin 1.1% −8.3%Adjusted operating margin −3.1% −13.2%
1) For the non-comparable items, see page 46.
Net sales for the Finnish operation in 2018 increased by 26 percent to MSEK 416 (329) and by 19 percent in local currency.
Adjusted operating income was improved to MSEK –13 (–43), corresponding to a margin of –3.1 (–13.2) percent. The improve-ment refers to greater efficiency and yield in pro duction, as well as a more favourable product mix. The segment reported a positive adjusted operating income in the fourth quarter.
Changes in estimated useful life of tangible fixed assets had a positive effect on adjusted operating income by MSEK 4 due to lower depreciation reported in the fourth quarter.
The retail market for chicken products in Finland, which is predominantly chilled, increased by 4 percent in value in 2018.
Acquisition of 51 percent of the shares in Rokkedahl ApSDanpo A/S, a group company reported in Segment Denmark, acquired newly issued shares in Rokkedahl Food ApS, represent-ing 51 percent of the outstanding shares, as of 1 September 2018. Payment for the shares were made in kind by transferring cus-tomer contracts from Danpo A/S to Rokkedahl Food ApS. At the same time, Danpo A/S entered into an agreement giving an option to acquire the remaining shares in Rokkedahl Food ApS 2023 at a price representing 6 times EBITDA. Acquired net assets have a fair value of MSEK 0. Contri buted customer contracts are valued at 0 MSEK in the Group. Goodwill is estimated to amount to MSEK 0.The transaction had no effect on cash or cash equivalents for the Group.
The purpose of the transaction is to strengthen the Group’s position in the premium segment of the Danish retail market by adding volume and production capacity. The company is reported in segment Denmark. Transactions costs amounted to approxi-mately MSEK 7.
Fair value of the non-controlling interest of 49 percent is esti-mated at MSEK 0.
Rokkedahl Food ApS contributed to the Group’s net sales 2018 by MSEK 63 and income for the year by MSEK 3. If the operation had been included in the Group as of 1 January 2018 net sales for the Group would have been MSEK 8,866 and income for the year MSEK 193.
The Scandi Standard share As of 31 December 2018, the share capital in Scandi Standard amounted to SEK 659,663 (659,663), comprising 66,060,890 (60,060,890) shares. Each share carries one vote. All shares have equal rights to the Company’s assets and profits.
There are no restrictions on the transfer of shares, voting rights or the right to participate in the Annual General Meeting, nor is the Company party to any significant agreements which might be affected, changed or terminated if control of the Company were to change as a result of a public bid for acquisition of shares in the Company, with the exception of the Group’s bank agreement. The Company is not aware of any agreements between shareholders
Scandi Standard Annual Report 2018
Report by the Board of Directors
48
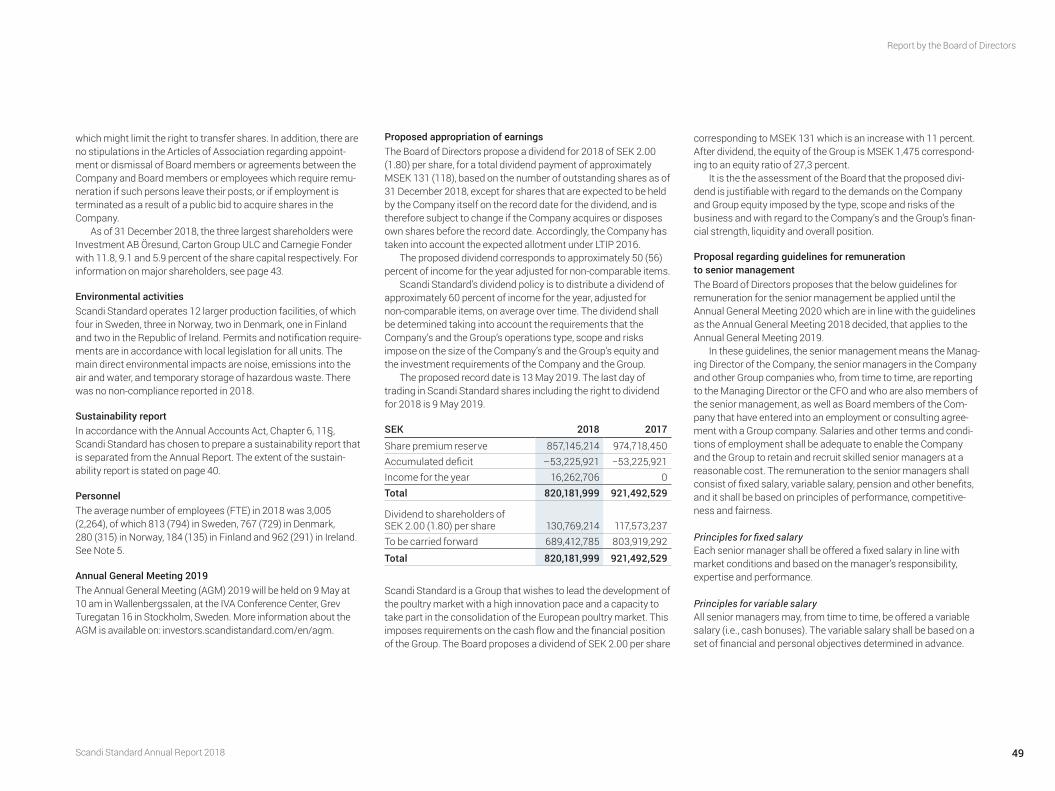
which might limit the right to transfer shares. In addition, there are no stipulations in the Articles of Association regarding appoint-ment or dismissal of Board members or agreements between the Company and Board members or employees which require remu-neration if such persons leave their posts, or if employment is terminated as a result of a public bid to acquire shares in the Company.
As of 31 December 2018, the three largest shareholders were Investment AB Öresund, Carton Group ULC and Carnegie Fonder with 11.8, 9.1 and 5.9 percent of the share capital respectively. For information on major shareholders, see page 43.
Environmental activitiesScandi Standard operates 12 larger production facilities, of which four in Sweden, three in Norway, two in Denmark, one in Finland and two in the Republic of Ireland. Permits and notification require-ments are in accordance with local legislation for all units. The main direct environmental impacts are noise, emissions into the air and water, and temporary storage of hazardous waste. There was no non-compliance reported in 2018.
Sustainability reportIn accordance with the Annual Accounts Act, Chapter 6, 11§, Scandi Standard has chosen to prepare a sustainability report that is separated from the Annual Report. The extent of the sustain-ability report is stated on page 40.
PersonnelThe average number of employees (FTE) in 2018 was 3,005 (2,264), of which 813 (794) in Sweden, 767 (729) in Denmark, 280 (315) in Norway, 184 (135) in Finland and 962 (291) in Ireland. See Note 5.
Annual General Meeting 2019 The Annual General Meeting (AGM) 2019 will be held on 9 May at 10 am in Wallenbergssalen, at the IVA Conference Center, Grev Turegatan 16 in Stockholm, Sweden. More information about the AGM is available on: investors.scandistandard.com/en/agm.
Proposed appropriation of earnings The Board of Directors propose a dividend for 2018 of SEK 2.00 (1.80) per share, for a total dividend payment of approximately MSEK 131 (118), based on the number of outstanding shares as of 31 December 2018, except for shares that are expected to be held by the Company itself on the record date for the dividend, and is therefore subject to change if the Company acquires or disposes own shares before the record date. Accordingly, the Company has taken into account the expected allotment under LTIP 2016.
The proposed dividend corresponds to approximately 50 (56) percent of income for the year adjusted for non- comparable items.
Scandi Standard’s dividend policy is to distribute a dividend of approximately 60 percent of income for the year, adjusted for non-comparable items, on average over time. The dividend shall be determined taking into account the requirements that the Company’s and the Group’s operations type, scope and risks impose on the size of the Company’s and the Group’s equity and the investment requirements of the Company and the Group.
The proposed record date is 13 May 2019. The last day of trading in Scandi Standard shares including the right to dividend for 2018 is 9 May 2019.
SEK 2018 2017
Share premium reserve 857,145,214 974,718,450Accumulated deficit –53,225,921 −53,225,921Income for the year 16,262,706 0Total 820,181,999 921,492,529
Dividend to shareholders of SEK 2.00 (1.80) per share 130,769,214 117,573,237To be carried forward 689,412,785 803,919,292
Total 820,181,999 921,492,529
Scandi Standard is a Group that wishes to lead the development of the poultry market with a high innovation pace and a capacity to take part in the consolidation of the European poultry market. This imposes requirements on the cash flow and the financial position of the Group. The Board proposes a dividend of SEK 2.00 per share
corresponding to MSEK 131 which is an increase with 11 percent. After dividend, the equity of the Group is MSEK 1,475 correspond-ing to an equity ratio of 27,3 percent.
It is the the assessment of the Board that the proposed divi-dend is justifiable with regard to the demands on the Company and Group equity imposed by the type, scope and risks of the business and with regard to the Company’s and the Group’s finan-cial strength, liquidity and overall position.
Proposal regarding guidelines for remuneration to senior managementThe Board of Directors proposes that the below guidelines for remuneration for the senior management be applied until the Annual General Meeting 2020 which are in line with the guidelines as the Annual General Meeting 2018 decided, that applies to the Annual General Meeting 2019.
In these guidelines, the senior management means the Manag-ing Director of the Company, the senior managers in the Company and other Group companies who, from time to time, are reporting to the Managing Director or the CFO and who are also members of the senior management, as well as Board members of the Com-pany that have entered into an employment or consulting agree-ment with a Group company. Salaries and other terms and condi-tions of employment shall be adequate to enable the Company and the Group to retain and recruit skilled senior managers at a reasonable cost. The remuneration to the senior managers shall consist of fixed salary, variable salary, pension and other benefits, and it shall be based on principles of performance, competitive-ness and fairness.
Principles for fixed salaryEach senior manager shall be offered a fixed salary in line with market conditions and based on the manager’s responsibility, expertise and performance.
Principles for variable salary All senior managers may, from time to time, be offered a variable salary (i.e., cash bonuses). The variable salary shall be based on a set of financial and personal objectives determined in advance.
Scandi Standard Annual Report 2018
Report by the Board of Directors
49
The variable salary may not amount to more than 75 percent of the fixed salary (in this context, fixed salary means cash salary earned during the year, excluding pension, benefits and similar). To the extent a Board member performs work for the Company, in addition to ordinary board work, a market-based consulting fee may be paid.
Principles for incentive programs The General Meeting may resolve on long-term incentive pro-grams such as share and share price-related incentive programs for the members of the senior management. Such incentive programs shall be designed to promote the long-term value growth of the Company and the Group and increase alignment between the interests of the participating individual and the Company’s shareholders.
Principles for pensions, salary during periods of notice and severance pay Agreements regarding pensions shall, where applicable, be premium based and designed in accordance with the level and practice applicable in the country in which the member of senior management is employed. Fixed salary during notice periods and severance payment, including payments for any restrictions on competition, shall in aggregate not exceed an amount equivalent to the fixed salary for two years. The total severance payment for all members of the senior management shall be limited to the current monthly salary for the remaining months up to the age of 65.
Principles for deviations from the guidelines The Board of Directors may resolve to deviate from the guidelines if the Board of Directors, in an individual case, is of the opinion that there are special circumstances justifying a deviation.
Guidelines for remuneration to senior managers, remuneration to senior managers, see Note 5.
Proposal for long-term incentive programThe Board of Directors has decided to propose to the AGM 2019 a long-term incentive program 2019 (LTIP 2019) for key employees which is designed to promote the long-term value growth of the
Company and the Group and increase alignment between the interests of the participating individual and the Company’s share-holders. The program is of the same type as LTIP 2015, LTIP 2016 , LTIP 2017 and LTIP 2018. The program comprises a maximum of 29 participants.
Performance share rights shall be allotted free of charge to the participants in relation to a fixed percentage of their base salary (fixed salary). After a three-year vesting period commencing in connection with the implementation of LTIP 2019 and provided that certain conditions are fulfilled, the participants may exercise their performance share rights through which they will be allotted shares in the Company free of charge. Each performance share entitles the holder up to one share. New for LTIP 2019 is that the participants undertakes to retain all allotted shares, except for such shares that are sold to cover for employment income tax due to the allotment of shares, for a period of two years from the date of the allotment of the shares.
In order for performance share rights to entitle to allotment of shares, it shall be required that the participant remains employed and has not given or been given notice of termination of employ-ment within the Group during the vesting period and that certain performance criteria are fulfilled.
In order to secure the delivery of shares under LTIP 2019 and for the purpose of hedging social security charges under LTIP 2019, the Board of Directors proposes that the Board of Directors be authorized to acquire a maximum of 409,717 shares in the Company on Nasdaq Stockholm. In addition, the Board of Directors proposes that the AGM resolves to transfer a maximun of 352,982 own shares to the participants of LTIP 2019 in accord-ance with the terms of the program.
The LTIP 2015 program was completed during 2018 with an allottment of 84,887 shares to the participants.
Apart from LTIP 2016, LTIP 2017 and LTIP 2018, Scandi Standard has no other share- or shareprice related incentive programs. The intention is that a program similar to LTIP 2019 will be proposed annually to the AGM in the coming years.
Full details of LTIP 2019 are included in the notice to the AGM 2019. For information about LTIP 2016, LTIP 2017 and LTIP 2018, see Note 5.
Scandi Standard Annual Report 2018
Report by the Board of Directors
50
RISKS AND RISK MANAGEMENT Scandi Standard’s ability to reach its financial and other targets is dependent on the Group being able to maintain its strong market shares and brand positions, to continuously launch new, innova-tive and safe products, and to have cost-efficient and flexible production.
As all business activities involve risks, an effective risk management process is required to protect current assets and realise the Group’s potential. Risks that are managed effectively can be reduced and result in opportunities and value creation, while risks that are not managed correctly can result in damage and value destruction.
The Group has a formalised and proactive risk management process, with clearly established roles and areas of responsibility. This involves risks being identified, evaluated, managed and followed up as a natural part of its corporate governance.
The risks are described below in no particular order of priority and without claiming to be exhaustive. Other risks and uncertain-ties presently unknown to the Group, or which the Group at present deems to be insignificant, could have a significant adverse impact in the future.
Risks and uncertaintiesRisks connected with Scandi Standard’s operations can generally be divided into strategic risks, operational risks, risks related to compliance with external laws and regulations and internal steering documents, reporting risks and financial risks.
All risks can have a negative impact on Scandi Standard’s net sales, financial results and financial position, and affect the Group’s ability to achieve the strategic, operational and financial targets that have been set.
Codes, policies, instructions and manuals have been estab-lished to ensure that the strategic risks are taken into account when making important business decisions and to govern and control operations.
Strategic risksStrategic risks are linked to business development and long-term planning, as well as brand value. These risks are largely dealt with by the Board of Directors as part of the annual strategy process, and in the work to establish the Group’s annual business plan and targets.
Operational risksOperational risks arise in the course of the day-to-day running of the businesses and are mainly managed by Group Management and other managers with operational responsibility.
Risks related to compliance with external laws and regulations as well as internal steering documentsThese risks are related to inadequate compliance with applicable external laws and regulations as well as internal steering documents.
For more information about important external laws and regulations and internal steering documents, see page 106 of the
Corporate governance report. These include the Swedish Corporate Governance Code and the Scandi Standard Code of Conduct, for example. In the case of financial reporting, this is to be prepared in accordance with external laws, accounting stand-ards and other requirements applicable to listed companies.
Reporting risks Reporting risks are related to the internal and external reporting in general and to the financial reporting in particular.
A description of internal control and risk management in the Group related to the financial reporting can be found in the Corporate governance report on page 111.
Financial risksThrough its international operations, the Group is exposed to various types of financial risks. These include fluctuations in the Group’s financial results, financial position and cash flow due to currency risks, interest rate risks, refinancing and liquidity risks as well as credit and counterparty risks.
Sensitivity analysis A sensitivity analysis of important factors affecting the Group’s financial results is shown below. The analysis is based on values as of 31 December 2018 and assumes that all other factors remain unchanged.
Sensitivity analysisChange in exchange rates in relation to SEK
Average sale price
Cost of goods sold DKK NOK EUR
Change on an annual basis 1% 1% 5% 5% 5%Approximate impact on operating income, MSEK 88 –75 –5 –6 –4
Scandi Standard Annual Report 2018
Report by the Board of Directors
51
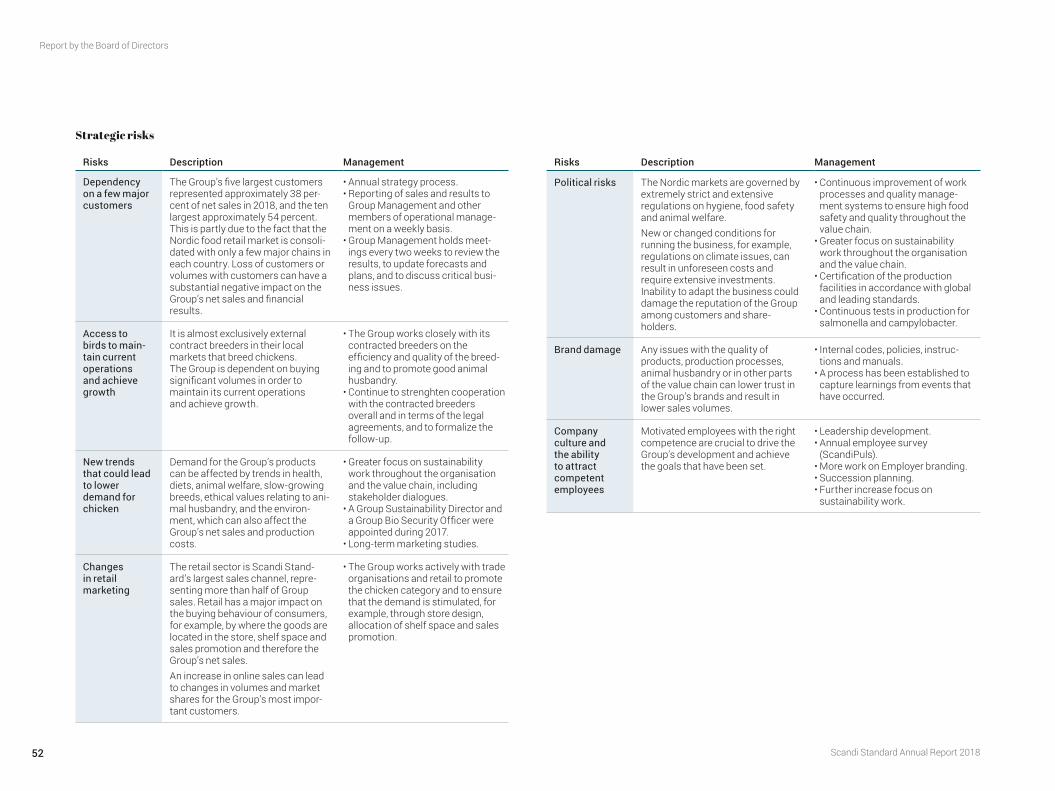
Risks Description Management
Dependency on a few major customers
The Group’s five largest customers represented approximately 38 per-cent of net sales in 2018, and the ten largest approximately 54 percent. This is partly due to the fact that the Nordic food retail market is consoli-dated with only a few major chains in each country. Loss of customers or volumes with customers can have a substantial negative impact on the Group’s net sales and financial results.
• Annual strategy process.• Reporting of sales and results to
Group Management and other members of operational manage-ment on a weekly basis.
• Group Management holds meet-ings every two weeks to review the results, to update forecasts and plans, and to discuss critical busi-ness issues.
Access to birds to main-tain current operations and achieve growth
It is almost exclusively external contract breeders in their local markets that breed chickens. The Group is dependent on buying significant volumes in order to maintain its current operations and achieve growth.
• The Group works closely with its contracted breeders on the efficiency and quality of the breed-ing and to promote good animal husbandry.
• Continue to strenghten cooperation with the contracted breeders overall and in terms of the legal agreements, and to formalize the follow-up.
New trends that could lead to lower demand for chicken
Demand for the Group’s products can be affected by trends in health, diets, animal welfare, slow-growing breeds, ethical values relating to ani-mal husbandry, and the environ-ment, which can also affect the Group’s net sales and production costs.
• Greater focus on sustainability work throughout the organisation and the value chain, including stakeholder dialogues.
• A Group Sustainability Director and a Group Bio Security Officer were appointed during 2017.
• Long-term marketing studies.
Changes in retail marketing
The retail sector is Scandi Stand-ard’s largest sales channel, repre-senting more than half of Group sales. Retail has a major impact on the buying behaviour of consumers, for example, by where the goods are located in the store, shelf space and sales promotion and therefore the Group’s net sales.An increase in online sales can lead to changes in volumes and market shares for the Group’s most impor-tant customers.
• The Group works actively with trade organisations and retail to promote the chicken category and to ensure that the demand is stimulated, for example, through store design, allocation of shelf space and sales promotion.
Risks Description Management
Political risks The Nordic markets are governed by extremely strict and extensive regulations on hygiene, food safety and animal welfare. New or changed conditions for running the business, for example, regulations on climate issues, can result in unforeseen costs and require extensive investments. Inability to adapt the business could damage the reputation of the Group among customers and share-holders.
• Continuous improvement of work processes and quality manage-ment systems to ensure high food safety and quality throughout the value chain.
• Greater focus on sustainability work throughout the organisation and the value chain.
• Certification of the production facilities in accordance with global and leading standards.
• Continuous tests in production for salmonella and campylobacter.
Brand damage Any issues with the quality of products, production processes, animal husbandry or in other parts of the value chain can lower trust in the Group’s brands and result in lower sales volumes.
• Internal codes, policies, instruc-tions and manuals.
• A process has been established to capture learnings from events that have occurred.
Company culture and the ability to attract competent employees
Motivated employees with the right competence are crucial to drive the Group’s development and achieve the goals that have been set.
• Leadership development.• Annual employee survey
(ScandiPuls).• More work on Employer branding.• Succession planning.• Further increase focus on
sustainability work.
Strategic risks
Scandi Standard Annual Report 2018
Report by the Board of Directors
52
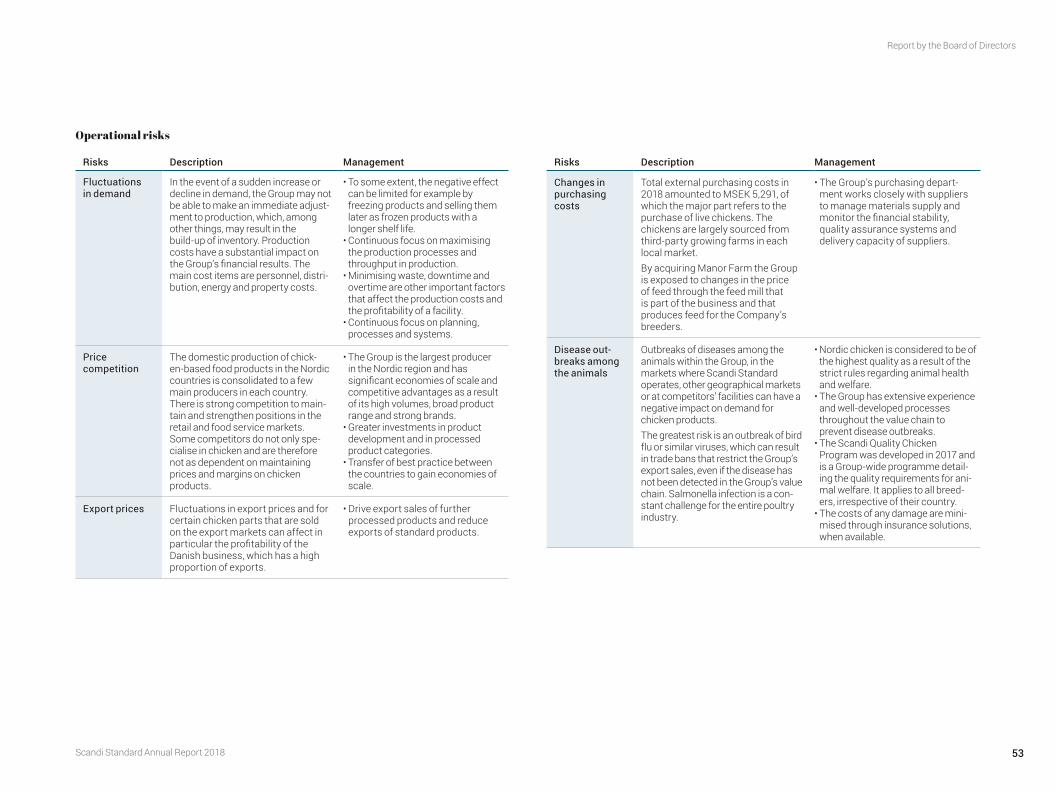
Risks Description Management
Fluctuations in demand
In the event of a sudden increase or decline in demand, the Group may not be able to make an immediate adjust-ment to production, which, among other things, may result in the build-up of inventory. Production costs have a substantial impact on the Group’s financial results. The main cost items are personnel, distri-bution, energy and property costs.
• To some extent, the negative effect can be limited for example by freezing products and selling them later as frozen products with a longer shelf life.
• Continuous focus on maximising the production processes and throughput in production.
• Minimising waste, downtime and overtime are other important factors that affect the production costs and the profitability of a facility.
• Continuous focus on planning, processes and systems.
Price competition
The domestic production of chick-en-based food products in the Nordic countries is consolidated to a few main producers in each country. There is strong competition to main-tain and strengthen positions in the retail and food service markets. Some competitors do not only spe-cialise in chicken and are therefore not as dependent on maintaining prices and margins on chicken products.
• The Group is the largest producer in the Nordic region and has significant economies of scale and competitive advantages as a result of its high volumes, broad product range and strong brands.
• Greater investments in product development and in processed product categories.
• Transfer of best practice between the countries to gain economies of scale.
Export prices Fluctuations in export prices and for certain chicken parts that are sold on the export markets can affect in particular the profitability of the Danish business, which has a high proportion of exports.
• Drive export sales of further processed products and reduce exports of standard products.
Risks Description Management
Changes in purchasing costs
Total external purchasing costs in 2018 amounted to MSEK 5,291, of which the major part refers to the purchase of live chickens. The chickens are largely sourced from third-party growing farms in each local market. By acquiring Manor Farm the Group is exposed to changes in the price of feed through the feed mill that is part of the business and that produces feed for the Company’s breeders.
• The Group’s purchasing depart-ment works closely with suppliers to manage materials supply and monitor the financial stability, quality assurance systems and delivery capacity of suppliers.
Disease out-breaks among the animals
Outbreaks of diseases among the animals within the Group, in the markets where Scandi Standard operates, other geographical markets or at competitors’ facilities can have a negative impact on demand for chicken products. The greatest risk is an outbreak of bird flu or similar viruses, which can result in trade bans that restrict the Group’s export sales, even if the disease has not been detected in the Group’s value chain. Salmonella infection is a con-stant challenge for the entire poultry industry.
• Nordic chicken is considered to be of the highest quality as a result of the strict rules regarding animal health and welfare.
• The Group has extensive experience and well-developed processes throughout the value chain to prevent disease outbreaks.
• The Scandi Quality Chicken Program was developed in 2017 and is a Group-wide programme detail-ing the quality requirements for ani-mal welfare. It applies to all breed-ers, irrespective of their country.
• The costs of any damage are mini-mised through insurance solutions, when available.
Operational risks
Scandi Standard Annual Report 2018
Report by the Board of Directors
53
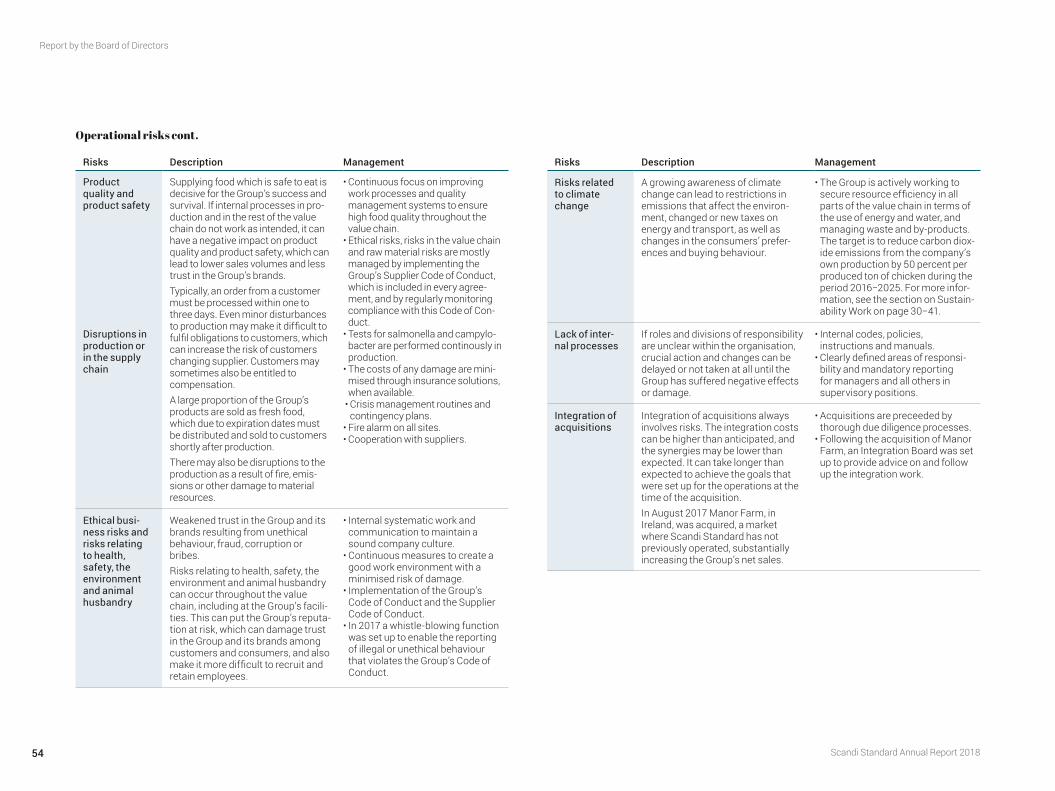
Risks Description Management
Product quality and product safety
Disruptions in production or in the supply chain
Supplying food which is safe to eat is decisive for the Group’s success and survival. If internal processes in pro-duction and in the rest of the value chain do not work as intended, it can have a negative impact on product quality and product safety, which can lead to lower sales volumes and less trust in the Group’s brands.Typically, an order from a customer must be processed within one to three days. Even minor disturbances to production may make it difficult to fulfil obligations to customers, which can increase the risk of customers changing supplier. Customers may sometimes also be entitled to compensation.A large proportion of the Group’s products are sold as fresh food, which due to expiration dates must be distributed and sold to customers shortly after production.There may also be disruptions to the production as a result of fire, emis-sions or other damage to material resources.
• Continuous focus on improving work processes and quality management systems to ensure high food quality throughout the value chain.
• Ethical risks, risks in the value chain and raw material risks are mostly managed by implementing the Group’s Supplier Code of Conduct, which is included in every agree-ment, and by regularly monitoring compliance with this Code of Con-duct.
• Tests for salmonella and campylo-bacter are performed continously in production.
• The costs of any damage are mini-mised through insurance solutions, when available.
• Crisis management routines and contingency plans.
• Fire alarm on all sites.• Cooperation with suppliers.
Ethical busi-ness risks and risks relating to health, safety, the environment and animal husbandry
Weakened trust in the Group and its brands resulting from unethical behaviour, fraud, corruption or bribes.Risks relating to health, safety, the environment and animal husbandry can occur throughout the value chain, including at the Group’s facili-ties. This can put the Group’s reputa-tion at risk, which can damage trust in the Group and its brands among customers and consumers, and also make it more difficult to recruit and retain employees.
• Internal systematic work and communication to maintain a sound company culture.
• Continuous measures to create a good work environment with a minimised risk of damage.
• Implementation of the Group’s Code of Conduct and the Supplier Code of Conduct.
• In 2017 a whistle-blowing function was set up to enable the reporting of illegal or unethical behaviour that violates the Group’s Code of Conduct.
Risks Description Management
Risks related to climate change
A growing awareness of climate change can lead to restrictions in emissions that affect the environ-ment, changed or new taxes on energy and transport, as well as changes in the consumers’ prefer-ences and buying behaviour.
• The Group is actively working to secure resource efficiency in all parts of the value chain in terms of the use of energy and water, and managing waste and by-products. The target is to reduce carbon diox-ide emissions from the company’s own production by 50 percent per produced ton of chicken during the period 2016−2025. For more infor-mation, see the section on Sustain-ability Work on page 30−41.
Lack of inter-nal processes
If roles and divisions of responsibility are unclear within the organisation, crucial action and changes can be delayed or not taken at all until the Group has suffered negative effects or damage.
• Internal codes, policies, instructions and manuals.
• Clearly defined areas of responsi-bility and mandatory reporting for managers and all others in supervisory positions.
Integration of acquisitions
Integration of acquisitions always involves risks. The integration costs can be higher than anticipated, and the synergies may be lower than expected. It can take longer than expected to achieve the goals that were set up for the operations at the time of the acquisition.In August 2017 Manor Farm, in Ireland, was acquired, a market where Scandi Standard has not previously operated, substantially increasing the Group’s net sales.
• Acquisitions are preceeded by thorough due diligence processes.
• Following the acquisition of Manor Farm, an Integration Board was set up to provide advice on and follow up the integration work.
Operational risks cont.
Scandi Standard Annual Report 2018
Report by the Board of Directors
54
Risks Description Management
Compliance with external laws and regu-lations as well as internal steering docu-ments
The Group operates in several differ-ent countries, which means that there are many external laws and regulations governing all aspects of the business. If these are not observed, it can have both legal and financial consequences that can also damage the Group’s reputation.As a Swedish public limited liability company listed on Nasdaq Stock-holm, Scandi Standard has to follow the Swedish Companies Act, the Swedish Annual Accounts Act, Nasdaq Stockholm’s rule book, the Swedish Corporate Governance Code, and other Swedish and foreign external laws and regulations.
• The Group’s management struc-ture with strong local management in each country allows for relevant information to be disseminated quickly within the organisation.
• Country risk policies and other internal steering documents, including the Instruction regarding financial reporting, Information policy, Insider policy, IT-security policy, Finance policy and others are updated on a regular basis and approved by the Board.
• Implementation of the Group’s Code of Conduct, the Supplier Code of Conduct and whistle-blowing function.
• The Group continuously works to streamline the financial reporting process for external financial information.
Risks related to compliance with external laws and regulations as well as internal steering documents
Risks Description Management
Transaction and transla-tion exposure
Transaction exposure relates mainly to export sales. Translation exposure is the effect of changes in exchange rates when foreign subsidiaries’ income statements and statements of financial position in DKK, NOK and EUR are translated into SEK.
• The financial risks are managed by the Group’s central finance func-tion, based on the finance policy that has been established by the Board, and the risk policy for each country.
• The Group’s currency rate risk is hedged to some extent by denomi-nating some loans in subsidiaries respectively reporting currency.
Interest, refinancing, liquidity, credit and counter-party risks
Interest-bearing liabilities expose the Group to interest rate risks, i.e. changes in market interest rates can negatively affect financial results and cash flow. Risks related to refinancing and liquidity include the risk that refinanc-ing opportunities are limited when loans and credit facilities shall be renewed, that costs are higher, as well as the risk of the inability to meet payment obligations as a result of insufficient liquidity. Credit and counterparty risks include the risks that a counterparty in a transaction will be unable to discharge its obligations. For more information, see Note 20.
• The interest rate risk is managed by limiting the fixed-rate period and is to a certain extent also secured by using rate swaps.
• The Group’s outstanding liabilities, including outstanding rate swaps, had a weighted average term of 21 (7) months, as of 31 December 2018.
• The refinancing risk is limited by having a well diversified group of counterparties.
• The weighted average maturity of loans at credit institutions were 5 (4) years at the end of the year.
Financial risks
Risks Description Management
Inaccuracies in reporting
Errors can affect both internal and external reporting generally but also specifically the financial reporting. For information about the internal control over financial reporting, see the Corporate governance report on pages 111−113.
• Financial and Accounting Manual• The internal audit function and the
process for identifying risks have gradually been strengthened.
IT-related risks Lack of information, security and IT-security, including disruptions or faults in critical IT systems can affect both internal and external reporting generally but also specifically the financial reporting.
• IT security policy.• Improved governance processes
and routines for IT systems are under implementation.
Reporting risks
Scandi Standard Annual Report 2018
Report by the Board of Directors
55
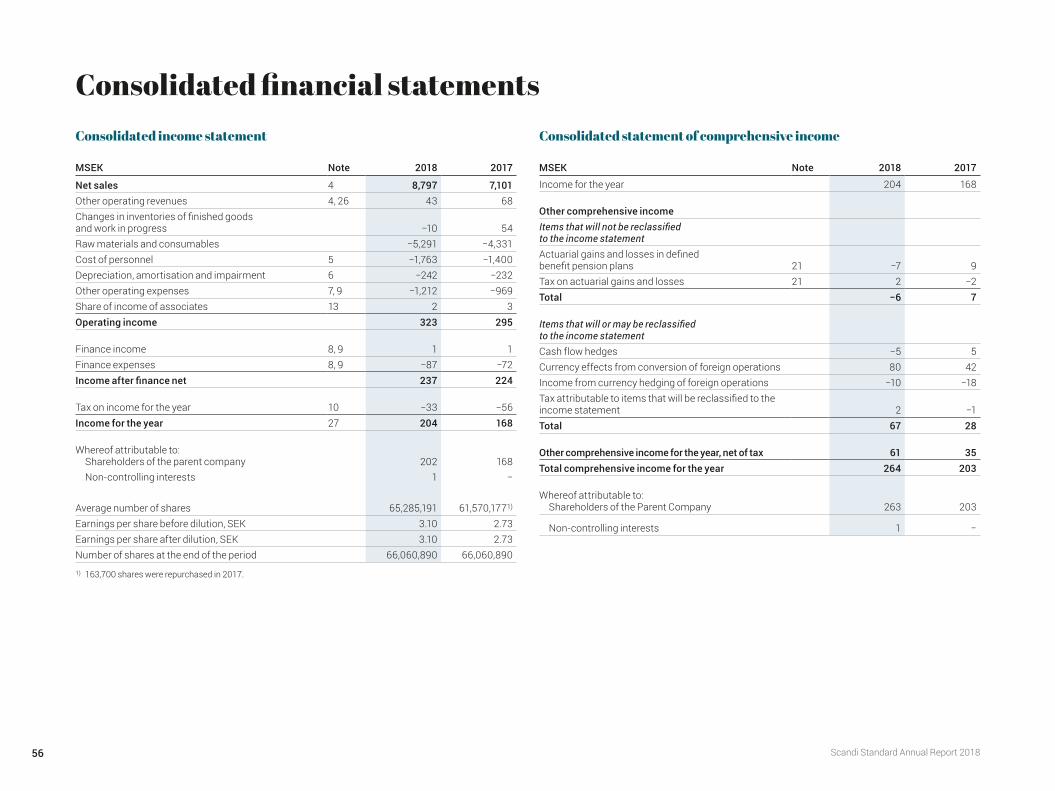
Consolidated financial statementsConsolidated income statement
MSEK Note 2018 2017
Net sales 4 8,797 7,101Other operating revenues 4, 26 43 68Changes in inventories of finished goods and work in progress −10 54Raw materials and consumables −5,291 −4,331Cost of personnel 5 −1,763 −1,400Depreciation, amortisation and impairment 6 −242 −232Other operating expenses 7, 9 −1,212 −969Share of income of associates 13 2 3Operating income 323 295
Finance income 8, 9 1 1Finance expenses 8, 9 −87 −72Income after finance net 237 224
Tax on income for the year 10 −33 −56Income for the year 27 204 168
Whereof attributable to: Shareholders of the parent company 202 168 Non-controlling interests 1 −
Average number of shares 65,285,191 61,570,1771)
Earnings per share before dilution, SEK 3.10 2.73Earnings per share after dilution, SEK 3.10 2.73Number of shares at the end of the period 66,060,890 66,060,890
1) 163,700 shares were repurchased in 2017.
Consolidated statement of comprehensive income
MSEK Note 2018 2017
Income for the year 204 168
Other comprehensive income Items that will not be reclassified to the income statementActuarial gains and losses in defined benefit pension plans 21 −7 9Tax on actuarial gains and losses 21 2 −2Total −6 7
Items that will or may be reclassified to the income statementCash flow hedges −5 5Currency effects from conversion of foreign operations 80 42Income from currency hedging of foreign operations −10 −18Tax attributable to items that will be reclassified to the income statement 2 −1Total 67 28
Other comprehensive income for the year, net of tax 61 35Total comprehensive income for the year 264 203
Whereof attributable to: Shareholders of the Parent Company 263 203
Non-controlling interests 1 −
Scandi Standard Annual Report 201856
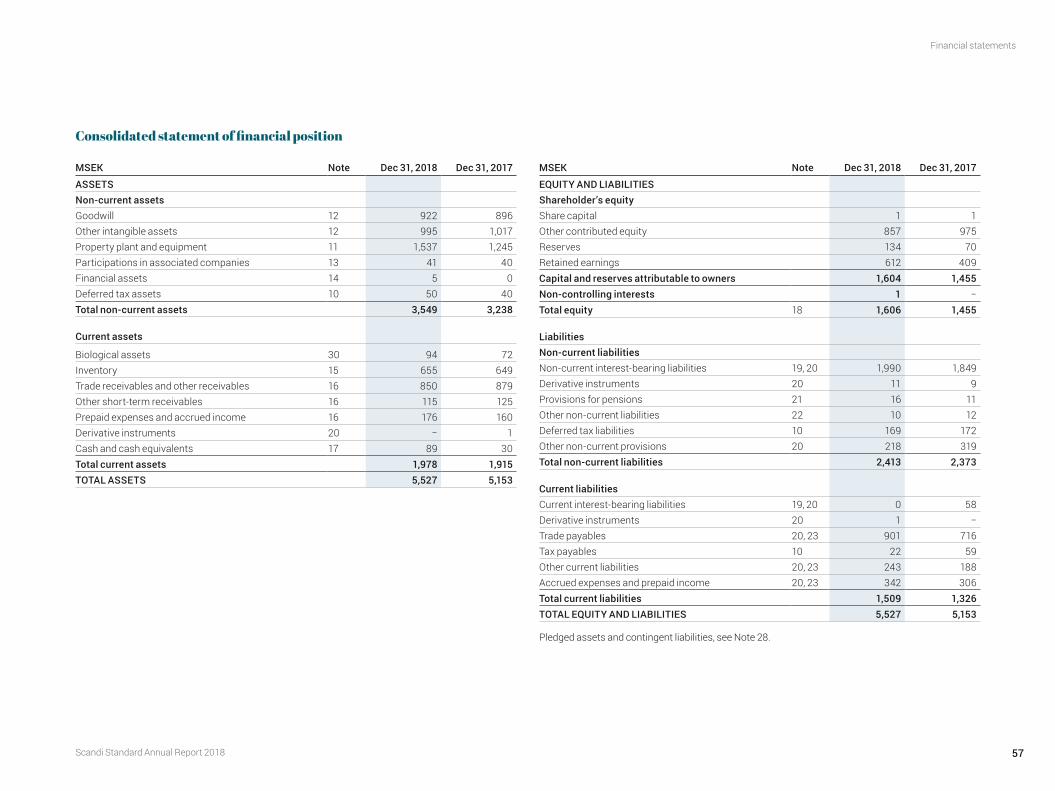
Consolidated statement of financial position
MSEK Note Dec 31, 2018 Dec 31, 2017
ASSETSNon-current assetsGoodwill 12 922 896Other intangible assets 12 995 1,017Property plant and equipment 11 1,537 1,245Participations in associated companies 13 41 40Financial assets 14 5 0Deferred tax assets 10 50 40Total non-current assets 3,549 3,238
Current assets
Biological assets 30 94 72Inventory 15 655 649Trade receivables and other receivables 16 850 879Other short-term receivables 16 115 125Prepaid expenses and accrued income 16 176 160Derivative instruments 20 − 1Cash and cash equivalents 17 89 30Total current assets 1,978 1,915TOTAL ASSETS 5,527 5,153
MSEK Note Dec 31, 2018 Dec 31, 2017
EQUITY AND LIABILITIESShareholder’s equityShare capital 1 1Other contributed equity 857 975Reserves 134 70Retained earnings 612 409Capital and reserves attributable to owners 1,604 1,455Non-controlling interests 1 −Total equity 18 1,606 1,455
LiabilitiesNon-current liabilitiesNon-current interest-bearing liabilities 19, 20 1,990 1,849Derivative instruments 20 11 9Provisions for pensions 21 16 11Other non-current liabilities 22 10 12Deferred tax liabilities 10 169 172Other non-current provisions 20 218 319Total non-current liabilities 2,413 2,373
Current liabilities Current interest-bearing liabilities 19, 20 0 58Derivative instruments 20 1 −Trade payables 20, 23 901 716Tax payables 10 22 59Other current liabilities 20, 23 243 188Accrued expenses and prepaid income 20, 23 342 306Total current liabilities 1,509 1,326TOTAL EQUITY AND LIABILITIES 5,527 5,153
Pledged assets and contingent liabilities, see Note 28.
Scandi Standard Annual Report 2018
Financial statements
57
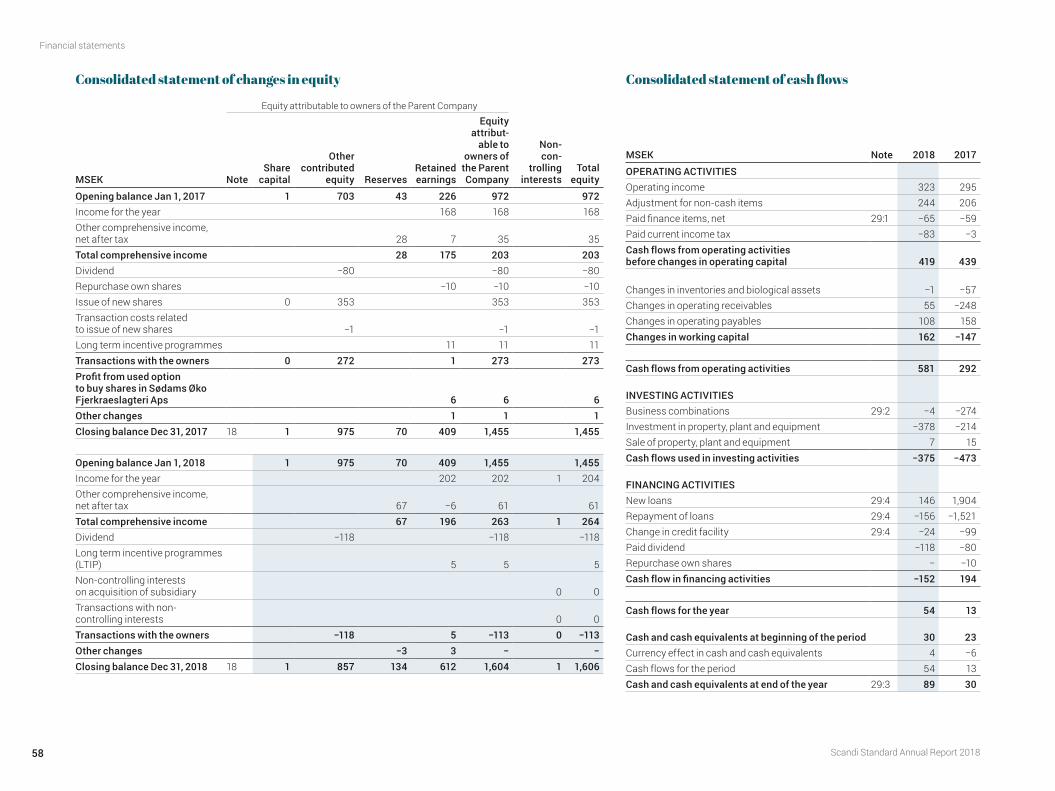
Consolidated statement of changes in equity
Equity attribut able to owners of the Parent Company
MSEK NoteShare
capital
Other con tributed
equity ReservesRetained earnings
Equity attribut-
able to owners of the Parent Company
Non- con-
trolling interests
Total equity
Opening balance Jan 1, 2017 1 703 43 226 972 972Income for the year 168 168 168Other comprehensive income, net after tax 28 7 35 35Total comprehensive income 28 175 203 203Dividend −80 −80 −80Repurchase own shares −10 −10 −10Issue of new shares 0 353 353 353Transaction costs related to issue of new shares −1 −1 −1Long term incentive programmes 11 11 11Transactions with the owners 0 272 1 273 273Profit from used option to buy shares in Sødams Øko Fjerkraeslagteri Aps 6 6 6Other changes 1 1 1Closing balance Dec 31, 2017 18 1 975 70 409 1,455 1,455
Opening balance Jan 1, 2018 1 975 70 409 1,455 1,455Income for the year 202 202 1 204Other comprehensive income, net after tax 67 −6 61 61Total comprehensive income 67 196 263 1 264Dividend −118 −118 −118Long term incentive programmes (LTIP) 5 5 5Non-controlling interests on acquisition of subsidiary 0 0Transactions with non- controlling interests 0 0Transactions with the owners −118 5 −113 0 −113Other changes −3 3 − −Closing balance Dec 31, 2018 18 1 857 134 612 1,604 1 1,606
Consolidated statement of cash flows
MSEK Note 2018 2017
OPERATING ACTIVITIES Operating income 323 295Adjustment for non-cash items 244 206Paid finance items, net 29:1 −65 −59Paid current income tax −83 −3Cash flows from operating activities before changes in operating capital 419 439
Changes in inventories and biological assets −1 −57Changes in operating receivables 55 −248Changes in operating payables 108 158Changes in working capital 162 −147
Cash flows from operating activities 581 292
INVESTING ACTIVITIES Business combinations 29:2 −4 −274Investment in property, plant and equipment −378 −214Sale of property, plant and equipment 7 15Cash flows used in investing activities −375 −473
FINANCING ACTIVITIES New loans 29:4 146 1,904Repayment of loans 29:4 −156 −1,521Change in credit facility 29:4 −24 −99Paid dividend −118 −80Repurchase own shares − −10Cash flow in financing activities −152 194
Cash flows for the year 54 13
Cash and cash equivalents at beginning of the period 30 23Currency effect in cash and cash equivalents 4 −6Cash flows for the period 54 13Cash and cash equivalents at end of the year 29:3 89 30
Scandi Standard Annual Report 2018
Financial statements
58
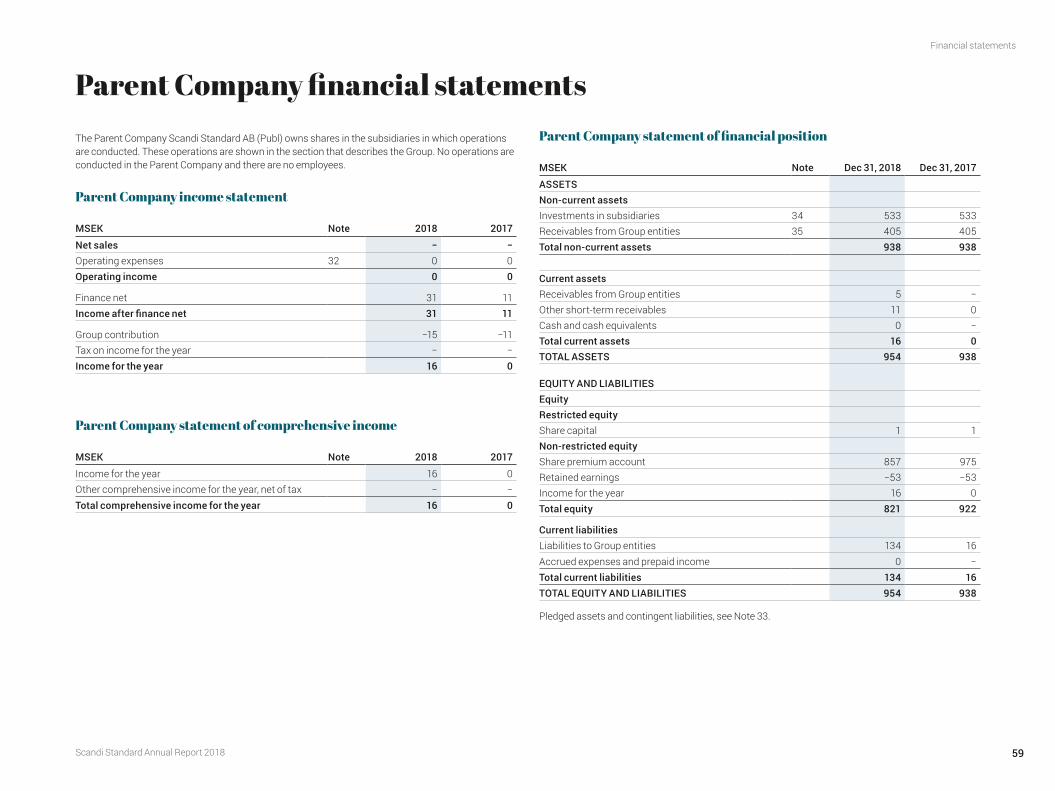
Parent Company financial statementsThe Parent Company Scandi Standard AB (Publ) owns shares in the subsidiaries in which operations are conducted. These operations are shown in the section that describes the Group. No operations are conducted in the Parent Company and there are no employees.
Parent Company income statement
MSEK Note 2018 2017
Net sales − −Operating expenses 32 0 0Operating income 0 0
Finance net 31 11Income after finance net 31 11
Group contribution −15 −11Tax on income for the year − −Income for the year 16 0
Parent Company statement of comprehensive income
MSEK Note 2018 2017
Income for the year 16 0Other comprehensive income for the year, net of tax − −Total comprehensive income for the year 16 0
Parent Company statement of financial position
MSEK Note Dec 31, 2018 Dec 31, 2017
ASSETSNon-current assets Investments in subsidiaries 34 533 533Receivables from Group entities 35 405 405Total non-current assets 938 938
Current assetsReceivables from Group entities 5 −Other short-term receivables 11 0Cash and cash equivalents 0 −Total current assets 16 0TOTAL ASSETS 954 938
EQUITY AND LIABILITIES Equity Restricted equity Share capital 1 1Non-restricted equity Share premium account 857 975Retained earnings −53 −53Income for the year 16 0Total equity 821 922
Current liabilities Liabilities to Group entities 134 16Accrued expenses and prepaid income 0 −Total current liabilities 134 16TOTAL EQUITY AND LIABILITIES 954 938
Pledged assets and contingent liabilities, see Note 33.
Scandi Standard Annual Report 2018
Financial statements
59
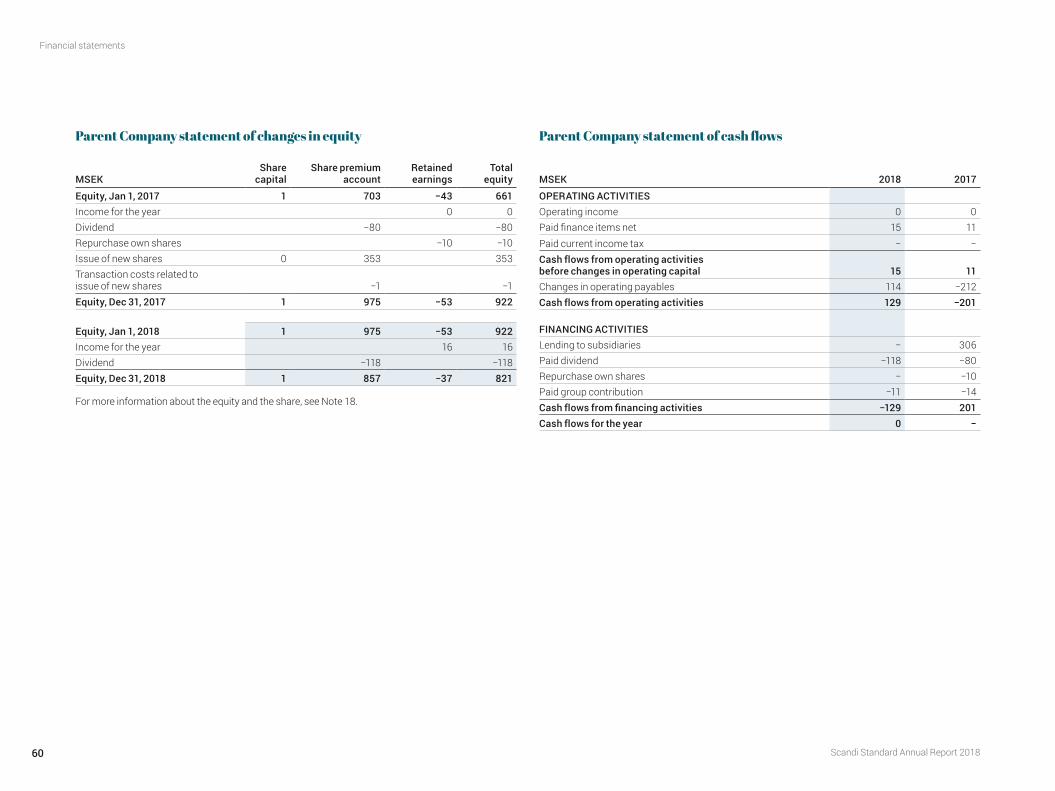
Parent Company statement of changes in equity
MSEKShare
capitalShare premium
account Retained earnings
Total equity
Equity, Jan 1, 2017 1 703 −43 661Income for the year 0 0Dividend −80 −80Repurchase own shares −10 −10Issue of new shares 0 353 353Transaction costs related to issue of new shares −1 −1Equity, Dec 31, 2017 1 975 −53 922
Equity, Jan 1, 2018 1 975 −53 922Income for the year 16 16Dividend −118 −118Equity, Dec 31, 2018 1 857 −37 821
For more information about the equity and the share, see Note 18.
Parent Company statement of cash flows
MSEK 2018 2017
OPERATING ACTIVITIES Operating income 0 0Paid finance items net 15 11Paid current income tax − −Cash flows from operating activities before changes in operating capital 15 11Changes in operating payables 114 −212Cash flows from operating activities 129 −201
FINANCING ACTIVITIES Lending to subsidiaries − 306Paid dividend −118 −80Repurchase own shares − −10Paid group contribution −11 −14Cash flows from financing activities −129 201Cash flows for the year 0 −
Scandi Standard Annual Report 2018
Financial statements
60
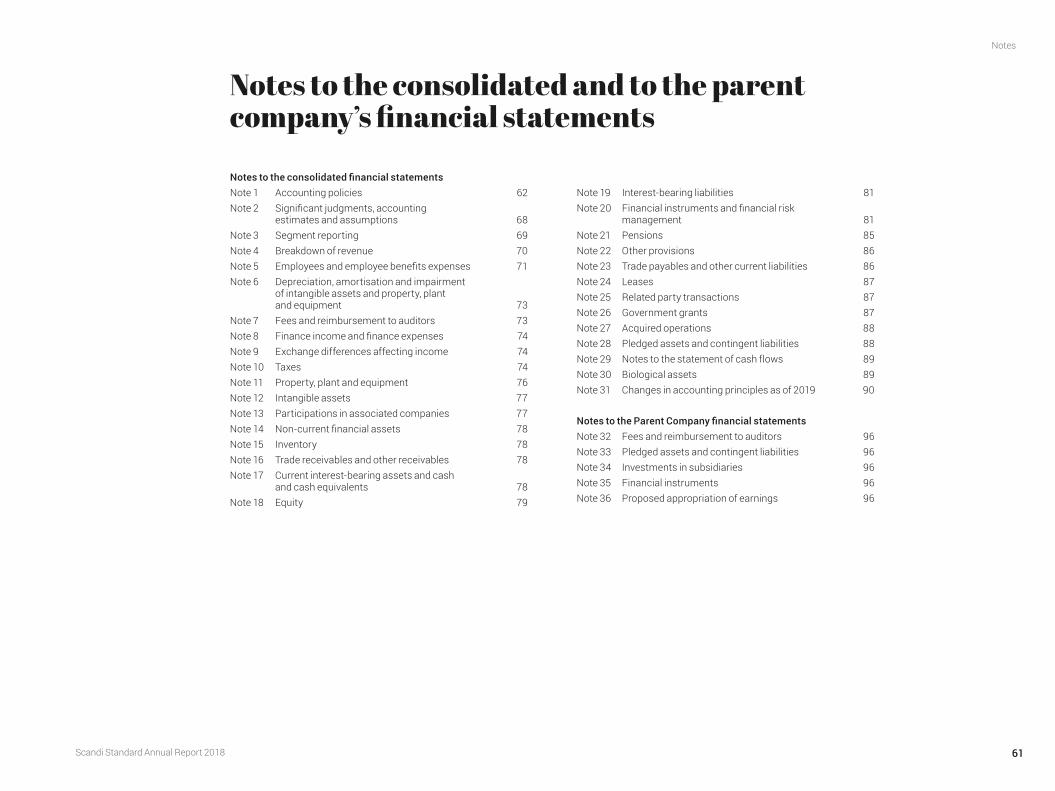
Notes to the consolidated financial statementsNote 1 Accounting policies 62Note 2 Significant judgments, accounting
estimates and assumptions
68Note 3 Segment reporting 69Note 4 Breakdown of revenue 70Note 5 Employees and employee benefits expenses 71Note 6 Depreciation, amortisation and impairment
of intangible assets and property, plant and equipment
73Note 7 Fees and reimbursement to auditors 73Note 8 Finance income and finance expenses 74Note 9 Exchange differences affecting income 74Note 10 Taxes 74Note 11 Property, plant and equipment 76Note 12 Intangible assets 77Note 13 Participations in associated companies 77Note 14 Non-current financial assets 78Note 15 Inventory 78Note 16 Trade receivables and other receivables 78Note 17 Current interest-bearing assets and cash
and cash equivalents
78Note 18 Equity 79
Note 19 Interest-bearing liabilities 81Note 20 Financial instruments and financial risk
management
81Note 21 Pensions 85Note 22 Other provisions 86Note 23 Trade payables and other current liabilities 86Note 24 Leases 87Note 25 Related party transactions 87Note 26 Government grants 87Note 27 Acquired operations 88Note 28 Pledged assets and contingent liabilities 88Note 29 Notes to the statement of cash flows 89Note 30 Biological assets 89Note 31 Changes in accounting principles as of 2019 90
Notes to the Parent Company financial statementsNote 32 Fees and reimbursement to auditors 96Note 33 Pledged assets and contingent liabilities 96Note 34 Investments in subsidiaries 96Note 35 Financial instruments 96Note 36 Proposed appropriation of earnings 96
Notes to the consolidated and to the parent company’s financial statements
Scandi Standard Annual Report 2018
Notes
61
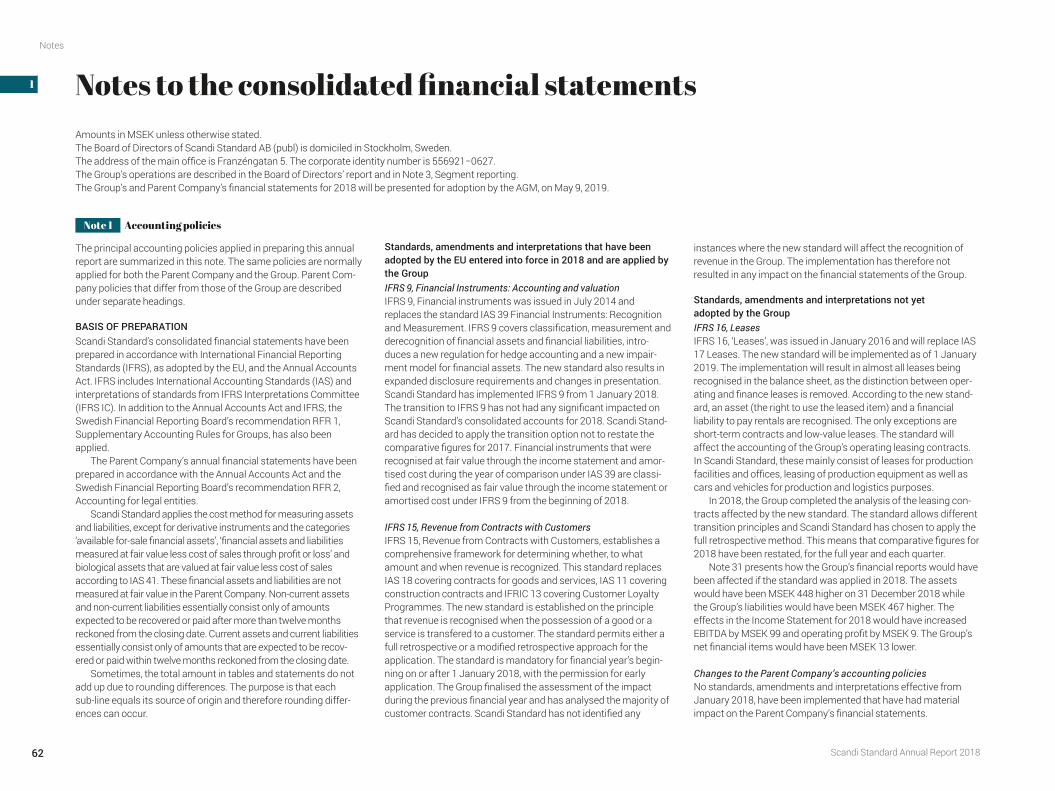
Notes to the consolidated financial statements
Note 1 Accounting policies
The principal accounting policies applied in preparing this annual report are summarized in this note. The same policies are normally applied for both the Parent Company and the Group. Parent Com-pany policies that differ from those of the Group are described under separate headings.
BASIS OF PREPARATION Scandi Standard’s consolidated financial statements have been prepared in accordance with International Financial Reporting Standards (IFRS), as adopted by the EU, and the Annual Accounts Act. IFRS includes International Accounting Standards (IAS) and interpretations of standards from IFRS Interpretations Committee (IFRS IC). In addition to the Annual Accounts Act and IFRS, the Swedish Financial Reporting Board’s recommendation RFR 1, Supplementary Accounting Rules for Groups, has also been applied.
The Parent Company’s annual financial statements have been prepared in accordance with the Annual Accounts Act and the Swedish Financial Reporting Board’s recommendation RFR 2, Accounting for legal entities.
Scandi Standard applies the cost method for measuring assets and liabilities, except for derivative instruments and the categories ‘available for-sale financial assets’, ‘financial assets and liabilities measured at fair value less cost of sales through profit or loss’ and biological assets that are valued at fair value less cost of sales according to IAS 41. These financial assets and liabilities are not measured at fair value in the Parent Company. Non-current assets and non-current liabilities essentially consist only of amounts expected to be recovered or paid after more than twelve months reckoned from the closing date. Current assets and current liabilities essentially consist only of amounts that are expected to be recov-ered or paid within twelve months reckoned from the closing date.
Sometimes, the total amount in tables and statements do not add up due to rounding differences. The purpose is that each sub-line equals its source of origin and therefore rounding differ-ences can occur.
Standards, amendments and interpretations that have been adopted by the EU entered into force in 2018 and are applied by the Group IFRS 9, Financial Instruments: Accounting and valuation IFRS 9, Financial instruments was issued in July 2014 and replaces the standard IAS 39 Financial Instruments: Recognition and Measurement. IFRS 9 covers classification, measurement and derecognition of financial assets and financial liabilities, intro-duces a new regulation for hedge accounting and a new impair-ment model for financial assets. The new standard also results in expanded disclosure requirements and changes in presentation. Scandi Standard has implemented IFRS 9 from 1 January 2018. The transition to IFRS 9 has not had any significant impacted on Scandi Standard’s consolidated accounts for 2018. Scandi Stand-ard has decided to apply the transition option not to restate the comparative figures for 2017. Financial instruments that were recognised at fair value through the income statement and amor-tised cost during the year of comparison under IAS 39 are classi-fied and recognised as fair value through the income statement or amortised cost under IFRS 9 from the beginning of 2018.
IFRS 15, Revenue from Contracts with Customers IFRS 15, Revenue from Contracts with Customers, establishes a comprehensive framework for determining whether, to what amount and when revenue is recognized. This standard replaces IAS 18 covering contracts for goods and services, IAS 11 covering construction contracts and IFRIC 13 covering Customer Loyalty Programmes. The new standard is established on the principle that revenue is recognised when the possession of a good or a service is transfered to a customer. The standard permits either a full retrospective or a modified retrospective approach for the application. The standard is mandatory for financial year’s begin-ning on or after 1 January 2018, with the permission for early application. The Group finalised the assessment of the impact during the previous financial year and has analysed the majority of customer contracts. Scandi Standard has not identified any
instances where the new standard will affect the recognition of revenue in the Group. The implementation has therefore not resulted in any impact on the financial statements of the Group.
Standards, amendments and interpretations not yet adopted by the Group IFRS 16, Leases IFRS 16, ‘Leases’, was issued in January 2016 and will replace IAS 17 Leases. The new standard will be implemented as of 1 January 2019. The implementation will result in almost all leases being recognised in the balance sheet, as the distinction between oper-ating and finance leases is removed. According to the new stand-ard, an asset (the right to use the leased item) and a financial liability to pay rentals are recognised. The only exceptions are short-term contracts and low-value leases. The standard will affect the accounting of the Group’s operating leasing contracts. In Scandi Standard, these mainly consist of leases for production facilities and offices, leasing of production equipment as well as cars and vehicles for production and logistics purposes.
In 2018, the Group completed the analysis of the leasing con-tracts affected by the new standard. The standard allows different transition principles and Scandi Standard has chosen to apply the full retrospective method. This means that comparative figures for 2018 have been restated, for the full year and each quarter.
Note 31 presents how the Group’s financial reports would have been affected if the standard was applied in 2018. The assets would have been MSEK 448 higher on 31 December 2018 while the Group’s liabilities would have been MSEK 467 higher. The effects in the Income Statement for 2018 would have increased EBITDA by MSEK 99 and operating profit by MSEK 9. The Group’s net financial items would have been MSEK 13 lower.
Changes to the Parent Company’s accounting policies No standards, amendments and interpretations effective from January 2018, have been implemented that have had material impact on the Parent Company’s financial statements.
Amounts in MSEK unless otherwise stated. The Board of Directors of Scandi Standard AB (publ) is domiciled in Stockholm, Sweden. The address of the main office is Franzéngatan 5. The corporate identity number is 556921−0627. The Group’s operations are described in the Board of Directors’ report and in Note 3, Segment reporting. The Group’s and Parent Company’s financial statements for 2018 will be presented for adoption by the AGM, on May 9, 2019.
Scandi Standard Annual Report 2018
Notes
62
1
2
3
4
5
6
7
8
9
10
11
12
13
14
15
16
17
18
19
20
21
22
23
24
25
26
27
28
29
30
31
32
33
34
35
ASSUMPTIONS AND ACCOUNTING ESTIMATES To ensure preparation of the financial statements in accordance with IFRS, assumptions and estimates must be made which affect reported assets and liabilities and income and expenses, as well as other information disclosed. The actual outcome may differ from these estimates and assumptions. The areas in which assumptions and accounting estimates have the greatest impact on carrying amounts are described in more detail in Note 2.
CONSOLIDATED FINANCIAL STATEMENTS The Group’s financial statements comprise the financial state-ments for the Parent Company and all Group entities in accordance with the definitions below.
Subsidiaries Subsidiaries are all entities over which the Company has control. The Group controls an entity when the Group is exposed to, or has the rights to, variable returns from its involvement with the entity and has the ability to affect those returns through its power over the entity. Subsidiaries are fully consolidated from the date on which control is transferred to the Group. They are deconsolidated from the date that control ceases.
The consolidated financial statements are prepared according to the purchase method. The cost of an investment in a subsidiary is the cash amount and the fair value of any non-cash considera-tion paid for the investment. The value of the acquired net asset, the equity in the Company, is determined by measuring acquired assets and liabilities and contingent liabilities at their fair value on the date of acquisition. Those fair values constitute the Group’s cost. If the cost of an investment in a subsidiary exceeds the fair value of the acquired Company’s identifiable net assets, the differ-ence is recognised as consolidated Goodwill.
Whether a minority’s share of Goodwill should be measured and included as an asset is determined for each acquisition. If the cost is less than the final fair value of the net assets the difference is recognised directly in the income statement. Acquisition-related costs are recognised in profit and loss as they arise.
All intra-Group transactions, including receivables and liabili-ties, income and expenses as well as unrealized earnings, are eliminated in their entirety.
Associates Associates are companies over which Scandi Standard has a significant, but not controlling, influence. This is normally the case when the Group holds between 20 and 50 percent of the voting rights.
Investments in associates are accounted for using the equity method of accounting and are initially recognised at cost.
Acquired assets and liabilities are measured in the same way as for subsidiaries and the carrying amount includes any Goodwill and other Group adjustments. The Group’s share of the associ-ate’s income after tax arising after the acquisition, adjusted for any depreciation/reversals of the consolidated value, is reported on a separate line in the income statement and is included in operating income. The share of income is calculated on the basis of Scandi Standard’s share of equity in the associate. The equity method means that the consolidated carrying amount of investments in associates corresponds to the Group’s share of the equity of associates plus the residual value of fair value adjustments.
Unrealized gains and losses that do not involve an impairment loss are eliminated in proportion to the Group’s investment in the associate.
The Group does not have any joint arrangements reported according to IFRS 11.
Translation of foreign Group entities Statements of financial position and income statements for all Group entities whose functional currency is not the presentation currency are translated into the Group’s presentation currency using the following procedures:• Assets and liabilities are translated at the closing rate on each
reporting date reported in the statement of financial position.• Revenues and expenses are translated at the average rate for
each year reported in the income statement and statement of comprehensive income.
• All translation differences that arise are recognised as a separate item under other comprehensive income in the statement of comprehensive income.
In cases where net investments in foreign operations are hedged with financial instruments the foreign exchange differences aris-ing on translation of these instruments are also recognised in the statement of comprehensive income. When a foreign operation is disposed of, the cumulative translation differences and exchange differences for any financial instruments held for hedging the net investment in the Company are recognised as part of the gain or loss on disposal.
Goodwill and fair value adjustments arising on the acquisition of a foreign entity are treated as assets and liabilities of the foreign entity and are translated according to the same principles as the entity.
Parent companyThe Parent Company recognises all investments in Group entities at cost, adjusted where applicable by accumulated impairment losses.
FOREIGN CURRENCY TRANSACTIONS AND BALANCE SHEET ITEMS The various entities within the Group present their reports in the currency of the primary economic environment in which they operate (the functional currency).
The consolidated financial statements are prepared in Swedish kronor (SEK), which is the Parent Company’s functional and pres-entation currency.
Foreign currency transactions are translated into the func-tional currency using the exchange rates prevailing at the transac-tion date.
Foreign currency receivables and liabilities are remeasured at closing date rates at the end of each reporting period. Exchange differences arising on such remeasurement, and upon payment of the transaction, are recognised in the income statement. However, exchange differences arising on remeasurement of items that are hedging transactions, and that qualify for hedge accounting, are recognised in other comprehensive income. Gains and losses on operating receivables and liabilities are netted and reported within operating income. Gains and losses on borrowings and financial investments are reported as financial items.
Exchange differences on receivables which represent an extended investment in subsidiaries are recognised in other com-prehensive income in the same way as translation differences relating to investments in foreign subsidiaries.
SEGMENT REPORTING Reported operating segments are consistent with the internal reporting submitted to the chief operating decision maker, who is the person that allocates resources and evaluates the results of the operating segments. At Scandi Standard, this role is assumed by the Managing Director & CEO, who, on behalf of the Board, takes charge of day-to-day management and governance.
The business segments are consistent with the Group’s opera-tional structure in which activities are divided into Regions. The Regions, which are based on geographical areas, are Denmark, Norway, Sweden, Ireland and Finland. Activities not included in a Region and corporate functions are reported as Group-wide. A further description of the operating segments is provided in Note 3.
The Regions are responsible for their operating income and the assets and liabilities used in their own operations, the operating capital. Financial items and taxes do not fall within the Regions’ responsibility; these are reported centrally for the Group. The same accounting policies are used for the Regions as for the Group, apart from financial instruments (IFRS 9 only at Group level).
Transactions between Regions and other operations are car-ried out on commercial terms.
Note 1 Accounting policies cont.
Scandi Standard Annual Report 2018
Notes
63
1
2
3
4
5
6
7
8
9
10
11
12
13
14
15
16
17
18
19
20
21
22
23
24
25
26
27
28
29
30
31
32
33
34
35
PROPERTY, PLANT AND EQUIPMENT Items of property, plant and equipment are recognised at cost less accumulated depreciation and any accumulated impairment. Cost includes expenditure that can be directly attributed to the acquisi-tion of the asset, including the effect of cash flow hedges relating to investment purchases in foreign currencies. Start-up and pre-production costs that are necessary for bringing the asset to its predetermined condition are included in the cost. For major investments, where the total investment value is at least MSEK 100 and the investment period lasts at least 12 months, interest during construction is included in the cost of the asset.
Subsequent expenditure on property, plant and equipment increases the cost only if it is probable that the Group will have future economic benefit from the subsequent expenditure. All other subsequent expenditure is recognised as an expense in the period in which it is incurred.
Depreciation policies for property, plant and equipment Land is assumed to have an indefinite useful life and is therefore not depreciated. Depreciation of other property, plant and equip-ment is based on cost less estimated residual value. Depreciation is straight-line over the asset’s estimated useful life. Each compo-nent of a larger item of property, plant and equipment with a cost that is significant in relation to the asset’s total cost and with a useful life significantly different from the rest of the asset, is depreciated separately.
The assets’ residual values and useful life are tested at least annually and adjusted as necessary. The following depreciation schedules are applied: Buildings 25−30 years Property fixtures 10−25 years Plant and machinery 5−20 years Equipment, tools 5−15 years Vehicles 5−10 years Office equipment 5−10 years
An analysis of the depreciation rates for the Group has been performed during the year to align the estimated useful life of a number of the Group’s fixed assets. The effect is that the useful life of a number of assets have been prolonged. The adjusted operat-ing profit 2018 was positively impacted by lower depreciation and amounted to approximately MSEK 28.
INTANGIBLE ASSETS An intangible asset is recognised when the asset is identifiable, the Group controls the asset, and it is expected to yield future eco-nomic benefits. Intangible assets such as Goodwill, trademarks and customer and supplier relationships are identified and meas-ured normally in connection with business combinations. Expendi-tures on internally generated trademarks, customer relationships and internally generated Goodwill are recognised in the income statement as an expense when they are incurred.
Goodwill Goodwill is the amount by which the cost of acquisition exceeds the fair value of the net assets acquired by the Group in a business combination. The value of the Goodwill is allocated to the operat-ing segment’s cash generating units which are expected to benefit from the acquisition that gave rise to the goodwill item. Goodwill is carried at cost less accumulated impairment losses and is tested annually for impairment. Goodwill impairment is not reversed.
Goodwill arising on acquisition of associates is included in the carrying amount of the associate and is tested for impair-ment as part of the value of the total investment in the associate.
Net gains or losses on the disposal of Group entities include the remaining carrying amount of the Goodwill attributable to the divested entity.
Trademarks The value of trademarks is carried at cost less any accumulated amortisation and impairment losses. Trademarks with an indefi-nite useful life are not amortised but are tested annually for impair-ment in the same way as Goodwill. Consumer trademarks that Scandi Standard intends to continue using for the foreseeable future and that have a cost of at least MSEK 10 are classified as trademarks with an indefinite useful life.
The relief from royalty method is used to measure trademarks identified in a business combination.
As trademarks in segments Sweden, Denmark and Norway have indefinite useful life, no estimated useful life have been defined. Trademarks in segment Ireland has an estimated useful life of 20 years.
Customer and supplier relationshipsIntangible assets in the form of customer and supplier relation-ships are identified in connection with business combinations. The value of customer relationships is calculated using the multi-pe-riod excess earning method, together with any other relevant information, and is carried at cost less accumulated amortisation and impairment losses.
At present, existing customer relationships are considered to have a useful life of 8, 10 or 20 years and existing supplier relationships a useful life of 5 or 10 years.
Research and development No research is conducted within the Group. Expenditure on devel-opment is recognised as an intangible asset only if it is technically and financially feasible to complete the asset, it is expected to provide future economic benefits, the cost of the asset can be measured reliably, and the development is substantial. Currently, this means that all expenditure on the development of commercial products and similar products is expensed as incurred. Expendi-ture on development of business-related IS/IT-systems is capital-ized if the general preconditions according to the above are met and the total expenditure is estimated to exceed MSEK 3.
Capitalized expenditure is amortised on a straight-line basis over the estimated useful life of 5 to 10 years.
IMPAIRMENT LOSSESIntangible assets with an indefinite useful life are not amortised but are tested for impairment annually or more frequently if there is an indication of impairment. The carrying amounts of assets that are amortised are regularly tested. At the end of each reporting period, an assessment is made as to whether there is any indication that the assets are impaired and need to be written down. The recovera-ble amount is estimated for these assets and for assets with indefi-nite useful life. The recoverable amount is the higher of an asset’s fair value less costs to sell and its value in use. An impairment loss is recognised if the recoverable amount is less than the carrying amount. A previously recognised impairment loss is reversed if the reasons for the earlier impairment no longer exist. However, an impairment loss is reversed only to the extent that it does not increase the carrying amount of an asset above the amount that would have been determined had no impairment loss been recog-nised in prior years. Impairment of Goodwill is never reversed.
For an asset that depends on other assets generating cash flows, the value in use of the smallest cash-generating unit to which the asset belongs is estimated. Goodwill is always allocated to the cash-generating units that benefit from the acquisition that generated the Goodwill.
An asset’s value in use is the present value of the estimated future cash flows that are expected from using the asset and its estimated residual value at the end of its useful life. When calculat-ing the value in use, future cash flows are discounted at an interest rate before tax that takes into account a market assessment of risk-free interest rates and risk involved with the specific asset.
Note 1 Accounting policies cont.
Scandi Standard Annual Report 2018
Notes
64
1
2
3
4
5
6
7
8
9
10
11
12
13
14
15
16
17
18
19
20
21
22
23
24
25
26
27
28
29
30
31
32
33
34
35
INVENTORIESInventories are measured at the lower of cost and net realizable value at the reporting date. The cost is estimated by applying the FIFO (first in/ first out) method or weighted average prices. The cost of self-produced goods includes raw materials, direct wages, other direct costs and production-related overhead costs, based on normal production capacity. Borrowing costs are not included in the measurement of inventories. Net realizable value is the estimated selling price in operating activities less the estimated costs to complete and sell the product.
FINANCIAL ASSETS AND LIABILITIES Financial instruments Financial assets and liabilities recognised in the statement of financial position include cash and cash equivalents, trade receiva-bles, shares, loan receivables, other interest-bearing instruments, trade payables, borrowings and Derivative instruments. Derivative instruments are recognised in the statement of financial position when the agreements are made. Other financial assets and finan-cial liabilities are recognised in the statement of financial position on the settlement date. A financial asset or part of the asset is derecognised on the settlement date or when it expires. A financial liability or part of a financial liability is derecognised on the settle-ment date or when it is extinguished in another manner.
From 1 January 2018, the Group classifies its financial assets in the following categories; fair value through profit or loss, fair value through comprehensive income or amortized costs. Assets held for the purpose of collecting contractual cash flows and where these cash flow constitute principal amounts and interests, and have not been identified as valued at fair value, are valued at amortized cost. The booked value of these assets is adjusted with expected loan losses. Interest income from these financial assets is reported using the effective interest method and is included in financial income. Financial assets held both for the purpose of collecting contractual cash flows and for sale, and where the assets’ cash flows constitute only capital amounts and interest, and have not been identified as valued at fair value, are valued at fair value through other comprehensive income. Interest income, write-downs and exchange rate differences are reported at fair value through other comprehensive income, while the other fair value changes are recognized in other comprehensive income. Assets that do not meet the requirements for amortized cost or fair value through other comprehensive income are measured at fair value through income statement. Financial liabilities are nor-mally reported as amortised cost. Additional purchase price in connection with the acquisition of business and to be settled in cash is reported at fair value through the income statement.
The Group assesses the future expected loan losses related to
assets reported at amortized cost and assets reported at fair value through other comprehensive income. The Group reports a credit reserve for such expected losses at each reporting date. For accounts receivable, the Group applies the simplified approach for credit reserve i.e. the reserve will correspond to the expected loss over the entire life of the claim. To estimate the expected loan losses, accounts receivable have been grouped based on credit properties and the number of days in relation to maturity. The Group also uses forward-looking variables to assess the expected loan losses. Claims that are not accounts receivable are divided into three groups. For the first group, expected credit risk is assessed based on the risk of default within the next 12 months. If an assessment is made that the credit risk for a receivable has increased significantly since the first accounting date, the receiva-ble is transferred to group two, where the assessment of the expected credit risk is based on the risk of default during the entire remaining term of the receivable. If a claim is deemed to have failed, it is moved to group three, where an assessment is made of the expected recoverable amount.
The transition to IFRS 9 from IAS 39 has not had any effect on Scandi Standard regarding hedge accounting. Scandi Standard has updated the hedge documentation according IFRS 9. Hedges that qualify for hedge accounting shall be deemed to be reasonably effective during the remaining term of the hedge. Sources of ineffi-ceny must be identified. The hedged item and hedging instrument must have a clear financial relationship, the hedging ratio must be in accordance with the company’s hedging strategy and credit risk must not be the dominant cause of the hedging instrument’s change in value.
Derivative instruments and hedge accounting holdings of financial derivative instruments comprise interest rate swaps and currency forward contracts. Forward exchange agree-ments are made in order to limit the effect on Scandi Standards’ profit and loss and financial position, due to short-term changes in the foreign exchange rates. Interest rate swaps are agreed in order to prolong the interest period for the liabilities and decrease the uncertainty of future interest expenses.
Derivative instruments are carried at fair value and the result of the remeasurement affects the income statement when the deriv-ative does not qualify for hedge accounting. Hedge accounting may be applied if certain criteria are met with regard to documen-tation of the hedge relationship and the hedge effectiveness and then the effective part of the remeasurement instead affects other comprehensive income.
Financial instruments that are hedging instruments hedge either an asset or a liability, a net investment in foreign operations or are a hedge of an actual or forecast transaction.
There are three different hedging relationships: cash flow hedges, hedging of net investments and fair value hedges. Scandi Standard currently only applies cash flow hedging and hedging of net investments.
Cash flow hedges A cash flow hedge is a hedge held to reduce the risk of an impact on profit or loss from changes in cash flow relating to a highly probable forecast future transaction or in transactions associated with an asset or liability. In cash flow hedge accounting, the change in the derivative instrument’s fair value is recognised in other comprehensive income and accumulated in equity, while any ineffective portion is recognised in profit or loss. When the hedged position is recognised in profit or loss, the result of the revaluation of the derivative instrument is also transferred to profit or loss.
Cash flow hedging is applied for currency risks in commercial flows and for interest rate risks in the debt portfolio.
Hedging of net investments Hedging of net investments refers to hedges held to reduce the effect of changes in the value of a net investment in a foreign oper-ation owing to a change in foreign exchange rates. Foreign cur-rency gains or losses arising from remeasurement of the fair value of the instruments used for these hedges are recognised in other comprehensive income and accumulated in equity. The result is reclassified from equity to profit or loss upon disposal of the foreign operation. Net investments are currently hedged by borrowing in the subsidiaries currencies.
Parent In the Parent Company, financial instruments are accounted for using the cost method. The parent company applies the rules in RFR2 and thus not IFRS 9. As the interest-bearing assets and liabilities of the Parent Company are consistent in all material respects with those of the Group, no special disclosures are pro-vided for the Parent Company.
Determination of fair value The fair value of forward exchange contracts is estimated based on current forward rates at the reporting date, while interest rate swaps are valued using estimates of future discounted cash flows. Market rates and current credit margins form the basis for determining the fair value of long-term borrowings.
For financial assets and liabilities with short maturities, the fair value is estimated at cost adjusted for any impairment. If the fair value of equity instruments cannot be determined, they are reported at cost adjusted for any impairment.
Note 1 Accounting policies cont.
Scandi Standard Annual Report 2018
Notes
65
1
2
3
4
5
6
7
8
9
10
11
12
13
14
15
16
17
18
19
20
21
22
23
24
25
26
27
28
29
30
31
32
33
34
35
PROVISIONS Provisions are recognised when Scandi Standard has a present obligation (legal or constructive) as a result of a past event, and it is probable that an outflow of resources will be required to settle the obligation. The amount of the provision recognised is the best estimate of the expenditure required to settle the obligation at the reporting date. For long-term material amounts, provisions are measured at the present value of the expenditure required to settle the obligation, taking into account the time value of money. Provi-sions for restructuring measures are made when a detailed, formal plan for measures is in place and well-founded expectations have been created for those who will be affected by the measures. No provisions are made for future operating losses.
EMPLOYEE BENEFITS Pensions Scandi Standard has both defined contribution and defined benefit pension plans, most of which are funded.
With defined contribution plans, the Company pays fixed con-tributions to a separate legal entity and has no obligation to pay further contributions thereafter. The costs for these plans are charged to consolidated profit as the benefits are earned.
Defined benefit pension plans define an amount of pension benefit that an employee will receive on retirement, based on factors such as salary, years of service and age. The Group’s companies bear the risk associated with paying out promised benefits. Plan assets in funded plans can only be used to pay benefits under the pension agreement.
The liability recognised in the statement of financial position consists of the net of the estimated present value of the defined benefit obligation and the fair value of the plan assets associated with the obligation at the reporting date, either in a pension fund or in some other arrangement.
Pension costs and pension obligations for defined benefit plans are calculated according to the projected unit credit method (PUC). This method allocates the costs for pensions as the employees carry out services for the Company that increase their entitlement to future benefits. The Company’s obligation is calcu-lated annually by independent actuaries. The obligation comprises the present value of the expected future payments. The discount rate that is used corresponds to the interest rate for high-quality corporate bonds or treasury bonds with a maturity that corre-sponds to the average term for the obligations and the currency. An interest rate equivalent to the interest rates of high-quality mortgage bonds is used for Swedish plans, which represent the vast majority of the defined benefit plans. These bonds are consid-ered equivalent to corporate bonds as they have a sufficiently deep market to be used as the basis for the discount rate.
Actuarial gains and losses may arise in determining the present value of the defined benefit obligation and fair value of plan assets. These arise either when the actual outcome diverges from the previously calculated assumption or the actuarial assumption changes. These actuarial gains and losses are recognised in Other comprehensive income.
A special payroll tax is calculated on the difference between the pension obligation determined according to IAS 19 and the pension obligation determined according to the rules applied in the legal entity. The calculated future payroll tax is included in the recognised pension liability. The present value of the provision is not calculated. The change in the provision is recognised in other comprehensive income to the extent that it relates to actuarial gains or losses.
Termination benefits A provision for costs in connection with termination of personnel is recognised only if the Company is obligated to end employment before the normal retirement date or when benefits are provided as an incentive to encourage voluntary termination. Estimated termination benefits are recognised as a provision when a detailed plan for the measure is presented.
Long-term incentive programsScandi Standard have annual long term incentive programs (“LTIPs”) for key employees, which are intended to contribute to the Company and the Group’s long-term value growth and increase shared interest in value growth between the employee and the company’s shareholders.
The LTIPs are equity-settled, share based and implies that performance rights shall be allotted free of charge to the partici-pants in relation to a fixed percentage of their fixed salary.
The compensation plans are accounted for in accordance with IFRS 2, Share base payments. The accounting costs that will arise in accordance with IFRS 2 are determined in connection with allotment date and are allocated over the vesting period (3 years).
At the end of each reporting period, the Company considers changes in anticipated number of vested shares. Social charges related to the program are recognised as a cash- settled instrument.
Hedging of commitments according to LTIPsNo new shares will be issued due to LTIPs and in order to ensure the delivery of shares and for the purpose of hedging social secu-rity charges under LTIPs, the Company acquire own shares.
The repurchased shares reduce the Group’s equity and are considered in the calculations of earnings per share (“EPS”).
Variable salary Provisions for variable salary are expensed on an ongoing basis in accordance with the economic substance of current agreements.
INCOME TAXThe Group’s tax expense consists of current tax and deferred tax. Taxes are recognised in the income statement, except when the underlying transaction is recognised in other comprehensive income (OCI), in which case the related tax effect is also recog-nised in OCI. Current tax is the tax payable or receivable for the current year. Current tax also includes adjustments to current tax attributable to prior periods.
Deferred tax is recognised using the balance sheet liability method on all temporary differences arising between the tax base of assets and liabilities and their carrying amount. Deferred tax is measured at the nominal amount and is calculated by applying the tax rates and regulations that have been enacted or substantively enacted by the reporting date. Deferred taxes relating to tempo-rary differences attributable to investments in subsidiaries and associates are not recognised, as, in each case, Scandi Standard is able to control the date for their reversal and it is not considered probable that any such reversal will occur in the near future.
Deferred tax assets relating to deductible temporary differ-ences and loss carryforwards are recognised only to the extent that it is considered probable that these will result in lower tax payments in the future.
Deferred tax assets and deferred tax liabilities are offset when they are attributable to the same tax authority and the companies in question have a legally enforceable right to offset current tax assets against current taxation liabilities.
REVENUE Net salesRevenue from the sale of goods for the main businesses that comprise the sale of products is reported when the buyer receives control over a product. Control is obtained when the buyer can control the use of the asset and receive all future benefit from it. Every promise to transfer an asset to a customer distinct from other commitments in a contract constitutes a performance commitment. Each distinct performance commitment is reported separately. A commitment is fulfilled when the customer receives control of the asset. The Group assess that this point in time mainly occurs upon delivery to the customer in accordance with current delivery terms in contracts entered into. Revenue is reported at transaction price, which is the compensation the Group expects to receive in exchange for the transfer of goods and services. When determining the transaction price, any discounts, but also any commitments regarding goods that the customer
Note 1 Accounting policies cont.
Scandi Standard Annual Report 2018
Notes
66
1
2
3
4
5
6
7
8
9
10
11
12
13
14
15
16
17
18
19
20
21
22
23
24
25
26
27
28
29
30
31
32
33
34
35

fails to sell further, are taken into account. The transaction price is not adjusted for the customer’s credit risk, but a possible write-down of a remuneration is made according to IFRS 9 and the credit loss is recognized as an impairment loss in the income statement. Payment is made on the basis of agreed payment terms in contracts entered into, which normally takes place at a time that occurs after delivery has taken place. There are no financing solutions within the Group.
Net sales include invoiced sales for main activities. Most of the Group’s revenue comes from the sale of manufactured goods. Revenue is reported excluding VAT because the Group does not collect the tax on its own account but acts as agent for the state.
Other operating revenue As other operating revenue, income from activities outside the company’s main business is reported. They mainly consist of rental income, insurance payments and profit on sales of tangible fixed assets. Other operating revenue includes foreign exchange gains on operating receivables and liabilities, which arise on translation at the closing day rate and profit on derivatives that are not hedged. In addition, other income and profits are reported from activities outside the company’s main business.
LEASING The Group substantially acts only as a lessee. However, as of late 2018, it sub-leases a property, that is no longer being used, under the same conditions as in the base contract. Leases are classified in the consolidated financial statements as finance leases or operating leases. A finance lease is a lease that transfers substan-tially all the financial risks and rewards incident to ownership. An operating lease is a lease other than a finance lease.
The lessee recognises a finance lease as a non-current asset and a corresponding interest-bearing liability in the statement of financial position at an amount equal to the value of the leased asset. The depreciation policy for leased assets is consistent with that for depreciable assets that are owned. The lease payments are apportioned between interest and amortisation of the initially recognised liability.
The lessee does not recognise an operating lease as asset in the statement of financial position. The total lease payments are recognised as an expense on a straight-line basis over the lease term.
GOVERNMENT GRANTS Government grants are recognised in the statement of financial position and the income statement when there is reasonable assurance that the Group will comply with any conditions
attached to the grant and the grant will be received. Grants are recognised in profit or loss on a systematic basis over the periods in which the Group recognises expenses for the related costs for which the grants are intended to compensate If the government grant or assistance is neither related to the acquisition of assets nor to compensation of costs, it is recognised as other income.
BORROWING COSTS Borrowing costs attributable to investments in assets that take at least 12 months to complete, and for which the investment amount is at least MSEK 100, are capitalized as part of the invest-ment amount. Other borrowing costs are expensed in the period in which they are incurred.
BIOLOGICAL ASSETS Biological assets are measured and carried at fair value less cost of sales in accordance with IAS 41. Scandi Standard has biological assets in the form of broiler parent stock within the operations of rearing day-old chicks in Sweden as well as broilers kept at some contract broiler producers in Denmark and Ireland. The lifespan of the parent stock is approximately one year, and the lifespan of the broilers is about 30 days. The assets of broiler parent stock is valued at fair value less cost of sales.
The stock has been valued using cash flow projections from expected sales of day-old chicks and the direct and indirect costs of keeping the stock. For costs, estimates have been made based on past experience. There is an observable market price for the day-old chicks and for number of chicks produced, the breeder norms for the variety kept have been used.
NON-CURRENT ASSETS HELD FOR SALE AND DISCONTINUED OPERATIONS Scandi Standard only reclassifies assets as held for sale if their value is substantial. The current threshold is MSEK 5.
GROUP CONTRIBUTIONS AND SHAREHOLDER CONTRIBUTIONS Parent CompanyThe Swedish Financial Reporting Board has introduced rules for reporting Group contributions in its recommendation RFR 2 Accounting for legal Entities. Scandi Standard is applying the alter-native rule, which means that both Group contributions received, and Group contributions made are reported as an appropriation.
The issuer capitalizes the shareholder contribution in shares and interests to the extent that impairment is not required. The recipient recognises the shareholder contribution directly in equity.
RELATED PARTIES By virtue of its control, the Parent Company has a related party relationship with its subsidiaries and sub-subsidiaries. By virtue of their significant influence, the Group and Parent Company have a related party relationship with their associates, which include directly and indirectly owned companies.
“Lantmännens Gemensamma Pensionsstiftelse Grodden” is a post-employment benefit plan for employees of certain companies in the Group as such, the fund is considered to be a related party.
Intra-Group purchases and sales of goods and services are conducted at market prices. By virtue of their right to participate in the decisions concerning the Group’s strategies, members of the Group’s Opera-tional Board have significant influence over the Parent Company and Group and are therefore considered to be related parties.
The Group’s main currencies in addition to SEK, 2018
SEK Average rate Closing rate
DKK 1.38 1.38NOK 1.07 1.02EUR 10.26 10.28
Note 1 Accounting policies cont.
Scandi Standard Annual Report 2018
Notes
67
1
2
3
4
5
6
7
8
9
10
11
12
13
14
15
16
17
18
19
20
21
22
23
24
25
26
27
28
29
30
31
32
33
34
35

Note 2 Significant judgments, accounting estimates and assumptions
Preparation of annual financial statements in accordance with IFRS in many cases requires management to make judgments and use of accounting estimates and assumptions in determining the carrying amounts of assets and liabilities. These estimates are based on historical experience and assumptions that are consid-ered reasonable and realistic in the current circumstances. The actual outcome may differ from the accounting estimates and assumptions.
The estimates and underlying assumptions are regularly reviewed. The effect of a change in an accounting estimate is recognised in the period of the change, if the change affects that period only, or in the period of the change and future periods, if the change affects both.
A general description of the accounting policies where man-agement’s accounting estimates and assumptions are expected to have a material effect on Scandi Standard Group’s financial position and financial statements are provided below. The carrying amounts at the reporting date can be found in the statement of financial position and associated notes.
Impairment of Goodwill and other assets Goodwill and other intangible assets with indefinite useful life are tested for impairment annually or whenever there are indications of possible impairment – in situations such as a changed busi-ness environment, a divestment decision or closure of operations. The Group’s Goodwill and other intangible assets amounted to MSEK 1,917 (1,913) at the end of the year, which corresponds to 35 (37) percent of the Group’s total assets. Other assets are tested for impairment as soon as there is an indication that an asset’s recoverable amount is lower than its carrying amount.
In most cases, an asset’s value in use is estimated by reference to the present value of the future cash flows the Group expects to derive from the asset. The cash flow projection is based on assumptions that represent management’s best estimate of the economic conditions that will exist over the remaining useful life of the asset and are based on the latest financial plan. An impairment loss is recognised if the estimated value in use is lower than the carrying amount.
The discount rates used to calculate the present value of the expected future cash flows are estimated from the current weighted average cost of capital (WACC) established within the Group for the markets in which the cash-generating units are active.
Other estimates regarding expected future results and the discount rates used can give different values of assets from those applied. Impairment is described in more detail in Note 6.
Contingent consideration agreed in connection with the acquisition of Carton Bros ULC in Ireland is recognized as a liabil-ity. The liability is determined based on the most probable out-come of the consideration and is assessed at the end of each reporting period. Changes in the reported value is recognised in the profit and loss.
Deferred tax assets and tax liabilities Assessments are made to determine deferred tax assets and tax liabilities. Deferred tax assets are recognised as an asset when it is considered likely that they can be utilized and offset against future taxable profits. Other assumptions regarding the outcome of these future taxable profits, as well as changes in tax rates and rules can result in significant differences in the measurement of deferred taxes.
More detailed information about the amounts can be found in Note 10.
Pensions The value of pension obligations for defined benefit pension plans is determined by using actuarial calculations based on assump-tions about discount rates, future salary increases, inflation and demographics. The discount rate, which is the most critical assumption, is based on the market return on high-quality corpo-rate bonds, namely mortgage bonds with long maturities. The rate is extrapolated to correspond to the pension plan’s obligations. A lower discount rate increases the present value of the pension obligation and pension cost, while a higher discount rate has the reverse effect. A reduction of the discount rate by 0.25 percentage points would increase the pension obligation by MSEK 7 (6) while an increase would reduce the obligation by MSEK 6 (6).
More detailed information about the amounts can be found in Note 21.
Biological assetsThe Group has biological assets in the form of broiler parent stock in the rearing of day-old chicks in Sweden as well as broilers kept at some contract broiler producers in Denmark and Ireland. These assets are valued at fair value less cost of sales according to IAS 41. The value of those assets is dependent on assumptions. For broiler parent stock, the market price for day-old chicks as well as operational expenses for keeping the stock impacts the value of the assets. A 1 percent change in the price of day-old chicks impacts the value of the assets by about MSEK 1 (2).
Detailed information about the amounts and changes can be found in Note 30.
Scandi Standard Annual Report 2018
Notes
68
1
2
3
4
5
6
7
8
9
10
11
12
13
14
15
16
17
18
19
20
21
22
23
24
25
26
27
28
29
30
31
32
33
34
35
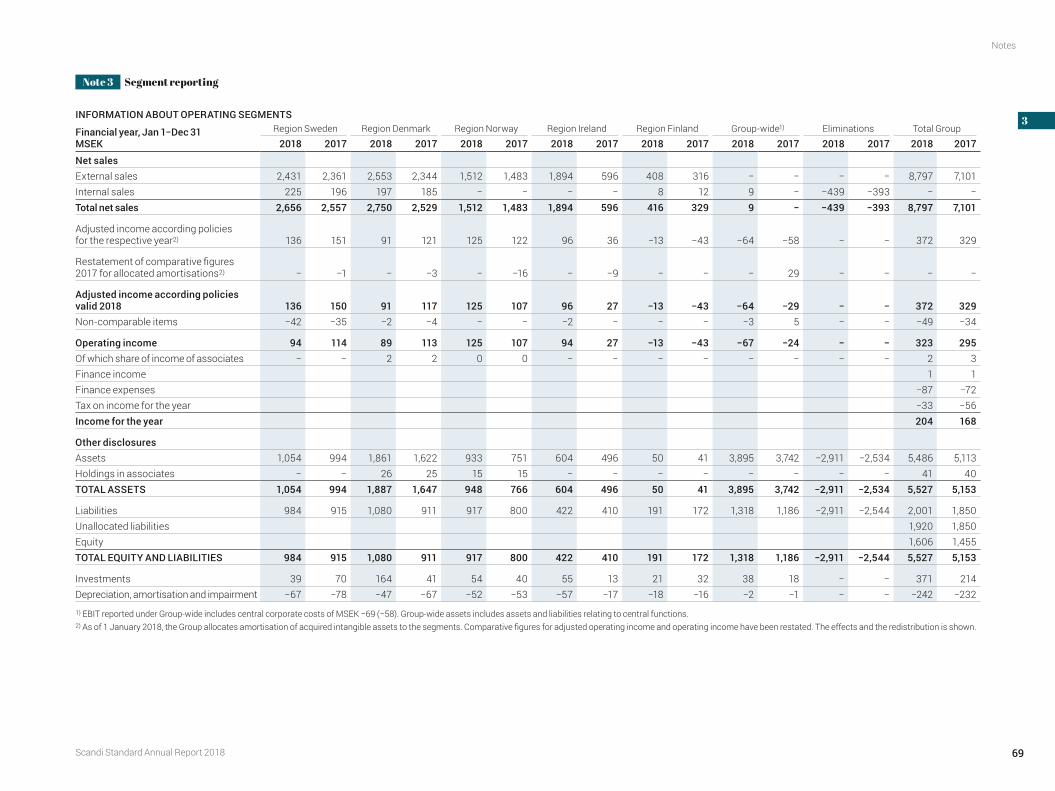
Note 3 Segment reporting
INFORMATION ABOUT OPERATING SEGMENTS
Financial year, Jan 1−Dec 31 MSEK
Region Sweden Region Denmark Region Norway Region Ireland Region Finland Group-wide1) Eliminations Total Group
2018 2017 2018 2017 2018 2017 2018 2017 2018 2017 2018 2017 2018 2017 2018 2017
Net sales External sales 2,431 2,361 2,553 2,344 1,512 1,483 1,894 596 408 316 − − − − 8,797 7,101Internal sales 225 196 197 185 − − − − 8 12 9 − −439 −393 − −Total net sales 2,656 2,557 2,750 2,529 1,512 1,483 1,894 596 416 329 9 − −439 −393 8,797 7,101
Adjusted income according policies for the respective year2) 136 151 91 121 125 122 96 36 −13 −43 −64 −58 − − 372 329
Restatement of comparative figures 2017 for allocated amortisations2) − −1 − −3 − −16 − −9 − − − 29 − − − −
Adjusted income according policies valid 2018 136 150 91 117 125 107 96 27 −13 −43 −64 −29 − − 372 329Non-comparable items −42 −35 −2 −4 − − −2 − − − −3 5 − − −49 −34
Operating income 94 114 89 113 125 107 94 27 −13 −43 −67 −24 − − 323 295Of which share of income of associates − − 2 2 0 0 − − − − − − − − 2 3Finance income 1 1Finance expenses −87 −72Tax on income for the year −33 −56Income for the year 204 168
Other disclosures Assets 1,054 994 1,861 1,622 933 751 604 496 50 41 3,895 3,742 −2,911 −2,534 5,486 5,113Holdings in associates − − 26 25 15 15 − − − − − − − − 41 40TOTAL ASSETS 1,054 994 1,887 1,647 948 766 604 496 50 41 3,895 3,742 −2,911 −2,534 5,527 5,153
Liabilities 984 915 1,080 911 917 800 422 410 191 172 1,318 1,186 −2,911 −2,544 2,001 1,850Unallocated liabilities 1,920 1,850Equity 1,606 1,455TOTAL EQUITY AND LIABILITIES 984 915 1,080 911 917 800 422 410 191 172 1,318 1,186 −2,911 −2,544 5,527 5,153
Investments 39 70 164 41 54 40 55 13 21 32 38 18 − − 371 214Depreciation, amortisation and impairment −67 −78 −47 −67 −52 −53 −57 −17 −18 −16 −2 −1 − − −242 −232
1) EBIT reported under Group-wide includes central corporate costs of MSEK −69 (−58). Group-wide assets includes assets and liabilities relating to central functions.2) As of 1 January 2018, the Group allocates amortisation of acquired intangible assets to the segments. Comparative figures for adjusted operating income and operating income have been restated. The effects and the redistribution is shown.
Scandi Standard Annual Report 2018
Notes
69
1
2
3
4
5
6
7
8
9
10
11
12
13
14
15
16
17
18
19
20
21
22
23
24
25
26
27
28
29
30
31
32
33
34
35

Note 3 Segment reporting cont.
Scandi Standard’s business is operationally divided into the countries of Sweden, Denmark, Norway, Ireland and Finland Internal reporting to Group Management and the Board corre-sponds with the Group’s operational structure. The division is based on the Group’s operations from a geographic perspective. Those countries where business is operated equals the Group’s segments. The segments are managed on the basis of the operating result (EBIT) and operating capital.
The responsibility for the Group’s financial assets and liabili-ties, provisions for taxes, gains and losses on the remeasurement of financial instruments (IFRS 9) are dealt with by the corporate functions and are not allocated to each segment. All capital expenditure on property, plant and equipment and intangible assets, are included in the segments’ investments.
Segment Sweden comprises the companies Kronfågel AB, SweHatch AB, Bosarpskyckling AB and AB Skånefågel. SweHatch AB engages in the rearing, production and hatching of day-old chicks for Kronfågel AB’s contract broiler producers and other small players in the Swedish market. Kronfågel AB is the seg-ment’s largest business engaged in slaughtering, production and development of chilled and frozen chicken products, mainly for the Swedish market. AB Skånefågel slaughters and sells chicken mainly for the Swedish market and export.
Segment Denmark comprises Danpo A/S, Rokkedahl Food ApS and the associate Farmfood A/S. Danpo A/S slaughters, produces, develops and processes chicken products with heat treatment for both the Danish market and exports within Europe and to Asia. Rokkedahl Food ApS slaughters and produces organic and free-range chicken. Farmfood A/S processes slaughterhouse byprod-ucts from the Group’s different segments, mainly for use in pet food sold in the international markets.
Segment Norway comprises Den Stolte Hane AS, Scandi Standard Norway AS and the associate Nærbø Kyllingslakt AS. The segment consists of two parts − the production slaughtering, processing of chicken products, and the packing of eggs in the segment’s own egg packing facility. Both types of product are sold in the Norwegian market.
Segment Ireland comprises Carton Bros ULC, which includes the operations of Manor Farm acquired as of August 2017. The segment includes slaughtering, production and development of chilled chícken products for the Irish market. The segment also produces feed for its contracted farmers.
Segment Finland comprises Naapurin Maalaiskana Oy. The segment includes slaughtering, production and development of chilled and frozen chícken products for the Finnish market.
Note 4 Breakdown of revenue
MSEK 2018 2017
Net sales Sales of goods 8,797 7,101Total 8,797 7,101
Other operating income Capital gains 1 2Rental income −4 4Government grants 0 0Canteen sales 7 7Insurance compensation 3 19Compensation for extra costs due to wrongly installed machine – 20Other 35 16Total 43 68
Net sales (external sales) per product category and segment
Sweden Denmark Norway Ireland FinlandGroup−
wide Total
MSEK 2018 2017 2018 2017 2018 2017 2018 2017 2018 2017 2018 2017 2018 2017
Chilled 1,091 1,061 783 715 750 717 1,699 528 325 243 – – 4,648 3,265Frozen 730 737 597 555 152 158 113 51 20 22 – – 1,612 1,523Ready-to-eat 288 245 982 853 247 243 – – 12 11 – – 1,529 1,352Other 322 317 191 221 363 365 82 17 51 40 – – 1,008 961Total 2,431 2,361 2,553 2,344 1,512 1,483 1,894 596 408 316 – – 8,797 7,101
Net sales per country
MSEKExternal sales
2018External sales
2017
Sweden 2,659 2,622Norway 1,543 1,505Denmark 1,410 1,324Ireland 1,695 530Germany 446 358Finland 457 324United Kingdom 337 139Rest of Europe 191 230Rest of the world 59 69Total 8,797 7,101
One of Scandi Standard’s customers accounts for more than 10 percent of the Group’s total net sales. The net sales amount on a Full Year basis is MSEK 1,100 (1,061). The customer is located in Region Sweden.
Scandi Standard Annual Report 2018
Notes
70
1
2
3
4
5
6
7
8
9
10
11
12
13
14
15
16
17
18
19
20
21
22
23
24
25
26
27
28
29
30
31
32
33
34
35

Note 5 Employees and employee benefits expenses
Average number of employees 2018
of which women 2017
of which women
Group Sweden 813 36% 794 37%Denmark 767 39% 729 38%Norway 280 54% 315 56%Ireland1) 962 45% 291 38%
Finland 184 48% 135 48%Total, Group2) 3,005 42% 2,264 40%
1) Ireland included in group since September 2017. The company had an average of 930 employees in all of 2017.
2) No employees in the Parent company.
Cost of personnel, MSEK 2018 2017
Salaries and benefits, Board of Directors and MDs 32 25– of which variable salary 12 10Salaries and benefits, other employees 1,458 1,095Social security expenses 152 146Pension expenses1) 92 83Other staff costs 30 40Total 1,763 1,400
1) MSEK 2 (2) of the Group’s pension costs relate to boards and Managing Directors. There are no outstanding pension obligations for these individuals.
Gender representation in executive managementGroup Parent Company
Female representation, % 2018 2017 2018 2017
Board of Directors 10 3 29 11Other senior executives 26 25 − −
Guidelines for remuneration to senior managementThe AGM has decided about the guidelines for remuneration to senior management. In these guidelines, the senior management means the managing director of the company, the senior manag-ers in the company and other group companies who, from time to time, are reporting to the managing director or the CFO and who are also members of the senior management, as well as board members of the company that have entered into an employment or consulting agreement with a group company.
Salaries and other terms and conditions of employment shall be adequate to enable the company and the group to retain and recruit
skilled senior managers at a reasonable cost. The remuneration to the senior managers shall consist of fixed salary, variable salary, pension and other benefits, and it shall be based on principles of per-formance, competitiveness and fairness.
Principles for fixed salary Each senior manager shall be offered a fixed salary in line with market conditions and based on the manager’s responsibility, exper-tise and performance.
Principles for variable salary All senior managers may, from time to time, be offered a variable salary (i.e., cash bonuses). The variable salary shall be based on a set of financial and personal objectives determined in advance. The variable salary may not amount to more than 75 percent of the fixed salary (in this context, fixed salary means cash salary earned during the year, excluding pension benefits and similar). To the extent a board member performs work for the company, in addition to ordinary board work, a market-based consulting fee may be paid.
Principles for incentive programs The general meeting may resolve on long-term incentive programs such as share and share price-related incentive programs for the members of the senior management. Such incentive programs shall be designed to promote the long-term value growth of the company and the group and increase alignment between the inter-ests of the participating individual and the company’s shareholders.
Principles for pensions, salary during periods of notice and severance pay Agreements regarding pensions shall, where applicable, be pre-mium based and designed in accordance with the level and prac-tice applicable in the country in which the member of senior man-agement is employed. Fixed salary during notice periods and sever-ance payment, including payments for any restrictions on competi-tion, shall in aggregate not exceed an amount equivalent to the fixed salary for two years. The total severance payment for all members of the senior management shall be limited to the current monthly salary for the remaining months up to the age of 65.
Principles for deviations from the guidelines The board of directors may resolve to deviate from the guidelines if the board of directors, in an individual case, is of the opinion that there are special circumstances justifying a deviation.
Variable salaryScandi Standard has a general program for variable salary that applies to senior management, local management teams and certain key persons. Targets may be qualitative as well as quanti-
tative. Decisions about participants and targets are made annually by Scandi Standard’s board of directors. Variable salary is accrued for in line with expected pay-out.
PensionScandi Standard offers its employees occupational pensions unless otherwise regulated in local agreements or other regula-tions. The Managing Director and CEO is entitled to a defined contribution pension scheme, with a premium of 15 percent of the pensionable salary, and has a retirement age of 65 years.
In Sweden, most employees are covered by defined benefit pension plans (ITP) through PRI Pensionstjänst AB. There are currently two different pension guidelines for Scandi Standard’s senior management: occupational pension accrual in accordance with the ITP agreement, with a pensionable salary ceiling of 30 income base amounts and payment of sickness benefits as laid down in the ITP agreement, and a defined contribution pension scheme, with a premium equal to 25−30 percent of the pension-able salary where the individual employee decides on the split between old-age, survivor and sickness benefits.
In Denmark, the pension contribution corresponds to 10 or 15 percent of the pensionable salary.
In Norway, the pension contributions are based on individual defined contribution pension agreements with contributions of between 5 and 12 percent of the pensionable salary.
In Ireland, the pension contribution corresponds to between 9 to 20 percent of the pensionable salary.
In Finland, the pension contribution corresponds to between 5 to 12 percent of the pensionable salary.
Termination and other benefitsTermination benefits/noticeThe Managing Director and CEO has a notice period of six months for termination of employment at the Company’s request and six months for termination at his own request. If employment is termi-nated at the Company’s request, termination benefits correspond-ing to 12 months’ salary (including fixed and variable salary, pen-sion and other benefits) is payable after the notice period with a full deduction of any salary from a new employer.
Other senior managers have notice periods of between six and 12 months for termination of employment at the Company’s request and between three and six months for termination at their own request. Certain senior managers have non-competition clauses with financial compensation to be paid to the Group if breached, corresponding to between 3 and 12 months remuneration.
Other benefitsIn addition to fixed and variable salaries and pensions, Scandi Standard offers occupational injury insurance and occupational
Scandi Standard Annual Report 2018
Notes
71
1
2
3
4
5
6
7
8
9
10
11
12
13
14
15
16
17
18
19
20
21
22
23
24
25
26
27
28
29
30
31
32
33
34
35
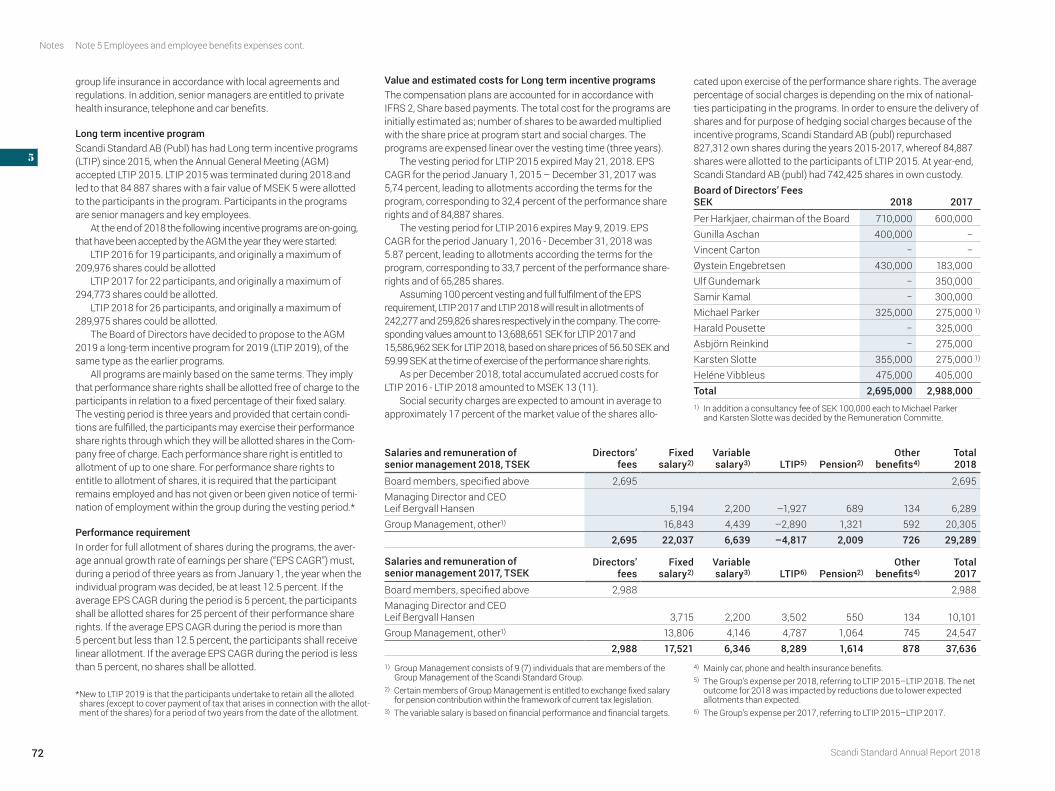
group life insurance in accordance with local agreements and regulations. In addition, senior managers are entitled to private health insurance, telephone and car benefits.
Long term incentive programScandi Standard AB (Publ) has had Long term incentive programs (LTIP) since 2015, when the Annual General Meeting (AGM) accepted LTIP 2015. LTIP 2015 was terminated during 2018 and led to that 84 887 shares with a fair value of MSEK 5 were allotted to the participants in the program. Participants in the programs are senior managers and key employees.
At the end of 2018 the following incentive programs are on-going, that have been accepted by the AGM the year they were started:
LTIP 2016 for 19 participants, and originally a maximum of 209,976 shares could be allotted
LTIP 2017 for 22 participants, and originally a maximum of 294,773 shares could be allotted.
LTIP 2018 for 26 participants, and originally a maximum of 289,975 shares could be allotted.
The Board of Directors have decided to propose to the AGM 2019 a long-term incentive program for 2019 (LTIP 2019), of the same type as the earlier programs.
All programs are mainly based on the same terms. They imply that performance share rights shall be allotted free of charge to the participants in relation to a fixed percentage of their fixed salary. The vesting period is three years and provided that certain condi-tions are fulfilled, the participants may exercise their performance share rights through which they will be allotted shares in the Com-pany free of charge. Each performance share right is entitled to allotment of up to one share. For performance share rights to entitle to allotment of shares, it is required that the participant remains employed and has not given or been given notice of termi-nation of employment within the group during the vesting period.*
Performance requirementIn order for full allotment of shares during the programs, the aver-age annual growth rate of earnings per share (“EPS CAGR”) must, during a period of three years as from January 1, the year when the individual program was decided, be at least 12.5 percent. If the average EPS CAGR during the period is 5 percent, the participants shall be allotted shares for 25 percent of their performance share rights. If the average EPS CAGR during the period is more than 5 percent but less than 12.5 percent, the participants shall receive linear allotment. If the average EPS CAGR during the period is less than 5 percent, no shares shall be allotted.
Value and estimated costs for Long term incentive programsThe compensation plans are accounted for in accordance with IFRS 2, Share based payments. The total cost for the programs are initially estimated as; number of shares to be awarded multiplied with the share price at program start and social charges. The programs are expensed linear over the vesting time (three years).
The vesting period for LTIP 2015 expired May 21, 2018. EPS CAGR for the period January 1, 2015 – December 31, 2017 was 5,74 percent, leading to allotments according the terms for the program, corresponding to 32,4 percent of the performance share rights and of 84,887 shares.
The vesting period for LTIP 2016 expires May 9, 2019. EPS CAGR for the period January 1, 2016 - December 31, 2018 was 5.87 percent, leading to allotments according the terms for the program, corresponding to 33,7 percent of the performance share-rights and of 65,285 shares.
Assuming 100 percent vesting and full fulfilment of the EPS requirement, LTIP 2017 and LTIP 2018 will result in allotments of 242,277 and 259,826 shares respectively in the company. The corre-sponding values amount to 13,688,651 SEK for LTIP 2017 and 15,586,962 SEK for LTIP 2018, based on share prices of 56.50 SEK and 59.99 SEK at the time of exercise of the performance share rights.
As per December 2018, total accumulated accrued costs for LTIP 2016 - LTIP 2018 amounted to MSEK 13 (11).
Social security charges are expected to amount in average to approximately 17 percent of the market value of the shares allo-
cated upon exercise of the performance share rights. The average percentage of social charges is depending on the mix of national-ties participating in the programs. In order to ensure the delivery of shares and for purpose of hedging social charges because of the incentive programs, Scandi Standard AB (publ) repurchased 827,312 own shares during the years 2015-2017, whereof 84,887 shares were allotted to the participants of LTIP 2015. At year-end, Scandi Standard AB (publ) had 742,425 shares in own custody.Board of Directors’ Fees SEK 2018 2017
Per Harkjaer, chairman of the Board 710,000 600,000Gunilla Aschan 400,000 −Vincent Carton − −Øystein Engebretsen 430,000 183,000Ulf Gundemark − 350,000Samir Kamal − 300,000Michael Parker 325,000 275,000 1)
Harald Pousette − 325,000Asbjörn Reinkind − 275,000Karsten Slotte 355,000 275,000 1)
Heléne Vibbleus 475,000 405,000Total 2,695,000 2,988,0001) In addition a consultancy fee of SEK 100,000 each to Michael Parker
and Karsten Slotte was decided by the Remuneration Committe.
Note 5 Employees and employee benefits expenses cont.
Salaries and remuneration of senior management 2018, TSEK
Directors’ fees
Fixed salary2)
Variable salary3) LTIP5) Pension2)
Other benefits4)
Total 2018
Board members, specified above 2,695 2,695Managing Director and CEO Leif Bergvall Hansen 5,194 2,200 –1,927 689 134 6,289Group Management, other1) 16,843 4,439 –2,890 1,321 592 20,305
2,695 22,037 6,639 –4,817 2,009 726 29,289
Salaries and remuneration of senior management 2017, TSEK
Directors’ fees
Fixed salary2)
Variable salary3) LTIP6) Pension2)
Other benefits4)
Total 2017
Board members, specified above 2,988 2,988Managing Director and CEO Leif Bergvall Hansen 3,715 2,200 3,502 550 134 10,101Group Management, other1) 13,806 4,146 4,787 1,064 745 24,547
2,988 17,521 6,346 8,289 1,614 878 37,636
1) Group Management consists of 9 (7) individuals that are members of the Group Management of the Scandi Standard Group.
2) Certain members of Group Management is entitled to exchange fixed salary for pension contribution within the framework of current tax legislation.
3) The variable salary is based on financial performance and financial targets.
4) Mainly car, phone and health insurance benefits.5) The Group’s expense per 2018, referring to LTIP 2015–LTIP 2018. The net
outcome for 2018 was impacted by reductions due to lower expected allotments than expected.
6) The Group’s expense per 2017, referring to LTIP 2015–LTIP 2017.
* New to LTIP 2019 is that the participants undertake to retain all the alloted shares (except to cover payment of tax that arises in connection with the allot-ment of the shares) for a period of two years from the date of the allotment.
Scandi Standard Annual Report 2018
Notes
72
1
2
3
4
5
6
7
8
9
10
11
12
13
14
15
16
17
18
19
20
21
22
23
24
25
26
27
28
29
30
31
32
33
34
35

Note 6 Depreciation, amortisation and impairment of in tangible assets and property, plant and equipment
MSEK 2018 2017
Depreciation and amortisation Land and buildings 28 22Plant and machinery 138 151Equipment, tools, fixtures and fittings 20 23Intangible assets 57 36Total 242 232
Impairment The Group tests intangible assets with indefinite useful life for impairment annually. These assets include Goodwill and Brands with indefinite lives. The intangible assets are allocated to the cash generating units in which they generated cash flow.
The cash generating units are the Groups operating segments. Cash flow expectations for the segments are based on business plans agreed by Group management for the next five years and on 2 percent organic growth thereafter. The cash flows are dis-counted by a calculated WACC before tax at 9.1−11.3 (9.7−11.3) percent based on the estimated return requirement for the seg-ments.
For the impairment testing at the end of 2018, all cash generat-ing units are expected to perform in line with the market. EBITDA is expected to improve slightly over the forecasting period towards the Group’s medium-term target of 10 percent.
The impairment test as of the end of the year shows that no need for impairment of the intangible assets in any of the cash generating units.
The assumptions included in the calculations are forward looking and as such are inherently uncertain and based on man-agement assumptions. To evaluate the risk that a change in any of the assumptions would have decreased the outcome of the impairment test, sensitivity analyses have been performed.
The WACC used is based on long term variables and as such should be stable over time. Nevertheless, return requirements can change and testing for this variable shows no impairment when increasing the WACC three percentage points.
Cash flow expectations in the cash generating units are an
important variable in the impairment test. The cash flows used are based on management’s best estimate of the future cash flow in each cash generating unit. There is a risk that these cash flows will be lower than expected over time, especially in the long term. Long term assumptions are based on a growth rate below the expected market growth to be prudent. The cash flows for the coming five years have greater impact on the value of the assets and are more important to test.
Market growth is strong in Sweden but margins have been under pressure due to stock clearance. It is the management’s expectation that this is a passing effect and that margins will recover over time. This change is not reflected in the business plan used as basis for the impairment test thus understating expected cash flow. The impairment test shows no impairment need even if EBITDA margin were to drop by three percentage points.
Denmark is assumed to show modest growth in line with the market. Denmark is exposed to fluctuating prices in the export markets since a large share of the sales is sold on export. The impairment test for this factor shows that there is no need for impairment even if prices on export markets would cause EBITDA margin to be reduced by more than three percentage points.
The operation in Norway is vulnerable due to its concentrated customer structure, but sensitivity analysis shows cash flows are expected to be sufficient even if the positive development of market share would ground to a halt.
The operations in Ireland, which was acquired in 2017, is tested with the assumptions and calculations made at the time of the acqusisition. The business is developing well and no impair-ment is required.
When the operation in Finland was acquired in 2015 it showed a low level of capacity utilization and generated a negative income. The valuation of Goodwill is based on a business plan where the operation is generating profit and a higher capacity utilization. In 2018 the production volumes and sales are up and adjusted oper-ating profIt was positive for the first time in the fourth quarter as a consequence of a number of actions that have been initiated, such as changes in management and reduction of labor force. The business position in the market continues to be strong and it is the estimate of management that the future profitability development mainly is dependent on the positive effects of internal actions to increase efficiency. Hence impairment of Goodwill is not consid-ered necessary.
Note 7 Fees and reimbursement to auditors
MSEK 2018 2017
PricewaterhouseCoopers (PwC)Audit services 6 4Audit related services 0 0Tax services 1 1
Other services1) 0 1Total 7 6
Other auditors: KPMG 0 1Total 7 71) Of which MSEK 0 (0) conserns audit services beyond the annual audit.
Annual audit includes the audit of the financial statements of the Parent Company and the Group, the accounting records and the administration of the Board of Directors and the Managing Director. It also includes other duties incumbent on the auditor of the Company as well as advice arising from observations made while performing the audit or carrying out such other duties.
The share of the total fees to PwC that refers to non-audit services, defined by the EU audit legislation, performed by the Swedish Öhrlings PricewaterhouseCoopers AB amounts to MSEK 0 (0) whereoff MSEK 0 (0) regarding audit services and MSEK 0 (0)regarding tax services. The services include accounting advice relating to the acquisition of Rokkedahl Foods ApS, advices from an accounting perspective for preparation of the financial reports, as well as other guidance regarding accounting and tax.
Scandi Standard Annual Report 2018
Notes
73
1
2
3
4
5
6
7
8
9
10
11
12
13
14
15
16
17
18
19
20
21
22
23
24
25
26
27
28
29
30
31
32
33
34
35

Note 8 Finance income and finance expenses
Income Expenses Total
MSEK 2018 2017 2018 2017 2018 2017
Loans and other receivables Other interest income 1 1 − − 1 1
1 1 − − 1 1Derivatives used in hedgingInterest and currency swaps − − −13 −8 −13 −8
− − −13 −8 −13 −8Other financial liabilities Interest expenses, pension plans − − −2 −3 −2 −3Interest expenses, borrowing − − −37 −38 −37 −38Interest expenses, earn-out − − −18 − −18 −Other borrowing expenses − − −5 −8 −5 −8Other interest expenses − − −4 −3 −4 −3Currency effects − − −8 −12 −8 −12
− − −73 −64 −73 −64Total 1 1 −87 −72 −86 −71
Note 9 Exchange differences affecting income
MSEK 2018 2017
Exchange differences affecting operating income 21 8Exchange differences, financial items −8 −12Total 13 −4
Exchange differences in operating income are included in:Other operating income/expense 21 8Total 21 8
Note 10 Taxes
Tax on income for the year, MSEK 2018 2017
Current tax expense (−) / tax income (+)Tax expense / income for the year −37 −54Adjustment of tax attributable to prior years −1 −0Total current tax −38 −54
Deferred tax expense (−) / tax income (+)Deferred tax from changes in temporary differences −11 −18Deferred tax from changes in changed tax rates 9 0Deferred tax income in capitalized losses carry forward 13 17Deferred tax expense use of capitalized losses carry forward −7 −Total deferred tax 5 −2Total recognised tax expense −33 −56
2018 2017
Reconciliation of effective tax % MSEK % MSEK
Income after finance net 237 224
Anticipated tax according to enacted Swedish tax rate −22.0 −52 −22.0 −49Effect of other tax rates for foreign subsidiaries 3.5 8 0.1 0Non-deductable expenses −1.4 −3 −2.4 −5Non-taxable income 0.2 0 0.0 0Effect of tax related to previous year −0.3 −1 0.1 0Reversal of income of associates 0.2 0 0.2 0Change in deferred tax due to changes in tax rates in Sweden and Norway 4.0 9 − −Other 2.1 5 −0.9 −2Recognised effective tax −13.7 −33 −24.9 −56
Tax items recognised in equity through other comprehensive income, MSEK 2018 2017
Actuarial gains and losses on defined benefit pension plans 2 −2Cash flow hedges 2 −1Total tax effects in other comprehensive income 3 −3
Scandi Standard Annual Report 2018
Notes
74
1
2
3
4
5
6
7
8
9
10
11
12
13
14
15
16
17
18
19
20
21
22
23
24
25
26
27
28
29
30
31
32
33
34
35
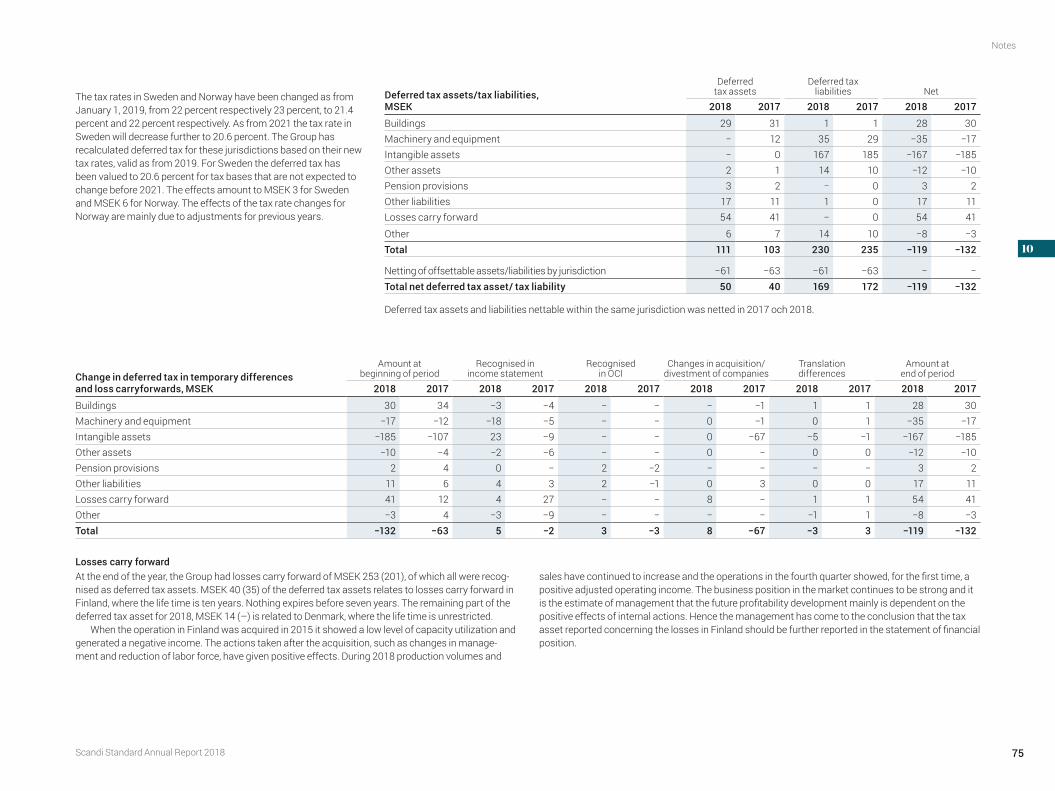
Change in deferred tax in temporary differences and loss carryforwards, MSEK
Amount at beginning of period
Recognised in income statement
Recognised in OCI
Changes in acquisition/ divestment of companies
Translation differences
Amount at end of period
2018 2017 2018 2017 2018 2017 2018 2017 2018 2017 2018 2017
Buildings 30 34 −3 −4 − − − −1 1 1 28 30Machinery and equipment −17 −12 −18 −5 − − 0 −1 0 1 −35 −17Intangible assets −185 −107 23 −9 − − 0 −67 −5 −1 −167 −185Other assets −10 −4 −2 −6 − − 0 − 0 0 −12 −10Pension provisions 2 4 0 − 2 −2 − − − − 3 2Other liabilities 11 6 4 3 2 −1 0 3 0 0 17 11Losses carry forward 41 12 4 27 − − 8 − 1 1 54 41Other −3 4 −3 −9 − − − − −1 1 −8 −3Total −132 −63 5 −2 3 −3 8 −67 −3 3 −119 −132
Losses carry forward At the end of the year, the Group had losses carry forward of MSEK 253 (201), of which all were recog-nised as deferred tax assets. MSEK 40 (35) of the deferred tax assets relates to losses carry forward in Finland, where the life time is ten years. Nothing expires before seven years. The remaining part of the deferred tax asset for 2018, MSEK 14 (–) is related to Denmark, where the life time is unrestricted.
When the operation in Finland was acquired in 2015 it showed a low level of capacity utilization and generated a negative income. The actions taken after the acquisition, such as changes in manage-ment and reduction of labor force, have given positive effects. During 2018 production volumes and
sales have continued to increase and the operations in the fourth quarter showed, for the first time, a positive adjusted operating income. The business position in the market continues to be strong and it is the estimate of management that the future profitability development mainly is dependent on the positive effects of internal actions. Hence the management has come to the conclusion that the tax asset reported concerning the losses in Finland should be further reported in the statement of financial position.
Deferred tax assets/tax liabilities, MSEK
Deferred tax assets
Deferred tax liabilities Net
2018 2017 2018 2017 2018 2017
Buildings 29 31 1 1 28 30Machinery and equipment − 12 35 29 −35 −17Intangible assets − 0 167 185 −167 −185Other assets 2 1 14 10 −12 −10Pension provisions 3 2 − 0 3 2Other liabilities 17 11 1 0 17 11Losses carry forward 54 41 − 0 54 41
Other 6 7 14 10 −8 −3Total 111 103 230 235 −119 −132
Netting of offsettable assets/liabilities by jurisdiction −61 −63 −61 −63 − −Total net deferred tax asset/ tax liability 50 40 169 172 −119 −132
Deferred tax assets and liabilities nettable within the same jurisdiction was netted in 2017 och 2018.
The tax rates in Sweden and Norway have been changed as from January 1, 2019, from 22 percent respectively 23 percent, to 21.4 percent and 22 percent respectively. As from 2021 the tax rate in Sweden will decrease further to 20.6 percent. The Group has recalculated deferred tax for these jurisdictions based on their new tax rates, valid as from 2019. For Sweden the deferred tax has been valued to 20.6 percent for tax bases that are not expected to change before 2021. The effects amount to MSEK 3 for Sweden and MSEK 6 for Norway. The effects of the tax rate changes for Norway are mainly due to adjustments for previous years.
Scandi Standard Annual Report 2018
Notes
75
1
2
3
4
5
6
7
8
9
10
11
12
13
14
15
16
17
18
19
20
21
22
23
24
25
26
27
28
29
30
31
32
33
34
35
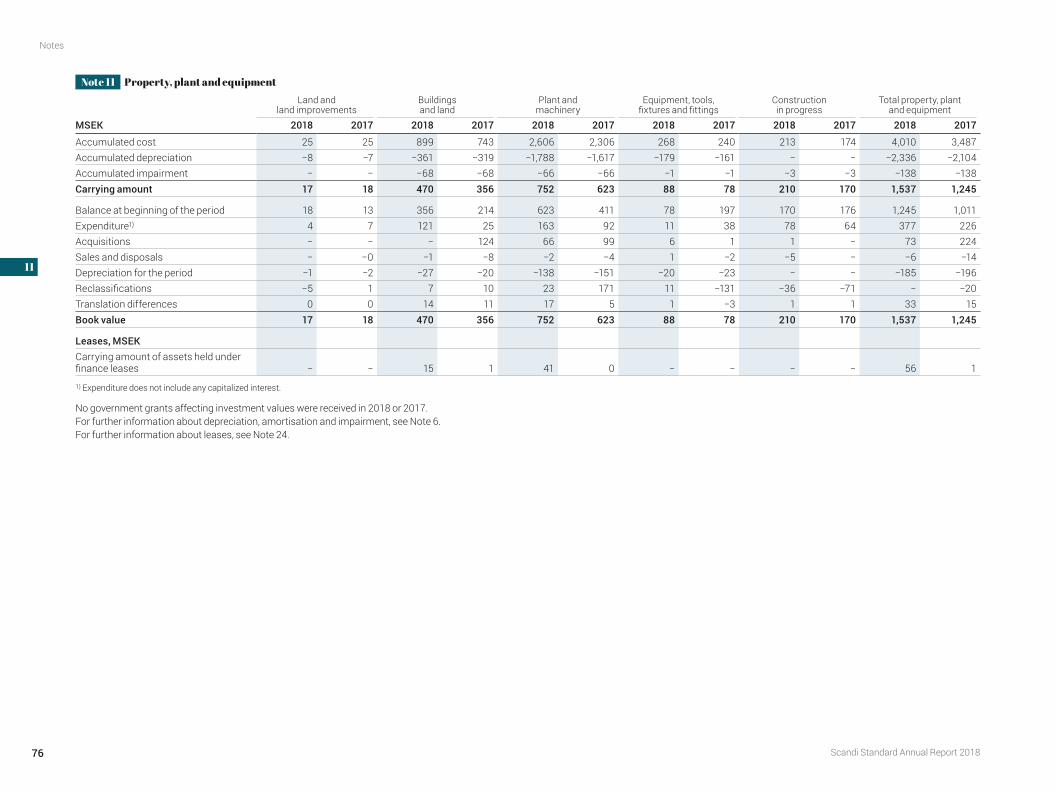
Note 11 Property, plant and equipmentLand and
land improvementsBuildings and land
Plant and machinery
Equipment, tools, fixtures and fittings
Construction in progress
Total property, plant and equipment
MSEK 2018 2017 2018 2017 2018 2017 2018 2017 2018 2017 2018 2017
Accumulated cost 25 25 899 743 2,606 2,306 268 240 213 174 4,010 3,487Accumulated depreciation −8 −7 −361 −319 −1,788 −1,617 −179 −161 − − −2,336 −2,104Accumulated impairment − − −68 −68 −66 −66 −1 −1 −3 −3 −138 −138Carrying amount 17 18 470 356 752 623 88 78 210 170 1,537 1,245
Balance at beginning of the period 18 13 356 214 623 411 78 197 170 176 1,245 1,011Expenditure1) 4 7 121 25 163 92 11 38 78 64 377 226Acquisitions − − − 124 66 99 6 1 1 − 73 224Sales and disposals − −0 −1 −8 −2 −4 1 −2 −5 − −6 −14Depreciation for the period −1 −2 −27 −20 −138 −151 −20 −23 − − −185 −196Reclassifications −5 1 7 10 23 171 11 −131 −36 −71 − −20Translation differences 0 0 14 11 17 5 1 −3 1 1 33 15Book value 17 18 470 356 752 623 88 78 210 170 1,537 1,245
Leases, MSEK Carrying amount of assets held under finance leases − − 15 1 41 0 − − − − 56 1
1) Expenditure does not include any capitalized interest.
No government grants affecting investment values were received in 2018 or 2017. For further information about depreciation, amortisation and impairment, see Note 6. For further information about leases, see Note 24.
Scandi Standard Annual Report 2018
Notes
76
1
2
3
4
5
6
7
8
9
10
11
12
13
14
15
16
17
18
19
20
21
22
23
24
25
26
27
28
29
30
31
32
33
34
35
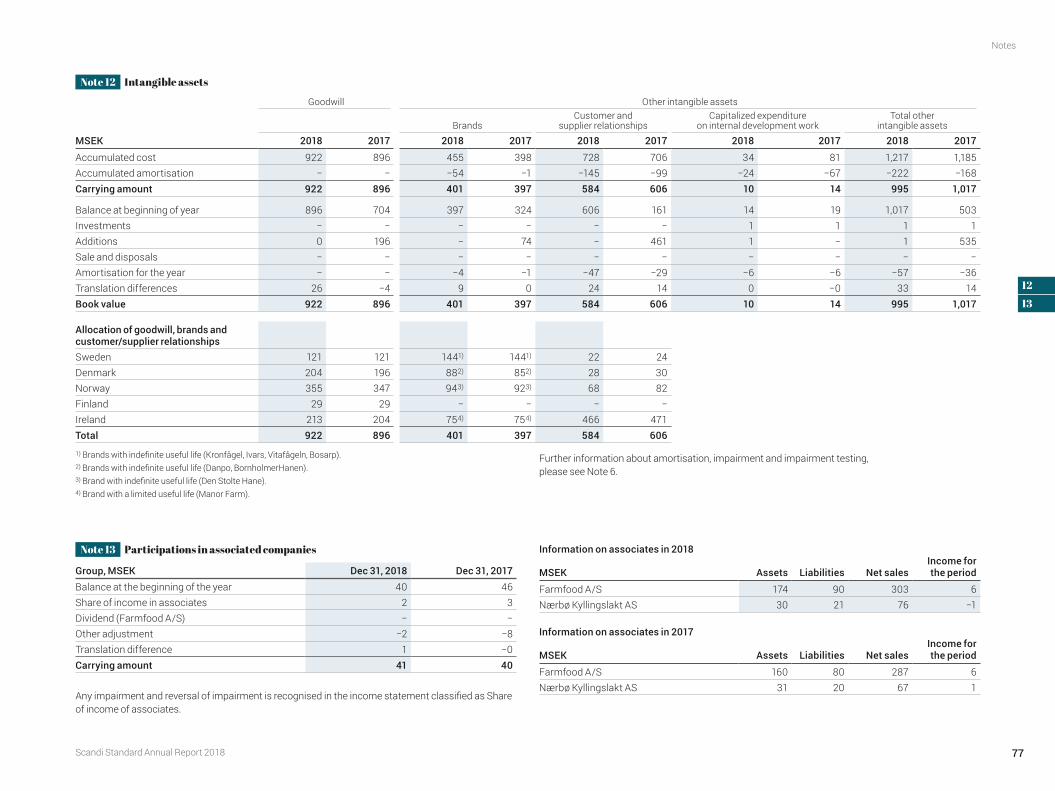
Note 12 Intangible assets
Goodwill Other intangible assets
BrandsCustomer and
supplier relationships Capitalized expenditure
on internal development workTotal other
intangible assets
MSEK 2018 2017 2018 2017 2018 2017 2018 2017 2018 2017
Accumulated cost 922 896 455 398 728 706 34 81 1,217 1,185Accumulated amortisation − − −54 −1 −145 −99 −24 −67 −222 −168Carrying amount 922 896 401 397 584 606 10 14 995 1,017
Balance at beginning of year 896 704 397 324 606 161 14 19 1,017 503Investments − − − − − − 1 1 1 1Additions 0 196 − 74 − 461 1 − 1 535Sale and disposals − − − − − − − − − −Amortisation for the year − − −4 −1 −47 −29 −6 −6 −57 −36Translation differences 26 −4 9 0 24 14 0 −0 33 14Book value 922 896 401 397 584 606 10 14 995 1,017
Allocation of goodwill, brands and customer/supplier relationshipsSweden 121 121 1441) 1441) 22 24Denmark 204 196 882) 852) 28 30Norway 355 347 943) 923) 68 82Finland 29 29 − − − −Ireland 213 204 754) 754) 466 471Total 922 896 401 397 584 606
1) Brands with indefinite useful life (Kronfågel, Ivars, Vitafågeln, Bosarp). 2) Brands with indefinite useful life (Danpo, BornholmerHanen).3) Brand with indefinite useful life (Den Stolte Hane).4) Brand with a limited useful life (Manor Farm).
Further information about amortisation, impairment and impairment testing, please see Note 6.
Note 13 Participations in associated companies
Group, MSEK Dec 31, 2018 Dec 31, 2017Balance at the beginning of the year 40 46Share of income in associates 2 3Dividend (Farmfood A/S) − −Other adjustment −2 −8Translation difference 1 −0Carrying amount 41 40
Any impairment and reversal of impairment is recognised in the income statement classified as Share of income of associates.
Information on associates in 2018
MSEK Assets Liabilities Net sales Income for the period
Farmfood A/S 174 90 303 6Nærbø Kyllingslakt AS 30 21 76 −1
Information on associates in 2017
MSEK Assets Liabilities Net sales Income for the period
Farmfood A/S 160 80 287 6Nærbø Kyllingslakt AS 31 20 67 1
Scandi Standard Annual Report 2018
Notes
77
1
2
3
4
5
6
7
8
9
10
11
12
13
14
15
16
17
18
19
20
21
22
23
24
25
26
27
28
29
30
31
32
33
34
35
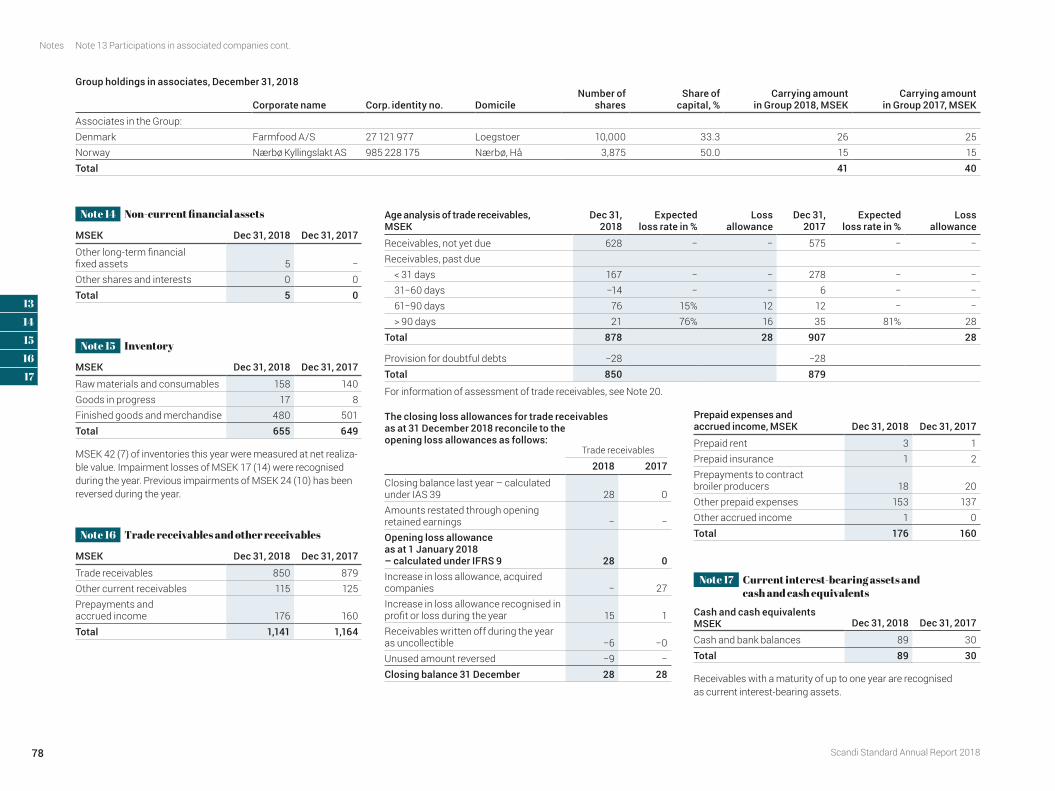
Group holdings in associates, December 31, 2018
Corporate name Corp. identity no. DomicileNumber of
shares Share of
capital, % Carrying amount
in Group 2018, MSEK Carrying amount
in Group 2017, MSEK Associates in the Group: Denmark Farmfood A/S 27 121 977 Loegstoer 10,000 33.3 26 25Norway Nærbø Kyllingslakt AS 985 228 175 Nærbø, Hå 3,875 50.0 15 15Total 41 40
Note 13 Participations in associated companies cont.
Note 14 Non-current financial assets
MSEK Dec 31, 2018 Dec 31, 2017
Other long-term financial fixed assets 5 −Other shares and interests 0 0Total 5 0
Note 15 Inventory
MSEK Dec 31, 2018 Dec 31, 2017
Raw materials and consumables 158 140Goods in progress 17 8Finished goods and merchandise 480 501Total 655 649
MSEK 42 (7) of inventories this year were measured at net realiza-ble value. Impairment losses of MSEK 17 (14) were recognised during the year. Previous impairments of MSEK 24 (10) has been reversed during the year.
Note 16 Trade receivables and other receivables
MSEK Dec 31, 2018 Dec 31, 2017
Trade receivables 850 879Other current receivables 115 125Prepayments and accrued income 176 160Total 1,141 1,164
Age analysis of trade receivables, MSEK
Dec 31, 2018
Expected loss rate in %
Loss allowance
Dec 31, 2017
Expected loss rate in %
Loss allowance
Receivables, not yet due 628 − − 575 − −Receivables, past due < 31 days 167 − − 278 − − 31−60 days −14 − − 6 − − 61−90 days 76 15% 12 12 − − > 90 days 21 76% 16 35 81% 28Total 878 28 907 28
Provision for doubtful debts −28 −28Total 850 879
For information of assessment of trade receivables, see Note 20.
The closing loss allowances for trade receivables as at 31 December 2018 reconcile to the opening loss allowances as follows:
Trade receivables
2018 2017
Closing balance last year – calculated under IAS 39 28 0Amounts restated through opening retained earnings − −Opening loss allowance as at 1 January 2018 – calculated under IFRS 9 28 0Increase in loss allowance, acquired companies − 27Increase in loss allowance recognised in profit or loss during the year 15 1Receivables written off during the year as uncollectible −6 −0Unused amount reversed −9 −Closing balance 31 December 28 28
Note 17 Current interest-bearing assets and cash and cash equivalents
Cash and cash equivalents MSEK Dec 31, 2018 Dec 31, 2017
Cash and bank balances 89 30Total 89 30
Receivables with a maturity of up to one year are recognised as current interest-bearing assets.
Prepaid expenses and accrued income, MSEK Dec 31, 2018 Dec 31, 2017
Prepaid rent 3 1Prepaid insurance 1 2Prepayments to contract broiler producers 18 20Other prepaid expenses 153 137Other accrued income 1 0Total 176 160
Scandi Standard Annual Report 2018
Notes
78
1
2
3
4
5
6
7
8
9
10
11
12
13
14
15
16
17
18
19
20
21
22
23
24
25
26
27
28
29
30
31
32
33
34
35

Equity attributable to the owners of the Parent Company
MSEKShare
capital1)
Other contributed
equity Hedge
reserve Translation
reserve Retained earnings
Equity attributable to the owners of the
Parent Company
Non- controlling
interestsTotal
equity
Total equity, opening balance Jan 1, 2017 1 703 −34 77 226 972 972Income for the year 168 168 168Actuarial gains and losses on pension plans 9 9 9Cash flow hedges: − remeasurement for the year 5 5 5 − reclassified to income statementExchange differences on translation of foreign operations 42 42 42Net gain on hedge of net investments in foreign operations −18 −18 −18Tax relating to components of other comprehensive income −1 −2 −3 −3Other comprehensive income for the year, net of tax 4 24 7 35 35Transactions with owners
Dividend −80 −80 −80Issue of new shares 0 353 353 353Transaction costs related to issue of new shares −1 −1 −1Repurchase own shares −10 −10 −10Long term incentive programmes 11 11 11
Profit from used option to buy shares in Sødams Øko Fjerkræslagteri ApS 6 6 6Other changes 1 1 1Total equity, closing balance Dec 31, 2017 1 975 −30 100 409 1,455 1,4551) The share capital in Scandi Standard AB amounted to SEK 659,663.
Total equity, opening balance Jan 1, 2018 1 975 −30 100 409 1,455 1,455Income for the year 202 202 1 204Actuarial gains and losses on pension plans −7 −7 −7Cash flow hedges: − remeasurement for the year −5 −5 −5 − reclassified to income statementExchange differences on translation of foreign operations 80 80 80Net gain on hedge of net investments in foreign operations -10 −10 −10Tax relating to components of other comprehensive income 2 2 3 3Other comprehensive income for the year, net of tax −4 70 −6 61 61Transactions with owners
Dividend −118 −118 −118Long term incentive programmes 5 5 5Non-controlling interests on acquisition of subsidiary 0 0Transactions with non-controlling interests 0 0
Other changes −3 3 0 0Total equity, closing balance Dec 31, 2018 1 857 −36 171 612 1,604 1 1,6061) The share capital in Scandi Standard AB amounted to SEK 659,663.
Note 18 Equity
Notes
79
1
2
3
4
5
6
7
8
9
10
11
12
13
14
15
16
17
18
19
20
21
22
23
24
25
26
27
28
29
30
31
32
33
34
35
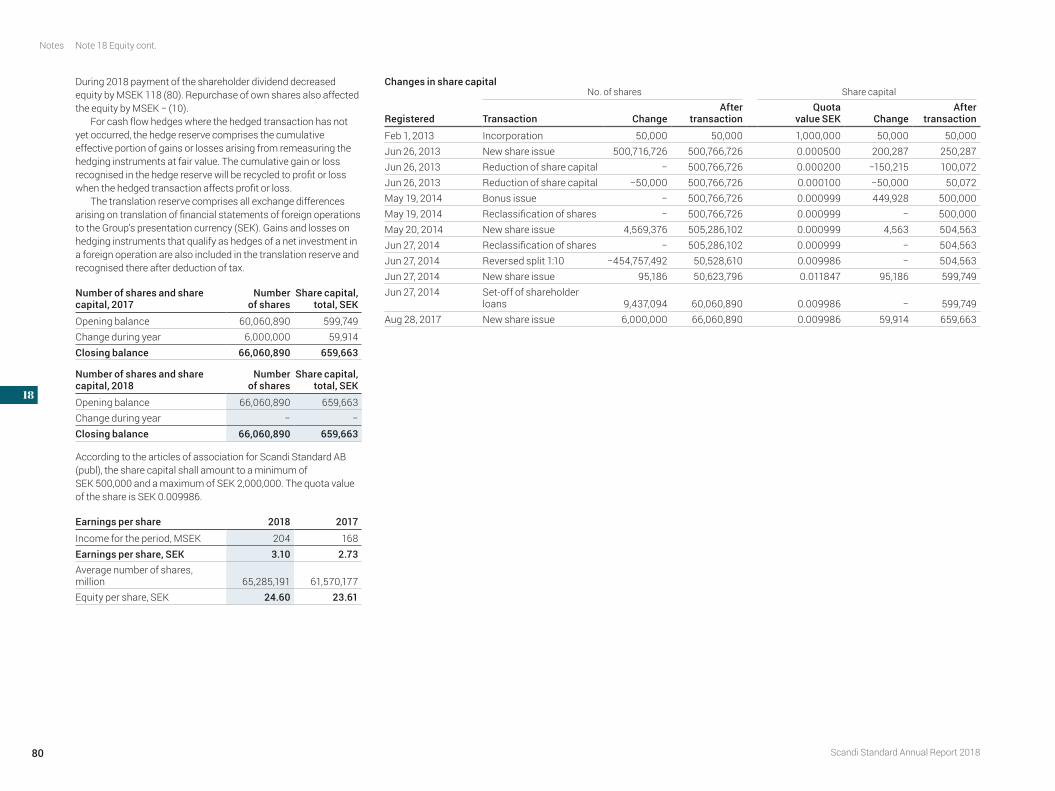
Note 18 Equity cont.
During 2018 payment of the shareholder dividend decreased equity by MSEK 118 (80). Repurchase of own shares also affected the equity by MSEK − (10).
For cash flow hedges where the hedged transaction has not yet occurred, the hedge reserve comprises the cumulative effective portion of gains or losses arising from remeasuring the hedging instruments at fair value. The cumulative gain or loss recognised in the hedge reserve will be recycled to profit or loss when the hedged transaction affects profit or loss.
The translation reserve comprises all exchange differences arising on translation of financial statements of foreign operations to the Group’s presentation currency (SEK). Gains and losses on hedging instruments that qualify as hedges of a net investment in a foreign operation are also included in the translation reserve and recognised there after deduction of tax.
Number of shares and share capital, 2017
Number of shares
Share capital, total, SEK
Opening balance 60,060,890 599,749Change during year 6,000,000 59,914Closing balance 66,060,890 659,663
Number of shares and share capital, 2018
Number of shares
Share capital, total, SEK
Opening balance 66,060,890 659,663Change during year − −Closing balance 66,060,890 659,663
According to the articles of association for Scandi Standard AB (publ), the share capital shall amount to a minimum of SEK 500,000 and a maximum of SEK 2,000,000. The quota value of the share is SEK 0.009986.
Earnings per share 2018 2017
Income for the period, MSEK 204 168Earnings per share, SEK 3.10 2.73Average number of shares, million 65,285,191 61,570,177Equity per share, SEK 24.60 23.61
Changes in share capitalNo. of shares Share capital
Registered Transaction ChangeAfter
transactionQuota
value SEK ChangeAfter
transaction
Feb 1, 2013 Incorporation 50,000 50,000 1,000,000 50,000 50,000Jun 26, 2013 New share issue 500,716,726 500,766,726 0.000500 200,287 250,287Jun 26, 2013 Reduction of share capital − 500,766,726 0.000200 −150,215 100,072Jun 26, 2013 Reduction of share capital −50,000 500,766,726 0.000100 −50,000 50,072May 19, 2014 Bonus issue − 500,766,726 0.000999 449,928 500,000May 19, 2014 Reclassification of shares − 500,766,726 0.000999 − 500,000May 20, 2014 New share issue 4,569,376 505,286,102 0.000999 4,563 504,563Jun 27, 2014 Reclassification of shares − 505,286,102 0.000999 − 504,563Jun 27, 2014 Reversed split 1:10 −454,757,492 50,528,610 0.009986 − 504,563Jun 27, 2014 New share issue 95,186 50,623,796 0.011847 95,186 599,749Jun 27, 2014 Set-off of shareholder
loans 9,437,094 60,060,890 0.009986 − 599,749Aug 28, 2017 New share issue 6,000,000 66,060,890 0.009986 59,914 659,663
Scandi Standard Annual Report 2018
Notes
80
1
2
3
4
5
6
7
8
9
10
11
12
13
14
15
16
17
18
19
20
21
22
23
24
25
26
27
28
29
30
31
32
33
34
35
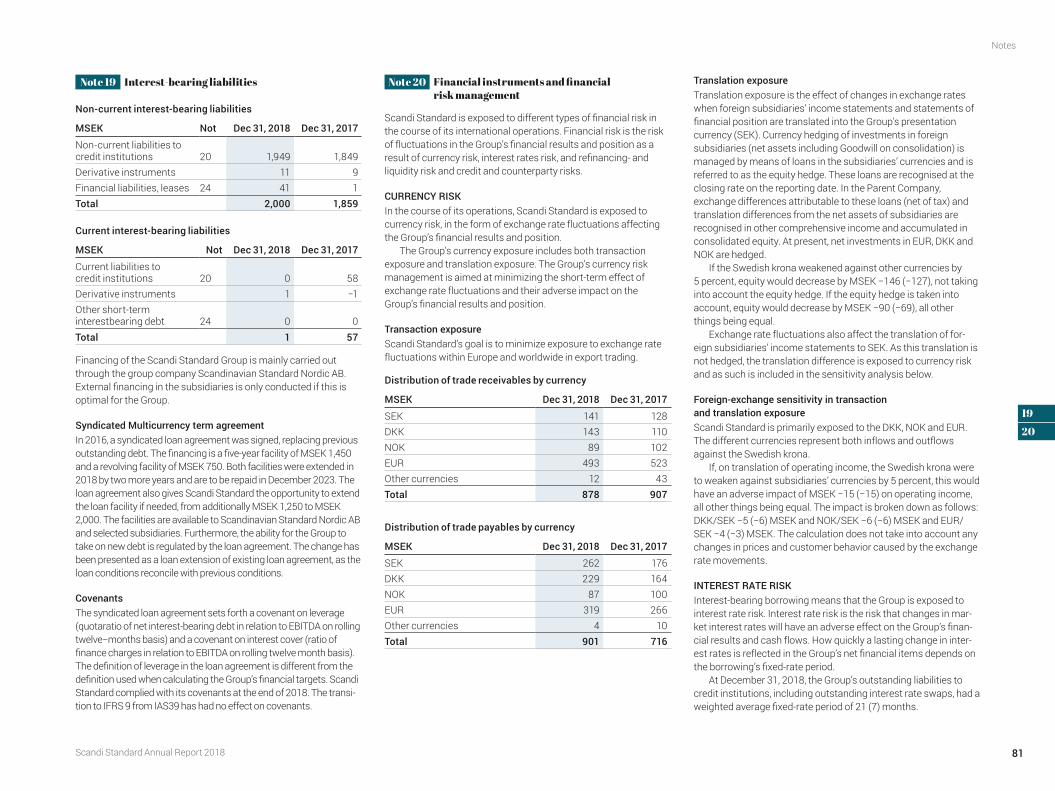
Note 19 Interest-bearing liabilities
Non-current interest-bearing liabilities
MSEK Not Dec 31, 2018 Dec 31, 2017
Non-current liabilities to credit institutions 20 1,949 1,849Derivative instruments 11 9Financial liabilities, leases 24 41 1Total 2,000 1,859
Current interest-bearing liabilities
MSEK Not Dec 31, 2018 Dec 31, 2017
Current liabilities to credit institutions 20 0 58Derivative instruments 1 −1Other short-term interestbearing debt 24 0 0Total 1 57
Financing of the Scandi Standard Group is mainly carried out through the group company Scandinavian Standard Nordic AB. External financing in the subsidiaries is only conducted if this is optimal for the Group.
Syndicated Multicurrency term agreementIn 2016, a syndicated loan agreement was signed, replacing previous outstanding debt. The financing is a five-year facility of MSEK 1,450 and a revolving facility of MSEK 750. Both facilities were extended in 2018 by two more years and are to be repaid in December 2023. The loan agreement also gives Scandi Standard the opportunity to extend the loan facility if needed, from additionally MSEK 1,250 to MSEK 2,000. The facilities are available to Scandinavian Standard Nordic AB and selected subsidiaries. Furthermore, the ability for the Group to take on new debt is regulated by the loan agreement. The change has been presented as a loan extension of existing loan agreement, as the loan conditions reconcile with previous conditions.
CovenantsThe syndicated loan agreement sets forth a covenant on leverage (quotaratio of net interest-bearing debt in relation to EBITDA on rolling twelve−months basis) and a covenant on interest cover (ratio of finance charges in relation to EBITDA on rolling twelve month basis). The definition of leverage in the loan agreement is different from the definition used when calculating the Group’s financial targets. Scandi Standard complied with its covenants at the end of 2018. The transi-tion to IFRS 9 from IAS39 has had no effect on covenants.
Note 20 Financial instruments and financial risk management
Scandi Standard is exposed to different types of financial risk in the course of its international operations. Financial risk is the risk of fluctuations in the Group’s financial results and position as a result of currency risk, interest rates risk, and refinancing- and liquidity risk and credit and counterparty risks.
CURRENCY RISK In the course of its operations, Scandi Standard is exposed to currency risk, in the form of exchange rate fluctuations affecting the Group’s financial results and position.
The Group’s currency exposure includes both transaction exposure and translation exposure. The Group’s currency risk management is aimed at minimizing the short-term effect of exchange rate fluctuations and their adverse impact on the Group’s financial results and position.
Transaction exposure Scandi Standard’s goal is to minimize exposure to exchange rate fluctuations within Europe and worldwide in export trading.
Distribution of trade receivables by currency
MSEK Dec 31, 2018 Dec 31, 2017
SEK 141 128DKK 143 110NOK 89 102EUR 493 523Other currencies 12 43Total 878 907
Distribution of trade payables by currency
MSEK Dec 31, 2018 Dec 31, 2017
SEK 262 176DKK 229 164NOK 87 100EUR 319 266Other currencies 4 10Total 901 716
Translation exposure Translation exposure is the effect of changes in exchange rates when foreign subsidiaries’ income statements and statements of financial position are translated into the Group’s presentation currency (SEK). Currency hedging of investments in foreign subsidiaries (net assets including Goodwill on consolidation) is managed by means of loans in the subsidiaries’ currencies and is referred to as the equity hedge. These loans are recognised at the closing rate on the reporting date. In the Parent Company, exchange differences attributable to these loans (net of tax) and translation differences from the net assets of subsidiaries are recognised in other comprehensive income and accumulated in consolidated equity. At present, net investments in EUR, DKK and NOK are hedged.
If the Swedish krona weakened against other currencies by 5 percent, equity would decrease by MSEK −146 (−127), not taking into account the equity hedge. If the equity hedge is taken into account, equity would decrease by MSEK −90 (−69), all other things being equal.
Exchange rate fluctuations also affect the translation of for-eign subsidiaries’ income statements to SEK. As this translation is not hedged, the translation difference is exposed to currency risk and as such is included in the sensitivity analysis below.
Foreign-exchange sensitivity in transaction and translation exposure Scandi Standard is primarily exposed to the DKK, NOK and EUR. The different currencies represent both inflows and outflows against the Swedish krona.
If, on translation of operating income, the Swedish krona were to weaken against subsidiaries’ currencies by 5 percent, this would have an adverse impact of MSEK −15 (−15) on operating income, all other things being equal. The impact is broken down as follows: DKK/SEK −5 (−6) MSEK and NOK/SEK −6 (−6) MSEK and EUR/SEK −4 (−3) MSEK. The calculation does not take into account any changes in prices and customer behavior caused by the exchange rate movements.
INTEREST RATE RISK Interest-bearing borrowing means that the Group is exposed to interest rate risk. Interest rate risk is the risk that changes in mar-ket interest rates will have an adverse effect on the Group’s finan-cial results and cash flows. How quickly a lasting change in inter-est rates is reflected in the Group’s net financial items depends on the borrowing’s fixed-rate period.
At December 31, 2018, the Group’s outstanding liabilities to credit institutions, including outstanding interest rate swaps, had a weighted average fixed-rate period of 21 (7) months.
Scandi Standard Annual Report 2018
Notes
81
1
2
3
4
5
6
7
8
9
10
11
12
13
14
15
16
17
18
19
20
21
22
23
24
25
26
27
28
29
30
31
32
33
34
35
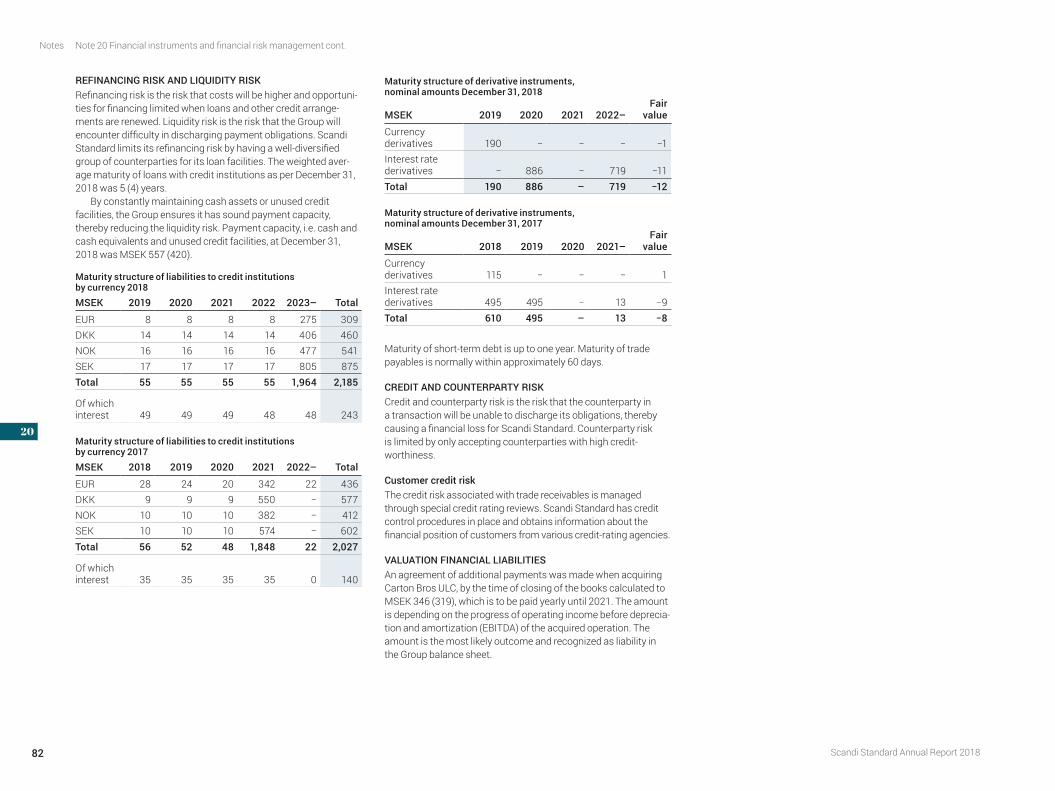
REFINANCING RISK AND LIQUIDITY RISK Refinancing risk is the risk that costs will be higher and opportuni-ties for financing limited when loans and other credit arrange-ments are renewed. Liquidity risk is the risk that the Group will encounter difficulty in discharging payment obligations. Scandi Standard limits its refinancing risk by having a well-diversified group of counterparties for its loan facilities. The weighted aver-age maturity of loans with credit institutions as per December 31, 2018 was 5 (4) years.
By constantly maintaining cash assets or unused credit facilities, the Group ensures it has sound payment capacity, thereby reducing the liquidity risk. Payment capacity, i.e. cash and cash equivalents and unused credit facilities, at December 31, 2018 was MSEK 557 (420).
Maturity structure of liabilities to credit institutions by currency 2018MSEK 2019 2020 2021 2022 2023– Total
EUR 8 8 8 8 275 309DKK 14 14 14 14 406 460NOK 16 16 16 16 477 541SEK 17 17 17 17 805 875Total 55 55 55 55 1,964 2,185
Of which interest 49 49 49 48 48 243
Maturity structure of liabilities to credit institutions by currency 2017MSEK 2018 2019 2020 2021 2022– Total
EUR 28 24 20 342 22 436DKK 9 9 9 550 − 577NOK 10 10 10 382 − 412SEK 10 10 10 574 − 602Total 56 52 48 1,848 22 2,027
Of which interest 35 35 35 35 0 140
Maturity structure of derivative instruments, nominal amounts December 31, 2018
MSEK 2019 2020 2021 2022–Fair
value
Currency derivatives 190 − − − −1Interest rate derivatives − 886 − 719 −11Total 190 886 – 719 −12
Maturity structure of derivative instruments, nominal amounts December 31, 2017
MSEK 2018 2019 2020 2021–Fair
value
Currency derivatives 115 − − − 1Interest rate derivatives 495 495 − 13 −9Total 610 495 – 13 −8
Maturity of short-term debt is up to one year. Maturity of trade payables is normally within approximately 60 days.
CREDIT AND COUNTERPARTY RISK Credit and counterparty risk is the risk that the counterparty in a transaction will be unable to discharge its obligations, thereby causing a financial loss for Scandi Standard. Counterparty risk is limited by only accepting counter parties with high credit- worthiness.
Customer credit risk The credit risk associated with trade receivables is managed through special credit rating reviews. Scandi Standard has credit control procedures in place and obtains information about the financial position of customers from various credit-rating agencies.
VALUATION FINANCIAL LIABILITIESAn agreement of additional payments was made when acquiring Carton Bros ULC, by the time of closing of the books calculated to MSEK 346 (319), which is to be paid yearly until 2021. The amount is depending on the progress of operating income before deprecia-tion and amortization (EBITDA) of the acquired operation. The amount is the most likely outcome and recognized as liability in the Group balance sheet.
Note 20 Financial instruments and financial risk management cont.
Scandi Standard Annual Report 2018
Notes
82
1
2
3
4
5
6
7
8
9
10
11
12
13
14
15
16
17
18
19
20
21
22
23
24
25
26
27
28
29
30
31
32
33
34
35
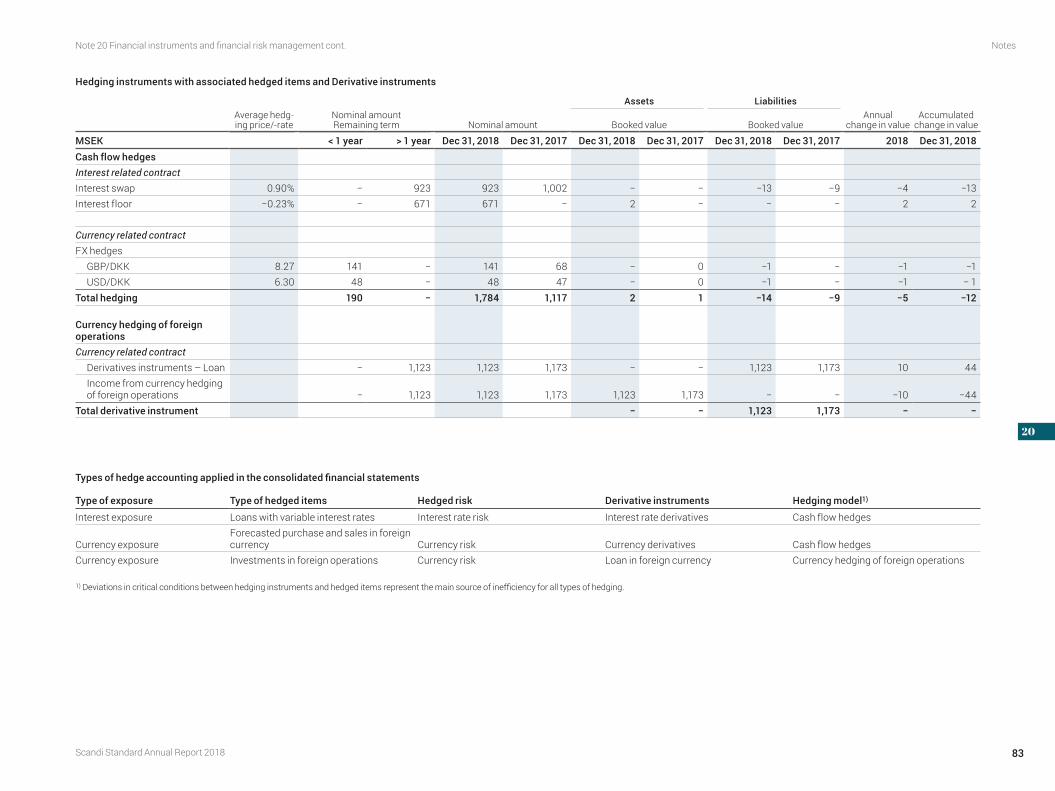
Note 20 Financial instruments and financial risk management cont.
Hedging instruments with associated hedged items and Derivative instruments
Assets LiabilitiesAverage hedg-ing price/-rate
Nominal amount Remaining term Nominal amount Booked value Booked value
Annual change in value
Accumulated change in value
MSEK < 1 year > 1 year Dec 31, 2018 Dec 31, 2017 Dec 31, 2018 Dec 31, 2017 Dec 31, 2018 Dec 31, 2017 2018 Dec 31, 2018Cash flow hedgesInterest related contractInterest swap 0.90% − 923 923 1,002 − − −13 −9 −4 −13Interest floor −0.23% − 671 671 − 2 − − − 2 2
Currency related contractFX hedges
GBP/DKK 8.27 141 − 141 68 − 0 −1 − −1 −1USD/DKK 6.30 48 − 48 47 − 0 −1 − −1 − 1
Total hedging 190 − 1,784 1,117 2 1 −14 −9 −5 −12
Currency hedging of foreign operationsCurrency related contract
Derivatives instruments – Loan − 1,123 1,123 1,173 − − 1,123 1,173 10 44Income from currency hedging of foreign operations − 1,123 1,123 1,173 1,123 1,173 − − −10 −44
Total derivative instrument − − 1,123 1,173 − −
Types of hedge accounting applied in the consolidated financial statements
Type of exposure Type of hedged items Hedged risk Derivative instruments Hedging model1)
Interest exposure Loans with variable interest rates Interest rate risk Interest rate derivatives Cash flow hedges
Currency exposureForecasted purchase and sales in foreign currency Currency risk Currency derivatives Cash flow hedges
Currency exposure Investments in foreign operations Currency risk Loan in foreign currency Currency hedging of foreign operations
1) Deviations in critical conditions between hedging instruments and hedged items represent the main source of inefficiency for all types of hedging.
Scandi Standard Annual Report 2018
Notes
83
1
2
3
4
5
6
7
8
9
10
11
12
13
14
15
16
17
18
19
20
21
22
23
24
25
26
27
28
29
30
31
32
33
34
35
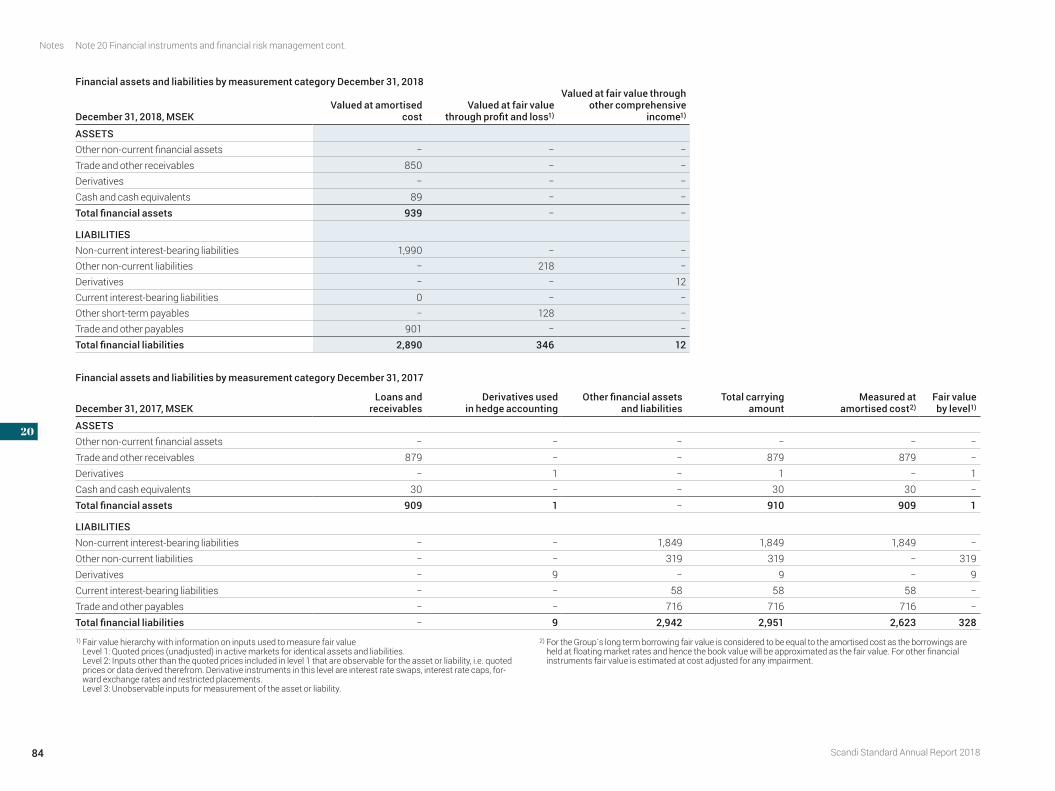
Note 20 Financial instruments and financial risk management cont.
Financial assets and liabilities by measurement category December 31, 2018
December 31, 2018, MSEKValued at amortised
costValued at fair value
through profit and loss1)
Valued at fair value through other comprehensive
income1)
ASSETS Other non-current financial assets − − −Trade and other receivables 850 − −Derivatives − − −Cash and cash equivalents 89 − −Total financial assets 939 − −
LIABILITIES Non-current interest-bearing liabilities 1,990 − −Other non-current liabilities − 218 −Derivatives − − 12Current interest-bearing liabilities 0 − −Other short-term payables − 128 −Trade and other payables 901 − −Total financial liabilities 2,890 346 12
Financial assets and liabilities by measurement category December 31, 2017
December 31, 2017, MSEKLoans and
receivables Derivatives used
in hedge accountingOther financial assets
and liabilitiesTotal carrying
amountMeasured at
amortised cost2)Fair valueby level1)
ASSETS Other non-current financial assets − − − − − −Trade and other receivables 879 − − 879 879 −Derivatives − 1 − 1 − 1Cash and cash equivalents 30 − − 30 30 −Total financial assets 909 1 − 910 909 1
LIABILITIES Non-current interest-bearing liabilities − − 1,849 1,849 1,849 −Other non-current liabilities − − 319 319 − 319Derivatives − 9 − 9 − 9Current interest-bearing liabilities − − 58 58 58 −Trade and other payables − − 716 716 716 −Total financial liabilities − 9 2,942 2,951 2,623 3281) Fair value hierarchy with information on inputs used to measure fair value
Level 1: Quoted prices (unadjusted) in active markets for identical assets and liabilities. Level 2: Inputs other than the quoted prices included in level 1 that are observable for the asset or liability, i.e. quoted prices or data derived therefrom. Derivative instruments in this level are interest rate swaps, interest rate caps, for-ward exchange rates and restricted placements. Level 3: Unobservable inputs for measurement of the asset or liability.
2) For the Group´s long term borrowing fair value is considered to be equal to the amortised cost as the borrowings are held at floating market rates and hence the book value will be approximated as the fair value. For other financial instruments fair value is estimated at cost adjusted for any impairment.
Scandi Standard Annual Report 2018
Notes
84
1
2
3
4
5
6
7
8
9
10
11
12
13
14
15
16
17
18
19
20
21
22
23
24
25
26
27
28
29
30
31
32
33
34
35
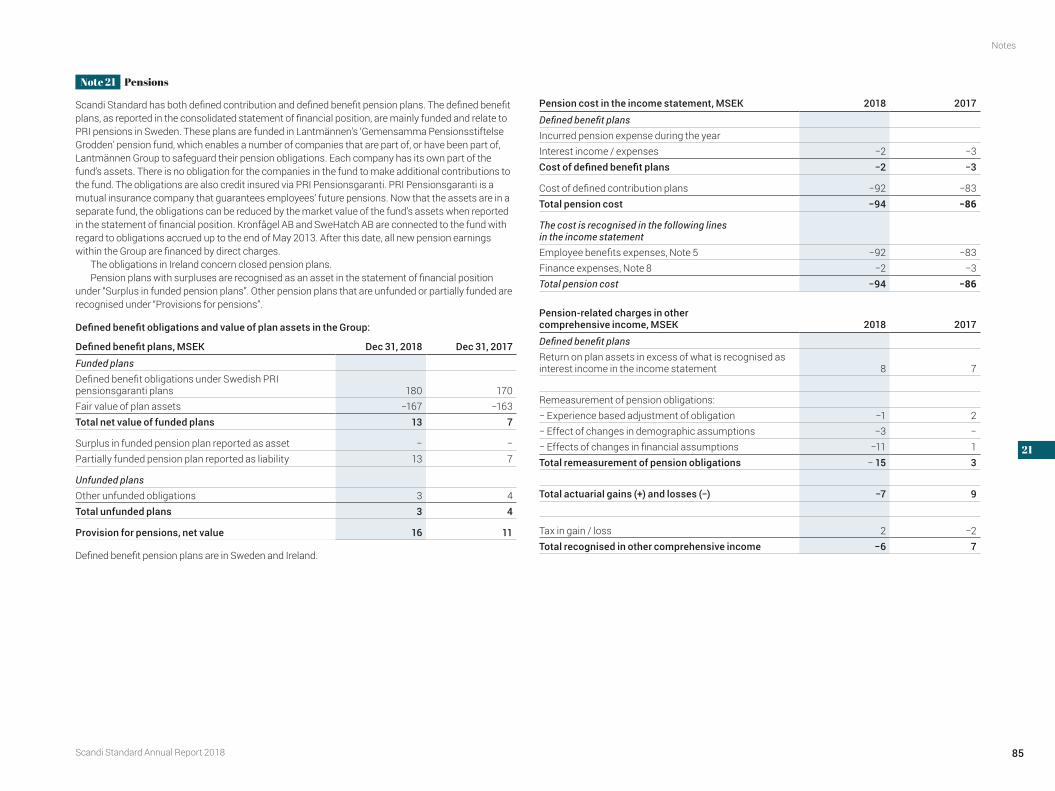
Note 21 Pensions
Scandi Standard has both defined contribution and defined benefit pension plans. The defined benefit plans, as reported in the consolidated statement of financial position, are mainly funded and relate to PRI pensions in Sweden. These plans are funded in Lantmännen’s ‘Gemensamma Pensionsstiftelse Grodden’ pension fund, which enables a number of companies that are part of, or have been part of, Lantmännen Group to safeguard their pension obligations. Each company has its own part of the fund’s assets. There is no obligation for the companies in the fund to make additional contributions to the fund. The obligations are also credit insured via PRI Pensionsgaranti. PRI Pensionsgaranti is a mutual insurance company that guarantees employees’ future pensions. Now that the assets are in a separate fund, the obligations can be reduced by the market value of the fund’s assets when reported in the statement of financial position. Kronfågel AB and SweHatch AB are connected to the fund with regard to obligations accrued up to the end of May 2013. After this date, all new pension earnings within the Group are financed by direct charges.
The obligations in Ireland concern closed pension plans.Pension plans with surpluses are recognised as an asset in the statement of financial position
under “Surplus in funded pension plans”. Other pension plans that are unfunded or partially funded are recognised under “Provisions for pensions”.
Defined benefit obligations and value of plan assets in the Group:
Defined benefit plans, MSEK Dec 31, 2018 Dec 31, 2017
Funded plansDefined benefit obligations under Swedish PRI pensionsgaranti plans 180 170Fair value of plan assets −167 −163Total net value of funded plans 13 7
Surplus in funded pension plan reported as asset − −Partially funded pension plan reported as liability 13 7
Unfunded plansOther unfunded obligations 3 4Total unfunded plans 3 4
Provision for pensions, net value 16 11
Defined benefit pension plans are in Sweden and Ireland.
Pension cost in the income statement, MSEK 2018 2017
Defined benefit plansIncurred pension expense during the yearInterest income / expenses −2 −3Cost of defined benefit plans −2 −3
Cost of defined contribution plans −92 −83Total pension cost −94 −86
The cost is recognised in the following lines in the income statementEmployee benefits expenses, Note 5 −92 −83Finance expenses, Note 8 −2 −3Total pension cost −94 −86
Pension-related charges in other comprehensive income, MSEK 2018 2017
Defined benefit plansReturn on plan assets in excess of what is recognised as interest income in the income statement 8 7
Remeasurement of pension obligations:− Experience based adjustment of obligation −1 2− Effect of changes in demographic assumptions −3 −− Effects of changes in financial assumptions −11 1Total remeasurement of pension obligations − 15 3
Total actuarial gains (+) and losses (−) −7 9
Tax in gain / loss 2 −2Total recognised in other comprehensive income −6 7
Scandi Standard Annual Report 2018
Notes
85
1
2
3
4
5
6
7
8
9
10
11
12
13
14
15
16
17
18
19
20
21
22
23
24
25
26
27
28
29
30
31
32
33
34
35
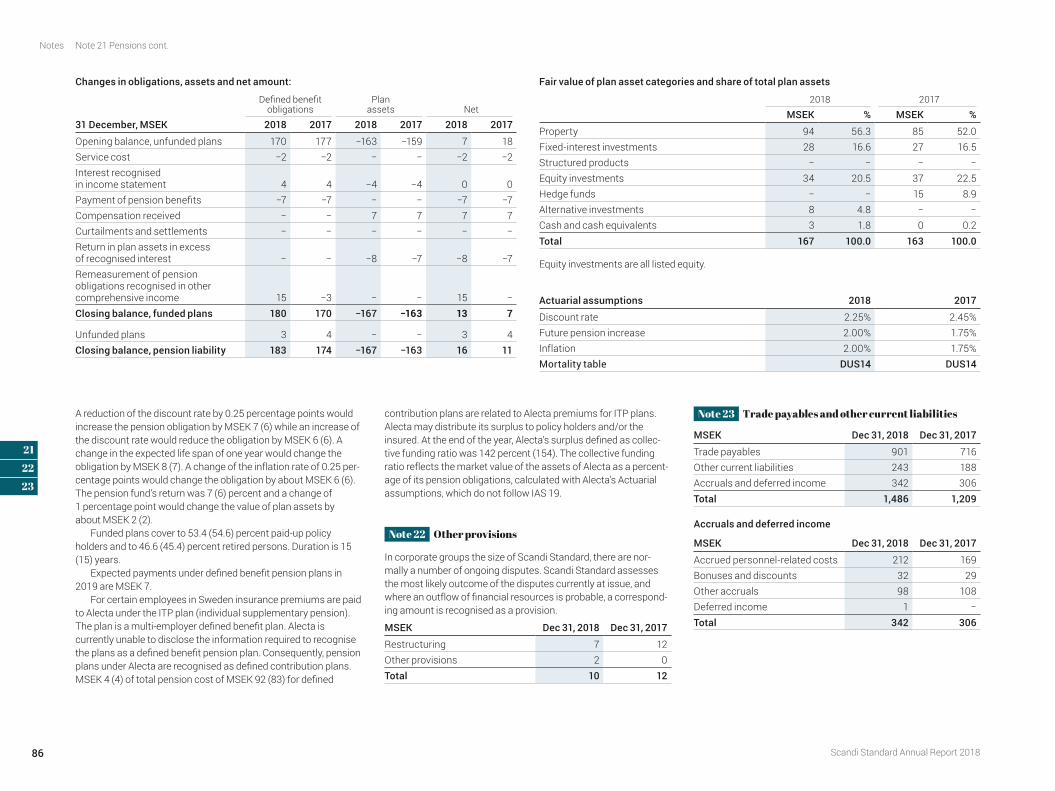
Changes in obligations, assets and net amount:
Defined benefit obligations
Plan assets Net
31 December, MSEK 2018 2017 2018 2017 2018 2017
Opening balance, unfunded plans 170 177 −163 −159 7 18Service cost −2 −2 − − −2 −2Interest recognised in income statement 4 4 −4 −4 0 0Payment of pension benefits −7 −7 − − −7 −7Compensation received − − 7 7 7 7Curtailments and settlements − − − − − −Return in plan assets in excess of recognised interest − − −8 −7 −8 −7Remeasurement of pension obligations recognised in other comprehensive income 15 −3 − − 15 −Closing balance, funded plans 180 170 −167 −163 13 7
Unfunded plans 3 4 − − 3 4Closing balance, pension liability 183 174 −167 −163 16 11
A reduction of the discount rate by 0.25 percentage points would increase the pension obligation by MSEK 7 (6) while an increase of the discount rate would reduce the obligation by MSEK 6 (6). A change in the expected life span of one year would change the obligation by MSEK 8 (7). A change of the inflation rate of 0.25 per-centage points would change the obligation by about MSEK 6 (6). The pension fund’s return was 7 (6) percent and a change of 1 percentage point would change the value of plan assets by about MSEK 2 (2).
Funded plans cover to 53.4 (54.6) percent paid-up policy holders and to 46.6 (45.4) percent retired persons. Duration is 15 (15) years.
Expected payments under defined benefit pension plans in 2019 are MSEK 7.
For certain employees in Sweden insurance premiums are paid to Alecta under the ITP plan (individual supplementary pension). The plan is a multi-employer defined benefit plan. Alecta is currently unable to disclose the information required to recognise the plans as a defined benefit pension plan. Consequently, pension plans under Alecta are recognised as defined contribution plans. MSEK 4 (4) of total pension cost of MSEK 92 (83) for defined
contribution plans are related to Alecta premiums for ITP plans. Alecta may distribute its surplus to policy holders and/or the insured. At the end of the year, Alecta’s surplus defined as collec-tive funding ratio was 142 percent (154). The collective funding ratio reflects the market value of the assets of Alecta as a percent-age of its pension obligations, calculated with Alecta’s Actuarial assumptions, which do not follow IAS 19.
Note 22 Other provisions
In corporate groups the size of Scandi Standard, there are nor-mally a number of ongoing disputes. Scandi Standard assesses the most likely outcome of the disputes currently at issue, and where an outflow of financial resources is probable, a correspond-ing amount is recognised as a provision.
MSEK Dec 31, 2018 Dec 31, 2017
Restructuring 7 12Other provisions 2 0Total 10 12
Note 23 Trade payables and other current liabilities
MSEK Dec 31, 2018 Dec 31, 2017
Trade payables 901 716Other current liabilities 243 188Accruals and deferred income 342 306Total 1,486 1,209
Accruals and deferred income
MSEK Dec 31, 2018 Dec 31, 2017
Accrued personnel-related costs 212 169Bonuses and discounts 32 29Other accruals 98 108Deferred income 1 −Total 342 306
Note 21 Pensions cont.
Fair value of plan asset categories and share of total plan assets
2018 2017
MSEK % MSEK %
Property 94 56.3 85 52.0Fixed-interest investments 28 16.6 27 16.5Structured products − − − −Equity investments 34 20.5 37 22.5Hedge funds − − 15 8.9Alternative investments 8 4.8 − −Cash and cash equivalents 3 1.8 0 0.2Total 167 100.0 163 100.0
Equity investments are all listed equity.
Actuarial assumptions 2018 2017
Discount rate 2.25% 2.45%Future pension increase 2.00% 1.75%Inflation 2.00% 1.75%Mortality table DUS14 DUS14
Scandi Standard Annual Report 2018
Notes
86
1
2
3
4
5
6
7
8
9
10
11
12
13
14
15
16
17
18
19
20
21
22
23
24
25
26
27
28
29
30
31
32
33
34
35
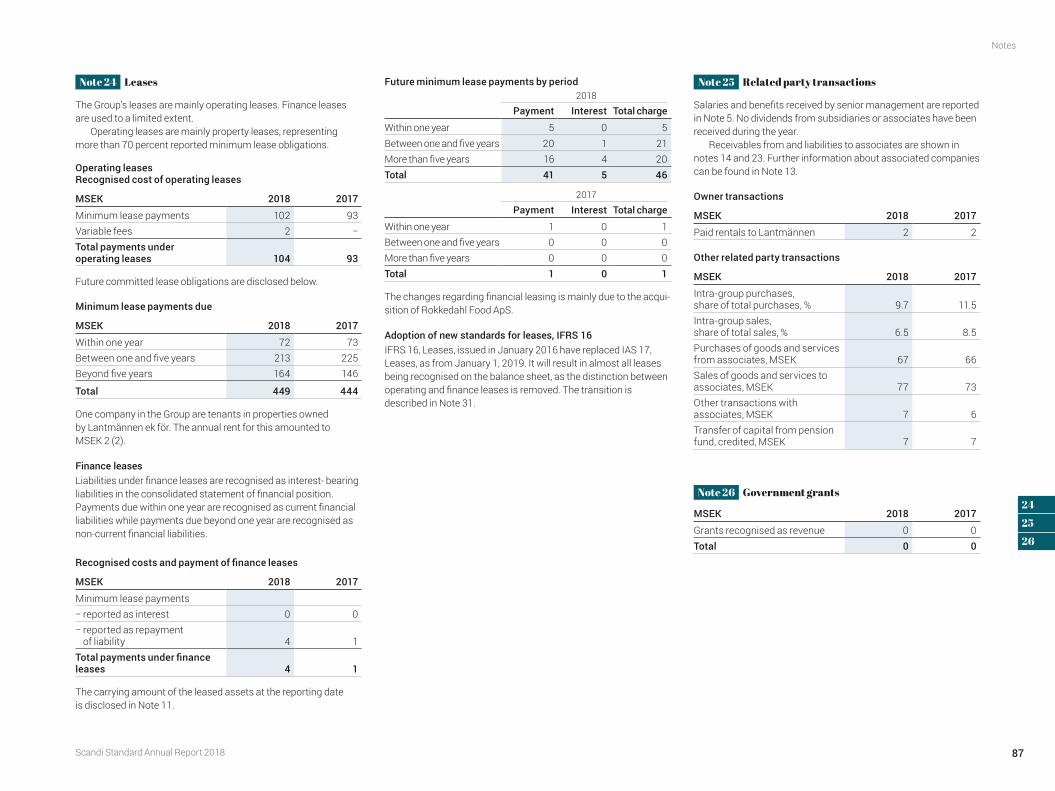
Note 24 Leases
The Group’s leases are mainly operating leases. Finance leases are used to a limited extent.
Operating leases are mainly property leases, representing more than 70 percent reported minimum lease obligations.
Operating leases Recognised cost of operating leases
MSEK 2018 2017
Minimum lease payments 102 93Variable fees 2 −Total payments under operating leases 104 93
Future committed lease obligations are disclosed below.
Minimum lease payments due
MSEK 2018 2017
Within one year 72 73Between one and five years 213 225Beyond five years 164 146
Total 449 444
One company in the Group are tenants in properties owned by Lantmännen ek för. The annual rent for this amounted to MSEK 2 (2).
Finance leases Liabilities under finance leases are recognised as interest- bearing liabilities in the consolidated statement of financial position. Payments due within one year are recognised as current financial liabilities while payments due beyond one year are recognised as non-current financial liabilities.
Recognised costs and payment of finance leases
MSEK 2018 2017
Minimum lease payments − reported as interest 0 0− reported as repayment
of liability 4 1Total payments under finance leases 4 1
The carrying amount of the leased assets at the reporting date is disclosed in Note 11.
Future minimum lease payments by period2018
Payment Interest Total charge
Within one year 5 0 5Between one and five years 20 1 21More than five years 16 4 20Total 41 5 46
2017
Payment Interest Total charge
Within one year 1 0 1Between one and five years 0 0 0More than five years 0 0 0Total 1 0 1
The changes regarding financial leasing is mainly due to the acqui-sition of Rokkedahl Food ApS.
Adoption of new standards for leases, IFRS 16IFRS 16, Leases, issued in January 2016 have replaced IAS 17, Leases, as from January 1, 2019. It will result in almost all leases being recognised on the balance sheet, as the distinction between operating and finance leases is removed. The transition is described in Note 31.
Note 25 Related party transactions
Salaries and benefits received by senior management are reported in Note 5. No dividends from subsidiaries or associates have been received during the year.
Receivables from and liabilities to associates are shown in notes 14 and 23. Further information about associated companies can be found in Note 13.
Owner transactions
MSEK 2018 2017
Paid rentals to Lantmännen 2 2
Other related party transactions
MSEK 2018 2017
Intra-group purchases, share of total purchases, % 9.7 11.5Intra-group sales, share of total sales, % 6.5 8.5Purchases of goods and services from associates, MSEK 67 66Sales of goods and services to associates, MSEK 77 73Other transactions with associates, MSEK 7 6Transfer of capital from pension fund, credited, MSEK 7 7
Note 26 Government grants
MSEK 2018 2017
Grants recognised as revenue 0 0Total 0 0
Scandi Standard Annual Report 2018
Notes
87
1
2
3
4
5
6
7
8
9
10
11
12
13
14
15
16
17
18
19
20
21
22
23
24
25
26
27
28
29
30
31
32
33
34
35
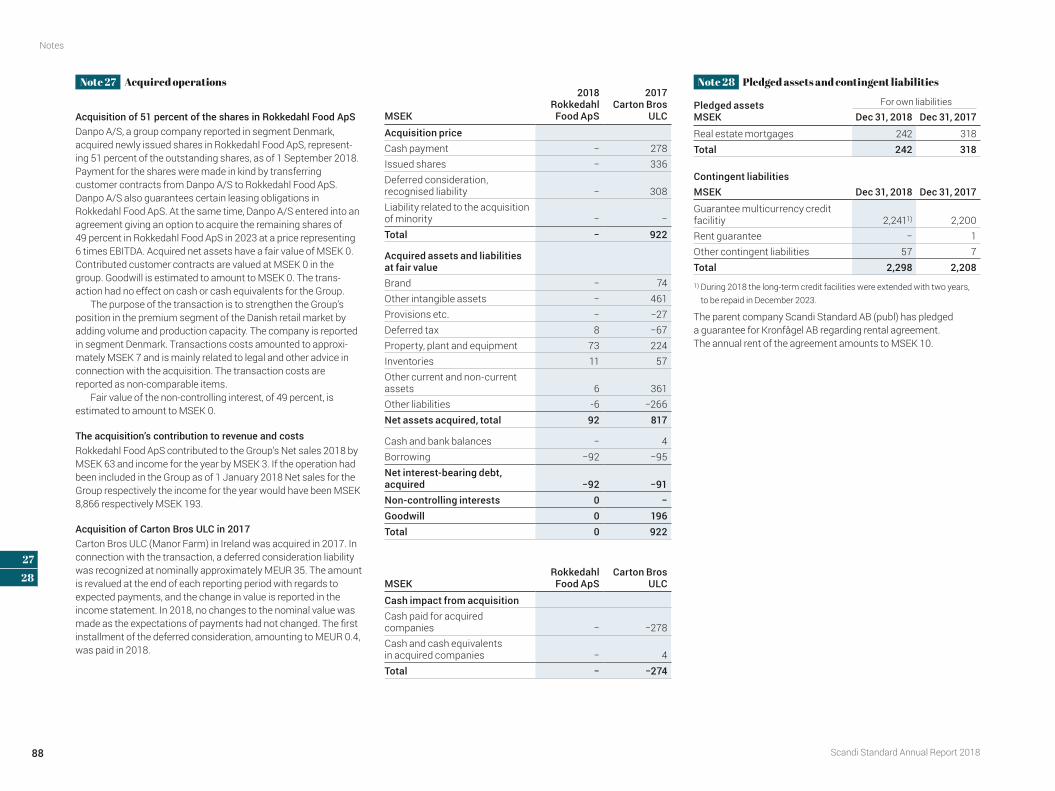
Note 28 Pledged assets and contingent liabilities
Pledged assetsMSEK
For own liabilities
Dec 31, 2018 Dec 31, 2017
Real estate mortgages 242 318Total 242 318
Contingent liabilitiesMSEK Dec 31, 2018 Dec 31, 2017
Guarantee multicurrency credit facilitiy 2,2411) 2,200Rent guarantee − 1Other contingent liabilities 57 7Total 2,298 2,208
1) During 2018 the long-term credit facilities were extended with two years, to be repaid in December 2023.
The parent company Scandi Standard AB (publ) has pledged a guarantee for Kronfågel AB regarding rental agreement. The annual rent of the agreement amounts to MSEK 10.
Note 27 Acquired operations
Acquisition of 51 percent of the shares in Rokkedahl Food ApSDanpo A/S, a group company reported in segment Denmark, acquired newly issued shares in Rokkedahl Food ApS, represent-ing 51 percent of the outstanding shares, as of 1 September 2018. Payment for the shares were made in kind by transferring customer contracts from Danpo A/S to Rokkedahl Food ApS. Danpo A/S also guarantees certain leasing obligations in Rokkedahl Food ApS. At the same time, Danpo A/S entered into an agreement giving an option to acquire the remaining shares of 49 percent in Rokkedahl Food ApS in 2023 at a price representing 6 times EBITDA. Acquired net assets have a fair value of MSEK 0. Contributed customer contracts are valued at MSEK 0 in the group. Goodwill is estimated to amount to MSEK 0. The trans-action had no effect on cash or cash equivalents for the Group.
The purpose of the transaction is to strengthen the Group’s position in the premium segment of the Danish retail market by adding volume and production capacity. The company is reported in segment Denmark. Transactions costs amounted to approxi-mately MSEK 7 and is mainly related to legal and other advice in connection with the acquisition. The trans action costs are reported as non-comparable items.
Fair value of the non-controlling interest, of 49 percent, is estimated to amount to MSEK 0.
The acquisition’s contribution to revenue and costsRokkedahl Food ApS contributed to the Group’s Net sales 2018 by MSEK 63 and income for the year by MSEK 3. If the operation had been included in the Group as of 1 January 2018 Net sales for the Group respectively the income for the year would have been MSEK 8,866 respectively MSEK 193.
Acquisition of Carton Bros ULC in 2017Carton Bros ULC (Manor Farm) in Ireland was acquired in 2017. In connection with the transaction, a deferred consideration liability was recognized at nominally approximately MEUR 35. The amount is revalued at the end of each reporting period with regards to expected payments, and the change in value is reported in the income statement. In 2018, no changes to the nominal value was made as the expectations of payments had not changed. The first installment of the deferred consideration, amounting to MEUR 0.4, was paid in 2018.
MSEK
2018Rokkedahl Food ApS
2017Carton Bros
ULC
Acquisition priceCash payment − 278Issued shares − 336Deferred consideration, recognised liability − 308Liability related to the acquisition of minority − −Total − 922
Acquired assets and liabilities at fair valueBrand − 74Other intangible assets − 461Provisions etc. − −27Deferred tax 8 −67Property, plant and equipment 73 224Inventories 11 57Other current and non-current assets 6 361Other liabilities -6 −266Net assets acquired, total 92 817
Cash and bank balances − 4Borrowing −92 −95Net interest-bearing debt, acquired −92 −91Non-controlling interests 0 −Goodwill 0 196Total 0 922
MSEKRokkedahl Food ApS
Carton Bros ULC
Cash impact from acquisitionCash paid for acquired companies − −278Cash and cash equivalents in acquired companies − 4Total − −274
Scandi Standard Annual Report 2018
Notes
88
1
2
3
4
5
6
7
8
9
10
11
12
13
14
15
16
17
18
19
20
21
22
23
24
25
26
27
28
29
30
31
32
33
34
35
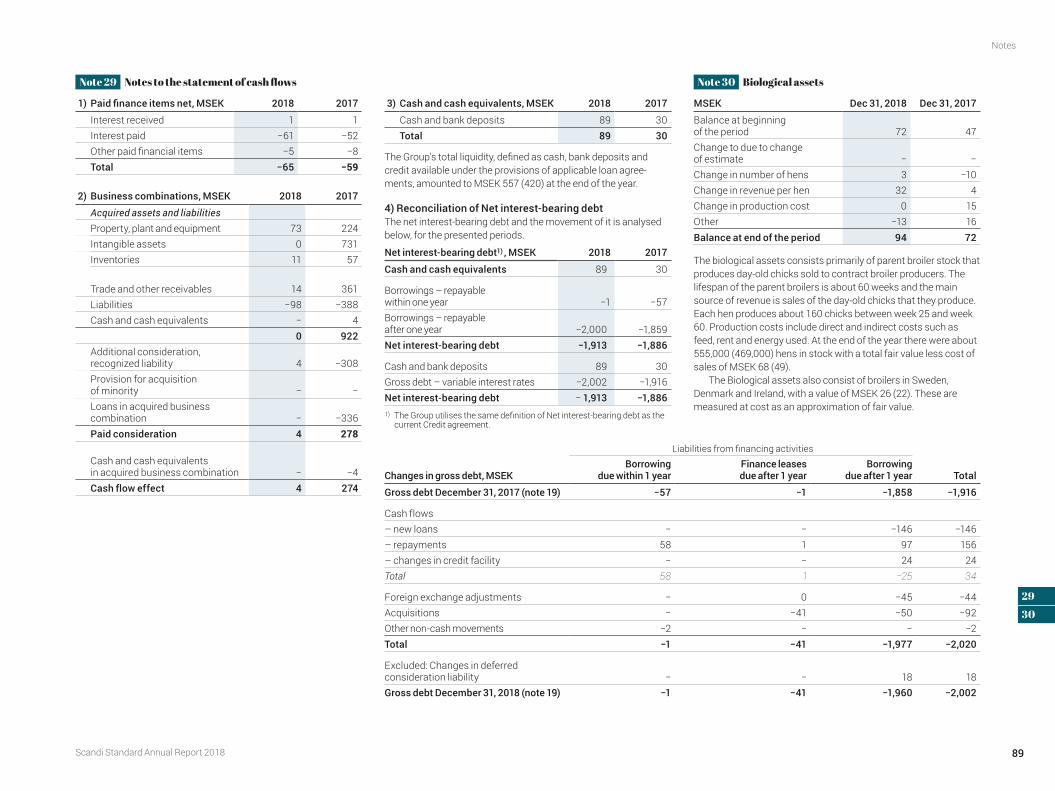
Note 30 Biological assets
MSEK Dec 31, 2018 Dec 31, 2017
Balance at beginning of the period 72 47Change to due to change of estimate − −Change in number of hens 3 −10Change in revenue per hen 32 4Change in production cost 0 15Other −13 16Balance at end of the period 94 72
The biological assets consists primarily of parent broiler stock that produces day-old chicks sold to contract broiler producers. The lifespan of the parent broilers is about 60 weeks and the main source of revenue is sales of the day-old chicks that they produce. Each hen produces about 160 chicks between week 25 and week 60. Production costs include direct and indirect costs such as feed, rent and energy used. At the end of the year there were about 555,000 (469,000) hens in stock with a total fair value less cost of sales of MSEK 68 (49).
The Biological assets also consist of broilers in Sweden, Denmark and Ireland, with a value of MSEK 26 (22). These are measured at cost as an approximation of fair value.
Note 29 Notes to the statement of cash flows
1) Paid finance items net, MSEK 2018 2017
Interest received 1 1Interest paid −61 −52Other paid financial items −5 −8Total −65 −59
2) Business combinations, MSEK 2018 2017
Acquired assets and liabilitiesProperty, plant and equipment 73 224Intangible assets 0 731Inventories 11 57
Trade and other receivables 14 361Liabilities −98 −388Cash and cash equivalents − 4
0 922Additional consideration, recognized liability 4 −308Provision for acquisition of minority − −Loans in acquired business combination − −336Paid consideration 4 278
Cash and cash equivalents in acquired business combination − −4Cash flow effect 4 274
3) Cash and cash equivalents, MSEK 2018 2017
Cash and bank deposits 89 30Total 89 30
The Group’s total liquidity, defined as cash, bank deposits and credit available under the provisions of applicable loan agree-ments, amounted to MSEK 557 (420) at the end of the year.
4) Reconciliation of Net interest-bearing debtThe net interest-bearing debt and the movement of it is analysed below, for the presented periods.
Net interest-bearing debt1) , MSEK 2018 2017
Cash and cash equivalents 89 30
Borrowings – repayable within one year −1 −57Borrowings – repayable after one year −2,000 −1,859Net interest-bearing debt −1,913 −1,886
Cash and bank deposits 89 30Gross debt – variable interest rates −2,002 −1,916Net interest-bearing debt − 1,913 −1,8861) The Group utilises the same definition of Net interest-bearing debt as the
current Credit agreement.
Liabilities from financing activities
Changes in gross debt, MSEKBorrowing
due within 1 yearFinance leases due after 1 year
Borrowing due after 1 year Total
Gross debt December 31, 2017 (note 19) −57 −1 −1,858 −1,916
Cash flows– new loans − − −146 −146– repayments 58 1 97 156– changes in credit facility − − 24 24Total 58 1 −25 34
Foreign exchange adjustments − 0 −45 −44Acquisitions − −41 −50 −92Other non-cash movements −2 − − −2Total −1 −41 −1,977 −2,020
Excluded: Changes in deferred consideration liability − − 18 18Gross debt December 31, 2018 (note 19) −1 −41 −1,960 −2,002
Scandi Standard Annual Report 2018
Notes
89
1
2
3
4
5
6
7
8
9
10
11
12
13
14
15
16
17
18
19
20
21
22
23
24
25
26
27
28
29
30
31
32
33
34
35
Note 31 Changes in accounting principles as of 2019
This note describes the effect on the Group’s financial statements by the application of IFRS 16 as of January 2019.
IFRS 16, Leases, published in January 2016 supersedes IAS 17, Leases. The standard is mandatory for financial years starting on or after 1 January 2019. It will result in almost all leases being recognized on the balance sheet, as the distinction between operating and financial leases is removed. The only exceptions are short-term (under 1 year) and low value (below 50 kSEK). The lease cost for those leases are disclosed separately. According to the new standard an asset (a right to use the leased item) and a financial liability to pay rentals are recognised. Associated depreci-ation expenses and interest expenses should be disclosed sepa-rately. Changes in estimated lease period, lease payments and similar may require revaluation of the right to use asset and lease liability in future periods.
The Group has during 2018 finalized the analysis of lease contracts affected by the new standard. The simplification to not test if an existing contract contains a lease or not at implementa-tion has been used.
The standard allows for several transition methods, and Scandi Standard has elected to use the full retrospective method where the accumulated effect of the transition is reported in the opening balance for 1 January 2018.
At the transition to IFRS 16, the Group is reporting leasing liabilities for leases previously reported as operating leases according to IAS 17, Leases. These liabilities are valued at the present value of future lease payments. In addition, when relevant, lease fees that have not been paid have been included, such as fixed and variable fees, amounts expected to be paid as residual value guarantees and penalties for premature terminations of the lease.
Changes will affect the Group’s accounting principles, which affects the accounting, valuation and presentation of certain amounts in the financial statements. The effects are disclosed below, where the restated financial reports for the full years and the quarters of 2018 are disclosed.
Since the transition to IFRS 16 results in reporting of operating lease commitments as liabilities in the statement of financial position, this means that the value of pledged assets and contin-gent liabilities will be reduced compared to what is disclosed in this annual report in Note 28, Pledged assets and contingent liabilities.
The operating leases that will be reported in Scandi Standard’s balance sheet as a consequence of IFRS 16 mainly refers to land and buildings (offices and production facilities), transportation (cars, fork lifts and trucks) and other equipment (such as IT and other office equipment).
The following accounting principles will be applied as of the implementation of IFRS 16 on 1 January 2019:As of 1 January 2019, the majority of the Group’s leases will be reported in the balance sheet and the standard will therefore impact the classification of the Group’s operating leases. Exceptions, according to the standard’s simplification rules, are short-term leases (shorter than one year) and low value leases (below 50 KSEK).
The Group shall test whether a contract contains a lease by investigating if the contract, for a compensation, gives the control of the use of an asset during a period. At the start of the lease, a right-of-use asset (the right to use a lease object) and a financial liability to pay rents are recognized.
The right-of-use asset is initially valued at the value of the leasing liability adjusted for any lease payments paid before or on the initial date of the lease with the addition of any direct costs and the estimated cost of restoring the underlying asset.
The leasing liability includes the present value of the following lease payments:• Fixed fees,• Variable fees that is dependent on an index or price, initially
valued by using an index or price at the start date,• Amounts expected to be paid for residual value guarantees,• The strike price for an option to buy the asset if the lessee is
reasonably certain to exercise the option, and• Penalties that are paid upon cancellation, if the lease period
indicates that the lessee plans to cancel the lease.
When the lease period is determined, the company uses all available information impacting the incentive to utilize an exten-sion option, or to not use the option to cancel the lease. Extension options are only included in the lease period if the lessee is reason-ably certain that the option will be exercised, and periods included in an option to cancel are only included in the lease period if the lessee is reasonably certain to not use the option.
Revaluation of leasing liabilities is done when changes in future lease payments are caused by changes in an index or price or if the Group changes its estimate regarding buy-out, extension or cancellation of the lease agreement. The value of the right-of-use asset is also changed with the same amount.
The right-of-use asset is depreciated on a straight-line basis over the shortest of the useful life of the assets and the term of the lease. The right-of-use asset is adjusted for revaluation of the lease liability and any write downs. Depreciation and write-downs are disclosed separately.
The lease liability is initially estimated to the present value of future lease payments, discounted by the implicit interest rate of the agreement, or if difficult to identify, the marginal loan rate of the Group. In general, the marginal loan rate is used. Interest costs are disclosed separately.
The Group has elected to not report right-of-use assets and lease liabilities for short term agreements (lease term up to twelve months) and leased assets with a low underlying value. Lease expenses for these leases are reported over the lease period and the amounts are disclosed separately in the financial statements.
Revenues from any sub-lease of assets are disclosed sepa-rately.
The change in accounting principles means that the compari-son numbers for 2018 have to be restated according to the new principles for leasing applied under IFRS 16. The restated amounts for the full year and individual quarters 2018 are disclosed below. Items that are not affected are not included, which means that subtotals and totals cannot be calculated from the information in the tables.
Scandi Standard Annual Report 2018
Notes
90
1
2
3
4
5
6
7
8
9
10
11
12
13
14
15
16
17
18
19
20
21
22
23
24
25
26
27
28
29
30
31
32
33
34
35

Impact on the comparison figures in the future financial statements as a result of changes in accounting principles as of January 1, 2019 The adjustments recognized for each line item are shown below for the full year and the quarters of 2018. Parts of the line items that are not affected by the changes have not been included. As a result, the sub-totals and totals disclosed cannot be recalculated from the numbers provided.
Consolidated income statement MSEK
According present
policies Q1 2018
Restate-ment
IFRS 16Restated Q1 2018
According present
policies Q2 2018
Restate-ment
IFRS 16Restated Q2 2018
According present
policies Q3 2018
Restate-ment
IFRS 16Restated Q3 2018
According present
policies Q4 2018
Restate-ment
IFRS 16Restated Q4 2018
According present policies
2018
Resta- ted
2018Restated
2018
Net sales 2,116 − 2,116 2,252 − 2,252 2,263 − 2,263 2,166 − 2,166 8,797 − 8,797Other operating revenues 8 − 8 24 − 24 11 0 11 0 −1 −1 43 −1 42Depreciation, amortisa-tion and impairment –68 –19 −87 –70 −20 −90 –73 −27 −100 –32 −22 –54 –242 −89 –331Other operating expenses –296 22 −274 –325 23 −303 –309 29 −280 –282 26 –256 –1,212 99 –1,113Operating income 80 2 82 67 2 69 87 2 89 89 3 91 323 9 333Financial income 0 − 0 0 − 0 1 0 1 0 0 0 1 0 1Financial expenses –25 –4 −29 –27 −4 −31 –20 −3 −23 –15 −3 –17 –87 −13 –100Income after finance net 55 −2 53 40 −1 39 68 −1 67 74 0 74 237 −4 233Tax on income for the year –11 0 −11 –7 0 −7 –15 0 −14 –1 0 –1 –33 1 –33Income for the year 44 −2 42 33 −1 32 53 −1 52 73 0 74 204 −3 200Whereoff attributable to: Shareholders of the parent company 44 −2 42 33 −1 32 53 −1 52 72 0 73 202 −3 199Non-controlling interests − − − − − − 0 0 0 1 − 1 1 0 1Average number of shares 65,233,578 65,233,578 65,268,959 65,268,959 65,318,465 65,318,465 65,318,465 65,318,465 65,285,191 65,285,191Earnings per share before dilution, SEK 0.67 0.65 0.51 0.49 0.82 0.80 1.10 1.13 3.10 3.07Earnings per share after dilution, SEK 0.67 0.65 0.51 0.49 0.82 0.80 1.10 1.13 3.10 3.07
Segment reporting MSEK
According present
policies Q1 2018
Restate-ment
IFRS 16Restated Q1 2018
According present
policies Q2 2018
Restate-ment
IFRS 16Restated Q2 2018
According present
policies Q3 2018
Restate-ment
IFRS 16Restated Q3 2018
According present
policies Q4 2018
Restate-ment
IFRS 16Restated Q4 2018
According present policies
2018
Restate-ment
IFRS 16Restated
2018
Adjusted operating income per segmentSweden 31 1 32 28 1 28 35 0 35 42 1 43 136 2 138Denmark 22 0 22 22 0 22 28 0 28 19 0 19 91 1 92Norway 26 1 27 33 2 35 30 2 31 36 2 38 125 6 131Ireland 20 0 20 27 0 27 23 0 23 26 0 26 96 0 96Finland –5 0 −5 –4 0 −4 –3 0 −3 0 0 0 –13 0 −13Group-wide –14 0 −14 –15 0 −15 –13 0 −13 –21 0 −21 –64 0 −64Adjusted operating income 80 2 82 90 2 93 100 2 102 102 3 104 372 9 381Non-comparable items − − −23 − −23 −12 − −12 –13 − −13 –49 − −49
Operating income 80 2 82 67 2 70 87 2 89 89 3 91 323 9 333
Scandi Standard Annual Report 2018
Notes
91
1
2
3
4
5
6
7
8
9
10
11
12
13
14
15
16
17
18
19
20
21
22
23
24
25
26
27
28
29
30
31
32
33
34
35
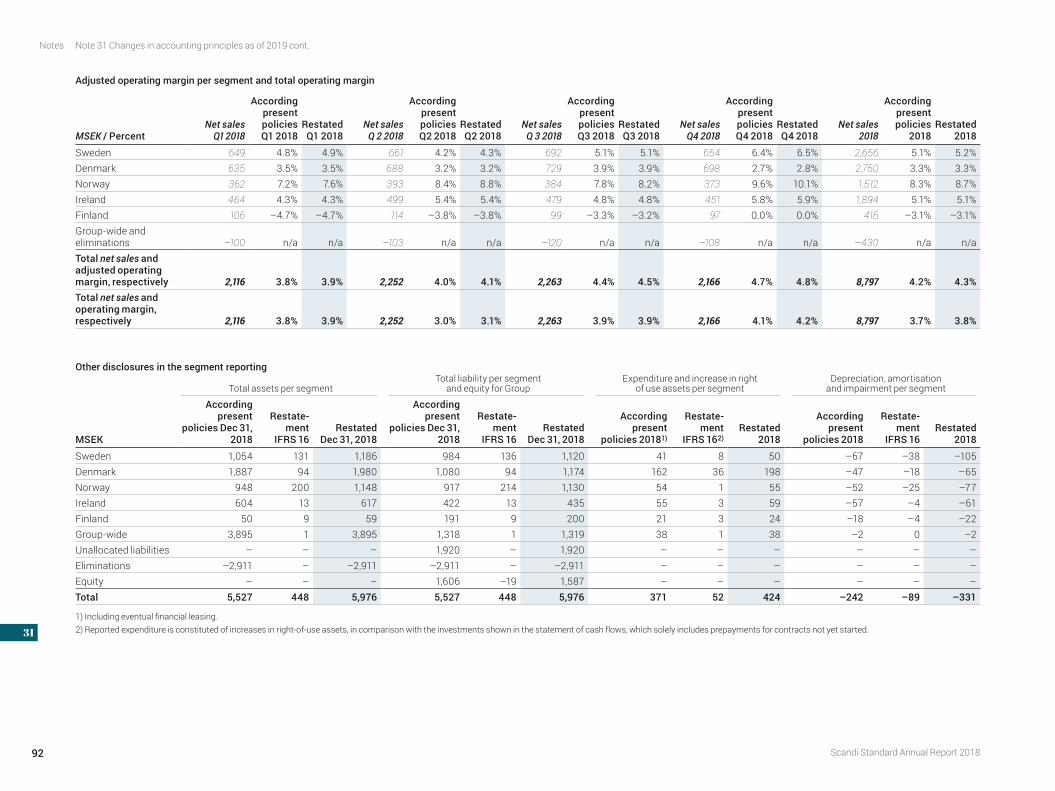
Other disclosures in the segment reporting
Total assets per segmentTotal liability per segment
and equity for Group Expenditure and increase in right
of use assets per segmentDepreciation, amortisation
and impairment per segment
MSEK
According present
policies Dec 31, 2018
Restate-ment
IFRS 16Restated
Dec 31, 2018
According present
policies Dec 31, 2018
Restate-ment
IFRS 16Restated
Dec 31, 2018
According present
policies 20181)
Restate-ment
IFRS 162)Restated
2018
According present
policies 2018
Restate-ment
IFRS 16Restated
2018
Sweden 1,054 131 1,186 984 136 1,120 41 8 50 –67 –38 –105Denmark 1,887 94 1,980 1,080 94 1,174 162 36 198 –47 –18 –65Norway 948 200 1,148 917 214 1,130 54 1 55 –52 –25 –77Ireland 604 13 617 422 13 435 55 3 59 –57 –4 –61Finland 50 9 59 191 9 200 21 3 24 –18 –4 –22Group-wide 3,895 1 3,895 1,318 1 1,319 38 1 38 –2 0 –2Unallocated liabilities – – – 1,920 – 1,920 – – – – – –Eliminations –2,911 – –2,911 –2,911 – –2,911 – – – – – –Equity – – – 1,606 –19 1,587 – – – – – –Total 5,527 448 5,976 5,527 448 5,976 371 52 424 –242 –89 –331
1) Including eventual financial leasing.2) Reported expenditure is constituted of increases in right-of-use assets, in comparison with the investments shown in the statement of cash flows, which solely includes prepayments for contracts not yet started.
Note 31 Changes in accounting principles as of 2019 cont.
Adjusted operating margin per segment and total operating margin
MSEK / PercentNet sales
Q1 2018
According present policies Q1 2018
Restated Q1 2018
Net sales Q 2 2018
According present policies Q2 2018
Restated Q2 2018
Net sales Q 3 2018
According present policies Q3 2018
Restated Q3 2018
Net sales Q4 2018
According present policies Q4 2018
Restated Q4 2018
Net sales 2018
According present policies
2018Restated
2018
Sweden 649 4.8% 4.9% 661 4.2% 4.3% 692 5.1% 5.1% 654 6.4% 6.5% 2,656 5.1% 5.2%Denmark 635 3.5% 3.5% 688 3.2% 3.2% 729 3.9% 3.9% 698 2.7% 2.8% 2,750 3.3% 3.3%Norway 362 7.2% 7.6% 393 8.4% 8.8% 384 7.8% 8.2% 373 9.6% 10.1% 1,512 8.3% 8.7%Ireland 464 4.3% 4.3% 499 5.4% 5.4% 479 4.8% 4.8% 451 5.8% 5.9% 1,894 5.1% 5.1%Finland 106 –4.7% –4.7% 114 –3.8% –3.8% 99 –3.3% –3.2% 97 0.0% 0.0% 416 –3.1% –3.1%Group-wide and eliminations –100 n/a n/a –103 n/a n/a –120 n/a n/a –108 n/a n/a –430 n/a n/aTotal net sales and adjusted operating margin, respectively 2,116 3.8% 3.9% 2,252 4.0% 4.1% 2,263 4.4% 4.5% 2,166 4.7% 4.8% 8,797 4.2% 4.3%Total net sales and operating margin, respectively 2,116 3.8% 3.9% 2,252 3.0% 3.1% 2,263 3.9% 3.9% 2,166 4.1% 4.2% 8,797 3.7% 3.8%
Scandi Standard Annual Report 2018
Notes
92
1
2
3
4
5
6
7
8
9
10
11
12
13
14
15
16
17
18
19
20
21
22
23
24
25
26
27
28
29
30
31
32
33
34
35

Consolidated statement of financial position
MSEK
According present policies
Jan 1, 2018
Restate-ment
IFRS 16
Restated Jan 1, 2018
According present policies Mar 31,
2018
Restate-ment
IFRS 16
Restated Mar 31,
2018
According present policies Jun 30,
2018
Restate-ment
IFRS 16
Restated Jun 30,
2018
According present policies Sep 30,
2018
Restate-ment
IFRS 16
Restated Sep 30,
2018
According present policies Dec 31,
2018
Restate-ment
IFRS 16
Restated Dec 31,
2018
ASSETSNon-current assetsRight-of-use assets − 428 428 − 441 441 − 462 462 − 515 515 − 486 486Property, plant and equipment 1,245 −1 1,244 1,324 −1 1,323 1,421 −16 1,405 1,531 −58 1,473 1,537 −56 1,481Non-current leasing receivables − − − − − − − − − − 11 11 − 10 10Deferred tax assets 40 5 45 43 5 48 45 5 50 58 6 64 50 5 55Total non-current assets 3,238 431 3,670 3,389 445 3,834 3,513 451 3,964 3,624 474 4,097 3,549 446 3,996
Current assetsCurrent leasing receivables − − − − 0 − − − − − 2 2 − 2 2Total current assets 1,915 − 1,915 1,968 0 1,969 2,023 0 2,023 2,016 2 2,018 1,978 2 1,980TOTAL ASSETS 5,153 431 5,585 5,357 445 5,802 5,536 451 5,987 5,640 476 6,115 5,527 448 5,976
EQUITY AND LIABILITIESRetained earnings 409 −16 393 450 −17 433 427 −18 409 483 −19 464 612 −19 593Capital and reserves attributable to owners 1,455 −16 1,439 1,589 −17 1,572 1,537 −18 1,519 1,583 −19 1,564 1,604 −19 1,586Non-controlling interests − − − − − − − − − 19 − 19 1 – 1Total equity 1,455 −16 1,439 1,589 −17 1,572 1,537 −18 1,519 1,602 −19 1,583 1,606 −19 1,587
LIABILITIESNon-current liabilitiesNon-current leasing liabilities 1 370 371 1 380 380 0 385 386 41 405 446 41 381 421Total non-current liabilities 2,373 370 2,743 2,496 380 2,876 2,414 385 2,799 2,420 405 2,825 2,413 381 2,794
Current liabilitiesCurrent leasing liabilities − 67 67 − 72 72 − 74 74 − 80 80 0 76 76Accrued expenses and prepaid income 306 10 316 310 10 320 332 10 342 321 10 331 342 11 353Total current liabilities 1,326 77 1,403 1,272 82 1,354 1,585 84 1,670 1,618 90 1,708 1,509 86 1,595
TOTAL EQUITY AND LIABILITIES 5,153 431 5,585 5,357 445 5,802 5,536 451 5,987 5,640 476 6,115 5,527 448 5,976
Scandi Standard Annual Report 2018
Notes
93
1
2
3
4
5
6
7
8
9
10
11
12
13
14
15
16
17
18
19
20
21
22
23
24
25
26
27
28
29
30
31
32
33
34
35

Consolidated statement of cash flows
MSEK
According present policies Q1 2018
Restate-ment
IFRS 16Restated Q1 2018
According present policies Q2 2018
Restate-ment
IFRS 16Restated Q2 2018
According present policies Q3 2018
Restate-ment
IFRS 16Restated Q3 2018
According present policies Q4 2018
Restate-ment
IFRS 16Restated Q4 2018
According present policies
2018
Restate-ment
IFRS 16Restated
2018
OPERATING ACTIVITIESOperating income 80 2 82 67 2 69 87 2 89 89 3 92 323 10 333Adjustments for non-cash items 72 19 91 99 20 119 48 27 75 25 22 47 244 89 333Paid finance items, net –16 –3 –19 –15 –3 –18 –18 –3 –22 –15 –3 –19 –65 –13 –78Cash flow from operating activities before change in operating capital 117 19 136 117 20 137 111 26 137 75 22 96 419 86 505
Change in operating receivables 36 0 36 –34 0 –34 –18 1 –17 71 0 71 55 1 56Change in operating payables –75 0 –75 98 0 98 –39 –5 –44 124 0 124 108 –5 103Changes i working capital 81 0 81 72 0 72 –6 –5 –11 132 1 133 162 –4 157
Cash flow from operating activities 198 19 217 189 20 209 105 21 126 207 22 229 581 82 663
INVESTING ACTIVITIESInvestments in right-of-use assets – 0 0 – 0 0 – –1 –1 – 0 0 – –1 –1Cash flows used in investing activities –90 0 –90 –142 0 –142 –109 –1 –110 –34 0 –34 –375 –1 –376
FINANCING ACTIVITIESPayments for amortisation of leasing liabilities – –18 –18 – –20 –20 – –20 –20 – –22 –22 – –81 –81Cash flows in financing activities 47 –18 29 –35 –20 –55 41 –20 21 –205 –22 –227 –152 –81 –232
Cash flows for the period 38 – 38 12 – 12 36 – 36 –32 – –32 54 – 54
Cash and cash equivalents at the end of the period 70 – 70 84 – 84 118 – 118 89 – 89 89 – 89
Note 31 Changes in accounting principles as of 2019 cont.
Scandi Standard Annual Report 2018
Notes
94
1
2
3
4
5
6
7
8
9
10
11
12
13
14
15
16
17
18
19
20
21
22
23
24
25
26
27
28
29
30
31
32
33
34
35
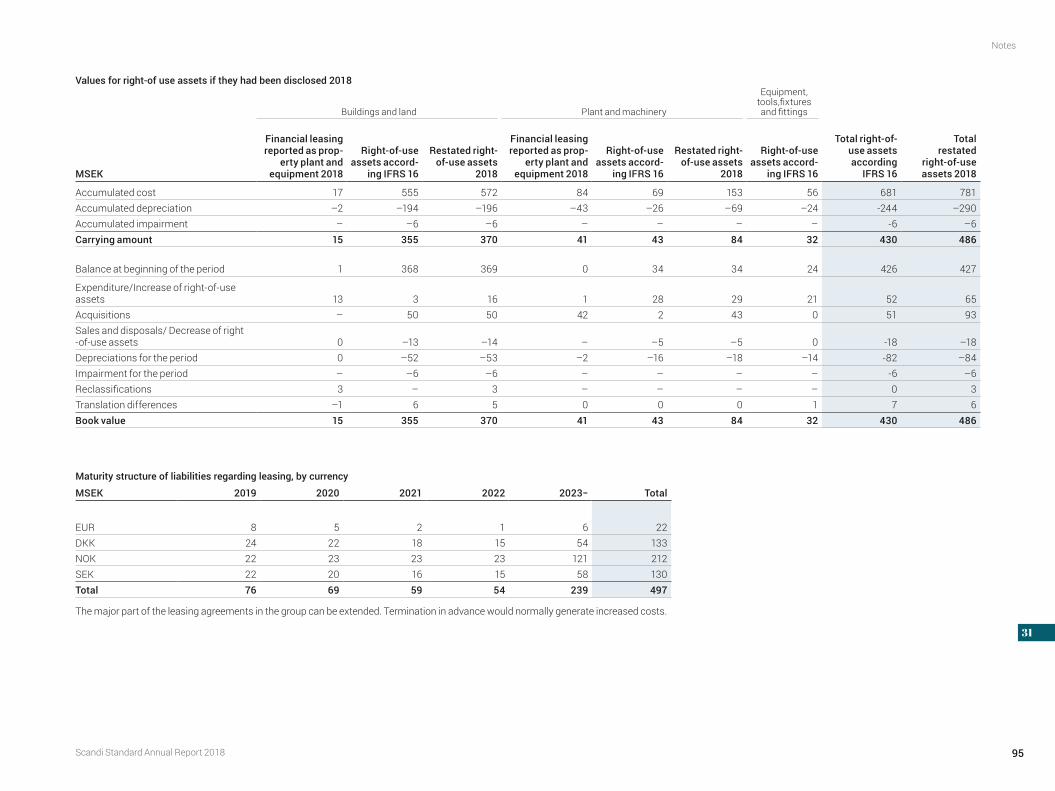
Maturity structure of liabilities regarding leasing, by currency
MSEK 2019 2020 2021 2022 2023− Total
EUR 8 5 2 1 6 22DKK 24 22 18 15 54 133NOK 22 23 23 23 121 212SEK 22 20 16 15 58 130Total 76 69 59 54 239 497
The major part of the leasing agreements in the group can be extended. Termination in advance would normally generate increased costs.
Values for right-of use assets if they had been disclosed 2018
Buildings and land Plant and machinery
Equipment, tools,fixtures and fittings
MSEK
Financial leasing reported as prop-
erty plant and equipment 2018
Right-of-use assets accord-
ing IFRS 16
Restated right-of-use assets
2018
Financial leasing reported as prop-
erty plant and equipment 2018
Right-of-use assets accord-
ing IFRS 16
Restated right-of-use assets
2018
Right-of-use assets accord-
ing IFRS 16
Total right-of-use assets according
IFRS 16
Total restated
right-of-use assets 2018
Accumulated cost 17 555 572 84 69 153 56 681 781Accumulated depreciation –2 –194 –196 –43 –26 –69 –24 -244 –290Accumulated impairment – –6 –6 – – – – -6 –6Carrying amount 15 355 370 41 43 84 32 430 486
Balance at beginning of the period 1 368 369 0 34 34 24 426 427
Expenditure/Increase of right-of-use assets 13 3 16 1 28 29 21 52 65Acquisitions – 50 50 42 2 43 0 51 93Sales and disposals/ Decrease of right -of-use assets 0 –13 –14 – –5 –5 0 -18 –18Depreciations for the period 0 –52 –53 –2 –16 –18 –14 -82 –84Impairment for the period – –6 –6 – – – – -6 –6Reclassifications 3 – 3 – – – – 0 3Translation differences –1 6 5 0 0 0 1 7 6Book value 15 355 370 41 43 84 32 430 486
Scandi Standard Annual Report 2018
Notes
95
1
2
3
4
5
6
7
8
9
10
11
12
13
14
15
16
17
18
19
20
21
22
23
24
25
26
27
28
29
30
31
32
33
34
35
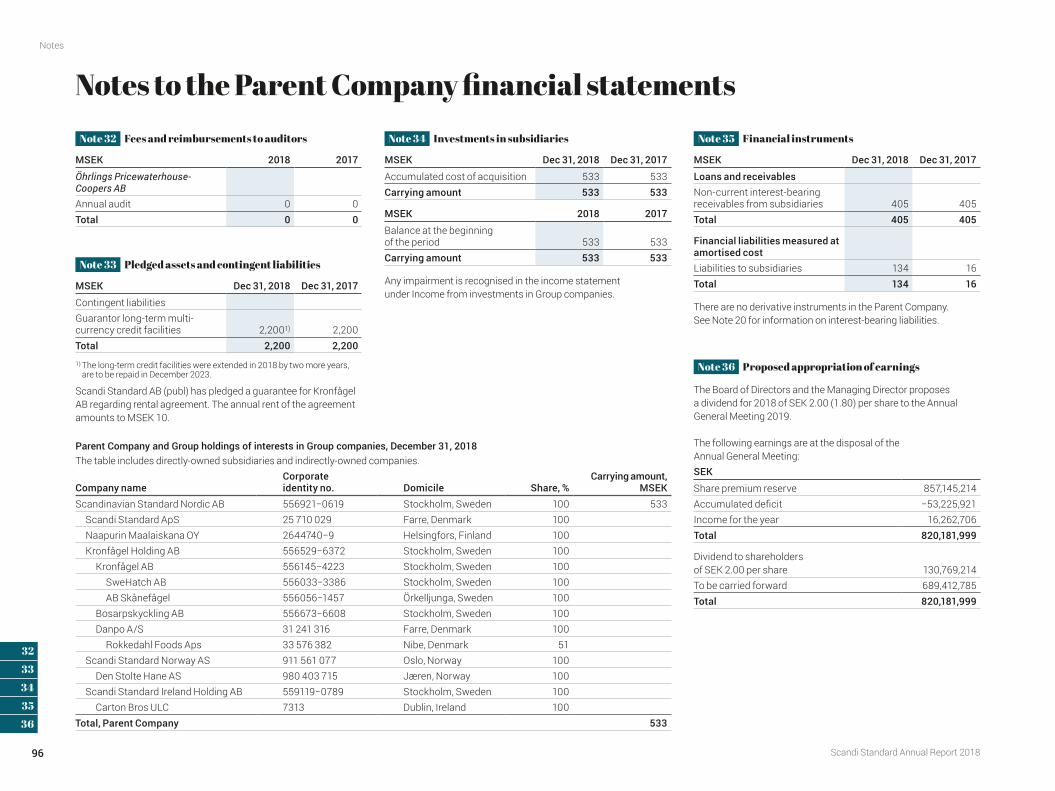
Parent Company and Group holdings of interests in Group companies, December 31, 2018 The table includes directly-owned subsidiaries and indirectly-owned companies.
Company nameCorporate identity no. Domicile Share, %
Carrying amount, MSEK
Scandinavian Standard Nordic AB 556921−0619 Stockholm, Sweden 100 533 Scandi Standard ApS 25 710 029 Farre, Denmark 100 Naapurin Maalaiskana OY 2644740−9 Helsingfors, Finland 100 Kronfågel Holding AB 556529−6372 Stockholm, Sweden 100 Kronfågel AB 556145−4223 Stockholm, Sweden 100 SweHatch AB 556033−3386 Stockholm, Sweden 100 AB Skånefågel 556056−1457 Örkelljunga, Sweden 100 Bosarpskyckling AB 556673−6608 Stockholm, Sweden 100 Danpo A/S 31 241 316 Farre, Denmark 100 Rokkedahl Foods Aps 33 576 382 Nibe, Denmark 51 Scandi Standard Norway AS 911 561 077 Oslo, Norway 100 Den Stolte Hane AS 980 403 715 Jæren, Norway 100 Scandi Standard Ireland Holding AB 559119−0789 Stockholm, Sweden 100 Carton Bros ULC 7313 Dublin, Ireland 100Total, Parent Company 533
Note 35 Financial instruments
MSEK Dec 31, 2018 Dec 31, 2017
Loans and receivables Non-current interest-bearing receivables from subsidiaries 405 405Total 405 405
Financial liabilities measured at amortised cost Liabilities to subsidiaries 134 16Total 134 16
There are no derivative instruments in the Parent Company. See Note 20 for information on interest-bearing liabilities.
Note 36 Proposed appropriation of earnings
The Board of Directors and the Managing Director proposes a dividend for 2018 of SEK 2.00 (1.80) per share to the Annual General Meeting 2019.
The following earnings are at the disposal of the Annual General Meeting: SEK
Share premium reserve 857,145,214Accumulated deficit −53,225,921Income for the year 16,262,706Total 820,181,999
Dividend to shareholders of SEK 2.00 per share 130,769,214To be carried forward 689,412,785Total 820,181,999
Notes to the Parent Company financial statementsNote 32 Fees and reimbursements to auditors
MSEK 2018 2017
Öhrlings Pricewaterhouse-Coopers ABAnnual audit 0 0Total 0 0
Note 33 Pledged assets and contingent liabilities
MSEK Dec 31, 2018 Dec 31, 2017
Contingent liabilitiesGuarantor long-term multi-currency credit facilities 2,2001) 2,200Total 2,200 2,200
1) The long-term credit facilities were extended in 2018 by two more years, are to be repaid in December 2023.
Scandi Standard AB (publ) has pledged a guarantee for Kronfågel AB regarding rental agreement. The annual rent of the agreement amounts to MSEK 10.
Note 34 Investments in subsidiaries
MSEK Dec 31, 2018 Dec 31, 2017
Accumulated cost of acquisition 533 533Carrying amount 533 533
MSEK 2018 2017
Balance at the beginning of the period 533 533Carrying amount 533 533
Any impairment is recognised in the income statement under Income from investments in Group companies.
Scandi Standard Annual Report 2018
Notes
96
1
2
3
4
5
6
7
8
9
10
11
12
13
14
15
16
17
18
19
20
21
22
23
24
25
26
27
28
29
30
31
32
33
34
35
36
Proposed appropriation of earnings and the Board of Directors’ and the Managing Director’s certification
The following earnings are at the disposal of the Annual General Meeting:SEK
Share premium reserve 857,145,214Accumulated deficit −53,225,921Income for the year 16,262,706Total 820,181,999
SEK
Dividend to shareholders of SEK 2.00 per share 130,769,214To be carried forward 689,412,785Total 820,181,999
The Board of Directors and the Managing Director and CEO hereby certify that the consolidated finan-cial statements have been prepared in accordance with International Financial Reporting Standards as adopted by the European Union and give a true and fair view of the Group’s financial position and per-formance. The Parent Company’s financial statements have been prepared in accordance with gener-ally accepted accounting principles, and give a true and fair view of the Parent Company’s financial position and performance.
The Board of Directors’ Report for the Group and Parent Company provides a true and fair overview of the development, financial position and performance of the Group and Parent Company, and describes significant risks and uncertainties faced by the Parent Company and Group companies.
Heléne VibbleusBoard member
Karsten SlotteBoard member
Michael ParkerBoard member
Øystein EngebretsenBoard member
The Group’s and Parent Company’s annual financial statements will be presented for adoption by the Annual General Meeting on 9 May 2019.Our audit report was submitted on 2 April 2019.
Öhrlings PricewaterhouseCoopers AB
Bo LagerströmAuthorized Public Accountant
Leif Bergvall HansenManaging Director and CEO
Vincent CartonBoard member
Gunilla AschanBoard member
Per HarkjærChairman of the Board
Stockholm, 2 April 2019
Scandi Standard Annual Report 2018
Proposed appropriation of earnings and the Board of Directors’ and the Managing Director’s certifica
97
Auditor’s reportTo the Annual General Meeting of Scandi Standard AB (publ), Corporate Identity Number 556921−0627
Report on the audit of the annual accounts and consolidated accounts
OpinionsWe have audited the annual accounts and consolidated accounts of Scandi Standard AB for the year 2018. The annual accounts and consolidated accounts of the company are included in on pages 44–97 of this document.
In our opinion, the annual accounts have been prepared in accordance with the Annual Accounts Act and present fairly, in all material respects, the financial position of the Parent Company as at 31 December 2018 and of its financial performance and cash flows for the year then ended, in accordance with the Annual Accounts Act. The consolidated accounts have been prepared in accordance with the Annual Accounts Act and present fairly, in all material respects, the financial position of the Group as at 31 December 2018 and of its financial performance and cash flows for the year then ended, in accordance with International Financial Reporting Standards (IFRS), as adopted by the EU, and the Annual Accounts Act. The statutory administration report is consistent with the other parts of the annual accounts and consolidated accounts.
We, therefore, recommend that the general meeting of share-holders adopts the income statement and statement of financial position for the Parent Company and for the Group.
Our opinions in this report on the annual accounts and consoli-dated accounts are consistent with the content of the additional report that has been submitted to the parent company’s audit committee in accordance with the Audit Regulation (537/2014) Article 11.
Basis for opinion We conducted our audit in accordance with International Stand-ards on Auditing (ISA) and generally accepted auditing standards in Sweden. Our responsibilities according to these standards are further described in the Auditor´s Responsibility section. We are independent of the parent company and the group in accordance with professional ethics for accountants in Sweden and have otherwise fulfilled tour ethical responsibilities in accordance with these requirements. This includes that, based on the best of our knowledge and belief, no prohibited services referred to in the Audit Regulation (537/2014) Article 5.1 have been provided to the
audited company or its controlled companies within the EU.We believe that the audit evidence we have obtained is suffi-
cient and appropriate to provide a basis for our opinions.
Our audit approachScope of the auditWe designed our audit by determining materiality and assessing the risks of material misstatement in the consolidated financial statements. In particular, we considered where management made subjective judgments; for example, in respect of significant accounting estimates that involved making assumptions and considering future events that are inherently uncertain. As in all of our audits, we also addressed the risk of management override of internal controls, including among other matters consideration of whether there was evidence of bias that represented a risk of material misstatement due to fraud.
We tailored the scope of our audit in order to perform sufficient work to enable us to provide an opinion on the consolidated finan-cial statements as a whole, taking into account the structure of the Group, the accounting processes and controls, and the industry in which the Group operates.
Our group audit includes 15 reporting units operating in four countries in the Nordic region and the Republic of Ireland. The operations are managed and monitored country by country in Sweden, Denmark, Norway, Finland and the Republic of Ireland. We have therefore scoped our audit procedures for the reporting units within each country, taking into account the current control environment and business processes at the individual reporting unit level and also by assessing business performance reviews and Group management’s oversight and follow-up activities on each unit.
In establishing the overall group audit strategy and plan, we determined the type of work that needed to be performed at the reporting unit respectively by the component auditors. For the most significant entities we required a full audit on their complete financial information.
The group consolidation, financial statement disclosures, a number of complex transactions, and Swedish entities were audited by the Group engagement team. These procedures
include among others impairment test of Goodwill and other intangible assets with indefinite life, long-term incentive program for management, business combinations and pension obligations.
The entities in scope for the Group audit procedures represent approximately 90 percentage of Group net sales.
Our audit is carried out continuously throughout the year. For the interim report covering the period January 1 to September 30, 2018, we issue a public limited review report. In connection with the issuance of the interim reports for the third quarter and year-end, we report our observations to Group management and the Audit Committee.
We also report our main observations to the entire Board of Directors when the annual financial statements have been prepared.
MaterialityThe scope of our audit was influenced by our application of materi-ality. An audit is designed to obtain reasonable assurance whether the financial statements are free from material misstatement. Mis-statements may arise due to fraud or error. They are considered material if, individually or in aggregate, they could reasonably be expected to influence the economic decisions of users taken on the basis of the consolidated financial statements.
Based on our professional judgment, we determined certain quantitative thresholds for materiality, including the overall group materiality for the consolidated financial statements as a whole. These, together with qualitative considerations, helped us to determine the scope of our audit and the nature, timing and extent of our audit procedures and to evaluate the effect of misstate-ments, both individually and in aggregate on the financial state-ments as a whole.
Key Audit MattersKey audit matters of the audit are those matters that, in our profes-sional judgment, were of most significance in our audit of the annual accounts and consolidated accounts of the current period. These matters were addressed in the context of our audit of, and in forming our opinion thereon, the annual accounts and consol as a whole, but we do not provide a separate opinion on these matters.
Scandi Standard Annual Report 2018
Auditor’s report
98
Valuation of inventories Refer to the Annual Report Note 15 – Inventories and Accounting policiesInventory of frozen chicken and processed products is held at a few locations in the Group and amounts to SEK 655 million as at December 31, 2018. Inventory is a significant asset in the consoli-dated balance sheet.
It is arduous to perform accurate accounting and recognition of the acquisition cost for the reason that the manufacturing process includes a large variety of products. Production calculations require a number of judgments necessary by management that have consequences to the inventory values recognised.
Inventory valuation, including making proper write-downs when necessary, is therefore a signifi-cant area in our audit.
Our audit included an assessment of the Group’s accounting policy for provision of obsolescence, analytical procedures and inquiries with controllers and detailed tests of significant inventory accounts.
We have tested controls regarding the methods applied in determining product calculations for finished goods, inward and outward deliveries from the inventory, and the monitoring undertaken to ensure that stock-taking takes place at all inventory sites and that inventory differences are investigated.
We have performed price tests of the inventory stock of frozen chicken products. We have walked through management’s monitoring controls of slow-moving items and management’s assessment of obsolescence.
We have participated in stock-takings and performed our own control stock-takings to verify existence and test obsolescence.
Our audit procedures at year-end focused on assessing the remaining risk of write-downs and evaluating management’s assessment for write-downs made.
Key audit matter How our audit addressed the Key audit matter
Our audit included a number of audit procedures to verify that the business combination has been recognised according to applicable accounting policies and that the impairment tests of Goodwill and other intangible assets with indefinite life have been performed by the use of generally accepted valua-tion methods, are mathematically correct, and by the use of reasonable asumptions of, among others, future cash-flow estimates and discount rates.
In our audit we have performed, among others, the following procedures:• tested the purchase price allocation for the acquisition of Rokkedahl to assess the fair value of the
identified assets and liabilities• evaluated significant assumptions in the impairment tests of Goodwill and other intangible assets
with indefinite life• verified the management’s assumptions and forecasts of future cash-flows to the budgets and
forecasts consistent with the business plans and verified that assumptions in the budgets and fore-casts are consistent with the management’s strategic plans and intentions and also with minutes from the Board of Directors meetings,
• evaluated management’s sensitivity analysis of changes in the assumptions that could lead to impairment.
Recognition of business combination and valuation of related goodwill and intangible assetsRefer to the Annual Report Note 6 – Depreciation, amortization and impairment of intangible assets and property, plant and equipment, Note 12 – intangible assets and Note 27 – Acquired operations and Accounting policies.
The recognition of a business combination requires the use of significant estimates and judgments by the management to identify the fair value of the acquired assets and liabilities.
In periods following an acquisition, Goodwill and other intangible assets with indefinite life related to the acquisition shall be tested annually for impairment by management. The impairment tests require the use of significant estimates and judgments by the management to identify and determine the Group’s cash-generating units and to assess future revenues, profit, working capital, investments and discount rate.
The carrying value of Goodwill amounts to SEK 922 million as of December 31, 2018. Intangible assets with indefinite life comprise various brand names acquired in Sweden, Denmark and Norway. The carrying value of brands with indefinite life amounts to SEK 326 million as of December 31, 2018. Goodwill and brands are significant intangible assets in the consolidated statement of financial posi-tion. No impairment charge has been recognised against goodwill or brand names with indefinite life in 2018.
Scandi Standard Annual Report 2018
Auditor’s report
99

Other information than the annual accounts and consolidated accountsThis document also contains other information than the annual accounts and consolidated accounts which is found on pages 1–43 and pages 102–105 and page 118.
The Board of Directors and Managing Director are responsible for this other information.
Our opinion on the annual accounts and consolidated accounts does not cover the other information and we do not express any form of assurance conclusion regarding this other information.
In connection with our audit of the annual accounts and con-solidated accounts, our responsibility is to read the information identified above and consider whether the information is materi-ally inconsistent with the annual accounts and consolidated accounts. In this procedure we also take into account our knowl-edge otherwise obtained in the audit and assess whether the information otherwise appears to be materially misstated.
If we, based on the work performed concerning this informa-tion, conclude that there is a material misstatement of this other information, we are required to report that fact. We have nothing to report in this regard.
Responsibilities of the Board of Directors and the Managing DirectorThe Board of Directors and Managing Director are responsible for the preparation of the annual accounts and consolidated accounts and that they give a fair presentation in accordance with the Annual Accounts Act and, concerning the consolidated accounts, in accordance with IFRS as adopted by the EU. The Board of Direc-tors and Managing Director are also responsible for such internal controls as they determine is necessary to enable the preparation of annual accounts and consolidated accounts that are free from material misstatement, whether due to fraud or error.
In preparing the annual accounts and consolidated accounts, the Board of Directors and the Managing Director are responsible for the assessment of the company’s and the group’s ability to continue as a going concern. They disclose, as applicable, matters related to going concern and using the going concern basis of accounting. The going concern basis of accounting is however not applied if the Board of Directors and the Managing Director intend to liquidate the company, to cease operations, or has no realistic alternative but to do so.
The Audit Committee shall, without prejudice to the Board of Directors’ responsibilities and tasks in general, among other things oversee the company’s financial reporting process.
Auditor’s Responsibilities Our objectives are to obtain reasonable assurance about whether the annual accounts and consolidated accounts as a whole are free from material misstatement, whether due to fraud or error, and to issue an auditor’s report that includes our opinions. Rea-sonable assurance is a high level of assurance, but is not a guaran-tee that an audit conducted in accordance with ISA and generally accepted auditing standards in Sweden will always detect a mate-rial misstatements when it exists. Misstatements can arise from fraud or error and are considered material if, individually or in the aggregate, they could reasonably be expected to influence the eco-nomic decisions of users taken on the basis of these annual accounts and consolidated accounts.
A further description of our responsibility for the audit of the annual accounts and consolidated accounts is available on Revi-sorsnämnden’s website: www.revisorsinspektionen.se/revisorn-sansvar. This description is part of the auditor’s report.
Scandi Standard Annual Report 2018
Auditor’s report
100
Report on other legal and regulatory requirements
OpinionsIn addition to our audit of the annual accounts and con solidated accounts, we have also audited the administration of the Board of Directors and the Managing Director of Scandi Standard AB (Publ) for the year 2018 and the proposed appropria-tions of the company’s profit or loss.
We recommend to the Annual General Meeting of shareholders that the profit be appropriated in accordance with the proposal in the statutory administration report and that the members of the Board of Directors and the Managing Director be discharged from liability for the financial year.
Basis for opinionsWe conducted the audit in accordance with generally accepted auditing standards in Sweden. Our responsibilities under to those standards are further described in the Auditor’s Responsibilities section. We are independent of the parent company and the group in accordance with professional ethics for accountants in Sweden and have otherwise fulfilled our ethical responsibilities in accord-ance with these requirements.
We believe that the audit evidence we have obtained is suffi-cient and appropriate to provide a basis for our opinions.
Responsibilities of the Board of Directors and Managing DirectorThe Board of Directors is responsible for the proposal for appropri-ations of the company’s profit or loss. At the proposal of dividend, this includes an assessment of whether the dividend is justifiable
considering the requirements which the company’s and the group’s type of operations, size and risks place on the size of the parent company’s and the group’s equity, consolidation require-ments, liquidity and position in general.
The Board of Directors is responsible for the company’s organi-sation and the administration of the company’s affairs. This includes among other things continuous assessment of the com-pany’s and the group’s financial situation and ensuring that the company’s organisation is designed so that the accounting, man-agement of assets and the company’s financial affairs otherwise are controlled in a reassuring manner. The Managing Director shall manage ongoing administration according to the Board of Direc-tors’ guidelines and instructions and for among other matters take measures that are necessary to fulfil the company’s accounting in accordance with law and handle the management of assets in a reassuring manner.
Auditor’s ResponsibilitiesOur objective concerning the audit of the administration and, thereby our opinion about discharge from liability, is to obtain audit evidence to assess with a reasonable degree of assurance whether any member of the Board of Directors or the Managing Director in any material respect:• has undertaken any action or been guilty of any omission which
can give rise to liability to the company, or• in any other way has acted in contravention of the
Companies Act, the Annual Accounts Act or the Articles of Association.
Our objective concerning the audit of the proposed appropriations of the company’s profit or loss, and thereby our opinion about this, is to assess with reasonable degree of assurance whether the proposal is in accordance with the Companies Act.
Reasonable assurance is a high level of assurance, but is not a guarantee that an audit conducted in accordance with generally accepted auditing standards in Sweden will always detect actions or omissions that can give rise to liability to the company, or that the proposed appropriations of the company’s profit or loss are not in accordance with the Companies Act.
A further description of our responsibility for the audit of the administration is available on Revisorsinspektionen’s website: www.revisorsinspektionen.se/revisornsansvar. This description is part of the auditor’s report.
Öhrlings PricewaterhouseCoopers AB was appointed auditor of Scandi Standard AB (publ) by the Annual General Meeting of the shareholders on the 22 May 2018 and has been the company’s auditor since the 9 September 2013.
Stockholm, 2 April 2019Öhrlings PricewaterhouseCoopers AB
Bo LagerströmAuthorized Public Accountant
Scandi Standard Annual Report 2018
Auditor’s report
101

MSEK, unless otherwise stated 2018 2017 2016 2015
Net sales 8,797 7,101 5,967 5,423EBITDA 563 525 438 445Operating income 323 295 238 260Income for the year 204 168 131 164EPS, SEK 3.10 2.73 2.21 2.73
Adjusted EBITDA1) 620 559 452 477Adjusted EBITDA-marginl1), % 7.1 7.9 7.6 8.8Adjusted operating income1) 372 329 252 292Adjusted operating margin1), % 4.2 4.6 4.2 5.4Dividend, SEK 2.002) 1.80 1.35 1.80
Operating cash flow 357 213 126 324Capital expenditure, net 371 199 265 206Adjusted return on capital employed (ROCE)1), % 10.6 11.1 10.3 12.7Equity to assets ratio, % 29.0 28.2 27.8 29.4Average number of employees 3,005 2,264 1,680 1,670
1) Adjusted for non-comparable items, see table to the right.2) Proposed by the Board.
Non-comparable items in EBITDAand operating income 2018 2017 2016 2015
Staff reduction costsa) −1 −2 −4 −Write down of inventoryb) − − −7 −Financial support to associated company c) − − − −7Transaction costsd) −11 −25 −2 −25Restructuring of productione) −42 −19 − −Revaluation of contingent considerationf) − 30 − −Costs related to fireg) − −4 − −Costs for cancellation of leasing contracth) − −15 − −Other −3 − − −
Total non-comparable items in EBITDA − 57 −34 −13 −32
Effect of changes in est life expectancy of fixed assetsi) 8 − − −
Total non-comparable items in operating income − 49 −34 −13 −32
a) Staff reduction costs in Sweden in the second quarter 2018, fourth quarter 2017 and in Denmark in the fourth quarter 2016.
b) Write down of inventory in Denmark.c) Financial support to associated company Farmfood A/S.d) Transaction costs for completed and non-completed acquisitions, as well as costs related to the formation
of the Scandi Standard Group. e) Restructuring of and changes in production in Sweden.f) Revaluation of contingent consideration in connection with the acquisition of the remaining
20 percent of the shares in Sødams in Denmark.g) Costs related to a fire in Sødams’ facility in Denmark.h) Costs for cancellation of leasing contract and project costs in Sweden. i) Effect of changes in estimated useful life of fixed assets related to previous periods.
Four year summary
Scandi Standard Annual Report 2018
Four year summary
102
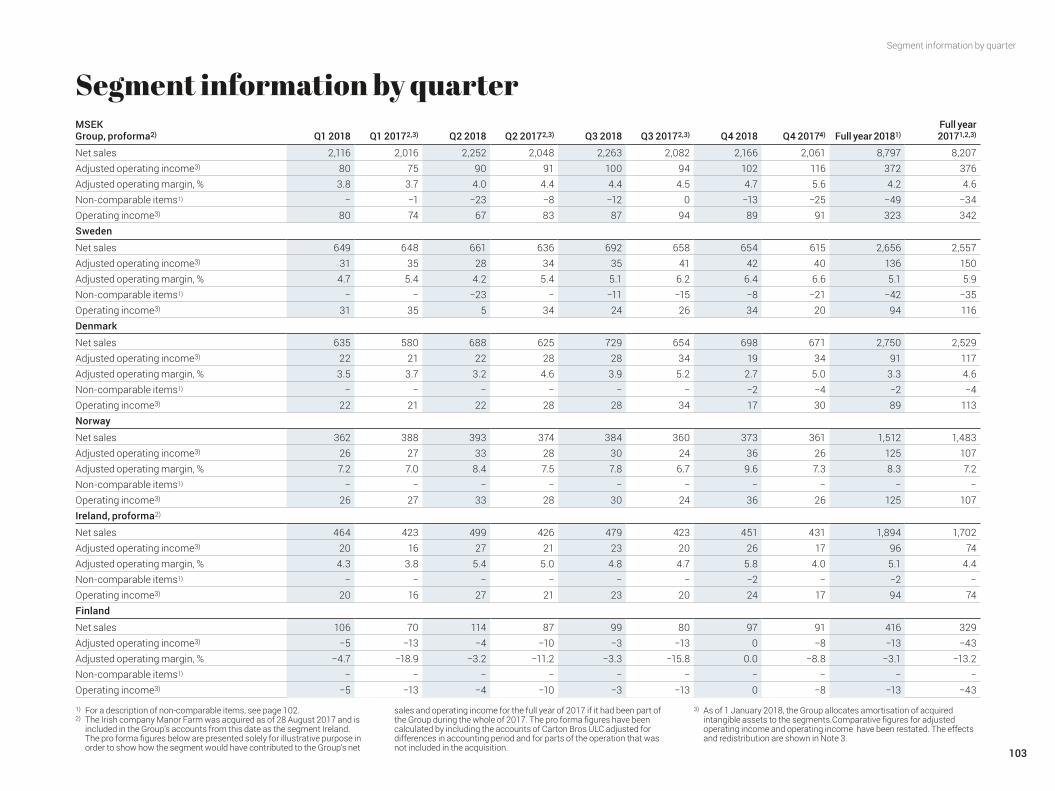
MSEKGroup, proforma2) Q1 2018 Q1 20172,3) Q2 2018 Q2 20172,3) Q3 2018 Q3 20172,3) Q4 2018 Q4 20174) Full year 20181)
Full year 20171,2,3)
Net sales 2,116 2,016 2,252 2,048 2,263 2,082 2,166 2,061 8,797 8,207Adjusted operating income3) 80 75 90 91 100 94 102 116 372 376Adjusted operating margin, % 3.8 3.7 4.0 4.4 4.4 4.5 4.7 5.6 4.2 4.6Non-comparable items1) − −1 −23 −8 −12 0 −13 −25 −49 −34Operating income3) 80 74 67 83 87 94 89 91 323 342Sweden
Net sales 649 648 661 636 692 658 654 615 2,656 2,557Adjusted operating income3) 31 35 28 34 35 41 42 40 136 150Adjusted operating margin, % 4.7 5.4 4.2 5.4 5.1 6.2 6.4 6.6 5.1 5.9Non-comparable items1) − − −23 − −11 −15 −8 −21 −42 −35Operating income3) 31 35 5 34 24 26 34 20 94 116Denmark
Net sales 635 580 688 625 729 654 698 671 2,750 2,529Adjusted operating income3) 22 21 22 28 28 34 19 34 91 117Adjusted operating margin, % 3.5 3.7 3.2 4.6 3.9 5.2 2.7 5.0 3.3 4.6Non-comparable items1) − − − − − − −2 −4 −2 −4Operating income3) 22 21 22 28 28 34 17 30 89 113Norway
Net sales 362 388 393 374 384 360 373 361 1,512 1,483Adjusted operating income3) 26 27 33 28 30 24 36 26 125 107Adjusted operating margin, % 7.2 7.0 8.4 7.5 7.8 6.7 9.6 7.3 8.3 7.2Non-comparable items1) − − − − − − − − − −Operating income3) 26 27 33 28 30 24 36 26 125 107Ireland, proforma2)
Net sales 464 423 499 426 479 423 451 431 1,894 1,702Adjusted operating income3) 20 16 27 21 23 20 26 17 96 74Adjusted operating margin, % 4.3 3.8 5.4 5.0 4.8 4.7 5.8 4.0 5.1 4.4Non-comparable items1) − − − − − − −2 − −2 −Operating income3) 20 16 27 21 23 20 24 17 94 74Finland
Net sales 106 70 114 87 99 80 97 91 416 329Adjusted operating income3) −5 −13 −4 −10 −3 −13 0 −8 −13 −43Adjusted operating margin, % −4.7 −18.9 −3.2 −11.2 −3.3 −15.8 0.0 −8.8 −3.1 −13.2Non-comparable items1) − − − − − − − − − −Operating income3) −5 −13 −4 −10 −3 −13 0 −8 −13 −43
Segment information by quarter
1) For a description of non-comparable items, see page 102.2) The Irish company Manor Farm was acquired as of 28 August 2017 and is
included in the Group’s accounts from this date as the segment Ireland. The pro forma figures below are presented solely for illustrative purpose in order to show how the segment would have contributed to the Group’s net
sales and operating income for the full year of 2017 if it had been part of the Group during the whole of 2017. The pro forma figures have been calculated by including the accounts of Carton Bros ULC adjusted for differences in accounting period and for parts of the operation that was not included in the acquisition.
3) As of 1 January 2018, the Group allocates amortisation of acquired intangible assets to the segments.Comparative figures for adjusted operating income and operating income have been restated. The effects and redistribution are shown in Note 3.
Segment information by quarter
103
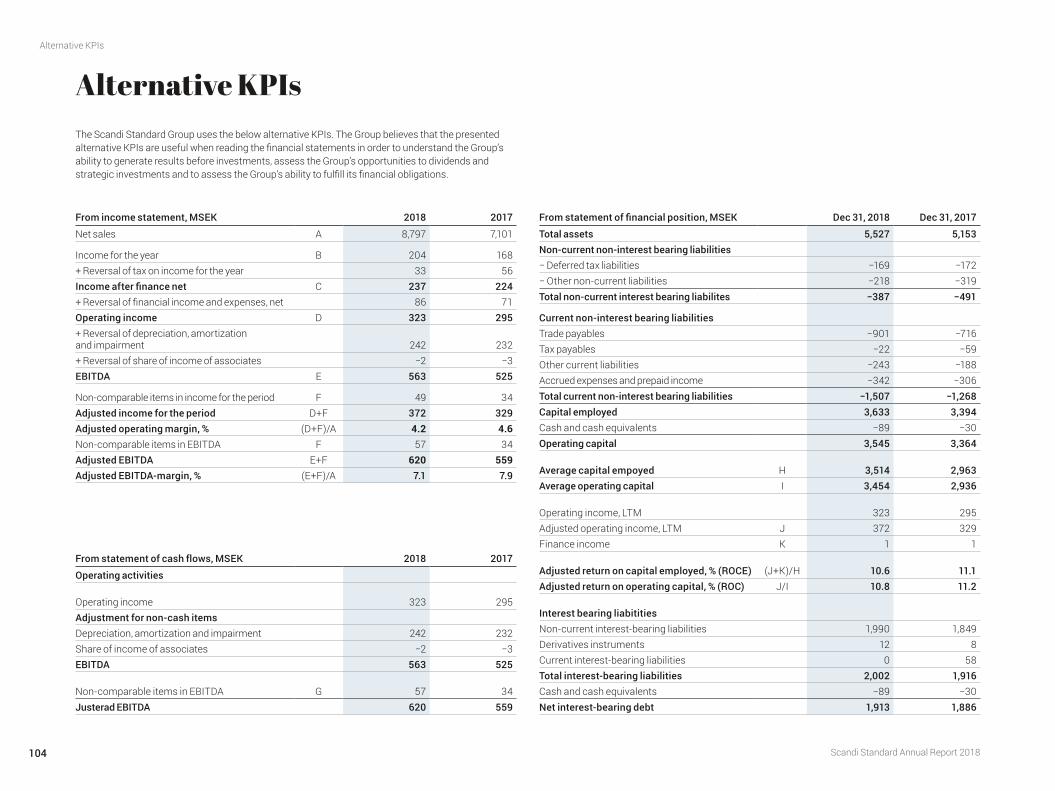
Alternative KPIs
From income statement, MSEK 2018 2017
Net sales A 8,797 7,101
Income for the year B 204 168+ Reversal of tax on income for the year 33 56Income after finance net C 237 224+ Reversal of financial income and expenses, net 86 71Operating income D 323 295+ Reversal of depreciation, amortization and impairment 242 232+ Reversal of share of income of associates −2 −3EBITDA E 563 525
Non-comparable items in income for the period F 49 34Adjusted income for the period D+F 372 329Adjusted operating margin, % (D+F)/A 4.2 4.6Non-comparable items in EBITDA F 57 34Adjusted EBITDA E+F 620 559Adjusted EBITDA-margin, % (E+F)/A 7.1 7.9
The Scandi Standard Group uses the below alternative KPIs. The Group believes that the presented alternative KPIs are useful when reading the financial statements in order to understand the Group’s ability to generate results before investments, assess the Group’s opportunities to dividends and strategic investments and to assess the Group’s ability to fulfill its financial obligations.
From statement of financial position, MSEK Dec 31, 2018 Dec 31, 2017
Total assets 5,527 5,153Non-current non-interest bearing liabilities− Deferred tax liabilities −169 −172− Other non-current liabilities −218 −319Total non-current interest bearing liabilites −387 −491
Current non-interest bearing liabilitiesTrade payables −901 −716Tax payables −22 −59Other current liabilities −243 −188Accrued expenses and prepaid income −342 −306Total current non-interest bearing liabilities −1,507 −1,268Capital employed 3,633 3,394Cash and cash equivalents −89 −30Operating capital 3,545 3,364
Average capital empoyed H 3,514 2,963Average operating capital I 3,454 2,936
Operating income, LTM 323 295Adjusted operating income, LTM J 372 329Finance income K 1 1
Adjusted return on capital employed, % (ROCE) (J+K)/H 10.6 11.1Adjusted return on operating capital, % (ROC) J/I 10.8 11.2
Interest bearing liabititiesNon-current interest-bearing liabilities 1,990 1,849Derivatives instruments 12 8Current interest-bearing liabilities 0 58Total interest-bearing liabilities 2,002 1,916Cash and cash equivalents −89 −30Net interest-bearing debt 1,913 1,886
From statement of cash flows, MSEK 2018 2017
Operating activities
Operating income 323 295Adjustment for non-cash itemsDepreciation, amortization and impairment 242 232Share of income of associates −2 −3EBITDA 563 525
Non-comparable items in EBITDA G 57 34Justerad EBITDA 620 559
Scandi Standard Annual Report 2018
Alternative KPIs
104
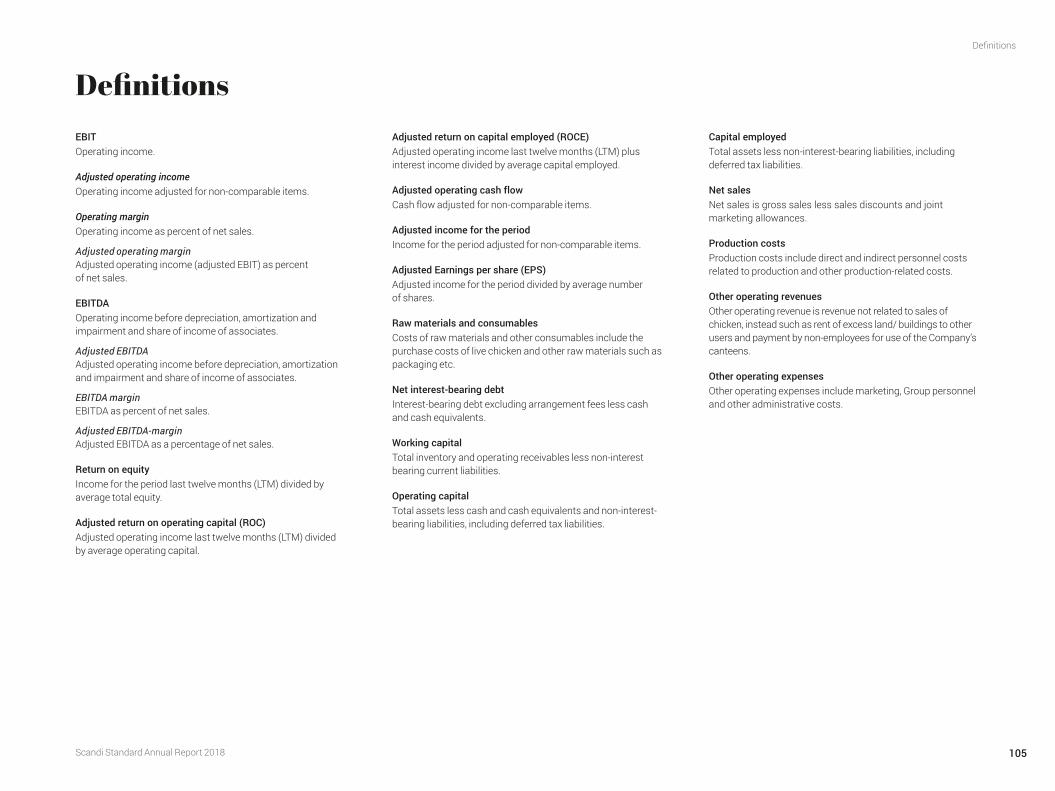
EBIT Operating income.
Adjusted operating income Operating income adjusted for non-comparable items.
Operating margin Operating income as percent of net sales.
Adjusted operating margin Adjusted operating income (adjusted EBIT) as percent of net sales.
EBITDAOperating income before depreciation, amortization and impairment and share of income of associates.
Adjusted EBITDAAdjusted operating income before depreciation, amortization and impairment and share of income of associates.
EBITDA margin EBITDA as percent of net sales.
Adjusted EBITDA-marginAdjusted EBITDA as a percentage of net sales.
Return on equityIncome for the period last twelve months (LTM) divided by average total equity.
Adjusted return on operating capital (ROC)Adjusted operating income last twelve months (LTM) divided by average operating capital.
Adjusted return on capital employed (ROCE)Adjusted operating income last twelve months (LTM) plus interest income divided by average capital employed.
Adjusted operating cash flowCash flow adjusted for non-comparable items.
Adjusted income for the periodIncome for the period adjusted for non-comparable items.
Adjusted Earnings per share (EPS)Adjusted income for the period divided by average number of shares.
Raw materials and consumables Costs of raw materials and other consumables include the purchase costs of live chicken and other raw materials such as packaging etc.
Net interest-bearing debtInterest-bearing debt excluding arrangement fees less cash and cash equivalents.
Working capitalTotal inventory and operating receivables less non-interest bearing current liabilities.
Operating capitalTotal assets less cash and cash equivalents and non- interest-bearing liabilities, including deferred tax liabilities.
Capital employedTotal assets less non-interest-bearing liabilities, including deferred tax liabilities.
Net sales Net sales is gross sales less sales discounts and joint marketing allowances.
Production costsProduction costs include direct and indirect personnel costs related to production and other production-related costs.
Other operating revenuesOther operating revenue is revenue not related to sales of chicken, instead such as rent of excess land/ buildings to other users and payment by non-employees for use of the Company’s canteens.
Other operating expenses Other operating expenses include marketing, Group personnel and other administrative costs.
Definitions
Scandi Standard Annual Report 2018
Definitions
105

Corporate governance reportCorporate governance within Scandi Standard aims to promote sustainable value creation for shareholders and a sound corporate culture where business opportunities are utilised within the framework of good risk control. This corporate governance report, which is a part of the Annual Report for 2018, has been prepared by the Board of Directors and has been examined by Scandi Standard’s external auditor. No deviations from the Swedish Corporate Governance Code are reported.
Scandi Standard AB (publ) (the Company) or the Company with subsidiaries (the Group or Scandi Standard) is a Swedish Public Limited Liability Company with its registered office in Stockholm. The Company’s shares have been listed on Nasdaq Stockholm since June 2014.
Responsibility for management and control of Scandi Stand-ard is distributed between the shareholders at the general meet-ings, the Board of Directors with appointed committees, and the Managing Director, pursuant to applicable laws and regulations, Scandi Standard’s Articles of Association, as well as internal codes, policies, instructions and manuals etc.
Share capital and shareholdersAs of 31 December 2018, the share capital amounted to SEK 659,663, represented by 66,060,890 shares with a quota value of SEK 0.009986 per share. Each share carries one vote. All shares have equal rights to Scandi Standard’s assets and profits.
The total number of shareholders as of 31 December 2018 was 5,594. Approximately 47 percent of the share capital was owned by foreigners. One owner, Investment AB Öresund, had more than 10 percent of the capital. The holding amounted to 11.8 percent on 31 December 2018. For more information on the share and share-holders, see pages 42–43.
General Meeting of shareholdersThe General Meeting of shareholders is Scandi Standard’s highest decision-making body through which shareholders exercise their rights to make decisions on Scandi Standard’s affairs. There are no restrictions on the shareholders’ rights in the Articles of Associ-ation or, as far as the Company is aware of, in any shareholders’ agreements.
Major external laws and regulations− Swedish Companies Act.− Swedish Annual Accounts Act. − Nasdaq Stockhom Rule Book for Issuers.− Swedish Corporate Governance Code.− Other Swedish and foreign laws and regulations.
Major internal steering documents− Articles of Association.− Procedure for the Board of Directors, Instruction for
the Managing Director, Instruction regarding financial reporting etc. − Code of Conduct.− Other codes, polices, instructions, manuals etc.
Proposals
Nomination Committee
Resolutions
Information
Shareholders by General Meeting
Board of Directors
Audit Committee
Remuneration Committee
External Auditor
Managing Director and Group Management
Elections
Information
Elections
Denmark Norway Ireland FinlandSweden
Governance structure
Scandi Standard Annual Report 2018
Corporate governance report
106
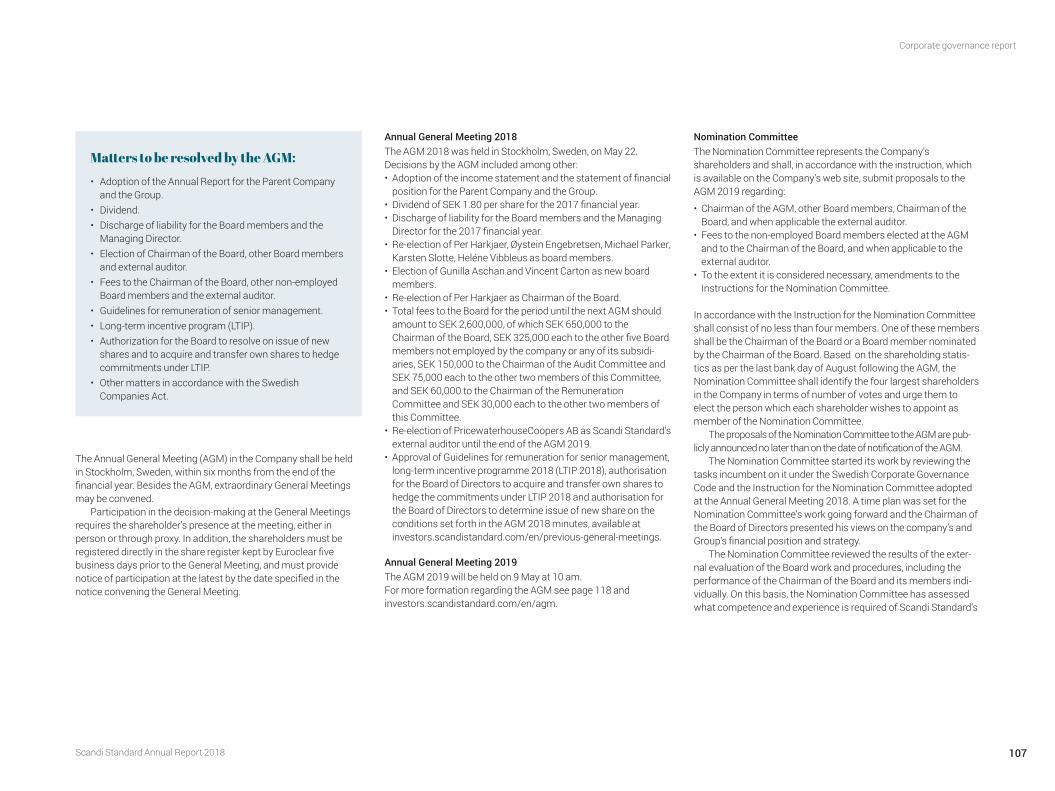
The Annual General Meeting (AGM) in the Company shall be held in Stockholm, Sweden, within six months from the end of the financial year. Besides the AGM, extraordinary General Meetings may be convened.
Participation in the decision-making at the General Meetings requires the shareholder’s presence at the meeting, either in person or through proxy. In addition, the shareholders must be registered directly in the share register kept by Euroclear five business days prior to the General Meeting, and must provide notice of participation at the latest by the date specified in the notice convening the General Meeting.
Matters to be resolved by the AGM:
• Adoption of the Annual Report for the Parent Company and the Group.
• Dividend.• Discharge of liability for the Board members and the
Managing Director. • Election of Chairman of the Board, other Board members
and external auditor.• Fees to the Chairman of the Board, other non-employed
Board members and the external auditor. • Guidelines for remuneration of senior management.• Long-term incentive program (LTIP). • Authorization for the Board to resolve on issue of new
shares and to acquire and transfer own shares to hedge commitments under LTIP.
• Other matters in accordance with the Swedish Companies Act.
Nomination CommitteeThe Nomination Committee represents the Company’s shareholders and shall, in accordance with the instruction, which is available on the Company’s web site, submit proposals to the AGM 2019 regarding:
• Chairman of the AGM, other Board members, Chairman of the Board, and when applicable the external auditor.
• Fees to the non-employed Board members elected at the AGM and to the Chairman of the Board, and when applicable to the external auditor.
• To the extent it is considered necessary, amendments to the Instructions for the Nomination Committee.
In accordance with the Instruction for the Nomination Committee shall consist of no less than four members. One of these members shall be the Chairman of the Board or a Board member nominated by the Chairman of the Board. Based on the shareholding statis-tics as per the last bank day of August following the AGM, the Nomination Committee shall identify the four largest shareholders in the Company in terms of number of votes and urge them to elect the person which each shareholder wishes to appoint as member of the Nomination Committee.
The proposals of the Nomination Committee to the AGM are pub-licly announced no later than on the date of notification of the AGM.
The Nomination Committee started its work by reviewing the tasks incumbent on it under the Swedish Corporate Governance Code and the Instruction for the Nomination Committee adopted at the Annual General Meeting 2018. A time plan was set for the Nomination Committee’s work going forward and the Chairman of the Board of Directors presented his views on the company’s and Group’s financial position and strategy.
The Nomination Committee reviewed the results of the exter-nal evaluation of the Board work and procedures, including the performance of the Chairman of the Board and its members indi-vidually. On this basis, the Nomination Committee has assessed what competence and experience is required of Scandi Standard’s
Annual General Meeting 2018The AGM 2018 was held in Stockholm, Sweden, on May 22. Decisions by the AGM included among other:• Adoption of the income statement and the statement of financial
position for the Parent Company and the Group.• Dividend of SEK 1.80 per share for the 2017 financial year.• Discharge of liability for the Board members and the Managing
Director for the 2017 financial year. • Re-election of Per Harkjaer, Øystein Engebretsen, Michael Parker,
Karsten Slotte, Heléne Vibbleus as board members. • Election of Gunilla Aschan and Vincent Carton as new board
members. • Re-election of Per Harkjaer as Chairman of the Board.• Total fees to the Board for the period until the next AGM should
amount to SEK 2,600,000, of which SEK 650,000 to the Chairman of the Board, SEK 325,000 each to the other five Board members not employed by the company or any of its subsidi-aries, SEK 150,000 to the Chairman of the Audit Committee and SEK 75,000 each to the other two members of this Committee, and SEK 60,000 to the Chairman of the Remuneration Committee and SEK 30,000 each to the other two members of this Committee.
• Re-election of PricewaterhouseCoopers AB as Scandi Standard’s external auditor until the end of the AGM 2019.
• Approval of Guidelines for remuneration for senior management, long-term incentive programme 2018 (LTIP 2018), authorisation for the Board of Directors to acquire and transfer own shares to hedge the commitments under LTIP 2018 and authorisation for the Board of Directors to determine issue of new share on the conditions set forth in the AGM 2018 minutes, available at investors.scandistandard.com/en/previous-general-meetings.
Annual General Meeting 2019 The AGM 2019 will be held on 9 May at 10 am. For more formation regarding the AGM see page 118 and investors.scandistandard.com/en/agm.
Scandi Standard Annual Report 2018
Corporate governance report
107
Nomination Committee for the 2019 AGM The names of the members of the Nomination Committee as set out below were announced in a press release on 1 October 2018.
Member Appointed by
Percent of share capital Dec 31, 2018
Percent of share capital Aug 31, 2018 Independent1)
Andreas Hofmann Investment AB Öresund, Ordförande 11.8 11.8 Yes/NoJustin Carton Carton Group ULC 9.1 9.1 No/YesViktor Henriksson Carnegie Fonder 5.9 5.7 Yes/YesUlf Zenk Lantmännen Animalieinvest AB 5.0 5.0 Yes/YesPer Harkjaer Chairman of the Board of Scandi Standard − − Yes/Yes
1) Refers to independence of the Company and its executive management and the Company’s major shareholders controlling, directly or indirectly, ten percent or more of the shares or votes in the Company.
Board members and evaluated the need for increased diversity on the Board in terms of age, gender, cultural/geographic background and ownership representation and has interviewed candidates for nomination as Board members. The Nomination Committee also had contacts with the Chairman of the Audit Committee to famil-iarize itself with the assessments made by the Company and the Audit Committee of the quality and efficiency of external auditor work. The Audit Committee also provided its recommendations on external auditor and auditor fees. The Nomination Committee also has been in contact with the external auditor regarding the cooper-ation with the Company and the Audit Committee. Prior to submit-ting their proposal to the AGM 2019, the Nomination Committee had held four meetings.
The Nomination Committee’s proposals to the AGM 2019 The proposals of the Nomination Committee to the 2019 AGM were announced in a press release in April 2019, which is available on the company’s website: http://investors.scandistandard.com/sv/. The proposals will be included in the notice convening the AGM, which is available on the website: investors.scandistandard.com/en/agm.
Diversity policyThe nomination committee applies Rule 4.1 of the Swedish Corpo-rate Governance Code as Board diversity policy. This means that when preparing its proposals to the AGM, the Nomination Commit-tee will consider that the Board of Directors is to have a composi-tion appropriate to Scandi Standard’s operations, phase of devel-opment and other relevant circumstances. The Board members elected by the AGM are collectively to exhibit diversity and breadth of qualifications, experience and background. The Nomination Committee is to strive for gender balance on the Board of Directors of Scandi Standard.
All Board assignments in Scandi Standard are to be based on merit with the prime consideration being to maintain and enhance the Board of Directors’ overall effectiveness. Within this, a broad set of qualities and competences is sought for and the Nomination Committee recognises that diversity (including age, gender, geo-graphical provenance and educational and professional back-
ground) is an important factor to take into consideration. In par-ticular, the Nomination Committee notes the necessity to increase the gender balance of the Board of Directors over time.
Board of DirectorsAccording to the Company’s Articles of Association, the Board of Directors shall consist of not less than three and not more than nine members, without deputy members. The AGM elects the Board members and the Chairman of the Board.
Until the AGM 2018, the Board comprised nine ordinary mem-bers, elected by the AGM 2017, and after the AGM 2018, seven ordi-nary members, elected by the AGM 2018, with no deputies and no employee representatives. All members are non-executive members. For more information on the Board of Directors, see pages 114–115.
Independence The Board is considered to be in compliance with the independ-ence requirements of the Swedish Corporate Governance Code in that the majority of the Board members are independent of the company and its management and at least two of these Board members also are independent of Scandi Standard’s major share-holders. See the table on page 110.
The Board’s tasks and responsibilities The Board of Directors is responsible for the organisation and management of the Company’s affairs. The Board’s responsibility and work are governed by laws and regulations as well as internal steering documents, including the Procedure for the Board of Directors. In addition, the General Meeting can provide instruc-tions.
The Procedure for the Board of Directors describes the Board’s tasks and responsibilities, the work of the Board including respon-sibility for the Chairman as well as responsibilities delegated to Committees appointed by the Board, Board meetings and informa-tion and reporting to the Board, insider trading, relations with Nasdaq Stockholm, information and reporting to the Board, and information about corporate governance. The Procedure is reviewed annually.
In addition to the inaugural Board meeting held in conjunction with the AGM, the Board shall meet at least six times a year.
The Board has established an Instruction for the Managing Director, including among other things specifications of issues requiring the Board’s approval and an instruction regarding finan-cial reporting to the Board.
Scandi Standard Annual Report 2018
Corporate governance report
108
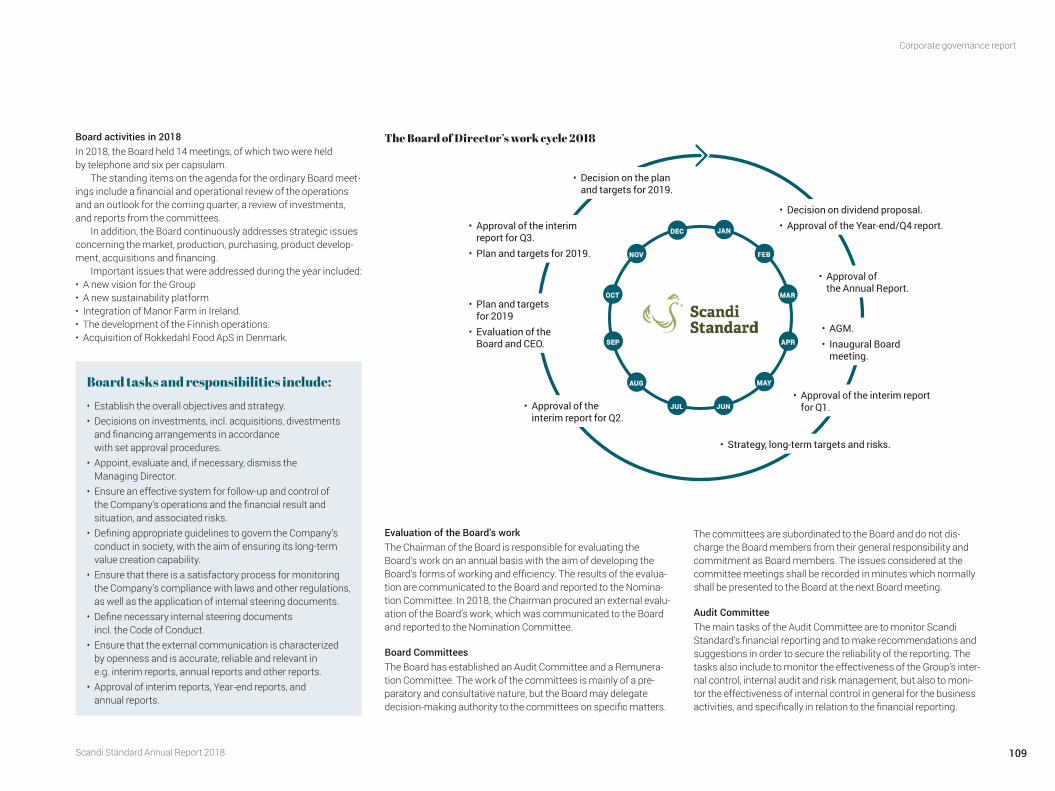
Board tasks and responsibilities include:
• Establish the overall objectives and strategy.• Decisions on investments, incl. acquisitions, divestments
and financing arrangements in accordance with set approval procedures.
• Appoint, evaluate and, if necessary, dismiss the Managing Director.
• Ensure an effective system for follow-up and control of the Company’s operations and the financial result and situation, and associated risks.
• Defining appropriate guidelines to govern the Company’s conduct in society, with the aim of ensuring its long-term value creation capability.
• Ensure that there is a satisfactory process for monitoring the Company’s compliance with laws and other regulations, as well as the application of internal steering documents.
• Define necessary internal steering documents incl. the Code of Conduct.
• Ensure that the external communication is characterized by openness and is accurate, reliable and relevant in e.g. interim reports, annual reports and other reports.
• Approval of interim reports, Year-end reports, and annual reports.
Board activities in 2018In 2018, the Board held 14 meetings, of which two were held by telephone and six per capsulam.
The standing items on the agenda for the ordinary Board meet-ings include a financial and operational review of the operations and an outlook for the coming quarter, a review of investments, and reports from the committees.
In addition, the Board continuously addresses strategic issues concerning the market, production, purchasing, product develop-ment, acquisitions and financing.
Important issues that were addressed during the year included:• A new vision for the Group• A new sustainability platform• Integration of Manor Farm in Ireland.• The development of the Finnish operations.• Acquisition of Rokkedahl Food ApS in Denmark.
Evaluation of the Board’s workThe Chairman of the Board is responsible for evaluating the Board’s work on an annual basis with the aim of developing the Board’s forms of working and efficiency. The results of the evalua-tion are communicated to the Board and reported to the Nomina-tion Committee. In 2018, the Chairman procured an external evalu-ation of the Board’s work, which was communicated to the Board and reported to the Nomination Committee.
Board CommitteesThe Board has established an Audit Committee and a Remunera-tion Committee. The work of the committees is mainly of a pre-paratory and consultative nature, but the Board may delegate decision-making authority to the committees on specific matters.
The committees are subordinated to the Board and do not dis-charge the Board members from their general responsibility and commitment as Board members. The issues considered at the committee meetings shall be recorded in minutes which normally shall be presented to the Board at the next Board meeting.
Audit CommitteeThe main tasks of the Audit Committee are to monitor Scandi Standard’s financial reporting and to make recommendations and suggestions in order to secure the reliability of the reporting. The tasks also include to monitor the effectiveness of the Group’s inter-nal control, internal audit and risk management, but also to moni-tor the effectiveness of internal control in general for the business activities, and specifically in relation to the financial reporting.
• Decision on dividend proposal.• Approval of the Year-end/Q4 report.
• Approval of the interim report for Q1.• Approval of the
interim report for Q2.
• Decision on the plan and targets for 2019.
• Strategy, long-term targets and risks.
• Approval of the Annual Report.
• Plan and targets for 2019
• Evaluation of the Board and CEO.
• Approval of the interim report for Q3.
• Plan and targets for 2019.
• AGM.• Inaugural Board
meeting.
JAN
JUL JUN
APR
MAR
FEB
DEC
NOV
OCT
SEP
AUG MAY
The Board of Director’s work cycle 2018
Scandi Standard Annual Report 2018
Corporate governance report
109
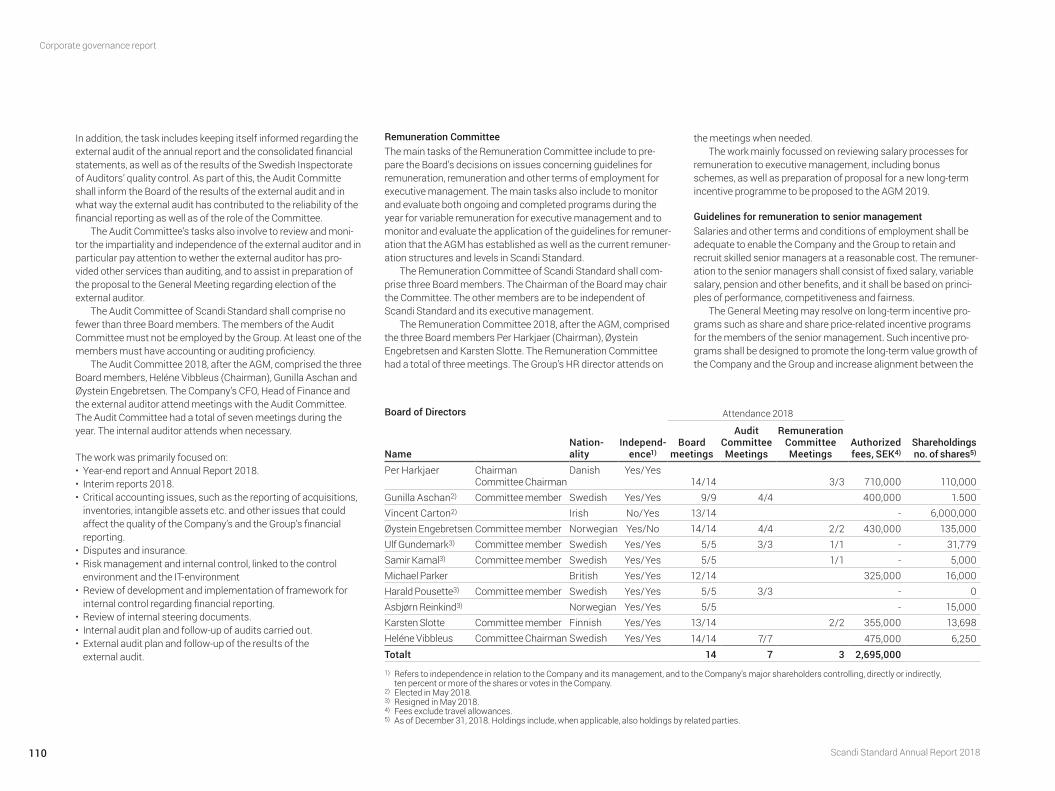
In addition, the task includes keeping itself informed regarding the external audit of the annual report and the consolidated financial statements, as well as of the results of the Swedish Inspectorate of Auditors’ quality control. As part of this, the Audit Committe shall inform the Board of the results of the external audit and in what way the external audit has contributed to the reliability of the financial reporting as well as of the role of the Committee.
The Audit Committee’s tasks also involve to review and moni-tor the impartiality and independence of the external auditor and in particular pay attention to wether the external auditor has pro-vided other services than auditing, and to assist in preparation of the proposal to the General Meeting regarding election of the external auditor.
The Audit Committee of Scandi Standard shall comprise no fewer than three Board members. The members of the Audit Committee must not be employed by the Group. At least one of the members must have accounting or auditing proficiency.
The Audit Committee 2018, after the AGM, comprised the three Board members, Heléne Vibbleus (Chairman), Gunilla Aschan and Øystein Engebretsen. The Company’s CFO, Head of Finance and the external auditor attend meetings with the Audit Committee. The Audit Committee had a total of seven meetings during the year. The internal auditor attends when necessary.
The work was primarily focused on:• Year-end report and Annual Report 2018.• Interim reports 2018.• Critical accounting issues, such as the reporting of acquisitions,
inventories, intangible assets etc. and other issues that could affect the quality of the Company’s and the Group’s financial reporting.
• Disputes and insurance.• Risk management and internal control, linked to the control
environment and the IT-environment• Review of development and implementation of framework for
internal control regarding financial reporting.• Review of internal steering documents.• Internal audit plan and follow-up of audits carried out.• External audit plan and follow-up of the results of the
external audit.
Remuneration Committee The main tasks of the Remuneration Committee include to pre-pare the Board’s decisions on issues concerning guidelines for remuneration, remuneration and other terms of employment for executive management. The main tasks also include to monitor and evaluate both ongoing and completed programs during the year for variable remuneration for executive management and to monitor and evaluate the application of the guidelines for remuner-ation that the AGM has established as well as the current remuner-ation structures and levels in Scandi Standard.
The Remuneration Committee of Scandi Standard shall com-prise three Board members. The Chairman of the Board may chair the Committee. The other members are to be independent of Scandi Standard and its executive management.
The Remuneration Committee 2018, after the AGM, comprised the three Board members Per Harkjaer (Chairman), Øystein Engebretsen and Karsten Slotte. The Remuneration Committee had a total of three meetings. The Group’s HR director attends on
the meetings when needed.The work mainly focussed on reviewing salary processes for
remuneration to executive management, including bonus schemes, as well as preparation of proposal for a new long-term incentive programme to be proposed to the AGM 2019.
Guidelines for remuneration to senior managementSalaries and other terms and conditions of employment shall be adequate to enable the Company and the Group to retain and recruit skilled senior managers at a reasonable cost. The remuner-ation to the senior managers shall consist of fixed salary, variable salary, pension and other benefits, and it shall be based on princi-ples of performance, competitiveness and fairness.
The General Meeting may resolve on long-term incentive pro-grams such as share and share price-related incentive programs for the members of the senior management. Such incentive pro-grams shall be designed to promote the long-term value growth of the Company and the Group and increase alignment between the
Board of Directors Attendance 2018
NameNation-ality
Independ-ence1)
Board meetings
Audit Committee Meetings
Remuneration Committee Meetings
Authorized fees, SEK4)
Share holdings no. of shares5)
Per Harkjaer ChairmanCommittee Chairman
Danish Yes/Yes14/14 3/3 710,000 110,000
Gunilla Aschan2) Committee member Swedish Yes/Yes 9/9 4/4 400,000 1.500 Vincent Carton2) Irish No/Yes 13/14 - 6,000,000 Øystein Engebretsen Committee member Norwegian Yes/No 14/14 4/4 2/2 430,000 135,000Ulf Gundemark3) Committee member Swedish Yes/Yes 5/5 3/3 1/1 - 31,779Samir Kamal3) Committee member Swedish Yes/Yes 5/5 1/1 - 5,000Michael Parker British Yes/Yes 12/14 325,000 16,000Harald Pousette3) Committee member Swedish Yes/Yes 5/5 3/3 - 0Asbjørn Reinkind3) Norwegian Yes/Yes 5/5 - 15,000Karsten Slotte Committee member Finnish Yes/Yes 13/14 2/2 355,000 13,698Heléne Vibbleus Committee Chairman Swedish Yes/Yes 14/14 7/7 475,000 6,250Totalt 14 7 3 2,695,000
1) Refers to independence in relation to the Company and its management, and to the Company’s major shareholders controlling, directly or indirectly, ten percent or more of the shares or votes in the Company.
2) Elected in May 2018.3) Resigned in May 2018.4) Fees exclude travel allowances.5) As of December 31, 2018. Holdings include, when applicable, also holdings by related parties.
Scandi Standard Annual Report 2018
Corporate governance report
110

interests of the participating individual and the company’s share-holders. The 2018 AGM resolved on a new long-term incentive programme (LTIP 2018), which is of the same kind as the previous programmes, LTIP 2016 and LTIP 2017.
For information about the guidelines for remuneration to sen-ior management and long-term incentive programmes, see the Report by the Board of Directors on pages 49–50 and Note 5.
Whistleblowing procedure A so-called whistleblowing procedure has been established since a few years, that makes it possible for employees and other stake-holders to anonymously report illegal or unethical behaviour that violates the Group’s code of conduct.
External auditor Scandi Standard’s external auditor is Öhrlings Pricewaterhouse-Coopers AB (PwC), elected at the AGM 2018 until the end of the AGM 2019, with Bo Lagerström as the Auditor in charge.
Bo Lagerström was born in 1966 and has been an authorised public accountant since 1997. He has no involvement in compa-nies related to the principal owners of Scandi Standard or with the management in Scandi Standard. For remuneration to the external auditor, see Note 7.
Internal control over financial reporting The Board is responsible for internal control and risk management in accordance with the Swedish Companies Act and the Swedish Corporate Governance Code. Below is the Board’s report on inter-nal control and risk management over financial reporting.
The description of the Group’s system of internal control and risk management with regards to financial reporting is based on the framework developed by the Committee of Sponsoring Organi-zations of the Treadway Commission (COSO). The framework comprises five integrated components; the control environment, risk assessment, control activities, information and communica-tion, and monitoring, as well as 17 fundamental principles related to the five components. The description below is limited to internal control and risk management over financial reporting.
Internal control over financial reporting aims to provide reason-able assurance of the reliability of external financial reporting in interim reports, full year reports and annual reports, and to ensure that external financial reporting is prepared in accordance with external laws, accounting standards and other requirements applicable to listed companies.
Control environment Internal control over financial reporting is based on the overall control environment. The control environment is the set of stand-ards, processes, and structures that provide the basis for carrying out internal control across the Group. The Board and Group Man-agement establish the tone at the top regarding the importance of internal control including expected standards of conduct of the employees. This involves integrity and ethical values, the parame-ters enabling the Board to carry out its oversight responsibilities, the organizational structure and assignment of responsibility and authority, the process for attracting, developing, and retaining competent employees, and the rigor around performance meas-ures, as well as incentives and rewards to drive accountability for performance. The resulting control environment has a pervasive impact on the overall system of internal control and risk manage-ment for the financial reporting. This is communicated in the form of internal steering documents such as:• Articles of Association.• Procedure for the Board of Directors.• Instruction for the Managing Director.• Instruction regarding financial reporting.• Code of Conduct.• Other codes, policies, instructions and manuals.
The control environment is also based on applicable external laws and regulations.
The Board has established a Procedure for its work and the Audit Committee and the Remuneration Committee. The main task of the Audit Committee includes to monitor Scandi Standard’s financial reporting and to make recommendations and sugges-tions in order to secure the reliability of the reporting. The task also includes to monitor the effectiveness of the Group’s internal con-trol, internal audit and risk management, and more specifically regarding the financial reporting in general for the business activi-ties. In addition, the task includes keeping itself informed regard-ing the external audit of the annual report and the consolidated financial statements, as well as of the results of the Swedish Inspectorate of Auditors’ quality control. As part of this, the Audit Committe’s work also includes to inform the Board of the results of the external audit and in what way the external audit has contrib-uted to the reliability of the financial reporting and the role of the Committee.
Responsibility for implementing the Board’s internal steering documents regarding internal control and risk management over
financial reporting, maintaining an effective control environment as well as the day-to-day work on internal control and risk manage-ment over financial reporting is delegated to the Managing Direc-tor. This responsibility is in turn delegated to managers within their specific areas of responsibility at various levels in the Group.
Responsibility and authority are defined by the Board in, among others, internal steering documents such as Instruction for the Managing Director stipulating resolutions that are subject to decision by the Board or the General Meeting of shareholders, Authority to sign for the Company and Delegated Authorities. The Board also approves, among others, the following internal steering documents; Instruction regarding financial reporting, Code of Conduct, Information Policy, Insider Policy, IT Security Policy, and Finance Policy. The Managing Director approves the Group’s Finance and Accounting Manual, which is available to all person-nel in finance and accounting. Based on the Board’s internal steer-ing documents, the Managing Director, the CFO and other manag-ers establish instructions and manuals to be implemented within their specific areas of responsibility.
These internal steering documents are reviewed and updated regularly with reference to for example changes in legislation, accounting standards, listing requirements and internal risk assessment. In 2018, a framework for internal control over finan-cial reporting has been developed and implemented. As part of this, efforts to strengthen the internal control over financial report-ing through formalised and documented internal processes and control activities have continued during the year, as well as making the financial reporting process and the accounting process more efficient.
Risk assessmentA structured identification of major risks, including risks related to the financial reporting, was conducted in 2015 as part of establish-ing instructions for a formalised and proactive process for risk management with clearly established roles and areas of responsibil-ity. The process implies that risks related to the financial reporting should be identified, evaluated, managed and followed-up. A plan was set up for work on strengthening the internal control for finan-cial reporting, through formalised and documented processes that function as intended. This in order to secure that the Group in an efficient way lives up to the aim of internal control related to the financial reporting. In accordance with the risk management pro-cess, an annual update of risks related to the financial reporting shall be made, which among other things comprises items in the income
Scandi Standard Annual Report 2018
Corporate governance report
111
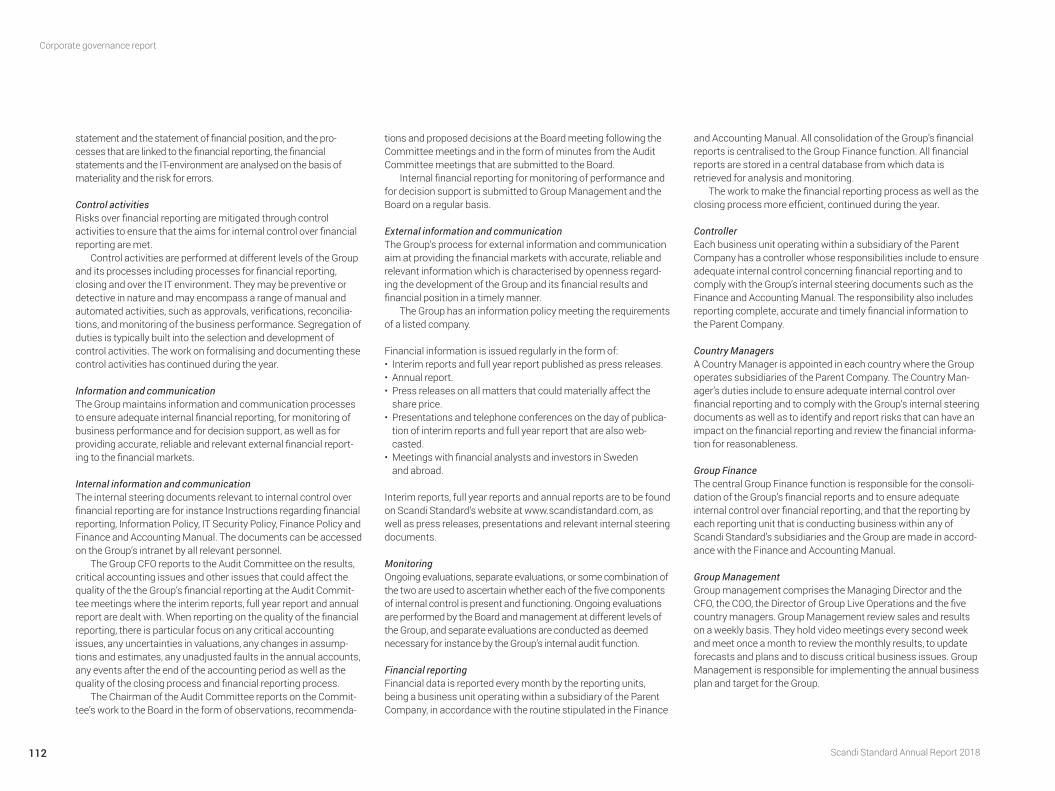
statement and the statement of financial position, and the pro-cesses that are linked to the financial reporting, the financial statements and the IT-environment are analysed on the basis of materiality and the risk for errors.
Control activities Risks over financial reporting are mitigated through control activities to ensure that the aims for internal control over financial reporting are met.
Control activities are performed at different levels of the Group and its processes including processes for financial reporting, closing and over the IT environment. They may be preventive or detective in nature and may encompass a range of manual and automated activities, such as approvals, verifications, reconcilia-tions, and monitoring of the business performance. Segregation of duties is typically built into the selection and development of control activities. The work on formalising and documenting these control activities has continued during the year.
Information and communication The Group maintains information and communication processes to ensure adequate internal financial reporting, for monitoring of business performance and for decision support, as well as for providing accurate, reliable and relevant external financial report-ing to the financial markets.
Internal information and communication The internal steering documents relevant to internal control over financial reporting are for instance Instructions regarding financial reporting, Information Policy, IT Security Policy, Finance Policy and Finance and Accounting Manual. The documents can be accessed on the Group’s intranet by all relevant personnel.
The Group CFO reports to the Audit Committee on the results, critical accounting issues and other issues that could affect the quality of the the Group’s financial reporting at the Audit Commit-tee meetings where the interim reports, full year report and annual report are dealt with. When reporting on the quality of the financial reporting, there is particular focus on any critical accounting issues, any uncertainties in valuations, any changes in assump-tions and estimates, any unadjusted faults in the annual accounts, any events after the end of the accounting period as well as the quality of the closing process and financial reporting process.
The Chairman of the Audit Committee reports on the Commit-tee’s work to the Board in the form of observations, recommenda-
tions and proposed decisions at the Board meeting following the Committee meetings and in the form of minutes from the Audit Committee meetings that are submitted to the Board.
Internal financial reporting for monitoring of performance and for decision support is submitted to Group Management and the Board on a regular basis.
External information and communication The Group’s process for external information and communication aim at providing the financial markets with accurate, reliable and relevant information which is characterised by openness regard-ing the development of the Group and its financial results and financial position in a timely manner.
The Group has an information policy meeting the requirements of a listed company.
Financial information is issued regularly in the form of:• Interim reports and full year report published as press releases. • Annual report. • Press releases on all matters that could materially affect the
share price. • Presentations and telephone conferences on the day of publica-
tion of interim reports and full year report that are also web-casted.
• Meetings with financial analysts and investors in Sweden and abroad.
Interim reports, full year reports and annual reports are to be found on Scandi Standard’s website at www.scandistandard.com, as well as press releases, presentations and relevant internal steering documents.
MonitoringOngoing evaluations, separate evaluations, or some combination of the two are used to ascertain whether each of the five components of internal control is present and functioning. Ongoing evaluations are performed by the Board and management at different levels of the Group, and separate evaluations are conducted as deemed necessary for instance by the Group’s internal audit function.
Financial reportingFinancial data is reported every month by the reporting units, being a business unit operating within a subsidiary of the Parent Company, in accordance with the routine stipulated in the Finance
and Accounting Manual. All consolidation of the Group’s financial reports is centralised to the Group Finance function. All financial reports are stored in a central database from which data is retrieved for analysis and monitoring.
The work to make the financial reporting process as well as the closing process more efficient, continued during the year.
ControllerEach business unit operating within a subsidiary of the Parent Company has a controller whose responsibilities include to ensure adequate internal control concerning financial reporting and to comply with the Group’s internal steering documents such as the Finance and Accounting Manual. The responsibility also includes reporting complete, accurate and timely financial information to the Parent Company.
Country Managers A Country Manager is appointed in each country where the Group operates subsidiaries of the Parent Company. The Country Man-ager’s duties include to ensure adequate internal control over financial reporting and to comply with the Group’s internal steering documents as well as to identify and report risks that can have an impact on the financial reporting and review the financial informa-tion for reasonableness.
Group Finance The central Group Finance function is responsible for the consoli-dation of the Group’s financial reports and to ensure adequate internal control over financial reporting, and that the reporting by each reporting unit that is conducting business within any of Scandi Standard’s subsidiaries and the Group are made in accord-ance with the Finance and Accounting Manual.
Group ManagementGroup management comprises the Managing Director and the CFO, the COO, the Director of Group Live Operations and the five country managers. Group Management review sales and results on a weekly basis. They hold video meetings every second week and meet once a month to review the monthly results, to update forecasts and plans and to discuss critical business issues. Group Management is responsible for implementing the annual business plan and target for the Group.
Scandi Standard Annual Report 2018
Corporate governance report
112
Internal audit An internal audit function was established in 2015, which is insourced from Deloitte. The work in 2018 focused to a large extent on evaluating the efficiency in the internal control over financial reporting and the business in general in the Group in accordance with an annual internal audit plan. The work also included support to the organisation in the development of the framework for internal control over financial reporting and in formalising and documenting processes and control activities regarding financial reporting.
The Board of DirectorsThe Board is responsible for internal control and risk management including internal control and risk management related to the
financial reporting. This responsibility includes establishing inter-nal steering documents and monitoring compliance with these as well with applicable external laws and regulations.The Board’s follow-up of compliance is based on different sources such as:• Reporting from the Managing Director regarding fulfilment of
established goals, operational follow-up, as well as financial results and financial position. In the Instruction for the Managing Director and the Instruction regarding financial reporting, the Board has defined the reporting required to be made to the Board.
• Reporting from the Chairman of the Audit Committee regarding the work in the Committee in the form of observations, recommen-dations and proposals for decisions regarding the effectiveness of the internal control regarding the financial reporting and the busi-
ness in general in the Group, as well as the reliability of the financial reporting. The work of the Audit Committee is based on an instruction established by the Board. The internal audit function reports the result of its work to the Audit Committee and this forms the basis for the Committee’s observations and recommen-dations.
• Reporting from the Whistleblowing function.
Stockholm, 2 April 2019
Scandi Standard AB (publ) The Board of Directors
To the Annual General Meeting of the shareholders in Scandi Standard AB (publ), corporate identity number 556921−0627
Engagement and responsibilityIt is the board of directors who is responsible for the corporate gov-ernance statement for the year 2018 on pages 106–113 and that it has been prepared in accordance with the Annual Accounts Act.
The scope of the auditOur examination has been conducted in accordance with FAR’s auditing standard RevU 16 The auditor’s examination of the corpo-rate governance statement. This means that our examination of the corporate governance statement is different and substantially less in scope than an audit conducted in accordance with Inter-national Standards on Auditing and generally accepted auditing standards in Sweden. We believe that the examination has provided us with sufficient basis for our opinions.
OpinionsA corporate governance statement has been prepared. Disclosures in accordance with chapter 6 section 6 the second paragraph points 2–6 the Annual Accounts Act and chapter 7 section 31 the second paragraph the same law are consistent with the annual accounts and the consolidated accounts and are in accordance with the Annual Accounts Act.
Stockholm, 2 April 2019Öhrlings PricewaterhouseCoopers AB
Bo LagerströmAuthorised Public Accountant
Auditor’s report on the Corporate Governance Statement
Scandi Standard Annual Report 2018
Corporate governance report
113

Board of Directors
1 2 3 4
5 6 7
Scandi Standard Annual Report 2018
Board of Directors
114
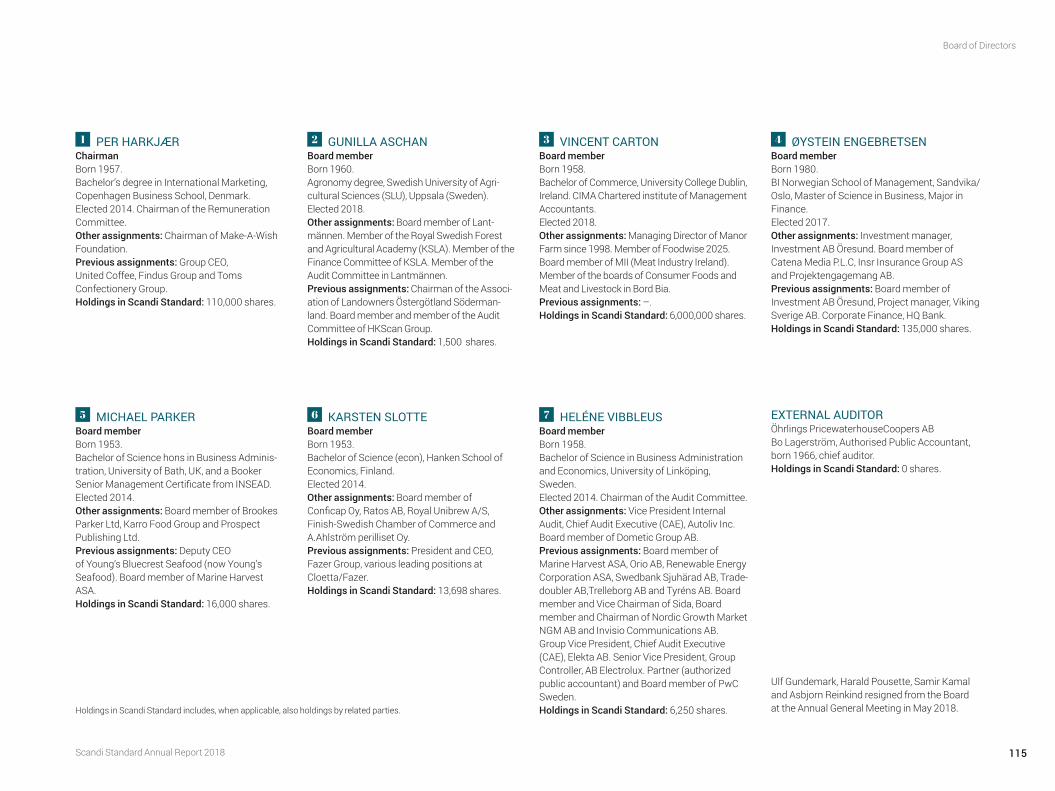
1 PER HARKJÆRChairman Born 1957. Bachelor’s degree in International Marketing, Copenhagen Business School, Denmark.Elected 2014. Chairman of the Remuneration Committee.Other assignments: Chairman of Make-A-Wish Foundation. Previous assignments: Group CEO, United Coffee, Findus Group and Toms Confectionery Group.Holdings in Scandi Standard: 110,000 shares.
2 GUNILLA ASCHANBoard member Born 1960.Agronomy degree, Swedish University of Agri-cultural Sciences (SLU), Uppsala (Sweden).Elected 2018.Other assignments: Board member of Lant-männen. Member of the Royal Swedish Forest and Agricultural Academy (KSLA). Member of the Finance Committee of KSLA. Member of the Audit Committee in Lantmännen. Previous assignments: Chairman of the Associ-ation of Landowners Östergötland Söderman-land. Board member and member of the Audit Committee of HKScan Group. Holdings in Scandi Standard: 1,500 shares.
3 VINCENT CARTONBoard member Born 1958.Bachelor of Commerce, University College Dublin, Ireland. CIMA Chartered institute of Management Accountants.Elected 2018.Other assignments: Managing Director of Manor Farm since 1998. Member of Foodwise 2025. Board member of MII (Meat Industry Ireland). Member of the boards of Consumer Foods and Meat and Livestock in Bord Bia. Previous assignments: –.Holdings in Scandi Standard: 6,000,000 shares.
4 ØYSTEIN ENGEBRETSENBoard member Born 1980.BI Norwegian School of Management, Sandvika/Oslo, Master of Science in Business, Major in Finance. Elected 2017. Other assignments: Investment manager, Investment AB Öresund. Board member of Catena Media P.L.C, Insr Insurance Group AS and Projektengagemang AB. Previous assignments: Board member of Investment AB Öresund, Project manager, Viking Sverige AB. Corporate Finance, HQ Bank.Holdings in Scandi Standard: 135,000 shares.
5 MICHAEL PARKERBoard member Born 1953. Bachelor of Science hons in Business Adminis-tration, University of Bath, UK, and a Booker Senior Management Certificate from INSEAD. Elected 2014.Other assignments: Board member of Brookes Parker Ltd, Karro Food Group and Prospect Publishing Ltd. Previous assignments: Deputy CEO of Young’s Bluecrest Seafood (now Young’s Seafood). Board member of Marine Harvest ASA.Holdings in Scandi Standard: 16,000 shares.
6 KARSTEN SLOTTEBoard member Born 1953. Bachelor of Science (econ), Hanken School of Economics, Finland.Elected 2014.Other assignments: Board member of Conficap Oy, Ratos AB, Royal Unibrew A/S, Finish-Swedish Chamber of Commerce and A.Ahlström perilliset Oy.Previous assignments: President and CEO, Fazer Group, various leading positions at Cloetta/Fazer. Holdings in Scandi Standard: 13,698 shares.
7 HELÉNE VIBBLEUSBoard memberBorn 1958. Bachelor of Science in Business Administration and Economics, University of Linköping, Sweden.Elected 2014. Chairman of the Audit Committee.Other assignments: Vice President Internal Audit, Chief Audit Executive (CAE), Autoliv Inc. Board member of Dometic Group AB.Previous assignments: Board member of Marine Harvest ASA, Orio AB, Renewable Energy Corporation ASA, Swedbank Sjuhärad AB, Trade-doubler AB,Trelleborg AB and Tyréns AB. Board member and Vice Chairman of Sida, Board member and Chairman of Nordic Growth Market NGM AB and Invisio Communications AB. Group Vice President, Chief Audit Executive (CAE), Elekta AB. Senior Vice President, Group Controller, AB Electrolux. Partner (authorized public accountant) and Board member of PwC Sweden.Holdings in Scandi Standard: 6,250 shares.
EXTERNAL AUDITORÖhrlings Pricewaterhouse Coopers AB Bo Lagerström, Authorised Public Accountant, born 1966, chief auditor.Holdings in Scandi Standard: 0 shares.
Ulf Gundemark, Harald Pousette, Samir Kamal and Asbjorn Reinkind resigned from the Board at the Annual General Meeting in May 2018.Holdings in Scandi Standard includes, when applicable, also holdings by related parties.
Scandi Standard Annual Report 2018
Board of Directors
115
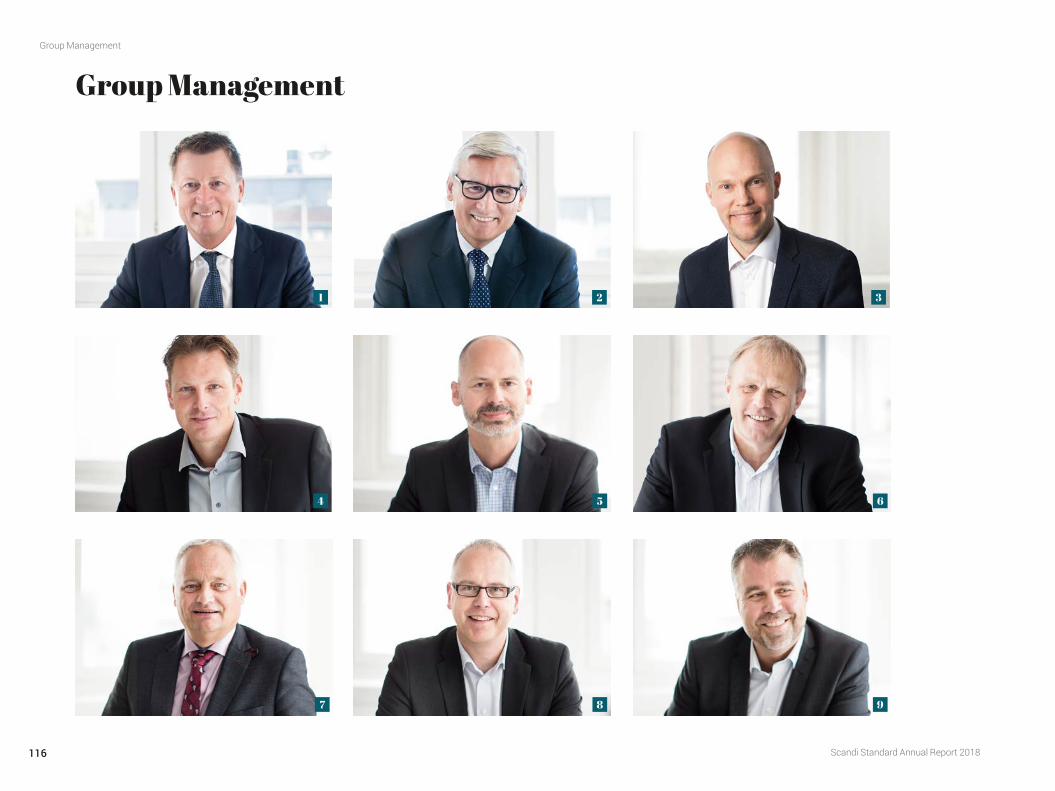
Group Management
1
4
7
2
5
8
3
6
9
Scandi Standard Annual Report 2018
Group Management
116
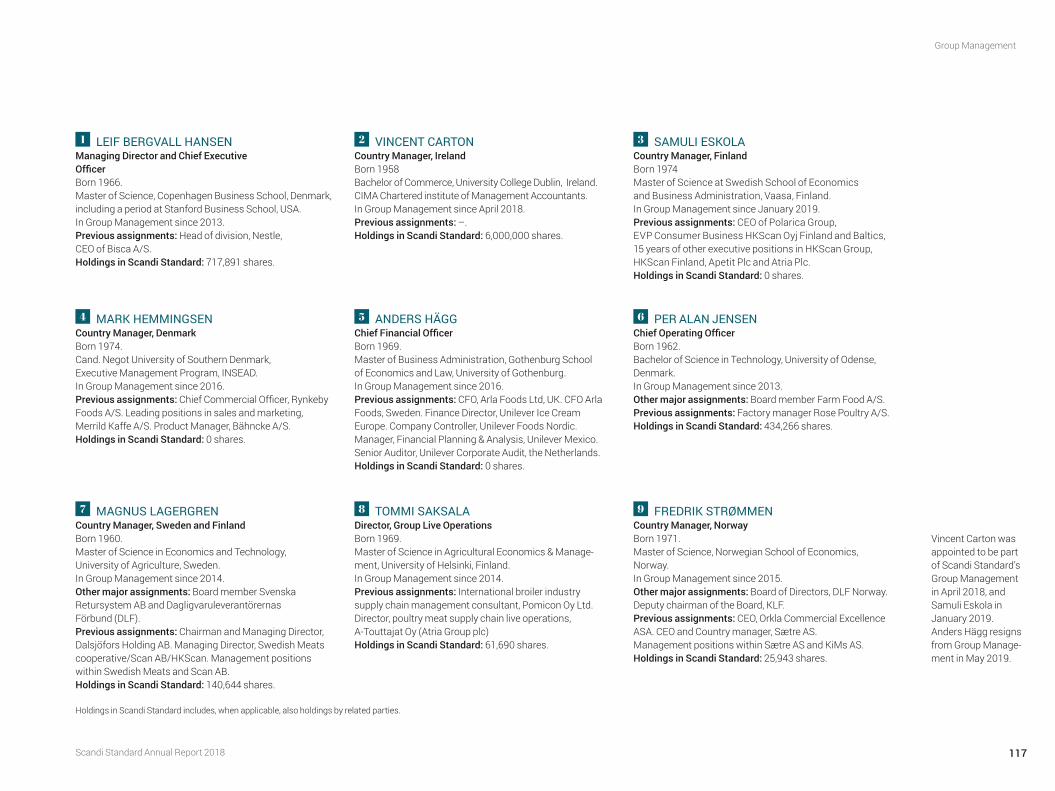
1 LEIF BERGVALL HANSENManaging Director and Chief Executive OfficerBorn 1966. Master of Science, Copenhagen Business School, Denmark, including a period at Stanford Business School, USA.In Group Management since 2013.Previous assignments: Head of division, Nestle, CEO of Bisca A/S.Holdings in Scandi Standard: 717,891 shares.
2 VINCENT CARTONCountry Manager, IrelandBorn 1958Bachelor of Commerce, University College Dublin, Ireland. CIMA Chartered institute of Management Accountants.In Group Management since April 2018. Previous assignments: –.Holdings in Scandi Standard: 6,000,000 shares.
3 SAMULI ESKOLACountry Manager, FinlandBorn 1974Master of Science at Swedish School of Economics and Business Administration, Vaasa, Finland.In Group Management since January 2019. Previous assignments: CEO of Polarica Group, EVP Consumer Business HKScan Oyj Finland and Baltics, 15 years of other executive positions in HKScan Group, HKScan Finland, Apetit Plc and Atria Plc.Holdings in Scandi Standard: 0 shares.
7 MAGNUS LAGERGREN Country Manager, Sweden and FinlandBorn 1960. Master of Science in Economics and Techno logy, University of Agriculture, Sweden.In Group Management since 2014.Other major assignments: Board member Svenska Retursystem AB and Dagligvaruleverantörernas Förbund (DLF).Previous assignments: Chairman and Managing Director, Dalsjöfors Holding AB. Managing Director, Swedish Meats cooperative/Scan AB/HKScan. Management positions within Swedish Meats and Scan AB. Holdings in Scandi Standard: 140,644 shares.
8 TOMMI SAKSALADirector, Group Live OperationsBorn 1969. Master of Science in Agricultural Economics & Manage-ment, University of Helsinki, Finland. In Group Management since 2014.Previous assignments: International broiler industry supply chain management consultant, Pomicon Oy Ltd. Director, poultry meat supply chain live operations, A-Touttajat Oy (Atria Group plc)Holdings in Scandi Standard: 61,690 shares.
9 FREDRIK STRØMMENCountry Manager, Norway Born 1971. Master of Science, Norwegian School of Economics, Norway. In Group Management since 2015.Other major assignments: Board of Directors, DLF Norway. Deputy chairman of the Board, KLF.Previous assignments: CEO, Orkla Commercial Excellence ASA. CEO and Country manager, Sætre AS. Management positions within Sætre AS and KiMs AS. Holdings in Scandi Standard: 25,943 shares.
4 MARK HEMMINGSENCountry Manager, Denmark Born 1974.Cand. Negot University of Southern Denmark, Executive Management Program, INSEAD. In Group Management since 2016.Previous assignments: Chief Commercial Officer, Rynkeby Foods A/S. Leading positions in sales and marketing, Merrild Kaffe A/S. Product Manager, Bähncke A/S.Holdings in Scandi Standard: 0 shares.
5 ANDERS HÄGGChief Financial OfficerBorn 1969.Master of Business Administration, Gothenburg School of Economics and Law, University of Gothenburg. In Group Management since 2016. Previous assignments: CFO, Arla Foods Ltd, UK. CFO Arla Foods, Sweden. Finance Director, Unilever Ice Cream Europe. Company Controller, Unilever Foods Nordic. Manager, Financial Planning & Analysis, Unilever Mexico. Senior Auditor, Unilever Corporate Audit, the Netherlands. Holdings in Scandi Standard: 0 shares.
6 PER ALAN JENSEN Chief Operating OfficerBorn 1962. Bachelor of Science in Technology, University of Odense, Denmark.In Group Management since 2013.Other major assignments: Board member Farm Food A/S.Previous assignments: Factory manager Rose Poultry A/S. Holdings in Scandi Standard: 434,266 shares.
Holdings in Scandi Standard includes, when applicable, also holdings by related parties.
Vincent Carton was appointed to be part of Scandi Standard’s Group Management in April 2018, and Samuli Eskola in January 2019. Anders Hägg resigns from Group Manage-ment in May 2019.
Scandi Standard Annual Report 2018
Group Management
117

Annual General MeetingThe Annual General Meeting 2019 will be held on Thursday, 9 May at 10 am in Wallenbergsalen, IVA Conference Center, Grev Ture gatan 16, Stockholm. For more information, see investors.scandistandard.com/en/agm.
ParticipationShareholders who intend to participate in the Annual General Meeting must:• Be registered in the share register kept by the Swedish
central securities depositary, Euroclear Sweden AB on Friday, 3 May 2019.
• Give notice of intent to participate to Scandi Standard no later than Friday, 3 May 2019.
Notice of participationNotice of intent to participate can be given:• on the Group’s website;
investors.scandi standard.com/en/agm• by telephone at +46 8 402 90 55.• by mail to Scandi Standard AB, c/o Euroclear Sweden AB,
P.O Box 191, SE–101 23 Stockholm, Sweden.
Notice should include the shareholder’s name, personal or company registration number, if any, address and telephone number, and the number of assistants attending, if any.
Shareholders may vote by proxy; in which case a power of attorney should be submitted to Scandi Standard well in advance of the AGM. Proxy forms are avail able for download in English and Swedish on the Group’s website.
Shares registered by nomineesShareholders who have their shares registered in the name of nominees must have their shares temporarily registered in their own name on Friday, 3 May 2019 in order to participate in the AGM. To ensure that such registration is made prior to this date, the nominee must be informed well in advance.
DividendThe Board of Directors has proposed a dividend of SEK 2.0 per share and Monday, 13 May 2019 as record date. With this record date, it is expected that dividends will be paid from Euroclear on Thursday, 16 May 2019. The last day for trading in Scandi Standard’s shares with right to dividend is Thursday, 9 May 2019.
Forward looking statementThis report contains forward-looking statements and the actual outcome could be materially different. Factors that could have a material effect on the actual outcome include, but are not limited to, general business conditions, fluctua-tions in exchange rates and interest rates, political develop-ments, the impact of competing products and their pricing, product development, commercialization and technological difficulties, product quality and safety, interruptions in supply, increased raw material cost, disease outbreaks, loss of major customer contracts and major customer credit losses. For further information see the sections on Risks and risk management on page 51–55 and on page 81–84.
Information about markets, market shares, market growth etc. are based on established independent external sources, internal sources and Company estimates.
The forward-looking statements reflect the Board of Directors’ and management’s current views with respect to certain future events and potential financial performance. Although the Board of Directors and the management believe that the expectations reflected in such forward-looking statements are reasonable, no assurance can be given that such expectations will prove to have been correct. This report does not imply that the Company has undertaken to revise these forward-looking statements, beyond what is required under the company’s registration contract with Nasdaq Stockholm, if and when circumstances arise that will lead to changes compared to the date when these statements were provided.
Annual General Meeting
118

Production: Scandi Standard in cooperation with Hallvarsson & Halvarsson. Script: Scandi Standard. Foto: Bengt Alm, Juliana Fälldin, Kronfågels bildbank. Printing: Larsson Offsettryck AB 2019.

Franzéngatan 5 Box 30174104 25 StockholmSweden
www.scandistandard.comwww.kronfagel.se www.danpo.dkwww.denstoltehane.nowww.naapurinmaalaiskana.fiwww.chicken.ie