Best Practices in Critical Access Hospitals October 11, 2011 Best Western Doublewood Inn Bismarck,...
82
Best Practices in Critical Access Hospitals October 11, 2011 Best Western Doublewood Inn Bismarck, North Dakota Eric Shell, CPA, MBA North Dakota Hospital Association Critical Access Hospital Conference
-
Upload
deborah-fox -
Category
Documents
-
view
213 -
download
0
Transcript of Best Practices in Critical Access Hospitals October 11, 2011 Best Western Doublewood Inn Bismarck,...

Best Practices in Critical Access Hospitals
October 11, 2011
Best Western Doublewood InnBismarck, North Dakota
Eric Shell, CPA, MBA
North Dakota Hospital AssociationCritical Access Hospital Conference

2
• Best Practices in Critical Access Hospitals1. Understand Rural Hospital Economics2. The “Right” Medical Staff3. Focus on both Inpatient and Outpatient Volume4. Effective Organizational Design5. Strong Revenue Cycle Practices6. Understand Physician Practice Management7. Facility Design that Supports Patient Care Model8. Developing Information Technology Systems9. Current Third Party Contracts and Charge Master10. Accurate Medicare cost report
• Summary/Discussion
Presentation Overview

Rural EconomicsMedical Staff
IP/OP Volume
Organizational Design
Revenue Cycle Practices
Practice Management
Facility Design
Information Technology
Third Party Contracts
Cost Reports
Summary

4
• Common Findings– Over emphasis on cost report management
• Managing the “RCCs”– “If we increase our charges, our RCCs will go down”
• “How do we increase our Medicare per diems to increase cash flow?”
– Over emphasis on expense management• “Revenue management?? That’s what the CEO does!”
– Belief that because we are a CAH, we should operate differently than PPS hospitals
Rural EconomicsUnderstand Rural Hospital Economics

5
• Variable Cost– Definition: Expenses that change with changes in activity– E.g.: Pharmaceuticals, reagents, film, food
• Fixed Cost– Definition: Expenses that do not change with changes in
activity– E.g.: Salaries and benefits (??), rent, utilities
• Mixed Cost (Step Fixed Costs)– Costs that remain fixed through a range of volume
growth, then jump to next level– E.g.: Salaries and benefits (??)
• Rural hospitals have inordinately high fixed (or step fixed costs) costs relative to revenue– E.g., ER standby, acute care nursing costs, etc.
Rural EconomicsRural Hospital Cost Structure

6
• A look at fixed and variable costs
Fixed Cost
Service Volumes
Dollars
Total Cost
Rural EconomicsRural Hospital Cost Structure (continued)
Fixed costs do not change with increased service volumes
The difference between fixed and total costs are the “variable costs”

7
Loss Zone
Understand Rural Hospital Economics
Rural Hospital Cost Structure (continued) Rural Economics
• Profits and Losses
Service Volumes
Dollars
Cost
Revenue
Profit Zone

8
Hypothetical Model Assumptions:
Expenses:Inpatient:
Acute Variable Costs/Day 200$ Swing-Bed SNF Variable Costs/Day 100$ Total Fixed Rountine and Ancillary Costs 2,600,000$
Outpatient:Outpatient Variable Costs/Unit 35$ Total Fixed Outpatient Costs 2,600,000$
Revenue:Inpatient:
Acute Revenue/Day (Non-Cost Based) 950$ Swing-Bed SNF Revenue/Day (Non-Cost Based) 250$
Outpatient:Outpatient Revenue Per Unit (Non-Cost Based) 150$
Payer Mix:Inpatient:
Medicare Acute Payer Mix 60%Medicare Swing-Bed SNF 100%
Outpatient:Medicare Outpatient Payer Mix 35%
Rural EconomicsEvaluating Rural Hospital Economics: A Model
9
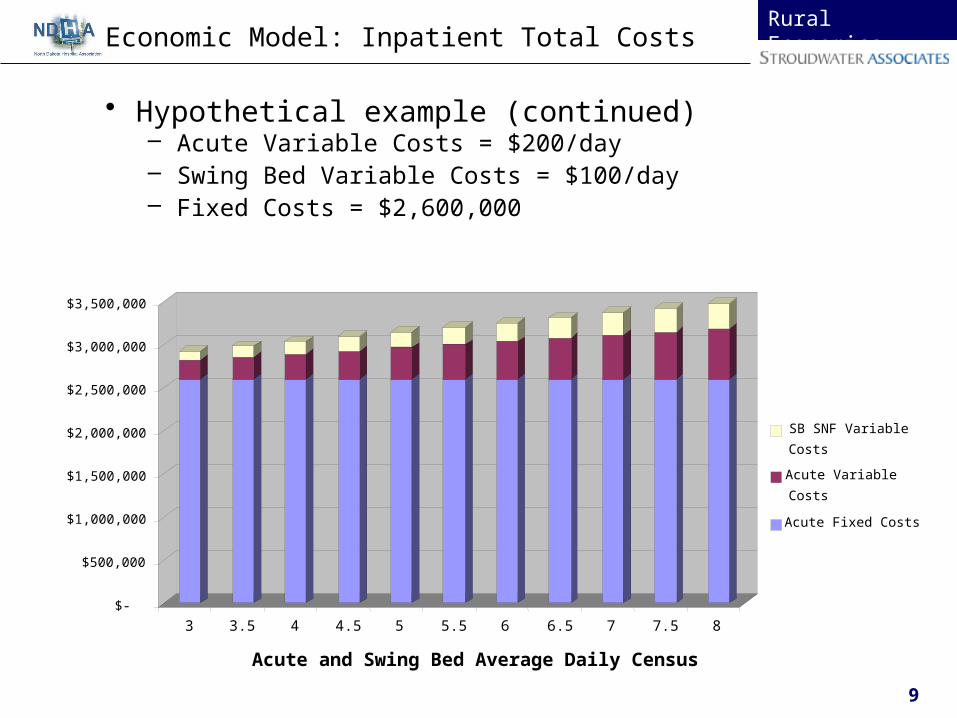
• Hypothetical example (continued)– Acute Variable Costs = $200/day– Swing Bed Variable Costs = $100/day– Fixed Costs = $2,600,000
Rural EconomicsEconomic Model: Inpatient Total Costs
$-
$500,000
$1,000,000
$1,500,000
$2,000,000
$2,500,000
$3,000,000
$3,500,000
3 3.5 4 4.5 5 5.5 6 6.5 7 7.5 8
Acute and Swing Bed Average Daily Census
SB SNF Variable
Costs
Acute Variable
Costs
Acute Fixed Costs

10
Rural EconomicsEconomic Model: Outpatient Total Costs
• Hypothetical example (continued)– Outpatient Variable Costs = $35/unit– Outpatient Fixed Costs = $2,600,000
$-
$500,000
$1,000,000
$1,500,000
$2,000,000
$2,500,000
$3,000,000
$3,500,000
$4,000,000
12,500 15,000 17,500 20,000 22,500 25,000 27,500 30,000 32,500 35,000 37,500
Outpatient Volume
Outpatient Total Cost Analysis
OP Variable
Costs
OP Fixed
Costs

11
Rural EconomicsEconomic Model: Inpatient Per Unit Costs
• Hypothetical example (continued)– As volume increases, fixed costs are allocated over large base– Result lower Unit Cost
$-
$200
$400
$600
$800
$1,000
$1,200
$1,400
3 3.5 4 4.5 5 5.5 6 6.5 7 7.5 8
Acute and Swing Bed Average Daily Census
Acute Unit Cost Analysis
IP Unit Fixed Costs
Acute Variable Costs/Day

12
Rural EconomicsEconomic Model: Outpatient Per Unit Costs
• Hypothetical example (continued)– Same applies to Outpatient costs!
$-
$50.00
$100.00
$150.00
$200.00
$250.00
12,500 15,000 17,500 20,000 22,500 25,000 27,500 30,000 32,500 35,000 37,500
Outpatient Volume (In "Units")
Outpatient Unit Cost Analysis
OP Unit Fixed Exp
OP Unit Variable Exp

13
• Hypothetical example (continued)– Non Cost-Based Per Diems > Cost-Based Per Diems once
Acute unit cost falls below $950• Note: Slightly higher acute variable costs cause higher breakeven
Rural EconomicsAcute Per Unit Revenue
IP Acute Unit Revenue
$0
$200
$400
$600
$800
$1,000
$1,200
$1,400
$1,600
3 3.5 4 4.5 5 5.5 6 6.5 7 7.5 8
Acute and SB SNF ADC
Cost-Based AcuteRev/Day
Non-Cost BasedAcute Rev/Day
Total AcuteCosts/Day

14
• Hypothetical Example (continued)– Non Cost-Based Payment > Cost-Based Payment once Acute
unit cost falls below $150
Rural EconomicsOutpatient Per Unit Revenue
Outpatient Unit Cost Analysis
$-
$50.00
$100.00
$150.00
$200.00
$250.00
$300.00
12,50
0
15,00
0
17,50
0
20,00
0
22,50
0
25,00
0
27,50
0
30,00
0
32,50
0
35,00
0
37,50
0
Outpatient Volume (Units of Service)
OP Total Expense
Non Cost-Based RevPer Unit

15
• Strategy 1: Decrease Expenses– Fixed Nature of standby costs, regulatory costs, etc. often
make this a difficult option - Most rural hospitals have expenses right
– Reducing expenses reduces a portion of total revenue
Rural EconomicsSuccessful Profit Strategies
Loss Zone
Service Volumes
Dollars
Cost
Revenue
Profit Zone

16
• Strategy 1: Decrease Expenses (continued)– Comparison with national standards example
Rural EconomicsSuccessful Profit Strategies
Performance FY 2011 Hourly FTEs @ ActualDepartment Indicator Volume Standard (1) Standard FTEs (2) Variance
Nursing - Med Surg Per Patient Day 2,240 12.00 12.92 18.58 5.66
Nursing - Surgery - minor Per Case 346 5.50 0.91 4.16 3.25 Nursing - Recovery Room Per Case 346 3.30 0.55 - (0.55) Surgery Subtotal 1.46 4.16 2.70
Emergency Room Per Case 5,850 2.40 6.75 8.40 1.65
Nursing Home - Nursing Staff Per Day 24,752 3.60 42.84 54.55 11.71 UR/Case Mgr/Soc Ser Patient Days 2,240 0.75 0.81 1.00 0.19 Nursing Administration Per Adjusted Admissions 2,939 1.75 2.47 5.88 3.41
Subtotal Nursing 67.26 92.57 25.31
Radiology Per Procedure 9,610 1.44 6.65 8.04 1.39 Lab/Blood Bank Per Test 71,126 0.25 8.62 8.82 0.20
Physical Therapy Per Treatment 26,546 0.50 6.38 10.39 4.01 Cardiac Rehab Per Procedure - 1.31 - 1.00 1.00 Cardio/Pulmonary Per Procedure - - - 1.46 1.46 Pharmacy Per Adjusted Day 15,629 0.60 4.51 2.67 (1.84) Subtotal Ancillary 26.16 32.38 6.22 Subtotal - Clinical 93.42 124.95 31.53
Hospital Administration Per Adjusted Admissions 2,939 1.65 2.33 5.51 3.18 Information Systems Per Adjusted Admissions 2,939 1.00 1.41 1.00 (0.41)
Human Resources Per Adjusted Admissions 2,939 1.10 1.55 - (1.55) Marketing/Planning/Public Rel Per Adjusted Admissions 2,939 0.28 0.40 - (0.40) Volunteers Per Adjusted Admissions 2,939 0.75 1.06 - (1.06) Telecommunications Per Adjusted Admissions 2,939 0.36 0.51 - (0.51) General Accounting (5) Per Adjusted Admissions 2,939 1.23 1.74 - (1.74)
Security Gross Square Feet 111,826 0.02 1.08 - (1.08) Patient Accounting Per Adjusted Admissions 2,939 3.00 4.24 7.46 3.22 Admitting/Patient Registration Per Adjusted Admissions 2,939 4.25 6.01 8.13 2.12 Medical Records Per Adjusted Admissions 2,939 3.50 4.95 6.81 1.86 Cent Supply/Mtl Mgmt/Sterile Per Adjusted Day 15,629 0.30 2.25 2.64 0.39 Housekeeping Net Square Feet 79,876 0.31 11.98 19.54 7.56 Dietary Meals Served 96,122 0.25 11.55 15.83 4.28 Plant Ops/ Maintenance Gross Square Feet 111,826 0.12 6.45 6.13 (0.32)
Laundry and Linen Lbs of Laundry 349,015 0.02 3.36 5.39 2.03 Subtotal Support 60.86 78.44 17.58
154.28 203.39 49.11
(1) Hourly Standards based on Stroudwater sample of hospitals
Sample of Selected Departments
17
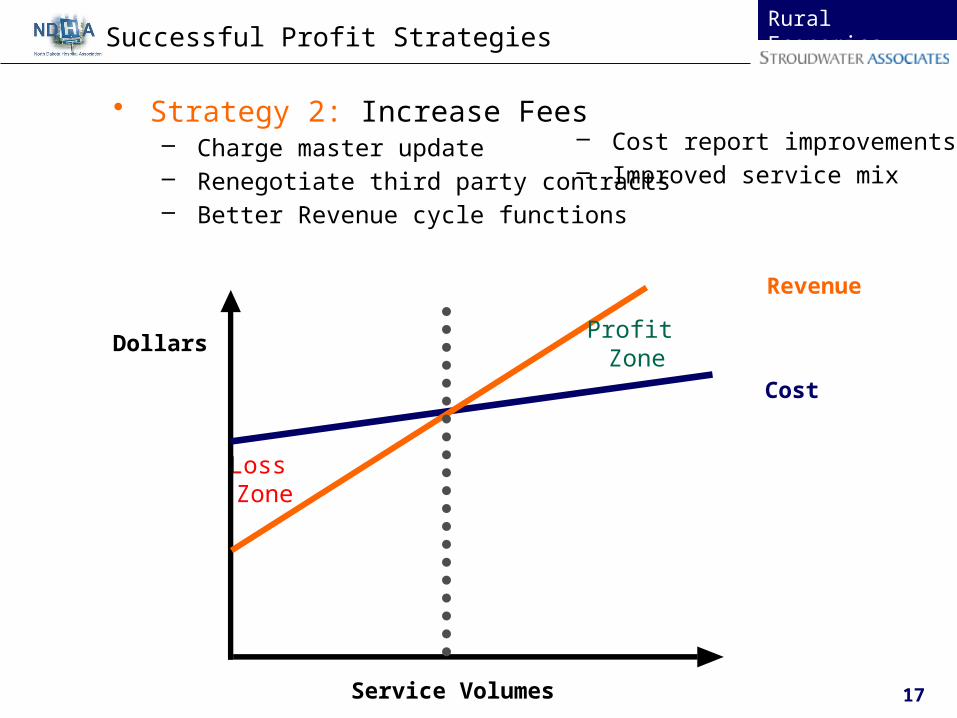
• Strategy 2: Increase Fees– Charge master update – Renegotiate third party contracts– Better Revenue cycle functions
Rural EconomicsSuccessful Profit Strategies
– Cost report improvements– Improved service mix
Loss Zone
Service Volumes
Dollars
Cost
Revenue
Profit Zone
18
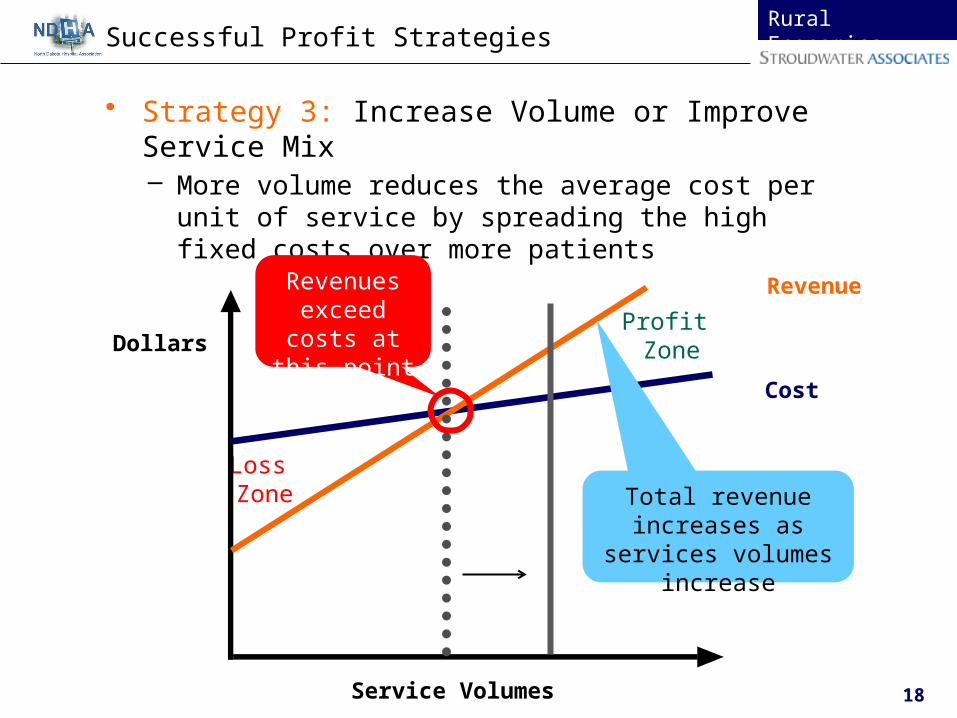
• Strategy 3: Increase Volume or Improve Service Mix– More volume reduces the average cost per unit of
service by spreading the high fixed costs over more patients
Rural EconomicsSuccessful Profit Strategies
Loss Zone
Service Volumes
Dollars
Cost
Revenue
Profit Zone
Revenues exceed costs at this point
Total revenue increases as services
volumes increase

19
Rural EconomicsSuccessful Profit Strategies
• Strategy 4: Grow Non-Medicare Business– Strategy assumes incremental margin on non-Medicare
offsets reduction in Medicare per unit revenue
Service Volumes
Dollars
• Medicare revenue mirrors the total cost, but only covers its share of the total
• Medicare revenue will never exceed costs
Cost
MedicareRevenue
Losses

20
Understand Rural Hospital Economics
Rural EconomicsSuccessful Profit Strategies
• Strategy 4: Grow Non-Medicare Business (continued)– Commercial revenue is the only potential source of profit
– Overall services must be increased to exceed unit costs
Service Volumes
Dollars
Cost
CommercialRevenueCommercial revenue goes
up evenly as service volumes increase. It is directly tied to volumes.

Rural Economics
Medical Staff
IP/OP Volume
Organizational Design
Revenue Cycle Practices
Practice Management
Facility Design
Information Technology
Third Party Contracts
Cost Reports
Summary

22
Medical StaffDetermining Provider Supply as a Planning Tool
Provider Supply (FTEs) for Service Area of 12,200
Primary Care Kaiser Group Health Health PartnersFamily Practice 1.7 5.7 2.7Internal Medicine 3.4 1.4 3.3Pediatrics 1.5 0.9 1.3
Subtotal 6.5 8.1 7.3
Non-Phys Providers 1.6 2.8 0.8Subtotal 8.1 10.9 8.1Medical
Allergy 0.1 0.2 0.1Cardiology 0.4 0.4 0.4Dermatology 0.3 0.2 0.2Endocrinology 0.2 0.0 0.1Gastroenterology 0.3 0.3 0.2Hem/Oncology 0.3 0.3 0.3Infectious Disease 0.1 0.1 0.1Nephrology 0.2 0.2 0.2Neurology 0.2 0.3 0.3Pulmonary 0.1 0.3 0.2Rheumatology 0.1 0.2 0.1
SurgicalENT 0.3 0.4 0.1General 0.7 0.8 0.9Neurosurgery 0.1 0.1OB/GYN 1.3 0.9 1.1Ophthalmology 0.5 0.5 0.5Orthopedic 0.5 0.8Plastic Surgery 0.1 0.2Urology 0.3 0.4
Supply Indicators

23
• Comparison between population based need and actual
Medical StaffProvider Supply as a Planning Tool, contd.
Physician Shortage/Surplus Adjusted Service Area Population 12,200Existing
Primary Care (1)
Family Practice 1.7 - 5.7 3.50 (2.2) - 1.8
Internal Medicine 1.4 - 3.4 1.50 (1.9) - 0.1
Pediatrics 0.9 - 1.5 0.50 (1.0) - (0.4)
Physician Primary Care Range 6.5 - 8.1 5.50 (2.6) - (1.0)
Non-Phys Providers 0.8 - 2.8 4.65 1.9 - 3.8
TOTAL Primary Care Range 8.1 - 10.9 10.15 (0.8) - 2.0
Medical SpecialtiesAllergy 0.00Cardiology 0.4 - 0.4 0.11 (0.3) - (0.3)
Dermatology 0.2 - 0.3 0.00 (0.3) - (0.2)
Endocrinology 0.0 - 0.2 0.00 (0.2) - (0.0)
Gastroenterology 0.2 - 0.3 0.11 (0.2) - (0.1)
Hem/Oncology 0.3 - 0.3 0.00 (0.3) - (0.3)
Infectious Disease 0.1 - 0.1 0.00 (0.1) - (0.1)Nephrology 0.1 - 0.2 0.00 (0.2) - (0.1)
Neurology 0.2 - 0.3 0.00 (0.3) - (0.2)
Pulmonary 0.1 - 0.3 0.00 (0.3) - (0.1)Rheumatology 0.1 - 0.2 0.00 (0.2) - (0.1)
Surgical Specialties
ENT 0.1 - 0.4 0.11 (0.3) - 0.0
General 0.7 - 0.9 0.22 (0.7) - (0.5)
Neurosurgery 0.1 - 0.1 0.00 (0.1) - (0.1)
OB/GYN 0.9 - 1.3 0.00 (1.3) - (0.9)
Ophthalmology 0.5 - 0.5 0.00 (0.5) - (0.5)Orthopedic 0.5 - 0.8 0.11 (0.7) - (0.4)
Plastic Surgery 0.1 - 0.2 0.00 (0.2) - (0.1)
Urology 0.3 - 0.4 0.00 (0.4) - (0.3)1
Physician FTEs calculated as 18 days per month = 1.0 FTE
2 See Attachments for detail of Supply Studies.
Supply Study (Shortage)/Surplus
Range Range (2)

24
• Medical staff development is a constant strategic priority• Have developed a comprehensive physician recruitment strategy that
includes, but is not limited to:─ Asking medical staff about additional specialty physician needs; e.g.,
cardiology, orthopedics, urology─ Contacting the State Office of Rural Health and/or Department of Health
for US trained physician recruitment and J-1 Visa recruitment─ Asking medical staff about their personal physician contacts─ Using contingency fee head hunters only after other avenues exhausted─ Recruiting with the local physicians, not independent of them─ Engaging community (realtors, newspaper, Chamber of Commerce, etc.)
to assist with physician recruitment• Use available population-based tools to evaluate need for
additional providers─ Present physician needs assessment to current medical staff to obtain
buy-in for active and aggressive recruitment of additional full time providers
• Reconsider strategy of maintaining independent primary care practices and consider employing local primary care providers through RHC, using production-based employment agreements
─ Will both stabilize and focus local providers
Medical StaffSuccessful Hospitals

Rural Economics
Medical Staff
IP/OP Volume
Organizational Design
Revenue Cycle Practices
Practice Management
Facility Design
Information Technology
Third Party Contracts
Cost Reports
Service Area
Summary

26
• CAH economics review– All growth in IP services (OP volume remains constant)
• IP growth limits both losses and profits
IP/OP VolumeWhy Both Inpatient and Outpatient?
Inpatient & LTC Breakeven Analysis
(IP Growth - Assumes Constant OP Visits)
$2,000,000
$2,500,000
$3,000,000
$3,500,000
$4,000,000
$4,500,000
$5,000,000
$5,500,000
$6,000,000
3.0 3.5 4.0 4.5 5.0 5.5 6.0 6.5 7.0 7.5 8.0
Acute and Swing Bed ADC
Total IP Rev
IP Costs

27
• CAH economics review (continued)– All growth in OP services (IP volume remains constant)– OP growth creates more losses at lower volumes and
higher profits at higher volumes
IP/OP VolumeWhy Both Inpatient and Outpatient? (contd.)
Outpatient Breakeven Analysis
(OP Growth - Assumes Constant Acute and SB ADC)
$2,000,000
$2,500,000
$3,000,000
$3,500,000
$4,000,000
$4,500,000
$5,000,000
$5,500,000
$6,000,000
12,50
0
15,00
0
17,50
0
20,00
0
22,50
0
25,00
0
27,50
0
30,00
0
32,50
0
35,00
0
37,50
0
Outpatient Visits
Total OPRevTotal OPCosts

28
• Controllable factors– Gain of inpatients was due to
• Re-establishing relations with physicians • Bringing back the community
IP/OP VolumeFocus on Both Inpatient and Outpatient
Inpatient Admissions
0
200
400
600
800
1,000
1,200
1,400
1,600
1998 1999 2000 2001 2002 2003 ytd
Med/Surg/Pedi Admits Deliveries

29
• Controllable Factors (continued)
– Gain of inpatients was due to replacement facility
IP/OP VolumeFocus on Both IP and OP Volume
IP Bed Utilization
0
500
1,000
1,500
2,000
2,500
3,000
3,500
Med/Surg D/Cs 532 554 809 972
M/S Days 1,787 1,931 2,389 3,404
SB D/Cs 32 61 44 81
SB Days 181 333 325 629
Observation Days 298 306 244 189
2002 2003 2004 2005

30
• Controllable Factors (continued)
– Loss directly related to RAC implications
IP/OP VolumeFocus on Both IP and OP Volume
0
500
1,000
1,500
2,000
2,500
3,000
3,500
4,000
4,500
FY 2006 FY 2007 FY 2008 FY 2009
Inpatient Services
Acute Discharges Acute Days Swing-Bed Days Observation Days

31
• Controllable Factors (continued)– Medicare IP Market Share
– Loss related to new competitors and “Cost Based Reimbursement”
IP/OP VolumeFocus on Both IP and OP Volume
12%
27%
17%
7%7%
28%
0%
5%
10%
15%
20%
25%
30%
2005 2006 2007 2008 2009
Lincoln County Medical Center
SSM Saint Joseph Hospital West
SSM Saint Joseph Health Center
Barnes-Jewish Saint Peters Hospital
Saint Luke's Hospital
All Other

32
• Inpatient Acute– Monitor emergency room admission rate by provider
• Target between 7% - 10%» Higher if specialty services available (i.e., surgery)
– Meet with physicians periodically, individually and informally, simply to inquire about their concerns – ask how we can help them do their job with higher quality, more efficiently, or with greater income
IP/OP VolumeSuccessful Rural Hospitals
7.1% 7.4%
5.9%
12.9%
4.6%
3.5%
2.9%
4.7%
0%
2%
4%
6%
8%
10%
12%
14%
FY 2007 FY 2008 FY 2009 FY 2010
Emergency Department Admission Rates
% ER Admissions % ER Transfers

33
• Inpatient Acute, continued– Recruit and retain nurses who are trained and comfortable with
the service mix offered at the rural hospital • At almost any cost!
– Reconsider current inpatient space usage and ensure that it meets community expected standards
– Recent movement toward ER/Hospitalists model– Are aware of RAC implications
IP/OP VolumeSuccessful Rural Hospitals

34
• Swing Bed– Target specific ADC goal and manage to it (e.g., SB ADC of 4)– Develop discharge planning process that begins at admission
• Daily discharge planning team meetings• Case manager (DON) to monitor all patients as potential Swing Bed
candidates– Case manager (DON) to establish relationships with case
mangers from area hospitals• Provide information regarding transfer rule – truly a “win-win”
– Ensure physical, occupational, and/or speech therapies 5-7 days/week
– Provide physicians assistance with Swing Bed program• Inform physicians regarding financial importance of Swing Bed
utilization• Assist physicians with proper billing codes• Ask physicians to assist identify potential Swing Bed transfers that
are (or plan to be) hospitalized elsewhere; e.g., CVA and orthopedic surgery patients
IP/OP VolumeSuccessful Rural Hospitals

35
• Volume increase over prior years due to – Increased number of employed physicians; and – Improved marketing of available services to physicians and
community
IP/OP VolumeOutpatient/Ancillary Services
Other Radiology Operating Statistics
0
500
1,000
1,500
2,000
2,500
3,000
99-00 00-01 01-02 2003 proj.
Fiscal Years Ending June 30
Ultrasound (OP) Mammography
CT Scans (OP) Nuclear Medecine (OP)

36
• Increased surgical volume • Bringing back the physicians
– More efficient OR throughput
IP/OP VolumeOutpatient/Ancillary Services, continued
Surgical Cases (Inpatient and Outpatient)
0
200
400
600
800
1,000
1,200
1,400
1998 1999 2000 2001 2002 2003 ytd
IP Surgical Cases OP Surgical Cases Endoscopy
37
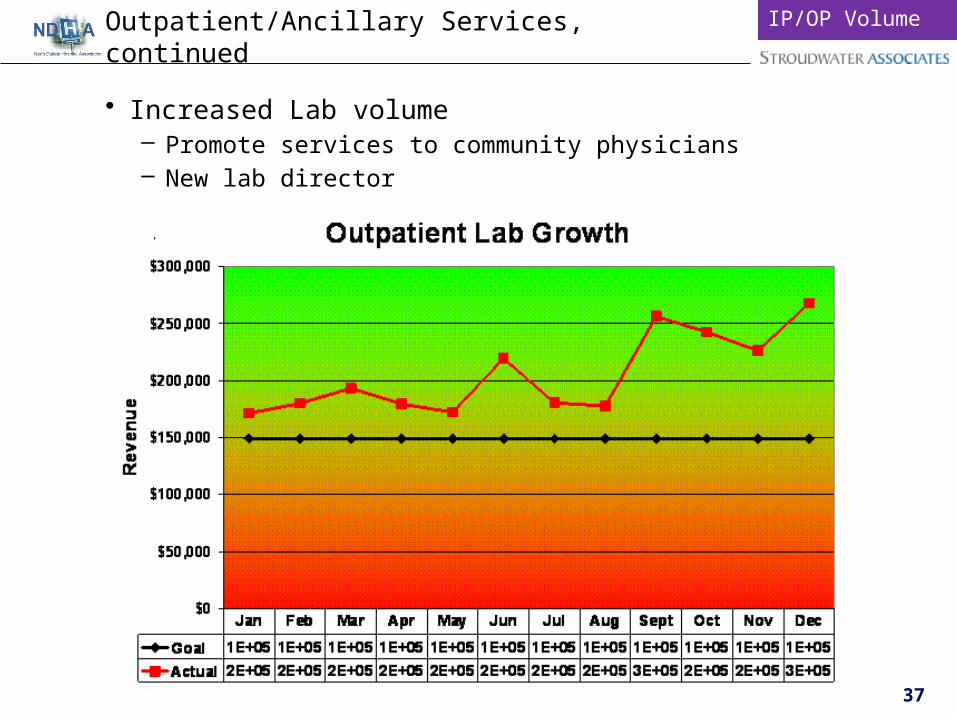
• Increased Lab volume– Promote services to community physicians– New lab director
Outpatient/Ancillary Services, continuedIP/OP Volume

38
• OP/Ancillary Services– Develop radiology marketing plan that highlights exceptional
equipment and staff– Meet with physicians to determine level of satisfaction with
current diagnostic tests and results and what can be done if less than 100% satisfied
– Investment in having updated diagnostic equipment– Aggressively pursue additional outpatient lab opportunities
• Because incremental costs of lab tests low, rural hospital can offer favorable rates and beat reference lab in both price and service (e.g., on-site phlebotomists, frequent pick-up)
• Pursue not only clinics, but nursing home and public health• To be competitive with outside reference labs, offer separate lab fee
schedule with volume reductions• Accommodate physician needs as best as possible with reporting
formats, e.g., panels reported on one page
IP/OP VolumeSuccessful Rural Hospitals

39
• Physical therapy– Develop physical therapy marketing strategy
• Measure and continuously improve patient satisfaction• Interview physicians regarding rehabilitation service needs• Remind physicians of the good work of rehabilitative services• Provide patient outcomes to physicians and “thank you” notes for
referrals– Measure PT productivity to determine when to increase staffing
• 12 visits/therapist/day is general guideline, but variable depending on number of neurology vs. Ortho cases seen and payer mix
• Another guideline is 6.5 billable hrs per therapist per day– Aggressively recruit therapist(s) to expand service and free Director for
marketing activity– Establish rehabilitation as an integral part of swing bed patient
determination (Care Management Team) and swing bed patient care– Regularly evaluate non core hospital services for profitability and fit with
mission
IP/OP VolumeSuccessful Rural Hospitals

Rural Economics
Medical Staff
IP/OP Volume
Organizational Design
Revenue Cycle Practices
Practice Management
Facility Design
Information Technology
Third Party Contracts
Cost Reports
Summary

41
• An effective organization, through sound leadership, will enable its employees to make decisions taking into account relevant data and hold employees accountable for these decisions. The key elements of this OA are as follows:– Leadership
• Maintaining visionary leadership while giving managers the tools to make effective decisions and holding accountable managers to improve the performance and value of the organization
– Decision Making/Accountability• The goal within an organization is to place decision making at a level
that leverages local information while improving overall hospital value – Compensation
• Compensation must be set at market rates and reward risk taking by managers and other employees
– Performance Measurement• Provides regular and timely information to managers to use in
effective decision making as well as to provide administrator with organizational results
Org. DesignTheoretical Overview

42
• Governance/Leadership– Board involved in operations rather than strategy
• Lack of strategic plans/direction– Decision Making and Responsibility
• Administrators with numerous direct reports• Department managers disconnected from decision making and
accountability and unaware of their contribution to hospital performance
– Compensation• Salaried staff with raises based on longevity
– Performance Measurement• Department managers not involved in annual budget• Performance information not presented to managers• Lack of performance information tied to organizational strategy
– Performance Improvement (PI)• PI as a “department” • Department directors design PI projects without administration input• Board member not conversant in strategic quality metrics• PI Director or Compliance Officer do not attend Board meetings
Org. DesignCommon Findings

43
• Leadership– Board’s focus on:
• Strategic direction• Assure effective management• Fiduciary responsibility• Achieve quality goals• Represent community interests
– Develop action oriental strategic/operating plans which often focus on:• Facility planning• Medical staff development planning• Growing patient volume• Human resource development and alignment with current strategies• Information technology vision and strategy• Quality improvement/patient safety• An affiliation strategy
Org. DesignSuccessful Rural Hospitals

44
• Affiliations– Regularly assess value of a potential affiliation– Understand value they bring to a relationship
Org. DesignSuccessful Rural Hospitals
ClinicalIntegration
H
ValueImage
Management Support
Purchased ServicesService Coordination
CapitalInvestment
Technology Integration
PhysicianIntegration
ClinicalIntegration
Rural
Urban
Franchise
Distributed Overhead
Support Services
Focused Service Linkage RegionalInvestment
Financial & ClinicalTransparency
Broad PhysicianDeployment
IntegratedSystem Capacity
Gap
GapL
Commitment
H
L
H
H

45
• Affiliations (continued)– Understand CAH Contribution Margin
Org. DesignSuccessful Rural Hospitals
Cox-Barton County Memorial Hospital CAH Contribution Margin Analysis 17-Jun-11
Missouri MissouriNet Income (Loss):
Total Operating Revenue 20,240,158$ Total Operating Expense 20,840,695
Operating Income (Loss) (600,538) Depreciation Expense 1,725,218 Non Operating Income 835,058
Net Income (Loss) Less Depreciation Expense 1,959,739$
Indirect Cost Allocations to CAH Affiliates:
Estimated Administrative and General Costs (Source: Below Analysis) 1,798,602$ Medicare Cost-Based Payer Mix (Source: Below Analysis) 47.52%
Net Increase in CAH Cost Based Reimbursement 854,709
Net Income Less Depreciation Expense Plus Fixed Allocated Costs 2,814,449$
Transfer Benefits Total 2014 Est. Discharges for CAH Service Area (Source: Thomson Rueters) 2,886 Current Cox Medicare Market Share (Source: 2009 CMS Med Par Data) (I) 3% Estimated Cox Discharges from CAH Service Area 86 Estimated Net Revenue Per Discharge (Source: AHD.com; 2009 Data) 10,657$ 10,657$ Estimated Net Inpatient Revenue from CAH Service Area 919,553
Est Net OP Rev From CAH Service Area (source: AHD OP % of IP Charges) 128% 1,179,709$ Total Net Transfer / Referral Dollars to System from CAH Affiliates 2,099,262$
Estimated Contribution Margin % (Source: Estimated) 60% 60% Estimated Contribution Margin on Net Revenue from CAH Service Area (II) 1,259,557$
Contribution Margin Per 1% of Inpatient Market Share (II)/(I) 421,282$ Esimtated Change in Market Share % with Competitive Entry into CAH 10%
CM from Loss of existing or potential gain of CAH Service Area Market Share 4,212,816$ Total Benefit / Cost to System from Cox CAH Affiliates 7,027,265$

46
• Decision Making and Responsibility– Create accountabilities for performance at the departmental levels through
use of budget-to-actual reports and regularly scheduled meetings with Administrator
– Convene a “senior management team” that meets on a weekly/bi-weekly basis• Reduce the number of administrator direct reports
• Compensation– Create entrepreneurial incentives for the senior management team and
department managers to focus on enhancing service volumes within key ancillary service centers including:• Jointly establish performance targets with department managers and
reward managers for obtaining results– E.g., prior year +10% or a moving average that is trending upward
• Structure department manager compensation to reward enhanced market share, customer satisfaction, and other appropriate attributes
• Regularly measure and trend ancillary operating statistics to shift focus to profit-generating services
Org. DesignSuccessful Rural Hospitals

47
• Compensation, continued
Health Services - Incentive ProgramTier Audited Financial Quality Customer Service Turnover People(1) Margin (2) Goal met (3) Goal met Svc scores (4) Goal met rate (5) Goal met
Ind/Facility avg 2.00% $0 $0 89% $0 32%> $01 2.20% $10 $10 90% $10 30%-31% $102 2.40% $20 $20 91% $20 28%-29% $203 2.60% $30 $30 92% $30 26%-27% $304 2.80% $40 $40 93% $40 24%-25% $405 3.00% $50 $50 94% $50 22%-23% $506 3.20% $60 $60 95% $60 20%-21% $607 3.40% $70 $70 96% $70 18%-19% $708 3.60% $80 $80 97% $80 16%-17% $809 3.80% $90 $90 98% $90 14%-15% $90
10 4.00% $100 $100 99% $100 <14% $100
NOTES:1. The previous year's Industry and Facility numbers will be averaged each year to come up with a benchmark. Our new facility goals will be tiered from the benchmark. The intervals used between tiers may change to ensure tier 10 is attainable.2. Audited Total Margin (as defined by industry practice) is from a combined audit of the hospital, nursing home, and clinics. Sales tax money is included in the calculation. Proceeds from the sale of bulk assets will be excluded from the calculation.3. This goal will be added next year after our ability to measure quality gets more sophisticated.4. Customer Satisfaction scores are an average of ER, Nursing Home, Outpatient Svcs, and Clinic surveys.5. Turnover is a facility average. It excludes promotions, transfers and retirements (20+ yrs of svc or age 60+).6. Eligible employees include those that have been employed at least 13 months at the time of distribution which is in December each year. Part-time employees will get a prorated incentive.7. Lawrence Health Services is under no obligation to pay an amount to employees that is greater than the overall profit for the fiscal year that was recently audited.8. Contract employees are not eligible for the incentive.9. This incentive is in addition to any other incentive pay that employees are receiving.
Org. DesignSuccessful Rural Hospitals
48
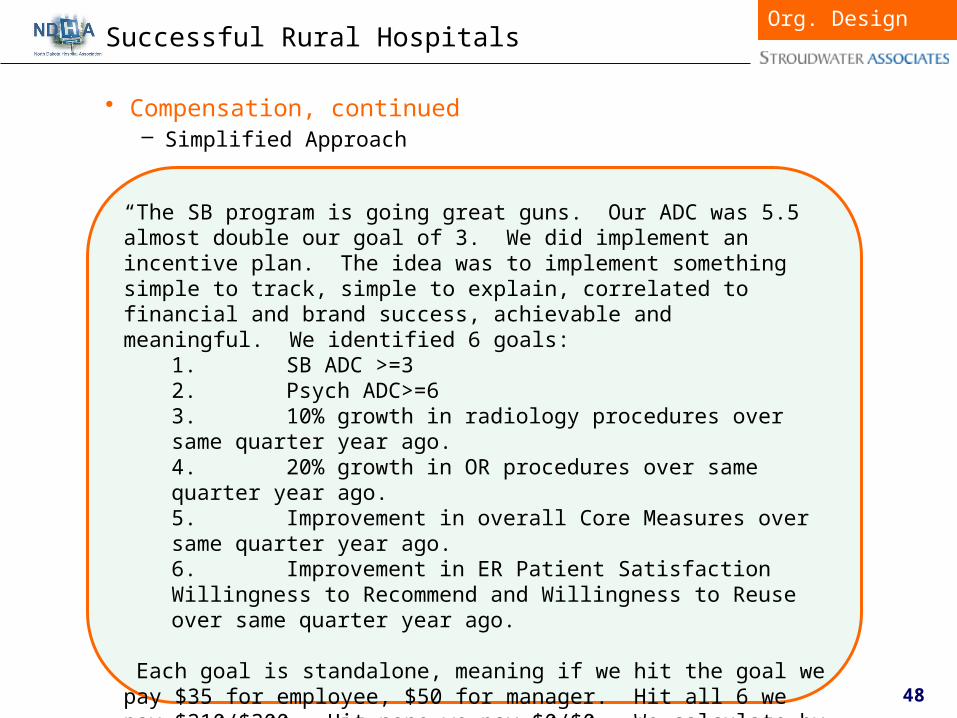
• Compensation, continued– Simplified Approach
Org. DesignSuccessful Rural Hospitals
“The SB program is going great guns. Our ADC was 5.5 almost double our goal of 3. We did implement an incentive plan. The idea was to implement something simple to track, simple to explain, correlated to financial and brand success, achievable and meaningful. We identified 6 goals:
1. SB ADC >=32. Psych ADC>=63. 10% growth in radiology procedures over same quarter year ago.4. 20% growth in OR procedures over same quarter year ago.5. Improvement in overall Core Measures over same quarter year ago.6. Improvement in ER Patient Satisfaction Willingness to Recommend and Willingness to Reuse over same quarter year ago.
Each goal is standalone, meaning if we hit the goal we pay $35 for employee, $50 for manager. Hit all 6 we pay $210/$300. Hit none we pay $0/$0. We calculate by quarter so there are 4 payouts per year. We print a separate check to hand out to the employees so that the benefit does not get lost in a bi-weekly payroll. We just completed our first quarter. We paid on 3 of the 6 goals, so the employees got $105/$150, but also got to see that with a little more effort they could have doubled the amount.”

49
• Performance Measurement– Financial statements reflect cost-based nature of Medicare
reimbursement– Department managers to be involved in developing annual
budgets– Budget to actual reports to be sent to department managers
monthly• Variance analysis to be performed through regularly scheduled
meetings between CFO and department managers– Create charts of key departmental performance indicators
• Indicators may include: monthly charges, expenses, volume statistics, staffing to volume ratios, combined with clinical indicators etc.
• Information must be available over a longer period to identify trends – Use charts and graphs to identify trends and opportunities for improvement
– Consider Balanced Scorecard Methodology to link operations, strategy, and performance results
Effective Organizational Design
Org. DesignSuccessful Rural Hospitals

Rural Economics
Medical Staff
IP/OP Volume
Organizational Design
Revenue Cycle Practices
Practice Management
Facility Design
Information Technology
Third Party Contracts
Cost Reports
Summary

51
• Days Revenue in Accounts Receivable– Benchmark for rural hospital is between 55 and 60 days– Difference between Net Days in A/R and Gross Days
• Look at both
Days in Net Accounts Receivable 6/30/2005 6/30/2006 6/30/2007 3/31/2008Net Accounts Receivable* 5,004,012$ 5,850,109$ 7,174,929$ 8,147,345$ Net Patient Revenue* 22,099,000$ 21,711,000$ 21,631,000$ 28,406,973$
Hospital Rate 82.6 98.4 121.1 104.7
Benchmark75th percentile 65.72 64.27 64.27 64.3 Median 55.13 53.85 53.85 53.9 25th percentile 46.28 45.98 45.98 46.0
Benchmark for small, rural hospitals from 2007 Sourcebook (Solucient, based on 2005 data).*Note: Net of contractual allowances and bad debt expense
Days in Gross Accounts Receivable 6/30/2005 6/30/2006 6/30/2007 3/31/2008Gross Accounts Receivable 11,660,959$ 13,593,351$ 18,382,709$ 17,569,599$ Gross Patient Revenue 44,908,000$ 52,178,000$ 60,381,000$ 67,897,333$
Hospital Rate 94.8 95.1 111.1 94.5
Benchmark75th percentile 65.7 64.3 64.3 64.3 Median 55.1 53.9 53.9 53.9 25th percentile 46.3 46.0 46.0 46.0
Benchmark for small, rural hospitals from 2007 Sourcebook (Solucient, based on 2005 data).
Revenue CycleStrong Practices: Measurement

52
• Key performance indicators– Have developed performance measurement systems to measure
key revenue cycle metrics on a monthly basis and use them to drive better performance into revenue cycle operations
– Better performing revenue cycle functions generally track many performance indicators including (source: HFMA):• Cash collections• Gross A/R and Gross A/R days• Net A/R and Net A/R days• In-house and Discharged Not Final Billed Receivables• Third party aging over 90 days• Cash percentage of net revenue• Cost to collect• Bad debt and charity as a percentage of gross charges• Denials as a fraction of gross charges• Point of service collections as a fraction of goal
Revenue CycleSuccessful Rural Hospitals

53
• Key performance indicators – Case Study
Revenue CycleSuccessful Rural Hospitals

54
• Key performance indicators – Case Study (continued)
Revenue CycleSuccessful Rural Hospitals
33.7
21.1
35.6
16.2 12.9
48.5
40.7
51.2
44.6
49.1
68.1 64.2
67.8
46.9 50.2
-
20
40
60
80
FY 2005 FY 2006 FY 2007 FY 2008 FY 2009 proj
Day
s
Memorial HospitalLiquidity Analysis
Days Cash on Hand Average Payment Period Days in Net Accounts Receivable

55
• Upgrade patient registration– Patient registration operates with core responsibilities of pre-
registering most scheduled services (surgeries, MRIs, CTs, etc.), registering all patients, verifying insurance, and collecting co-payments
– Effective pre-registration process for scheduled OP services• MD office faxes over order, patient demographics, and insurance
information• Insurance is electronically verified and patient is called with
scheduled time and co-payment information– Point-of-service collections for both emergent and elective care
• ER policy - after full medical screening, patients deemed non-urgent are required to make $75 payment or services will be discontinued and charges waived
• Re-registered patients will not receive service unless they have made arrangements to pay either co-payment or 25% of estimated patient payment
• Once per month, point of service receipts per clerk are reviewed as a performance measure
– Establish weekly process to monitor collected upfront co-payments and deductibles
– Provide expanded financial counseling to assist self pay patients in filling out Medicaid applications and to set up payment plans
Revenue CycleSuccessful Rural Hospitals

56
• Additional best practices– Adjust medical staff by-laws for physician time for chart
completion from 30 to 15 days– Establish a documented collection policy and follow it!– Establish sliding fee schedule for low-income patients that is
applied consistently for all patients– Have a prompt pay discount policy up to 30% across the board
and communicate policy to patients– Establish a process for working claim denials in a timely manner– Ensure current collection policy is sufficient to allow Medicare
bad debts to be reimbursable– Begin tracking of each collection agency’s performance relative
to each other– Formally establish a revenue cycle meeting on a bi-monthly basis
that includes all important stakeholders to the revenue cycle function
– Target a reduction in bad debt expense from 12% of gross charges to 9% of gross charges and develop strategies to achieve new target
– Develop a process to accurately demonstrate community benefit by improving process for classifying a patient as charity care
Revenue CycleSuccessful Rural Hospitals

Rural Economics
Medical Staff
IP/OP Volume
Organizational Design
Revenue Cycle Practices
Practice Management
Facility Design
Information Technology
Third Party Contracts
Cost Reports
Summary

58
Practice Mgmt.Evaluating Physician Practice Performance
Financial Performance
Organizational Structure
Revenue
Visits
RVU Benchmarks
Visit Benchmarks
New Patients
Throughput
Price
Collections
Fee Schedules
Payer Mix
Coding
Expense
Non-Provider
Staff Ratios
Overhead Expenses
Provider
Compensation
Physician Ratio
• Framework:

59
• Benchmarking is essential for providers to understand their productivity relative to peers– Benchmarking with “Scientific” data
Practice Mgmt.Provider Compensation
Year Ended 25th 75th 90thProductivity Measures 12/31/2010 Percentile Median Percentile PercentileFP (no OB) Benchmarks:
Charges (excludes TC) 463,762 595,153 762,303 956,813 Ambulatory Encounters 3,213 4,008 4,925 6,070 Relative Value Units 7,007 8,855 10,593 12,814 Work Relative Value Units 3,937 4,845 5,865 7,004 Compensation 151,207 183,999 233,948 297,760 Comp to Work RVU 33.66 39.13 46.94 58.38
Dr. A Charges (excludes TC) 506,521 XAmbulatory Encounters 4,238 XRelative Value Units 8,107 XWork Relative Value Units 4,612 XComp to Work RVU 61.76$ X
Dr. B
Charges (excludes TC) 540,973 XAmbulatory Encounters 4,151 XRelative Value Units 8,521 X
Work Relative Value Units 4,670 XComp to Work RVU 51.17$ X
Dr. C Charges (excludes TC) 366,696 XAmbulatory Encounters 2,823 XRelative Value Units 5,904 XWork Relative Value Units 3,115 XComp to Work RVU 62.45$ X
MGMA (2010 Report - 2009 Data)
60
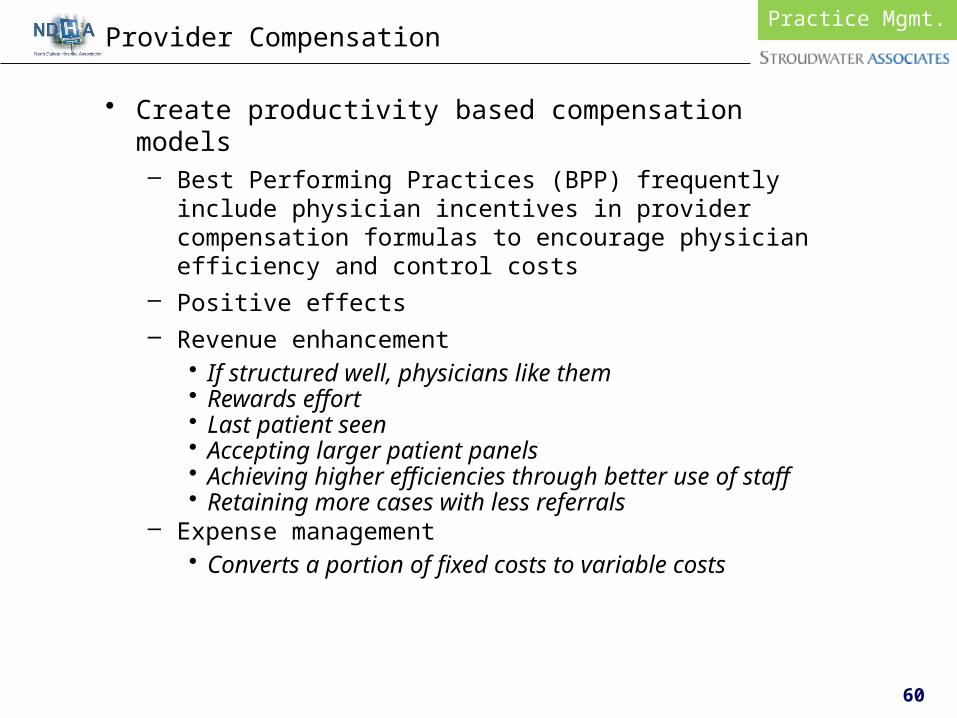
• Create productivity based compensation models – Best Performing Practices (BPP) frequently include physician
incentives in provider compensation formulas to encourage physician efficiency and control costs
– Positive effects– Revenue enhancement
• If structured well, physicians like them• Rewards effort• Last patient seen• Accepting larger patient panels• Achieving higher efficiencies through better use of staff• Retaining more cases with less referrals
– Expense management• Converts a portion of fixed costs to variable costs
Practice Mgmt.Provider Compensation

61
• Review Charge Master on an annual basis for changes in RVUs
– Review third party contracts on an annual basis taking into account transitioning RVUs• 99213: 2007 – 1.66; 2011 – 2.10
– 26% increase in RVU weight!!!
– Depending on market conditions, establish charges between 125% and 150% of Medicare fee schedule
Practice Mgmt.Fee Schedule
2011 Current Conversion Medicare % of Code Description RVUs** Fee Factor (CF) CF Medicare
Evaluation and Management Codes:99201 Office Visit New 1 1.25 65.00$ 52.00$ 33.98$ 153%99202 Office Visit New 2 2.16 95.00$ 43.98$ 33.98$ 129%99203 Office Visit New 3 3.13 137.00$ 43.77$ 33.98$ 129%99204 Office Visit New 4 4.81 183.00$ 38.05$ 33.98$ 112%99211 Office/outpatient visit, est 0.56 $32.00 57.14$ 33.98$ 168%99212 Office/outpatient visit, est 1.25 $65.00 52.00$ 33.98$ 153%99213 Office/outpatient visit, est 2.10 $83.00 39.52$ 33.98$ 116%99214 Office/outpatient visit, est 3.09 $122.00 39.48$ 33.98$ 116%99215 Office/outpatient visit, est 4.16 $183.00 43.99$ 33.98$ 129%99231 Subsequent hospital care 1.08 $92.00 85.19$ 33.98$ 251%99232 Subsequent hospital care 2.11 $120.00 56.87$ 33.98$ 167%99238 Hospital Discharge 2.09 $141.00 67.46$ 33.98$ 199%99395 Prev visit est age 18-39 2.82 $101.00 35.82$ 33.98$ 105%99396 Prev visit est age 40-64 3.08 $103.00 33.44$ 33.98$ 98%
** 2011 Fully Implemented Non-Facility Total
62
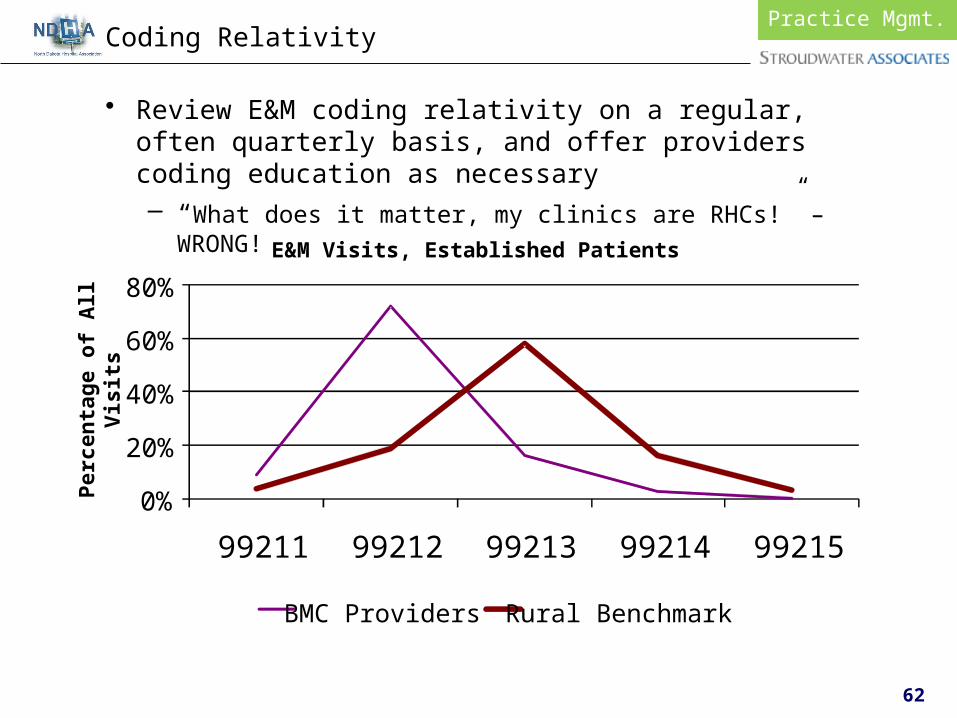
• Review E&M coding relativity on a regular, often quarterly basis, and offer providers coding education as necessary– “What does it matter, my clinics are RHCs!” – WRONG!
Understand Practice Management
Practice Mgmt.Coding Relativity
0%
20%
40%
60%
80%
99211 99212 99213 99214 99215
E&M Visits, Established Patients
BMC Providers Rural Benchmark
Per
cen
tage
of A
ll V
isit
s

Rural Economics
Medical Staff
IP/OP Volume
Organizational Design
Revenue Cycle Practices
Practice Management
Facility Design
Information Technology
Third Party Contracts
Cost Reports
Summary

64
Facility Design to Support Care Model
Facility Design2011 Rural Hospital Replacement Facility Study
Prepared and sponsored by:
Sponsored by:
S P E C I A L I N D U S T R Y R E P O R T
2011 RURAL HOSPITAL
REPLACEMENT FACILITY
STUDY

65
Facility Design2011 Rural Hospital Replacement Facility Study
Included in Study
Future Study Participants
NO DATA
LOW
State MedianCash Flow
HIGH
2011 Eligible CAHs (n=); Future Replacements (n=)2011 Eligible CAHs (n=114)
Future Participants (n=70)

66
• % Change in Total Volume by Year (Adjusted Patient Days)
Facility Design2011 Rural Hospital Replacement Facility Study
3%
1%
11%
8% 8%
3%
-1%
7%
0%
7%6%
0%
-3%
3%
1%
7%
6%
-2%
-5%
0%
5%
10%
15%
% C
han
ge
Year of Replacement
Percent Change in Total Patient VolumeBy Year Pre and Post Replacement
2005 or earlier (36 hospitals) 2006-2007 (29 hospitals) 2008 or later (49 hospitals)
Year -2 Year -1 Year 1 Year 2 Year 3 Year 4 Year 5

67
• Annualized change in Adjusted Patient Days
Facility Design2011 Rural Hospital Replacement Facility Study

68
• Quality Reporting
Facility Design2011 Rural Hospital Replacement Facility Study
8185
74 73
66
74
84
77 757680
63
69
6064
82
6770
50
60
70
80
90
100
VBPP Range (Minimum=Threshold/Maximum=Benchmark)
Median - Study participants
Median - all CAHs reporting

69
• Patient Volume– We have surpassed all expectations for volume growth. We are
now expanding building and doubling parking lot.”
– “We are experiencing a 20% growth in both IP and OP volume. We have begun recapturing volume that was driving by.”
– “Surgery volume has skyrocketed with recruitment of orthopedic surgeon.”
– “We have increased swing bed census by 93% and have seen significant growth in surgical volume.”
– “We were projected to lose $300K in year one. With growth in volume, we actually made $700K and made $1.5M in second year.”
– “The recent economic downturn has dampened growth.”
– “Not meeting volume projections. First year did really well. Then economy and lack of flu season lowered volume.”
Facility Design2010 Rural Hospital Replacement Facility Study

70
• Medical Staff– “Medical Staff satisfaction has skyrocketed.”
– “Recruited FP in August 2009, contracted with another FP who will finish school July 2012, and offer out for a general surgeon in July 2011.”
– “Just recruited 3rd year resident. Residents rounding through here ask if they can come work for us.”
– “We lost orthopedics with new facility because we did not have space for them. We just finished new clinic space and they will be starting up next month.”
– “We have increased from 5 FPs to 9 FPs in the community. Not recruiting any more. We have physicians calling but we don’t have a spot for them. “
– “Orthopedic surgeon recruited out of tertiary center said the ORs here are better than at the University.”
– “Recruited a full time orthopedic surgeon starting in August and a full time general surgeon beginning in January 2011.”
Facility Design2010 Rural Hospital Replacement Facility Study

71
• Staff Recruitment/Retention– “We now have no open nurse positions and are using no
travelers.”
– “We are fully staffed with people knocking on the door.”
– “Local community college is now visiting us as a clinic training site for students.”
– “Lab manager feels she has died and gone to heaven.”
– “Our turnover rate has dropped and we now have multiple candidates for open positions.”
– “Staff morale and pride have increased tremendously.”
– “We were able to recruit much higher quality staff. We were able to change the culture from the ground up.”
Facility Design2010 Rural Hospital Replacement Facility Study

Rural Economics
Medical Staff
IP/OP Volume
Organizational Design
Revenue Cycle Practices
Practice Management
Facility Design
Information Technology
Third Party Contracts
Cost Reports
Summary

73
• Common Findings– Stroudwater believes that successful hospitals of the future will
deliver demonstrable quality, patient safety, and customer service
– Many CAHs have made only limited investments in information technology to date • Information decision-support system is often limited
• Successful Rural Hospitals– Have developed a 5-year IT vision and strategy with an end
goal of a community/ population-based care management system that will increase hospital market share• Need to demonstrate quality of care and patient safety to the
community at large• Include in this plan the anticipated return on investment from
market share shifts or the cost of having market share swings away from the CAH
Information Tech.Developing Systems

Rural Economics
Medical Staff
IP/OP Volume
Organizational Design
Revenue Cycle Practices
Practice Management
Facility Design
Information Technology
Third Party Contracts
Cost Reports
Summary

75
• Common Findings– Third party contracts not updated on a regular basis
• Essential to the profitability of a rural hospital– Business office staff not aware of negotiated contracts– Charge masters have not been updated for several years
• Successful Rural Hospitals– Work with an outside vendors to perform comprehensive
evaluation of the hospital wide charge master– Organize/catalog all third-party contracts and evaluate whether
any contracts should be renegotiated– Establish process whereby all business office clerks are familiar
with third-party contracts and actively work all third-party EOMBs to ensure accurate reimbursement
Third Party ContractsCharge Master and Third Party Contracts

Rural Economics
Medical Staff
IP/OP Volume
Organizational Design
Revenue Cycle Practices
Practice Management
Facility Design
Information Technology
Third Party Contracts
Cost Reports
Service Area
Summary

77
• Common Findings– Errors in cost report preparation that reduce eligible
reimbursement• Medicare Bad Debts• Nursing Administration• RHC Provider FTE Count• Double Counting of Expenses• RCC inconsistencies• Statistical Allocation of Costs• Reporting of NF Swing-Beds• LDRP Allocations• Physician Stand-by Costs in EDs• Related Party Cost Allocations
• Successful Rural Hospitals– Understand cost reports – Prepare accurate cost reports enabling full reasonable
cost reimbursement
Cost ReportsAccurate Cost Reports

78
• Physician Stand-by/On Call Costs in ED (continued)– Worksheet A-8/2
• ER with 4,700 visits per year
– So what’s the problem???» $519K/811K = 64% professional time» 64% X 8,760 Annual Hours = 5,606 professional hours» 5,606 hours / 4,700 ER Visits = 1.2 hours per visit
Cost ReportTop 10 Cost Reporting Errors

79
• Physician Stand-by/On Call Costs in ED – Best Practice
Cost ReportsTop 10 Cost Reporting Errors

80
• Physician Stand-by/On Call Costs in ED – Best PracticeStandby Time
Cost ReportsTop 10 Cost Reporting Errors

81
• Physician Stand-by/On Call Costs in ED – Best PracticeStandby Time
Cost ReportsTop 10 Cost Reporting Errors