Best Practices for integrating ecosystem services … · Best Practices for Integrating Ecosystem...
54
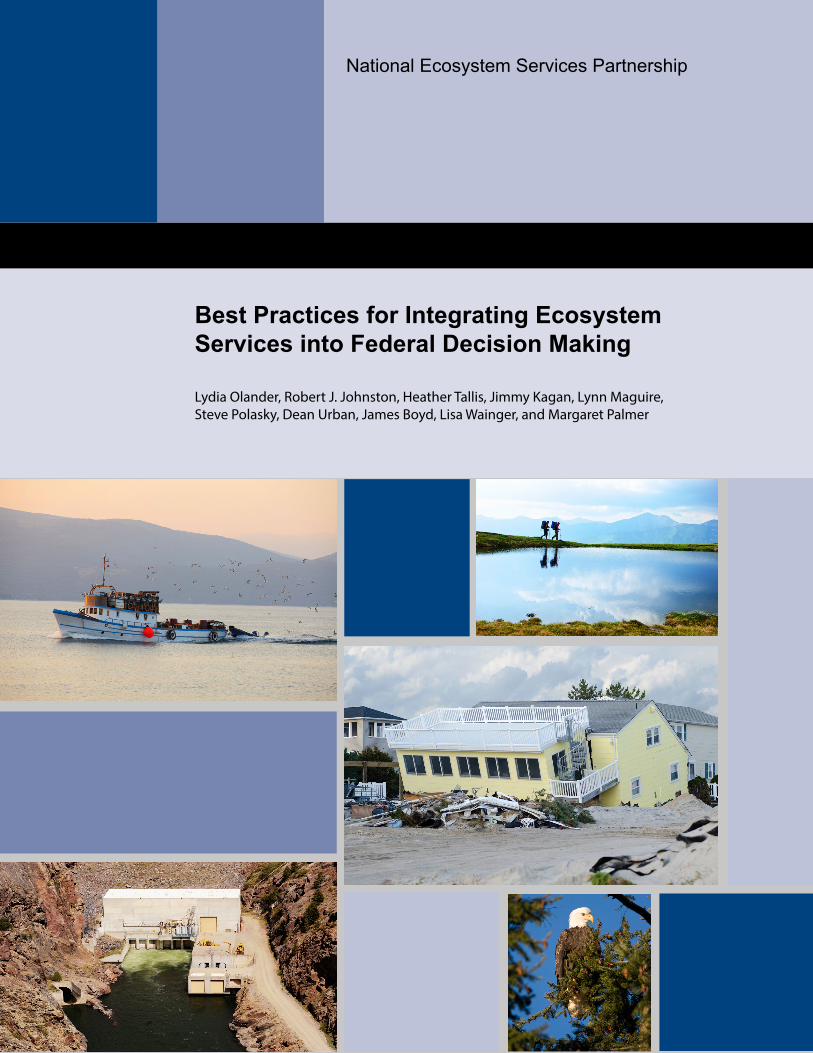
National Ecosystem Services Partnership Best Practices for Integrating Ecosystem Services into Federal Decision Making Lydia Olander, Robert J. Johnston, Heather Tallis, Jimmy Kagan, Lynn Maguire, Steve Polasky, Dean Urban, James Boyd, Lisa Wainger, and Margaret Palmer
Transcript of Best Practices for integrating ecosystem services … · Best Practices for Integrating Ecosystem...
National Ecosystem Services Partnership
Best Practices for Integrating Ecosystem Services into Federal Decision Making
Lydia Olander, Robert J. Johnston, Heather Tallis, Jimmy Kagan, Lynn Maguire,
Steve Polasky, Dean Urban, James Boyd, Lisa Wainger, and Margaret Palmer

Best Practices for Integrating Ecosystem Services into Federal Decision Making
Lydia Olander Duke University Nicholas Institute for Environmental Policy Solutions
Robert J. Johnston Clark University
Heather Tallis The Nature Conservancy
Jimmy Kagan Oregon State University Institute for Natural Resources (INR) and INR-Portland
Lynn Maguire Duke University Nicholas School of the Environment
Steve Polasky University of Minnesota
Dean Urban Duke University Nicholas School of the Environment
James Boyd Resources for the Future
Lisa Wainger University of Maryland Center for Environmental Science
Margaret Palmer Socio-Environmental Synthesis Center and the University of Maryland

Relationship of This Paper to the Federal Resource Management and Ecosystem Services Guidebook
The online Federal Resource Management and Ecosystem Services Guidebook (FRMES Guidebook, https://nespguidebook.com), published in December 2014, is designed to increase understanding of ecosystem services within federal agencies and to increase consistency of ecosystem services approaches to management across agencies. Although the guidebook presents methods for implementing these approaches, it is not focused on best practices recommendations. This paper, “Best Practices for Integrating Ecosystem Services into Federal Decision Making,” was developed by acknowledged academic experts in the field to provide such recommendations. It refines and clarifies the methods presented in the FRMES Guidebook. The recommendations herein will be incorporated into the guidebook in the second half of 2015.
Acknowledgments
We thank the National Socio-Environmental Synthesis Center for hosting the author workshop and conversation with federal agencies under funding received from the National Science Foundation DBI-1052875 as well as The Gordon and Betty Moore Foundation for support of the FRMES project. We greatly appreciate constructive reviews from Lynn Scarlett, George Van Houtven, Chris Hartley, Shawn Komlos, Elizabeth Murray, Bruce Carlson, Maria Wegner, Christine Davis, and Greg Arthaud. We would also like to acknowledge the assistance of Christy Ihlo on a number of figures and Melissa Edeburn for her editorial work.
How to CiteLydia Olander, Robert J. Johnston, Heather Tallis, Jimmy Kagan, Lynn Maguire, Steve Polasky, Dean Urban, James Boyd, Lisa Wainger, and Margaret Palmer. 2015. “Best Practices for Integrating Ecosystem Services into Federal Decision Making.” Durham: National Ecosystem Services Partnership, Duke University. doi:10.13016/M2CH07

Executive Summary On behalf of the American public, federal agencies take many actions that influence ecosystem conditions and change the provision of ecosystem services valued by the public. To date, most decisions affecting ecosystems have relied on ecological assessments with little or no consideration of the value of ecosystem services. Best practice for ecosystem services assessments is to apply quantitative measures and methods that express both an ecosystem’s capacity to provide valued services and, through those services, social benefit (value). Well-established preference evaluation methods, including market and non-market economic valuation as well as non-monetary methods, can be used to estimate values for ecosystem services. Such preference evaluation methods are sometimes used by federal agencies and represent best practice for ecosystem services assessment. However, these methods can be infeasible because of time or resource constraints, particularly when new data need to be collected. In such cases, the minimum standard recommended for an ecosystem services assessment is to use measures that go beyond narrative description and that are carefully constructed to reflect the ecosystem’s capacity to provide benefits to society but that stop short of a formal assessment of people’s preferences. We call these measures of ecosystem services benefit-
relevant indicators (BRIs). The use of BRIs ensures that ecosystem services assessments measure outcomes that are demonstrably relevant to human welfare, rather than biophysical measures that might not be relevant to human welfare. Examples of BRIs include likelihood or occurrences of respiratory distress caused by wildfire smoke inhalation, number of bald eagle nests (an iconic species), and storage volume of wetland areas upstream of homes vulnerable to floods. If ecosystem service values or BRIs are not used in some manner, ecosystem services are not being assessed, and no direct insights can be drawn about effects on social welfare. This minimum best practice is broadly achievable across agencies and decision contexts with current capacity and resources.

Table of Contents
Introduction .......................................................................................................................... 1
Part 1. Ecosystem Services Assessment Using BRIs ................................................................. 5
What Are Benefit-Relevant Indicators? ...........................................................................................5
Causal Chains and Conceptual Diagrams .........................................................................................5
Selecting Services: Scope and Scale of Analysis ................................................................................9
Implementing Benefit-Relevant Indicators (BRIs) in Practice .......................................................... 13
Preference Evaluation Methods .................................................................................................... 25
Conclusion ................................................................................................................................... 32
Part 2. Examples of How Ecosystem Services Can Be Incorporated into Federal Decision
Making ................................................................................................................................ 33
Impact Assessment under NEPA .................................................................................................... 33
Impact Assessment under the Endangered Species Act .................................................................. 34
Funding Allocation: USFS Forest Restoration Funding .................................................................... 35
Funding Allocation: Conservation Reserve Program ....................................................................... 36
Compensatory Mitigation for Impacts to Wetlands and Streams .................................................... 37
Performance Metrics .................................................................................................................... 38
Benefit-Cost Analysis under a Regulatory Impact Analysis ............................................................. 39
Natural Resource Damage Assessment.......................................................................................... 40
Cost-Effectiveness Analysis ........................................................................................................... 41
Endnotes ............................................................................................................................. 42
1
Introduction This paper recommends best practices for integrating ecosystem services into federal decision-making processes in the United States. Ecosystem services are generally defined as goods and services provided wholly or in part by ecosystems and that are of value to people. Including ecosystem services in decision making can improve how decisions are made and communicated to the public. Failure to include ecosystem services in decision making can lead to losses in the substantial benefits ecosystems provide to the American public.1 This paper is intended to assist the U.S. government and federal agencies as they develop their own internal guidance on the applications and implementation of ecosystem services analyses in a wide range of decision-making contexts. Among the federal actions driving the need for this resource are new principles and requirements for federal investments in water resources issued by the White House Council on Environmental Quality (CEQ) in 2013 and the 2012 Forest Planning Rule issued by the U.S. Forest Service, both of which request explicit consideration of ecosystem services.2 In addition, the Executive Offices of the President have committed to issue new guidance related to federal decision making and ecosystem services.3 Incorporating ecosystem services at the beginning of decision processes can help inform how agencies define problems and formulate solutions. It can also help ensure that agencies consider the full range of benefits and costs associated with their actions—and particularly those that affect people through changes in ecosystems or natural resources. Although these issues are most obvious for decisions that directly target natural resource issues, they are salient to any decision that directly or indirectly affects ecosystems, natural resources, or the environment. Measures of ecosystem service can be used in a wide range of decision contexts. For example, they might be useful in tracking performance of programs and projects to assess progress toward goals; in comparing outcomes to better allocate funding; in considering the potential effects of natural resource and infrastructure plans, siting decisions, or permit allocation for use of public resources; and in revising rules and regulations that drive implementation of laws such as the Clean Water Act and Clean Air Act. At present, measures of ecosystem service values are incorporated into some but not all federal decisions.4 Even contexts that include some ecosystem service value typically do not quantify all important service values, particularly non-use values (such as cultural, educational, spiritual, or existence values).5 Failure to be inclusive may occur because of resource or time constraints, lack of agency staff expertise, lack of available data, or lack of confidence among agency staff in the methods used to measure different types of value. When ecosystem services values are not used, insight can still be gained by quantifying changes in the underlying ecosystem services that provide those benefits. The treatment of ecosystem services varies widely across agencies and decision contexts. No standard terminology for ecosystem service measures and assessments exists, and the lack of a common vocabulary can generate confusion. Indeed, this is one of the reasons that best practice guidelines are needed.6 We use intuitive terms that can supplant, or be interpreted and aligned with, other terminology moving forward. Establishment of best practices can promote quality and consistency in application, just

2
as the U.S. Environmental Protection Agency’s establishment of risk assessment principles led to improvements in those methods across federal agencies.7 Three best practices can significantly improve and expand ecosystem service considerations in decision making:
Extend assessments beyond purely ecological measures that are not explicitly tied to
people’s values to measures of ecosystem services that are directly relevant to people. This task can be accomplished by using ecosystem service values or preferences or by using measures referred to here as benefit-relevant indicators (BRIs). BRIs reflect well-defined measures of “things valued” by people, because they have a direct causal impact on human welfare.
Assess ecosystem services using well-defined measures that go beyond narrative description
and that are appropriate to the analyses, even when data, time, or resources are limited. A data-based approach greatly facilitates the use of formal methods for structured decision making and clear communication of the decision process. Various measurement scales can be developed for such analyses, including continuous, categorical, rank order, and interval-scale data. The key to such measures is that they can be used subsequently in more formal valuation or decision analysis methods. Narrative descriptions or ambiguously defined categories (e.g., high-medium-low, with no measurable criteria defining these categories) are not best practice.
Include all important services, even those that are difficult to quantify. For federal agencies, “important services” may be defined by legal requirements or policy or by evaluating the magnitude of expected change from an action and the importance of that change to people. Some authorities may allow broad consideration of services across agencies and mandates, like the National Environmental Protection Act (NEPA).8 However, other authorities and mandates are narrower and will not include all services. Although decision making is clearly better when all significantly affected services that matter to people are included, doing so may require increased coordination across authorities, agencies, and other affected entities to achieve this.
The approach described in this paper will be familiar to those involved in federal decisions that typically use economic valuation of benefits or benefit-cost analyses that include non-market values, because BRIs typically form the foundation of these methods (although the term BRI is rarely used within valuation).9 However, unlike benefit-cost analysis, ecosystem service evaluation need not attempt to put everything into monetary terms. Extending the use of BRIs to decisions in which monetary valuation methods are not used can help agencies make decisions that better reflect the public interest. BRIs can be used directly in an intuitive decision-making process or as an input into a formal evaluation process in which preferences are quantified through monetary or non-monetary methods (Figure 1).10 BRIs serve a particularly important function when they represent less tangible non-use values that can be difficult to quantify and are often excluded.11 We
recommend that BRIs with well-defined measurement
scales be the minimum standard for ecosystem services
assessment (Figure 2).
3
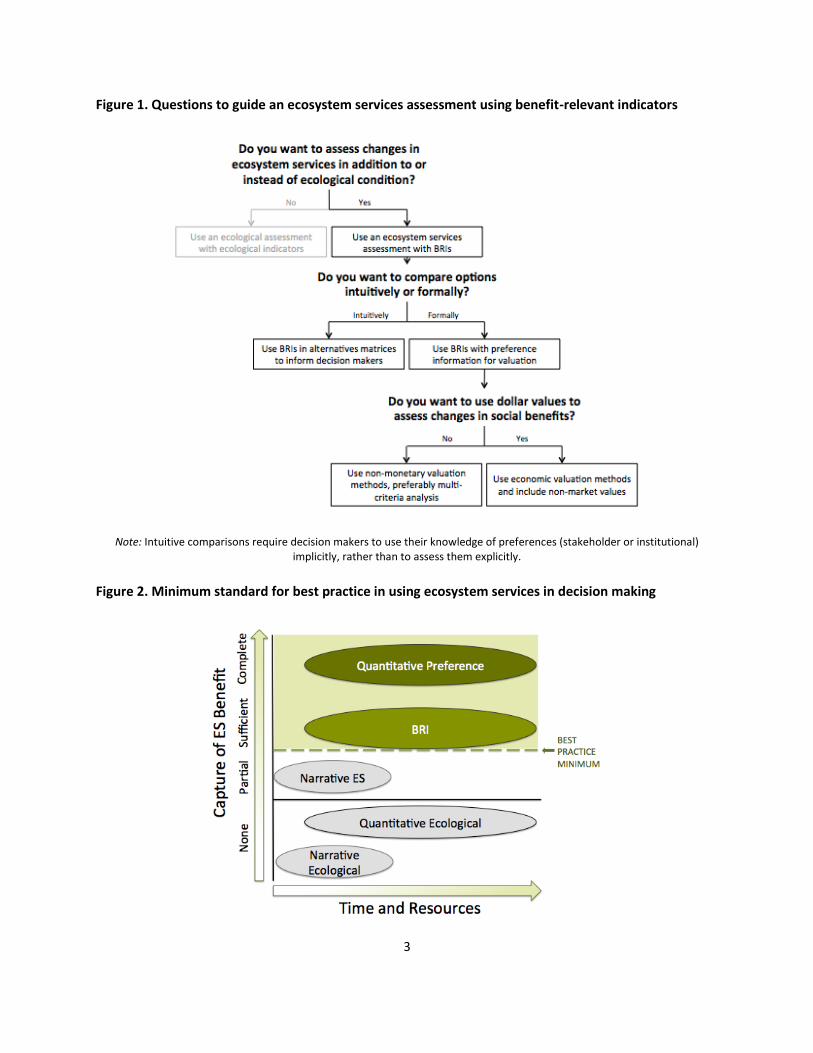
Figure 1. Questions to guide an ecosystem services assessment using benefit-relevant indicators
Note: Intuitive comparisons require decision makers to use their knowledge of preferences (stakeholder or institutional) implicitly, rather than to assess them explicitly.
Figure 2. Minimum standard for best practice in using ecosystem services in decision making

4
Part 1 of this paper describes recommended best practices for moving beyond ecological measures that are not explicitly linked to human benefits to make causal connections from proposed actions to outcomes valued by people. It also provides questions that decision makers can use to determine whether they are applying these best practices. Part 2 provides examples of how ecosystem services can be incorporated into a variety of federal decision-making contexts. Incorporating ecosystem services into decision making using BRIs should help agencies make decisions on the basis of information and assessments that are more complete and better reflect human benefits from nature. Implementing these best practices is easier than is typically realized. In many cases, agencies can apply them without significant changes in capacity or resources.12

5
Part 1. Ecosystem Services Assessment Using BRIs What Are Benefit-Relevant Indicators? Ecological features and processes are essential for the provision of ecosystem services but are not the same as services.13 Until there is some person somewhere who benefits from a given element or process of an ecosystem, that element or process is not a service. Benefit-relevant indicators (BRIs) are measurable indicators that capture this connection by considering whether there is demand for the service, how much it is used (for use values) or enjoyed (for non-use values), and whether the site provides the access necessary for people to benefit from the service, among other considerations.14 BRIs can also be measures of a disservice that result in lower rather than higher benefits. For example, wolves can create a disservice to ranchers who lose livestock to predation. In other cases, BRIs provide positive benefits up to a certain quantity, above which point benefits may become negative. For example, many wildlife species (for example, deer) are valued for recreational (e.g., hunting, viewing) and existence purposes up to a certain density, but at higher densities they are viewed as pests (e.g., due to damage caused to crops and landscaping). Hence, some BRIs will not have an unambiguously positive or negative impact on human welfare and may in fact have positive impacts for some groups in society simultaneous with negative impacts for other groups. Causal Chains and Conceptual Diagrams Many decisions are based, at least in part, on assessments or measures of how a policy, project, or action is likely to affect an ecosystem. A causal chain—also known as a path model or means-end diagram—is a logical model that declares how a management action or policy is expected to propagate through the ecosystem to effect changes in the provision of ecosystem services and benefits to various segments of society. Causal chains in commonly used ecological assessments often end with expected environmental changes and omit impacts on benefits to society. In contrast, a causal chain in an ecosystem services assessment leads to effects on human well-being (Figure 3). Incorporating ecosystem services into causal chains can improve how agencies define problems and formulate solutions by expanding the focus of the decision maker beyond ecological outcomes to social outcomes caused by the ecological changes.15 Ecosystem services assessment starts with development of a conceptual model for the proposed policy, management action, or project that is constructed with causal chains. To ensure best practices are used in building these conceptual models and causal chains, the following questions should be considered sequentially (Figure 3):
How does a policy, management decision, or program action affect ecological conditions? How do changes in ecological conditions lead to changes in the delivery of ecosystem services
(defined as ecological changes that directly influence people)? How do those changes in the delivery of ecosystem services affect benefits or costs to individuals
or groups?
Understanding the benefits and costs of changes in services to people requires some understanding of, or engagement of, affected stakeholders and the general public.

6
Figure 3. Components of an ecosystem service causal chain
Even though an ecological assessment that is not explicitly tied to people’s values can inform a causal chain, it is not sufficient to describe changes in ecosystem services. An ecosystem services assessment must consider how and which changes in the environment affect benefits to people. When causal connections to people are not made explicit, it is unclear whether and how each ecological change is related to changes in social benefits, and important changes to societal benefits may be left out of the analysis. An ecosystem services assessment requires a well-crafted causal chain whereby the indicators used to quantify changes in the supply of services are defined as BRIs. An ecological measure can become a BRI if it is tied directly and causally to something important to people, e.g., the presence of bald eagles, which are clearly identified as important to the American public. Figure 4 compares an ecological assessment with ecological indicators that are not explicitly linked to things people value, to an ecosystem services assessment using BRIs. In this example, resource managers are assessing mechanical thinning of forests to reduce the intensity of fire. An ecological assessment of this option might consider changes in the fuel load, which affects fire intensity (Figure 4a), along with a variety of other biophysical implications. An ecosystem services assessment, in contrast, would extend these causal chains to specific benefits to people that would result from mechanical thinning and the consequent management of fire risk (Figure 4b). There are many ways that people might be influenced by this action. For example, by reducing fire intensity the management action would reduce the incidence of smoke and the extent of poor air quality and exposure, reducing adverse health impacts from fire for nearby residents (e.g., as hospital visits, missed work days, or actual health care costs).16 These considerations extend the ecological assessment to an ecosystem services assessment by including the interaction of people with the ecology (Figure 4b). Best practice for ecosystem services assessment will focus on estimation of changes in ecosystem service values or preferences (blue text in Figure 4), but when time or resources are limiting, the minimum standard for assessment is to focus on BRIs (red text in Figure 4).

7
Where do causal chains stop? Trace the chain through natural systems into the human realm to where it fully captures a benefit to people. By drawing the full causal chain, assessors are ensured that the assessment connects ecology to human benefit. Figure 4. Differences between ecological and ecosystem services assessments and indicators
Note: Causal chains consider expected outcomes from forest fire management activities like mechanical thinning. Black text indicates an ecological assessment and indicators; red text indicates extension to an ecosystem services assessment; indicators within ovals illustrate BRIs; and blue text indicates measures of social benefit and value. The demarcation among ecology, ecosystem services, and social benefits is not absolute (the lines between categories are drawn differently by different people), as represented by the tri-colored arrow.
Constructing a causal chain is a staged process that begins with a simple conceptual mapping that marshals discussion about the scope of the assessment. Indicators are added to the concept map to make the concepts more measurable (e.g., hospital visits). The diagram is often revised with data and information assembled to meet the needs (or capacity) of the analytic assessment. Ultimately, the diagram may be implemented as data-driven models that are used to estimate changes in services expected to result from management or policy actions. Here, we focus on the conceptual mapping; later stages of modeling are addressed in subsequent sections. Developing causal chains is a critical step to ensure that ecosystem services assessments are comprehensive and transparent.17 This causal chain approach to conceptual mapping can help identify how a policy or management action can affect multiple aspects of an ecosystem and how each of the impacts on an ecosystem can have multiple impacts on social benefits (Figure 5). When assessing a policy or management action, development of an initial conceptual diagram with causal chains is useful for considering all possible impacts to valued services. This process will likely identify too many services to be meaningfully quantified in any ecosystem services assessment. Thus, the quantitative assessment can

8
be focused on those effects likely to be most important to the decision—often those expected to have the largest impacts on human welfare (see “Selecting Ecosystem Services” below). To provide an example of these initial conceptual maps, we continue the forestry example with understory thinning. The diagram indicates likely effects on forest structure, which change not only the intensity of fires, but also species habitat, risk of pest and pathogen outbreaks, and forest carbon storage (Figure 5). Each of these ecological changes can then be followed down individual causal chain branches of the conceptual map to one or more ecosystem services and anticipated human benefits. As noted above, these initial conceptual diagrams should be expansive and comprehensive, including all likely changes, even those that are likely to be difficult to measure or model or that are likely to have only minor effects on people. Conceptual diagrams provide information on how ecological changes may matter to people and are often included in a problem definition or scoping process before any measures are formally selected or quantification is initiated. Development of the conceptual diagram often can provide important insights for decision making, because it can identify the full range of pathways through which actions can influence people, whether or not those actions are within an agency’s direct jurisdiction. This mapping exercise presents an opportunity to identify necessary partners and stakeholders.
Figure 5. Conceptual diagram with causal chains for an ecosystem services assessment of a forest
management decision
Note: This conceptual map of simplified causal chains shows possible outcomes from forest fire management activities like mechanical thinning. Black text indicates an ecological assessment and indicators; red text indicates extension to an ecosystem services assessment; and blue text indicates measures of social benefit and value.
9
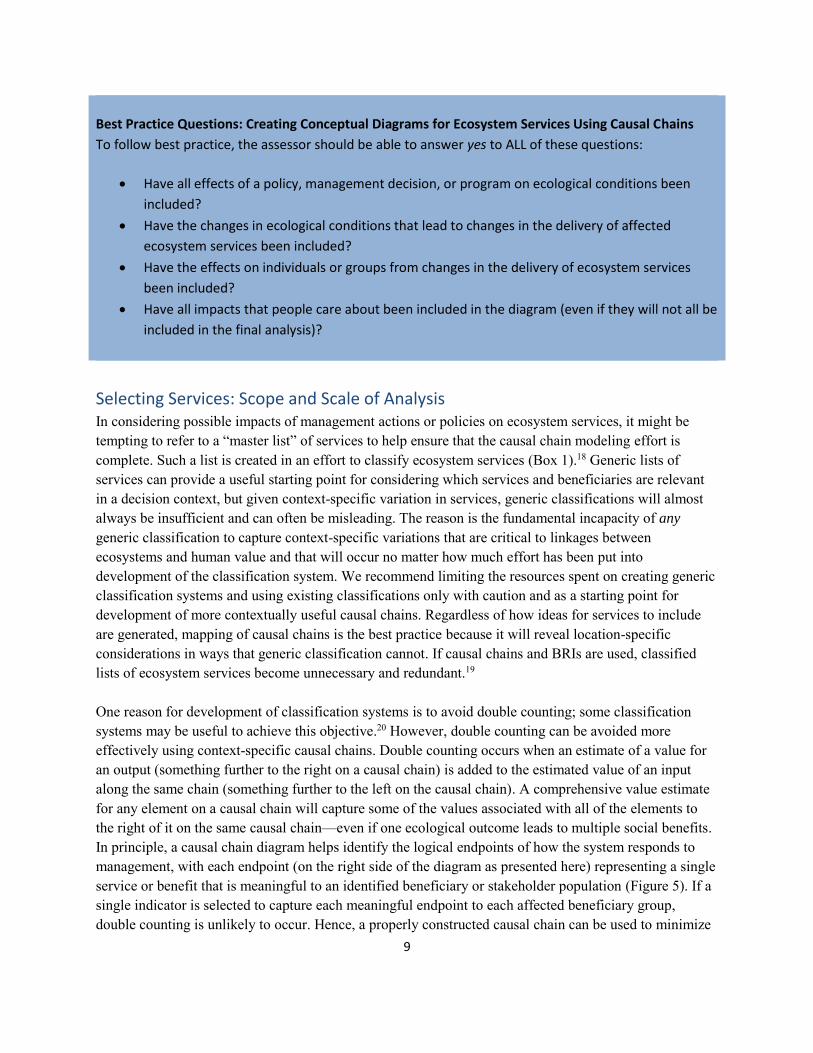
Best Practice Questions: Creating Conceptual Diagrams for Ecosystem Services Using Causal Chains
To follow best practice, the assessor should be able to answer yes to ALL of these questions:
Have all effects of a policy, management decision, or program on ecological conditions been
included?
Have the changes in ecological conditions that lead to changes in the delivery of affected
ecosystem services been included?
Have the effects on individuals or groups from changes in the delivery of ecosystem services
been included?
Have all impacts that people care about been included in the diagram (even if they will not all be
included in the final analysis)?
Selecting Services: Scope and Scale of Analysis In considering possible impacts of management actions or policies on ecosystem services, it might be tempting to refer to a “master list” of services to help ensure that the causal chain modeling effort is complete. Such a list is created in an effort to classify ecosystem services (Box 1).18 Generic lists of services can provide a useful starting point for considering which services and beneficiaries are relevant in a decision context, but given context-specific variation in services, generic classifications will almost always be insufficient and can often be misleading. The reason is the fundamental incapacity of any generic classification to capture context-specific variations that are critical to linkages between ecosystems and human value and that will occur no matter how much effort has been put into development of the classification system. We recommend limiting the resources spent on creating generic classification systems and using existing classifications only with caution and as a starting point for development of more contextually useful causal chains. Regardless of how ideas for services to include are generated, mapping of causal chains is the best practice because it will reveal location-specific considerations in ways that generic classification cannot. If causal chains and BRIs are used, classified lists of ecosystem services become unnecessary and redundant.19
One reason for development of classification systems is to avoid double counting; some classification systems may be useful to achieve this objective.20 However, double counting can be avoided more effectively using context-specific causal chains. Double counting occurs when an estimate of a value for an output (something further to the right on a causal chain) is added to the estimated value of an input along the same chain (something further to the left on the causal chain). A comprehensive value estimate for any element on a causal chain will capture some of the values associated with all of the elements to the right of it on the same causal chain—even if one ecological outcome leads to multiple social benefits. In principle, a causal chain diagram helps identify the logical endpoints of how the system responds to management, with each endpoint (on the right side of the diagram as presented here) representing a single service or benefit that is meaningful to an identified beneficiary or stakeholder population (Figure 5). If a single indicator is selected to capture each meaningful endpoint to each affected beneficiary group, double counting is unlikely to occur. Hence, a properly constructed causal chain can be used to minimize

10
double counting in an ecosystem services assessment because it clearly illustrates these input-output relationships.21 However, no causal chain can eliminate all possibility of double counting. Hence, if the analysis is to proceed to preference evaluation, it is important to involve experts in monetary or non-monetary valuation to ensure that double counting is eliminated or minimized and that all major sources of value are considered (i.e., to avoid under counting as well as double counting). Box 1. Classification Systems
A number of different systems have been developed and are under development to classify ecosystem
services into categories. These systems are intended to increase consistency in use. Decision-specific
classification of services may be helpful in some contexts, though they are never essential. The Common
International Classification of Ecosystem Services (CICES) is being designed to support incorporation of
ecosystem services into national accounts.a National accounts have strict rules about double counting,
but the inconsistent ways that ecosystem services are named and distinguished can make it difficult to
avoid. The CICES classification, if well designed, will help ensure that the rules of the national accounting
decision context are followed. The Environmental Protection Agency is developing two other services
classification systems: the Final Ecosystem Goods and Services Classification System (FEGS-CS) and the
National Ecosystem Services Classification (NESCS).b Both are intended to enhance consistency across
decisions at different scales. Existing classifications should be used with caution and interpreted using
context-specific causal chains.
Notes: a S. Polasky, H. Tallis, and B. Reyers, “Setting the Bar: Standards for Ecosystem Services,” Proceedings of the National Academies of Science of the United States of America 112(24):7356–7361; S. Banzhaf and J. Boyd, “The Architecture and Measurement of an Ecosystem Services Index,” Sustainability 4(4)(2012):430-461; J. Boyd, “The Nonmarket Benefits of Nature: What Should Be Counted in Green GDP?” Ecological Economics 61(4)(2006):716-723. b Common International Classification of Ecosystem Services, 2013, http://cices.eu/.; D.H. Landers and A.M. Nahlik, Final Ecosystem Goods and Services Classification System (FEGS), EPA/600/R-13/ORD-004914, 2013, http://ecosystemcommons.org/sites/default/files/fegs-cs_final_v_2_8a.pdf; P. Sinha and G. Van Houtven, National Ecosystem Services Classification System (NESCS): Framework Design and Policy Application, draft report prepared for the U.S. Environmental Protection Agency, http://water.epa.gov/learn/confworkshop/upload/FINAL-Summ-WS2-NESCS.pdf.
Rather than using classification systems, agencies should focus on identifying ecosystem services and the groups potentially affected by agency actions using causal chains and conceptual maps. Conceptual maps can generally be developed at low cost. The agency can then choose which BRIs, values, or both will be considered further. By proceeding in this manner, the agency acknowledges the full suite of affected ecosystem services and can be more transparent about the services that are (and are not) subsequently analyzed and the rationale for these decisions. Because a full empirical assessment would not be conducted for all services initially identified in a conceptual map, assessors can use a few key questions to determine which services should be included.

11
Does the ecosystem service fall under the legal mandates or authorities of the assessor?
Many laws, and the rules that agencies have developed to implement them, mandate an analysis of specific environmental attributes as well as social impacts, economic impacts, or both. These laws include the National Environmental Policy Act, the Clean Water Act, the Endangered Species Act, the Forest Land Policy and Management Act, and the American Indian Religious Freedom Act, among others. Any ecosystem services assessment conducted under a specific agency mandate will need to include changes to ecosystem services derived from the attributes and impacts specified in that mandate. Other regulations may also require assessments to consider services outside the assessor’s direct jurisdiction. For example, the National Oceanic and Atmospheric Association Fisheries has responsibility for managing anadromous fish, meaning that changes in ecosystem services associated with a river in which fish spawn before migrating offshore must be a consideration in decision making. In addition, these decisions may require consideration of many related services called for by other mandates from the Environmental Protection Agency, soil and water conservation districts, and water treatment facilities. Agencies might not want to invest in analyzing changes to ecosystem services that are outside of their authorities. Yet, broad analysis (or at least a recognition of all affected ecosystem services, whether or not they are subsequently analyzed) can improve understanding of the potential benefits of activities and may provide an opportunity for improved collaboration across agencies and with other affected entities. We emphasize that there is no instance in which agencies are specifically precluded from conducting an analysis with ecosystem services, although the applicability of the resulting information (i.e., whether it can legally be used to inform decisions) varies across agencies and decision contexts.22 Is an impact on the ecosystem service likely to be large and strongly driven by the proposed activity?
If agencies aim to comprehensively assess ecosystem services and potential benefits, an effect on services should be included in the assessment if the policy, decision, or action is likely to have a large impact on it, whether or not the service is the intended target of the action or required by a mandate. For example, the U.S. Forest Service broadly recognizes the importance of the national forest system in providing drinking water to communities and habitat for many aquatic and riparian species. Thus, forest plans should not only focus on direct services, such as wood production, forest species maintenance, and forest jobs, but also on the relationship between forest restoration or timber harvest actions and downstream water uses. Only if the impact of an action on a BRI is insignificant can it be safely excluded from further analysis. When determining whether an impact on an ecosystem service is likely to be significant, the time frame of possible impacts should be matched to the time frame of the action. For example, if the decision is about placing a dam that will exist for 100 years, the magnitude of impacts on that river should be considered over the 100-year time frame. The most appropriate time scale should cover the likely impacts during the project and for the period during which effects will remain substantial.

12
Will the expected changes to the ecosystem service matter to many people or to groups of special
concern?
Answering this question means giving consideration to the “service areas” or “servicesheds” likely to be affected and to how many and which people will be affected by likely changes in a service. A serviceshed captures the area that provides a specific ecosystem service to a specific group of people (Figure 6). Serviceshed boundaries are defined by the area that supports the biophysical production of the service, by relevant access constraints (physical and institutional) to the service, and by demand for the service within that area.23 For example, change in the water quality of a lake popular for recreation affects people who do or would potentially visit the lake, which may include people who live outside of the watershed of the lake. In some cases, there is biophysical supply of an ecosystem service but no realized benefit. Fish abundance for recreational fishing will generate no benefit in a water body where fishing is prohibited by law, or is otherwise inaccessible for recreation (Figure 6, lake 3). If, however, the existence of a place, habitat, or species is what people care about, its condition and continuance is what matters; physical and institutional constraints preventing access do not limit the benefits being realized and the serviceshed including all those who value the particular service can be national or even worldwide. Servicesheds for nonuse values in particular can often span very great distances.24
Figure 6. Hypothetical serviceshed boundaries
Source: H. Tallis, C.M. Kennedy, M. Ruckelshaus, J. Goldstein, and J.M. Kiesecker, “Mitigation for One and All: An Integrated Framework for Mitigation of Development Impacts on Biodiversity and Ecosystem Services,” in review. Note: The serviceshed for recreational fisheries is determined by the accessible lakes (or rivers) with harvestable recreational fish species that are within an acceptable travel time of people. Lakes 4 and 5 are outside the example serviceshed because they lack physical access or are too far away, respectively. Lake 3 is within the potential serviceshed area but is protected, so lacks legal access.

13
A serviceshed captures the population that will be affected and can help decision makers consider where a change in provision of a service may have a large impact on vulnerable populations or other social groups of special concern. All services do not flow to all people equally, and some decision contexts present a requirement to consider those differences. For example, Native American groups have fishing and hunting rights on all federal lands, and a NEPA assessment on such lands should capture impacts to those groups distinctly. A general BRI for commercial fishing benefits would be abundance of fish landed commercially, whereas a group-specific BRI would be abundance of fish landed by Native American groups. When such interests exist, drawing an explicit causal chain for the group of interest can be a helpful way to understand key connections and identify a group-specific BRI.
Best Practice Questions: Selection of Ecosystem Services
To follow best practices, an assessor should include a service in an assessment if he or she answers yes
to ANY of these questions:
Does the ecosystem service fall under the legal mandate of the assessor?
Is the impact on the ecosystem service likely to be large and strongly driven by the proposed
activity?
Will the expected changes to the ecosystem service matter to or affect the social welfare of
many people or groups of special concern?
Agencies may need to collaborate with one another to include services outside their authorities.
Implementing Benefit-Relevant Indicators (BRIs) in Practice Drawing from the general definition of BRIs presented above, this section discusses additional considerations that must be addressed when implementing BRIs in practice. When Is an Indicator a BRI?
Does the indicator reflect changes in ecological condition that are relevant to the beneficiaries?
BRIs must reflect changes in ecological condition (they must be good indicators of the ecological changes), and the changes must be relevant to people. For example, marsh, reef, or mangrove habitat are all known to dampen incoming waves and in so doing, protect coastal areas from erosion and inundation. For this service, habitat area is not the most relevant ecological metric; multiple studies have shown that the leading offshore habitat edge plays a disproportionate role in dampening waves compared with more interior acres of habitat. In this case, contiguity of offshore habitat edge is the appropriate ecological indicator to reflect a step on the causal chain for a coastal protection ecosystem services assessment. An indicator becomes benefit relevant when it is cast in units that resonate with stakeholders as something that affects their welfare proximally (Table 1). For example, “numbers of catchable fish” is more relevant to fishers than other measures such as dissolved oxygen content in the water or an index of biotic integrity—even though water quality might directly influence fish populations. Similarly, in the

14
causal chain connecting a change in forest management to changes in the risks of wildfire, the BRI emerges when fire behavior is translated into units directly relevant to human health (Figure 4b). Likewise, fire behavior might be translated into other BRIs connecting fire to other services of concern for various stakeholder groups such as hikers or homeowners (Figure 5). As a simple rule of thumb, if members of the beneficiary groups affected by an ecological change (e.g., those whose health is affected by airborne particulates) cannot easily understand why an indicator is relevant to their welfare, it is unlikely that the indicator is an effective BRI.
Does the indicator capture relevant physical and institutional access constraints on the flow of the
service?
Many ecological measures and indicators used in ecological assessments fulfill the first requirement of a BRI, because extensive research has identified sensitive interactions in the environment of interest to people. However, a BRI must capture only those ecological components and processes that can be enjoyed or used by people for some benefit. Capturing these components and processes requires information on relevant physical or institutional limits on people’s ability to access (physically or otherwise) a benefit. For example, for the service of timber production, tree density alone is not a sufficient BRI. Physical infrastructure such as roads or features such as terrain may limit tree harvests in some areas. Separately, legal restrictions may limit physical access to areas with trees (e.g., protected areas) or regulate harvest rates or areas (e.g., through riparian buffer restrictions). A BRI must reflect these constraints so that the flow of services is not over-estimated. In this case, a BRI would be the density and size of harvestable trees accessible to forest managers. BRIs are relevant to all ecosystem services, including those with non-use values such as existence, educational, and spiritual values. When people value the existence of an old-growth forest, a historical or culturally important place, or particular species like bald eagles or endangered tortoise, BRIs need to represent the elements that impart value to people, including the presence, quantity, quality, and sustainability of these places, habitats, or species. When species or ecosystems are protected by law, BRIs are likely to consist of well-constructed ecological metrics because laws are evidence of public interest. When a species or ecosystem is not federally protected, agencies may use BRIs to represent other types of evidence of people’s values such as conservation priorities developed by non-governmental groups. Box. 2 What about Intrinsic Value?
There have been lively discussions in the conservation literature about concepts of instrumental versus
intrinsic value and their use in resource management decision making. But concepts of value not linked
to humans and not susceptible to measurement are not relevant to analyses of ecosystem services. A
broad range of values can be incorporated as ecosystem services, including many types of non-use
values (e.g., existence, aesthetic, spiritual, educational) that include some, but perhaps not all, of the
types of value that some authors describe as “intrinsic.”
Sources: L. Maguire and J. Justus, “Why Intrinsic Value Is a Poor Basis for Conservation Decisions,” Bioscience 58 (2008):910–911; H. Tallis, J. Lubchenco, and 238 co-signatories, “A Call for Inclusive Conservation,” Nature 515 (2014):27–28.
15
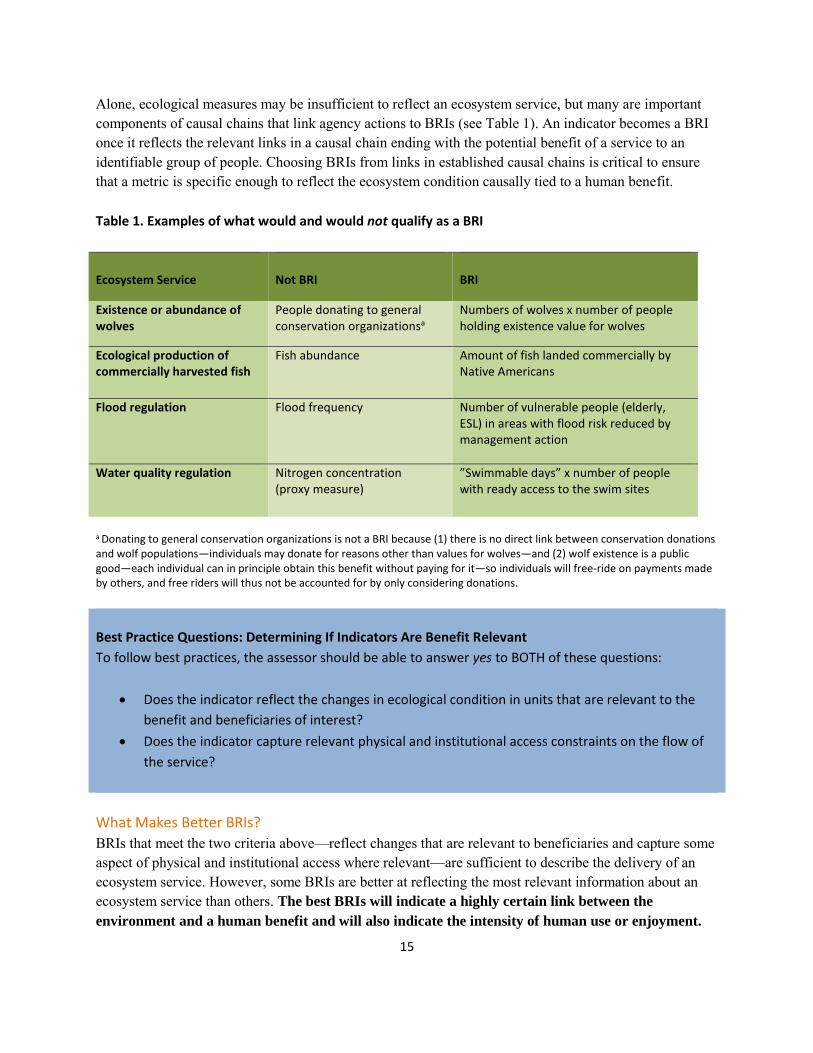
Alone, ecological measures may be insufficient to reflect an ecosystem service, but many are important components of causal chains that link agency actions to BRIs (see Table 1). An indicator becomes a BRI once it reflects the relevant links in a causal chain ending with the potential benefit of a service to an identifiable group of people. Choosing BRIs from links in established causal chains is critical to ensure that a metric is specific enough to reflect the ecosystem condition causally tied to a human benefit.
Table 1. Examples of what would and would not qualify as a BRI
Ecosystem Service
Not BRI
BRI
Existence or abundance of wolves
People donating to general conservation organizationsa
Numbers of wolves x number of people holding existence value for wolves
Ecological production of commercially harvested fish
Fish abundance Amount of fish landed commercially by Native Americans
Flood regulation Flood frequency Number of vulnerable people (elderly, ESL) in areas with flood risk reduced by management action
Water quality regulation Nitrogen concentration (proxy measure)
”Swimmable days” x number of people with ready access to the swim sites
a Donating to general conservation organizations is not a BRI because (1) there is no direct link between conservation donations and wolf populations—individuals may donate for reasons other than values for wolves—and (2) wolf existence is a public good—each individual can in principle obtain this benefit without paying for it—so individuals will free-ride on payments made by others, and free riders will thus not be accounted for by only considering donations.
Best Practice Questions: Determining If Indicators Are Benefit Relevant
To follow best practices, the assessor should be able to answer yes to BOTH of these questions:
Does the indicator reflect the changes in ecological condition in units that are relevant to the
benefit and beneficiaries of interest?
Does the indicator capture relevant physical and institutional access constraints on the flow of
the service?
What Makes Better BRIs?
BRIs that meet the two criteria above—reflect changes that are relevant to beneficiaries and capture some aspect of physical and institutional access where relevant—are sufficient to describe the delivery of an ecosystem service. However, some BRIs are better at reflecting the most relevant information about an ecosystem service than others. The best BRIs will indicate a highly certain link between the
environment and a human benefit and will also indicate the intensity of human use or enjoyment.

16
Causal chains and BRIs
BRIs that capture biophysical outcomes as close as possible to human use, enjoyment, or appreciation are preferred. As causal relationships are established between management or policy actions and various ecological outcomes, indicators along the chain of ecosystem services production can be distinguished on the basis of their distance or proximity to social outcomes.
Consider the following causal chain arising from restoration of a wetland (the policy action) (Figure 7): (1) wetland restoration affects nitrogen levels in surrounding waters, (2) those nitrogen levels affect the
water’s oxygen levels through algal blooms, (3) oxygen levels affect fish mortality and reproduction, and (4) fish mortality and reproduction affect fish abundance in waters used by anglers. Measuring fish abundance in waters used by anglers is a BRI. Measuring wetland restoration is not, unless a tight relationship has already been firmly established between wetland restoration and fish abundance. BRIs that capture intermediate outcomes “earlier” in the causal chain are less desirable than BRIs that capture more final
outcomes “later” in the causal chain, because the earlier BRIs increase the number of links to be established to firmly anchor the measure to benefits. All else equal, therefore, it is preferable to develop indicators that capture “final” biophysical outcomes rather than “intermediate” outcomes. The notion of final ecosystem goods and services (FEGS) is a concept used by a number of agencies. FEGS emphasizes the distinction between “final” and “intermediate” ecological goods and services.25 Final ecosystem goods and services (FEGS) are “components of nature, directly enjoyed, consumed, or used to yield human well-being.”26 Intermediate ecosystem goods and services are ecological processes, functions, structures, characteristics, and interactions that are essential to the existence of final ecosystem goods and services, but are not directly enjoyed, used, or consumed by beneficiaries.27 In some cases, the links between intermediate ecosystem goods and services to final ecosystem goods and services are well established, and a measure of an intermediate ecosystem good or service can be used as a BRI. Carbon sequestration provides a good example. Carbon sequestration is not a final good or service because it is not directly linked to benefits. Rather, carbon sequestration is an input into climate regulation, which is linked to the severity of future climate change and its associated impacts. A large research effort has gone into establishing the causal links between atmospheric CO2 concentrations and climate change and between climate change and potential future damages (from sea level rise, changes in precipitation patterns, and so on) to derive estimates of the social cost of carbon.28 Insistence on measuring only final ecosystem goods and services would not allow measurement of carbon sequestration and the social cost of carbon as an approach. However, it is only because the work has been done to link carbon sequestration to benefits through the social cost of carbon that allows carbon sequestration to be an acceptable BRI.

17
Summarizing the above, BRIs are related to but not the same as FEGS. One of the key features characterizing BRIs is that BRIs are clearly and measurably relevant to human welfare. Hence, all FEGS can and should be measured using BRIs. However, some things that are not FEGS may qualify as BRIs, if causal chains are sufficiently well developed to link those things clearly and measurably to welfare. An example is an intermediate service for which links to FEGS are well established. Hence, from a conceptual perspective, all FEGS are BRIs, but not all BRIs are FEGS. Figure 7. Use of BRIs to assess the fishing benefits derived from wetland restoration
Note: Black text indicates an ecological assessment and indicators; red text indicates extension to an ecosystem services assessment and indicators, with ovals illustrating BRIs; and blue text indicates measures of social benefit and value.
How much uncertainty is there in the measure of the BRI?
Measurement of BRIs often involves considerable uncertainty. The complexity (length) of the causal chain amplifies uncertainty, because information loss occurs at each link of the chain. For example, we will be more confident about the impact of restoration on nitrogen concentrations than we will be about oxygen content and about fish population demography, and still less confident about numbers of catchable fish (Figure 7). Similarly, we might expect some uncertainty about human health impacts of smoke from fires (Figure 4b) because of the propagation of model uncertainties about fire behavior, smoke production, plume dispersion in the airshed, and human response to smoke exposure. It is worth underscoring that one advantage of using causal chain diagrams is that they facilitate communication of these uncertainties. Another source of uncertainty in BRIs arises from the difficulty of measuring impacts in relevant terms. For example, in the case of a commercial fishery we might index “catchable fish” directly from commercial landings. But in other (noncommercial) instances, we might have to be satisfied with estimates of fishing success derived from fishing permits, visitor days, or some other measure imperfectly related to actual numbers of fish caught. Use of proxies should be accompanied by an estimate of confidence in the accuracy of the proxy estimate. When choosing the most suitable BRIs for any particular application, analysts may need to balance the direct proximity or relevance of the measure to benefits with the ability to get accurate information.

18
Does the BRI reflect the intensity of use or enjoyment by people? Additional information about the importance of a service is added when information about the intensity of use or enjoyment of a service is available. For example, knowing whether the affected waters in the wetland example are the most popular fishing areas in the state given their accessibility (averaging 100 people per day during the season) or are highly prized for their beauty but somewhat isolated and used by fewer people (10 people per day during the season) would be helpful. Data on fish mortality and
reproduction can be a sufficient BRI, but number of fish caught would provide some information about the intensity of fishing, making that measure a better BRI. This aspect of a BRI is nicely illustrated by the example of the health impacts of smoke from fire, by developing a BRI explicitly in terms of exposure (how many and which people?) and hazard (how bad is the air?). Even “better” BRIs leave out information about people’s
preferences. For example, people may value a service or good more if it is scarce, if it has no substitutes (other ways to gain goods or services that provide similar benefits), or if it does not require many other inputs (or complements) to produce benefit. Although BRIs lack measures of these components of benefit, they represent a significant advance beyond ecological assessment alone. When feasible, valuation can be used to capture these additional components of benefit. Indeed, BRIs might be viewed as nearly ideal inputs into more formal valuation methods, because they are already in appropriate units, and the relevant stakeholder populations are identified in at least a preliminary way.
How Are BRIs Quantified?
A large body of literature explains how to quantify changes in ecological conditions.29 But these analyses alone are not sufficient, because they typically focus on ecosystem processes or features (e.g., net primary productivity) rather than on benefit-relevant endpoints. In fact, there is far more literature on ecological assessments than on changes in ecosystem services. Once agencies and other organizations start using ecosystem services assessment, the literature on such assessments should expand and mature. Measuring Changes in Ecosystem Services
When assessing or monitoring the ecosystem service outcomes of an action, a direct measure of a BRI can be used. In contrast, predicting changes in the provision of services resulting from management or policy actions (a necessary step for preference evaluation) involves converting the conceptual model depicted as a causal chain into an operational empirical model. There are several ways to measure the relationship between an action (policy, project, management) and its effect on the production of services. These methods differ in the time, resources, and capacity required. A narrative description of changes in
19
ecosystem services could take the least time and resources, but it would not meet the minimum best practice requirement proposed for ecosystem services assessment because it is neither repeatable nor comparable (see Figure 2), nor is it readily used in valuation or decision analysis methods. Informal and formal methods of expert elicitation (e.g., Bayesian belief networks) can be used to generate quantifiable causal chains, including estimates of uncertainty. The empirical method that is likely to take the least time and resources and that meets the proposed best practice is to use existing or to derive new models that use available data (collected by the agency or by others) or a well-established relationships
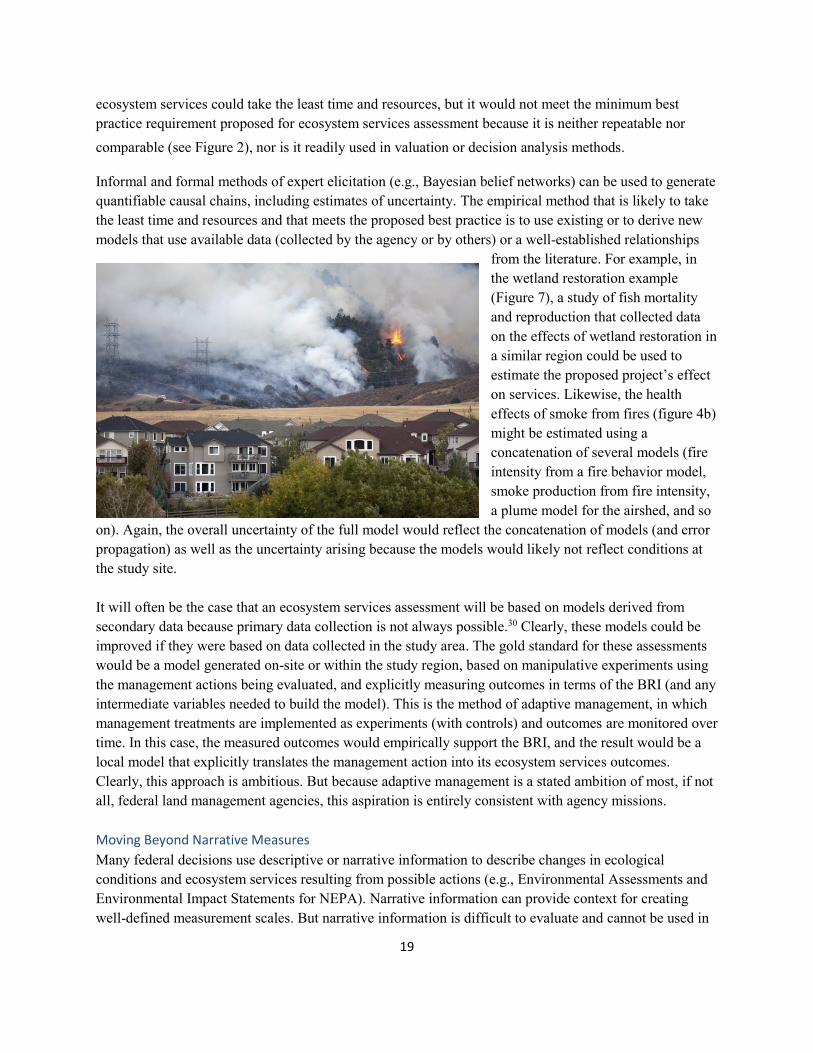
from the literature. For example, in the wetland restoration example (Figure 7), a study of fish mortality and reproduction that collected data on the effects of wetland restoration in a similar region could be used to estimate the proposed project’s effect on services. Likewise, the health effects of smoke from fires (figure 4b) might be estimated using a concatenation of several models (fire intensity from a fire behavior model, smoke production from fire intensity, a plume model for the airshed, and so
on). Again, the overall uncertainty of the full model would reflect the concatenation of models (and error propagation) as well as the uncertainty arising because the models would likely not reflect conditions at the study site. It will often be the case that an ecosystem services assessment will be based on models derived from secondary data because primary data collection is not always possible.30 Clearly, these models could be improved if they were based on data collected in the study area. The gold standard for these assessments would be a model generated on-site or within the study region, based on manipulative experiments using the management actions being evaluated, and explicitly measuring outcomes in terms of the BRI (and any intermediate variables needed to build the model). This is the method of adaptive management, in which management treatments are implemented as experiments (with controls) and outcomes are monitored over time. In this case, the measured outcomes would empirically support the BRI, and the result would be a local model that explicitly translates the management action into its ecosystem services outcomes. Clearly, this approach is ambitious. But because adaptive management is a stated ambition of most, if not all, federal land management agencies, this aspiration is entirely consistent with agency missions. Moving Beyond Narrative Measures
Many federal decisions use descriptive or narrative information to describe changes in ecological conditions and ecosystem services resulting from possible actions (e.g., Environmental Assessments and Environmental Impact Statements for NEPA). Narrative information can provide context for creating well-defined measurement scales. But narrative information is difficult to evaluate and cannot be used in

20
preference evaluation (e.g., economic valuation) or tradeoff analyses. Narrative information is also not easily reproducible or testable in the same ways as information expressed using a well-defined scale. Given these limitations, descriptive narratives alone do not qualify as minimum best practice for
ecosystem services assessments.
In most cases, however, it is relatively easy to transform descriptive narrative data into well-defined categorical or quantitative data that can satisfy minimum best practice. For example, descriptive measures can be transformed into a binary measure of presence and absence, or a categorical measure, or a continuous quantitative measure. Quantitative and categorical measures of ecosystem services will make the services easier to evaluate intuitively and to incorporate into formal valuation or tradeoff analysis, making the services more likely to be fully considered in decisions. For measurements to be effective, their scales must be defined clearly enough to be applied by different users and to different decision contexts with consistent results (e.g., they must be repeatable).31 Numerical measurement scales, whether continuous (e.g., board feet of merchantable timber available from a specified land parcel) or discrete (e.g., numbers of deer taken by recreational hunters during a specified period of time from a specified geographic region), are the most obvious scales, but some categorical measurement scales can also meet these standards. Categorical measurement scales can be used when numerical scales would be inappropriate or when estimation using numerical scales is too difficult or too expensive. An example is a scale describing degree of preservation of a tribal cultural site (e.g., “destroys a specified cultural site,” “preserves the site, but prevents access by tribal members,” and “preserves the site and permits access on specified days”). In another example, categorical data may simply reflect presence or absence, such as the presence/absence of a particular listed species in a specific geographic area during a specific period of time, as determined by an agreed-on detection method. Other types of categories might reflect key thresholds or officially defined categories—for example, whether a population is considered endangered or threatened according to established guidelines. Thresholds between categories need to be defined clearly to provide reliable results. Scales such as “low,” “medium,” and “high” fail to meet this standard of clarity, unless such terms are clearly linked to well-defined thresholds. Categorical measures of BRIs must be defined using a scale that is unambiguous, measurable, and replicable to meet best practice guidelines.32

21
Identifying and Quantifying Who Is Affected
Identification and quantification of those people who could benefit from an ecosystem service—beneficiaries—involves defining the serviceshed and flows of services.33 For a locally used service like municipal water supply, the serviceshed is easily drawn around those using water within the watershed downstream of the policy or project action. For a service used or appreciated by a broader or spatially distributed group of people, like recreational use or cultural appreciation of a particular location, the serviceshed would include the area providing the service and its connections to those using or appreciating the service even if they live scattered about the region. Decision makers need to know not only where these people are, but who they are, how many, and whether they are affected by potential changes in the provision of services (e.g., reduction in flood or fire frequency or intensity). In the absence of a primary study or other direct means to identify the distribution of affected individuals (e.g., a survey conducted using a random sample over the potentially relevant area), indirect means may be used. Although indirect methods are almost always less accurate than direct methods of identifying affected individuals, they can provide sufficient insight for many purposes, particularly when direct methods are infeasible. For example, data from the U.S. census or large-scale surveys like the National Survey on Recreation and the Environment, and perhaps information on what people purchase (e.g., fishing gear or bird identification guides), can help identify and quantify affected people.34 Small reductions in nitrogen oxide and sulfur oxide pollution can have significant health benefits over large areas, which can be characterized from air movement patterns. Direct engagement and outreach with communities and community groups, along with social media and surveys, can also help identify and determine the size of affected communities. A considerable economic literature is devoted to determining the “extent of the market” for ecological benefits (or where benefits occur); this literature details approaches that can be used for various types of applications.35
Best Practice Questions: Measuring BRIs
To follow best practice, the assessor should be able to answer yes to ALL of these questions:
Does the method for estimating the change in BRI capture the causal path from action to change
in ecosystem service?
Is the BRI in an appropriate (well-defined and repeatable) measurement scale and stakeholder-
relevant unit?
Does the method capture relevant changes in demand and access (e.g., intensity of use, number
of people affected, and access)?

22
What Can BRIs Do—and Not Do—for Analysis and Decision Making?
BRIs represent the minimum requirement for measurement that links policy options to ecosystem services analysis. BRIs can be used in intuitive decision making and tradeoff evaluation and as inputs to preference evaluation (monetary and non-monetary approaches). BRIs, when used with non-monetary methods like multi-criteria analysis, can reveal options that produce the highest ecosystem services benefits for a given amount of spending, even when benefits cannot be monetized.36 BRIs in Intuitive Decision Making
Can BRIs stand alone as an input to decision making? Absolutely. By design, BRIs are more informative and intuitive inputs to ecosystem services analysis and stakeholder deliberations than purely biophysical measures or biophysical measures that are less directly relevant to social welfare. When decision makers prefer to form their own judgments, resolve their own tradeoffs, and set their own priorities (or if they lack the time or money to engage in preference evaluation methods), BRIs represent a more precise and transparent alternative to purely narrative claims of ecosystem services production. When a decision is being taken using BRIs, a basic, helpful step can be to construct an “alternatives matrix” that depicts each policy option’s associated (measured or modeled) BRI outcomes (Table 2). Table 2. Alternatives matrix for considering ecosystem services in intuitive decision making
Policy or Management Alternative
Option A
Option B
Option C
Ecosystem Service Benefit-Relevant Indicator
BRI 1
Vegetation density in areas upstream of flood prone area with people or property of interest
BRI 2 Aquifer volume accessible by households
BRI 3 Amount of fish landed commercially
BRI 4 Acres of wetland habitat supporting recreationally important bird or fish species
Source: National Ecosystem Services Partnership, Federal Resource Management and Ecosystem Services Guidebook (Durham: National Ecosystem Services Partnership, Duke University, 2014), https://nespguidebook.com/assessment-framework/alternative-matrices-and-maps/.
23
Evaluating Tradeoffs with BRIs
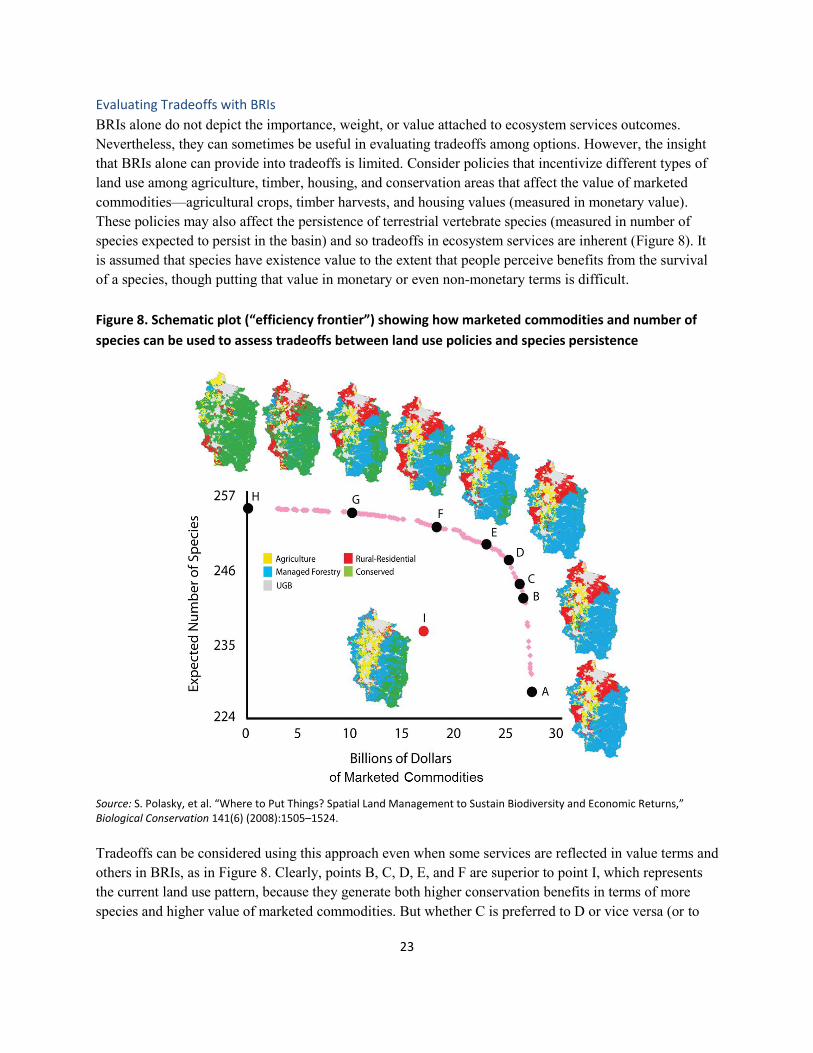
BRIs alone do not depict the importance, weight, or value attached to ecosystem services outcomes. Nevertheless, they can sometimes be useful in evaluating tradeoffs among options. However, the insight that BRIs alone can provide into tradeoffs is limited. Consider policies that incentivize different types of land use among agriculture, timber, housing, and conservation areas that affect the value of marketed commodities—agricultural crops, timber harvests, and housing values (measured in monetary value). These policies may also affect the persistence of terrestrial vertebrate species (measured in number of species expected to persist in the basin) and so tradeoffs in ecosystem services are inherent (Figure 8). It is assumed that species have existence value to the extent that people perceive benefits from the survival of a species, though putting that value in monetary or even non-monetary terms is difficult.
Figure 8. Schematic plot (“efficiency frontier”) showing how marketed commodities and number of
species can be used to assess tradeoffs between land use policies and species persistence
Source: S. Polasky, et al. “Where to Put Things? Spatial Land Management to Sustain Biodiversity and Economic Returns,” Biological Conservation 141(6) (2008):1505–1524.
Tradeoffs can be considered using this approach even when some services are reflected in value terms and others in BRIs, as in Figure 8. Clearly, points B, C, D, E, and F are superior to point I, which represents the current land use pattern, because they generate both higher conservation benefits in terms of more species and higher value of marketed commodities. But whether C is preferred to D or vice versa (or to

24
any other two points on the efficiency frontier) depends on a value judgment about the relative importance of species conservation versus value of marketed goods. Is greater conservation or greater value of commodities preferred? In this case, BRIs help assessors consider the options in intuitive and socially relevant terms, but they do not identify a single best option, without further analysis. An action with positive effects on a greater number of BRIs will not necessarily have greater social value than an action that affects fewer BRIs. In general, the assessor cannot simply count (positively) affected BRIs provided by a system as a proxy for social value. Effects on social welfare depend not only on how many BRIs are affected, but also on the degree of change in each BRI and the relative value of each BRI to all beneficiary groups. Most decision contexts and policy options (environmental or not) involve
tradeoffs that, if they are to be evaluated formally rather than intuitively, require application of
preference evaluation methods.
Using BRIs in Preference Evaluation
An evaluation of preferences is needed if (1) service provision varies substantially across different stakeholder populations, i.e., there are differences of opinion about the outcomes, or (2) changes in services in response to management or policy vary in direction (or magnitude) across services. In either case, tradeoffs will have to be made and that means valuation of some kind. BRIs are important and desirable inputs to preference evaluation.37 Here, we use the broader term preference evaluation to incorporate both economic (monetary) and non-monetary valuation methods. In principle, it is possible to conduct preference evaluation at any point in a causal chain, as long as the relationships between actions and changes in services (i.e., ecological production functions) are known. In some cases, preferences or values are estimated for measures that—although not BRIs in a universal sense—do represent BRIs in a specific context (e.g., a measure of chemical water quality in a context in which that measure has immediate and measurable health implications for people, quantifiable through established models). Regardless of the point on the causal chain at which values or preferences are estimated, the use of clearly defined BRIs improves transparency and defensibility and also clarifies the outcome being valued. Moreover, in general, preferences and values can be estimated with greater certainty when the evaluation (e.g., monetary valuation) is conducted for BRIs that are more directly proximate to human welfare (i.e., are further to the right on the causal chain).38
The validity and accuracy of any subsequent preference evaluation depends on the existence of well-defined, unambiguous biophysical measures. The use of vague or poorly defined biophysical measures will lead to poorly defined or biased measures of value. Put another way, a measure of value can only be as good as the biophysical measure on which it is based. Johnston et al. (2012) and Schultz et al. (2012) discuss desirable properties of biophysical indicators used for valuation.39

25
Best Practice Questions: Determining Whether BRIs without Preference Evaluation Are Sufficient for
the Assessment (If Not, Best Practice Is to Conduct Preference Evaluation)
To follow best practice, the assessor should be able to answer yes to ALL of these questions:
Are impacts on ecosystem services (rather than ecological conditions) being assessed?
For the BRIs in question, is more always better?
Is the direction of the effect on social value the same for all affected people (i.e., are there only
winners or only losers from the actions in question, so that the analysis does not have to
balance gains to some people against losses to others)?
Is use of intuitive decision making with assumed rather than quantified preferences of those
affected expected and sufficient?
And should be able to answer no to ALL of these questions:
Does information on how much different services are valued need to be included?
Are decisions being made on the basis of social welfare, or what is best for the public?
Is an assessment of tradeoffs and relative costs and benefits across alternatives needed?
Is the goal to provide information for a formal cost-benefit analysis or similar evaluation of
economic benefits?
Preference Evaluation Methods Information (for a formal analysis) or assumptions (for an intuitive decision) about social preferences or values are essential for decision makers to draw conclusions about how changes in the provision of ecosystem services will affect social benefits. Even “more is better” conclusions require decision makers to assume a positive relationship between services and social welfare. When a decision involves tradeoffs (e.g., alternative policies that provide more of some BRIs and less of others), it is critical to understand the relative value people place on the different services. Otherwise, it is not possible to know which alternative policy option is preferable. Without preference evaluation, the analysis is left with conclusions regarding quantities of what is valued (e.g., irrigation water) (Figure 9, box A), without any information on how much they are valued (e.g., is more irrigation water worth the investment in wetland restoration?) (Figure 9, Box B). Here, preference evaluation refers to a broad set of analytical methods, including both economic valuation and non-monetary multi-criteria analysis. Value is used in the economic sense to imply well-defined, generally monetary, measures of value. Preference(s) is used to reflect how individuals order outcomes on the basis of the relative satisfaction or enjoyment (i.e., utility) they provide; outcomes that generate greater utility also generate greater value.

26
Figure 9. Ecosystem services supply measured as a BRI (quantities of what is valued, A) and social
benefit (how much the service if valued, B)
Note: The black text shows the ecological assessment and indicators; the red text shows the transition to ecosystem services assessment, with BRIs shown in the circles; and the blue text shows the final benefit as a value. a “Marginal” refers to a small, additional change to an existing quantity. Consequently, marginal crop value would refer to the additional crop value provided by the action under study.
Although we consider quantification with BRIs to be minimum best practice, an ecosystem services analysis will always be more informative when rigorous information on values or preferences is included. Valuation is helpful because a policy that influences a greater number of services is not necessarily superior to a policy that influences fewer. And more of a service is not always better. An increasing quantity of water in a river used for recreation will be a benefit up to a point but becomes a problem once the river begins to flood (i.e., value is not always a monotonic function of ecosystem services quantity). Preference evaluation of various types can help ensure that assessors make appropriate inferences regarding the effect of changes in services on human well-being. One way of expressing people’s preference for a given level of service, or for one service as compared to another, is in monetary terms (economic valuation); another is to form a unitless ranking (using non-monetary methods). Most regulatory impact analyses require economic valuation of some type, and many other types of federal decisions encourage or require some type of valuation. Office of Management and Budget guidance suggests that assessments of significant federal actions should monetize all primary effects that can be monetized.40 Monetary expressions of value are often preferred in federal decisions, in part because of familiarity. Expressing all benefits in a common monetary metric allows for analysis of tradeoffs among services and a clear bottom line in terms of net benefits. However, there are limitations to using monetization to express the value of ecosystem services. In some federal decision contexts, the role of economic values is expressly limited.41 In others, there is reluctance to monetize some kinds of ecosystem services, or the difficulty or expense of estimating monetary values may be large relative to agency resources.42 Other limitations arise from cultural or religious prohibitions on monetizing some kinds of ecosystem services; cultural values to tribes of spiritual and religious artifacts and sites are a frequently cited example.43 Non-monetary methods can be used when dollar values are not desired and when an understanding of the differences among multiple stakeholder groups’ values is preferable to aggregation of those values.
27
Economic Valuation
Estimation of economic values, including both market and non-market values, enables an ecosystem services analysis to:
Identify options that are socially beneficial (or optimal) from the broader set that are feasible, Provide a more informative analysis of tradeoffs, including benefits and costs realized by
different affected groups (who gains and who loses and how much they gain or lose), Demonstrate whether the economic benefits of agency actions (including benefits realized outside
of markets) outweigh the costs (benefit-cost analysis), and
Inform the design of market-based programs to encourage provision of ecosystem services (payments for ecosystem services). For example, estimation of economic values can identify which types of users would be willing to pay to access or use ecosystem services of various types.
Methods for economic valuation have been developed and evaluated over the past five decades and are well established in both the scientific literature and guidance documents (see Box 3).44 Protocols and standards for these methods document the circumstances in which different types of valuation methods are appropriate. Valuation can be conducted at differing levels of accuracy, depending on the reasons for the analysis as well as data, time, and expertise available to conduct the analysis.45 The level of accuracy may also be determined by required regulatory approvals (e.g., the Office of Management and Budget requires approvals for many types of data collection and regulatory analyses).46 An economist trained in monetary valuation can help decision makers ensure that the translation from BRIs to values is based on the application of valid and reliable methods. Valuation can be accomplished using a primary study at the site of interest (generating new valuation data and results) or with benefit
transfer. Benefit transfer uses research results from pre-existing primary valuation studies at one or more sites or policy contexts (often called study sites) to predict economic values at other, typically unstudied sites or policy contexts (often called policy sites).47 Primary data collection is more accurate but generally requires greater time and resources to conduct.48 In either case, specific methods are required to ensure that values meet minimum standards for validity and accuracy.49 In the absence of the expertise required to conduct economic valuation methods, to evaluate them, or both, it is generally preferable to refrain from valuation (i.e., stop the analysis at the quantification of BRIs) rather than to generate values with unknown or questionable validity and accuracy.
28
Box 3. Methods for Economic Valuation Choice of valuation method(s) is determined by the type of values likely to be associated with identified BRIs. Revealed preference methods are based on analyses of observed human behavior—for example, recreation demand and hedonic property value.a The observation that individuals are willing to pay more for homes in areas with clearer surface water, all else held constant, can be used to derive the value of surface water clarity to nearby homeowners.b The factor input method values ecosystem services used as inputs to products sold on markets. Revealed preference methods can measure only use values. Although they are grounded in observed behavior, strong assumptions are often required to link this behavior to unambiguous measures of value.c Stated preference methods are based on analysis of responses to carefully designed survey questions such as those in contingent valuation and choice experiments.d Although sometimes controversial because of their reliance on survey responses rather than observed behavior, they can measure use and nonuse values. Neither revealed nor stated preference techniques are preferred for all applications.e Best practice is to apply the valuation techniques best suited to the services and types of values likely to be significant. Stated preference methods should be used when required to quantify major components of ecosystem service value such as nonuse value or value when no behavior may be readily observed. Analysts also must choose whether to use primary valuation studies to estimate values (either revealed or stated preference) or benefit transfer.f Benefit transfer is the use of research results from primary valuation studies at sites or in policy contexts (often called study sites) to predict economic values at other sites or in other policy contexts (often called policy sites) to approximate economic value to be provided when time, funding, or other constraints prevent the use of primary research to generate this value. Although the use of high-quality primary research is preferred, the realities of the policy process often mean that benefit transfer is the only feasible option to estimate values. When considering the use of primary valuation research versus benefit transfer, the central tradeoff is between the resources and time required for the analysis and the level of accuracy in estimated values. Benefit transfers can generally be conducted more easily than primary valuation, but they almost always involve significant errors. In general, simpler transfer methods generate larger errors.g Notes: a A.M. Freeman, J.A. Herriges, and C.L. Kling, The Measurement of Environmental and Resource Values: Theory and Methods, third edition (Washington, D.C.: RFF Press, 2014); N.E. Bockstael and K.E. McConnell, Environmental and Resource Valuation with Revealed Preferences: A Theoretical Guide to Empirical Models (Dordrecht, The Netherlands: Springer, 2010). b P.J. Poor, K.J. Boyle, L.O. Taylor, and R. Bouchard, “Objective versus Subjective Measures of Water Clarity in Hedonic Property Value Models.” Land Economics 77(4)(2001): 482–493. c Bockstael and McConnell (2010). d I. Bateman, R. Carson, B. Day, W. Hanemann, N. Hanley, T. Hett, M. Jones-Lee, G. Loomes, S. Mourato, E. Ozdemiroglu, D. Pearce, R. Sugden, and J. Swanson, Economic Valuation with Stated Preference Techniques: A Manual (Cheltenham: Edward Elgar Publishing, 2002). e For revealed preference methods challenges, see A. Randall, “A Difficulty with the Travel Cost Method,” Land Economics 70(1)(1994):88–96 and A.M. Freeman, J.A. Herriges, and C.L. Kling (2014). f R.J. Johnston and R.S. Rosenberger, “Methods, Trends and Controversies in Contemporary Benefit Transfer,” Journal of Economic Surveys 24(3)(2010):479–510; R.J. Johnston, J. Rolfe, R.S. Rosenberger and R. Brouwer, Benefit Transfer of Environmental and Resource Values: A Guide for Researchers and Practitioners (Dordrecht, The Netherlands: Springer, 2015). g Ibid. K.J. Boyle, N.V. Kuminoff, C.F. Parmeter, and J.C. Pope, “The Benefit Transfer Challenges,” Annual Review of Resource Economics 2(2010):161–182; R.J. Johnston and R.S. Rosenberger, “Methods, Trends and Controversies in Contemporary Benefit Transfer,” Journal of Economic Surveys 24(3)(2010): 479–510; Johnston, Rolfe, Rosenberger, and Brouwer (2015).

29
Establishing the Link between BRIs and Economic Valuation
BRIs, if chosen appropriately, serve as the necessary ecological or biophysical inputs into economic
valuation models; they are the measures that link biophysical measures or models to valuation
estimates or models. That is, BRIs reflect the things that generate benefits or that are valued (directly or indirectly) within an economic valuation study (see Box 4). A carefully developed causal chain (or means-ends diagram) and a comprehensive set of BRIs associated with any policy action can also help analysts identify all the ways that the action might influence social value—whether through market or non-market channels. In this way, the use of BRIs can help ensure that values of non-market ecosystem services are appropriately recognized. As noted above, superior BRIs will be “closer” to the final services that provide value to people and hence better suited to valuation. That is, valuation models are more accurate and less subject to bias when the included variables are those that directly (rather than indirectly) influence values and behavior.50 The economic literature provides guidance on the choice of specific BRIs for different types of revealed and stated preference valuation, although these works do not necessarily use the “BRI” terminology.51 As noted above, different BRIs will generally link to different values realized by different beneficiary groups. Hence, the most appropriate BRIs for use within any particular valuation model will depend on the type of value being estimated and the type of valuation model being used. This information is the same as that required to define any BRI, regardless of whether valuation will be conducted. For example, an analysis of recreational fishing values would require information on BRIs directly relevant to the behavior and values of recreational anglers such as changes in average or expected harvest rates of targeted species (Figure 7). Box 4. BRIs and the Social Cost of Carbon
Analysts calculating carbon sequestration benefits can leverage an existing government study to
represent the social benefits as dollar values. The “social cost of carbon” has been derived by studies on
the basis of linkages between BRIs (e.g., risks of droughts, flooding, fire, improved crop growth, and so
on) and social value. It was possible to develop this measure because the type and magnitude of the
BRIs do not depend on or vary according to the location of emissions (unlike most other pollutants,
which are not uniformly mixed).
Source: Interagency Working Group on Social Cost of Carbon, United States Government, Technical Update of the Social Cost of Carbon for Regulatory Impact Analysis- Under Executive Order 12866, 2013, https://www.whitehouse.gov/sites/default/files/omb/assets/inforeg/technical-update-social-cost-of-carbon-for-regulator-impact-analysis.pdf.
Accounting for Scope and Scale in Monetary Valuation
Economic values are meaningful only for a particular quantity of a market or nonmarket commodity, relative to a specific baseline. In other words, they are only meaningful when valuing a specific change in the provision of a service. If the change is large (i.e., non-marginal), value estimation must account for the fact that per-unit values for any commodity generally diminish as more of that commodity is obtained (a phenomenon referred to as diminishing marginal utility, where utility is the amount of benefit obtained). For example, a recreational angler is generally willing to pay more per fish to increase her catch from 0 to

30
1 fish than from 99 to 100 fish; the value of a marginal fish depends on how many fish have already been caught.52 In most cases, the change in a BRI cannot be multiplied by a simple “unit value” to arrive at a total value of the change (at least for non-marginal changes); doing so would overlook the fact that marginal values tend to diminish as quantity or quality increases. Similarly, values per unit of area (e.g., per acre) generally cannot be calculated and multiplied by the total affected area. Consequently, applying values determined for one scale of change to another scale of change is inappropriate, making it difficult to estimate regional or national values from local values. In a small number of cases, value scaling may be feasible. An example would be small-scale localized changes in a good valued due to its global consequences (or because it is sold on global markets), such as changes in local greenhouse gas emissions.
Best Practice Questions: Application of Economic Valuation
To follow best practice, the assessor should be able to answer yes to ALL of these questions:
Is the analysis applying established methods for economic non-market valuation (revealed or
stated preference techniques) that include a clear link between monetized values and social
welfare?
Is an economist trained in methods for non-market valuation involved?
Is a marginal change in services (a quantified change from a baseline) being valued?
Are new values being applied to reflect different marginal changes if the scale of the analysis is
changing?
If benefit transfers are used for valuation, do they follow best practices?
Non-Monetary Multi-Criteria Analytical Methods
When monetization of all or some of the ecosystem services measures in an analysis is inappropriate or too difficult to do well, assessors can use a variety of analytical methods with both monetized and non-monetized components to develop a ranking or rating of alternatives with respect to their contributions to stakeholder preferences for ecosystem services. Several of these methods are described in a handbook developed by the London School of Economics to advise local governments on use of multi-criteria analysis.53 Some of the methods (e.g., outranking procedures and the Analytical Hierarchy Process) are less demanding of information on both performance of management alternatives and expressions of preference than others (e.g., multi-attribute utility analysis, or MAUA), but they are correspondingly less transparent and thus less informative for the kinds of multi-party deliberative decision making that often characterizes resource management.54 Although MAUA has been criticized as too time-consuming and too dependent on expertise that agencies may not have, it has the advantage of obliging users to think carefully about all the elements of preference evaluation in a systematic way. There is value in using MAUA concepts to inform decision making when incorporating ecosystem services, even when a full quantification does not appear feasible.

31
Multi-criteria analysis can be used for resource management problems such as impact assessment, in which one alternative must be selected; for resource allocation among potential activities; and for prioritization of targets for action (such as candidates for ESA listing). The stakeholder group selected to assign relative utility to ecosystem services outcomes (or BRIs) will vary depending on whether the agency is aiming to assess general public preferences or to fulfill select mission goals. MAUA will only be considered representative of public preferences if representative members of the public are included. Processes that occur within agencies can only be said to represent agency goals. Multi-criteria analysis has been used in various federal decision contexts, for example, National Estuary Program planning in Oregon and remedial planning for contaminated sites.55 It is useful for comparison of preferences among alternatives but not for estimations of value in any absolute sense. The components and results of analysis are tied to the decision context, including the items being evaluated (e.g., alternative management plans) and the range of performance of those alternatives for each ecosystem service. Multi-criteria analysis can be used at any scale from local to international, but it cannot readily be scaled up or down without a great deal of additional work to establish that preference information is relevant to contexts other than those for which preferences were originally gathered. It is particularly useful for decisions affecting multiple stakeholders and for public decisions requiring a transparent decision process.
BRIs and associated measurement scales represent the ecosystem services being pursued in a particular decision context. Multi-criteria analysis assigns relative preferences to different levels of a single BRI (and these preferences can differ among stakeholders and among decision contexts) and different weights/priorities among multiple BRIs in order to create a single combined metric of overall contribution to ecosystem services.
The Federal Resources Management and Ecosystem Services Guidebook and the accompanying primer on multi-criteria analysis outline good practices for applying multi-attribute utility analysis to a NEPA-type decision process, but the elements apply equally to other types of agency decision making.56 Several books also address practical applications of these methods.57 In addition, U.S. Geological Survey and other federal agencies have developed instructional materials on structured decision making that enable training of agency personnel.58 People who have participated in this training can be called on by agencies that want to apply these tools for non-monetary valuation of ecosystem services.

32
Best practice questions for use of multi-‐attribute utility analysis To follow best practices the assessor should be able to answer yes to ALL of these questions:
• Is an expert trained in multi-‐criteria analysis methods involved? • Are the measures of preference tied to the decision context for which the preference evaluation
input was obtained? Is a quantified difference in the provision of a service being evaluated? • Are the preferences of all parties/stakeholders affected by a decision being assessed to ensure a
transparent process? (If the assessment involves services and interests outside an agency’s authorities, collaboration may be necessary.)
• Are different preferences being assessed to reflect different marginal changes if the scale or other elements of the analysis are changing?
Conclusion Incorporating ecosystem services into federal decision making can change the way a problem is perceived and the way solutions are formulated because decision makers consider not only changes to ecological conditions but also how these changes can affect people. We contend that ecosystem services can be brought into a decision processes using causal chains and conceptual mapping to inform the way options are considered. We recommend—as the minimum standard for ecosystem services assessment—the use of BRIs that go beyond narrative description by using well-defined measurement scales that are compatible with valuation and decision analysis methods. We also recommend use of monetary or non-monetary valuation methods as best practice. We emphasize the importance of considering all important services in assessments, a task that provides an opportunity for agencies and stakeholders to partner and coordinate efforts, particularly when affected services are outside agency authorities. Analysts have multiple options to fit the constraints at hand; existing data or expert elicitation are low-cost options to move beyond narrative evaluations. And last but not least, we suggest that use of BRIs can increase the transparency and defensibility of non-market values in economic valuation.

33
Part 2. Examples of How Ecosystem Services Can Be
Incorporated into Federal Decision Making Impact Assessment under NEPA What is it?
The National Environmental Policy Act (NEPA) of 1970 requires an analysis of the effects of proposed actions with any federal nexus. NEPA is consistent with the use of an ecosystem services approach given its focus on the effects of federal actions on nature and people.59 NEPA addresses an array of projects, from wind turbine siting to assessing the impacts of the proposed Keystone XL Pipeline. How is it currently done?
Traditional environmental assessments (EAs) or environmental impact statements (EISs) evaluate the wildlife, fish, wetland, and other environmental impacts of a set of alternatives. Often these assessments will provide lists of impacts separated by impact types (e.g., wildlife, air, water); sometimes they are descriptive narratives, and sometimes they are quantified measures. They usually do not include changes in benefits provided to people that will flow from proposed alternatives through the environment. How would it change with BRIs?
Consider a moderately simple example: a 10-mile re-routing of state Highway 20 in Oregon from the steep Yaquina River corridor to a shorter, straighter alignment along a forest ridge. The environmental impact statement (EIS) determined there were unavoidable impacts to less than an acre of wetlands, but the project proposed many stream crossings and new culverts, with impacts on fish and water quality. The EIS evaluated the wetlands lost as well as the impacts of both the construction and the highway to fish habitat, including two listed salmon species, and to water quality. The proposed wetlands mitigation involved creating a wetland immediately adjacent to the new highway route that would be as similar as possible to the affected wetlands. The initially proposed mitigation options provided limited ecological benefits and were not acceptable to stakeholders. A group of stakeholders, including the Confederated Tribes of the Siletz Indians and a 501c3 conservation organization, The Wetlands Conservancy, identified a set of conservation priorities that addressed specific ecosystem services, which included increasing populations of the listed fish in Yaquina Bay, where they could be caught, and reduced temperature and sediment to address regulatory water quality needs downstream along the river in the town of Newport, at the mouth of the Yaquina River. These services were measured using benefit-relevant indicators. The proposed mitigation was altered to fund wetland acquisitions at the lower end of the project, where they would provide important rearing habitat for the salmon species of interest. The use of BRIs and the consideration of causal chains also showed that restoration and conservation lower in the watershed would help reduce flood risk to the community of Newport while also reducing temperature and sediment for the Yaquina, helping meet regulatory requirements (Total Maximum Daily Load). Using an ecosystem services-focused approach, the Oregon Department of Transportation has modified its mitigation plan, without adding any project costs.60

34
Impact Assessment under the Endangered Species Act What is it?
Many agencies address potential impacts to endangered species. Under the Endangered Species Act (ESA), impacts by federal agencies or any state or local agencies that needs a federal permit or uses federal dollars will require review, consultation, and, when unavoidable but allowable, mitigation. How is it currently done?
Impacts are generally reviewed under Section 7 of the ESA, and after consultation, the regulatory agency, either NOAA Fisheries for anadromous fish and marine mammals or the U.S. Fish and Wildlife Service for other species, will decide that the proposed action cannot be allowed under the act or requires mitigation. When actions are allowed, any losses must be mitigated. Those proposing the action generally propose mitigation, which can include restoring habitat for the species elsewhere or acquiring credits if an approved species bank exists. In general, the amount and method of required mitigation will be determined by the regulatory agency. In very rare cases, critical habitat regulations (Section 4(b)(2) allow for exceptions if the costs of protecting the habitat outweigh the benefits, and in these cases, a valuation of the costs of the conservation actions is undertaken. How would it change with BRIs?
ESA reviews of impacts to species do not regularly use an ecosystem services framework. Thus, BRIs other than the existence of the endangered species are typically not considered. In general, if a species bank exists, or if the regulatory agencies require specific mitigation actions, the ESA will not allow consideration of other ecosystem services. However, the selection of mitigation actions and the establishment of species banks create the opportunity to use an ecosystem services framework if there are multiple options for species protection and recovery that could provide mitigation. BRIs could be used to consider other benefits provided by mitigation or conservation alternatives where all else is equal for the species. For example, the vernal pool wetlands that support endangered plants and fairy shrimp in California and Oregon may also provide recreational birdwatching or hiking opportunities as well as contribute to water quality regulation or groundwater recharge. Currently, these other benefits are considered when there are overlapping regulatory drivers, such as wetland or stream impacts (regulated under 404 of the Clean Water Act) in addition to the ESA impact. Considering additional services and identifying the causal chain and BRIs for the associated benefits related to the species habitat can help decision makers prioritize choices and increase the overall public good.61 In addition, in the rare cases in which critical habitat protections are challenged on the basis of cost due to Section 4 (b)(2) assertions, the use of relevant BRIs from the causal chains associated with the critical habitat can provide a better evaluation of the cost-benefit tradeoff than the traditional methods.

35
Funding Allocation: USFS Forest Restoration Funding What is it?
Congress provides funding to U.S. Forest Service (USFS) regional offices to distribute to national forests and ranger districts as well as funding to forest restoration cooperatives and many state forestry departments. How is it currently done?
The funding is distributed to each of the regions needing forest restoration and is generally spread across forests on the basis of fire risk and fire-fighting costs. The USFS has developed extensive analytical tools to evaluate fire risk to help focus restoration and research funding.62 When assessing fire risks, the agency considers significant forest resources as well as the life and property risks for homeowners living in and adjacent to forests. The Forest Service already does an exceptional job of evaluating most of the ecosystem services that fire directly affects, but its decisions largely do not consider many indirect, yet important, secondary effects on services. How would it change with BRIs?
Two recent studies provide an opportunity to explore how including BRIs could change methods for allocating forest restoration dollars. The first is a fire restoration study in the Coronado National Forest in the Sky Islands area of south-central Arizona (described in more detail below) and the second is a fire restoration study in the Siskiyou–Rogue River National Forest located in southwestern Oregon and northwestern California.63 In both of these areas, in spite of significant investments and extensive data, fire restoration funding allocations have not considered impacts on water and water availability downstream of impacted forests. In Arizona, the Coronado Forest staff worked with a University of Arizona–The Nature Conservancy cooperative to evaluate fire risk to forest resources as well as to sensitive adjacent non-forest Sonora Desert vegetation.64 In addition to the forest resources and fire impacts on the adjacent desert, the cooperative evaluated recreational effects on the large population of nearby Tucson. If the cooperative had used a broader ecosystem services approach, it would have selected services that may have altered funding allocations. As is the case with many forests, the Coronado National Forest serves as the headwaters for a number of streams. An adjacent project in the San Pedro Watershed involved the U.S. Geological Survey and the Bureau of Land Management, both of which were working with local communities to address limited water availability for in-stream water needs for riparian vegetation and associated endangered songbirds.65 The use of an ecosystem services assessment would have identified an additional set of BRIs related to water availability for adjacent communities and habitats, resulting in a more comprehensive strategy with cross-agency data and analysis. Such an assessment could provide significant efficiencies by avoiding independent investments in aquatic and terrestrial restoration and duplicative or inefficient actions.

36
Funding Allocation: Conservation Reserve Program What is it?
The U.S. Department of Agriculture’s (USDA) Conservation Reserve Program (CRP) pays agricultural producers to reestablish valuable land cover to help improve water quality, prevent soil erosion, and reduce loss of wildlife habitat. Programs vary but typically provide a yearly rental payment to farmers who agree to a 10- to 15-year contract to remove environmentally sensitive land from production and to plant species that improve environmental health and quality. To participate in the CRP, producers voluntarily submit offers to USDA that describe the lands on which the conservation activity will occur and the payment requested. The USDA ranks eligible offers on the basis of the environmental benefits and costs of the proposals. In fiscal year 2013, more than 25 million acres were enrolled in the CRP.66 How is it currently done?
The environmental benefits of lands offered for enrollment in the CRP are evaluated using an environmental benefit index (EBI).67 The EBI is primarily based on on-site factors, such as the type and diversity of planted vegetation and soil characteristics affecting erosion and leaching potential. It also includes certain landscape-related measures, such as proximity to priority conservation, air quality, or water quality zones designated by USDA and states. To the extent that those zones are designated in relation to social outcomes, the EBI can reflect social objectives and outcomes. How would it change with BRIs?
Because the EBI already features and rewards conservation in various priority zones, it would be natural and relatively straightforward to apply BRIs to the determination of those priority zones. For example, a CRP offer’s water quality score is determined in part by the property’s location in a state-defined water quality zone. BRIs could be used to identify and re-define water quality zones by combining information on water quality problems with data on municipal and industrial water uses affected by impaired water quality or volumes of water requiring treatment for such uses. BRIs could also be used to identify and re-define water quality zones on the basis of the water’s potential for recreation (angling, swimming, and boating). A CRP offer’s wildlife score is determined by the type of planted vegetation, but offers are eligible only if they lie within designated priority wildlife areas. Again, BRIs could be used to identify and re-define those priority areas. Currently, states determine priority areas on the basis of specific species’ habitat needs. BRIs could be used to analyze the beneficiaries and social outcomes arising from increased species abundance by, for example, tracking the number and location of hunters, anglers, and other recreators who would benefit from increased abundance. Notably, EBI water quality scoring already includes a BRI that relates a property’s leach index score (a proxy for nutrient and pesticide export to groundwater) to a measure of the population that utilizes groundwater for drinking.68

37
Compensatory Mitigation for Impacts to Wetlands and Streams What is it?
Under the Clean Water Act, authorization is required for the discharge of dredged or fill material within U.S. waters. Project proponents must first avoid and minimize impacts and then compensatory mitigation may be required for unavoidable impacts. The U.S. Army Corps of Engineers, through its Regulatory Program, ensures that compensatory mitigation is sufficient to offset unavoidable impacts. In 2008, the Corps and the EPA issued a joint rule for compensatory mitigation that stated, “mitigation...should be located where it is most likely to successfully replace lost...services,” opening the door for a more explicit consideration of services.69 How is it currently done?
Many states have developed assessment methods to categorize the type and quality of a wetland and to flag the presence of at-risk species to assess impact and mitigation sites. Ohio has a rapid assessment method that uses a list of yes/no questions to describe the kind of species that use the wetland (endangered, critical habitat, significant breeding area), the wetland type (fen, bog, relict web prairie, estuarine, mature forested), and wetland quality (native or invasive species, acidic, excavated mine site).70 The assessment method also includes a quantitative assessment that reflects continuous and categorical measures of wetland size, surrounding land use, hydrological characteristics, types of modifications, and vegetation type and quality. All of these measures are used to determine the characteristics of the impacted wetland and a mitigation wetland. The only measure that would be considered a BRI in this method is the presence and absence of endangered species, which are clearly identified as important to people by their regulatory status. How would it change with BRIs?
What is missing are measures of changes in other ecosystem services that may be overlooked by a focus on habitat. For example, water-holding capacity or denitrification rates would be the first link in the causal chain of preventing property damage or improving water quality to support human health. These types of measures could indicate whether a mitigation site would provide the same, less, or more flood and nutrient retention services as the affected site, particularly when considered in the context of watershed-scale planning. It would be important to develop BRIs for the full suite of services that the wetlands provide in a region. In some cases, wetlands cool water for fish; in others, they are important for groundwater recharge.

38
Performance Metrics What are they?
Agencies and programs within agencies are required to identify strategic goals and track progress toward them. This information is pertinent to budget and planning oversight by Congress and the Executive Branch. Performance indicators are also a way for agencies to communicate with the broader public about their priorities and performance. Performance metrics take a wide variety of forms and are developed and used at all levels of federal activity. Agency priorities and performance indicators vary widely and resist generalization. With that in mind, two specific examples are considered here. How are they currently done? Example 1
A Department of the Interior (DOI) goal is to promote water conservation in the arid west to increase water supply for agricultural, municipal, industrial, and environmental uses. DOI provides grants for water conservation projects and selects grants in part on the basis of the degree of the need in the location of the project. In developing and selecting water conservation grants, DOI and its partners often evaluate water demand for energy, irrigation, municipal, and other uses. However, in its national performance reporting, DOI provides no information on the beneficiaries of water conservation grants. Instead, the sole performance indicator is the “acre-feet of conservation capacity approved by the grants program.”71 How would they change with BRIs? Example 1
BRI performance reporting would tie increased water conservation capacity to information on the beneficiaries of that capacity, perhaps by sector (municipal, agricultural, industrial, recreation, and households benefitting from increased environmental availability) and the relative scarcity of the water conserved in various locations. Much of this information is already available to DOI through resources like the U.S. Geological Survey’s National Water Census and National Water Use Information Program. How are they currently done? Example 2
An EPA priority goal is to improve, restore, and maintain water quality by reducing nonpoint source pollution. Nonpoint source reductions are pertinent to the development of Total Maximum Daily Load implementation plans for impaired waters by states. However, Section 319 of the Clean Water Act empowers the EPA to provide grant assistance to states to improve nonpoint source pollution reduction efforts (through technical, training, and financial assistance).72 The performance indicator for this priority is “the number of water bodies identified by states as being primarily impaired by nonpoint sources that are now partially or fully restored.”73 The indicator expresses nothing about the social outcomes or beneficiaries of water quality improvements, which may be due to the fact that water quality criteria, rather than social outcome criteria, drive states’ nonpoint source planning. How they would change with BRIs? Example 2
BRI performance reporting would tie improvements in water quality to information on the beneficiaries of those improvements. Direct beneficiaries would include any water treatment facilities (and their customers) requiring removal of nonpoint source pollutants. Indirect, but no less important, beneficiaries would include communities benefiting from recreational, aesthetic, and species-related improvements resulting from pollution reductions. Recreational use, census, and other demographic data could be used to relate the location of water quality improvement to specific types of beneficiary.

39
Benefit-Cost Analysis under a Regulatory Impact Analysis What is it?
Under Executive Order 12866 signed by President Clinton in 1993 and reaffirmed by Executive Order 13563 and signed by President Obama, agencies proposing a “significant regulatory action,” defined as having an annual effect on the economy of at least $100 million, are directed to assess the benefits and costs of regulatory alternatives. In doing so, according to Section 1a of Executive Order 12866 states, “agencies should assess all costs and benefits of available regulatory alternatives, including the alternative of not regulating. Costs and benefits shall be understood to include both quantifiable measures (to the fullest extent that these can be usefully estimated) and qualitative measures of costs and benefits that are difficult to quantify, but nevertheless essential to consider.” The Office of Information and Regulatory Affairs (OIRA) in the Office of Management and Budget coordinates the review of benefit-cost analyses. How is it currently done?
Agencies such as the EPA, National Marine Fisheries Service, and the Department of Transportation regularly conduct benefit-cost analyses of proposed actions. In principle, such analyses should include all benefits and costs and incorporate impacts on the value of ecosystem services. In practice, benefit-cost analyses often omit values associated with many ecosystem services, particularly if those services fall outside of the agency’s direct areas of regulatory emphasis or have values (such as existence values) that are difficult to quantify. Valuing the full range of affected ecosystem services is considered difficult and sometimes beyond the capacity of agencies given resource constraints. Ecosystem services are often mentioned among potential impacts but often are not quantified and are rarely monetized. The EPA’s Guidelines for Preparing Economic Analyses has a section devoted to ecological benefits; this guidance catalogs many of the difficulties inherent in quantifying or valuing ecosystem services.74 More detailed information in this regard has been provided by the EPA Science Advisory Board.75 How would it change with BRIs?
Use of BRIs would help agencies expand the set of ecosystem services routinely considered in benefit-cost analysis. Because they are tied to benefits, BRIs would identify the set of relevant impacts to quantify under a proposed action. Application of market and non-market valuation methods would then be used to monetize benefits. For example, a proposed rule to improve water quality by reducing nitrogen or phosphorus loadings to water bodies should include analysis of impacts on end uses affected by water quality, such as drinking water supplies, recreational use of water bodies (swimming and boating), recreational and commercial fishing, and nature viewing.76 Market and non-market valuation methods exist for each of these end uses. Of course, the impacts on some benefits are not easily quantified, nor are some benefits (e.g., cultural and spiritual values) easily monetized. But use of BRIs focuses attention on what needs to be measured, allowing agencies to speed progress in expanding the set of ecosystem services routinely included in benefit-cost analysis.

40
Natural Resource Damage Assessment What is it?
The Comprehensive Environmental Response, Compensation and Liability Act (CERCLA), the Oil Pollution Act (OPA), and the National Marine Sanctuaries Act (NMSA) establish liability for injury to natural resources. Natural resource damages (NRDs) are damages to land, fish, wildlife, biota, air, water, groundwater, and other resources, including changes in the health of a habitat or population and in the underlying ecological processes on which they rely. The statutes create a compensable monetary liability for damage, which in turn requires calculation of the monetary value of the damage. NRD assessment refers to practices that quantify the restoration actions or monetary penalties required of liable parties. The goal of NRD liability law is to “make the environment and public whole” following a pollution event. In principle, meeting this goal requires measurement not only of biophysical losses but also of associated social and economic losses (i.e., the value of lost ecosystem goods and service benefits). BRIs represent data useful to such measurement. However, due to relatively established case law and administrative rules governing NRD assessments, there is relatively little scope for application of BRIs under OPA and CERCLA. How is it currently done?
Agencies responsible for calculating NRDs in general rely on “replacement cost” as the measure of damages as opposed to measuring the social benefit lost as a result of the damage. This practice was established in a 1989 case, Ohio v. Department of Interior, in which the court strongly favored the use of restoration costs as a basis for damages. In 1996, NOAA followed the 1994 DOI rules with its own rules, to be applied to assessments authorized under OPA. And in 2008, the DOI issued new regulations allowing but not mandating this approach. Prior to these cases, damage assessment procedures emphasized determination of a monetary value for the loss of use of the injured resources, followed by determination of how to spend that money on the highest-value restoration projects. Now the primary goal of assessment is timely, cost-effective restoration of the injured natural resources. For example, if an oil spill damages sea grass, the cost of restoring the services provided by the sea grass becomes the measure of damages. This strategy avoids the need to measure lost social benefits, because the point is to replace the resource through restoration. It is clearly much easier to solicit restoration bids based on costs in damage negotiations than to conduct an ecological and economic assessment of lost goods and services. The drawback is that replacement costs can, depending on the circumstances, exceed or fall short of the lost benefit. How would it change with BRIs?
Application of BRIs to NRD assessment is limited, given the established legal and administrative preference for replacement cost-based damage measures. However, one aspect of NRD assessment—compensation for “interim losses”—is a potential exception. In addition to restoration and replacement costs, the rules allow for damages due to the loss in social value experienced between the time of injury and full restoration, which can sometimes take decades. Compensation for interim losses, by definition, cannot be achieved through on-site restoration. Additional payments for off-site restoration that replaces damaged resources may be required to compensate for interim losses. BRIs could be used to identify and target such additional restoration activities.77
41
Cost-Effectiveness Analysis What is it?
Cost-effectiveness analysis (CEA) differentiates options on the basis of the costs of achieving a quantitative environmental objective that is typically a simple metric (e.g., acres of wetland restored) but that can also be a compound metric representing multiple outcomes (e.g., sum of habitat unit gains and losses across multiple species). The U.S. Army Corps of Engineers requires cost-effectiveness analysis for mitigation and ecosystem restoration projects “to identify the least-cost solution for each possible level of environmental output.” Other resource agencies use cost-effectiveness analysis to report program outcomes (e.g., acres of non-native invasive plants treated per dollar spent). Where CEA uses only one outcome, it does not analyze tradeoffs among different types of ecosystem services. How would it change with BRIs?
The role of BRIs in CEA will depend on the environmental objectives of the project. When CEA is being used to choose which projects will be undertaken, the metrics used to judge cost-effectiveness will typically need to match the agency’s missions and program authorites and may be narrowly focused on one or a few services. Alternatively, when agencies aim to maximize a program’s social benefits or show the benefits of lands they already manage or have chosen to restore, many more metrics may be appropriate to use to comprehensively communicate the benefits per dollar spent. In either case, BRIs would modify the simple environmental output metrics to include information on the beneficiaries of restoration (e.g., number of anglers, birders, or other households likely to benefit). Instead of “acres of wetland” restored (not a BRI-based objective), the BRI metric could be defined as “acres of wetland in flood-prone residential areas” or “acres of wetland habitat supporting recreationally important bird and fish species to better reflect the potential for tangible human uses.”78 However, BRIs that characterize potential for human use would not be appropriate for use in CEA to support a decision on how to restore non-use services associated with habitat, and they could distort program intentions. Where multiple metrics are desirable, MAUA or a similar process can provide a quantitative metric of a bundle of diverse ecosystem services to use in achieving and demonstrating program cost-effectiveness.

42
Endnotes
1 National Research Council, Valuing Ecosystem Service: Towards Better Environmental Decision Making (Washington, D.C.: National Academies Press, 2005); National Ecosystem Services Partnership, Federal Resource Management and Ecosystem Services Guidebook (Durham: National Ecosystem Services Partnership, Duke University, 2014), https://nespguidebook.com; President’s Council of Advisors on Science and Technology, Sustaining Environmental Capital: Protecting Society and the Economy (2011), https://www.whitehouse.gov/sites/default/files/microsites/ostp/pcast_sustaining_environmental_capital_report.pdf. 2 The White House, Principles and Guidance for Federal Investment in Water (2013), http://www.whitehouse.gov/sites/default/files/draft_interagency_guidelines_march_2013.pdf; National Forest System Land Management Planning, Final Rule, 36 C.F.R. 219 (March 23, 2012), http://www.fs.usda.gov/Internet/FSE_DOCUMENTS/stelprdb5362536.pdf. 3 Council on Climate Preparedness and Resilience, Priority Agenda Enhancing the Climate Resilience of America’s Natural Resources (Washington, D.C.: Council on Climate Preparedness and Resilience, 2014), https://www.whitehouse.gov/sites/default/files/docs/enhancing_climate_resilience_of_americas_natural_resources.pdf 4 U.S. Environmental Protection Agency, Environmental Impact and Benefits Assessment for Final Effluent Guidelines and Standards for the Construction and Development Category, EPA-821-R-09-012 (2009); U.S. Environmental Protection Agency, Economic Analysis of Final Water Quality Standards for Nutrients for Lakes and Flowing Waters in Florida (Washington, D.C.: U.S. Environmental Protection Agency, 2009). 5 C. Griffiths, H. Klemick, M. Massey, C. Moore, S. Newbold, D. Simpson, P. Walsh and W. Wheeler, “U.S. Environmental Protection Agency Valuation of Surface Water Quality Improvements,” Review of Environmental Economics and Policy 6(1)(2012):130–146; Kristy Wallmo and Daniel K. Lew, “Valuing Improvements to Threatened and Endangered Marine Species: An Application of Stated Preference Choice Experiments,” Journal of Environmental Management 92(2011):1793–1801. 6 D.M. Bauer and R.J. Johnston, “The Economics of Rural and Agricultural Ecosystem Services: Purism versus Practicality,” Agricultural and Resource Economics Review 42(1)(2013):iii–xv; J.W. Boyd and A. Krupnick, “Using Ecological Production Theory to Define and Select Environmental Commodities for Nonmarket Valuation,” Agricultural and Resource Economics Review 42(1)(2013):1–32. 7 In 1983, the National Academy of Science (NAS) published Risk Assessment in the Federal Government: Managing the Process (NRC, 1983*; commonly referred to as the “Red Book”). EPA has integrated the principles of risk assessment from this groundbreaking report into its practices to this day. 8 Dinah Bear, “Integration of Ecosystem Services Valuation Analysis into National Environmental Policy Act Compliance: Legal and Policy Perspectives,” In Federal Resource Management and Ecosystem Services Guidebook (Durham: National Ecosystem Services Partnership, Duke University, 2014), www.nespguidebook.com. 9 Environmental Protection Agency, Office of Policy, National Center for Environmental Economics, Guidelines for preparing Economic Analyses (2014), http://yosemite.epa.gov/ee/epa/eerm.nsf/vwAN/EE-0568-50.pdf/$file/EE-0568-50.pdf; National Marine Fisheries Service, Guidelines for Economic Reviews of National Marine Fisheries Service Regulatory Actions (Silver Spring, MD: National Oceanic and Atmospheric Administration/National Marine Fisheries Service, 2007), http://www.nmfs.noaa. gov/sfa/domes_fish/EconomicGuidelines.pdf; U.S. Department of the Interior, Bureau of Land Management, Guidance on Estimating Nonmarket Environmental Values (Washington, D.C.: Bureau of Land Management, 2013), http://www.blm.gov/wo/st/en/info/regulations/Instruction_Memos_and_Bulletins/national_instruction/2013/IM_2013-131__Ch1.print.html. 10 Evaluation sometimes refers only to economic or monetary valuation methods. In this case, it includes monetary and non-monetary, multi-criteria methods. Both approaches include the preferences and values of people, they just use different units (e.g., dollars versus utilities) to do so.

43
11 Nonuse values reflect the satisfaction people receive from protecting ecosystems or species and are often referred to as existence, bequest, and altruistic values. 12 If agencies are unwilling or unable to use best professional judgment to fill in data gaps, more capacity or resources may be needed. 13 H. Tallis, S.E. Lester, M. Ruckelshaus, M. Plummer, K. McLeod, A. Guerry, S. Andelman, M.R. Caldwell, M. Conte, S. Copps, D. Fox, R. Fuita, S.D. Gaines, G. Gelfenbaum, B. Gold, P. Kareiva, C. Kim, K. Lee, M. Papenfus, S. Redman, B. Silliman, L. Wainger, and C. White, “New Metrics for Managing and Sustaining the Ocean’s Bounty,” Marine Policy 36(2011):303–306. 14 National Ecosystem Services Partnership, Federal Resource Management and Ecosystem Services Guidebook (Durham: National Ecosystem Services Partnership, Duke University, 2014), https://nespguidebook.com/assessment-framework/benefit-relevant-indicators/. 15 Further information for establishing robust conceptual diagrams for ecosystem services is provided in L. Wainger and M. Mazzotta, “Realizing the Potential of Ecosystem Services: A Framework for Relating Ecological Changes to Economic Benefits,” Environmental Management 48(2011):710–733; National Ecosystem Services Partnership, “Ecological Assessments: Means-Ends Diagrams,” Federal Resource Management and Ecosystem Services Guidebook (Durham: National Ecosystem Services Partnership, Duke University, 2014), https://nespguidebook.com. 16 For example, a study from Canada shows the costs of fire on human health: http://www.sciencedaily.com/releases/2006/08/060810211036.htm. 17 National Ecosystem Services Partnership, Federal Resource Management and Ecosystem Services Guidebook (Durham: National Ecosystem Services Partnership, Duke University, 2014), https://nespguidebook.com. 18 Millennium Ecosystem Assessment, Ecosystems and Human Well-Being: Synthesis (Washington, D.C.: Island Press, 2005); Common International Classification of Ecosystem Services (2013), http://cices.eu/.; D.H. Landers and A.M. Nahlik, Final Ecosystem Goods and Services Classification System (FEGS), EPA/600/R-13/ORD-004914, 2013, http://ecosystemcommons.org/sites/default/files/fegs-cs_final_v_2_8a.pdf; P. Sinha and G. Van Houtven, National Ecosystem Services Classification System (NESCS): Framework Design and Policy Application, draft report prepared for the U.S. Environmental Protection Agency. 19 Classification can be time consuming and may provide limited value. One-size-fits all classifications can also be misleading in some instances, because BRIs, beneficiaries, and values are context specific. These classifications are also often poor at representing nonuse values. 20 The Millennium Ecosystem Services Assessment provides a commonly used classification of services. This classification was not generated using a causal chain approach and can result in double counting. 21 More details on how to avoid double counting through use of causal chains and objectives hierarchies can be found in L. Maguire, Multi-criteria Evaluation for Ecosystem Services: A Brief Primer, 2014, https://sites.nicholasinstitute.duke.edu/ecosystemserFseevices/research/publications/. 22 Dinah Bear, “Integration of Ecosystem Services Valuation Analysis into National Environmental Policy Act Compliance: Legal and Policy Perspectives,” in Federal Resource Management and Ecosystem Services Guidebook (Durham: National Ecosystem Services Partnership, Duke University, 2014), www.nespguidebook.com; Paul B. Smyth, “Application of an Ecosystem Services Framework for BLM Land Use Planning: Consistency with the Federal Land Policy and Management Act and Other Applicable Law,” in Federal Resource Management and Ecosystem Services Guidebook (Durham: National Ecosystem Services Partnership, Duke University, 2014), www.nespguidebook.com. 23 H. Tallis and S. Polasky, “Mapping and Valuing Ecosystem Services as an Approach for Conservation and Natural-Resource Management,” Annals of the New York Academy of Sciences 1162(2009):265–283, doi: 10.1111/j.1749-6632.2009.04152; J. Boyd and S. Banzhaf, “What Are Ecosystems?” Ecological Economics 63(2007):616–626. 24 R.J. Johnston, D. Jarvis, K. Wallmo, and D. Lew, “Multi-Scale Spatial Pattern in Nonuse Willingness to Pay: Applications to Threatened and Endangered Marine Species,” Land Economics 91(4), in press.

44
25 Boyd, J. 2007. “The Nonmarket Benefits of Nature: What Should Be Counted in Green GDP?” Ecological Economics 61(4): 716–723; J. Boyd and S. Banzhaf, “What Are Ecosystem Services?” Ecological Economics 63(2007): 616–626; R.J. Johnston and M. Russell. 2011. “An Operational Structure for Clarity in Ecosystem Service Values,” Ecological Economics 70:2243–2249; P. Ringold, J. Boyd, D. Landers, and M. Weber, “What Data Should We Collect? A Framework for Identifying Indicators of Ecosystem Contributions to Human Wellbeing,” Frontiers in Ecology and the Environment 11(2)(2013):98–105. 26 J. Boyd and S. Banzhaf. 2007. “What Are Ecosystem Services?” Ecological Economics 63(2007):616–626. 27 http://unstats.un.org/unsd/envaccounting/seeaRev/meeting2013/EG13-BG-3.pdf. 28 Interagency working Group on Social Cost of Carbon, United States Government, Technical Update of the Social Cost of Carbon for Regulatory Impact Analysis Under Executive Order 12866, 2013 https://www.whitehouse.gov/sites/default/files/omb/assets/inforeg/technical-update-social-cost-of-carbon-for-regulator-impact-analysis.pdf. 29 See, for example, a recent assessment of progress on Mississippi water quality and hypoxia at http://water.epa.gov/type/watersheds/named/msbasin/upload/hypoxia_reassessment_508.pdf, a national wetlands assessment procedure at http://water.epa.gov/type/wetlands/assessment/survey/upload/Wetland-Survey-Fact-Sheetv7.pdf, and a number of USDA examples and guides at http://www.fs.fed.us/emc/rig/ecosystem_assessment.shtml. See also S.A. Bortone, ed., Estuarine Indicators (Boca Raton, Florida: CRC Press, 2005). 30 Primary data are new data observed or collected directly at the site or region of interest for purposes of a particular study. Secondary data are data already collected for another purpose (e.g., a prior study in the literature), often but not always at other locations. 31 National Ecosystem Services Partnership, Federal Resource Management and Ecosystem Services Guidebook (Durham: National Ecosystem Services Partnership, Duke University, 2014), https://nespguidebook.com/assessment-framework/indicators/. 32 E.T. Schultz, R.J. Johnston, K. Segerson, and E.Y. Besedin, “Integrating Ecology and Economics for Restoration: Using Ecological Indicators in Valuation of Ecosystem Services,” Restoration Ecology 20(3)(2012):304–310. 33 H. Tallis, S. Polasky, J.S. Lozano, and S. Wolny. “Inclusive Wealth Accounting for Regulating Ecosystem Services,” in Inclusive Wealth Report 2012: Measuring Progress towards Sustainability (Cambridge: Cambridge University Press, 2012). 34 National Survey on Recreation and the Environment, http://www.srs.fs.usda.gov/trends/nsre-directory/. 35 I.J. Bateman, B.H. Day, S. Georgiou, and I. Lake, “The Aggregation of Environmental Benefit Values: Welfare Measures, Distance Decay and Total WTP,” Ecological Economics 60(2006):450–460; J. Loomis, “Vertically Summing Public Good Demand Curves: An Empirical Comparison of Economic versus Political Jurisdictions,” Land Economics 76(2000):312–321; J.B. Loomis, “How Large Is the Extent of the Market for Public Goods: Evidence from a Nation Wide Contingent Valuation Survey,” Applied Economics 28(7)(1996):779–782. 36 An application of BRIs to support decisions about where to manage invasive species revealed that BRIs with multi-criteria decision support and an optimization framework can identify restoration sites that would generate the largest bundle of ecosystem services for a given level of spending and improve on current decision making. L.A. Wainger, D.M. King, R.N. Mack, E.W. Price, and T. Maslin, “Can the Concept of Ecosystem Services Be Practically Applied to Improve Natural Resource Management Decisions? Ecological Economics 69(2010):978–987. 37 Evaluation sometimes refers only to economic or monetary valuation methods. In this case, it includes monetary and non-monetary, multi-criteria methods. Both approaches include the preferences and values of people, they just use different units (e.g., dollars versus utilities) to do so. 38 J.W. Boyd and A. Krupnick, “Using Ecological Production Theory to Define and Select Environmental Commodities for Nonmarket Valuation,” Agricultural and Resource Economics Review 42(1)(2013):1–32; R.J. Johnston and M. Russell, “An Operational Structure for Clarity in Ecosystem Service Values,” Ecological Economic 70(12)(2011):2243–2249.

45
39 R.J. Johnston, E.T. Schultz, K. Segerson, E.Y. Besedin, and M. Ramachandran, “Enhancing the Content Validity of Stated Preference Valuation: The Structure and Function of Ecological Indicators,” Land Economics 88(1)(2012): 102–120; E.T. Schultz, R.J. Johnston, K. Segerson and E.Y. Besedin, “Integrating Ecology and Economics for Restoration: Using Ecological Indicators in Valuation of Ecosystem Services,” Restoration Ecology 20(3)(2012):304–310. 40 Office of Management and Budget, Guidance on Regulatory Impact Analysis, 2013, http://www.whitehouse.gov/sites/default/files/omb/inforeg/regpol/circular-a-4_regulatory-impact-analysis-a-primer.pdf. 41 Examples include the Clean Air Act, the Endangered Species Act, the Resource Conservation and Recovery Act, the Safe Drinking Water Act, and sections of the Fishery Conservation and Management Reauthorization Act, among many others. See K.J. Arrow, M.L. Cropper, G.C. Eads, R.W. Hahn, L.B. Lave, R.G. Noll, P.R. Portney, M. Russell, R. Schmalensee, V.K. Smith, and R.N. Stavins, “Is There a Role for Benefit Cost Analysis in Environmental, Health and Safety Regulation? Science 272(1996):221–222. A detailed, illustrative discussion of this issue in the context of fish stock rebuilding is provided by Committee on Evaluating the Effectiveness of Stock Rebuilding Plans of the 2006 Fishery Conservation and Management Reauthorization Act, Evaluating the Effectiveness of Fish Stock Rebuilding Plans in the United States (Washington, DC: The National Academies Press, 2014). 42 L. Wainger and M. Mazzotta, “Realizing the Potential of Ecosystem Services: A Framework for Relating Ecological Changes to Economic Benefits,” Environmental Management 48(2011):710–733. 43 R. Winthrop, “The Strange Case of Cultural Services: Limits of the Ecosystem Services Paradigm,” Ecological Economics 108(2014):208–214. 44 P.A. Champ, K.J. Boyle, and T.C. Brown, A Primer on Nonmarket Valuation: The Economics of Non-Market Goods and Resources (New York: Springer, 2003); A.M. Freeman, J.A. Herriges, and C.L. Kling, The Measurement of Environmental and Resource Values: Theory and Methods, third edition (Washington, D.C.: RFF Press, 2014); D.S. Holland, J.N. Sanchirico, R.J. Johnston, and D. Joglekar, Economic Analysis for Ecosystem-Based Management: Applications to Marine and Coastal Environments (Washington D.C.: RFF Press, 2010); National Ecosystem Services Partnership, Federal Resource Management and Ecosystem Services Guidebook (Durham: National Ecosystem Services Partnership, Duke University, 2014), https://nespguidebook.com; Office of Management and Budget, Guidance on Regulatory Impact Analysis, 2003, http://www.whitehouse.gov/sites/default/files/omb/inforeg/regpol/circular-a-4_regulatory-impact-analysis-a-primer.pdf.; U.S. Environmental Protection Agency, Office of Policy, National Center for Environmental Economics, Guidelines for Preparing Economic Analyses, 2014, http://yosemite.epa.gov/ee/epa/eerm.nsf/vwAN/EE-0568-50.pdf/$file/EE-0568-50.pdf; Department of Commerce, National Oceanic and Atmospheric Administration, and National Marine Fisheries Service, Guidelines for Economic Review of National Marine Fisheries Service Regulation Actions, 2007, http://www.nmfs.noaa.gov/sfa/domes_fish/EconomicGuidelines.pdf. 45 With respect to reason for the analysis, more accurate values are required for some types of applications. See J.D. Kline and M.J. Mazzotta, Evaluation of Tradeoffs among Ecosystem Services in the Management of Public Lands, U.S. Department of Agriculture, Forest Service, Pacific Northwest Research Station, General Technical Report PNW-GTR-865, 2012, http://www.fs.fed.us/pnw/pubs/pnw_gtr865.pdf. 46 R. Iovanna and C. Griffiths, “Clean Water, Ecological Benefits, and Benefits Transfer: A Work in Progress at the U.S. EPA,” Ecol Econ 60(2)(2006):473–482. 47 R.J. Johnston and R.S. Rosenberger, “Methods, Trends and Controversies in Contemporary Benefit Transfer,” Journal of Economic Surveys 24(2010):479–510; R.J. Johnston, J. Rolfe, R.S. Rosenberger, and R. Brouwer, Benefit Transfer of Environmental and Resource Values: A Guide for Researchers and Practitioners (The Netherlands: Springer, 2015). 48 B. Allen and J. Loomis, “The Decision to Use Benefit Transfer or Conduct Original Valuation Research for Benefit-Cost and Policy Analysis,” Contemporary Economic Policy 26(1)(2008):1–12. 49 R.J. Johnston, J. Rolfe, R.S. Rosenberger, and R. Brouwer, Benefit Transfer of Environmental and Resource Values: A Guide for Researchers and Practitioner (The Netherlands: Springer, 2015); A.M. Freeman, J.A. Herriges, and C.L.

46
Kling, The Measurement of Environmental and Resource Values: Theory and Methods, third edition (Washington, D.C.: RFF Press, 2014). 50 J. Boyd and A. Krupnick, “Using Ecological Production Theory to Define and Select Environmental Commodities for Nonmarket Valuation,” Agricultural and Resource Economics Review 42(2013):1–32; R.J. Johnston and M. Russell, “An Operational Structure for Clarity in Ecosystem Service Values,” Ecological Economic 70(12)(2011):2243–2249. 51 R.J. Johnston and M. Russell, “An Operational Structure for Clarity in Ecosystem Service Values,” Ecological Economic 70(12)(2011):2243–2249; R.J. Johnston, E.T. Schultz, K. Segerson, E.Y. Besedin, and M. Ramachandran, “Enhancing the Content Validity of Stated Preference Valuation: The Structure and Function of Ecological Indicators,” Land Economics 88(1)(2012):102–120; J. Boyd and A. Krupnick, “Using Ecological Production Theory to Define and Select Environmental Commodities for Nonmarket Valuation,” Agricultural and Resource Economics Review 42(2013):1–32; Ringold et al. 2009, Report from the Workshop on Indicators of Final Ecosystem Services for Streams, EPA/600/R-09/137, http://www.epa.gov/nheerl/arm/streameco/docs/IndicatorsFinalWorkshopReportEPA600R09137.pdf; P.L. Ringold, A.M. Nahlik, J. Boyd, and D. Bernard, Report from the Workshop on Indicators of Final Ecosystem Goods and Services for Wetlands and Estuaries, U.S. Environmental Protection Agency, 2011; P.L. Ringold, J. Boyd, D. Landers, and M. Weber, “What Data Should We Collect? A Framework for Identifying Indicators of Ecosystem Contributions to Human Well-Being,” Frontiers in Ecology and the Environment 11(2013):98–105, http://dx.doi.org/10.1890/110156; E.T. Schultz, R.J. Johnston, K. Segerson, and E.Y. Besedin, “Integrating Ecology and Economics for Restoration: Using Ecological Indicators in Valuation of Ecosystem Services,” Restoration Ecology 20(4)(2012):304–310; M. Zhao, R.J. Johnston, and E.T. Schultz, “What to Value and How? Ecological Indicator Choices in Stated Preference Valuation,” Environmental and Resource Economics 56(1)(2013):3–25. 52 R.J. Johnston, M.H. Ranson, E.Y. Besedin, and E.C. Helm, “What Determines Willingness to Pay per Fish? A Meta-Analysis of Recreational Fishing Values,” Marine Resource Economics 21(1)(2006):1–32. 53 Department of Communities and Local Government, Multi-Criteria Analysis: A Manual, 2009, www.communities.gov.uk. See appendices 1 to 8. 54 Ibid. See outranking procedures in appendices 6 and 7, the analytical hierarchy process in Appendix 5, and multi-attribute utility analysis in appendices 3 and 4. 55 J. Arvai and R. Gregory, “Testing Alternative Decision Approaches for Identifying Cleanup Priorities at Contaminated Sites,” Environmental Science Technology 37 (8)(2003):1469–1476.; R. Gregory and K. Wellman, “Bringing Stakeholder Values into Environmental Policy Choices: A Community-based Estuary Case Study,” Ecological Economics 39(2001):37–52; I. Linkov, A. Varghese, S. Jamil, T.P. Seager, G. Kiker, and T. Bridges, “Multi-criteria Decision Analysis: Framework for Applications in Remedial Planning for Contaminated Sites,” in Comparative Risk Assessment and Environmental Decision Making, ed. I. Linkov and A. Ramadan, 15–54 (Amsterdam: Kluwer, 2004). 56 National Ecosystem Services Partnership, Federal Resource Management and Ecosystem Services Guidebook (Durham: National Ecosystem Services Partnership, Duke University, 2014), https://nespguidebook.com; L. Maguire, “Multicriteria Evaluation for Ecosystem Services: A Brief Primer,” 2014, https://sites.nicholasinstitute.duke.edu/ecosystemservices/research/publications/. 57 R. Gregory, L. Failing, M. Harstone, G. Long, T. McDaniels, and D. Ohlson, Structured Decision Making: A Practical Guide to Environmental Management Choices (Oxford: Wiley-Blackwell, 2012). 58 http://nctc.fws.gov/courses/SDM/home.html. 59 D. Bear, “Integration of Ecosystem Services Valuation Analysis into National Environmental Policy Act Compliance: Legal and Policy Perspectives,” National Ecosystem Services Partnership, Duke University, 2014, http://nicholasinstitute.duke.edu/sites/default/files/publications/frmes_lp_1_nepa_0.pdf. 60 Transportation Research Board, An Ecological Approach to Integrating Conservation and Highway Planning, vol. 2. SHRP 2 Report S2-C06-RW-2, 2012; J.S. Kagan, F.M. Shilling, and L.J. Gaines, “Valuation and Crediting
47
Approaches for Transportation and Metropolitan Planning Agencies,” Transportation Research Record: Journal of the Transportation Research Board of the National Academies 2403(2012):1–8. 61 K. Greer and S. Marina, “Environmental Reviews and Case Studies: Breaking the Environmental Gridlock: Advance Mitigation Programs for Ecological Impacts,” Environmental Practice 12 (3)(2010):227–236. 62 T.C. Bonebrake, A.D. Syphard, J. Franklin, K.E. Anderson, H. Akcakaya, T. Mizerek, C. Winchell, and H.M. Regan, “Fire Management, Managed Relocation, and Land Conservation Options for Long-Lived Obligate Seeding Plants under Global Changes in Climate, Urbanization, and Fire Regime,” Conservation Biology 28(4)(2014):1057–1067; LANDFIRE Program, U.S. Department of Agriculture, Forest Service, http://www.landfire.gov/index.php. 63 J.E. Halofsky, M.K. Creutzburg, and M.A. Hemstrom, Integrating Social, Economic, and Ecological Values across Large Landscapes, U.S. Forest Service General Technical Report, PNW-GTR-986, 2014. J.E. Halofsky, M.A. Hemstrom, D.R. Conklin, J.S. Halofsky, B.K. Kerns, and D. Bachelet, “Assessing Potential Climate Change Effects on Vegetation Using a Linked Model Approach,” Ecological Modeling 266(2013):131–143. 64 B. Gebow, C. Stetson, D.A. Falk, and C. Dolan, “FireScape: A Program for Whole-Mountain Fire Management in the Sky Island Region,” in Merging Science and Management in a Rapidly Changing World: Biodiversity and Management of the Madrean Archipelago III, compiled by G.J. Gottfried, P.F. Folliott, B.S. Gebow, L.G. Eskew, and L.C. Collins, RMRS-P-67 (Fort Collins, CO: U.S. Department of Agriculture, Forest Service, Rocky Mountain Research Station, 2013). 65 A.M. York and M.L. Schoon, “Collective Action on the Western Range: Coping with External and Internal Threats,” International Journal of the Commons 5(2)(2011):388–409. 66 Megan Stubbs, Conservation Reserve Program (CRP): Status and Issues, Congressional Research Service report, 2014, http://nationalaglawcenter.org/wp-content/uploads/assets/crs/R42783.pdf. 67 U.S. Department of Agriculture, Conservation Reserve Program Sign-Up 41 Environmental Benefits Index (EBI), USDA FSA Fact Sheet, http://www.fsa.usda.gov/Internet/FSA_File/crp_41_ebi.pdf. 68 P. Feather, D. Hellerstein, and L. Hansen, Economic Valuation of Environmental Benefits and the Targeting of Conservation Programs: The Case of the CRP, USDA Agricultural Economic Report 778, 1999. 69 J.B. Ruhl, J. Salzman, and I. Goodman “Implementing the New Ecosystem Services Mandate of the Section 404 Compensatory Mitigation Program: A Catalyst for Advancing Science and Policy.” Stetson Law Review 38(2009):251–272. 70 Ohio EPA, Wetland Ecology Unit, Division of Surface Water, Ohio Rapid Assessment Method for Wetlands, v. 5.0. User’s Manual and Scoring Forms, 2001, http://www.epa.state.oh.us/portals/35/401/oram50um_s.pdf. 71 U.S. Bureau of Reclamation, DOI WaterSMART Strategic Implementation Plan, www.usbr.gov/WaterSMART/docs/FedRegister_WaterSMART_Implementation_plan_FINAL.PDF. 72 U.S. Environmental Protection Agency Office of Wetlands, Oceans, and Watersheds, A National Evaluation of the Clean Water Act Section 319 Program, 2011, water.epa.gov/polwaste/nps/upload/319evaluation.pdf. 73 www.performance.gov. 74 U.S. Environmental Protection Agency, National Center for Environmental Economics, Office of Policy, Guidelines for Preparing Economic Analyses (Washington, D.C.: U.S. EPA, 2010, updated May 2014). 75 U.S. Environmental Protection Agency, Valuing the Protection of Ecological Systems and Services: A Report of the EPA Science Advisory Board, EPA-SAB-09-012 (Washington, DC: U.S. Environmental Protection Agency, Science Advisory Board, Office of the Administrator, 2009). 76 B. Keeler, S. Polasky, K.A. Brauman, K.A. Johnson, J.C. Finlay, A. O’Neill, K. Kovacs, and B. Dalzell, “Linking Water Quality and Well-Being for Improved Assessment and Valuation of Ecosystem Services,” Proceedings of the National Academy of Sciences 109(2012):18619–18624. 77 C.A. Jones and K.A. Pease, “Restoration-Based Measures in Natural Resources Liability Statutes,” Contemporary Economic Policy 15(1997):111-122; R. Randle, “The Oil Pollution Act of 1990: Its Provisions, Intent, and Effects,” ELR News and Analysis 21(10119)(1991).

48
78 B. Brandreth and L. Leigh Skaggs, Lessons Learned from Cost Effectiveness and Incremental Cost Analyses, U.S. Army Corps of Engineers-Institute for Water Resources Report 02-R-5, 2012, http://www.iwr.usace.army.mil/Portals/70/docs/iwrreports/02r5cost_eff.pdf.

gj
About the National Ecosystem Services PartnershipThe National Ecosystem Services Partnership (NESP) engages both public and private individuals and organizations to enhance collaboration within the ecosystem services community and to strengthen coordination of policy and market implementation and research at the national level. The partnership is an initiative of Duke University’s Nicholas Institute for Environmental Policy Solutions and was developed with support from the U.S. Environmental Protection Agency and with donations of expertise and time from many public and private institutions. The partnership is led by Lydia Olander, director of the Ecosystem Services Program at the Nicholas Institute, and draws on the expertise of federal agency staff, academics, NGO leaders, and ecosystem services management practitioners.
About the Nicholas Institute for Environmental Policy SolutionsEstablished in 2005, the Nicholas Institute for Environmental Policy Solutions at Duke University improves environmental policymaking worldwide through objective, fact-based research in the areas of climate change, the economics of limiting carbon pollution, emerging environmental markets, oceans governance and coastal management, and freshwater management. The Nicholas Institute is part of Duke University and its wider community of world-class scholars. This unique resource allows the Nicholas Institute’s team of economists, scientists, lawyers, and policy experts not only to deliver timely, credible analyses to a wide variety of decision makers, but also to convene decision makers to reach a shared understanding of this century’s most pressing environmental problems.
National Ecosystem Services Partnership • [email protected] • nespguidebook.com
NICHOLAS INSTITUTEFOR ENVIRONMENTAL POLICY SOLUTIONS
Celebrating 10 Years