Best Management Practices with B3 and Benchmarking
47
CERTs Energy Benchmarking Using B3 Katie Jones CERTs GreenCorps Member
-
Upload
clean-energy-resource-teams -
Category
Education
-
view
1.301 -
download
3
description
Katie Jones, GreenCorps Member with the Minnesota Clean Energy Resource Teams, provides an introduction to the Minnesota B3 Benchmarking system for buildings to help local governments and schools get started.
Transcript of Best Management Practices with B3 and Benchmarking
CERTs
Energy Benchmarking
Using B3Katie JonesCERTs GreenCorps Member
Presenter
Presentation Notes
Hi, as most of you know my name is Katie Jones and I am the GreenCorps member serving with CERTs. I’ve designed the presentation to be a resource, so there are lists of resources on certainly which you may review and when you open up the document that I sent you there is commentary within the notes section to help you review what is on the page.

Contents
1. Why care about energy?
2. Managing energy
3. Benchmarking in B3: Step-by-Step
4. Implementing best management practices: Step-by-Step
7
www.CleanEnergyResourceTeams.org

Step toward self-sufficiency
Acid mine drainage
Ocean acidificationHabitat disturbance
Groundwater contamination
Air quality
National security
Mountain top removal
Accidental spills
Acid rain
Mercury deposition
Money
Why do you care about energy consumption?
Energy Costs
Responsible use of tax dollars
Serving as a model for the community
Why care about energy?
www.CleanEnergyResourceTeams.org
Presenter
Presentation Notes
So to start off, why do you or should you care about using energy? Well, there is a myriad of environmental reasons, issues with national security, increasing self sufficiency, serving as a model for the community….and the biggest driver for concern is of course: Money. Decreasing energy usage directly correlates with decreasing costs – meaning that money is more available for other things and having this shows that tax dollars are being put to better use. Energy costs are one of those soft but very necessary costs for schools and local governments. However, the pain to the coffers due to the variability of energy prices and weather can be lessened if energy consumption is more smartly managed. Also, money saved from using less energy can be put to other uses! Just think of all the possibilities for extra money for your school or local government…
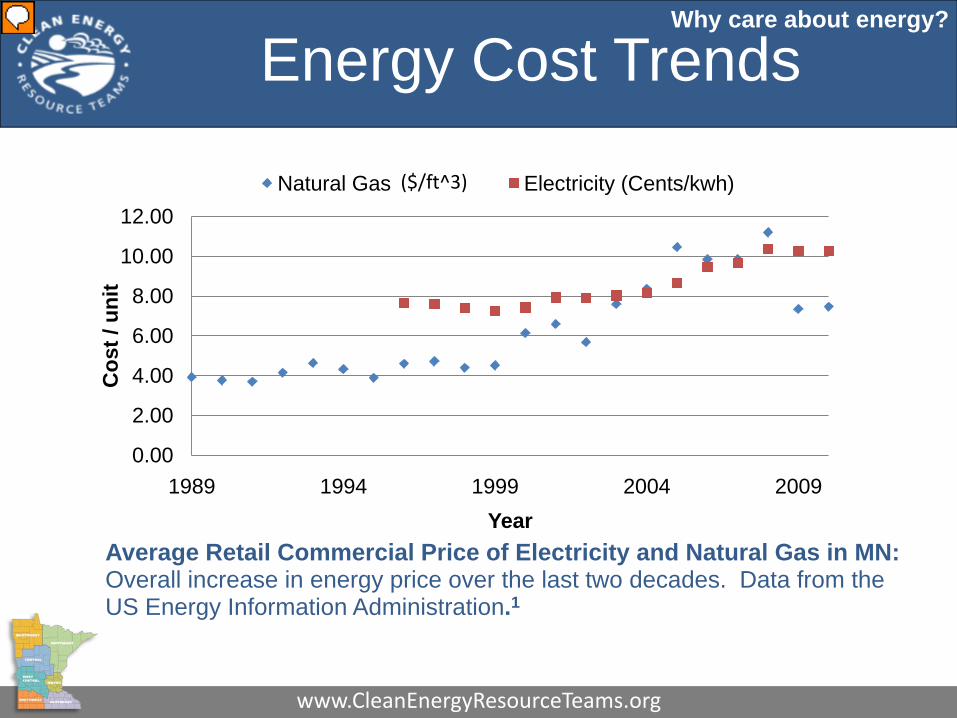
Energy Cost Trends
Heating/AC – 55%
Lights, electronics– 20%
Appliances – 15%Average Retail Commercial Price of Electricity and Natural Gas in MN: Overall increase in energy price over the last two decades. Data from the US Energy Information Administration.1
Why care about energy?
0.00
2.00
4.00
6.00
8.00
10.00
12.00
1989 1994 1999 2004 2009
Cos
t / u
nit
Year
Natural Gas ($/CFU) Electricity (Cents/kwh)($/ft^3)
www.CleanEnergyResourceTeams.org
Presenter
Presentation Notes
This slide exhibits the cost of energy of our most common energy types, electricity and natural gas, during the most recent past for commercial buildings – which is generally what public buildings are considered. Here you can see that the vertical axis measures the cost per unit of natural gas in dollars per cubic foot and electricity in cents/kwh for each year. The general trend as you can see is up in all sectors. And although energy may be a small cost in a budget, but the non-fixed and increasing nature can negatively affect a budget. Therefore, investing now can save much money over the long term. Any questions so far?

Managing Energy
“You can’t manage what you don’t measure.”-unknown-
Thermal comfort measured by a
thermostat
Building performance measured by energy usage by
benchmarking
Student’s knowledge measured by a report
card
Managing energy
www.CleanEnergyResourceTeams.org
Presenter
Presentation Notes
So we know that we need to care about energy, so we need to learn how to manage it. And one of the most useful and effective quotes in this industry is “You can’t manage what you don’t measure.” For example, parent’s don’t know how well a child is learning without a report card, one cannot quantitatively understand and control thermal comfort without a thermostat, and a building’s performance when it comes to energy usage cannot be understood unless it is measured by benchmarking. Benchmarking is a measurement tool just like thermostats and report cards.
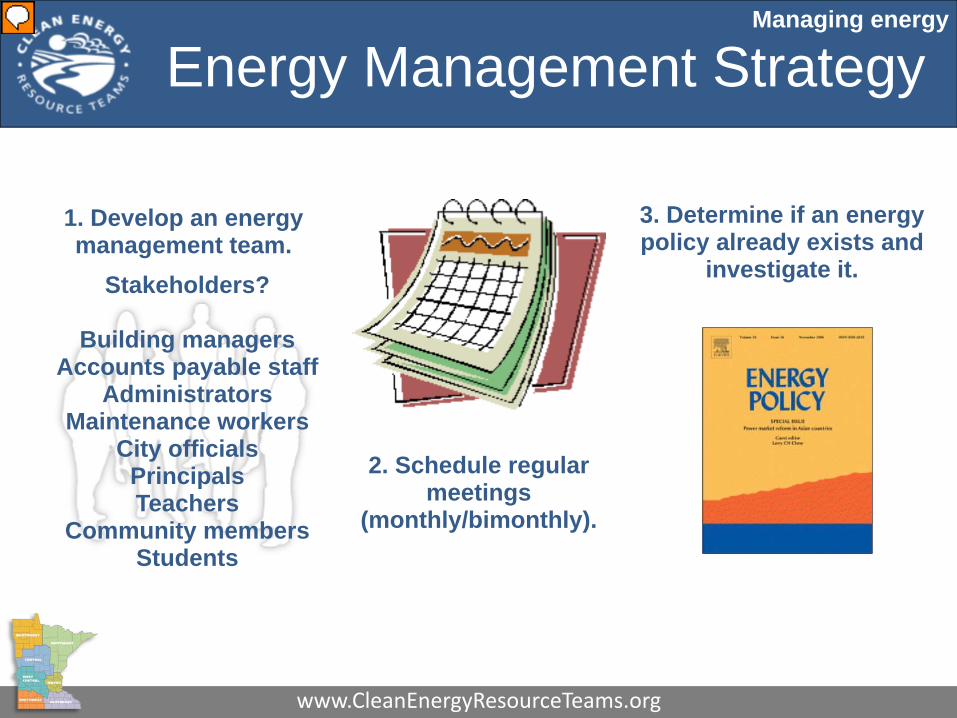
Energy Management Strategy
1. Develop an energy management team.
2. Schedule regular meetings
(monthly/bimonthly).
3. Determine if an energy policy already exists and
investigate it.
Managing energy
Stakeholders?
Building managersAccounts payable staff
AdministratorsMaintenance workers
City officialsPrincipalsTeachers
Community membersStudents
www.CleanEnergyResourceTeams.org
Presenter
Presentation Notes
BUT tools are only effective when they are put to use by people! So the most important part is to first coordinate people. Whose job description involves building management, utility data entering, managing accounts? Who has interest in saving the building energy and money? Involve all interested parties who can commit to following through. Then set regular meetings. Meet at least quarterly to provide guidance and establish next steps for all parties. At those meetings, determine if your organization already has an energy policy. Is the organization living up to the policy? Should changes to the policy be made? Make sure your buildings are abiding by the policies set by the school / local government.

Accountability
4. Set goals. Hold one another accountable.
Make goals concrete, easily understandable, and comparable(kBTU/ft^2/yr)
Make goals public• Newsletters• Signage• TV and radio• Website
5. Provide fun rewards• Limbo by a principal, mayor, students
etc. for each met goal• Host tour of building improvements
Managing energy
www.CleanEnergyResourceTeams.org
Presenter
Presentation Notes
Also at each meeting it is IMPERITIVE to set goals, track performance in achieving those goals, and holding one another accountable. Use targets that are easily understandable and comparable across other buildings/sectors. This may be familiar to some of you, but I wanted to go over it just in case. Building efficiency is most commonly measured by energy use intensity by energy/area/time-period, kBTU/ft^2/year. You may be familiar with the kwh and the therms presented to you on your utility bills. These are units of energy, just like a BTU or British thermal unit. KBTU is simply 1000 BTU of energy. In the energy use intensity, ft^2 is the common area unit, and a year is used as the time period unit, because it takes into account the range of energy used over the different seasons. Now that you know the unit, use it and even use it as an educational tool in schools! Making goals public adds another dimension of accountability. And, since it is for a good cause it should be easier for people to help you to your goal by providing other EE ideas or ways of funding. Use signage, email and paper newsletters, your website, and tv and radio announcements showing the progress towards those goals. I always liked the United Way campaign signs. They publically conveyed that a. a campaign was going on, b. the goal set, and c. how far they have to go to reach the goal in a non-pushy but informative way. A similar thing could be done on a sign using the picture of a plug, a light bulb, a building, a ruler, etc. Be creative! The sign’s design could be a good design project for a high school art or community computer class. Finally, provide fun rewards for accomplishing the goal. A limbo stick featured in a front office could display each goal and a local celebrity would have the pleasure of limbo-ing under that goal line. Another idea would be to have an open house for the improvements made on the building. This not only showcases the good work going on in your building, but it also provides something the community can be proud of and it motivates others in the community to improve their own buildings!
Energy Management Strategy
Quick review:
1. Develop energy management team
2. Schedule regular meetings
3. Investigate energy policy
4. Set goals.
5. Provide fun rewards
Managing energy
Questions?
www.CleanEnergyResourceTeams.org
Presenter
Presentation Notes
Just as a quick review to be successful in decreasing energy usage, you need an energy management strategy. Develop an energy management team with important stakeholders. Schedule regular meetings. Investigate whether an energy policy already exists and use it. Set goals and use some of the tips I provided to provide accountability to the team. And lastly, provide fun rewards – decreasing energy usage is an accomplishment and should be celebrated. Any question so far? Any questions at this point?
B3 BasicsB3: Step-by-step
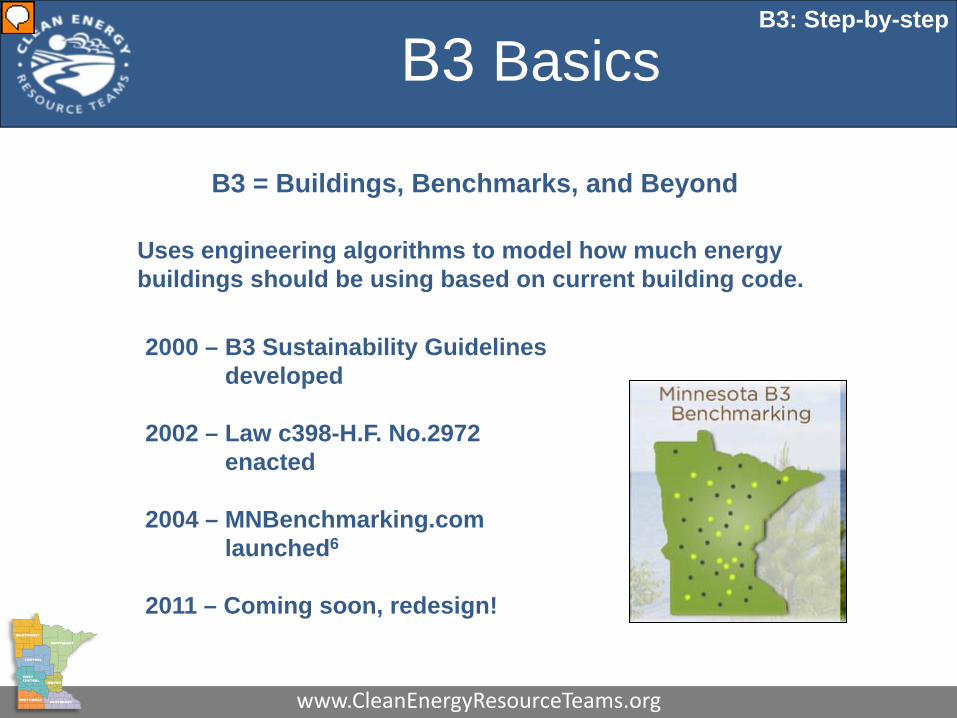
B3 = Buildings, Benchmarks, and Beyond
2000 – B3 Sustainability Guidelines developed
2002 – Law c398-H.F. No.2972 enacted
2004 – MNBenchmarking.com launched6
2011 – Coming soon, redesign!
Uses engineering algorithms to model how much energy buildings should be using based on current building code.
www.CleanEnergyResourceTeams.org
Presenter
Presentation Notes
Ok moving on to B3: Step-By-Step. As just as a short intro to B3, the name stands for Buildings, Benchmarks and Beyond. The program is designed to analyze energy performance in buildings to identify buildings which would benefit most in energy efficiency efforts. The way B3 works is by modeling how much energy buildings should be using if they were built to current building code. This is an effective method for the wide variety of public building types, but it can be limiting at times when certain building types do not exist and not all variables are accounted for. The system has become the primary tool for public buildings in Minnesota. In 2002, a new law specified that energy in public buildings must be tracked and energy efficiency measures with a payback of 10-15 years should be undertaken. B3 has been the best tool for public building managers to use for this purpose. The B3 tool has been operation since 2004 and tracks energy in over 5000 buildings. Also, the tool will soon become more useful in 2011 by providing greater context of building performance relative to other similar buildings.

B3 PollB3: Step-by-step
How confident are you in your ability to utilize B3?
A. Very – I can input building and utility data and use the reporting tab.
B. Fairly – I can input building and utility data.
C. Somewhat – I can input utility data, but not much else.
D. Not at all – I’ve never used B3.
B3 Link : http://www.mnbenchmarking.com/
www.CleanEnergyResourceTeams.org
Presenter
Presentation Notes
Before we move into the section on B3, I’d like to get a sense of everyone’s experience with the tool, so that I am hopefully not bypassing important basics or boring you with things you already know.
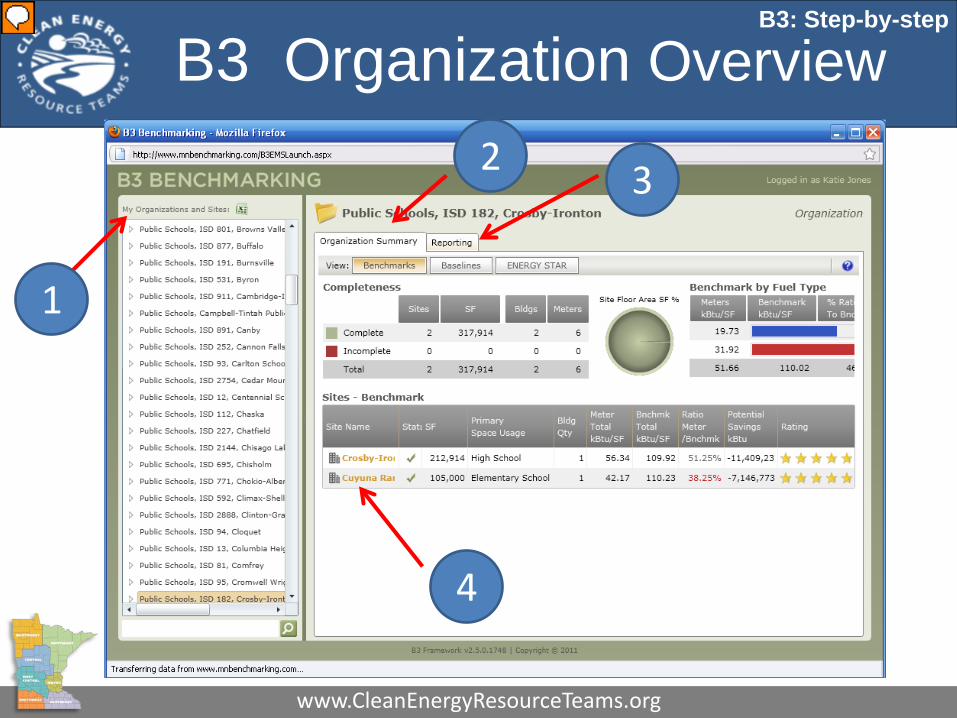
B3 Organization OverviewB3: Step-by-step
1
2 3
4
www.CleanEnergyResourceTeams.org
Presenter
Presentation Notes
List of organizations to which you have access Organization summary tab – provides access to each building called a ‘site’ and overview statistics of organization Reporting tab – provides trend graph and pie charts List of buildings – click on each one to edit building profile, meter data, and understand energy use
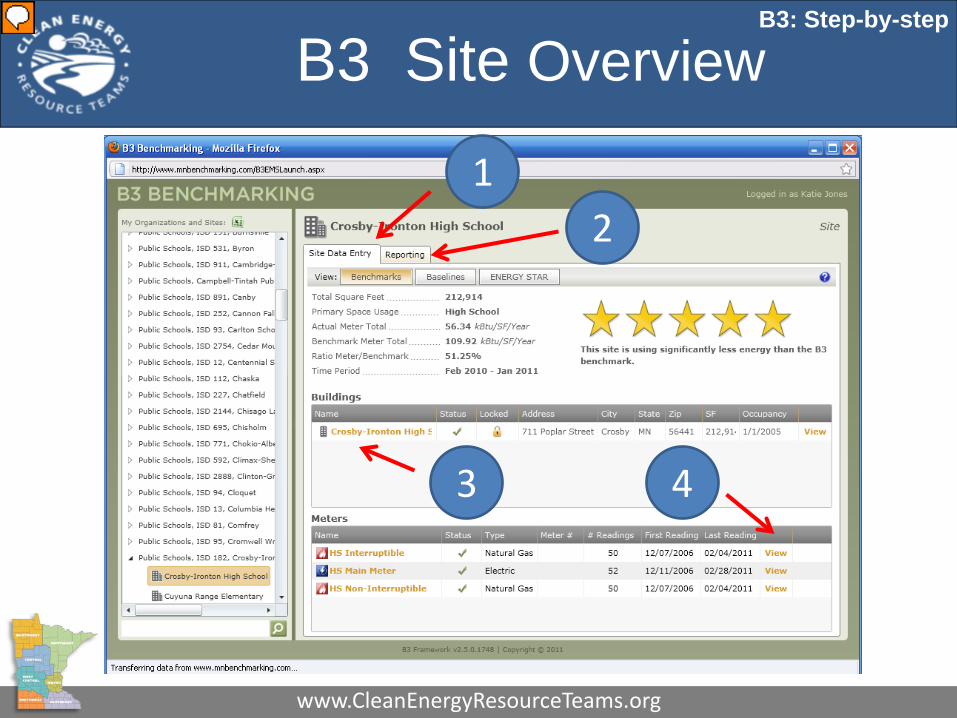
B3 Site OverviewB3: Step-by-step
3
12
4
www.CleanEnergyResourceTeams.org
Presenter
Presentation Notes
Site Data Entry – summary info and data entry location for a specific building Reporting tab – provides trend graph and pie charts for specific building Building summary – click to enter building profile editor List of meters – click on each one to edit meter data, add a new meter by clicking “add new meter”
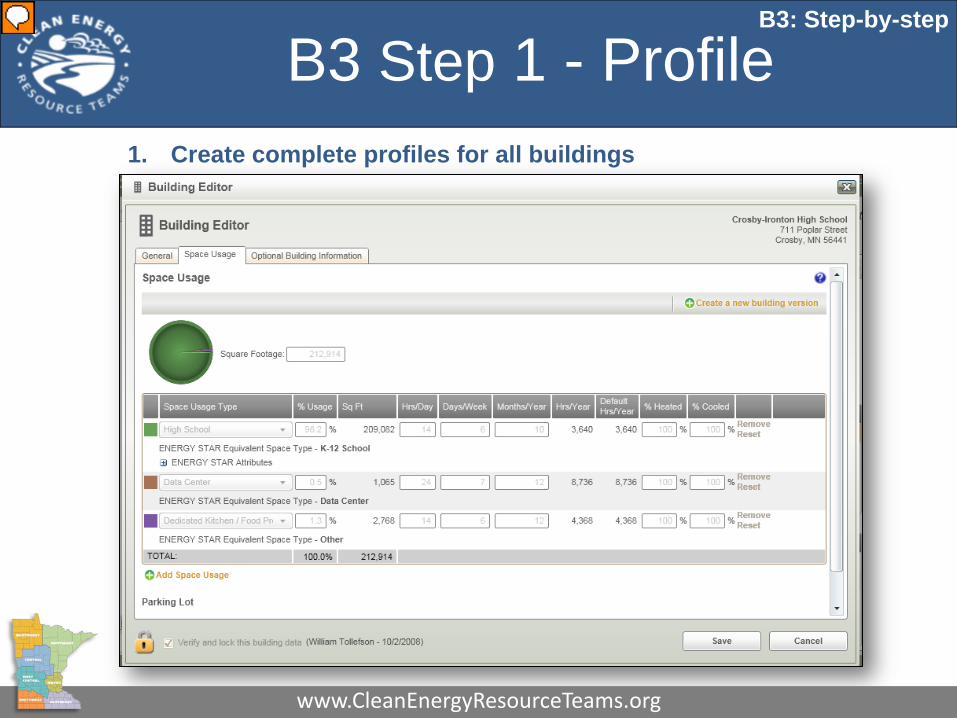
B3 Step 1 - Profile1. Create complete profiles for all buildings
B3: Step-by-step
www.CleanEnergyResourceTeams.org
Presenter
Presentation Notes
The first thing to do once you have a B3 account is to set up a building profile. Crosby-Ironton Schools has graciously allowed me to use their account as an example. Here on this page you enter all of the characteristics of the building, such as the address, what type of space occupies certain areas, the number of occupants, the type of lighting and heating systems, etc. All of your organization s already have this, but it is important that this be as accurate as possible. So if you now know what type of lighting system is in the building or if you just had a energy audit, please update that information here. The characteristics of the building are used to calculate the building’s “benchmark energy use”, which in B3 is how much energy the building should be using based on the characteristics entered if the building were built to the current building code. For example, a typical office space uses X BTU/sq ft/yr. This amount is multiplied by the office space area of the building and incorporated into the total amount of energy the building uses during one year. The “General” and “Space Usage” tabs must be filled out, and it is encouraged to fill out the “Optional Building Info” so that all of your building data is then centered in one location.
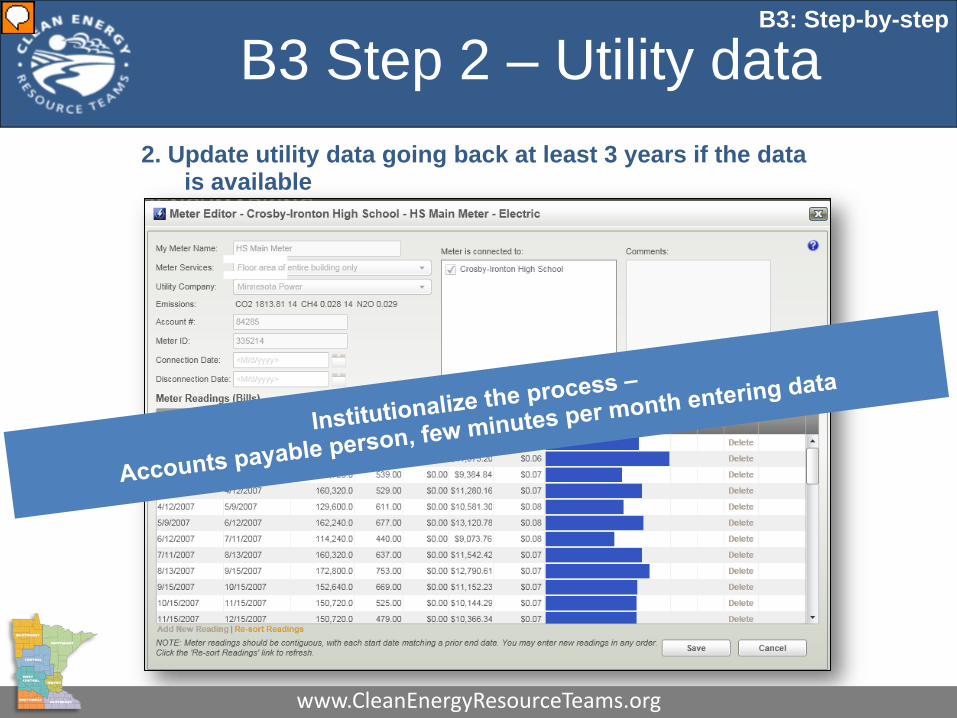
B3 Step 2 – Utility data2. Update utility data going back at least 3 years if the data
is available
B3: Step-by-step
www.CleanEnergyResourceTeams.org
Presenter
Presentation Notes
Once the building characteristics have been defined, energy data must be entered to provide the “actual energy use.” Click “add a new meter” to add any new meters or click on existing meters to input data. The Meter Editor page is fairly straightforward. Simply put in the start and end date of service, the consumption, and the cost. Everything else is updated for you. Be sure to check the unit type of the data provided (i.e. therms, CCF, etc). Also make sure to keep your data updated monthly. Doing it monthly takes just a few minutes per account and this can be easily done by the person who receives the data. If this is not done monthly, the data backs up, and it is much less likely to be entered. Previously I may have said to use 2 years worth of back data – however, the Office of Eneergy Security has recently suggested that it is better to have 3 years worth of back data to get a better understanding of the building’s average performance. Bruce Nelson from the Office of Energy Security, said that it may be a good idea to check that sure meters measure the area which they are supposed to be measuring. Some building meters are actually attached to other buildings, so it is important that you have your utility verify which meters are connected to what space. You may want to specify in the comments box where this meter is located, so that if another person takes over your B3 duties someday, he/she has all of the correct meter information. Also, have them make sure the meter is calibrated correctly. Bruce has also seen meters that were not accurately measuring energy usage which cost the building owners lots of money over the years.
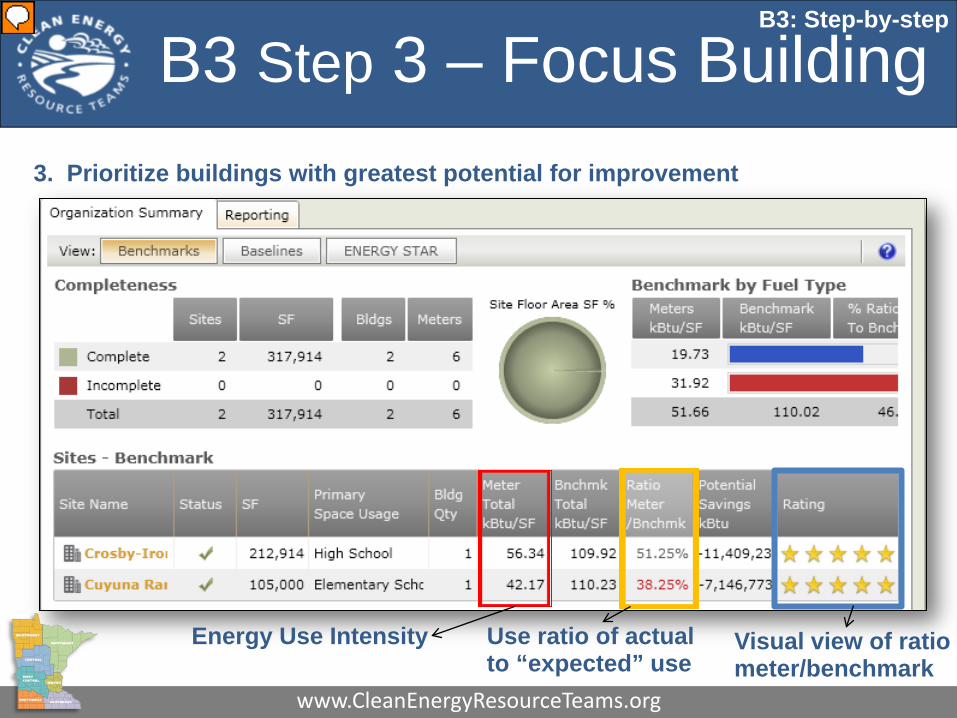
B3 Step 3 – Focus Building3. Prioritize buildings with greatest potential for improvement
Energy Use Intensity Use ratio of actual to “expected” use
Visual view of ratio meter/benchmark
B3: Step-by-step
www.CleanEnergyResourceTeams.org
Presenter
Presentation Notes
After building profile and meter data is entered, B3 will calculate the amount of energy used per square foot per year. Calculating the energy per square foot normalizes the energy usage, so that energy efficiency or energy used in buildings of different sizes can be compared. Like I said earlier the kBTU/SF/year is the standard unit for understanding and comparing the energy efficiency performance of a building. The three columns indicated by the colored boxes are most important. The red box indicates the raw numbers of consumption – indicating which building consumes the most overall in terms of the energy use intensity. The yellow box helps you identify which building to focus on by comparing the actual building consumption to the benchmark (what the building should be using). The greater the number over 100% the more the building is consuming than it should based on the building characteristics. If this is below 50% or above 150%, review the data to make sure it is correct. In this case, Crosby Ironton has actually done many energy efficiency improvements, which is why their ratio is so low. The benchmark provides an estimation based on the building profile of how the building should be performing and provides a starting place for knowing which building to focus on. The blue box shows the yellow box data in a visual form. 1 star represents an energy inefficient building, 2.5 stars represents a building that uses the expected amount of energy (a ratio meter/benchmark of 100%), and 5 stars has a ratio meter/benchmark of less than 50%.
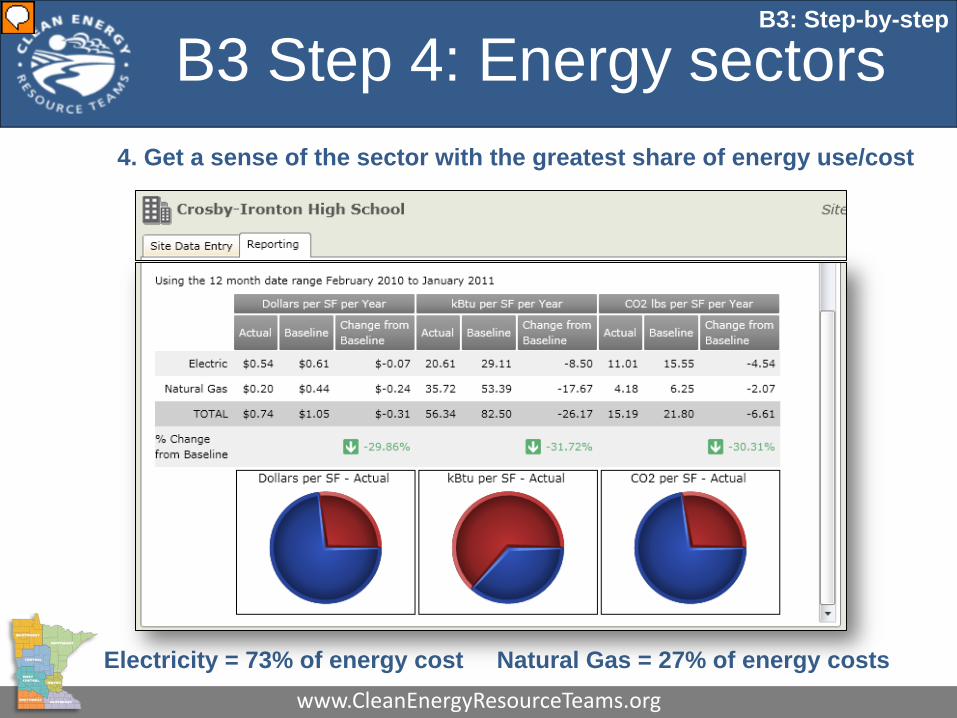
B3 Step 4: Energy sectors4. Get a sense of the sector with the greatest share of energy use/cost
Electricity = 73% of energy cost Natural Gas = 27% of energy costs
B3: Step-by-step
www.CleanEnergyResourceTeams.org
Presenter
Presentation Notes
Moving over into the Reporting tab, this is another place where we can analyze information. Now you know which building to focus on, but where do you start in the building? Something that might be useful is finding out which part of your building’s energy pie is contributing the most to energy costs. In most commercial buildings, electricity will be the largest contributor. Although in this building, more natural gas energy is used, but because electricity cost more per unit, electricity provides the greatest overall utility cost. Therefore, when you are examining implementing best management practices, you may want to investigate those which decrease your electricity usage first to get the quote “most bang for your buck.”
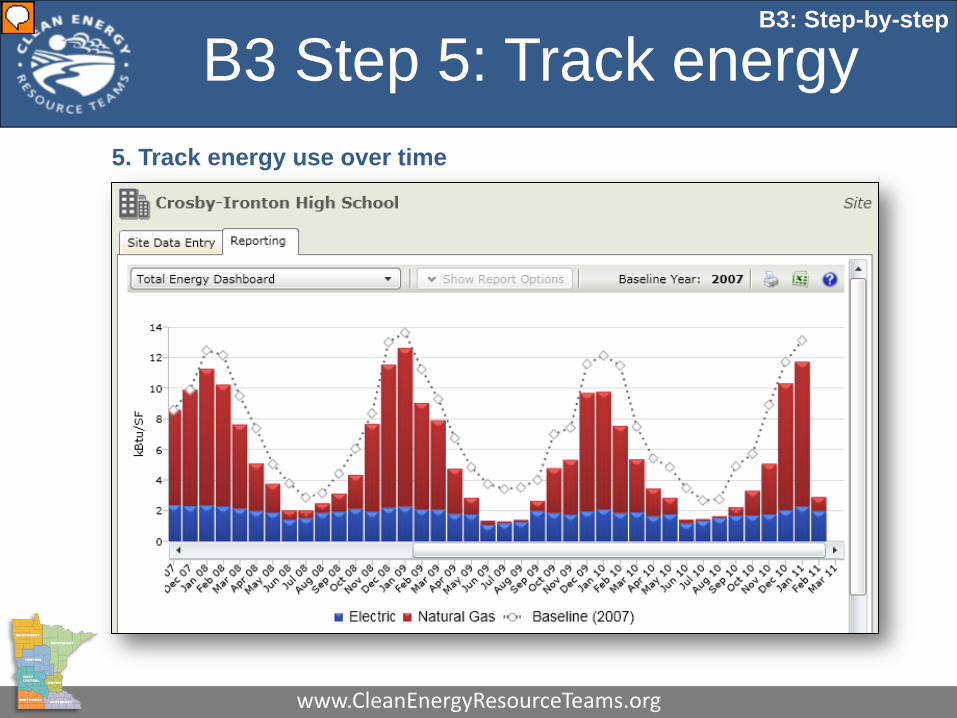
B3 Step 5: Track energy5. Track energy use over time
B3: Step-by-step
www.CleanEnergyResourceTeams.org
Presenter
Presentation Notes
Also on the reporting tab is a graph showing energy use over time. The dotted line represents the baseline year data – the data from which to compare energy usage and the data from which is weather normalized over all other years. The red indicates natural gas use and blue indicates electricity use. For these two sources their original units (therms and kwh) have been converted to kBTU. As you can see, especially during the summer months of 2009 and 2010 , there is a significant gap between the height of the baseline year data points and the combined natural gas and electric usage. This indicates that a reduction in energy use. So the goal is to constantly be widening that gap. Furthermore the graph helps you identify those months in which energy use is highest. It may help you start asking such questions as: what events happened in the building during this time? How many occupants were in the building? Was there a major device installation? Are there opportunities during this particular month to turn down the thermostat, turn off the AC, power down devices?
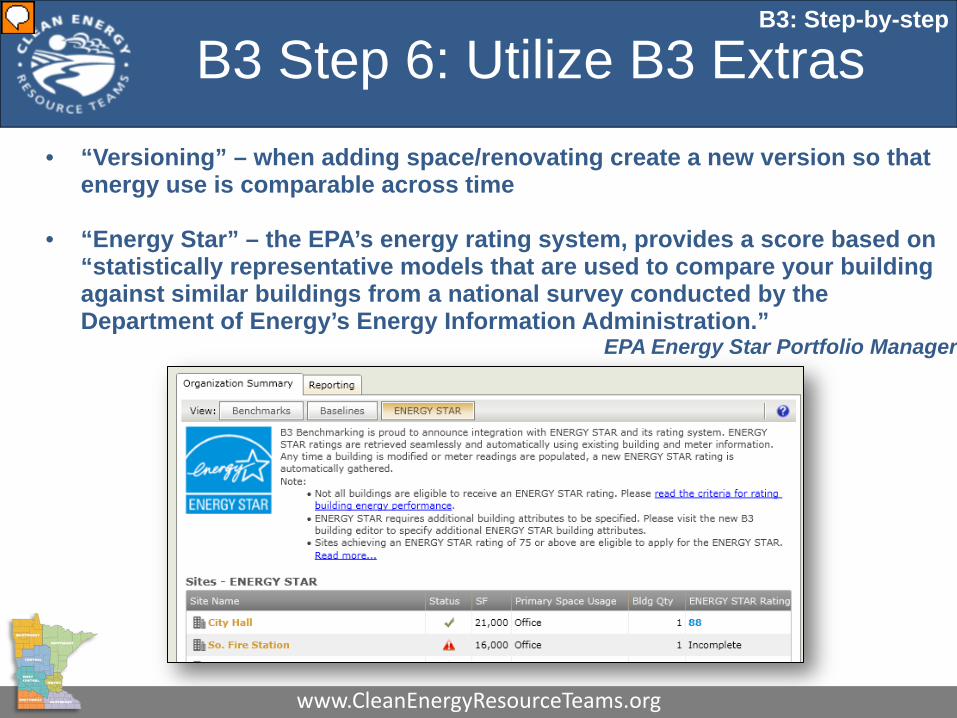
B3 Step 6: Utilize B3 Extras• “Versioning” – when adding space/renovating create a new version so that
energy use is comparable across time
• “Energy Star” – the EPA’s energy rating system, provides a score based on “statistically representative models that are used to compare your building against similar buildings from a national survey conducted by the Department of Energy’s Energy Information Administration.”
EPA Energy Star Portfolio Manager
B3: Step-by-step
www.CleanEnergyResourceTeams.org
Presenter
Presentation Notes
When you have become more familiar with B3 you can start understanding the “versioning” and “Energy Star score” tools available. “Versioning,” which can be done in the “Building Editor” creates different versions of a building in the system. This is comes in handy when the space usage types change and when space is added or taken away from buildings during renovations. Therefore, as the building changes over time, the energy used is understandable and comparable. The Energy Star score is calculated and retrieved from the EPA Energy Star Portfolio Manager site to provide another view of how a building fares in comparison to other buildings. A building is not compared to others in the Portfolio Manager database. Instead, it is based on models of similar buildings from a national survey conducted by the DOE’s Energy Information Admin. This score, which is from 0-100 with 0 being a low performer and 100 a high performer, is useful to understand how a buildings compares to similar buildings and to provide a reward for good building performance. Buildings with scores greater than 75 are eligagle for an Energy Star Certification, which could be used for marketing of a school or city’s green initiatives.
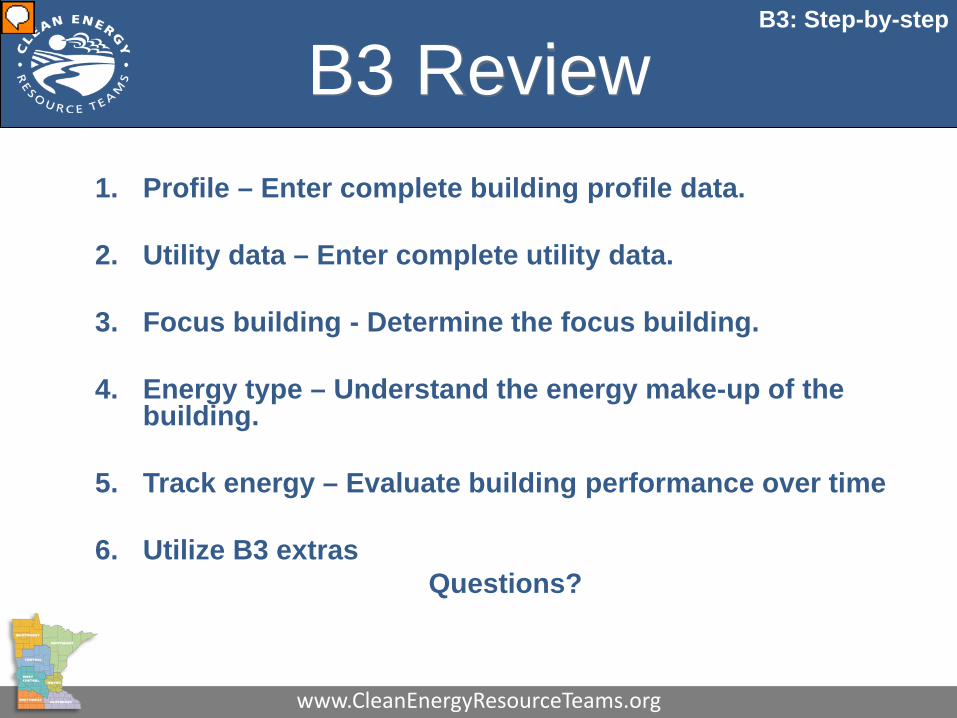
B3 Review1. Profile – Enter complete building profile data.
2. Utility data – Enter complete utility data.
3. Focus building - Determine the focus building.
4. Energy type – Understand the energy make-up of the building.
5. Track energy – Evaluate building performance over time
6. Utilize B3 extrasQuestions?
B3: Step-by-step
www.CleanEnergyResourceTeams.org
Presenter
Presentation Notes
So as a review of B3, first make sure to enter complete building data, so that B3 can provide you an accurate benchmark. Keep utility data current, by institutionalizing the process. Compare the benchmark/actual ratios to determine the building with the greatest savings opportunities. Investigate which energy type costs you the most overall. And then track the energy usage – what times of the year do I notice the worst performance? I’ll take another pause here for questions.

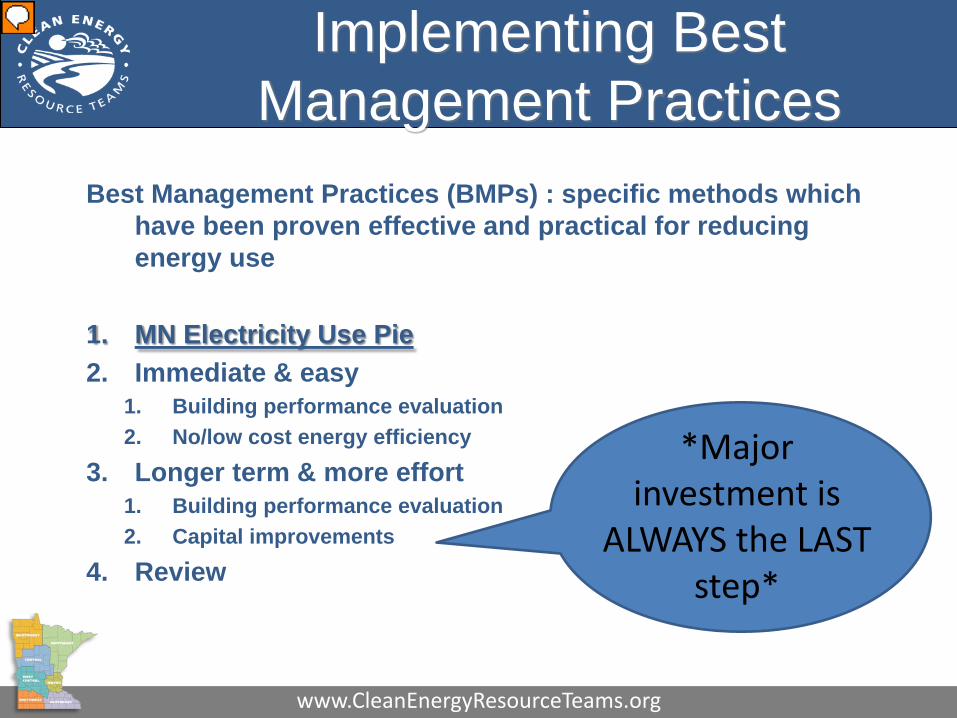
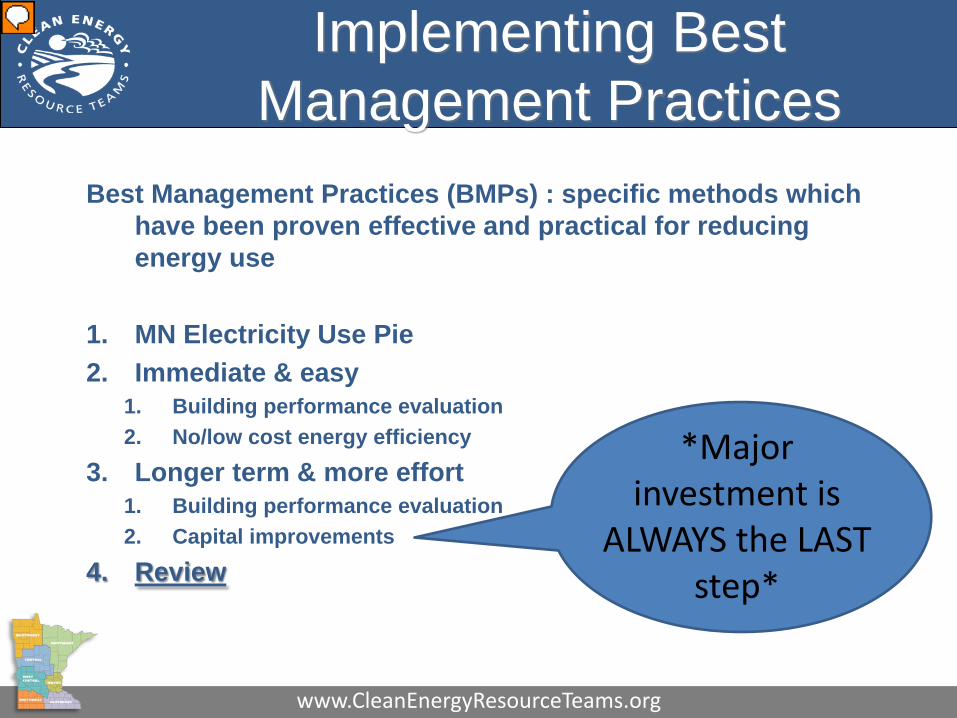
Implementing Best Management Practices
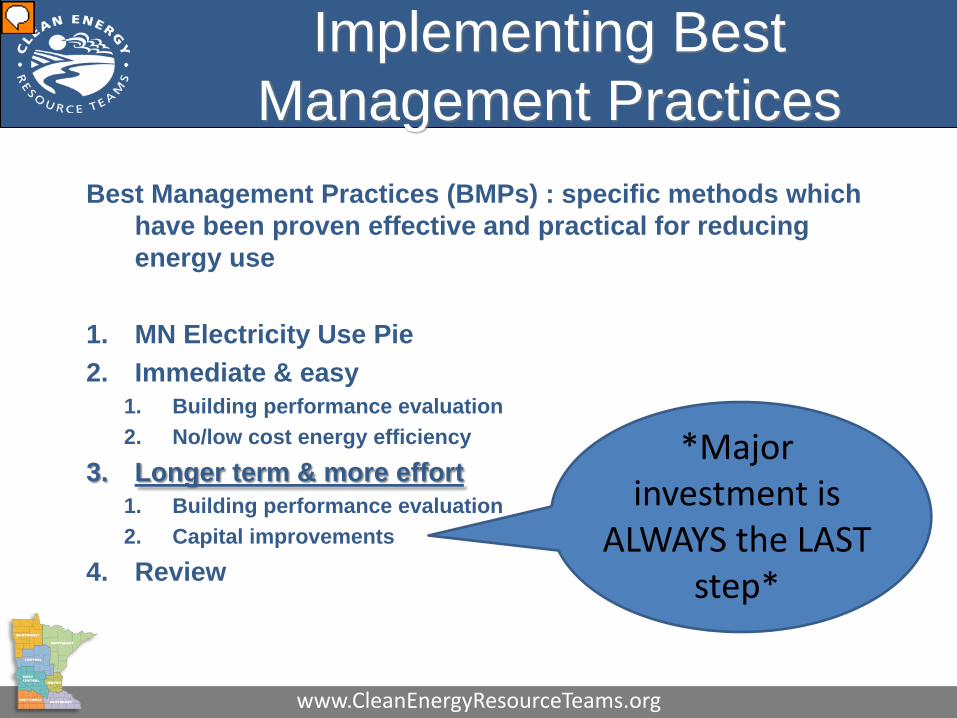
Best Management Practices (BMPs) : specific methods which have been proven effective and practical for reducing energy use
1. MN Electricity Use Pie2. Immediate & easy
1. Building performance evaluation2. No/low cost energy efficiency
3. Longer term & more effort1. Building performance evaluation2. Capital improvements
4. Review
*Major investment is
ALWAYS the LAST step*
www.CleanEnergyResourceTeams.org
Presenter
Presentation Notes
Now let’s move on to the really exciting stuff – the best management practices which are specific methods which have been proven effective and practical for reducing energy use. Since we noticed earlier that electricity has the largest cost to a buildings total energy cost, we’ll first take a look a look at what sectors of a building use the most energy. Then we’ll move into the immediate and easy first steps to take. From there, I’ll discuss practices that involve more planning and that take longer to carry out. I’d like to point out that Finally we’ll conclude with a major review.
Implementing Best Management Practices
Best Management Practices (BMPs) : specific methods which have been proven effective and practical for reducing energy use
1. MN Electricity Use Pie2. Immediate & easy
1. Building performance evaluation2. No/low cost energy efficiency
3. Longer term & more effort1. Building performance evaluation2. Capital improvements
4. Review
*Major investment is
ALWAYS the LAST step*
www.CleanEnergyResourceTeams.org
Presenter
Presentation Notes

MN Electricty Poll
What sectors consumes the most energy in MN?
A. Industry
B. Transportation
C. Buildings
www.CleanEnergyResourceTeams.org
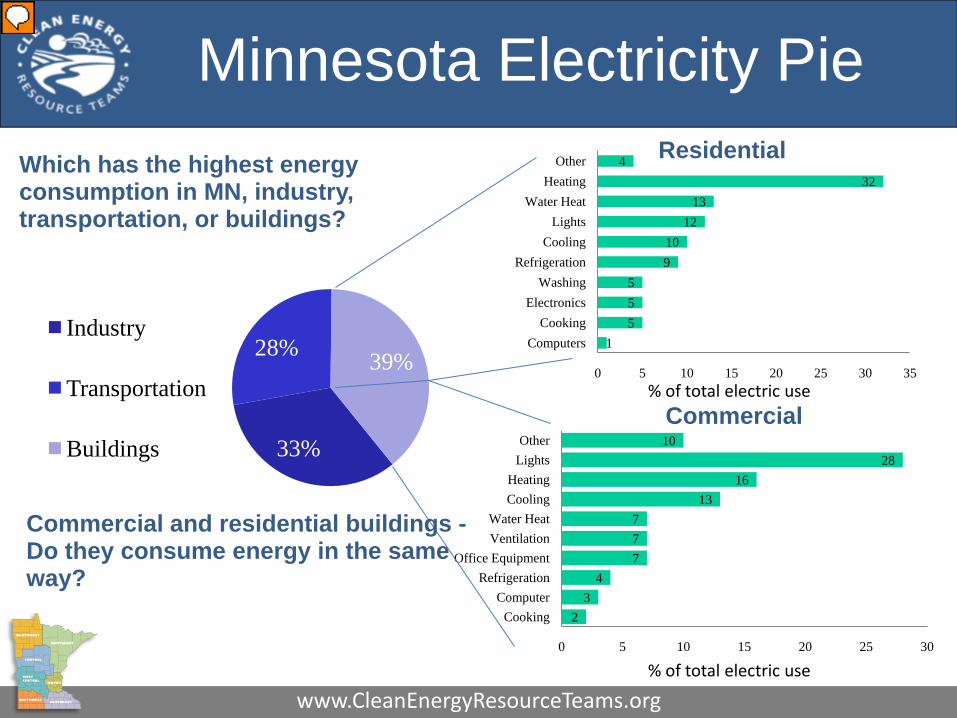
Minnesota Electricity Pie
33%
28% 39%Industry
Transportation
Buildings
1555
910
1213
324
0 5 10 15 20 25 30 35
ComputersCooking
ElectronicsWashing
RefrigerationCooling
LightsWater Heat
HeatingOther
23
4777
1316
2810
0 5 10 15 20 25 30
CookingComputer
RefrigerationOffice Equipment
VentilationWater Heat
CoolingHeating
LightsOther
Residential
Commercial
Which has the highest energy consumption in MN, industry, transportation, or buildings?
Commercial and residential buildings -Do they consume energy in the same way?
% of total electric use
% of total electric use
www.CleanEnergyResourceTeams.org
Presenter
Presentation Notes
Time for another poll! Which has the highest energy consumption in MN, industry, transportation, or buildings? In Minnesota, the majority of energy is used by buildings. And what consumes the most energy in residential buildings? – in commercial buildings? Are they the same? Indeed they aren’t. Heating takes up the biggest chunk in homes while lighting accounts for the most usage in commercial buildings like schools and local government buildings – but as we’ll see this is something that is easily tackled. Also please note some of the other major players, such as office equipment. Those seldom-used but big devices - printers, scanners, and fax machines - can zap a lot of energy.

Implementing Best Management Practices
Best Management Practices (BMPs) : specific methods which have been proven effective and practical for reducing energy use
1. MN Electricity Use Pie2. Immediate & easy
1. Building performance evaluation2. No/low cost energy efficiency
3. Longer term & more effort1. Building performance evaluation2. Capital improvements
4. Review
*Major investment is
ALWAYS the LAST step*
www.CleanEnergyResourceTeams.org
Presenter
Presentation Notes

Building EvaluationWalk-through:
A tour of the building during different operational periods (i.e. during business hours, after hours, during major events).
• Take note of the following:– Lighting – Electronic equipment – Temperature/humidity– Noticeable building damage– Staff expertise and knowledge
• Pros and cons:– Pros: self-guided, low cost, many low cost opportunities– Cons: technical opportunities will likely be missed
BMPs: Immediate and Easy
www.CleanEnergyResourceTeams.org
Presenter
Presentation Notes
One of the first major steps is an initial assessment in the form of a walk-through. A walk-through is a tour of the building that is self-guided with the focus being non-technical in nature. The goal is to develop a snapshot for how the building is performing, without any major testing. During the walk-through, assess the following: Classroom, hallway, office lighting levels and fixture control Control of computers, vending machines and other plug in loads; Building use and occupancy schedules; • Shutdown procedures during unoccupied periods; • Status of control strategies for major building systems; • Boiler and cooling system efficiency and maintenance practices; • Condition of steam, water or air distribution systems; • Temperature control and setbacks; • Condition of building envelope, windows and weatherstripping; • Identification of prominent problems (indoor air quality etc.); • Assessment of staff expertise.
No/Low Cost PracticesBMPs: Immediate and Easy
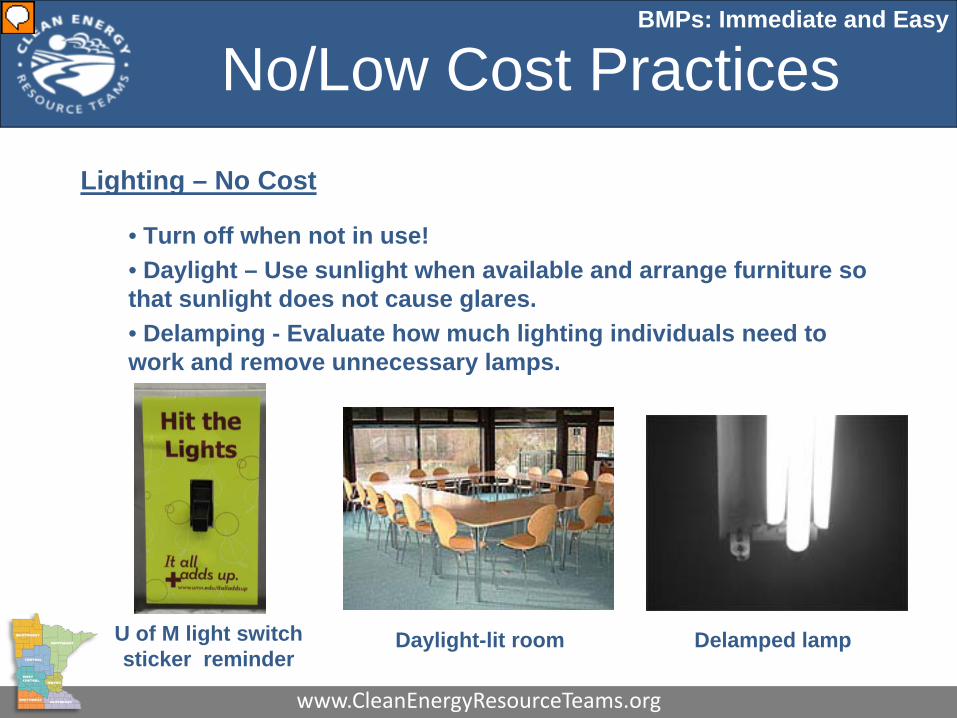
Lighting – No Cost
• Turn off when not in use! • Daylight – Use sunlight when available and arrange furniture so that sunlight does not cause glares.• Delamping - Evaluate how much lighting individuals need to work and remove unnecessary lamps.
Delamped lampDaylight-lit roomU of M light switch sticker reminder
www.CleanEnergyResourceTeams.org
Presenter
Presentation Notes
I’m sure during your walk-through at different times, you’ll notice lights left on. So create campaigns and awareness for people to “Hit the lights.” At the U of M, these stickers adorn light switches everywhere, and I know this bright green sticker has caught my eye a few times to remind me to hit the switch. Also, the about lighting levels around the building. Is it too bright in some areas? If so consider de-lamping. At the Office of Energy Security, they evaluated every work station to see how much light people were comfortable with and wound up delamping in parts of the offices. Finally, remember the benefits of sunlight – it’s a moral booster and free light source. Rearrange furnature and keep blinds open when possible to maximize sunlight.
No/Low Cost PracticesBMPs: Immediate and Easy
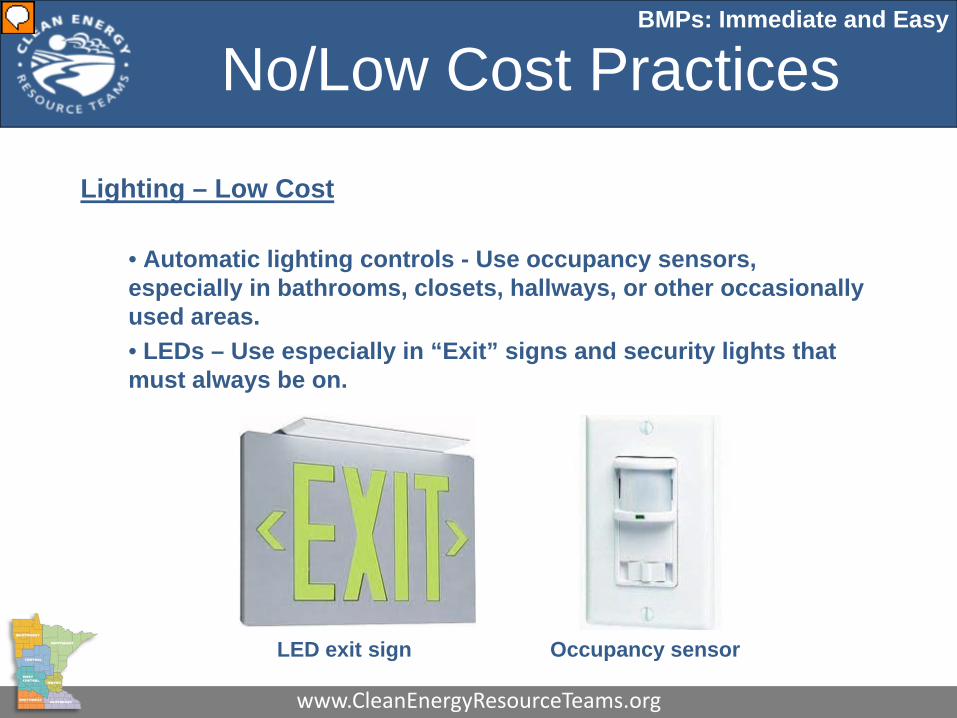
Lighting – Low Cost
• Automatic lighting controls - Use occupancy sensors, especially in bathrooms, closets, hallways, or other occasionally used areas.• LEDs – Use especially in “Exit” signs and security lights that must always be on.
LED exit sign Occupancy sensor
www.CleanEnergyResourceTeams.org
Presenter
Presentation Notes
For low cost lighting changes, consider automatic controls such as occupancy sensors in little used areas, such as bathrooms, closets, and hallways. Installation and labor may cost a couple hundred dollars, but they can cut the cost of energy in those areas by half according to Minneapolis energy auditors9. When it comes to EXIT signs, they always must be on, but by using LED bulbs, one can reduce the energy needed to light the signs by 88% and save approximately $92 after one year.
No/Low Cost Practices
Lighting - Resources:
• Visit the One Stop Efficiency Shop for rebates http://www.mncee.org/programs_bldgs_facilities/commercial_lighting/index.php
• Xcel Efficiency Library http://www.xcelenergy.com/SiteCollectionDocuments/docs/frameset-ca-office-buildings.html
• Department of Energy - Energy Savers- Lighting http://www.energysavers.gov/your_home/lighting_daylighting/index.cfm/mytopic=11980
BMPs: Immediate and Easy
www.CleanEnergyResourceTeams.org
Presenter
Presentation Notes
There are several resources when it comes to lighting, especially because there is many cost-effective technologies such as T-8 bulbs and more efficient ballasts. Check out some more specific options for your buildings that meet your needs and have good paybacks.
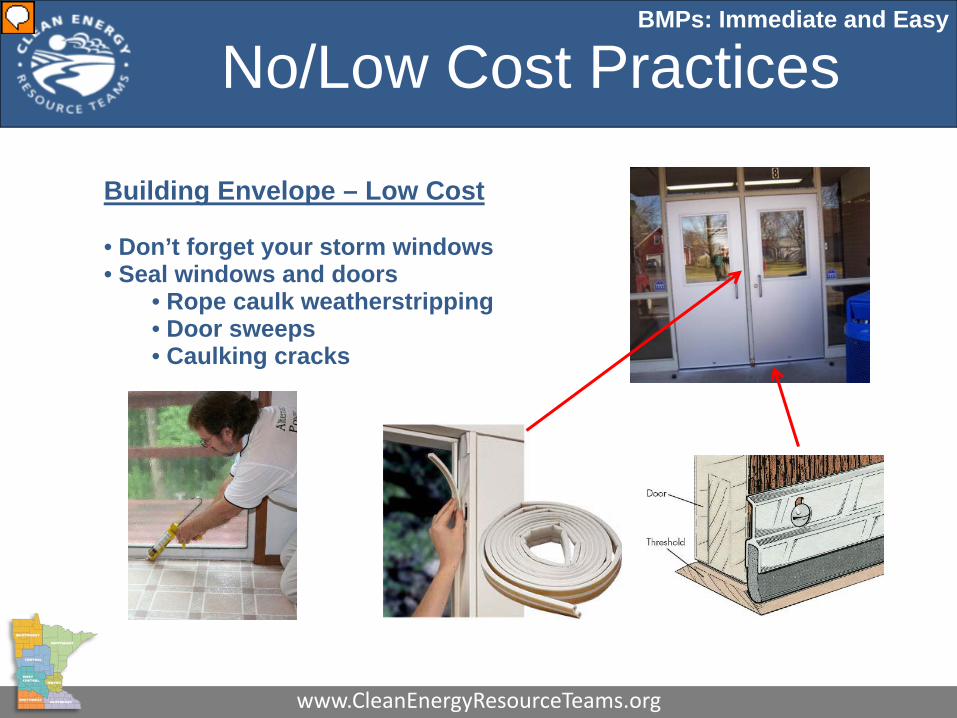
No/Low Cost PracticesBMPs: Immediate and Easy
Building Envelope – Low Cost
• Don’t forget your storm windows • Seal windows and doors
• Rope caulk weatherstripping• Door sweeps• Caulking cracks
www.CleanEnergyResourceTeams.org
Presenter
Presentation Notes
In older buildings especially, any orifice in the building’s envelope (i.e. a door, window, etc) has the potential to allow air flow. It is fairly simple to stop those leaks using rope caulk, door sweeps, and caulking. I’ve been amazed at some of the buildings even at the University of Minnesota I’ve been into where I can actually put my hand up around doorways and feel cold air leaks. Also, try turning off the lights during the day, and look around to see if there is any daylight shining in through places other than windows. A friend of mine had an energy audit on her home, and when they turned off the lights in her basement, they noticed that daylight was shining in through a decent sized hole in an obscure part of the basement. Such simply tricks can help identify wasteful air leaks.
No/Low Cost Practices
www.CleanEnergyResourceTeams.org/
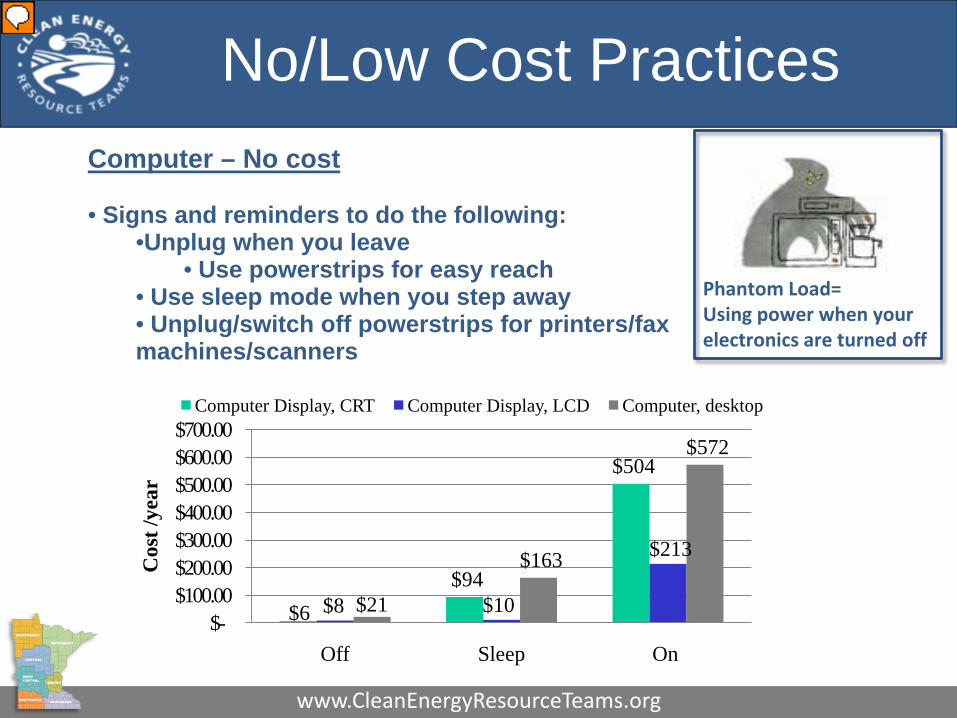
Phantom Load= Using power when your electronics are turned off
$6 $94
$504
$8 $10
$213
$21
$163
$572
$-$100.00 $200.00 $300.00 $400.00 $500.00 $600.00 $700.00
Off Sleep On
Cos
t /ye
ar
Computer Display, CRT Computer Display, LCD Computer, desktop
Computer – No cost
• Signs and reminders to do the following:•Unplug when you leave
• Use powerstrips for easy reach• Use sleep mode when you step away• Unplug/switch off powerstrips for printers/fax machines/scanners
www.CleanEnergyResourceTeams.org
Presenter
Presentation Notes
For this section, I’d like to emphasize phantom load. Phantom load otherwise known as phantom power or standby power, is the energy that is used while a device is turned OFF. That’s right, when a device is off but still plugged in it drains energy. This is especially obvious with all of those devices with little lights on them. In the realm of computers, they can drain much energy over time. This graph illustrates the cost of energy for 5 desktop computers, 5 CRT (old fashioned) displays, and 5 new LCD displays if the computers were left in an off, sleep, or on setting the entire year. Imagine what this graph would look like for the number of computers in your office or school! This scenario of course is not realistic, as computers are turned off, on, and put on sleep throughout the year, but it does highlight the differences in energy usage among the modes and computer parts. Notice though, that even in the “off” mode phantom load is still draining energy. That is essentially like throwing money out of the window! Therefore, unplug computer parts when you leave or switch off the powerstrip which houses those plugs. In our office, the U of M “Green” police have put our powerstrips near our keyboards as a way to reduce the barrier of turning the strips off. At the MN Pollution Control Agency, they have experimented with computer pop ups at the end of the day reminding employees to power down and turn power strips off. �And since the “sleep” mode uses much less energy than the “on” mode and you lose no data in the sleep mode, put the computer to “sleep” when you must step away from your desk during the day. Also, how often are printers, fax machines, and scanners used throughout the day? Only power them on when you are ready to use them!
No/Low Cost Practices
Computer – Resources
• Energy Star Low Carbon IT Campaign: http://www.energystar.gov/index.cfm?c=power_mgt.pr_power_mgt_low_carbon
• Climate Savers Computing: •http://www.climatesaverscomputing.org/learn/saving-energy-at-home/
• Minnesota Pollution Control Agency – Energy Savings Case Studyhttp://www.pca.state.mn.us/index.php/living-green/living-green-government/state-agency-sustainability-action-plans/energy-savings-mpca-sustainability-action-plan.html
www.CleanEnergyResourceTeams.org
Presenter
Presentation Notes
I encourage you to investigate some of these resources that present a variety of options for managing computer energy.
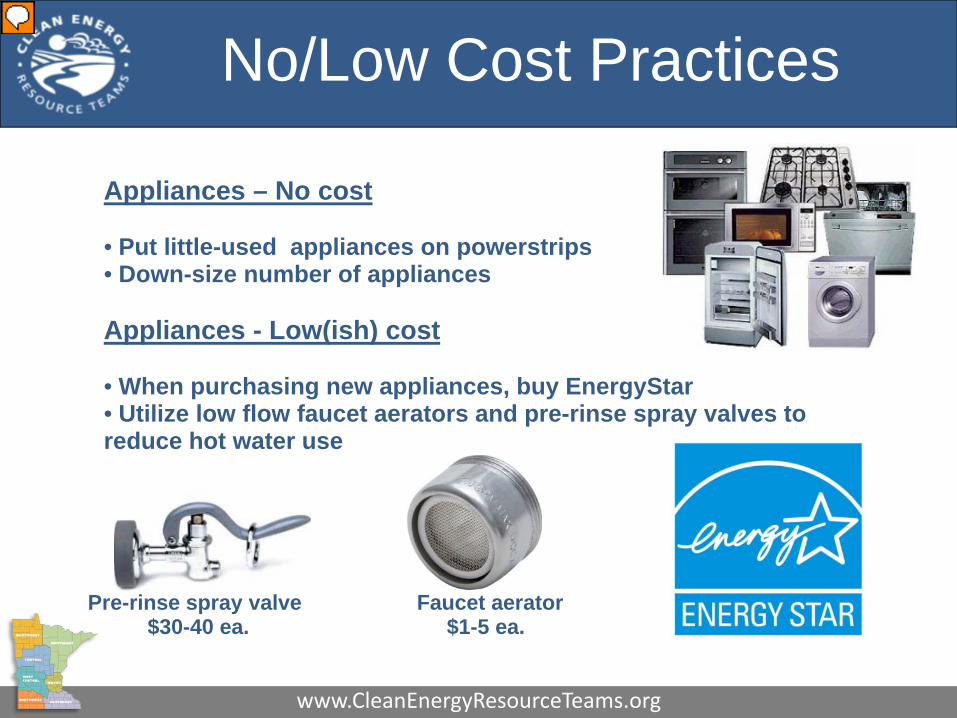
No/Low Cost Practices
Appliances – No cost
• Put little-used appliances on powerstrips• Down-size number of appliances
Appliances - Low(ish) cost
• When purchasing new appliances, buy EnergyStar• Utilize low flow faucet aerators and pre-rinse spray valves to reduce hot water use
Pre-rinse spray valve Faucet aerator $30-40 ea. $1-5 ea.
www.CleanEnergyResourceTeams.org
Presenter
Presentation Notes
We have appliances, microwaves, refrigerators, stoves, washers, etc. in break rooms and kitchens. Over time these can drain a lot of energy. Consider: Do you need the microwave to tell you the time? Don’t computers, watches, and cell phones do that already for us? To easily save energy, put machines like microwaves on powerstrips. Also, larger offices may have multiple small refrigerators, but it is more energy and cost efficient to condense that number and upgrade to one larger refrigerator. The MPCA actually just implemented this practice and received very few complaints against the change. When purchasing new appliances, always look for the Energy Star logo. Energy Star is a federal government program which certifies high efficiency appliances. Also, an immediate and simple way to save water and hot water is to decrease the flow rate of water coming out of nozzles by using faucet aerators and pre-rinse spray valves (this does not change the water pressure!). Minneapolis energy auditors have found up to an 53% decrease in the energy needed to heat and pump water by using low flow devices and these devices have a payback of less than 1 year.9
No/Low Cost Practices
www.CleanEnergyResourceTeams.org/
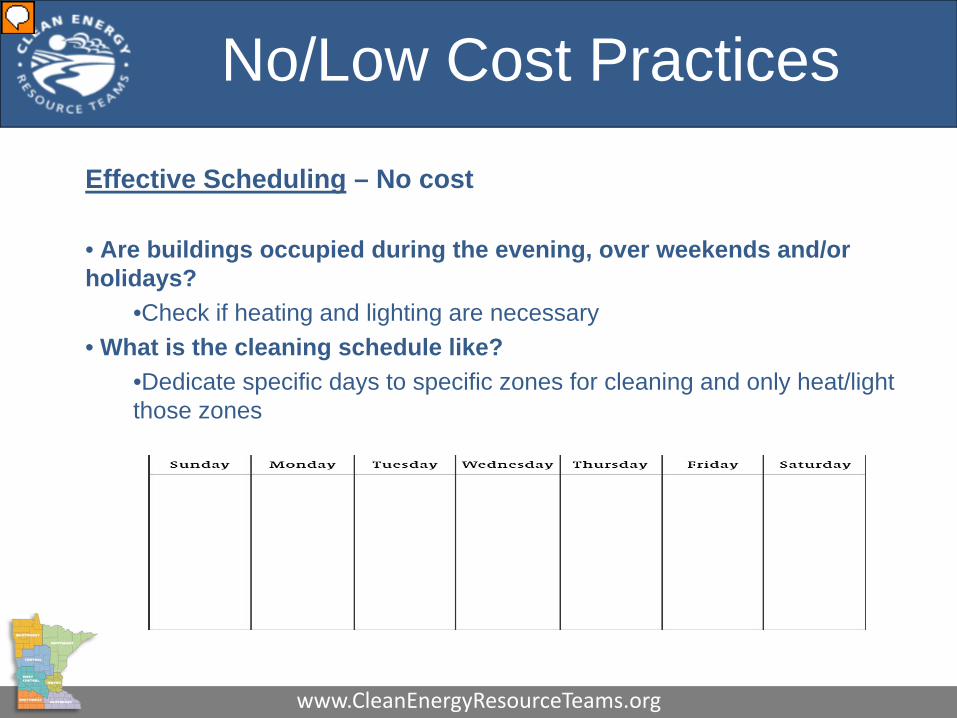
Effective Scheduling – No cost
• Are buildings occupied during the evening, over weekends and/or holidays?
•Check if heating and lighting are necessary• What is the cleaning schedule like?
•Dedicate specific days to specific zones for cleaning and only heat/light those zones
www.CleanEnergyResourceTeams.org
Presenter
Presentation Notes
This next section is about effective scheduling in the building. Evaluate when people are in the building, and consider changing schedules, so that all of the building’s systems are not on for just a handful of people. Crosby-Ironton has done this with it’s cleaning schedule. Because the building is controlled in zones, the cleaning staff concentrates on specific zones on certain days and the building systems are automated to turn on in those zones when the staff is there.
No/Low Cost Practices
www.CleanEnergyResourceTeams.org/
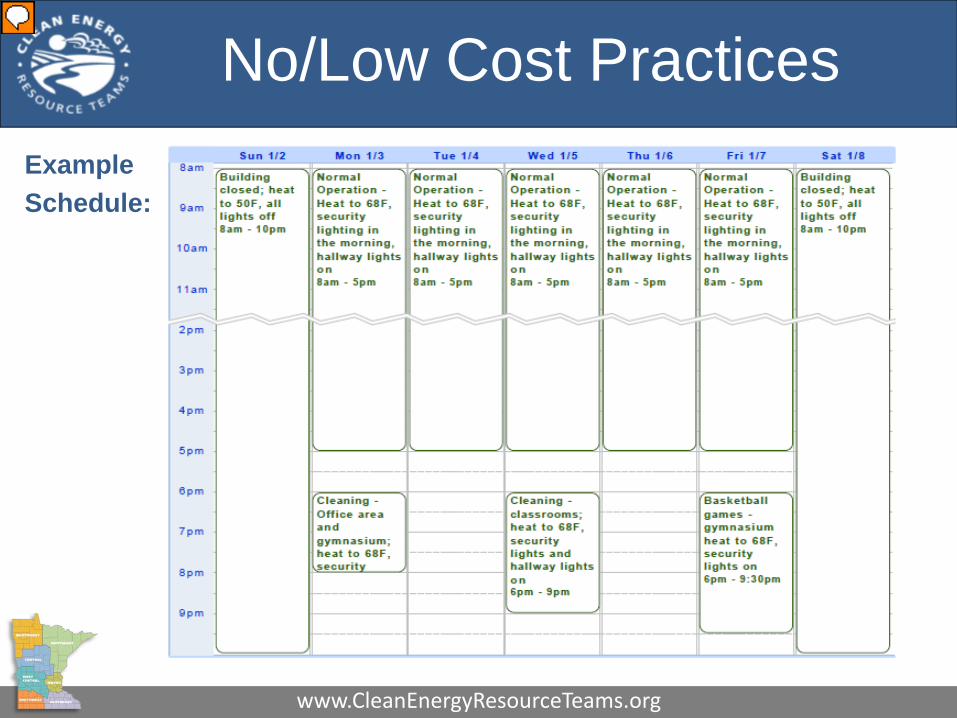
Example Schedule:
www.CleanEnergyResourceTeams.org
Presenter
Presentation Notes
Here’s an example winter schedule. The building is closed during the weekend, and so that building is only heated to 50F and all of the lights are turned off. During the week, the building is heated to a comfortable 68F and in the early mornings the security lights are turned on. The same is true when the cleaning staff is on duty and when there is a basketball game, the building systems are only active in the gymnasium. According to the Green Institute’s Energy Auditors, setting the thermostat to 68 for occupied times and 58 for unoccupied times and in the dog days of summer at 75 for occupied times and 85 for unoccupied times can saving 18% on heating and cooling.9 A possible 18% change that costs absolutely nothing!

No/Low Cost Practices
www.CleanEnergyResourceTeams.org/
Other behavior – no cost
• Add a delay to the elevator door to encourage stair use
• Use automatic openers on doors only when absolutely necessary
• Think twice before clicking the PRINT, & use both sides of the paper
• Get rid of the nice-to-have but unnecessary personal, energy-consuming luxuries like fish tanks, decorative lighting, coffee cup warmers, miniature water falls, etc.
• Be creative!
BMPs: Immediate and Easy
www.CleanEnergyResourceTeams.org
Presenter
Presentation Notes
There are many small ways in which we use energy, which are commonly overlooked, but as the U of M campaign says “It all Adds Up!”. Developing educational campaigns and/or competitions around these practices are easy and can be lots of fun. Use signage and in-house workshops to create awareness about energy intensive behaviors. And use techniques which have been shown to work, such as adding a delay to the opening of the elevator door. A study from the 80’s found that adding a few second delay to the opening and closing of the elevator doors annoyed 1/3 of elevator riders so much that they took the stairs. And interestingly, even when the delay was removed, that same 1/3 of riders still took the stairs. You may consider this with automatic door openers as well. Other campaigns may be to promote more double sided printing, but less printing overall and encourage people to get rid of nice-to-have but unnecessary personal energy-consuming luxuries like coffee cup warmers, fish tanks, and lava lamps. And lastly, be creative! http://www.ncbi.nlm.nih.gov/pmc/articles/PMC1308228/
No/Low Cost Practices
www.CleanEnergyResourceTeams.org/
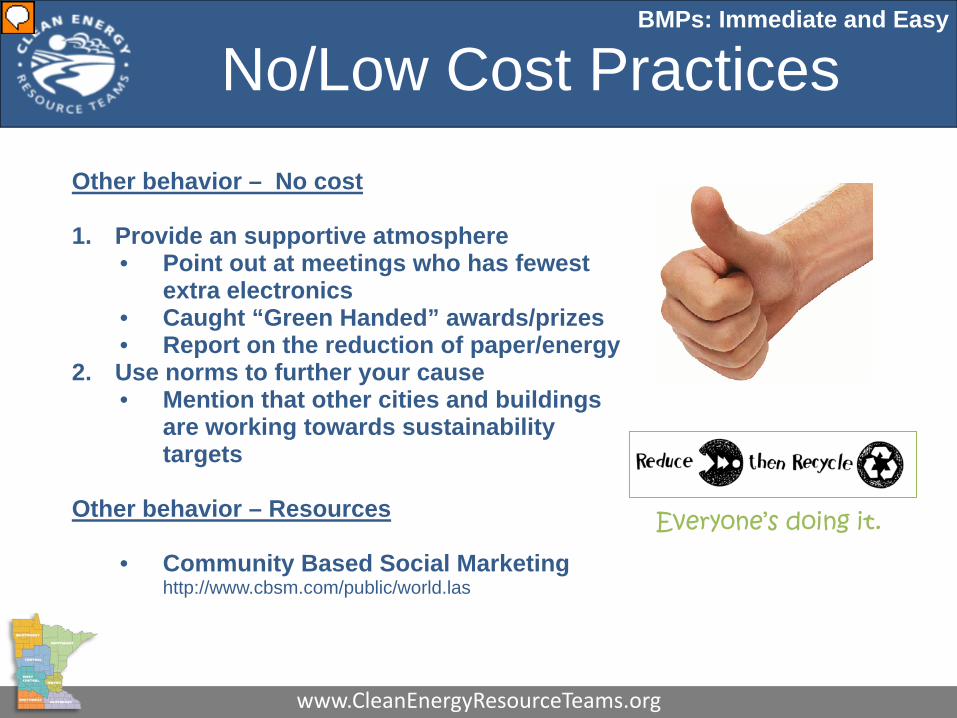
Other behavior – No cost
1. Provide an supportive atmosphere• Point out at meetings who has fewest
extra electronics• Caught “Green Handed” awards/prizes• Report on the reduction of paper/energy
2. Use norms to further your cause• Mention that other cities and buildings
are working towards sustainability targets
Other behavior – Resources
• Community Based Social Marketing http://www.cbsm.com/public/world.las
BMPs: Immediate and Easy
Everyone’s doing it.
www.CleanEnergyResourceTeams.org
Presenter
Presentation Notes
Implementing behavior changes is difficult, but it can be done! Provide reasonable expectations and encourage a very supportive atmosphere. Send out gentle reminders of workplace goals and complement those who are doing well. Provide “Caught Green Handed” awards or recognize the person with the fewest gadgets. Also, use norms to further your cause – just like it has become normal to recycle, make it normal to print double sided. Mention too that other buildings are working towards sustainability targets – your building doesn’t want to be left behind. The realm of changing behaviors is new, and a great informative tool is the Community Based Social Marketing site. This tool has articles and studies highlighting effective ways of making energy saving behaviors more of the norm. And in fact, by emphasizing that more and more people are practicing more energy saving techniques, more people will join the change, since people inherently want to be normal.
Implementing Best Management Practices
Best Management Practices (BMPs) : specific methods which have been proven effective and practical for reducing energy use
1. MN Electricity Use Pie2. Immediate & easy
1. Building performance evaluation2. No/low cost energy efficiency
3. Longer term & more effort1. Building performance evaluation2. Capital improvements
4. Review
*Major investment is
ALWAYS the LAST step*
www.CleanEnergyResourceTeams.org
Presenter
Presentation Notes
Moving on to measures that involve more time, money, and effort, we come to building evaluation again.
Building Evaluation• Recommissioning:
“A systematic process to improve the operation of your building systems so that they:
• Actually meet your needs (for ventilation, comfort, air quality control)
• Use only as much energy as is really necessary to do so.”
Center for Energy and the Environment4
BMPs: Longer term & more effort
www.CleanEnergyResourceTeams.org
Presenter
Presentation Notes
For this evaluation though, we focus on the technical aspects and optimize the controls and systems currently in place through the process known as recommissioning. The Bruce Nelson at the Minnesota Office of Energy Security has observed that even brand new buildings may not have control systems set correctly, that fans or pumps have been installed backwards and other issues, due to time pressures to construction crews. And it is even more likely that over time, the HVAC control systems have changed or do not adequately meet the needs of the current occupants. So regardless of the age of the building, it is a good idea to recommission your buildings.
Building EvaluationRecommissioning - So how does it work?
• “Calibration: ensure control sensors and devices are calibrated• Scheduling and Enabling: Turn equipment off or down when unneeded• Air and Water Flows: Don’t run equipment at higher air or water flows
than needed• Ventilation: Make sure the right amount of ventilation air gets in, and that
it gets to where the people are.• Setpoints and Resets: Don’t run equipment at higher heating or lower
cooling temperatures or higher air or water pressures than needed• Condition and Function Checks: Make sure key equipment is working
the way it should (actuators, dampers, valves, VFDs, etc.)”
Center for Energy and the Environment4
BMPs: Longer term & more effort
www.CleanEnergyResourceTeams.org
Presenter
Presentation Notes
From a presentation by the Center for Energy and the Environment4 Today’s HVAC systems are complex. Cost and time pressures lead to errors in design, submittals, equipment delivered and construction. Sequences of operation specified by the design engineer are often vague and/or sub-optimal; implementation is left to the controls contractor. The quality of TAB work is highly variable. Commissioning is not normally done. Many problems are hidden. Older buildings sure as *@!&@# don’t work the way they should Modern controls and equipment weren’t available when building was built Remodels/additions add problems Operational needs often have changed Deferred maintenance leaves some equipment in marginal condition Short-handed maintenance staff, operators’ “anecdotal” understanding of systems and ad hoc responses to complaints make things worse.
Building EvaluationRecommissioning – In-house experts
• Use talents and knowledge of current maintenance staff
• Capacity building - consider investing in building management training courses for staff– Practices in the building industry are constantly evolving– Extra training helps provide and ensure proper energy
management over the long term– Utilities might help with training costs – just ask!
BMPs: Longer term & more effort
www.CleanEnergyResourceTeams.org
Presenter
Presentation Notes
If and when you are looking into the maintenance operations of the building, also consider your the in-house experts. Put their current talents and knowledge to work, but also think about the capacity building opportunity. Perhaps your main building manager was certified 20 years ago, and since technology has evolved radically since then, it might be advantageous to invest in retraining him/her. Because energy efficiency is in interest of MN utilities, they may even be willing to pay for the training programs. Just ask!
Building EvaluationRecommissioning – Resources
• Xcel Commissioning Buildings 101– http://www.xcelenergy.com/SiteCollectionDocuments/docs/CSS-1865.pdf
• EPA Energy Star: Building Upgrade Manual- Retrocommissioning– http://www.energystar.gov/index.cfm?c=business.EPA_BUM_CH5_RetroComm
• Xcel Rebates and help finding a recommissioning consultant:– http://www.xcelenergy.com/Minnesota/Business/Programs_Resources/ConservationRebates_Incentiv
es_Business/Pages/Recommissioning.aspx
• Ask your local utility about recommissioning information and rebates
BMPs: Longer term & more effort
www.CleanEnergyResourceTeams.org
Presenter
Presentation Notes
There are several resources out there for recommissioning buildings, and the industry is growing. Xcel provides information on rebates for recommissioning projects and helps connect you with consultants. Energy Star also provides resources for finding a consultant and provides technical details for those building managers who would like to attempt to some recommissioning projects themselves. Finally, even though it may be counter-intuitive, local utilities often provide information about recommissioning as well.
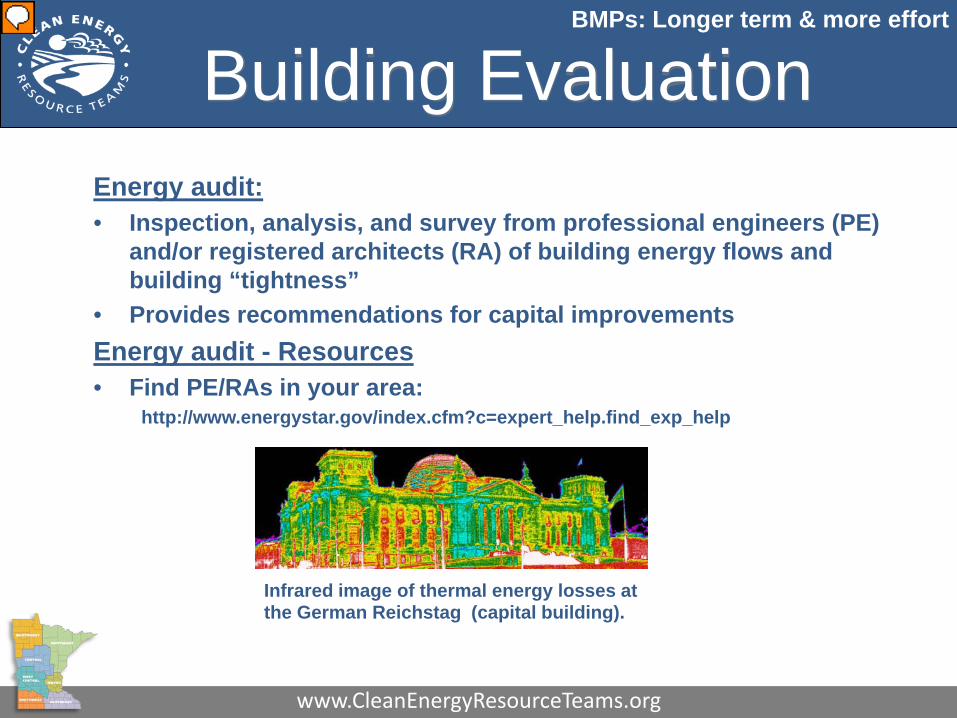
Building EvaluationEnergy audit:• Inspection, analysis, and survey from professional engineers (PE)
and/or registered architects (RA) of building energy flows and building “tightness”
• Provides recommendations for capital improvementsEnergy audit - Resources• Find PE/RAs in your area:
http://www.energystar.gov/index.cfm?c=expert_help.find_exp_help
Infrared image of thermal energy losses at the German Reichstag (capital building).
BMPs: Longer term & more effort
www.CleanEnergyResourceTeams.org
Presenter
Presentation Notes
The lines between the words recommissioning and energy audit in the energy efficiency industry are sort of blurred. But I see recommissioning as a “tuning of the instrument” exercise that can possibly be done in-house, while an energy audit involves a thorough reevaluation of the entire building through an inspection, analysis and survey from professional engineers or registered architects. They evaluate things like operating systems and thermal losses in the building envelope. Such losses can be analyzed using an infarred image like this one of the capital building in Germany. After inspection, they provide recommendations for capital improvements such as replacing boilers, adding insulation, investigating renewable energy, etc. There are more than 60 professional engineering firms in MN registered with Energy Star.

Capital Improvement
• EPA – Energy Star• Financials provides webinars, information, and support
www.energystar.gov
• Federal Energy Management Program• Energy Cost Calculators for Energy-Efficient Products
http://www1.eere.energy.gov/femp/technologies/eep_eccalculators.html
• GreenStep Cities Public Buildings• List of resources for rebates, funding sources
http://greenstep.pca.state.mn.us/bestPracticesDetail.cfm?bpid=1• DSIRE
• Database for State Incentives for Renewables and Efficiencyhttp://www.dsireusa.org/
BMPs: Longer term & more effort
www.CleanEnergyResourceTeams.org
Presenter
Presentation Notes
These four programs provide great information for capital improvements, funding sources, financial incentives, possible paybacks, and cost effectiveness calculators. Once you’ve completed all of the low/no cost opportunities, I would suggest looking into these programs.
Implementing Best Management Practices
Best Management Practices (BMPs) : specific methods which have been proven effective and practical for reducing energy use
1. MN Electricity Use Pie2. Immediate & easy
1. Building performance evaluation2. No/low cost energy efficiency
3. Longer term & more effort1. Building performance evaluation2. Capital improvements
4. Review
*Major investment is
ALWAYS the LAST step*
www.CleanEnergyResourceTeams.org
Presenter
Presentation Notes
Moving on to measures that involve more time, money, and effort, we come to building evaluation again.

Entire Process Review
1. Develop/update energy management strategy • Remember team regular meetings!
2. Enter/update all utility data and building profile information in B3
3. Use B3 to determine your spaces with greatest saving potential
4. Focus on the chosen buildings, examine, and implement Best Management Practices
5. Track usage and evaluate effectiveness of BMPs
6. Repeat Steps 1-5
Review
www.CleanEnergyResourceTeams.org

Questions?And then…a quick poll!
Contact me with other questions:Katie Jones
Review
www.CleanEnergyResourceTeams.org
Presenter
Presentation Notes
Any questions? Then a quick poll.
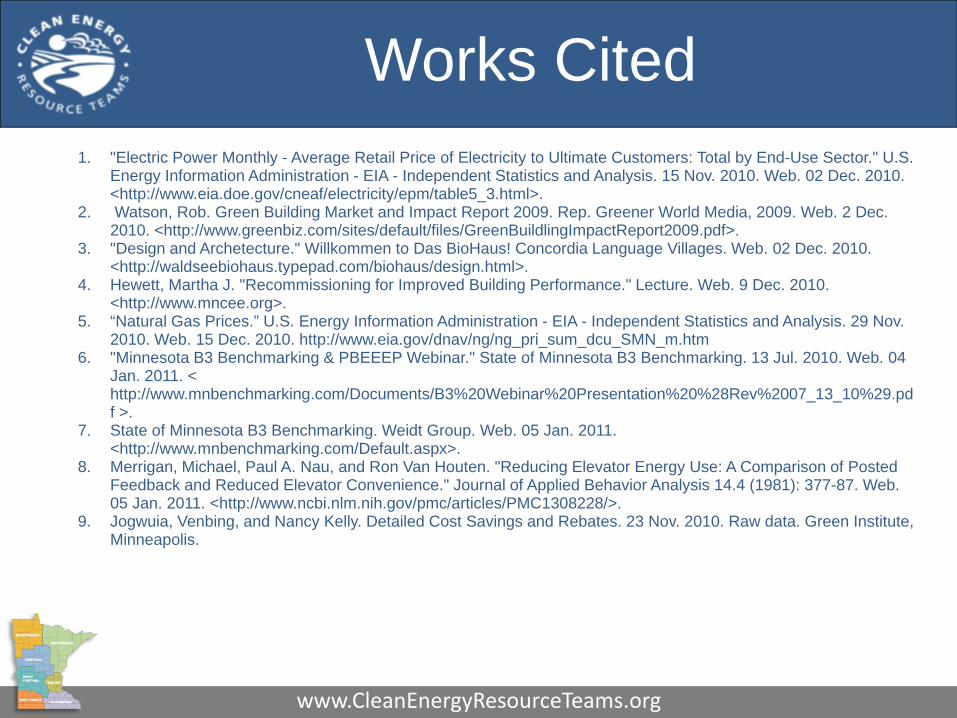
Works Cited1. "Electric Power Monthly - Average Retail Price of Electricity to Ultimate Customers: Total by End-Use Sector." U.S.
Energy Information Administration - EIA - Independent Statistics and Analysis. 15 Nov. 2010. Web. 02 Dec. 2010. <http://www.eia.doe.gov/cneaf/electricity/epm/table5_3.html>.
2. Watson, Rob. Green Building Market and Impact Report 2009. Rep. Greener World Media, 2009. Web. 2 Dec. 2010. <http://www.greenbiz.com/sites/default/files/GreenBuildlingImpactReport2009.pdf>.
3. "Design and Archetecture." Willkommen to Das BioHaus! Concordia Language Villages. Web. 02 Dec. 2010. <http://waldseebiohaus.typepad.com/biohaus/design.html>.
4. Hewett, Martha J. "Recommissioning for Improved Building Performance." Lecture. Web. 9 Dec. 2010. <http://www.mncee.org>.
5. “Natural Gas Prices.” U.S. Energy Information Administration - EIA - Independent Statistics and Analysis. 29 Nov. 2010. Web. 15 Dec. 2010. http://www.eia.gov/dnav/ng/ng_pri_sum_dcu_SMN_m.htm
6. "Minnesota B3 Benchmarking & PBEEEP Webinar." State of Minnesota B3 Benchmarking. 13 Jul. 2010. Web. 04 Jan. 2011. < http://www.mnbenchmarking.com/Documents/B3%20Webinar%20Presentation%20%28Rev%2007_13_10%29.pdf >.
7. State of Minnesota B3 Benchmarking. Weidt Group. Web. 05 Jan. 2011. <http://www.mnbenchmarking.com/Default.aspx>.
8. Merrigan, Michael, Paul A. Nau, and Ron Van Houten. "Reducing Elevator Energy Use: A Comparison of Posted Feedback and Reduced Elevator Convenience." Journal of Applied Behavior Analysis 14.4 (1981): 377-87. Web. 05 Jan. 2011. <http://www.ncbi.nlm.nih.gov/pmc/articles/PMC1308228/>.
9. Jogwuia, Venbing, and Nancy Kelly. Detailed Cost Savings and Rebates. 23 Nov. 2010. Raw data. Green Institute, Minneapolis.
www.CleanEnergyResourceTeams.org