Berkeley Symposium on Poverty, the Distribution of Income, and
29
UNIVERSITY OF CALIFORNIA, BERKELEY BERKELEY • DAVIS • IRVINE • LOS ANGELES • MERCED • RIVERSIDE • SAN DIEGO • SAN FRANCISCO SANTA BARBARA • SANTA CRUZ Berkeley Symposium on Poverty, the Distribution of Income, and Public Policy A Conference Honoring Gene Smolensky December 12-13, 2003 DECEMBER 13, 2003 SESSION IV: 8:30am-10:30am Medicare Growth, Technology Advances, and the Distribution of Health Care Benefits. Author: Jonathan Skinner Dartmouth College Discussants: Victor Fuchs Stanford University Julian Le Grand London School of Economics
Transcript of Berkeley Symposium on Poverty, the Distribution of Income, and
UNIVERSITY OF CALIFORNIA, BERKELEY
BERKELEY • DAVIS • IRVINE • LOS ANGELES • MERCED • RIVERSIDE • SAN DIEGO • SAN FRANCISCO SANTA BARBARA • SANTA CRUZ
Berkeley Symposium onPoverty, the Distribution of Income, an
A Conference Honoring Gene SmDecember 12-13, 2003
DECEMBER 13, 2003
SESSION IV: 8:30am-10:30
Medicare Growth, Technology Advances, and the Dist
Author: Jonathan Skinner Dartmouth College Discussants: Victor Fuchs Stanford University Julian Le Grand London School of Econ
d Public Policy olensky
am
ribution of Health Care Benefits.
omics
Medicare Growth, Technological Advances, and the Distribution of Health Care Benefits
Jonathan Skinner Dartmouth College, Dartmouth Medical School,
and NBER [email protected]
Weiping Zhou Dartmouth Medical School [email protected]
Draft: December 10, 2003
PRELIMINARY: Not for Quotation
Prepared for the Symposium in honor of Eugene Smolensky, Berkeley CA, December 12-13 2003. We are grateful to Dan Gottlieb for data analysis using the Cooperative Cardiovascular Project.
1
The technological revolution in health care has brought great benefits with respect
to survival and general well-being, particularly in the treatment of cardiovascular disease
(e.g., Cutler et. al., 1998). These changes in medical treatment have come at a cost,
particularly in the United States, where double-digit growth rates in health care spending
in the near term, and Medicare expenditure growth in the longer term, threaten the fiscal
stability of both private and public health insurance systems. This paper examines the
distributional consequences of the recent changes in health care technology and
expenditures in the United States, particularly among the Medicare population over age
65.
Empirically, there are many unresolved questions regarding the distributional
impact of health care technology. Earlier research suggested that medical care
innovations, such as the use of antibiotics in the treatment of tuberculosis, reduced health
care disparities by race.1 However, recent studies that focus on health outcomes suggest
that better educated patients get access to newer drugs (Lleras-Muney and Lichtenberg,
2002), survive longer following the diagnosis of cancer (Glied and Lleras-Muney, 2003)
and comply better with regimens for the treatment of AIDS (Goldman and Smith, 2002).
Other studies have examined utilization rates rather than health outcomes, and have
found different results depending on the treatment; there are modest differences in the use
of knee replacements by income (see Skinner, Zhou, and Weinstein, 2003; also see
Sanchez et al, 1992).
1 (Cite, 1977). The evaluation of changes in disparities can sometimes be difficult when both groups (say high and low income) are experiencing a downward trend. This is because the answer can sometimes depend on whether one is considering the proportional distribution of survival or the proportional distribution of mortality (or absolute differences); the answer can sometimes depend on the metric.
2
A third approach to measuring health care inequality is to compare differences
across income groups in health care expenditures. Early work found a positive
association between income and health care spending, particularly after controlling for
health status (Le Grand, 1982; Davis and Reynolds, 1975). McClellan and Skinner
(2003) found a generally positive association between overall Medicare expenditures and
income during the later 1980s, largely because high income households tend to live
longer. Another set of studies using more recent data have found the opposite result;
those with either low income or educations (Battachyaria and Lakdawalla, 2003) or living
in poorer zip codes (Lee, McClellan, and Skinner, 1999; McClellan and Skinner, 2003)
experiencing substantially higher levels of Medicare expenditures.
Another more theoretical literature has grappled with the problem of how best to
measure inequality. Should we focus on differences in utilization of health care
(controlling for underlying health status), differences in �access� to care (however
measured), or differences in outcomes attributable to differences in utilization?2 More
recently, research has focused on modeling the joint distribution of income and health
(Contoyannis and Forster, 1999; Bommier and Stecklov, 2002). In part, the choice of the
measure depends on the point being made. Fuchs (1998) adopted the use of �full
income� that combines money income and Medicare expenditures of the elderly
population to emphasize the opportunity cost of all that health care spending among the
elderly � that a modest decrease in money spent on Medicare could, if redirected as cash,
have a substantial impact on money income, particularly among low income and older
groups.
2 For example, see Culyer et. al. (1982), Le Grand (1982, 1991), Wagstaff et. al. (1991), and O�Donnell and Mooney (1991).
3
Finally, a different line of research has attempted to quantify full income
differently, not with regard to expenditures on health care, but with regard to the
valuation of additional life years. In this approach, most recently developed in Becker,
Philipson, and Soares (2003), one solves out the dollar value of the increased longevity
based on properties of the intertemporal utility function.3
In this paper, we build on the previous literature attempting to measure and
quantify changes in inequality over time.4 The task is more complicated owing to
uncertainty about how best to measure inequality, but we adopt a catholic approach by
considering changes (and levels) of three measures of health care -- expenditures,
utilization, and outcomes -- in the elderly population in the United States.
There are four basic empirical results in the paper. First, we document the
dramatic �twist� in the income gradient of health care expenditures during the 1990s, and
the �untwist� following the passage of the Balanced Budget Act of 1997. The magnitude
of the increase in dollar transfers through the Medicare program to the lowest income
neighborhoods was large: the magnitude of the relative increase in Medicare
expenditures for the lowest income groups (compared to the highest income group) was
equal or more than the comparable increase in money income during the same period.
And while inequality in money income increased in the over-65 population during this
period, full income inclusive of Medicare expenditures did not.
Second, the twist in the distribution of Medicare expenditures was largely because
of home health care, which was disproportionately targeted to the lowest income
3 This in turn follows on a literature developed by Usher (1973) and Becker (1988). 4 Here Professor Smolensky played a key role in identifying true facts and keeping other researchers on the path of truth; see Ross et. al. (1987), Danziger et. al. (1977) and Danziger et. al. (1989).
4
neighborhoods. By 1997, per capita expenditures for home health care (not simply
among those receiving home health care) exceeded $2000 among some demographic
groups. While these expenditures surely resulted in more home visits among the elderly
population, they also benefited the firms and entrepreneurs providing the services. In
1997, federal investigators testified that nearly 40 percent of home health care was
�unjustified,� either because the services were not needed, the individual was not
covered, or the agency should not have provided the service (Havemann, 1997).5 While
we cannot provide a full evaluation of the home health care boom in this paper, it does
suggest that expenditures as a measure of redistribution can be quite suspect when the
primary beneficiaries of the spending could be producers rather than consumers.6
The third empirical finding focuses on income-based differences in the provision
of �effective� care in the treatment of heart attacks, such as the use of aspirin, β-blockers,
and reperfusion in the first 12 hours following the heart attack. We argue that these
measures are in fact a good marker for quality of care (or access to care), since it is these
sources of treatment that have been shown to be the primary (if not the only) major
causes of improvements in survival following heart attacks (Heidenreich and McClellan,
2001). Nor is there any need to adjust for differences in �need� across income groups,
since among ideal or appropriate patients, the target rate is nearly 100 percent regardless
of income or demographic group. These measures also avoid the most serious problems
5 One physician routinely prescribed tests for sexually transmitted diseases for every one of his home health care patients (Havemann, 1997). 6 Another cause for the runup in health care expenditures during the 1990s was the problem of upcoding whereby hospitals switched patients from low-reimbursement to high-reimbursement diagnostic related groups (Silverman and Skinner, 2003). The upcoding epidemic, which was largely shut down following investigations by the Justice Department and others, can be distinguished from more benign �bracket creep� by the sheer magnitude of the increases and the inability to support the diagnosis with the medical record.

5
inherent in outcomes measures, since they do not reflect other factors (genetic, lifestyle,
etc.) that might exert an independent influence on outcomes. During 1994/95, these
measures of effective care show somewhat higher rates among AMI patients living in
higher income neighborhoods, although this income gradient is largely the consequence
of where low income people live (all heart attack patients in Alabama are less likely to be
treated with β-blockers) rather than differences within areas between low and high
income recipients.
Finally, the distributional �twist� in expenditures is reversed by a regressive twist
in health care outcomes. Comparing the 10-year survival patterns of Medicare cohorts in
1982-91 with cohorts of the same age in 1992-2001, we find that the lowest income
decile experienced an increase in expected life-years from age 65-84 of about 0.2 years,
while the highest income decile could reasonably expect an additional 0.9 life-years. The
�full� income that reflects both longevity and income changes therefore diverged during
this period. How much of these differences in longevity reflected medical technology,
and how much other factors, is not entirely understood. Indeed, one study focusing on
just heart attack patients found much larger mortality gains in regions with higher levels
of education and social capital rather than in regions with higher income per se (Skinner
and Staiger, 2003b).
A message of these four findings is that there is a very large difference between
the evaluation of health care expenditures, health care utilization of technologically
effective care, and health care outcomes. While it is not entirely surprising that the
sharp increases in Medicare spending among the bottom income deciles were not
reflected in increased survival � after all, one could still argue that home health care

6
provided great improvements in quality of life � it is more surprising that differences in
health outcomes should widen so much during this period when in fact income inequality
in the general population was moderating (Deaton and Paxson, 2001).
1. The Distribution of Money Income Among the Elderly: 1992-2001
The Medicare program provides health insurance to nearly every elderly person
over age 65. To construct a measure of full income inclusive of Medicare benefits, we
therefore first derive measures of individual income in the over-65 population. Income
is derived from the March CPS data extraction created by Unicon Corporation
(www.unicon.com). There is considerable undercounting of specific forms of income
such as interest and dividends (Roemer, 2000), and we follow Fuchs (1998) in adjusting
estimates of income upward to control for the underreporting; we refer to these measures
of income as �adjusted.�7 Income measures are derived as family income divided by the
number of people in the family, where the sample is just for those respondents age 65 and
over. All income measures are expressed in 1996 dollars.
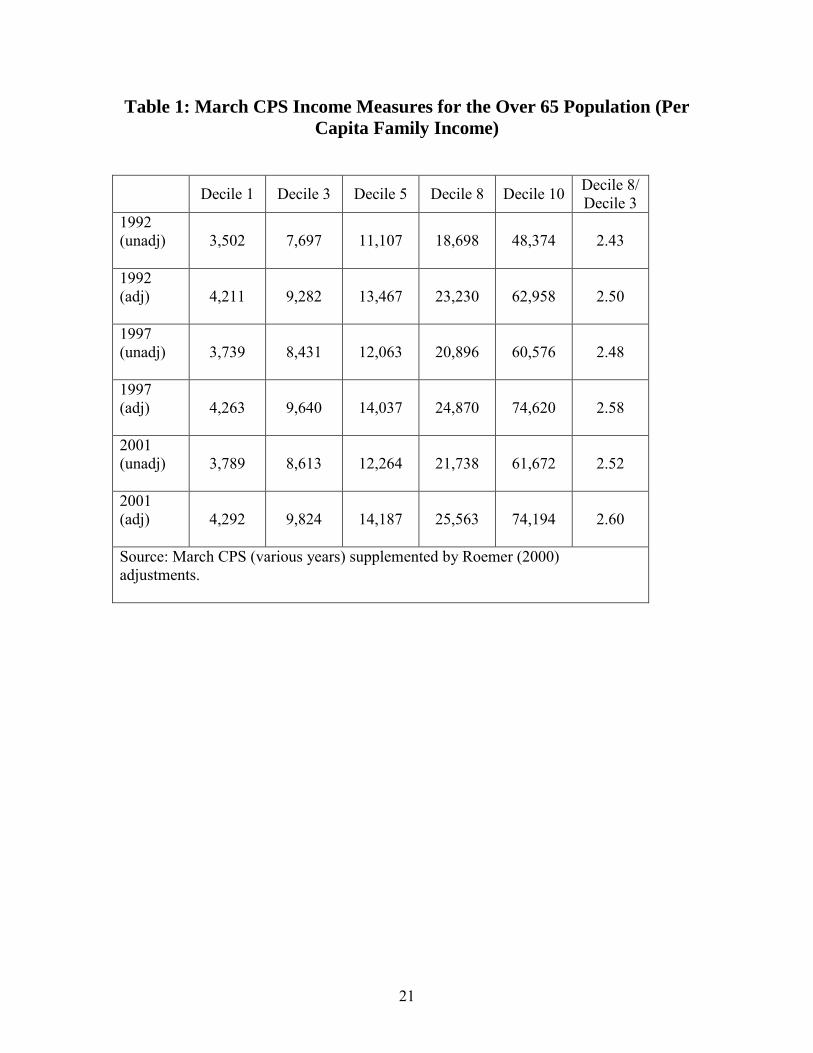
Table 1 presents measures of decile-specific income (both adjusted and
unadjusted) for the 3rd, 5th, and 8th deciles in three critical years, 1992 (the start point),
1997 (the high point of Medicare spending just prior to the implementation of BBA 1997)
and 2001.8 As noted by Fuchs, the measurement of the bottom and top income decile
may be problematic. This is because creating deciles based on observed income
measures will tend to place observations with the most egregious measurement error
(positive or negative) in either of these two deciles (Dynan, et. al., 2003). While we
7 Roemer (2000) developed year-specific underreporting measures for 1990-1996. For years prior to 1990 we use the 1990 adjustments, and for years after 1996 we use the 1996 measures. 8 They are not yet adjusted for differences by age or sex, although preliminary investigation suggests little difference over time in age or sex.
7
cannot entirely rule out the hypothesis that measurement error won�t result in bias for
other deciles as well, we replicate the Fuchs (1998) result by focusing primarily on the
third and eighth income deciles, particularly for comparison with zip code income data,
where even the top and bottom decile neighborhoods will tend to include middle-income
families. There are also pitfalls in comparing income over time for the entire aged
population, (Ross, et. al., 1987) although potential bias is likely to be minimized by the
relatively short time horizons.
Looking at adjusted income measures, Table 1 suggests a modest increase in per
capita money income among the low income deciles, with Decile 3 experiencing an
overall rise of $542 in real 1996 dollars, or an overall decade increase of 5.8 percent. By
contrast, adjusted income for the 8th decile rose by 10 percent in real terms annually, and
for decile 10 income (no doubt fueled by the bull market), real income rose by 18
percent. The ratio of Decile 8 to Decile 3 income rose from 2.5 to 2.6 during 1992-2001.
The important thing to note here is that the magnitude of increases in money income was
quite modest during this period among the bottom income deciles
2. The Distribution of Medicare Expenditures by Zip Code Income
In this analysis, we use the Continuous Medicare History Survey (CMHS), a 5
percent sample of every Medicare enrollee, to consider the secular trends of overall
Medicare expenditures by income decile. Because individual income is not available in
the Medicare claims data, we instead use zip code income. There are advantages and
disadvantages of using zip code income. On the one hand, zip code income may better
reflect permanent income for elderly people � the choice of residence � compared to
survey data, since reported income may not reflect wealth ownership and is likely
8
infested with measurement error and transitory income components. On the other hand,
zip code income is subject to �ecological bias,� poor Medicare enrollees in rich
neighborhoods will generally be treated differently from rich enrollees in poor
neighborhoods, and thus zip code income is also picking up neighborhood effects.
Previous studies have suggested that zip code income provides a reasonable
characterization of income in health-related research (see Geronimus, et. al., 1996).
Nonetheless, one must exercise caution in lining up income deciles based on individual
data (as the CPS above) and based on zip code data (as presented here).
We estimate year and decile specific expenditures by controlling for age
categories (in 5-year increments), sex, and year x decile interaction terms for the entire
sample in 1992, 1997, and 2001 to match up with the CPS income data (N = 3.6
million).9 Only fee-for-service Medicare enrollees are included in the sample.10 We use
zip code income information based on the 1990 Census, but the results are not different if
we use the 2000 Census income data for the later cohorts.11 (There are no available zip
code data on income from the 1980 Census.) Briefly, we find market increases in overall
9 There are well-known approaches to estimating models with zero dependent variables (not terribly serious here, because nearly everyone sees a doctor at least once during the year) and outliers. These nonlinear transformations do not concern us, however, because our primary interest is in average expenditures, not transformed expenditures! Furthermore, our sample size is large enough so that estimates are robust to outliers. 10 In theory, focusing just on fee-for-service recipients could bias results for two reasons. First, the aggregate increases in expenditures could be biased upward if healthier people signed up into health maintenance organizations (HMOs). However, the HMO capitation payments were largely based on previous fee-for-service expenditures (less 5%); given the relatively modest number of people who signed up for HMOs this bias seems small. Second, if there were differential enrollment in HMOs by income groups, bias could result in cross-income comparisons. We intend to look at this question in a subsequent draft. 11 There is likely error introduced by trying to match zip codes at the outset of the cohort with Census data, as zip codes do change over time because they split into multiple zip codes. We do not think that this error will introduce systematic bias in our results, expect perhaps to blur true income-based differences in utilization or expenditures.

9
Medicare spending, with the largest increases among the lowest income decile. Between
1992 and 1997, Medicare expenditures increased by $1317 in the lowest income decile,
while rising by $759 in the top decile.
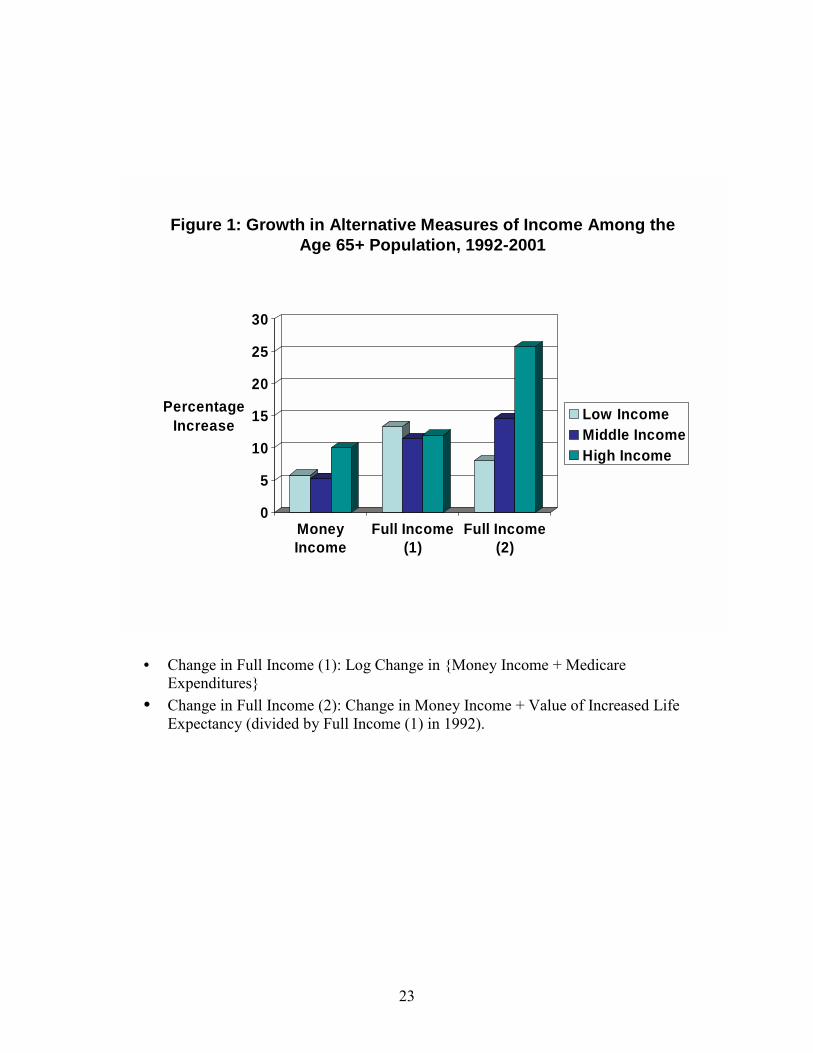
Again following Fuchs (1998), we can create our first measure of full income by
adding to money income (from the CPS) expenditures on Medicare (from the CMHS).
As noted above, below we will match up income data from the 3rd and 8th CPS income
data to the 1st and 10th zip code income deciles.12 Figure 1 presents the basic results thus
far. The first set of measures reflects the total percentage change (over 10 years) in real
money income for the 3rd, 5th, and 8th deciles. The second includes the change in
combined income plus Medicare expenditures, as a percentage of 1992 �full� income.
Here the story is different; the percentage growth in real income (inclusive of Medicare
payments) was essentially flat. In other words, the growth in Medicare expenditures �
valued purely in dollar terms � offset growing inequality in money income.
The rapid increases in Medicare expenditures during the 1990s among low
income zip codes was actually continuing a trend begun in the 1980s. Figure 2 shows
patterns of expenditures for a cohort of Medicare enrollees age 70-74 in 1982, and for the
cohort age 70-74 in 1992, as they aged through 10 years of Medicare expenditures
(conditional on surviving). These are all in real 1996 dollars, and are presented for both
the bottom and the top income deciles. What used to be essentially equal rates between
the top and bottom income deciles in the 1982 cohort shows a sharp divide by the later
cohort through the 1990s. Taking this longer view suggests a relative �twist� in the
income-Medicare expenditure gradient of about $1000 over this 10-year period, or
12 The results are sensitive to using the 10th income decile from the CPS, but the bottom deciles for the CPS are similar with regard income changes.
10
roughly double the increase in adjusted CPS income between 1987-97 for age 70-74
families ($566).
Why the twist? One major reason is because of the rapid expansion of home
health care during the 1990s. Beginning in the late 1980s, when restrictions on the use of
home health care were eased, there were dramatic increases in the use of home health
care particularly in certain regions of the U.S. such as Texas, Florida, and Tennessee
(Wennberg and Cooper, 1999). In part because of a variety of scandals and
investigations, and the rapid growth in expenditures, Congress restricted its use sharply
through BBA 1997. What is less well known is that expenditures for home health care
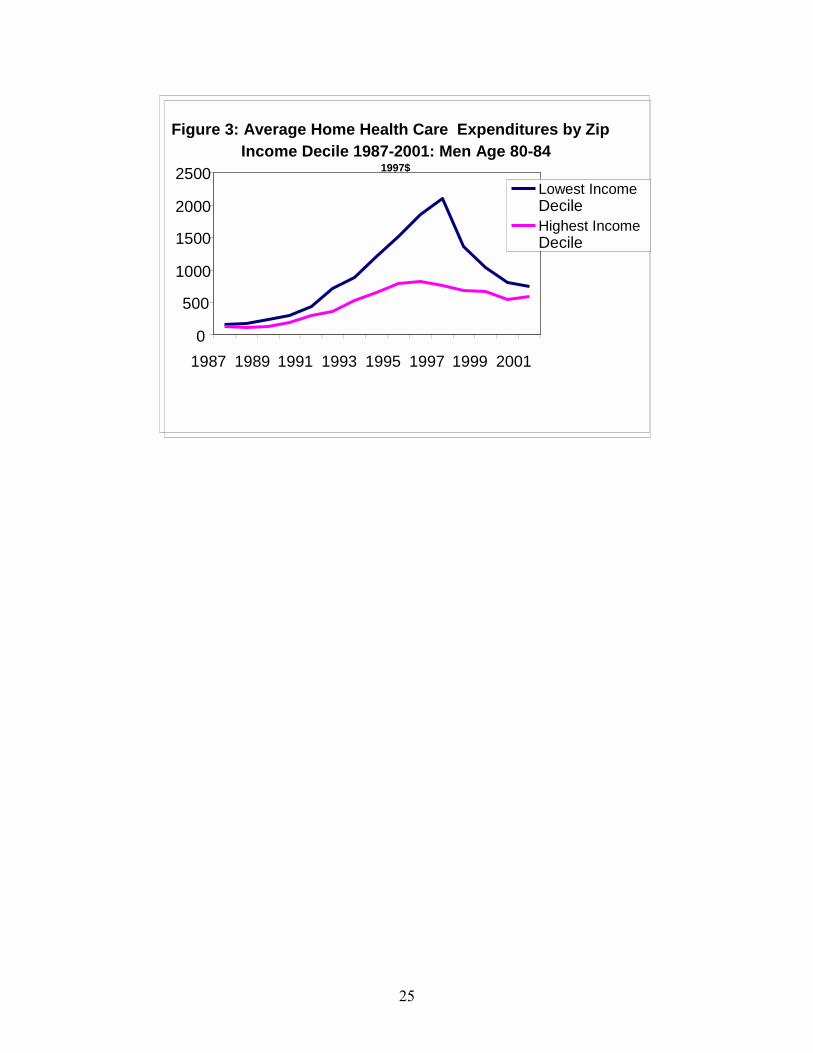
were concentrated to a large extent in the poorest regions of the U.S.13 Figure 3 tabulates
average home health care spending for the cohort of all men initially aged 80-84 in 1987.
These are clearly an older group, and thus more likely to receive some kind of home
health care treatment. Still, the patterns show most starkly the sharp differences in home
health care expenditures by decile. Much of the spending differences took place in the
South, and so to some extent, the differences by income reflect the geography of income;
as there are more low income zip codes in Arkansas and Texas (where use of home health
care was high) than in Connecticut, where use was low.14
In short, one should be cautious about attributing all dollar increases in Medicare
expenditures to the people who nominally �receive� the benefit. The first rule of
incidence analysis is that the recipient of the service may not be the only beneficiary.
13 See Lee, McClellan, and Skinner (1999). 14 States in the northeast were also more likely to finance home health care under their Medicaid programs, and so looking at Medicare alone is likely to overstate the income-based differences. But the bias with regard to the dramatic changes in home health care expenditures cannot be explained by substitution effects between Medicaid and Medicare coverage.
11
Home health care is not the only service provided during the 1990s that may have
benefited providers, but it was certainly the most visible.
3. The Distribution of Effective Care for Heart Attacks by Zip Code Income
The distribution of health care expenditures is informative about the opportunity
costs of the existing health care system in terms of what else could be purchased with the
money devoted to health care. A different (and, one hopes, closely associated) question
is the distribution of health care utilization by income group. Generally, utilization is a
problematic measure of access or inequality, since it is difficult to determine differences
by income owing to underlying health status or preferences. For this reason, we focus on
the technological developments that Heidenreich and McClellan (2001) argue accounts
for all of the improvements in 90-day survival rates following acute myocardial infarction
(AMI): aspirin, β blocker use, reperfussion (thrombolytics or PTCA) within 12 hours of
the heart attack, and ACE inhibitors. Rates of smoking cessation advice among smokers
are also presented. These rates are based on an exhaustive survey of AMI patients over
age 65 in 1994/95 in the Cooperative Cardiovascular Project (CCP) along with chart
reviews of comorbidities (allowing abstracters to determine �appropriate� or �ideal�
categories for treatment) and characteristics of the patient�s AMI. Because we consider
just the universe of ideal or appropriate patients, the �right rate� should be approaching
100 percent (or perhaps a bit lower in the much larger universe of patients deemed
appropriate for treatment), regardless of health status, income, age, or any other
characteristic. For this reason, we present simple means of utilization by income group.
Table 3 presents income-based differences in utilization of effective care.
Approximate 95% confidence intervals are presented at the bottom of the table; these
12
apply to each of the means in the column because the deciles ensure equal sample sizes
and the exact binomial confidence intervals are based on the average ratio. The first
thing to notice is that generally, during 1994/95, rates of utilization of these effective
methods of care were remarkably low, hovering around 50 percent in some cases. (Rates
of β blocker use have risen since they have become commonly used measures of quality,
but in many states they are still used for fewer than 70 percent of ideal patients; see
Jencks, 2003). The second characteristic of these data is that higher income deciles are
more likely to use effective treatments; rates rise from 40 percent in the bottom income
decile to 47 percent in the top decile. Unfortunately, we cannot measure changes over
time in the use of these effective treatments. However, rates of utilization for most of
these treatments were very low among all income groups back in the 1970s, so the record
suggests that technological innovations in the treatment of AMI was biased modestly
towards higher income groups.15
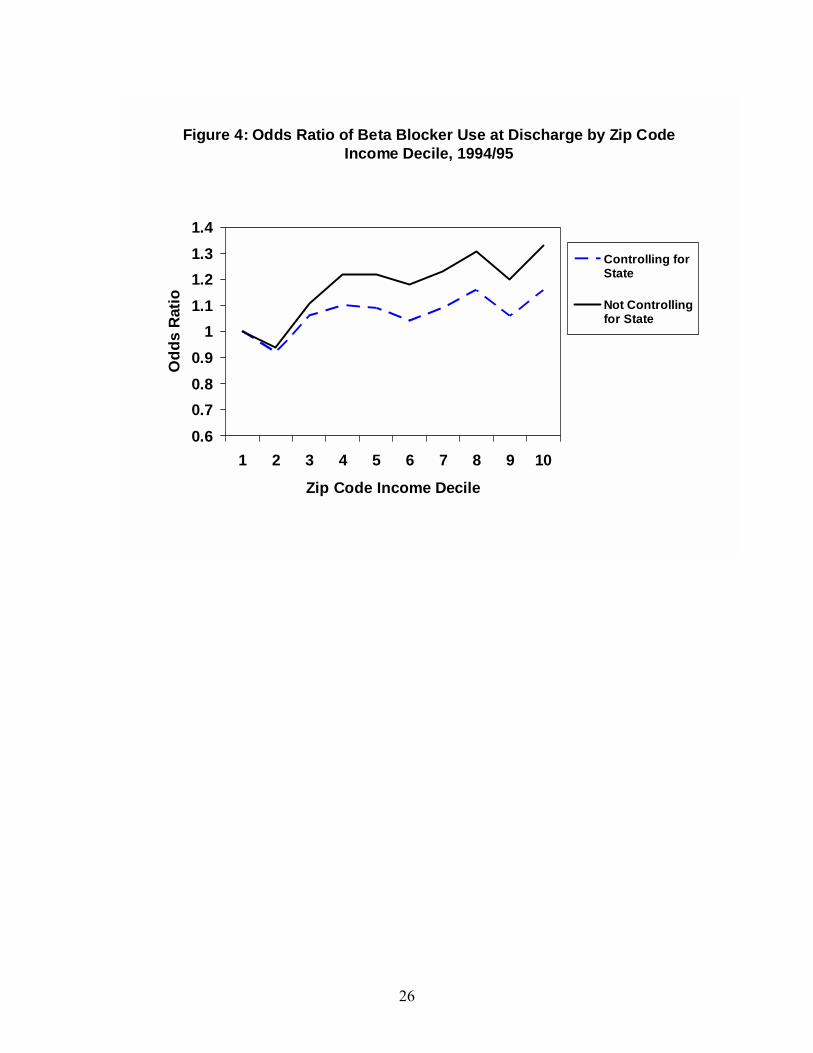
We considered these data further with the use of logistics analysis, with the results
presented in Figure 4 for the case of β blockers. In one case, we simply replicate our
earlier results by estimating a logistics model with zip code income dummy variables. In
the other case, we perform the same analysis but including dummy variables for state of
residence. (There is far more variation across states in the use of β blockers than there is
across income groups; Jencks, 2003). Half of the observed gradient between β blocker
use at discharge and income is the consequence of where people live and not how they
are treated within a given region; the odds ratio for the highest income group (relative to
15 That is, the initial level of use in (say) 1975 is assumed to be near zero across all income groups. If β blockers reduce the likelihood of 90-day mortality by 20 percent, a 7 percent gap across income groups would translate to a 1.4 percent reduction in mortality. If 90-day mortality is about 20 percent, one would expect a difference in deaths of about 3 per 1000 AMI patients; not trivial, but difficult to detect in the data.
13
the benchmark lowest income decile) drops from 1.33 (without controls for state) to 1.16
(with controls).16
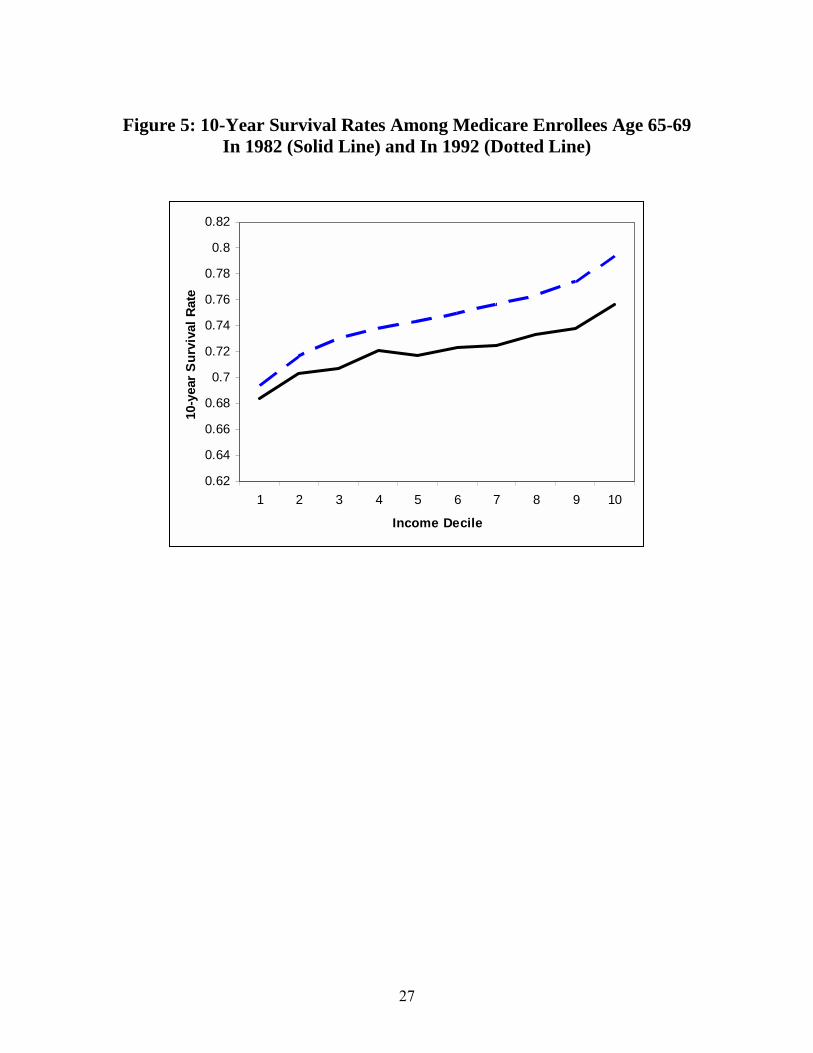
4. The Distribution of Survival Gains by Zip Code Income
We next consider overall survival gains in the Medicare population. Here we use
the entire sample reported in the denominator file, and not just the fee-for-service
population; this is to avoid potential selection bias in attrition into HMO enrollment. We
consider two different cohorts from the Continuous Medicare History Survey. The first is
the group of people age 65-69 and 75-79 alive in 1982, and the second is the
corresponding group alive at age 1992. Figure 5 shows the percentage of the groups age
65-69 in the initial year who were still alive ten years later, broken out by zip code
income in 1990. (Thus the zip codes were essentially identical for the analysis). There is
a clear income gradient in both years; people living in higher zip code incomes were
more likely to survive during both the 1980s and 1990s. What is notable is that the
secular survival gains were substantially larger for higher income groups than for lower
income groups, thus increasing disparities.
One way to quantify these differences is to consider cumulative distribution
tables; essentially Gini coefficient measures for the distribution of life years conditional
on income (e.g., Contoyannis and Forster, 1999). The Gini-equivalent measure, however,
is just 0.02, and the changes over time are even smaller. A different approach is to
consider accumulated life years from 65-84 (formed by chaining together the two panels
of 10 year survival curves for ages 65-69 and 75-79 and appropriately aggregating), and
16 With controls for state, the 95 percent C.I. for the top income decile is 1.06-1.26; except for decile 8 all other deciles are either insignificant or marginally significant.
14
measure changes over time in expected life years.17 There was a 0.2 increase in expected
life years in the bottom income decile, a 0.6 increase in the middle decile, and a 0.9
increase in the top income decile.18
Converting these changes in life years into dollar terms is of course problematic,
but we adopted the approach used in Becker et. al (2003). The essentially insight they
use is to consider how much an individual would be willing to give up in order to gain an
extra year. The context is a standard intertemporal utility function with a fixed disutility
of death.19 Given the set of parameters assumed in the Becker et. al. (2003) paper (an
intertemporal elasticity of substitution � quite different from the (inverse) Arrow-Pratt
measure of relative risk aversion � equal to 1.25, and their assumed disutility of death
measure), we find a $497 money-metric increase in income through improved longevity
for the bottom income decile compared to a $4534 increase for the top income decile.
Figure 1 shows the proportional increase of this most comprehensive measure of
income. For comparability with the Fuchs-style full income measure, we show the
percentage increases of combined money income plus increased longevity as a
percentage of the Fuchs �full income� measure. (There are difficult methodological
issues involved in determining the denominator for full income including life expectancy;
see Cutler, et. al., 1998.) What was previously an improvement in the distribution of full
17 For simplicity, these are undiscounted, but it is straightforward to apply conventional discounting to adjust these measures. 18 This continues an apparent trend; see Pappas (1993). 19 One needs this latter component because the arguments of many utility functions are negative, for example those with constant relative risk aversion parameters in excess of 1; without some disutility of death, a shorter life would be a good thing.
15
income inclusive of Medicare spending has reversed and now reflects increasing
inequality over time.20
5. Conclusions and Discussion
This paper has considered a variety of ways to quantify the distributional changes
of health care spending, utilization of effective care, and actual improvements in health
during the past several decades. In an ideal world, changes in medical expenditures, and
improvements in health, would be associated in a positive way. What made the 1990s in
the U.S. interesting is the sharp discord between rising Medicare expenditures among the
poorest income groups coupled with lagging gains in life expectancy, at least relative to
the highest income groups. Thus one must be careful to distinguish these two measures
of inequality, and suggests inquiring further into more objective measures of the value �
both with regard to survival and with regard to quality of life -- received by the different
groups.
For this reason, we tend to favor a middle ground � measures of effective care
where there is a good sense that rates should be equal across income groups, and
clustered near 100%. For these measures, issues of comorbidities and preferences for
care should not matter. Other treatments may also be candidates for �reliable� measures
of access, such as knee or hip replacements with well established benefits and potential
barriers of access. (Here the evidence suggests much larger racial differences in care
than income-based differences in care, at least among the Medicare population.)
Furthermore, at least measures of effective care are amenable to monitoring across
20 We do not include Medicare expenditures in this definition of full income so as to avoid double counting. However, there may be non-survival benefits of Medicare spending not otherwise reflected in this measure.
16
regions and socio-demographic groups, something which is being done more actively
currently with monitoring of effective care measures.
An important limitation of this study is that it has not considered the financing
side of the Medicare program. Certainly during this period since the 1980s and 1990s,
Medicare tax payments both rose and became more progressive as general income taxes
became a larger source of revenue (McClellan and Skinner, 2003). Certainly an analysis
of the new prescription drug benefits passed into law in 2003 should consider both the
importance of fixed annual payments (highly regressive) and the introduction of a
�missing market� among lower income recipients without access to employer-based
retirement supplemental insurance plans, as well as the intergenerational transfers likely
to take place.21 Whether changes in the progressivity of financing would (or should)
compensate for the longer life expectancy of high income households is both a
quantitative and an ethical question.
21 Addressing this larger question requires data not simply on the elderly population (as is discussed below) but also on the income distribution of younger generations paying the additional taxes; see Danziger et. al. (1977).
17
References Auerbach, Alan, Jagadeesh Gokhale, and Laurence J. Kotlikoff, "Social Security and
Medicare Policy from the Perspective of Generational Accounting," in J.M. Poterba (ed.) Tax Policy and the Economy 6. Cambridge: NBER and MIT Press (1992).
Battacharya, Jay, and Darius Lakdawalla, �Does Medicare Benefit the Poor? New
Answers to an Old Question,� NBER Working Paper No. 9215 (revised, 2003). Becker, Gary S., Thomas J. Philipson, and Rodrigo R. Soares, �The Quantity and Quality
of Life and the Evolution of World Inequality,� NBER Working Paper No. 97645 (June 2003).
Bommier, A., and G. Stecklov, �Defining Health Inequality: Why Rawls Succeeds Where
Social Welfare Theory Fails,� Journal of Health Economics 21(3) (2002): 497-514.
Contoyannis, Paul, and Martin Forster, �The Distribution of Health and Income: A
Theoretical Framework,� Journal of Health Economics 18(5) (1999): 605-622. Culyer, A.J., Eddy van Doorslaer, and Adam Wagstaff, "Comment: Utilisation as a
measure of equity by Mooney, Hall, Donaldson, and Gerard," Journal of Health Economics 11 (1992): 93-98.
Cutler, David, Mark McClellan, Joseph Newhouse, and Dahlia Remler, �Pricing Heart
Attack Treatments,� Quarterly Journal of Economics 113(4) (November 1998), 991-1024.
Danziger, Sheldon, Robert Haveman, and Eugene Smolensky, �The Measurement and
Trend of Inequality: Comment,� American Economic Review 67(3) (June 1977): 505-512.
Danziger, Sheldon, Peter Gottschalk, and Eugene Smolensky, �How the Rich Have Fared
1973-87� American Economic Review 79 (2) (May 1989): 310-314. Davis, Karen, and Roger Reynolds, "Medicare and the Utilization of Health Care
Services by the Elderly," Journal of Human Resources 10(3): 361-77. Deaton, Angus, and Christina Paxson, �Mortality, Income, and Income Inequality Over
Time in Britain and the United States,� NBER Working Paper No. 8534 (October 2001).
Dynan, Karen, Jonathan Skinner, and Stephen Zeldes, �Do the Rich Save More?� Journal
of Political Economy (forthcoming, 2003).

18
Fuchs, Victor, �The Financial Problems of the Elderly: A Holistic Approach,� NBER Working Paper No. 8236 (April 2001).
Fuchs, Victor, �Provide, Provide: The Economics of Aging� NBER Working Paper No.
6642 (July 1998). Fullerton, Don, and Diane Rogers, Who Bears the Lifetime Tax Burden? Washington
DC: The Brookings Institution (1993). Geronimus, Arline, John Bound, and Lisa Neidert, �On the Validity of Using Census
Geocode Characteristics to Proxy Individual Socioeconomic Characteristics,� Journal of the American Statistical Association 91(434): 529-537 (1996).
Gittelsohn, Alan M., Jane Halpern, and Ricardo L. Sanchez, "Income, Race, and Surgery
in Maryland," American Journal of Public Health 81(11) (November 1991): 1435-41.
Glied, Sherry, and Adriana Lleras-Muney, �Health Inequality, Education, and Medical
Innovation,� NBER Working Paper No. 9738 (May 2003). Goldman, D.P and J.P. Smith. 2002. �Can Patient Self-Management Help Explain the
SES Health Gradient?� Proceeding of the National Academy of Sciences of the United States of America 99(16): 10929-10934.
Gornick, Marian E., Paul Eggers, Thomas Reilly, Renee Mentnech, Leslye Fitterman,
Lawrence Kucken, and Bruce Vladeck, �Effects of Race and Income on Mortality and Use of Services Among Medicare Beneficiaries,� New England Journal of Medicine 335: 791-799 (1996).
Havemann, Judith, �Fraud is Rife in Home Care for the Elderly; Medicare Investigators
Find 40% of Services Unjustified,� The Washington Post (July 29, 1997) p. A01. Heidenreich, Paul A., and Mark McClellan, �Trends in Treatment and Outcome for Acute
Myocardial Infarction: 1975-1995,� American Journal of Medicine 110 (2001): 165-74.
House, James S., Ronald C. Kessler, and A. Regula Herzog, et al., �Age, Socioeconomic
Status, and Health,� The Millbank Quarterly 68(3) (1990): pp. 383-411. Jencks, Stephen F., Edwin D. Huff, and Timothy Cuerdon, �Change in the Quality of
Care Delivered to Medicare Beneficiaries,� JAMA 289(3) (January 15, 2003), 305-312.
Kitagawa, E.M, and P.M. Hauser, Differential Mortality in the United States Cambridge:
Harvard University Press (1973). Le Grand, Julian, The Strategy of Equality. London, George Allen & Unwin (1982).
19
Le Grand, Julian, �The Distribution of Health Care Revisited: A Commentary on
Wagstaff, van Doorslaer and Paci, and O�Donnell and Propper,� Journal of Health Economics 10 (1991): 239-245.
Lee, Julie, Mark McClellan, and Jonathan Skinner, �The Distributional Effects of
Medicare Expenditures,� in J. Poterba (ed.) Tax Policy and the Economy 13 (1999)
Link, Charles R., Stephen H. Long, and Russell F. Settle, "Equity and the Utilization of
Health Care Services by the Medicare Elderly," Journal of Human Resources 17(2) (1982): 195-212.
Link, Charles R., and Russell F. Settle, "Medicare and the Disadvantaged Elderly:
Objectives and Outcomes," Health and Society 62(4) (1984): 609-656. Lleras-Muney, Adriana, and Frank R. Lichtenberg, �The Effect of Education on Medical
Technologgy Adoption: Are the More Educated More Likely to Use New Drugs?� NBER Working Paper No. 9185 (September 2002).
Lubitz, James, and Gerald Riley, 1993, �Trends in Medicare Payments in the Last Year
of Life,� New England Journal of Medicine 331: 1092-1096. McClellan, Mark, and Jonathan Skinner, �The Incidence of Medicare.� Mimeo,
Dartmouth College (2003). Mulligan, Casey, and Tomas Philipson, �Merit Motives and Government Intervention:
Public Finance in Reverse,� NBER Working Paper No. 7698 (May 2000). Pappas, G., et al., �The Increasing Disparity in Mortality Between Socioeconomic
Groups in the United States,� New England Journal of Medicine 329: 103-109 (1993).
Preston, Samuel, and Paul Taubman, �Socioeconomic Differences in Adult Mortality and
Health Status,� in Linda G. Martin and Samuel Preston (eds.) Demography of Aging (Washington DC: National Research Council and the National Academy Press) (1994).
Roemer, Marc I., �Assessing the Quality of the March Current Population Survey and the
Survey of Income and Program Participation Income Estimates, 1990-1996,� Mimeo, Income Surveys Branch, Housing and Household Economic Statistics Division, U.S. Census (June 16, 2000).
Ross, Christine M., Sheldon Danziger, and Eugene Smolensky, �Interpreting Changes in
the Economic Status of the Elderly, 1949-79,� Contemporary Policy Issues 5 (April 1987): 98-112.

20
Sassi, F., L. Archard, and J. Le Grand, �Equity and the Economic Evaluation of
Healthcare.� Health Technology Assessments 5(3) (2001): 1-130. Skinner, Jonathan, and Douglas Staiger, �The Diffusion of Health Care Technology,�
Mimeo, Dartmouth College (April 2003a). Skinner, Jonathan, and Douglas Staiger, �Hybrid Corn and Beta Blockers: Explaining
Patterns of Technological Innovation in the United States,� Mimeo, Dartmouth College (December 2003b).
Skinner, Jonathan, Zhou, Weiping, and James Weinstein, �Income-Based Differences in
the Prevalence of Knee Osteoarthritis and the Incidence of Knee Replacements,� mimeo, Dartmouth Medical School (2003).
Smith, George, and Matthias Egger, "Socioeconomic Differences in Mortality in Britain
and the United States," American Journal of Public Health 82 (1992): 1079-1081. Smith, James, �Unraveling the SES-Health Connection,� mimeo, RAND Corporation
(September 2003). Wagstaff, Adam, Eddy van Doorslaer, and Pierella Paci, �On The Measurement of
Horizontal Inequity in the Delivery of Health Care,� Journal of Health Economics 10 (1991): 169-205.
21
Table 1: March CPS Income Measures for the Over 65 Population (Per Capita Family Income)
Decile 1 Decile 3 Decile 5 Decile 8 Decile 10 Decile 8/
Decile 3 1992 (unadj)
3,502 7,697 11,107 18,698 48,374 2.43
1992 (adj)
4,211 9,282 13,467 23,230 62,958 2.50
1997 (unadj)
3,739 8,431 12,063 20,896 60,576 2.48
1997 (adj)
4,263 9,640 14,037 24,870 74,620 2.58
2001 (unadj)
3,789 8,613 12,264 21,738 61,672 2.52
2001 (adj)
4,292 9,824 14,187 25,563 74,194 2.60
Source: March CPS (various years) supplemented by Roemer (2000) adjustments.

22
Table 2: Medicare Expenditures by Year and Zip Code Income Decile
Decile 1 Decile 3 Decile 5 Decile 8 Decile 10
1992 3,667 3,304 3,235 3,454 3,450
1997 4,984 4,564 4,346 4,107 4,209
2001 4,852 4,580 4,437 3,997 4,334
Source: Medicare Continuous History Survey. Controls for age and sex.
Table 3: Rates of Effective Care for Heart Attack (AMI) In the CCP 1994/95: by Income Decile
Zip Code Income Decile
Beta Blocker Use at
Discharge*
Ace Inhibitor At Discharge**
Reperfusion within 12
Hours
Smoking advice
given*** 1 40 57 32 33
2 39 57 32 35
3 43 60 33 34
4 45 59 33 35
5 45 59 34 37
6 44 57 35 34
7 45 59 37 34
8 47 59 37 37
9 45 59 36 35
10 47 59 37 35 Approx.
95% Conf. Interval
±1.4 ±2.2 ±1.7 ±2.3
Sample size 50,156 19,286 32,097 17,151 Source: Cooperative Cardiovascular Project. * Universe: appropriate (beta blocker) or eligible (for reperfusion). ** Universe: ideal patients *** Universe: smokers
23
Figure 1: Growth in Alternative Measures of Income Among the Age 65+ Population, 1992-2001
0
5
10
15
20
25
30
Percentage Increase
MoneyIncome
Full Income(1)
Full Income(2)
Low IncomeMiddle IncomeHigh Income
• Change in Full Income (1): Log Change in {Money Income + Medicare
Expenditures} • Change in Full Income (2): Change in Money Income + Value of Increased Life
Expectancy (divided by Full Income (1) in 1992).

24
Figure 2: Medicare Expenditures for Cohorts Age 65-69 in 1982-92 and 1992-2001 (1996$)
0
1000
2000
3000
4000
5000
6000
7000
1 2 3 4 5 6 7 8 9 10Year
$199
6 Ex
pend
iture
s
25
Figure 3: Average Home Health Care Expenditures by Zip Income Decile 1987-2001: Men Age 80-84
1997$
0
500
1000
1500
2000
2500
1987 1989 1991 1993 1995 1997 1999 2001
Lowest Income Decile Highest Income Decile
26
Figure 4: Odds Ratio of Beta Blocker Use at Discharge by Zip Code Income Decile, 1994/95
0.60.70.80.9
11.11.21.31.4
1 2 3 4 5 6 7 8 9 10
Zip Code Income Decile
Odd
s R
atio
Controlling forState
Not Controllingfor State
27
Figure 5: 10-Year Survival Rates Among Medicare Enrollees Age 65-69
In 1982 (Solid Line) and In 1992 (Dotted Line)
0.62
0.64
0.66
0.68
0.7
0.72
0.74
0.76
0.78
0.8
0.82
1 2 3 4 5 6 7 8 9 10
Income Decile
10-y
ear S
urvi
val R
ate