Floods, Fires, Earthquakes and Pine Beetles: JARring Actions and Fat Tails Berkeley Symposium on...
37
Floods, Fires, Earthquakes and Pine Beetles: JARring Actions and Fat Tails Berkeley Symposium on Real Estate, Catastrophic Risk, and Public Policy UC Berkeley, March 22-23, 2006 Thanks to Alan Berger, Carolyn Kousky, Erzo Luttmer
-
date post
21-Dec-2015 -
Category
Documents
-
view
215 -
download
0
Transcript of Floods, Fires, Earthquakes and Pine Beetles: JARring Actions and Fat Tails Berkeley Symposium on...

Floods, Fires, Earthquakes and Pine Beetles:JARring Actions and Fat Tails
Berkeley Symposium on Real Estate, Catastrophic Risk, and Public
Policy UC Berkeley, March 22-23, 2006
Thanks to Alan Berger, Carolyn Kousky, Erzo Luttmer

Mistreating the Mississippi:JARring Actions that Fueled the Floods
Work with Carolyn Kousky

Mistreating the Mississippi
• There has been much examination of what went wrong once Katrina was on the radar screen heading for New Orleans.
• Our analysis is on decisions made long before Katrina but that nonetheless exacerbated her impacts. For example: 1850: Swamp and Overflow Land Act (filling wetlands) 1944-63: 6 dams planned for and constructed on the
Missouri (“Big Muddy”) 1965: Completion of Mississippi River Gulf Outlet
• These are examples of JARring actions.

Overview of Presentation
• What are JARring actions and what challenges do they pose for policy?
• Hurricane Katrina as an example of a disaster that was exacerbated by JARring actions
• Potential policy responses

JARring Actions
• Acronym JARring: Jeopardize Assets that are Remote• A particular type of externality: cost imposed on
others who are spatially or temporally distant• Could also be distant due to the probabilistic nature of
imposed costs• Can often lead to a loss of “ecosystem services” such
as flood mitigation and storm surge attenuation by coastal wetlands
• Building in wildfire zone or on fault• Suppressing fires
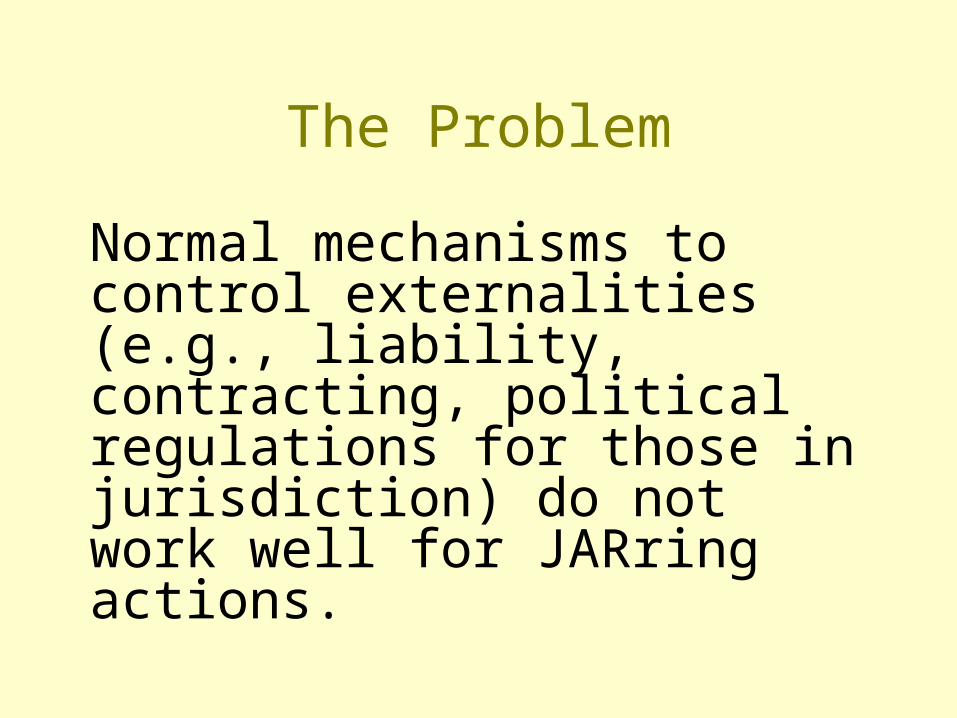
The Problem
Normal mechanisms to control externalities (e.g., liability, contracting, political regulations for those in jurisdiction) do not work well for JARring actions.

Policy Challenges
• Hard to assign responsibility for consequences plausible deniability
• Collective action problems
• People tend to look for local causes
• Scientific uncertainty
• Hard to calculate changes in risk levels
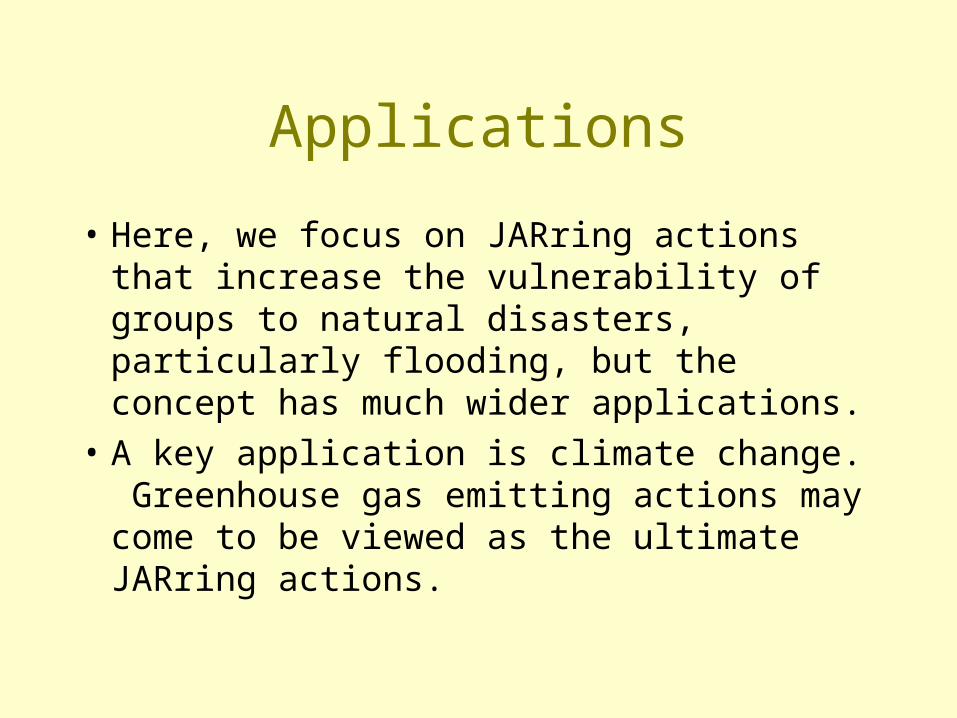
Applications
• Here, we focus on JARring actions that increase the vulnerability of groups to natural disasters, particularly flooding, but the concept has much wider applications.
• A key application is climate change. Greenhouse gas emitting actions may come to be viewed as the ultimate JARring actions.
Examples of JARring Actions
• Private entities face no incentive to consider how their actions affect those distant from them.
• Examples:– Filling wetlands
– Increasing impervious surface area
– Construction of agricultural levees
– Increasing drainage of agricultural land
– Lobbying for structural projects that though privately beneficial mistreat the Mississippi
Public JARring Actions
• Historically, government (particularly USACE) has not considered the external costs imposed by large structural projects.
• Examples:– Levees
– Canals
– Dams
– Responding to lobbying efforts of concentrated interest groups

(PHOTO BY ELLIS LUCIA / The Times-Picayune)
Coastal wetland loss and Katrina:losing a storm buffer
Each year an area of marsh close to the size of Manhattan is lost.

2000
1973
Tracking the Loss
Source: http://www.publichealth.hurricane.lsu.edu/Louisiana%20Coastal%20Land%20Loss.htm

Causes of Loss:Lack of Sediment Reaching Gulf
Sources: http://www.lewis-clark.org/content/content-article.asp?ArticleID=1412
http://www.industcards.com/hydro-usa-ne-dakotas.htm

Causes of Loss:Sediment Sent Out to Sea
The sediment is “shot over the shelf like peas through a peashooter, and lost to the abyssal plain.” - John McPhee
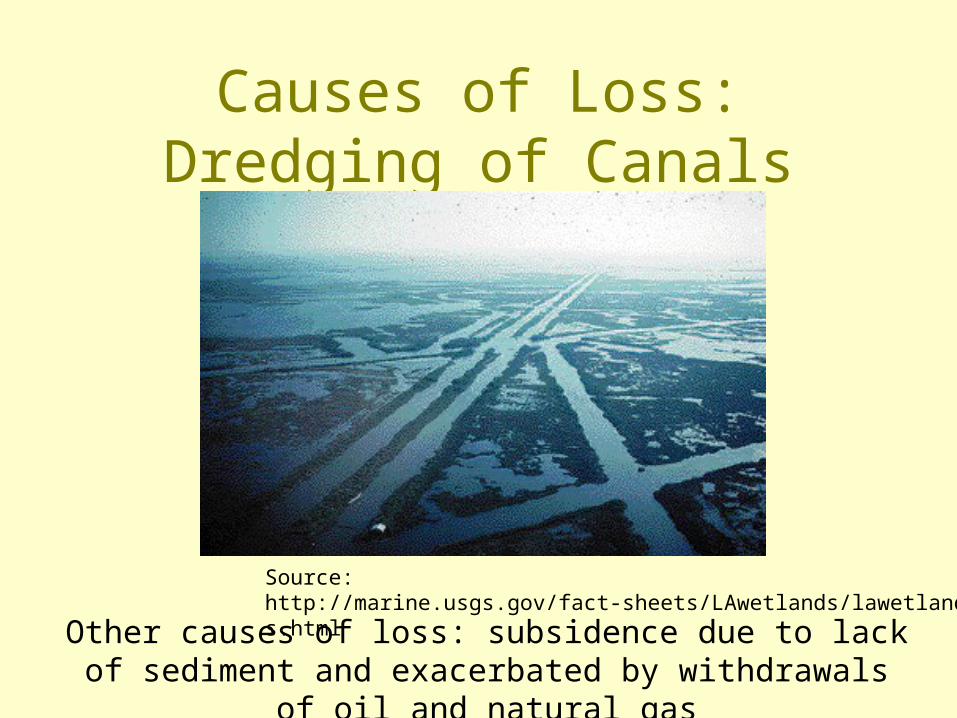
Causes of Loss:Dredging of Canals
Source: http://marine.usgs.gov/fact-sheets/LAwetlands/lawetlands.html
Other causes of loss: subsidence due to lack of sediment and exacerbated by withdrawals of oil and natural gas

MRGO (Mississippi River Gulf Outlet)
http://www.saveourlake.org/wetlands.htm

Issues Left to the Reader(Due to time limitations)
• Government Action Needed
• Possible Policy Responses
• The Mistake of Planning for the X-Year Flood, Fire, Quake, or Infestation
• Incentives, Insurance and Planning for the Future

Contagion in Disaster Attention Number of times "avian flu" mentioned in U.S.
news sources as tallied from Lexis-Nexis
050
100150200250300350400450500
Month
Nu
mb
er o
f tim
es

What’s Wrong with This Picture?
Phoenix suburb

This Picture Too.
Littleton, Mass.


Historically Significant Wildland Fires 1988-1999 Continental U.S.
Date Name Location Acres Significance
1988 Yellowstone Montana and Idaho 1,585,000 Large Amount of Acreage
Burned
1988 Canyon Creek Montana 250,000 Large Amount of Acreage Burned
June 1990 Painted Cave California 4,900 641 Structures Destroyed
June 1990 Dude Fire Arizona 24,174 6 Lives Lost 63 homes destroyed
October 1991 Oakland Hills California 1,500 25 Lives Lost and 2,900
Structures Destroyed
August 1996 Cox Wells Idaho 219,000 Largest Fire of the Year
1998 Flagler/St. John Florida 94,656 Forced the evacuation of thousands of residents
August 1999
Dunn Glen Complex Nevada 288,220 Largest Fire of the Year
September - November
1999 Kirk Complex California 86,700
Hundreds of people were evacuated by this complex of fires that burned for almost 3
months
FAT TAILS: Observe massive multiple of largest to next in three categories:
Largest fire of year, people evacuated, and structures destroyed.
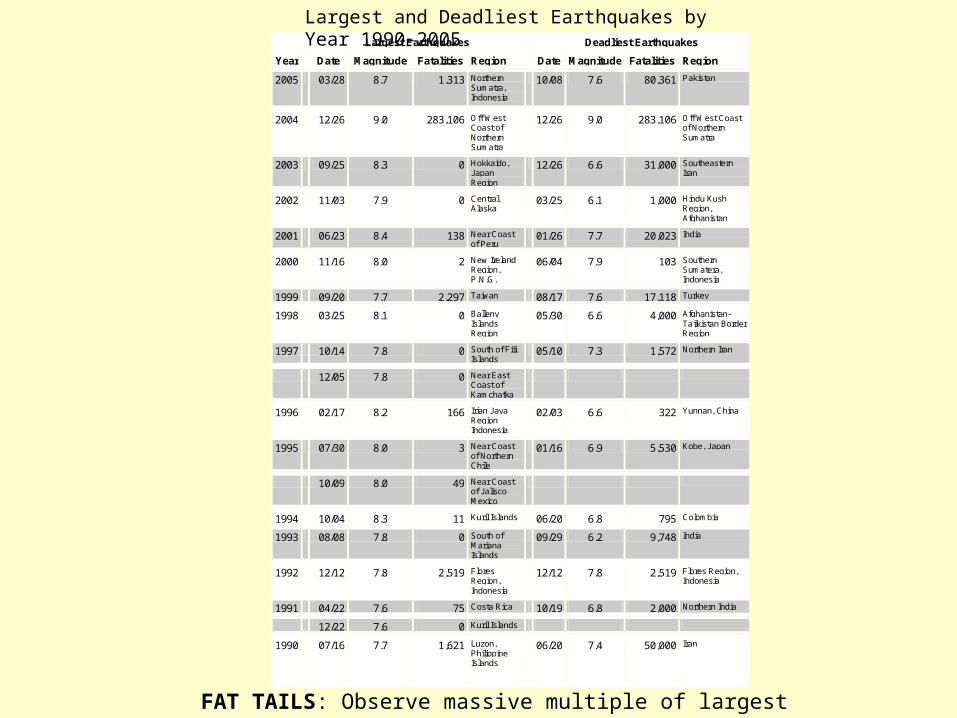
Largest Earthquakes Deadliest Earthquakes
Year Date Magnitude Fatalities Region Date Magnitude Fatalities Region
2005 03/28 8.7 1,313 Northern Sumatra, Indonesia
10/08 7.6 80,361 Pakistan
2004 12/26 9.0 283,106 Off West Coast of Northern Sumatra
12/26 9.0 283,106 Off West Coast of Northern Sumatra
2003 09/25 8.3 0 Hokkaido, Japan Region
12/26 6.6 31,000 Southeastern Iran
2002 11/03 7.9 0 Central Alaska
03/25 6.1 1,000 Hindu Kush Region, Afghanistan
2001 06/23 8.4 138 Near Coast of Peru
01/26 7.7 20,023 India
2000 11/16 8.0 2 New Ireland Region, P.N.G.
06/04 7.9 103 Southern Sumatera, Indonesia
1999 09/20 7.7 2,297 Taiwan 08/17 7.6 17,118 Turkey
1998 03/25 8.1 0 Balleny Islands Region
05/30 6.6 4,000 Afghanistan-Tajikistan Border Region
1997 10/14 7.8 0 South of Fiji Islands
05/10 7.3 1,572 Northern Iran
12/05 7.8 0 Near East Coast of Kamchatka
1996 02/17 8.2 166 Irian Jaya Region Indonesia
02/03 6.6 322 Yunnan, China
1995 07/30 8.0 3 Near Coast of Northern Chile
01/16 6.9 5,530 Kobe, Japan
10/09 8.0 49 Near Coast of Jalisco Mexico
1994 10/04 8.3 11 Kuril Islands 06/20 6.8 795 Colombia
1993 08/08 7.8 0 South of Mariana Islands
09/29 6.2 9,748 India
1992 12/12 7.8 2,519 Flores Region, Indonesia
12/12 7.8 2,519 Flores Region, Indonesia
1991 04/22 7.6 75 Costa Rica 10/19 6.8 2,000 Northern India
12/22 7.6 0 Kuril Islands
1990 07/16 7.7 1,621 Luzon, Philippine Islands
06/20 7.4 50,000 Iran
FAT TAILS: Observe massive multiple of largest to next in fatalities.
Largest and Deadliest Earthquakes by Year 1990-2005

Earthquakes and People
• We routinely build in areas at risk from earthquakes – consider the Bay Area.
• This is largely because earthquakes are an “amenity risk.”
• Amenity Risks: risks that have associated with them a benefit
• Compare to Noxious Risks

Source: Wikipedia, USGS
Comparing population density to earthquake hazard

USGS time dependent map of earthquake hazard in the next 24 hours

Source: USGS

Protection responds to investment.Investment responds to protection.
• Housing pressures in the Bay Area have led to increased development in the Sacramento-San Joaquin Valley.
• The area is prone to flooding and levees in the region are in need of repair.
• State lawmakers are considering upgrading protection in the region and the state’s congressional delegation is working to secure federal funding.
• Local officials are also requiring builders to increase protection.

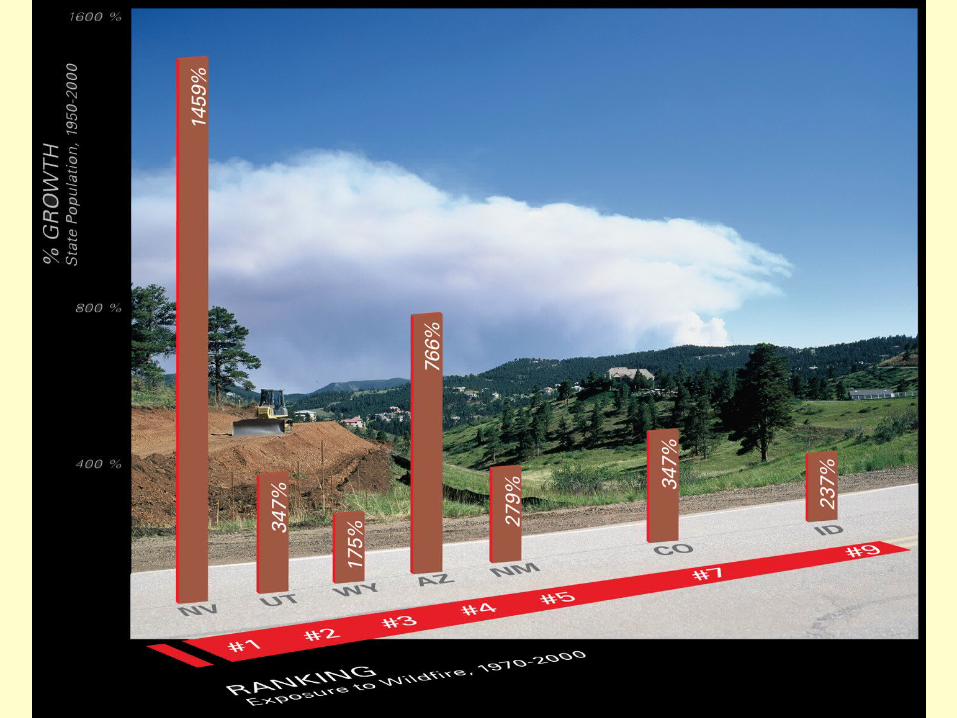
Forest Fires
• As we expand into the urban-wild interface, our investments face greater risk of fire
• This is another example of an “amenity risk” – along with higher risk of fire, people experience peace and quiet, scenic views, etc.
• Risk reduction includes actions such as clearing fuel around homes

Pine Beetles
• Largest infestation in North American history.
• Infest area in British Columbia three times the size of Maryland.
• 12 western states
• Attacks old, even-aged trees
• Result of clear cutting and wild fire suppression
• Dead trees also spur wildfires
• Associated with warming winters (global warming?)
• Timber companies may benefit, millions of trees to be cut down

Fire is Our Enemy

Dendroctonus ponderosae

Loss Distributions and Fat Tails1. For the distributions of some individual outcomes, e.g., human heights, variability is
small relative to the mean.
2. Other outcomes are aggregates, determined by large numbers of trials with low probabilities. These will also have small variability relative to the mean.
These distributions are the norm we carry around in our head. They are fundamentally misleading when we think about low probability catastrophes.
3. Catastrophes are low probability outcomes. Their magnitudes, e.g., acres lost to the largest wildfire, people lost in a terrorist attack, damage due to a flooding incident, are highly variable relative to their mean.
4. When individual outcomes have high variability relative to their mean, there is rarely symmetry in distribution of the magnitude of losses.
5. Rather, there is likely to be symmetry in the logarithm of the magnitude of loss. Thus, an outcome of roughly twice the median is as likely as one half the median.
6. We should think of these outcomes in terms of multiples. You think the median loss is M. What multiple of the mean K would you require to have a ½ chance of observing the outcome? That is, for what K do you believe the outcome would be as likely as not to be between M/K and KM?
7. Even when we think in terms of multiples, our thinking is likely to be influenced excessively by the Normal (bell-shaped) distribution. The tails of real world distributions tend to be thicker than that.
8. This is bad news, if true. The most people lost in a terrorist accident in the US is less than 3,000. But there is a good chance that 100,000 could be lost.

People Estimate Distributions Too Tightly Real-Time Estimation Exercise
Your job is to assess:
First, your median estimate (50th percentile). This means the outcome is as likely to be above it as below it.
Second, your 25th and 75th percentiles. The 25th percentile means the outcome has one chance in four of being below it. In other words, if it is below your median, it is as likely as not to be below your 25th percentile.
Third, your 1st and 99th percentiles, what are sometimes called surprise points. There should only be a 1% chance that the true value lies below your 1st percentile. There should only be a 1% chance that the true value lies above your 99th percentile.
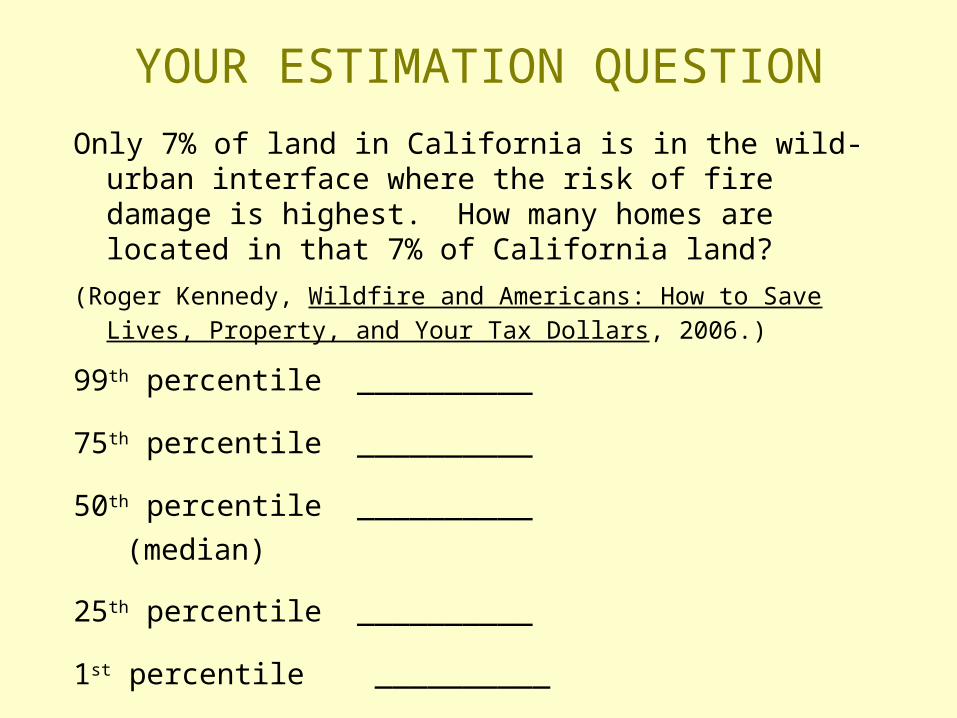
YOUR ESTIMATION QUESTION
Only 7% of land in California is in the wild-urban interface where the risk of fire damage is highest. How many homes are located in that 7% of California land?
(Roger Kennedy, Wildfire and Americans: How to Save Lives, Property,
and Your Tax Dollars, 2006.)
99th percentile __________
75th percentile __________
50th percentile __________
(median)
25th percentile __________
1st percentile __________

In Conclusion
While we can never contract with the future or accurately predict all of the consequences of our actions and policies, policymakers must extend their thinking about their impacts and the impacts of private entities beyond the local, the near term, the likely, and the recently newsworthy.