Berenberg and Goldman Sachs Fourth German Corporate Conference · Berenberg and Goldman Sachs...
56
Berenberg and Goldman Sachs Fourth German Corporate Conference Munich, 21 – 22 September 2015
-
Upload
dinhkhuong -
Category
Documents
-
view
218 -
download
1
Transcript of Berenberg and Goldman Sachs Fourth German Corporate Conference · Berenberg and Goldman Sachs...

Berenberg and Goldman Sachs Fourth German Corporate Conference
Munich, 21 – 22 September 2015

2
Taking TUI to the next level – Our growth and value strategy 2
Summary & Outlook 3
Agenda
Overview TUI Group & 9M performance 1
TUI GROUP | Berenberg and Goldman Sachs Fourth German Corporate Conference | 21 - 22 September 2015

3
TUI Group – The World’s Leading Tourism Business
TUI GROUP | Berenberg and Goldman Sachs Fourth German Corporate Conference | 21 - 22 September 2015
Attractive global hotel portfolio Growing fleet of cruise ships
Modern & efficient leisure airline Access to over 20m customers
Key figures 13/14: Turnover €18.5bn; Underly. EBITA €870m; DPS €0.33
4
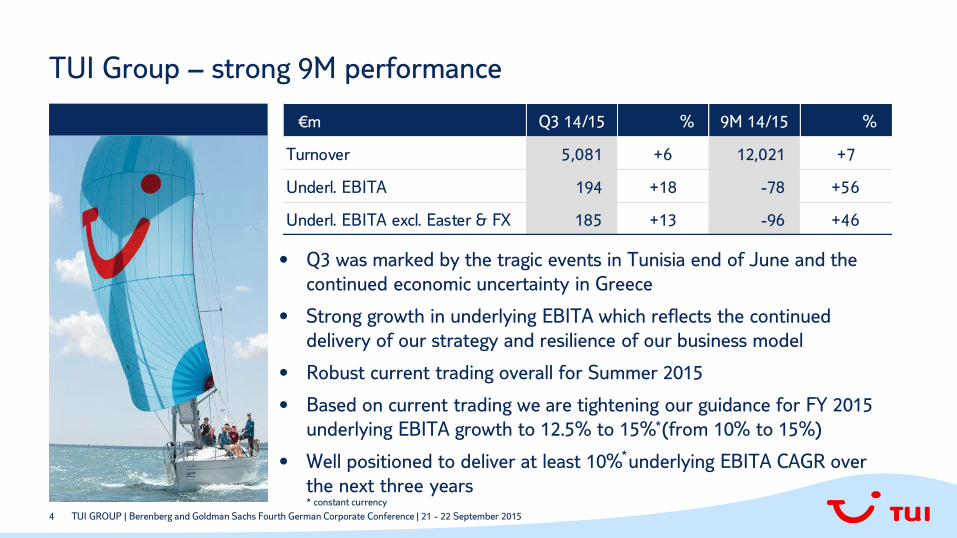
• Q3 was marked by the tragic events in Tunisia end of June and the
continued economic uncertainty in Greece
• Strong growth in underlying EBITA which reflects the continued
delivery of our strategy and resilience of our business model
• Robust current trading overall for Summer 2015
• Based on current trading we are tightening our guidance for FY 2015
underlying EBITA growth to 12.5% to 15% (from 10% to 15%)
• Well positioned to deliver at least 10% underlying EBITA CAGR over
the next three years
TUI Group – strong 9M performance
TUI GROUP | Berenberg and Goldman Sachs Fourth German Corporate Conference | 21 - 22 September 2015
€m Q3 14/15 % 9M 14/15 %
Turnover 5,081 +6 12,021 +7
Underl. EBITA 194 +18 -78 +56
Underl. EBITA excl. Easter & FX 185 +13 -96 +46
*
*
* constant currency
5
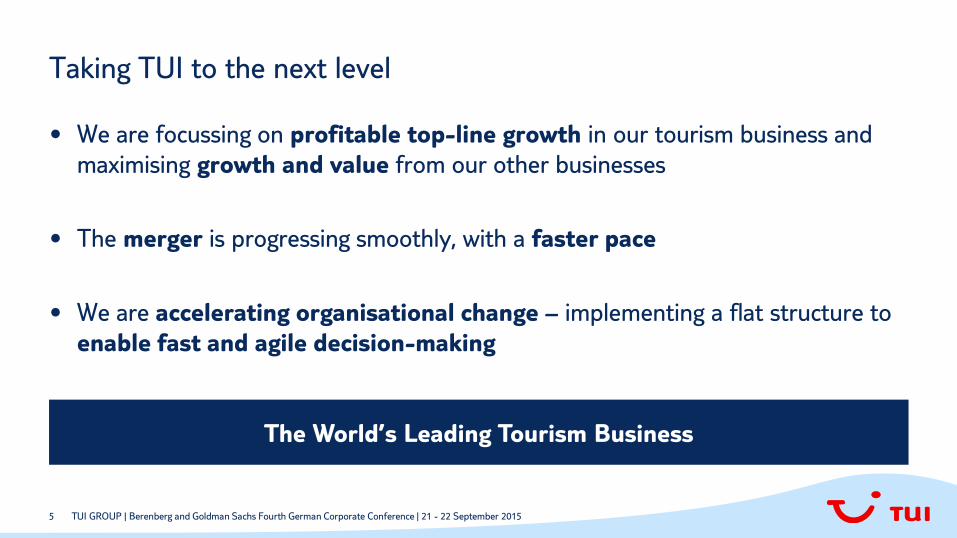
Taking TUI to the next level
• We are focussing on profitable top-line growth in our tourism business and
maximising growth and value from our other businesses
• The merger is progressing smoothly, with a faster pace
• We are accelerating organisational change – implementing a flat structure to
enable fast and agile decision-making
The World’s Leading Tourism Business
TUI GROUP | Berenberg and Goldman Sachs Fourth German Corporate Conference | 21 - 22 September 2015
6
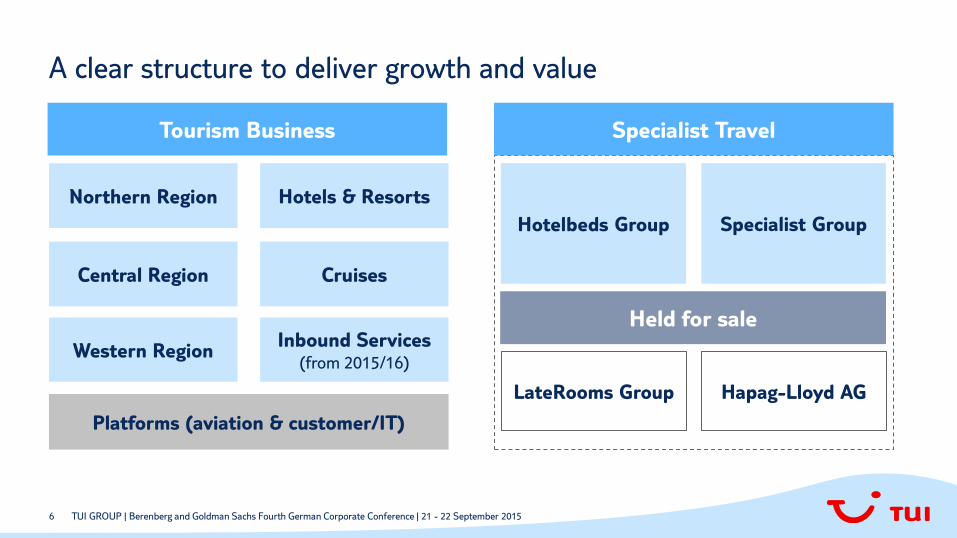
A clear structure to deliver growth and value
TUI GROUP | Berenberg and Goldman Sachs Fourth German Corporate Conference | 21 - 22 September 2015
Tourism Business
Held for sale
Hotelbeds Group
LateRooms Group Hapag-Lloyd AG
Northern Region
Central Region
Western Region
Specialist Group
Hotels & Resorts
Cruises
Platforms (aviation & customer/IT)
Inbound Services (from 2015/16)
Specialist Travel

7
What we want to achieve – our growth levers
TUI GROUP | Berenberg and Goldman Sachs Fourth German Corporate Conference | 21 - 22 September 2015
Deliver Tourism Growth
Marketing &
Sales
Maximise Growth & Value of our other businesses
Flight Inbound
Service Accommodation
Balance sheet strength, flexibility and
strong free cash flow generation
Deliver Merger Synergies
Unparalleled
customer
proposition
Increased
shareholder
returns
Integrated
platforms
Integrated
management
8
Integrated
platforms
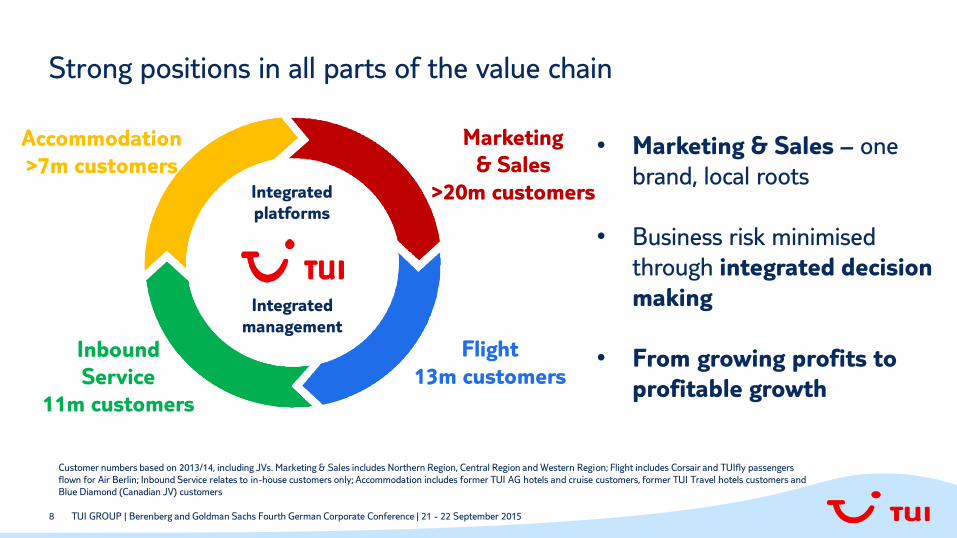
Strong positions in all parts of the value chain
TUI GROUP | Berenberg and Goldman Sachs Fourth German Corporate Conference | 21 - 22 September 2015
Marketing
& Sales
>20m customers
Flight
13m customers
Inbound
Service
11m customers
Accommodation
>7m customers
Integrated
management
Customer numbers based on 2013/14, including JVs. Marketing & Sales includes Northern Region, Central Region and Western Region; Flight includes Corsair and TUIfly passengers
flown for Air Berlin; Inbound Service relates to in-house customers only; Accommodation includes former TUI AG hotels and cruise customers, former TUI Travel hotels customers and
Blue Diamond (Canadian JV) customers
• Marketing & Sales – one
brand, local roots
• Business risk minimised
through integrated decision
making
• From growing profits to
profitable growth
9
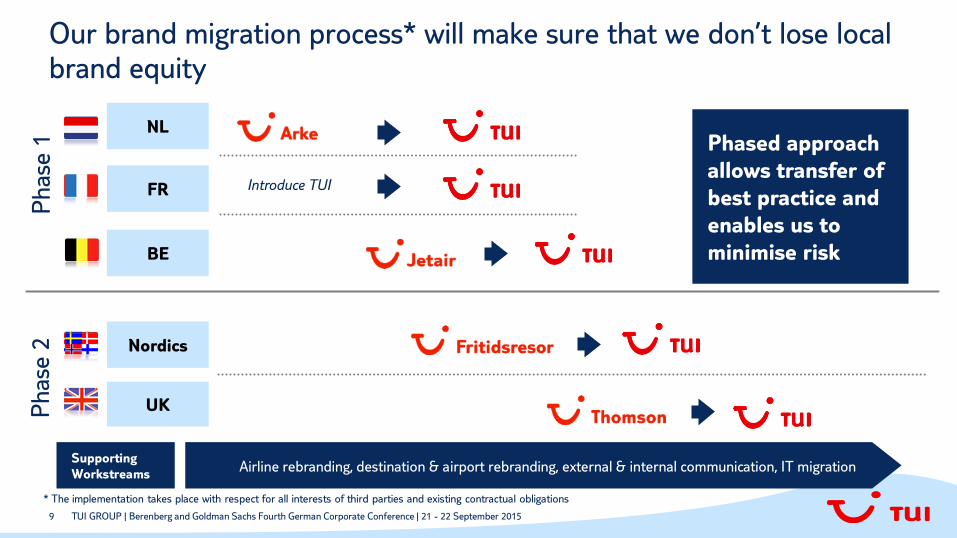
Airline rebranding, destination & airport rebranding, external & internal communication, IT migration
Our brand migration process* will make sure that we don’t lose local brand equity
NL
Introduce TUI
Supporting
Workstreams
FR
BE
UK
Nordics
Phase
1
Phase
2
TUI GROUP | Berenberg and Goldman Sachs Fourth German Corporate Conference | 21 - 22 September 2015
Phased approach
allows transfer of
best practice and
enables us to
minimise risk
* The implementation takes place with respect for all interests of third parties and existing contractual obligations
10
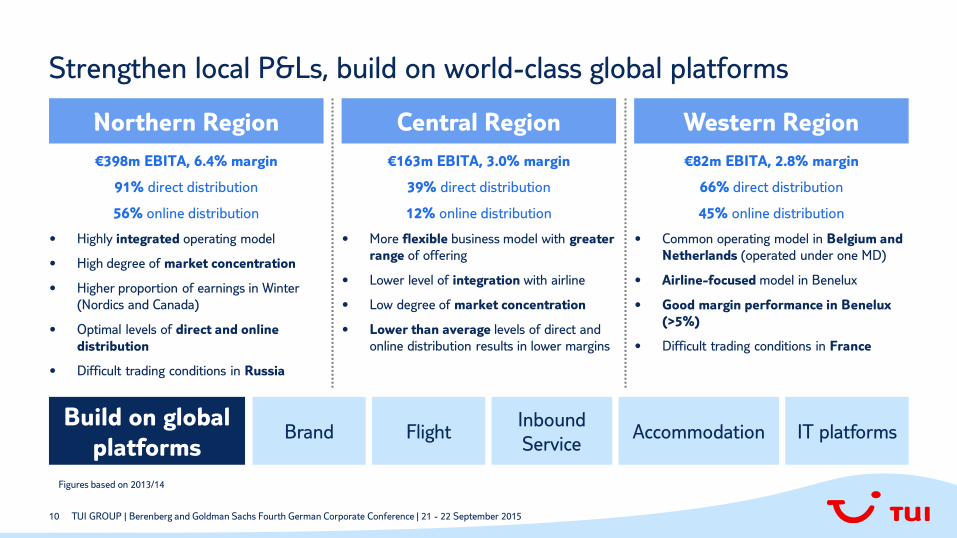
Strengthen local P&Ls, build on world-class global platforms
TUI GROUP | Berenberg and Goldman Sachs Fourth German Corporate Conference | 21 - 22 September 2015
Northern Region Central Region Western Region
€398m EBITA, 6.4% margin
91% direct distribution
56% online distribution
• Highly integrated operating model
• High degree of market concentration
• Higher proportion of earnings in Winter
(Nordics and Canada)
• Optimal levels of direct and online
distribution
• Difficult trading conditions in Russia
€163m EBITA, 3.0% margin
39% direct distribution
12% online distribution
• More flexible business model with greater
range of offering
• Lower level of integration with airline
• Low degree of market concentration
• Lower than average levels of direct and
online distribution results in lower margins
€82m EBITA, 2.8% margin
66% direct distribution
45% online distribution
• Common operating model in Belgium and
Netherlands (operated under one MD)
• Airline-focused model in Benelux
• Good margin performance in Benelux
(>5%)
• Difficult trading conditions in France
Build on global
platforms Brand Flight
Inbound
Service Accommodation IT platforms
Figures based on 2013/14
11
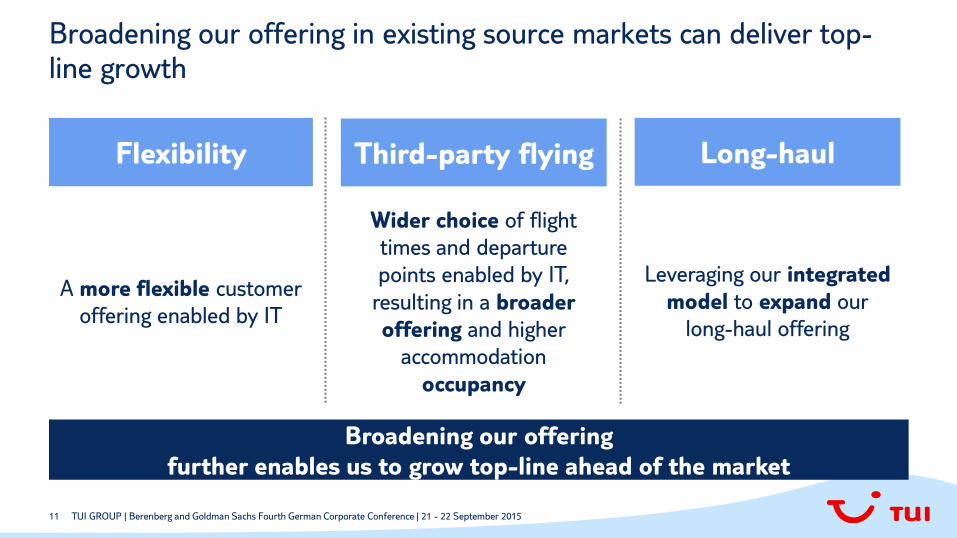
Broadening our offering in existing source markets can deliver top-line growth
TUI GROUP | Berenberg and Goldman Sachs Fourth German Corporate Conference | 21 - 22 September 2015
Third-party flying Flexibility
Wider choice of flight
times and departure
points enabled by IT,
resulting in a broader
offering and higher
accommodation
occupancy
A more flexible customer
offering enabled by IT
Long-haul
Leveraging our integrated
model to expand our
long-haul offering
Broadening our offering
further enables us to grow top-line ahead of the market

12
Europe’s 7th largest airline fleet
TUI GROUP | Berenberg and Goldman Sachs Fourth German Corporate Conference | 21 - 22 September 2015
59 aircraft
10 aircraft
22 aircraft
29 aircraft
8 aircraft
Aircraft numbers as at 31 September 2014; TUIfly (Germany) excludes aircraft leased out to Air Berlin; Corsair excluded from above figures
One organisational structure
Business model /
ways of working
Scale: one procurement organisation /
common supply chain & process
Local airlines: crew rostering / flight planning
Cen
tral P
latf
orm
Targeting €50m operational efficiency
improvement by 2018/19 The only leisure airline with 787
Industry-leading rates of asset utilisation Central platform with local airlines

13
Our Inbound service team
TUI GROUP | Berenberg and Goldman Sachs Fourth German Corporate Conference | 21 - 22 September 2015
Bringing World of TUI to life
Delivering our differentiation strategy
in all destinations
Customer
experience Sales
Cost People
engagement
Increase NPS and CSQ Increase sales & margin
Reduce cost of sales & overheads Increase engagement scores
Over 6,500 employees
11m customers
Transfers
Transport Excursions
Handling
One organisation
Service
109 destinations
Being fully integrated within Tourism
Figures shown relate to Inbound Services business which is being moved from Hotelbeds Group to Tourism

14 TUI GROUP | Berenberg and Goldman Sachs Fourth German Corporate Conference | 21 - 22 September 2015
Growth in Our Strong Hotel and Club Brands
Brand
Strategy
Continue to grow the
highly profitable brand
Expand & internationalise
the club product
Our new brand :
New hotels plus
repositioning of
some existing
brands
Distribution ~50% through TUI >75% through TUI
Footprint (30/9/14)
Med
Caribbean
Nth Africa
Other
Med
Nth Africa
Other
Targeting ~60 new hotels by 2018/19
Hotels Clubs
95% through TUI
Med
Nth Africa

15 TUI GROUP | Berenberg and Goldman Sachs Fourth German Corporate Conference | 21 - 22 September 2015
Growth in our Powerful & Exclusive International Hotel Concepts
International hotel concepts designed for specific customer segments -
enhanced occupancy management and reduced risk
Luxurious (5* only) family-
friendly hotels, exceptional
wellness facilities and world-
class entertainment
11 hotels
NPS >70
Adult-only 4&5* seafront
hotels ; contemporary styling
and spa facilities
56 hotels
NPS ~60
Upscale modern family resorts
(4* and above) first class
wellness experience; activities
for different generations
40 hotels
NPS >50
# hotels currently planned for Summer 2016; NPS scores are for Summer 2014
• Differentiates our
local market offering
• Earlier bookings
• Superior margins
• Superior NPS
16
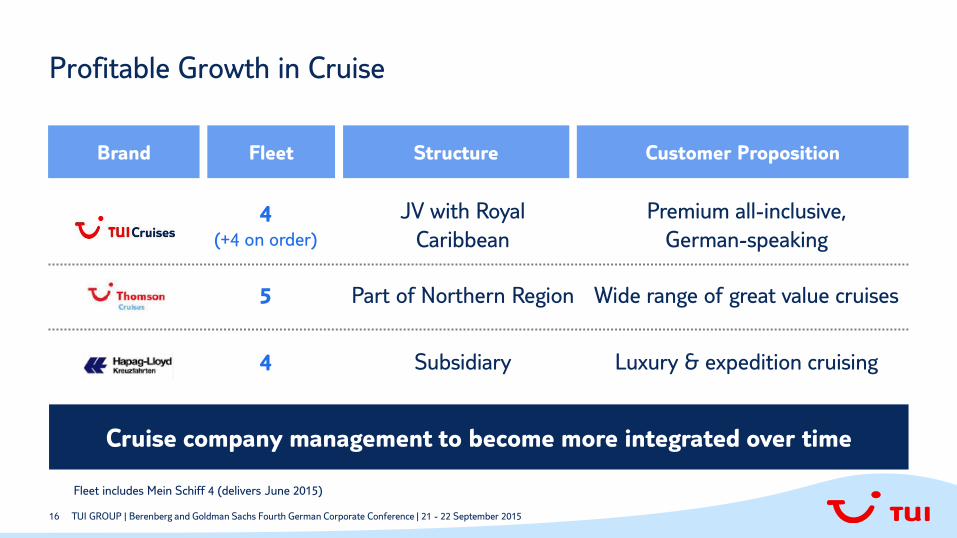
Profitable Growth in Cruise
TUI GROUP | Berenberg and Goldman Sachs Fourth German Corporate Conference | 21 - 22 September 2015
4 (+4 on order)
JV with Royal
Caribbean
Premium all-inclusive,
German-speaking
5 Part of Northern Region Wide range of great value cruises
4 Subsidiary Luxury & expedition cruising
Fleet includes Mein Schiff 4 (delivers June 2015)
Cruise company management to become more integrated over time
Brand Fleet Structure Customer Proposition

17
Conquering Destinations - Our long-haul presence
TUI GROUP | Berenberg and Goldman Sachs Fourth German Corporate Conference | 21 - 22 September 2015
Asia & India
Significant and growing long-haul presence
Mexico &
C.America
USA
Indian Ocean
Over 1m customers (source markets, accommodated)
Over 40 group hotels
Figures correct for 2013/14 unless otherwise noted
Range of cruise routes
Caribbean
Middle East
Australia
13 x 787s (S15)
18
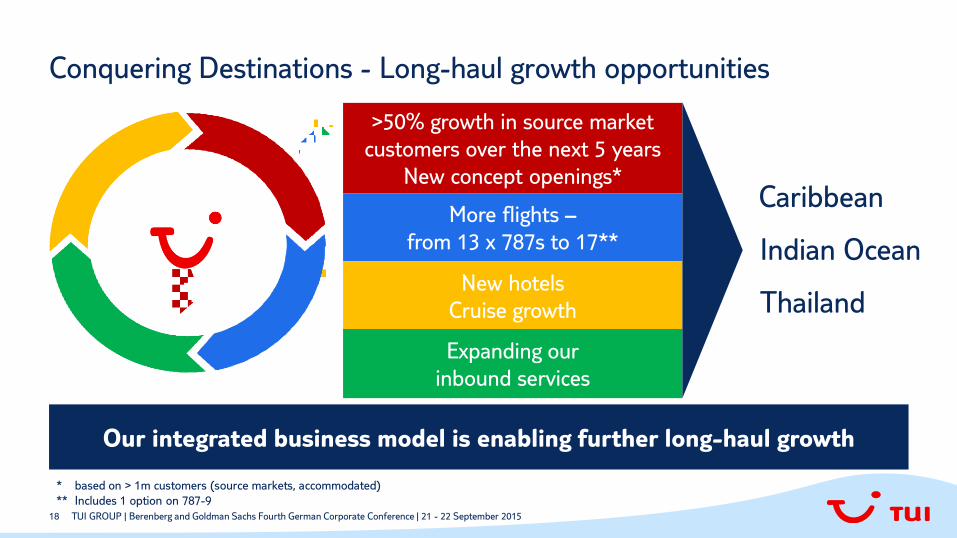
Conquering Destinations - Long-haul growth opportunities
TUI GROUP | Berenberg and Goldman Sachs Fourth German Corporate Conference | 21 - 22 September 2015
Our integrated business model is enabling further long-haul growth
* based on > 1m customers (source markets, accommodated)
** Includes 1 option on 787-9
Caribbean
>50% growth in source market
customers over the next 5 years
New concept openings*
More flights –
from 13 x 787s to 17**
New hotels
Cruise growth
Expanding our
inbound services
Indian Ocean
Thailand

19
Integrated Platforms - Focus on Customer Experience
TUI GROUP | Berenberg and Goldman Sachs Fourth German Corporate Conference | 21 - 22 September 2015
• IBM strategic marketing platform:
• Multi-channel, personalised marketing
• In depth view of marketing effectiveness
• Data warehouse / analytics
• Enhancing the online customer experience
• Driving higher conversion rates in source markets
• Include hotel platforms in scope
• SAP solution:
• Single view of the customer
• Contact management
• Customer service support
• Top-line and margin improvement
• Increasingly mobile first
• Key driver of customer engagement at every stage
of the journey
• Over 1 million downloads to date
Central Mobility Platform
Central Online Platform
Central Customer Platform
Central eCRM

20
Maximise Growth and Value of our other businesses
TUI GROUP | Berenberg and Goldman Sachs Fourth German Corporate Conference | 21 - 22 September 2015
Hotelbeds
Group
LateRooms
Group
Hapag Lloyd AG
Specialist
Group
• Optimise strategic future through standalone operation
• Run as independent business
• Inbound Services being integrated into Tourism
• Evaluating our options
• Portfolio of businesses
• Run independently and managed for value
• Held for sale
• Held for sale
• CSAV merger complete, expect to deliver significant synergies and business expected to
return to profitability in 2015
• Our shareholding is now <15% and we continue to hold the business for sale
• Agreed upon IPO with other shareholders
21
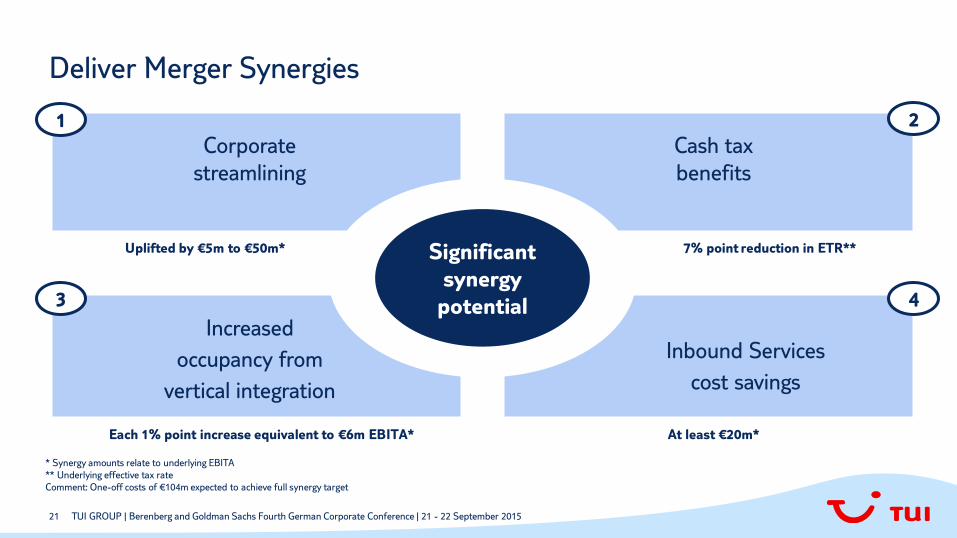
Deliver Merger Synergies
TUI GROUP | Berenberg and Goldman Sachs Fourth German Corporate Conference | 21 - 22 September 2015
Corporate
streamlining
Cash tax
benefits
Inbound Services
cost savings
Increased
occupancy from
vertical integration
Uplifted by €5m to €50m* 7% point reduction in ETR** Significant
synergy
potential
At least €20m* Each 1% point increase equivalent to €6m EBITA*
1 2
3 4
* Synergy amounts relate to underlying EBITA
** Underlying effective tax rate
Comment: One-off costs of €104m expected to achieve full synergy target

22
Growth Roadmap - Growth Levers
TUI GROUP | Berenberg and Goldman Sachs Fourth German Corporate Conference | 21 - 22 September 2015
Profitable top-line growth &
further efficiency enhancements
in source markets
Continue strategy of
capacity growth in
hotels & cruises
Maximise growth & value of
other businesses
Deliver merger synergies
Focus on balance sheet
simplicity, flexibility and strong
free cash flow generation
Profitable top-line growth which
outperforms the market (>3%)
One Aviation (€50m)
>60 new hotels @ €1.4m EBITA*
4 new ships @ €25m EAT per
ship (50% share)
15%-20% EBITA CAGR
€100m by 2016/17
Rigorous focus on SDIs , interest and
capex management
What we want to achieve Growth Roadmap
Source Markets
Hotels & Cruises
Hotelbeds Group
Corporate streamlining
Occupancy improvement
Inbound Services
P&L, Balance Sheet,
Cash flow
EBITA CAGR in line with Tourism Specialist Group
* Hotel margin only

23
Progressive dividend policy
TUI GROUP | Berenberg and Goldman Sachs Fourth German Corporate Conference | 21 - 22 September 2015
20
25
30
35
40
45
50
55
60
65
70
2013/14 TUI AG 2013/14 TUI Travel 2014/15 indicative 2015/16 indicative
33 cents
44.5 cents
• 2014/15 dividend will be
based off 44.5 cents
• Dividend in respect of
2014/15 and 2015/16 will
grow in line with growth in
underlying EBITA at
constant currency
• Additional 10% in 2014/15
and 2015/16
Indicative Dividend Growth
TUI Travel dividend 2013/14 (excl additional 10p) 14.55p
Converted at €0.82 17.76c
At exchange ratio 0.399 44.5c
Additional 10%
Based on growth in underlying EBITA

24
Taking TUI to the Next Level – the World’s Leading Tourism Business
TUI GROUP | Berenberg and Goldman Sachs Fourth German Corporate Conference | 21 - 22 September 2015
• Merger integration ahead of our original plan - we are working well together
• New organisation structure in place - a flatter, more agile structure
• Strong and sustainable business model with exciting growth prospects
• Profitable top-line growth >3%
• Tightening of FY 15 underlying EBITA guidance to 12.5%-15% (from 10% - 15%)
• Expect at least 10% underlying EBITA CAGR over the next three years
• Committed to progressive dividend growth
Well positioned to deliver underlying EBITA CAGR of at least 10%
over the next three years Guidance on constant currency
Appendix
TUI GROUP | Berenberg and Goldman Sachs Fourth German Corporate Conference | 21 - 22 September 2015
9M 2014/15 Results 13 August 2015
TUI GROUP | Berenberg and Goldman Sachs Fourth German Corporate Conference | 21 - 22 September 2015
27
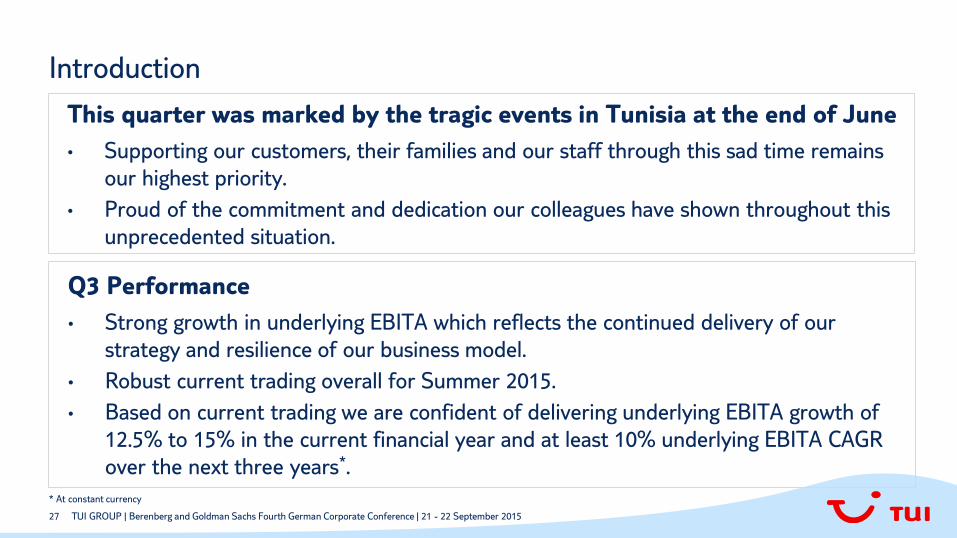
Introduction
* At constant currency
This quarter was marked by the tragic events in Tunisia at the end of June
• Supporting our customers, their families and our staff through this sad time remains
our highest priority.
• Proud of the commitment and dedication our colleagues have shown throughout this
unprecedented situation.
Q3 Performance
• Strong growth in underlying EBITA which reflects the continued delivery of our
strategy and resilience of our business model.
• Robust current trading overall for Summer 2015.
• Based on current trading we are confident of delivering underlying EBITA growth of
12.5% to 15% in the current financial year and at least 10% underlying EBITA CAGR
over the next three years*.
TUI GROUP | Berenberg and Goldman Sachs Fourth German Corporate Conference | 21 - 22 September 2015

28
Q3 2014/15
Strong Q3 underlying
EBITA growth
Source Markets
Hotels & Resorts and
Cruises
• Group underlying EBITA improved to €194m (Q3 2013/14: €164m)
• Includes €11m adverse Easter impact and €10m
repatriation/cancellation costs for Tunisia, offset by €20m benefit from
FX translation
• Northern - Strong UK load factor and margin performance
• Central - Additional investment in distribution and margin pressure in
Germany
• Western - Costs due to aircraft entry into service delay in Belgium
• Hotels & Resorts delivered significantly higher result, driven by strong
Riu performance
• Cruises continued to grow profits, with full year operation of Mein
Schiff 3, launch of Mein Schiff 4 and continued turnaround of Hapag-
Lloyd Kreuzfahrten
Strong growth in Q3 underlying EBITA demonstrates
the resilience of our integrated business model
Hotelbeds Group • Increase in underlying EBITA driven by 20% growth in roomnights
TUI GROUP | Berenberg and Goldman Sachs Fourth German Corporate Conference | 21 - 22 September 2015
29
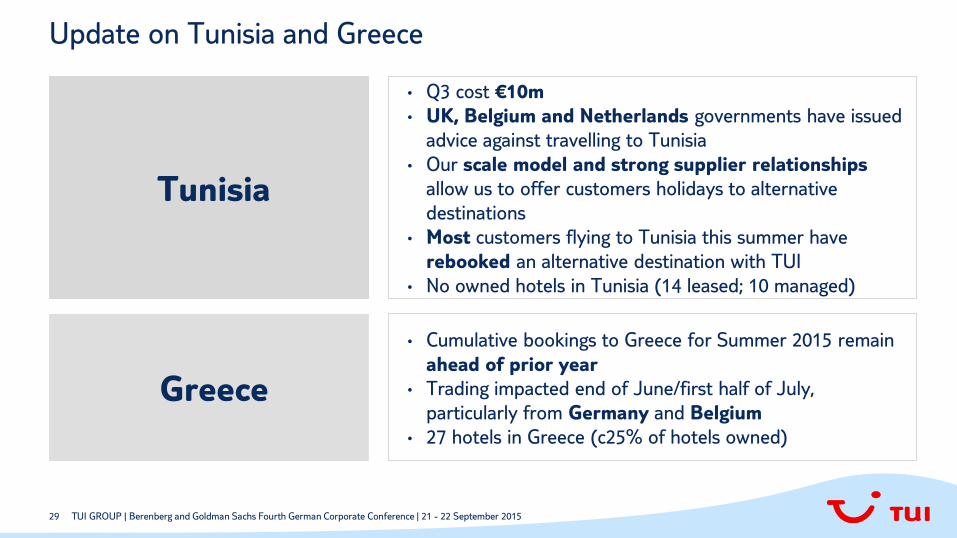
Update on Tunisia and Greece
Tunisia
Greece
• Q3 cost €10m
• UK, Belgium and Netherlands governments have issued
advice against travelling to Tunisia
• Our scale model and strong supplier relationships
allow us to offer customers holidays to alternative
destinations
• Most customers flying to Tunisia this summer have
rebooked an alternative destination with TUI
• No owned hotels in Tunisia (14 leased; 10 managed)
• Cumulative bookings to Greece for Summer 2015 remain
ahead of prior year
• Trading impacted end of June/first half of July,
particularly from Germany and Belgium
• 27 hotels in Greece (c25% of hotels owned)
TUI GROUP | Berenberg and Goldman Sachs Fourth German Corporate Conference | 21 - 22 September 2015

30
Turnover Q3 and 9M 2014/15
TUI GROUP | Berenberg and Goldman Sachs Fourth German Corporate Conference | 21 - 22 September 2015
€m Q3 14/15 Q3 13/14 % 9M 14/15 9M 13/14 %
Northern Region 1,866.3 1,660.0 12.4 4,025.1 3,629.6 10.9
Central Region 1,406.4 1,393.4 0.9 3,341.4 3,222.3 3.7
Western Region 772.0 782.8 -1.4 1,687.0 1,711.1 -1.4
Source Markets 4,044.7 3,836.2 5.4 9,053.5 8,563.0 5.7
Hotels & Resorts 135.8 105.0 29.3 381.2 316.6 20.4
Cruises 63.8 63.9 -0.2 200.0 213.1 -6.1
Other Tourism 96.5 95.9 0.6 328.9 319.7 2.9
Tourism 4,340.8 4,101.0 5.8 9,963.6 9,412.4 5.9
Specialist Group 462.8 395.5 17.0 1,355.5 1,166.6 16.2
Hotelbeds Group 259.3 262.0 -1.0 654.7 631.6 3.7
All Other Segments 18.2 18.5 -1.6 47.4 36.8 28.8
TUI Group continuing ops 5,081.1 4,777.0 6.4 12,021.2 11,247.4 6.9

31
Underlying EBITA Q3 and 9M 2014/15
TUI GROUP | Berenberg and Goldman Sachs Fourth German Corporate Conference | 21 - 22 September 2015
€m Q3 14/15 Q3 13/14 % 9M 14/15 9M 13/14 %
Northern Region 107.0 99.1 8.0 -2.6 -25.1 89.6
Central Region -4.2 29.9 n/a -97.9 -46.8 -109.2
Western Region -11.1 2.0 n/a -72.8 -67.8 -7.4
Source Markets 91.7 131.0 -30.0 -173.3 -139.7 24.1
Hotels & Resorts 67.3 41.7 61.4 122.9 74.4 65.2
Cruises 19.3 -1.5 n/a 37.6 -17.7 n/a
Other Tourism -20.6 -21.9 5.9 -40.2 -42.1 4.5
Tourism 157.7 149.3 5.6 -53.0 -125.1 57.6
Specialist Group 24.5 20.5 19.5 5.2 2.9 79.3
Hotelbeds Group 30.6 23.6 29.7 38.4 31.2 23.1
All Other Segments -18.6 -29.7 37.4 -69.0 -86.7 20.4
TUI Group continuing ops 194.2 163.7 18.6 -78.4 -177.7 55.9
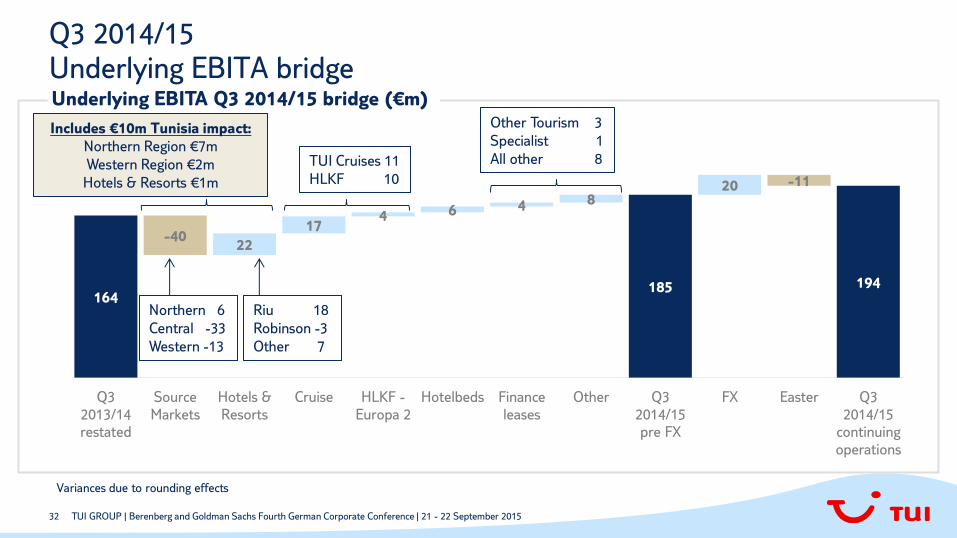
32
164
-40 22
17 4 6 4 8
185
20 -11
194
Q3
2013/14
restated
Source
Markets
Hotels &
Resorts
Cruise HLKF -
Europa 2
Hotelbeds Finance
leases
Other Q3
2014/15
pre FX
FX Easter Q3
2014/15
continuing
operations
Q3 2014/15 Underlying EBITA bridge
TUI GROUP | Berenberg and Goldman Sachs Fourth German Corporate Conference | 21 - 22 September 2015
Includes €10m Tunisia impact:
Northern Region €7m
Western Region €2m
Hotels & Resorts €1m
Variances due to rounding effects
Northern 6
Central -33
Western -13
Riu 18
Robinson -3
Other 7
TUI Cruises 11
HLKF 10
Other Tourism 3
Specialist 1
All other 8
Underlying EBITA Q3 2014/15 bridge (€m)
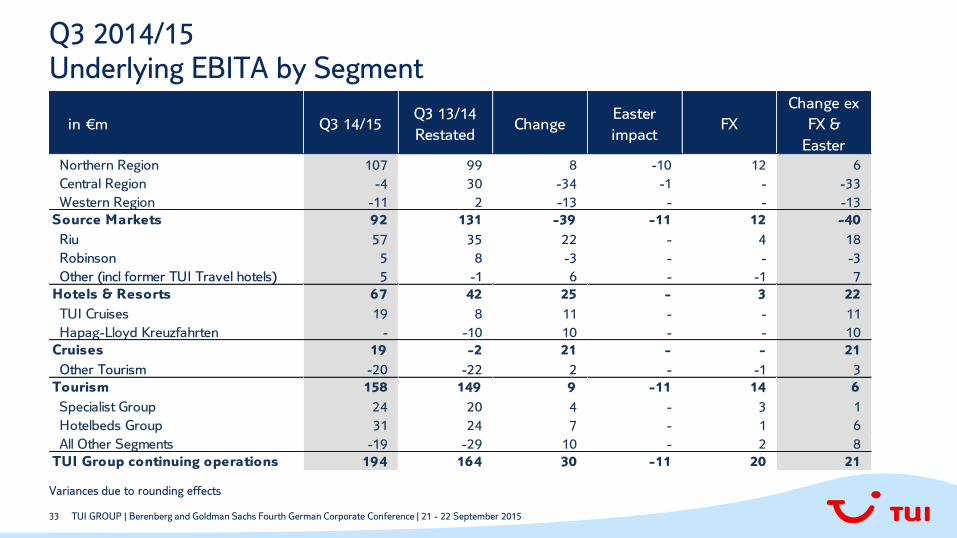
33
Q3 2014/15 Underlying EBITA by Segment
TUI GROUP | Berenberg and Goldman Sachs Fourth German Corporate Conference | 21 - 22 September 2015
in €m Q3 14/15Q3 13/14
RestatedChange
Easter
impactFX
Change ex
FX &
Easter
Northern Region 107 99 8 -10 12 6
Central Region -4 30 -34 -1 - -33
Western Region -11 2 -13 - - -13
Source Markets 92 131 -39 -11 12 -40
Riu 57 35 22 - 4 18
Robinson 5 8 -3 - - -3
Other (incl former TUI Travel hotels) 5 -1 6 - -1 7
Hotels & Resorts 67 42 25 - 3 22
TUI Cruises 19 8 11 - - 11
Hapag-Lloyd Kreuzfahrten - -10 10 - - 10
Cruises 19 -2 21 - - 21
Other Tourism -20 -22 2 - -1 3
Tourism 158 149 9 -11 14 6
Specialist Group 24 20 4 - 3 1
Hotelbeds Group 31 24 7 - 1 6
All Other Segments -19 -29 10 - 2 8
TUI Group continuing operations 194 164 30 -11 20 21
Variances due to rounding
effects
Variances due to rounding effects
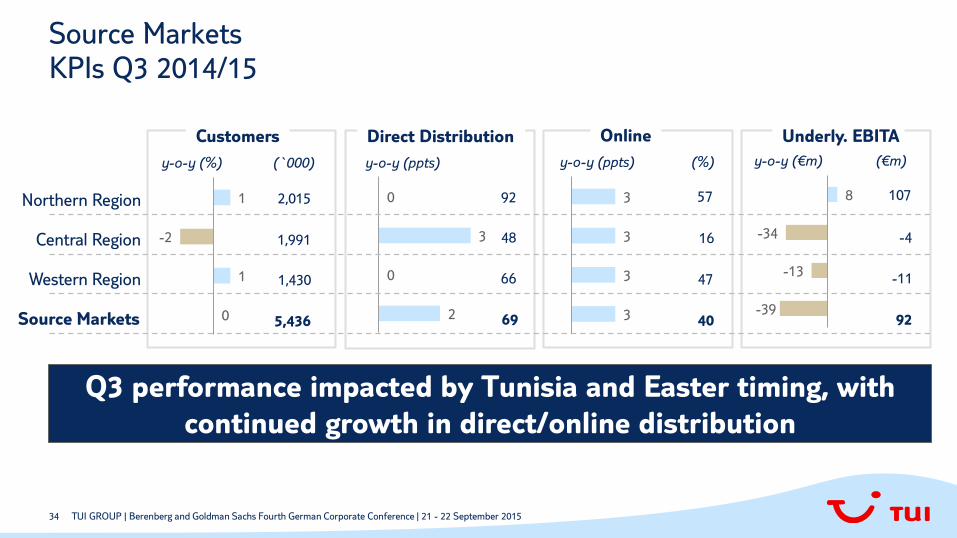
34
0
3
0
2
8
-34
-13
-39
Source Markets KPIs Q3 2014/15
2,015
1,991
1,430
92
48
66
8 1
40
Online
5,436 69
Customers Direct Distribution
y-o-y (%) (`000) y-o-y (ppts) (%) y-o-y (ppts) (%) y-o-y (€m) (€m)
57
16
47
107
-4
Underly. EBITA
Northern Region
Central Region
Western Region
Source Markets
-11
92
Q3 performance impacted by Tunisia and Easter timing, with
continued growth in direct/online distribution
1
-2
1
0
3
3
3
3
TUI GROUP | Berenberg and Goldman Sachs Fourth German Corporate Conference | 21 - 22 September 2015

35
57
Hotels & Resorts KPIs for owned and leased hotels Q3 2014/15
TUI H&R
4,501
826
654
6,435
52.93
84.63
41.40
54.94
8 1
79
Occupancy3 Capacity1 Revenue/bed2
y-o-y (%) (`000) y-o-y (%) (€) y-o-y (ppts) (%)
67
y-o-y (€m) (€m)
82
71
71
5
Underly. EBITA /EAT4
1 Group owned or leased hotel beds multiplied by opening days per quarter 2 Arrangement revenue divided by occupied beds 3 Occupied beds divided by capacity 4 Segment figures
Note: capacity, revenue/bed and occupancy restated to exclude Grecotel
Other (incl former TUI Travel Hotels)
22
-3
6
25
0
4
-3
0
15
3
10
12
-2
0
11
0
Strong performance driven by Riu
5
TUI GROUP | Berenberg and Goldman Sachs Fourth German Corporate Conference | 21 - 22 September 2015
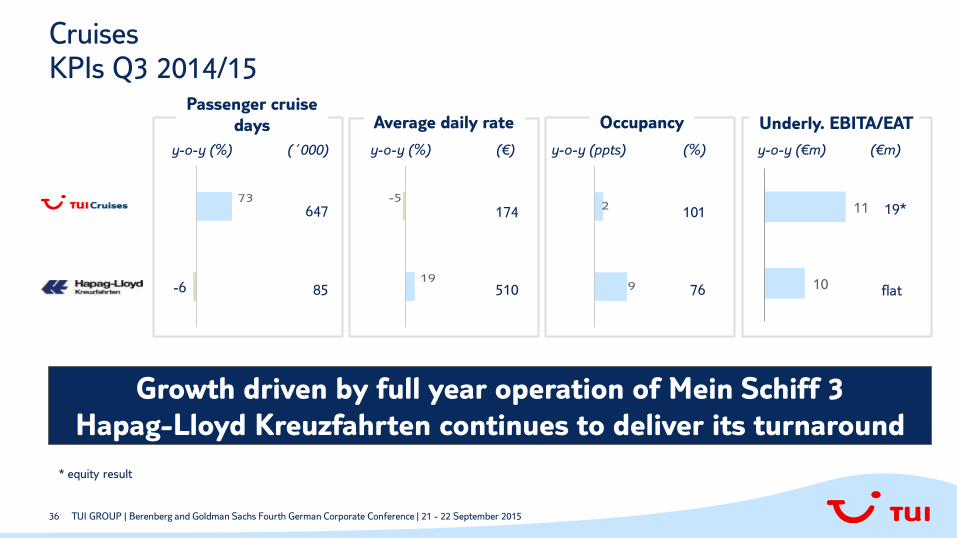
36
19
-511
10
Cruises KPIs Q3 2014/15
73
-6
647
85
101
76
174
510 9
2
y-o-y (%) (´000) y-o-y (%) (€)
Average daily rate Occupancy
y-o-y (ppts) (%) y-o-y (€m) (€m)
19*
flat
Underly. EBITA/EAT
* equity result
Growth driven by full year operation of Mein Schiff 3
Hapag-Lloyd Kreuzfahrten continues to deliver its turnaround
TUI GROUP | Berenberg and Goldman Sachs Fourth German Corporate Conference | 21 - 22 September 2015
Passenger cruise
days

37
9M 2014/15 Income Statement – Key Figures
TUI GROUP | Berenberg and Goldman Sachs Fourth German Corporate Conference | 21 - 22 September 2015
Variances due to rounding
effects
in €m 9M 14/159M 13/14
restated
Turnover 12,021.2 11,247.4
Underlying EBITA -78.4 -177.7
Adjustments -160.7 -64.5
EBITA -239.1 -242.2
Net interest expense -141.9 -182.4
Equity result Hapag-Lloyd 0.9 -46.0
EBT -380.1 -470.6
Income taxes 230.8 122.4
Group result Continued operations -149.3 -348.2
Discontinued operations -20.0 -7.4
Minority interest -3.0 99.4
Group result after minorities -172.3 -256.2
Hybrid dividend -10.9 -17.4
EPS (€) (continuing operations) -0.33 -1.07
Adjustments €160.7m comprise PPA (€57m),
merger-related costs (€35m), other
restructuring costs (€14m), value adjustment for
a VAT receivable (€18m) and provision for a
pending litigation (€14m)
Interest decrease of €40.5m driven by :
• Lower convertible bond interest €74m
• Partly offset by new high yield bond
interest, higher interest in relation to asset-
financing (aircraft and Europa 2)
Tax income is partly attributable to the
seasonality of the tour operator business;
the merger-related reassessment of deferred
tax assets on tax loss carry-forwards led to a
tax credit of €117m
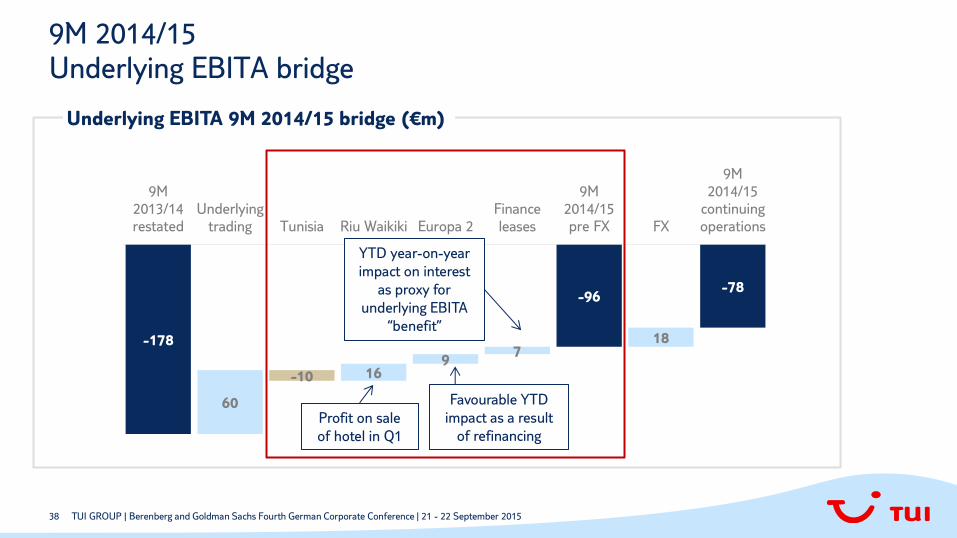
38
-178
60
-10 16 9
7
-96
18
-78
9M
2013/14
restated
Underlying
trading Tunisia Riu Waikiki Europa 2
Finance
leases
9M
2014/15
pre FX FX
9M
2014/15
continuing
operations
Profit on sale
of hotel in Q1
YTD year-on-year
impact on interest
as proxy for
underlying EBITA
“benefit”
9M 2014/15 Underlying EBITA bridge
TUI GROUP | Berenberg and Goldman Sachs Fourth German Corporate Conference | 21 - 22 September 2015
Favourable YTD
impact as a result
of refinancing
Underlying EBITA 9M 2014/15 bridge (€m)
39
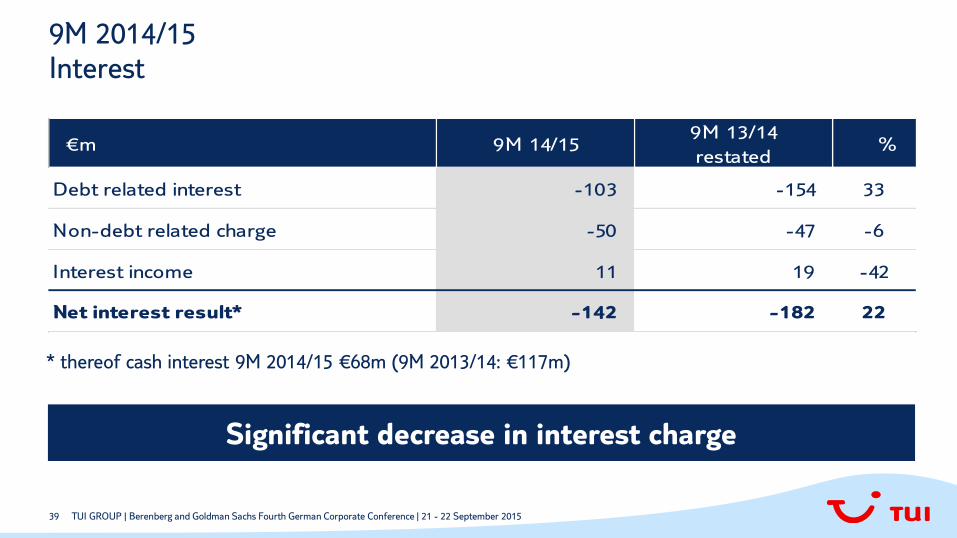
9M 2014/15 Interest
€m 9M 14/159M 13/14
restated%
Debt related interest -103 -154 33
Non-debt related charge -50 -47 -6
Interest income 11 19 -42
Net interest result* -142 -182 22
* thereof cash interest 9M 2014/15 €68m (9M 2013/14: €117m)
Significant decrease in interest charge
TUI GROUP | Berenberg and Goldman Sachs Fourth German Corporate Conference | 21 - 22 September 2015
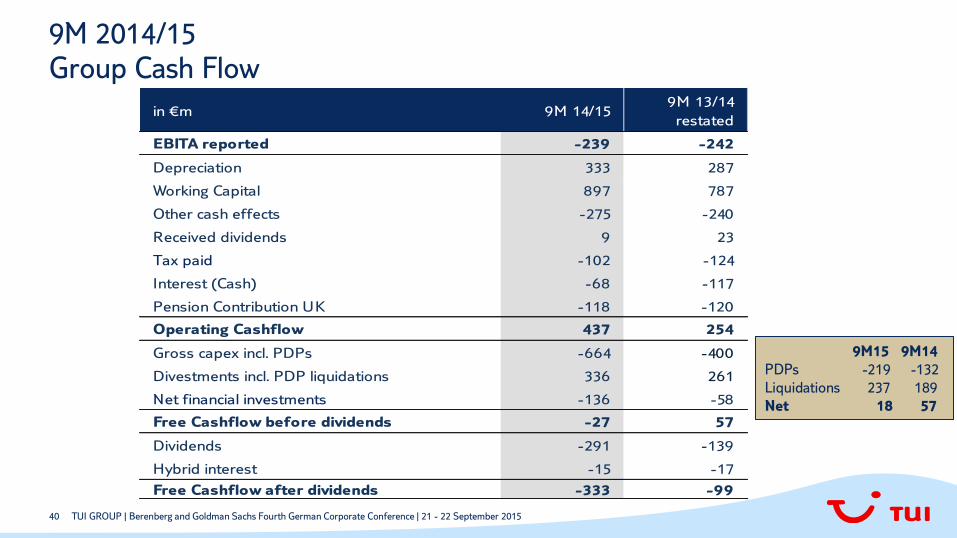
40
in €m 9M 14/159M 13/14
restated
EBITA reported -239 -242
Depreciation 333 287
Working Capital 897 787
Other cash effects -275 -240
Received dividends 9 23
Tax paid -102 -124
Interest (Cash) -68 -117
Pension Contribution UK -118 -120
Operating Cashflow 437 254
Gross capex incl. PDPs -664 -400
Divestments incl. PDP liquidations 336 261
Net financial investments -136 -58
Free Cashflow before dividends -27 57
Dividends -291 -139
Hybrid interest -15 -17
Free Cashflow after dividends -333 -99
9M 2014/15 Group Cash Flow
9M15 9M14
PDPs -219 -132
Liquidations 237 189
Net 18 57
TUI GROUP | Berenberg and Goldman Sachs Fourth German Corporate Conference | 21 - 22 September 2015

41
9M 2014/15 Capex
Capex reflects hotel growth strategy and
profile of aircraft pre delivery payments
Source
Markets /
Other
Tourism
Hotels &
Resorts
Cruises Specialist Hotelbeds
PDPs
Other
9M 14/15 Gross Capex €664m • Increase versus prior year driven by
higher pre-delivery payments for
aircraft, hotel growth, Europa 2
and higher expenditure on IT
projects to deliver digital
transformation
• Full year outlook remains at ~€800m
including pre-delivery payments
TUI GROUP | Berenberg and Goldman Sachs Fourth German Corporate Conference | 21 - 22 September 2015

42
Group balance sheet 30 June 2015 Movement in Net Debt
€m 30 June 201530 Sep 2014
restated
30 June 2014
restated
Opening net cash / (debt) 293 -97 -97
Movement in cash net of debt -333 101 -99
Foreign exchange movement -164 -136 -85
Non cash movement in debt -
Asset backed finance*-689 -167 -167
Non cash movement in debt - Other 586 592 123
Closing net (debt) / cash -307 293 -325
* incl. financing Europa 2 and seven new aircraft which are finance leased or debt-financed
Comment: As at 30 June 2015, cash and cash equivalents worth €194m were subject to disposal restrictions.
TUI GROUP | Berenberg and Goldman Sachs Fourth German Corporate Conference | 21 - 22 September 2015

43
Group balance sheet 30 June 2015 Net financial debt
TUI GROUP | Berenberg and Goldman Sachs Fourth German Corporate Conference | 21 - 22 September 2015
Variances due to rounding
effects
€m 30 June 201530 Sep 2014
restated
30 June 2014
restated
Financial liabilities 1,883 1,965 2,240
o/w non-current 1,672 1,748 1,418
o/w current 211 217 822
Cash 1,576 2,258 1,915
Net (debt)/cash -307 293 -325
• Decrease in financial liabilities since 30 September 2014 driven by conversion of bonds, partly offset by increase in asset-financing (aircraft and Europa 2)
• Increase in net debt since 30 September 2014 driven by typical seasonal cash outflows, primarily within the tour operators
• We expect a broadly net debt neutral position at year-end mainly due to higher capex (growth in hotels, Europa 2), asset-financing, redemption of hybrid and dividend payments made in December and February, partly offset by bond conversions

44
• 86% sold to date for Summer 2015, in line with prior year
• Source Markets bookings and average selling prices up 2% year-on-year
• Capacity remixed from Tunisia to alternative destinations
• Trading for Greece impacted end of June/first half of July, particularly from
Germany and Belgium; bookings have been recovering in recent weeks
• Direct bookings make up 69% of the total, with online bookings at 39%
• Hotels & Resorts performing well with good progress being made on joint
occupancy management
• Cruises – launch of Mein Schiff 4 (June 2015) drives strong bookings;
Hapag-Lloyd Kreuzfahrten continues its turnaround
Current Trading Summer 2015
Robust current trading for Summer 2015
TUI GROUP | Berenberg and Goldman Sachs Fourth German Corporate Conference | 21 - 22 September 2015

45
Trading Update Summer 2015
TUI GROUP | Berenberg and Goldman Sachs Fourth German Corporate Conference | 21 - 22 September 2015
89%
ASP2
6
4
5
4
3
1
2
6
Sales2 Customers2
2
4
2
1
2
6
Flat
Flat
UK
2
3
2
1
-4
5
3
Flat
Germany
Benelux
Total Source Markets
Current trading1
y-o-y variation (%)
Programme
sold
91%
85%
85%
1. These statistics are up to 3 May 2015 and are shown on a constant currency basis 2. These statistics relate to all customers whether risk or non-risk
86%
Northern Region
Nordics
Central Region
Western Region
83%
85%
85%
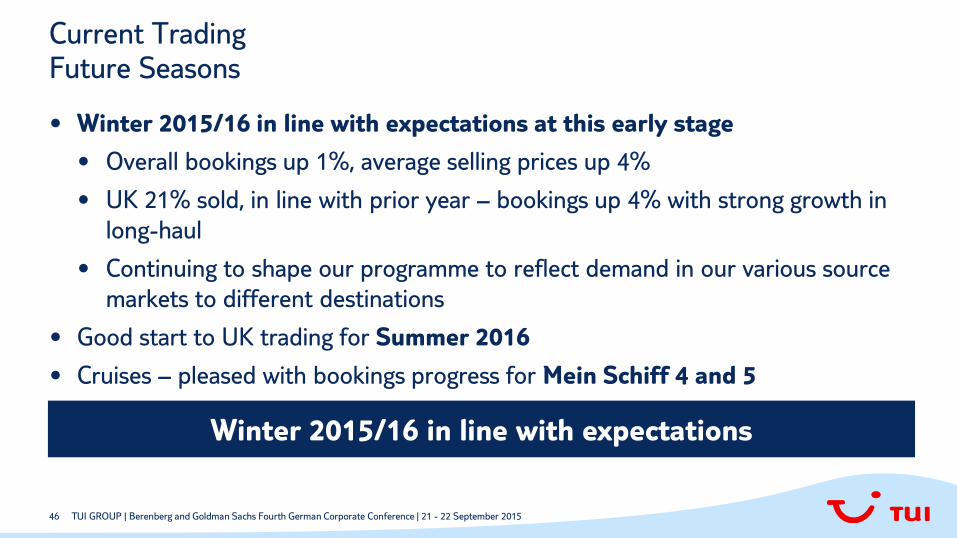
46
• Winter 2015/16 in line with expectations at this early stage
• Overall bookings up 1%, average selling prices up 4%
• UK 21% sold, in line with prior year – bookings up 4% with strong growth in
long-haul
• Continuing to shape our programme to reflect demand in our various source
markets to different destinations
• Good start to UK trading for Summer 2016
• Cruises – pleased with bookings progress for Mein Schiff 4 and 5
Current Trading Future Seasons
Winter 2015/16 in line with expectations
TUI GROUP | Berenberg and Goldman Sachs Fourth German Corporate Conference | 21 - 22 September 2015
47
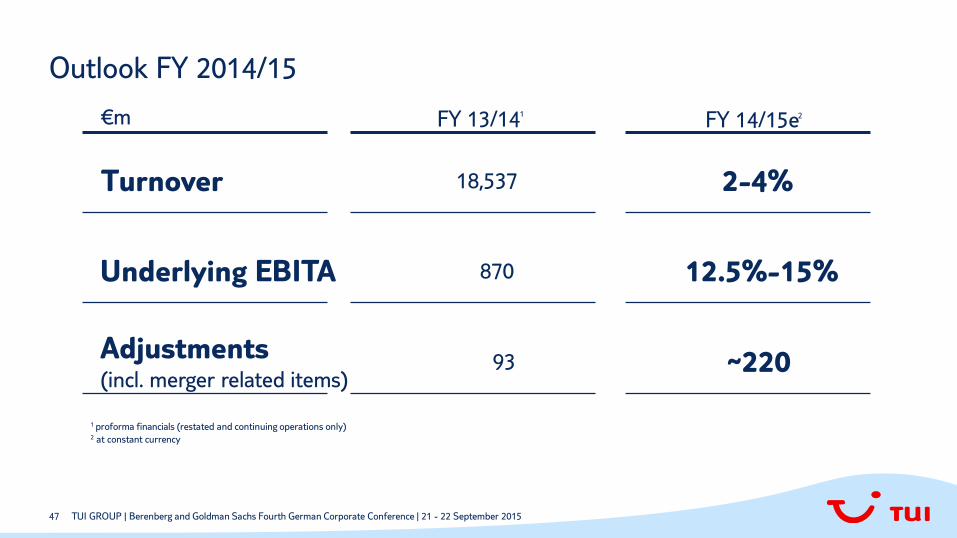
Outlook FY 2014/15
FY 14/15e FY 13/14 €m
2-4% Turnover 18,537
12.5%-15% Underlying EBITA 870
~220 Adjustments (incl. merger related items)
93
2
1 proforma financials (restated and continuing operations only)
2 at constant currency
1
TUI GROUP | Berenberg and Goldman Sachs Fourth German Corporate Conference | 21 - 22 September 2015

48
Interest Guidance
TUI GROUP | Berenberg and Goldman Sachs Fourth German Corporate Conference | 21 - 22 September 2015
• Lower 2015/16e P&L interest
driven by removal of four
convertible bonds, partially offset
by expected increase in asset
financing costs (aircraft, hotels,
cruise ships)
• Hybrid finance charge reduced
to nil from 2015/16 (not included
in interest)
• Long-term financing charge likely
to reflect financing requirements
for aircraft and growth in hotels
€229m ~€200m
~€180m
2015/16e 2014/15e 2013/14
Cash Non-cash
€115m
€114m
Constant currency basis

49
74
21
Separately Disclosed Items Guidance
~€100m
2015/16e 2014/15e
~€220m
2013/14
€95m
long-term
Merger related Non-merger Non-cash PPA
• Strict focus on SDI
management
• Purchase price allocation
stable at ~€75m per annum
• SDI guidance does not
include M&A transactions or
significant new restructuring
projects
Constant currency basis
TUI GROUP | Berenberg and Goldman Sachs Fourth German Corporate Conference | 21 - 22 September 2015
50
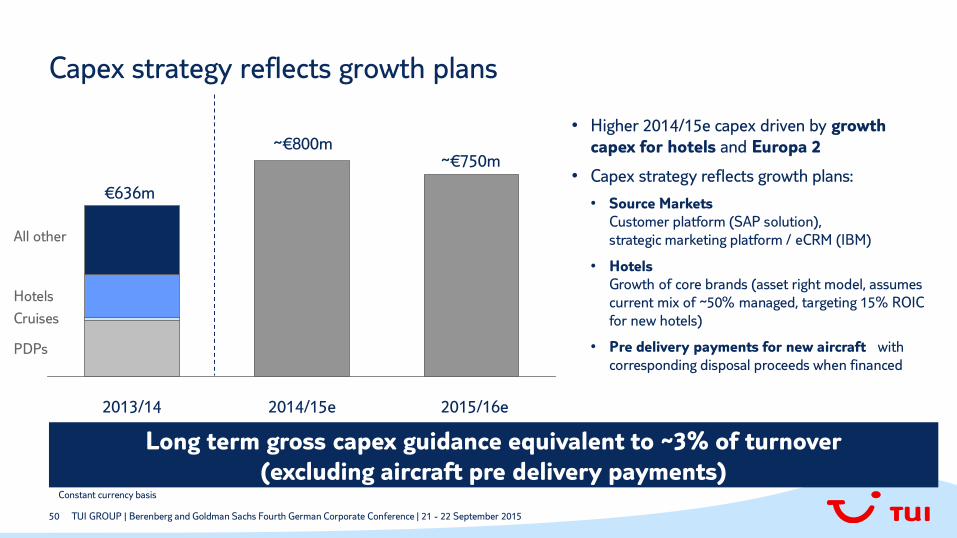
• Higher 2014/15e capex driven by growth
capex for hotels and Europa 2
• Capex strategy reflects growth plans:
• Source Markets
Customer platform (SAP solution),
strategic marketing platform / eCRM (IBM)
• Hotels
Growth of core brands (asset right model, assumes
current mix of ~50% managed, targeting 15% ROIC
for new hotels)
• Pre delivery payments for new aircraft with
corresponding disposal proceeds when financed
Capex strategy reflects growth plans
2014/15e 2013/14
~€800m
€636m
2015/16e
All other
PDPs
Cruises
Hotels
Long term gross capex guidance equivalent to ~3% of turnover
(excluding aircraft pre delivery payments)
~€750m
Constant currency basis
TUI GROUP | Berenberg and Goldman Sachs Fourth German Corporate Conference | 21 - 22 September 2015
51
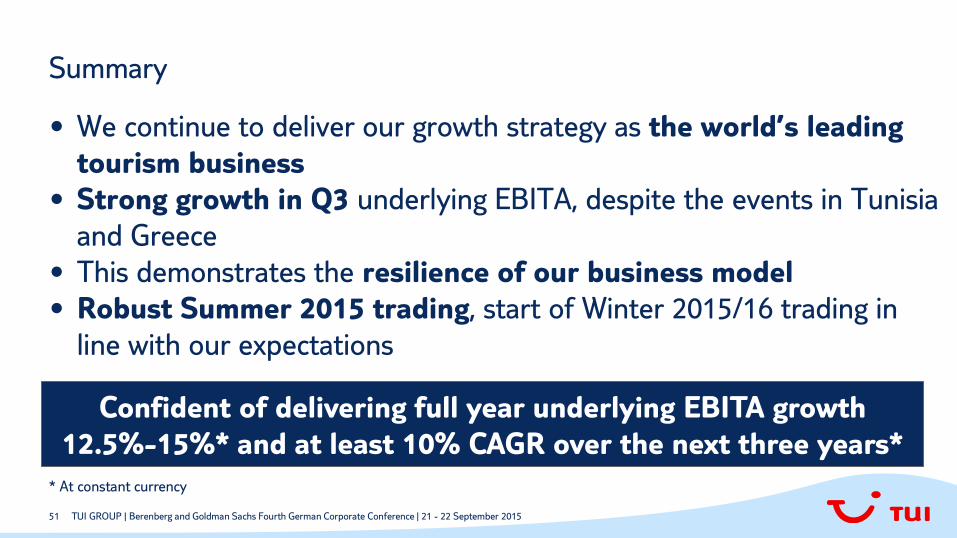
• We continue to deliver our growth strategy as the world’s leading
tourism business
• Strong growth in Q3 underlying EBITA, despite the events in Tunisia
and Greece
• This demonstrates the resilience of our business model
• Robust Summer 2015 trading, start of Winter 2015/16 trading in
line with our expectations
Summary
Confident of delivering full year underlying EBITA growth
12.5%-15%* and at least 10% CAGR over the next three years*
* At constant currency
TUI GROUP | Berenberg and Goldman Sachs Fourth German Corporate Conference | 21 - 22 September 2015

52
Pro Forma Turnover 2012/13 & 2013/14
TUI GROUP | Berenberg and Goldman Sachs Fourth German Corporate Conference | 21 - 22 September 2015
€m FY 12/13 Q1 13/14 Q2 13/14 Q3 13/14 Q4 13/14 FY 13/14
Northern Region 6,037.2 1,047.6 922.0 1,660.0 2,571.2 6,200.8
Central Region 5,524.8 1,022.7 806.2 1,393.4 2,203.7 5,426.0
Western Region 3,019.4 494.2 434.1 782.8 1,259.1 2,970.2
Source Markets 14,581.4 2,564.5 2,162.3 3,836.2 6,034.0 14,597.0
Hotels & Resorts 462.3 101.2 110.4 105.0 199.4 516.0
Cruises 261.0 55.2 94.0 63.9 67.9 281.0
Other Tourism 440.6 110.2 116.6 102.8 148.8 478.4
Tourism 15,745.3 2,831.1 2,483.3 4,107.9 6,450.1 15,872.4
Specialist Group 1,698.1 331.0 437.1 388.6 468.8 1,625.5
Hotelbeds Group 815.0 186.8 182.8 261.9 368.1 999.6
All Other Segments 38.4 -5.4 23.7 18.6 2.4 39.3
TUI Group continuing operations 18,296.8 3,343.5 3,126.9 4,777.0 7,289.4 18,536.8
Note: The numbers are restated to reflect the new segment structure and the LateRooms Group has been classified as a discontinued operation
53
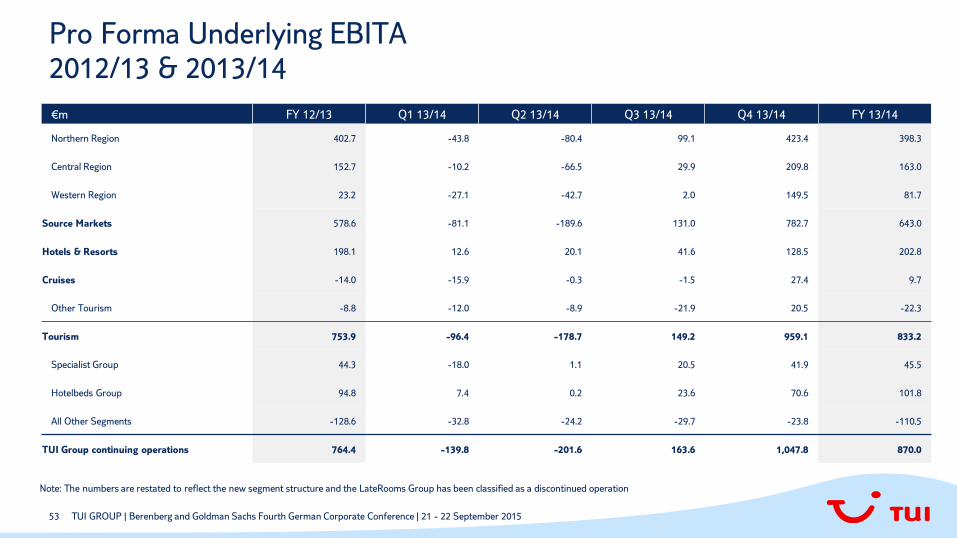
Pro Forma Underlying EBITA 2012/13 & 2013/14
TUI GROUP | Berenberg and Goldman Sachs Fourth German Corporate Conference | 21 - 22 September 2015
€m FY 12/13 Q1 13/14 Q2 13/14 Q3 13/14 Q4 13/14 FY 13/14
Northern Region 402.7 -43.8 -80.4 99.1 423.4 398.3
Central Region 152.7 -10.2 -66.5 29.9 209.8 163.0
Western Region 23.2 -27.1 -42.7 2.0 149.5 81.7
Source Markets 578.6 -81.1 -189.6 131.0 782.7 643.0
Hotels & Resorts 198.1 12.6 20.1 41.6 128.5 202.8
Cruises -14.0 -15.9 -0.3 -1.5 27.4 9.7
Other Tourism -8.8 -12.0 -8.9 -21.9 20.5 -22.3
Tourism 753.9 -96.4 -178.7 149.2 959.1 833.2
Specialist Group 44.3 -18.0 1.1 20.5 41.9 45.5
Hotelbeds Group 94.8 7.4 0.2 23.6 70.6 101.8
All Other Segments -128.6 -32.8 -24.2 -29.7 -23.8 -110.5
TUI Group continuing operations 764.4 -139.8 -201.6 163.6 1,047.8 870.0
Note: The numbers are restated to reflect the new segment structure and the LateRooms Group has been classified as a discontinued operation
54
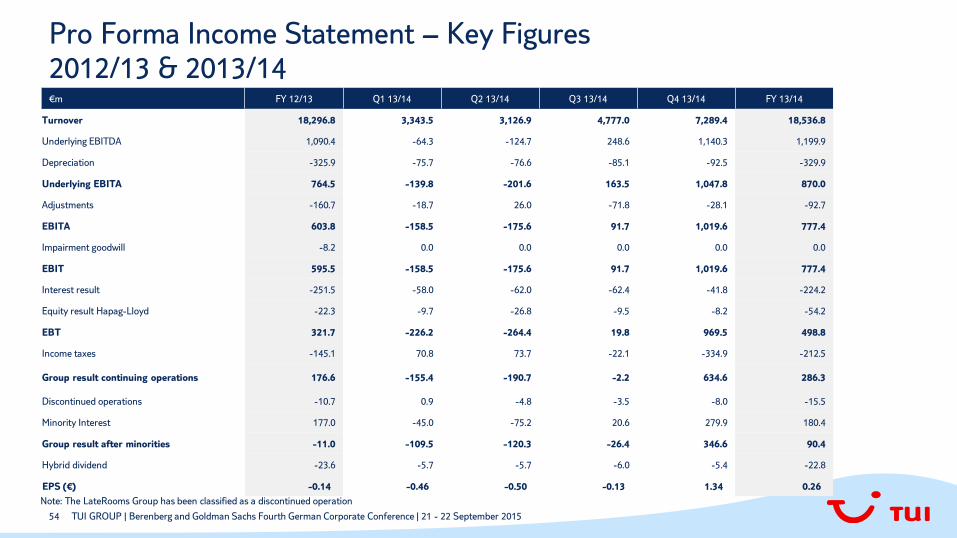
Pro Forma Income Statement – Key Figures 2012/13 & 2013/14
TUI GROUP | Berenberg and Goldman Sachs Fourth German Corporate Conference | 21 - 22 September 2015
€m FY 12/13 Q1 13/14 Q2 13/14 Q3 13/14 Q4 13/14 FY 13/14
Turnover 18,296.8 3,343.5 3,126.9 4,777.0 7,289.4 18,536.8
Underlying EBITDA 1,090.4 -64.3 -124.7 248.6 1,140.3 1,199.9
Depreciation -325.9 -75.7 -76.6 -85.1 -92.5 -329.9
Underlying EBITA 764.5 -139.8 -201.6 163.5 1,047.8 870.0
Adjustments -160.7 -18.7 26.0 -71.8 -28.1 -92.7
EBITA 603.8 -158.5 -175.6 91.7 1,019.6 777.4
Impairment goodwill -8.2 0.0 0.0 0.0 0.0 0.0
EBIT 595.5 -158.5 -175.6 91.7 1,019.6 777.4
Interest result -251.5 -58.0 -62.0 -62.4 -41.8 -224.2
Equity result Hapag-Lloyd -22.3 -9.7 -26.8 -9.5 -8.2 -54.2
EBT 321.7 -226.2 -264.4 19.8 969.5 498.8
Income taxes -145.1 70.8 73.7 -22.1 -334.9 -212.5
Group result continuing operations 176.6 -155.4 -190.7 -2.2 634.6 286.3
Discontinued operations -10.7 0.9 -4.8 -3.5 -8.0 -15.5
Minority Interest 177.0 -45.0 -75.2 20.6 279.9 180.4
Group result after minorities -11.0 -109.5 -120.3 -26.4 346.6 90.4
Hybrid dividend -23.6 -5.7 -5.7 -6.0 -5.4 -22.8
EPS (€) -0.14 -0.46 -0.50 -0.13 1.34 0.26
Note: The LateRooms Group has been classified as a discontinued operation

55
TUI Group Bond financing & maturity profile 30 June 2015
TUI GROUP | Berenberg and Goldman Sachs Fourth German Corporate Conference | 21 - 22 September 2015
Instrument Issue Maturity Volume €mInterest %
p.a.
Revolving Credit Facility Sep 14 June 18 1,750
High Yield Bond Sep 14 Oct 19 300 4.5
c2% margin
on average
above LIBOR
Debt Finance
56
Financial Calendar
TUI GROUP | Berenberg and Goldman Sachs Fourth German Corporate Conference | 21 - 22 September 2015
10 December 2015 Annual Report for financial Year 2014/15
30 September 2015 Pre-close trading update
9 February 2016 Annual General Meeting