BERENBERG & GOLDMAN SACHS GCC SEPTEMBER 2017
40
BERENBERG & GOLDMAN SACHS GCC SEPTEMBER 2017
Transcript of BERENBERG & GOLDMAN SACHS GCC SEPTEMBER 2017
BERENBERG & GOLDMAN SACHS GCC
SEPTEMBER 2017

AGENDA
2 Berenberg & Goldman Sachs GCC | September 2017
BUSINESS MODEL
STRATEGY
VALUE-BASED FIGURES
KEY FINANCIALS FIRST HALF 2017
OUTLOOK 2017

TAKKT IS A PORTFOLIO OF B2B DIRECT MARKETING SPECIALISTS
3 Berenberg & Goldman Sachs GCC | September 2017

TAKKT ORGANIZED INTO SIX DIVISIONS
4 Berenberg & Goldman Sachs GCC | September 2017
BEG: Business Equipment Group; PSG: Packaging Solutions Group; MEG: Merchandising Equipment Group
REG: Restaurant Equipment Group; DPG: Displays Group; OEG: Office Equipment Group

5 Berenberg & Goldman Sachs GCC | September 2017
OUR DIVISIONS ARE PRODUCT SPECIALISTS AND SELL EQUIPMENT AND
SPECIALTIES WITH AN AVERAGE ORDER VALUE OF 470 EURO

OUR ROLE IN THE MARKET – VALUE-ADD SERVICES FOR CUSTOMERS
AND SUPPLIERS BEYOND PURE DISTRIBUTION
6 Berenberg & Goldman Sachs GCC | September 2017

7 Berenberg & Goldman Sachs GCC | September 2017
OUR MULTI-CHANNEL STRATEGY OFFERS MULTIPLE TOUCH POINTS FOR
OUR CUSTOMERS ACCORDING TO INDIVIDUAL PREFERENCES
Mid-sized
corporates
Small
businesses
Large
Corporates
CUSTOMER CHARACTERISTICS
• Frequent and regular demand
• Focus on efficiency of procurement
process and services
• Customer lifetime value (loyal)
• Less frequent, irregular demand
• Focus on price
• Transaction-oriented and less loyal
CHANNELS
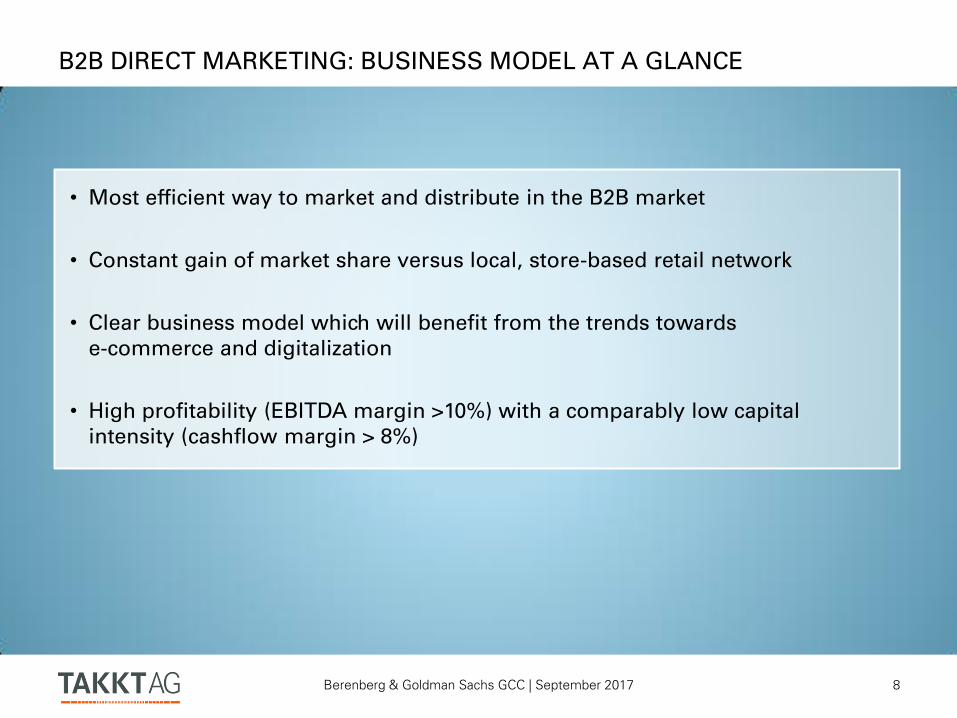
B2B DIRECT MARKETING: BUSINESS MODEL AT A GLANCE
8 Berenberg & Goldman Sachs GCC | September 2017
• Most efficient way to market and distribute in the B2B market
• Constant gain of market share versus local, store-based retail network
• Clear business model which will benefit from the trends towards
e-commerce and digitalization
• High profitability (EBITDA margin >10%) with a comparably low capital
intensity (cashflow margin > 8%)

AGENDA
9 Berenberg & Goldman Sachs GCC | September 2017
BUSINESS MODEL
STRATEGY
VALUE-BASED FIGURES
KEY FINANCIALS FIRST HALF 2017
OUTLOOK 2017

STRONG BUSINESS MODEL WITH CLEARLY DEFINED TARGETS
10 Berenberg & Goldman Sachs GCC | September 2017
Organic growth of 4 to 5% p.a.
on average
• Efficiency of direct marketing
• Implementation of multi-channel PLUS
• Shaping the digital transformation
Growth of 5% p.a. on average
via acquisitions
• Well-established B2B market leaders in attractive market niches
• Access to new products, markets, customers and business models
Diversify risk
• Significant contributions to sales on at
least two continents
• Diversified share of sales across
customer groups
• Balanced product range
Act sustainably
• Industry role model for sustainability
• Sustainability as “built-in” rather than an “add-on”
EBITDA margin within corridor of 12-15%

ORGANIC GROWTH ABOVE GDP ALSO DUE TO EFFICIENCY OF DIRECT
MARKETING MODEL
11 Berenberg & Goldman Sachs GCC | September 2017
higher average
order value
lower average
order value
consolidated
supplier
base
fragmented
supplier
base
Store-based
business:
~ 70-90%
Direct
marketing:
~10-30%
Total market volume of EUR 100bn+
with growth potential in line with GDP
Direct marketing is steadily gaining market share vs store-based business
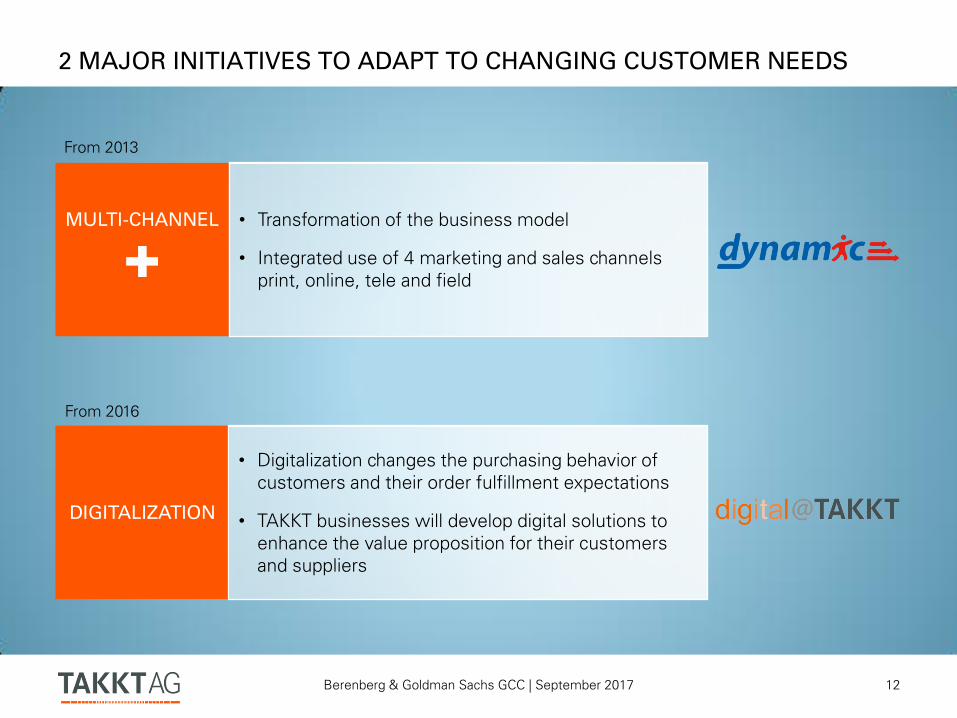
2 MAJOR INITIATIVES TO ADAPT TO CHANGING CUSTOMER NEEDS
12 Berenberg & Goldman Sachs GCC | September 2017
MULTI-CHANNEL
DIGITALIZATION
• Transformation of the business model
• Integrated use of 4 marketing and sales channels
print, online, tele and field
• Digitalization changes the purchasing behavior of
customers and their order fulfillment expectations
• TAKKT businesses will develop digital solutions to
enhance the value proposition for their customers
and suppliers
From 2013
From 2016

CONTINUED PUSH TO INCREASE PRIVATE LABEL AND DIRECT IMPORTS
13 Berenberg & Goldman Sachs GCC | September 2017
13.9% 14.7% 15.9%
18.3% 19.4%
2013 2014 2015 2016 H1/2017
Share of private labels in order intake in %
9.6% 10.0%
12.1% 13.7%
14.9%
2013 2014 2015 2016 H1/2017
Share of direct imports in purchase volume in %

E-COMMERCE WITH VERY GOOD GROWTH
14 Berenberg & Goldman Sachs GCC | September 2017
multi-channel
20.5%
H1/2017
9.2%
e-procurement
web-focused
16.0%
Split between e-commerce channels
28.0% 30.1%
36.5% 39.0%
45.7%
2013 2014 2015 2016 H1/2017
Share of e-commerce in order intake in %

DIGITALIZATION: OUR VISION 2020
15 Berenberg & Goldman Sachs GCC | September 2017
We want to double our
e-commerce business
until 2020 by creating an
outstanding customer
experience through
digitalization.
We strive to transform our
organization in a step
change by putting digital
first and focusing on
customer centricity.
We will invest up to
EUR 50 million
until 2020 in our people
and new technologies.
The implementation of
our Digital Agenda will
increase our midterm
organic sales growth.

OUR 6 FOCUS AREAS OF THE DIGITAL AGENDA
16 Berenberg & Goldman Sachs GCC | September 2017
Strategy & Innovation
We strictly align our business
model with the digital age
and take a critical look at the
status quo.
Data and Analytics
The internet of things and new
technological analysis open up
additional growth opportunities.
Customer Decision Journey
We would like to learn more
about and understand our
customers’ needs and decision
making processes better.
Process Automation
Our processes will become
faster and more efficient,
manual activities will be further
automated.
Organization, Management
and Corporate Culture
We adapt our organization and
procedures in line with our
goals to ensure successful
implementation of our strategy.
Technology
We continue to focus on
modernizing our existing IT
systems and introducing new
ones along the entire value
chain.

WE WILL INVEST UP TO EUR 50 MILLION UNTIL 2020 FOR THE
IMPLEMENTATION OF OUR DIGITAL AGENDA
17 Berenberg & Goldman Sachs GCC | September 2017
opex
capex
10 m 5 m 5 m 5 m
10 m 5 m 5 m 5 m
2017 2018 2019 2020
We will recruit up to 100 additional talents personnel

DIGITAL AGENDA: EXAMPLE TAKKT INVESTMENT COMPANY
18 Berenberg & Goldman Sachs GCC | September 2017
TAKKT investment company (TBG)
Aim
Getting access to innovative and digital business
models, new product ideas and visionary
founders.
Targets
TAKKT is interested in young businesses with a
focus on B2B direct marketing or innovative
solutions with a high relevance for TAKKT’s
businesses.
Entry point
Focus on financing younger companies, who
already have a product/service offering on the
market and are looking for partners to help fund
additional growth.
TAKKT as a „smart investor“
Apart from helping to fund growth, TAKKT is also
offering know-how and international expertise.
First investments
Digital printing of professional transport
packaging with individually customized design in
smaller batches.
Allows online shops to print personalized product
brochures, that are put into customers’ parcels.
Innovative marketplace which bundles the
product range of hundreds of. Customers get
access to attractively priced products and an
advanced price comparison engine.
Anti-fraud fingerprint for products. The holo-
graphic fingerprint is applied to the product via a
label and can be read with the help of a
smartphone

DIGITAL AGENDA:
EXAMPLE IMPLEMENTATION OF PRÜFPLANER
19 Berenberg & Goldman Sachs GCC | September 2017
Prüfplaner helps customers to maintain an
overview of the legal requirements
regarding inspections
Sends timely reminder of inspections
which are due
Enables documentation and collaboration
within the team
Is cloud-based and immediately ready for
use without installation
Development of idea
Consistent focus on customers’ needs.
More than 80 customer interviews conducted.
Issue of “statutory inspections” specified.
Findings
Unclear inspection obligations, largely analog
processing resulting in a high level of input.
Large number of external providers; however, no
innovative and focused solution on the market.
Implementation
Concentration on main functionalities
Agile development based on latest technology
Design-driven approach

DIGITAL AGENDA: EXAMPLE INNOVATIVE WORK ENVIRONMENTS
20 Berenberg & Goldman Sachs GCC | September 2017
Aim
• Creating innovative work environments to new ways of working and
further develop our corporate culture to such a degree that it supports
the digital transformation
• Improve cross-functional collaboration
• Offer modern communication areas to employees as an alternative to
more traditional conference rooms
• Improve staff satisfaction
Creating state-of-the-art work environments to further develop our
corporate culture and promote broader collaboration and knowledge sharing
Implementation
• Already realized at NBF within new location in Milwaukee, WI, USA
• GPA is currently moving to a new location in Fall River, MA, USA
• In planning stage for TAKKT and KAISER+KRAFT in Stuttgart, as well as
for ratioform in Munich; construction and refurbishing in 2017/2018

DIGITAL AGENDA: DIGITAL ENTREPRENEURSHIP PROGRAM
21 Berenberg & Goldman Sachs GCC | September 2017
Participants from Europe and the US getting 18 months of top training
• Getting to know key functions of the company
• Working in various digital departments at TAKKT companies
in Germany, the US and other countries
• Assignments at Haniel‘s digital workbench Schacht One
• Stints at a start-up in the TAKKT portfolio
• 1 week visit in the Silicon Valley
• Using agile methodology such as scrum or design thinking
• Participation in sales-related measures
• Regular meetings with the Management Board
With the international trainee program „Digital Entrepreneurship“
TAKKT wants to recruit and train talent at an early stage
Preparation for an executive or key position for the digital transformation of TAKKT Group

DIGITAL AGENDA IS THE NEXT STRATEGIC MOVE TO INCREASE OUR
MIDTERM ORGANIC GROWTH
22 Berenberg & Goldman Sachs GCC | September 2017
• DYNAMIC modernization and growth initiative
successfully implemented.
• Vision 2020 formulated with the goal to transform
our organization in a step change by putting digital
first and focusing on customer centricity.
• Investment commitment of EUR 50 million until
2020, including the recruitment of up to 100 talents.
• In total, more than 100 measures across our six
divisions have been identified.
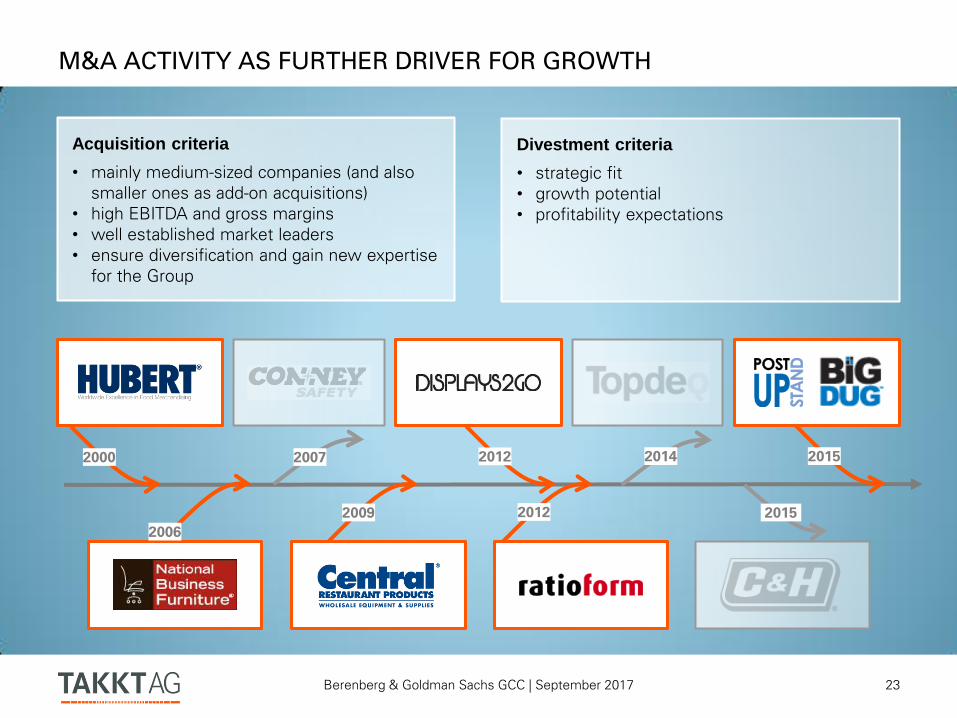
M&A ACTIVITY AS FURTHER DRIVER FOR GROWTH
23 Berenberg & Goldman Sachs GCC | September 2017
2000 2007 2012 2014 2015
2006
2009 2012 2015
Acquisition criteria
• mainly medium-sized companies (and also
smaller ones as add-on acquisitions)
• high EBITDA and gross margins
• well established market leaders
• ensure diversification and gain new expertise
for the Group
Divestment criteria
• strategic fit
• growth potential
• profitability expectations

DIVERSIFICATION OF REGIONS, CUSTOMER GROUPS & PRODUCT
RANGES
24 Berenberg & Goldman Sachs GCC | September 2017
USA
48.4 %
2016
22.1%
Germany
Europe without
Germany
28.5%
Regions
1.0 % Others
Balanced contributions to sales
from two continents
Manufacturing
28.1%
2016
14.6 %
Non-profit
and Public
Organizations
Trade
13.0 %
Customer groups
16.7 % Others
Low dependency from single
customer groups
27.6 %
Services
Product ranges
Broad product portfolio –
multi-purpose use
Office
Plant and
Environment
18.2%
22.5 %
14.4 % 1.7 %
Sales Promotion
Others
17.9%
Storage and
Transport
16.7 %
Food and Dining
2016
8.6 %
Packaging
and Shipping
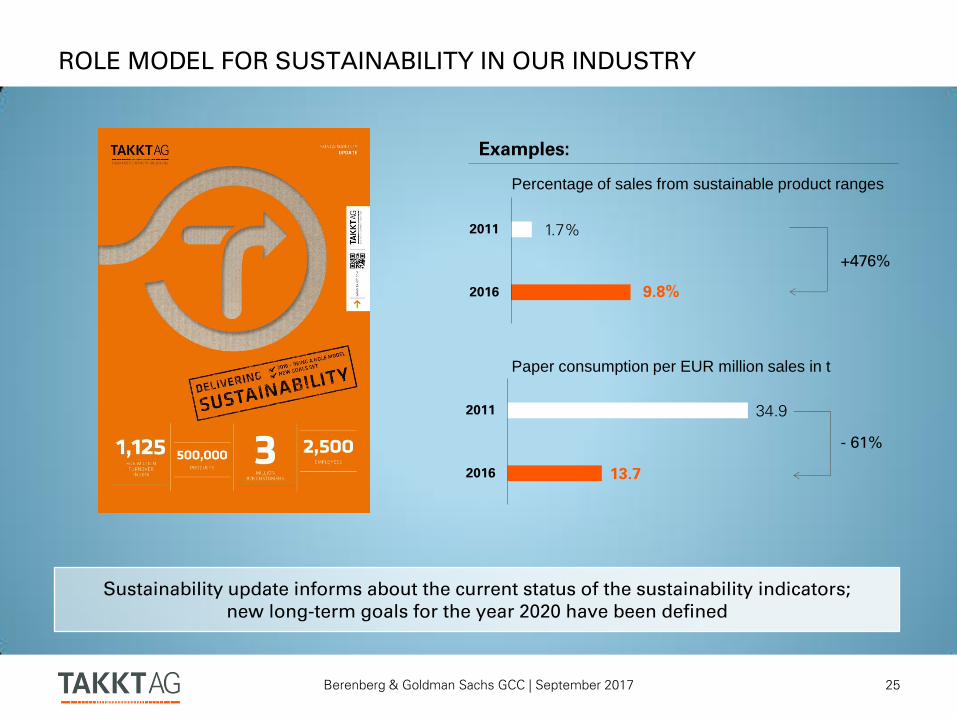
ROLE MODEL FOR SUSTAINABILITY IN OUR INDUSTRY
25 Berenberg & Goldman Sachs GCC | September 2017
9.8%
1.7%
2016
2011
+476%
Percentage of sales from sustainable product ranges
13.7
34.9
2016
2011
- 61%
Paper consumption per EUR million sales in t
Examples:
Sustainability update informs about the current status of the sustainability indicators;
new long-term goals for the year 2020 have been defined

AGENDA
26 Berenberg & Goldman Sachs GCC | September 2017
BUSINESS MODEL
STRATEGY
VALUE-BASED FIGURES
KEY FINANCIALS FIRST HALF 2017
OUTLOOK 2017
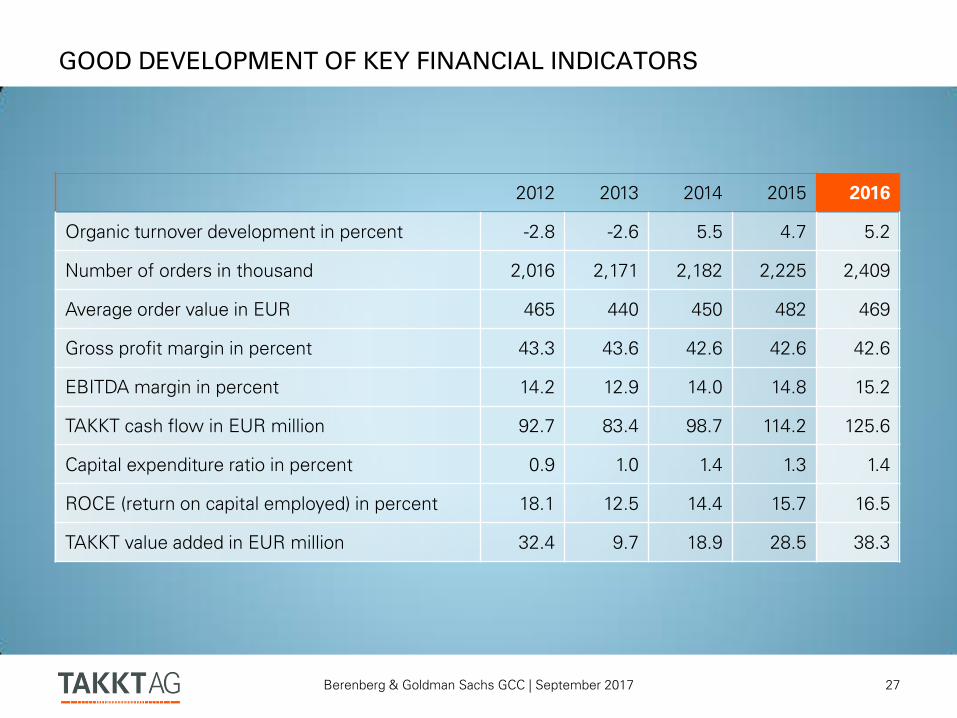
GOOD DEVELOPMENT OF KEY FINANCIAL INDICATORS
27 Berenberg & Goldman Sachs GCC | September 2017
2012 2013 2014 2015 2016
Organic turnover development in percent -2.8 -2.6 5.5 4.7 5.2
Number of orders in thousand 2,016 2,171 2,182 2,225 2,409
Average order value in EUR 465 440 450 482 469
Gross profit margin in percent 43.3 43.6 42.6 42.6 42.6
EBITDA margin in percent 14.2 12.9 14.0 14.8 15.2
TAKKT cash flow in EUR million 92.7 83.4 98.7 114.2 125.6
Capital expenditure ratio in percent 0.9 1.0 1.4 1.3 1.4
ROCE (return on capital employed) in percent 18.1 12.5 14.4 15.7 16.5
TAKKT value added in EUR million 32.4 9.7 18.9 28.5 38.3

IMPROVED VALUE-BASED KPIS
28 Berenberg & Goldman Sachs GCC | September 2017
18.1%
12.5%
14.4% 15.7%
16.5%
2012 2013 2014 2015 2016
Return on capital employed in %
2012 2013 2014 2015 2016
TAKKT value added in EUR million
38.3*
18.0*
26.5*
36.9*
46.8*
32.4
9.7
18.9
28.5
38.3
* Adjusted for amortization of intangible assets resulting from
acquisitions and the related tax effect.

TAKKT DIVIDEND POLICY
29 Berenberg & Goldman Sachs GCC | September 2017
0.32 0.32 0.32
0.50 0.55
2012 2013 2014 2015 2016
Dividend per share in EUR
• Payout ratio with a corridor of between 35 and 45 percent of the profit for the period
• TAKKT aims for a consistent and reliable dividend stream
• Dividend for the 2016 financial year increased by 10% to EUR 0.55 per share which
corresponds to a payout ratio of 40 percent

AGENDA
30 Berenberg & Goldman Sachs GCC | September 2017
BUSINESS MODEL
STRATEGY
VALUE-BASED FIGURES
KEY FINANCIALS FIRST HALF 2017
OUTLOOK 2017

SALES GROWTH IN THE FIRST HALF OF THE YEAR IMPACTED BY A
SLOW-DOWN AT US ACTIVITIES
31 Berenberg & Goldman Sachs GCC | September 2017
95.3
82.0
17.2%
14.5%
H1/16 H1/17
554.2 565.0
H1/16 H1/17
Sales in EUR million EBITDA in EUR million and margin in %
+2.0% growth
+0.9% organic growth
Adjusted for earn-out adjustments in H1/16,
the EBITDA margin was at 14.5% (15.8%)

PERFORMANCE IN EUROPE IN LINE WITH EXPECTATIONS
32 Berenberg & Goldman Sachs GCC | September 2017
62.1
55.3 21.7%
19.1%
H1/16 H1/17
285.7 289.6
H1/16 H1/17
Sales in EUR million EBITDA in EUR million and margin in %
+1.4% growth
+2.0% organic growth
Adjusted for earn-out adjustments in H1/16,
the EBITDA margin was at 19.1% (20.1%)
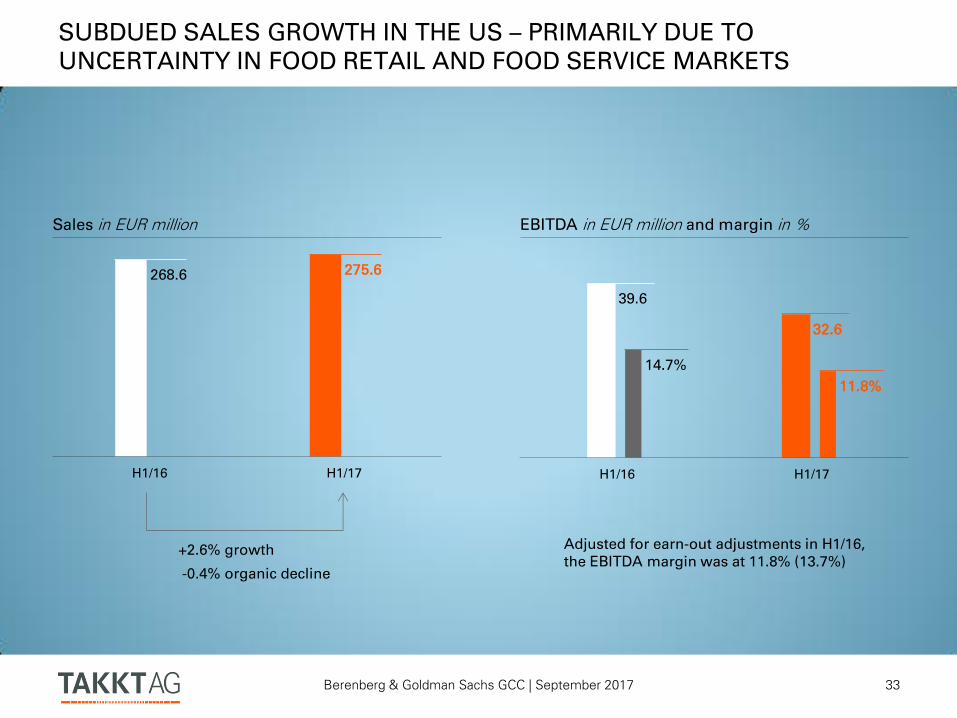
SUBDUED SALES GROWTH IN THE US – PRIMARILY DUE TO
UNCERTAINTY IN FOOD RETAIL AND FOOD SERVICE MARKETS
33 Berenberg & Goldman Sachs GCC | September 2017
39.6
32.6
14.7%
11.8%
H1/16 H1/17
268.6 275.6
H1/16 H1/17
Sales in EUR million EBITDA in EUR million and margin in %
+2.6% growth
-0.4% organic decline
Adjusted for earn-out adjustments in H1/16,
the EBITDA margin was at 11.8% (13.7%)
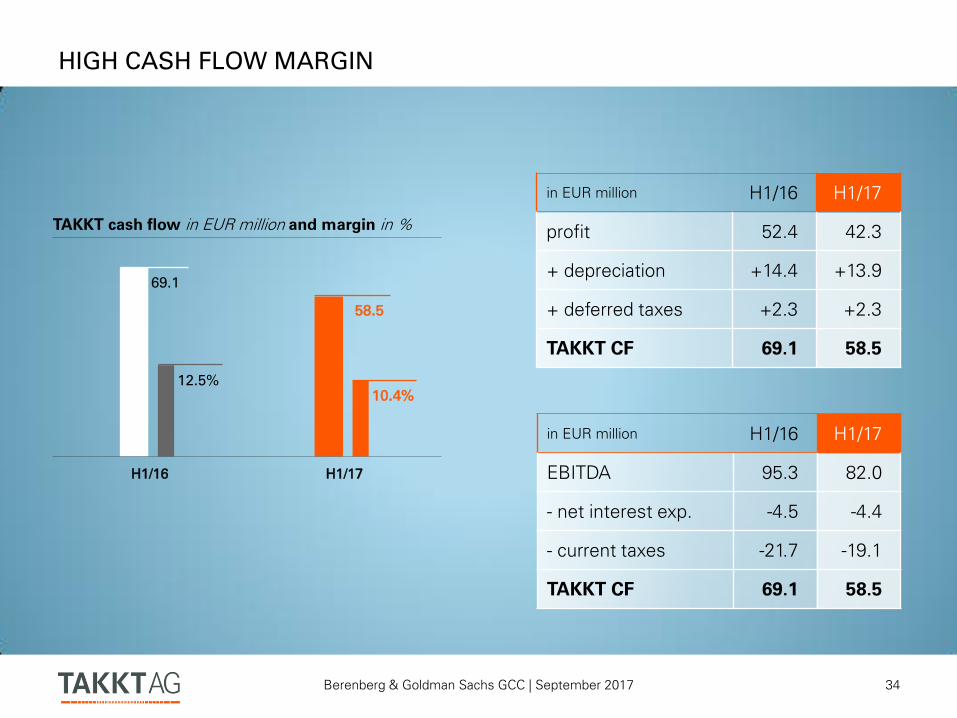
HIGH CASH FLOW MARGIN
34 Berenberg & Goldman Sachs GCC | September 2017
69.1
58.5
12.5% 10.4%
H1/16 H1/17
TAKKT cash flow in EUR million and margin in %
in EUR million H1/16 H1/17
profit 52.4 42.3
+ depreciation +14.4 +13.9
+ deferred taxes +2.3 +2.3
TAKKT CF 69.1 58.5
in EUR million H1/16 H1/17
EBITDA 95.3 82.0
- net interest exp. -4.5 -4.4
- current taxes -21.7 -19.1
TAKKT CF 69.1 58.5

STRONG CASH FLOW GENERATION
35 Berenberg & Goldman Sachs GCC | September 2017
in EUR million H1/16 H1/17
TAKKT cash flow 69.1 58.5
Change of net working capital as well as other adjustments -2.4 +5.0
Cash flow from operating activities 66.7 63.5
Capital expenditure on non-current assets -7.5 -13.3
Proceeds from disposal of non-current assets +0.2 +0.1
Proceeds from the disposal of consolidated companies +1.5 +0.0
Free TAKKT cash flow
(for acquisitions, payout to shareholders and loan repayments) 60.9 50.3

AGENDA
36 Berenberg & Goldman Sachs GCC | September 2017
BUSINESS MODEL
STRATEGY
VALUE-BASED FIGURES
KEY FINANCIALS FIRST HALF 2017
OUTLOOK 2017

ORGANIC GROWTH OVERVIEW
37 Berenberg & Goldman Sachs GCC | September 2017
Organic growth Q1/16 Q2/16 Q3/16 Q4/16 2016 Q1/17 Q2/17
TAKKT Group +5.7% +9.9% +2.8% +3.0% +5.2% +4.1% -2.3%
TAKKT EUROPE +1.6% +10.9% -0.9% +2.9% +3.5% +6.6% -2.5%
TAKKT AMERICA +10.8% +8.9% +6.0% +3.1% +7.0% +1.5% -2.2%

OUTLOOK FOR 2017
38 Berenberg & Goldman Sachs GCC | September 2017
• Stable gross profit margin at TAKKT AMERICA; slight decrease at TAKKT EUROPE.
• In the expected business environment, due to implementation of digital agenda,
the EBITDA margin should be in the middle range of the target corridor of 12 -15%.
• If the business environment is worse than expected, an EBITDA margin of the
Group in the lower half of the target corridor cannot be ruled out. In the event that
business performance surpasses predictions, the stronger growth could have a
positive impact on the EBITDA margin.
weaker
economy main scenario
stronger
economy
GDP growth rates compared to 2016 unexpectedly
weak
Europe:
slightly lower/stable
US: higher
unexpectedly
strong
Organic sales growth lower 2 - 5% higher
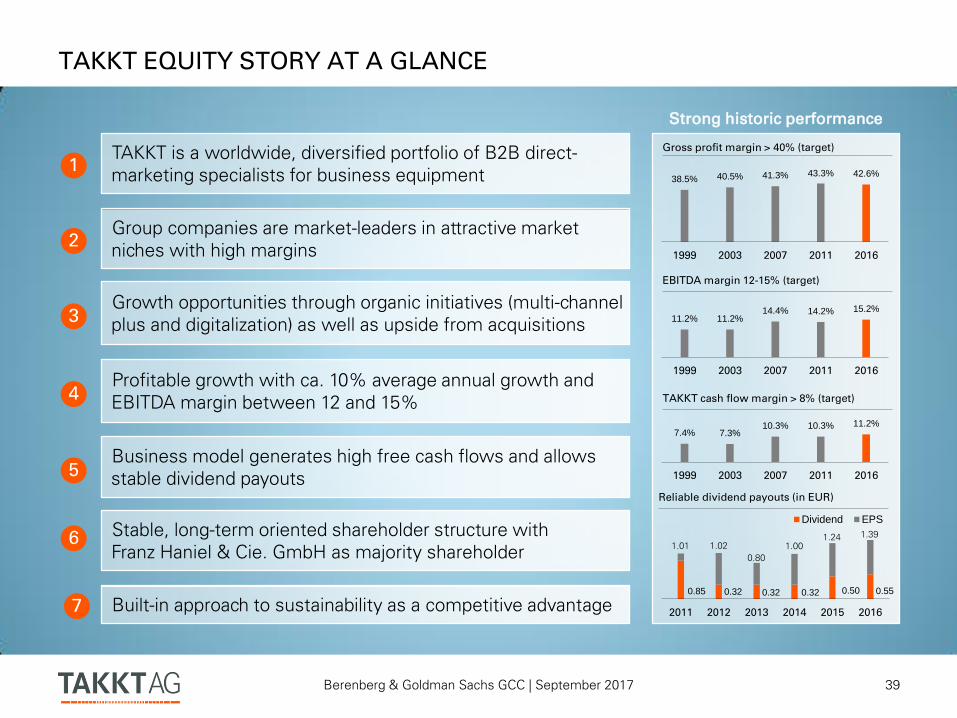
TAKKT EQUITY STORY AT A GLANCE
39 Berenberg & Goldman Sachs GCC | September 2017
1
2
3
4
5
6
38.5% 40.5% 41.3% 43.3% 42.6%
1999 2003 2007 2011 2016
Gross profit margin > 40% (target)
Strong historic performance
Reliable dividend payouts (in EUR)
Profitable growth with ca. 10% average annual growth and
EBITDA margin between 12 and 15%
Business model generates high free cash flows and allows
stable dividend payouts
Stable, long-term oriented shareholder structure with
Franz Haniel & Cie. GmbH as majority shareholder
Group companies are market-leaders in attractive market
niches with high margins
TAKKT is a worldwide, diversified portfolio of B2B direct-
marketing specialists for business equipment
Growth opportunities through organic initiatives (multi-channel
plus and digitalization) as well as upside from acquisitions
7 Built-in approach to sustainability as a competitive advantage
11.2% 11.2% 14.4% 14.2% 15.2%
1999 2003 2007 2011 2016
EBITDA margin 12-15% (target)
7.4% 7.3% 10.3% 10.3% 11.2%
1999 2003 2007 2011 2016
TAKKT cash flow margin > 8% (target)
0.85 0.32 0.32 0.32 0.50 0.55
2011 2012 2013 2014 2015 2016
Dividend EPS
1.01 1.02
0.80
1.00 1.24 1.39
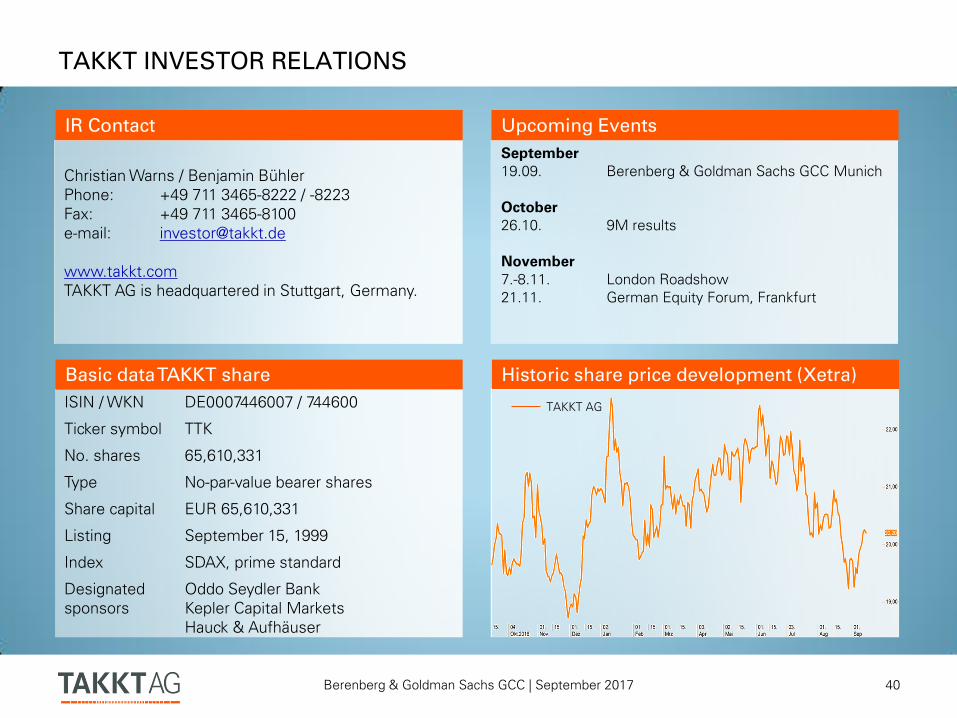
TAKKT INVESTOR RELATIONS
40 Berenberg & Goldman Sachs GCC | September 2017
Christian Warns / Benjamin Bühler
Phone: +49 711 3465-8222 / -8223
Fax: +49 711 3465-8100
e-mail: [email protected]
www.takkt.com
TAKKT AG is headquartered in Stuttgart, Germany.
IR Contact Upcoming Events
September
19.09. Berenberg & Goldman Sachs GCC Munich
October
26.10. 9M results
November
7.-8.11. London Roadshow
21.11. German Equity Forum, Frankfurt
Basic data TAKKT share
ISIN / WKN DE0007446007 / 744600
Ticker symbol TTK
No. shares 65,610,331
Type No-par-value bearer shares
Share capital EUR 65,610,331
Listing September 15, 1999
Index SDAX, prime standard
Designated
sponsors
Oddo Seydler Bank
Kepler Capital Markets
Hauck & Aufhäuser
Historic share price development (Xetra)
TAKKT AG