Benthic Macroinvertebrate survey 2015-2016
49
Benthic Macroinvertebrate survey 2015-2016: Coorong and Murray Mouth Icon Site Report for the Department of Environment, Water and Natural Resources and the Murray-Darling Basin Authority Sabine Dittmann & Ryan Baring Flinders University, School of Biological Sciences GPO Box 2100, Adelaide, SA 5001
Transcript of Benthic Macroinvertebrate survey 2015-2016

Benthic Macroinvertebrate survey
2015-2016:
Coorong and Murray Mouth Icon Site
Report for the
Department of Environment, Water and Natural Resources
and the Murray-Darling Basin Authority
Sabine Dittmann & Ryan Baring
Flinders University, School of Biological Sciences
GPO Box 2100, Adelaide, SA 5001
© Flinders University and The Department of Environment, Water and Natural Resources (DEWNR)
With the exception of the Commonwealth Coat of Arms, the Murray-Darling Basin Authority logo,
photographs, graphics and trademarks, all material presented in this document is provided under a
Creative Commons Attribution 4.0 International Licence.
(https://creativecommons.org/licenses/by/4.0/).
For the avoidance of any doubt, this licence only applies to the material set out in this document.
The details of the licence are available on the Creative Commons website (accessible using the links
provided) as is the full legal code for the CC BY 4.0 licence
((https://creativecommons.org/licences/by/4.0/legal code).
MDBA’s preference is that this publication be attributed (and any material sourced from it) using the
following:
Publication (cite as): Dittmann, S. & Baring, R. 2015. Benthic macroinvertebrate survey 2015-2016:
Coorong and Murray Mouth Icon Site. Report for the Department of Environment, Water and Natural
Resources and the Murray-Darling Basin Authority. Flinders University, Adelaide.
Source: Licensed from The Department of Environment, Water and Natural Resources under a
Creative Commons Attribution 4.0 International Licence.
Cover Image: Waders feeding in the mudflats at Ewe Island, Murray Mouth, photo by S. Dittmann
2015
Disclaimer
The contents of this publication do not purport to represent the position of the Commonwealth of
Australia or the MDBA in any way and are presented for the purpose of informing and stimulating
discussion for improved management of Basin's natural resources.
To the extent permitted by law, the copyright holders (including its employees and consultants)
exclude all liability to any person for any consequences, including but not limited to all losses,
damages, costs, expenses and any other compensation, arising directly or indirectly from using this
report (in part or in whole) and any information or material contained in it.
Contact us
Enquiries regarding the licence and any use of the document are welcome to: Adrienne Rumbelow
LLCMM Icon Site Coordinator [email protected]

Contents
1. Executive summary .......................................................................................................................... 5
2. Introduction ....................................................................................................................................... 6
3. Materials and Methods ..................................................................................................................... 9
3.1 Sampling sites and dates ........................................................................................................ 9
3.2 Environmental parameters .................................................................................................... 10
3.3 Macrofauna ............................................................................................................................ 12
3.4 Data Analysis ......................................................................................................................... 13
4. Results – Murray Mouth and Coorong ........................................................................................... 15
4.1 Mudflat habitats in the Murray Mouth and Coorong .............................................................. 15
4.1.1 Salinity regime and water level .......................................................................................... 15
4.1.2 Water quality ...................................................................................................................... 16
4.1.3 Sediment size ranges ........................................................................................................ 16
4.1.4 Sediment organic matter and chlorophyll-a ....................................................................... 19
4.1.5 Trajectory for environmental conditions between years .................................................... 20
4.2 Macroinvertebrate populations .............................................................................................. 22
4.2.1 Macroinvertebrate species richness, diversity and distribution ......................................... 22
4.2.2 Macroinvertebrate abundances and distribution ............................................................... 26
4.2.4 Macroinvertebrate biomass ............................................................................................... 33
4.2.5 Macroinvertebrate communities ........................................................................................ 35
4.2.6 Environmental conditions as predictor variables for macroinvertebrate communities ...... 38
6. Discussion ...................................................................................................................................... 42
6.1 Macroinvertebrate populations .................................................................................................... 42
6.2 Habitat conditions .................................................................................................................. 44
6.3 Intervention monitoring .......................................................................................................... 44
6.4 Conclusion ............................................................................................................................. 45
7. Acknowledgements: ....................................................................................................................... 46
8. References ..................................................................................................................................... 46

Appendices provided electronically
The following Word and Excel data files were supplied:
Appendix 1 Sampling sites, dates and coordinates 2015-2016
Appendix 2 Murray Mouth and Coorong environmental parameters 2015-2016
Appendix 3 Murray Mouth and Coorong Sediment Characteristics 2015-2016
Appendix 4 Murray Mouth and Coorong Species Diversity 2015-2016
Appendix 5 Murray Mouth and Coorong macroinvertebrate abundances 2015-2016
Appendix 6 Murray Mouth and Coorong Biomass_2015-2016
5
1. Executive summary
The Living Murray (TLM) Condition Monitoring Program provides an assessment of the ecological
condition of the Lower Lakes, Coorong and Murray Mouth (LLCMM) Icon Site. This report provides
findings from the 11th survey of benthic macroinvertebrate monitoring in this Ramsar listed wetland
addressing in particular the condition monitoring target I-1 “Maintain or improve invertebrate
populations in mudflats”.
The response of benthic macroinvertebrates to environmental changes in the Murray Mouth and
Coorong were assessed with measurements of diversity, abundance, biomass and community
structure and various environmental parameters from sediments and overlying water. Identification of
the influence of environmental conditions to changes in the benthic population structure addresses the
TLM condition monitoring targets M-1 – ‘Facilitate frequent changes in exposure and submergence of
mudflats’, M-2 – ‘Maintain sediment size range in mudflats’, and M-3 – ‘Maintain organic content for
mudflats’, and also contributes to W-1 – ‘Assessment of estuarine conditions between Goolwa
Barrage and Pelican Point’. The sampling regime for macroinvertebrates and environmental conditions
in the November 2015 and April 2016 survey followed procedures from previous years and as
described in The Living Murray LLCMM Icon Site Condition Monitoring Plan (Maunsell 2009).
Macroinvertebrate samples were taken in the Murray Mouth and Coorong at 11 sites with a hand-held
PVC corer. The volume of water released over the barrages during the November 2015 (55 GL) and
March 2016 (50 GL) period was lower than some recent years but consistent through time. Findings
from the November 2015 survey indicate that macroinvertebrate populations are recovering in the
system and providing food for shorebirds but they are reduced to sites in the Murray Mouth and
northern reaches of the North Lagoon, specifically at site Mulbin Yerrok. Species numbers, diversity,
abundances and biomass are similar to the recent survey in 2013/14 where flow has resumed. The
micro-mollusc Arthritica helmsi, now has an increased range and highly abundant throughout the
Murray Mouth and at Mulbin Yerrok, where it was once rare but now common in the system.
Macroinvertebrate community trajectories in the Murray Mouth appear to be shifting back to pre-
drought conditions but it is difficult to determine and requires further investigation in future surveys. In
comparison, the southern sites of the North Lagoon were much lower in abundance and less diverse
than recent survey years and macroinvertebrates in the South Lagoon were very low or completely
absent. The TLM icon site target I-1 “Maintain or improve invertebrate populations in mudflats” is only
partially met and is restricted to the Murray Mouth and northern North Lagoon section of the Coorong.
Comparisons between the November 2015 and April 2016 survey showed a decrease in
macroinvertebrate abundances and biomass, and changes to community structure at sites sampled in
the Murray Mouth and North Lagoon, which may be attributed to reduced flows and unusual high
temperatures over the 2015/16 summer, or foraging by birds. Future surveys should investigate the
macrobenthic communities and environmental conditions around the arrival and departure of
shorebirds to better determine the influences of environmental change together with predation on
macroinvertebrate communities.
Habitat conditions in the Murray Mouth and Coorong mudflats were within similar ranges to the
2013/14 survey. Salinities of overlying water in the mudflats followed the same pattern as previous
years with low values in the Murray Mouth described as oligo- or mesohaline (<18 ppt) and
hypersaline (>40 ppt) from the southern North Lagoon through to the most southern site of the South
Lagoon. The sediment conditions have met TLM condition monitoring targets in the Murray Mouth and
northern North Lagoon which have improved for the better. However, the facilitation of frequent
changes in exposure and submergence of mudflats is not clear during warm summer periods as
observed in 2015/16 where there was zero flow through the barrages for some time.

6
2. Introduction
This report presents the findings from the 2015/16 benthic macroinvertebrate surveys undertaken as
part of The Living Murray (TLM) Condition Monitoring Program (spring/summer) and Intervention
Monitoring Program (April 2017). These monitoring programs provide an assessment of the Lower
Lakes, Coorong and Murray Mouth Icon Site, its habitat values and state of recovery of key species
(Maunsell 2009). In estuarine ecosystems such as the Murray Mouth and Coorong,
macroinvertebrates are a key component, where they play an essential role in benthic functioning of
sand/mudflats (Covich et al. 2004) and support aquatic food webs by providing food for higher trophic
level consumers, such as birds (Botto et al. 1998). Benthic macroinvertebrates also respond quickly to
change and are often used as indicator organisms for ecosystem health, particularly in estuarine
environments (Cardoso et al. 2007; Wildsmith et al. 2011).
The Lower Lakes, Murray Mouth and Coorong is a Ramsar listed wetland of significant importance,
which has undergone extreme environmental changes over the past decade (Wainwright and Christie
2008, Paton et al. 2009, Kingsford et al. 2011). Following the Millennium Drought, flow into the system
resumed with large flows from spring 2010 to the end of 2012 and more modest but continuous flows
in 2013 to 2014, albeit with some fluctuation with season and water management (Figure 1). Flow
through the barrages continued during the 2015 year with a slight increase in the winter-spring period,
which was then reduced back to very little or no flows during the 2015/16 summer period (Figure 1).
Figure 1: Monthly barrage flow from the Lower Lakes into the Murray Mouth and Coorong during the years of macroinvertebrate and mudflat monitoring from 2004 to March 2016. Based on modelled monthly barrage outflow data from the MDBA.
Long-term monitoring of the system since 2004 has provided insights into the loss of benthic habitat
quality, macroinvertebrate species and populations during the drought years and the recovery of the
macrobenthos after flows resumed in 2010. Signs of recovery in macroinvertebrate communities were
delayed after the reintroduction of flows in 2010, which was only first noticeable in the 2011/12 and

7
2012/13 monitoring surveys (Dittmann et al. 2012, 2013a,b). Initially there was an increase in
chironomids and amphipods during 2011/12, but since then there has been an increase in more
macroinvertebrate species, particularly with larger bodied, deeper burrowing species that are
important for bioturbation of sediments (Dittmann et al. 2012, 2013a, b, 2014, 2016). The delayed
response of macroinvertebrate recolonisation into the benthos due to improving environmental
conditions from re-introduced flows are some signs of recovery (Dittmann et al. 2016), however
previous evidence shows that such processes can take several years or decades (Borja et al. 2010).
Increases in climate variability and the associated availability of environmental flows will also add to
the challenges for this system over the longer term.
This report presents the findings from the 11th year of condition monitoring of the Murray Mouth and
Coorong to assess the food availability for migratory and native shorebirds and other higher trophic
level organisms in the system. As in previous years, the same sampling sites were surveyed in
November 2015 and a subset of four sites in April 2016 using the same methods for consistency and
reliable comparison over time. Additional to the annual survey in late spring/early summer, the four
sites re-surveyed in April 2016 were sampled due to concern of an immediately noticeable reduction in
some larger-bodied species of polychaete worms in the November 2015 survey. All sites correspond
with shorebird monitoring sites and most overlap with other components of TLM monitoring (e.g. fish).
Findings from the current monitoring also included several environmental parameters for sediment
condition and water quality, to assess changes across time and space at the sites with comparison to
previous surveys. It was anticipated that this current survey would indicate further improvements of
macroinvertebrate populations and communities and benthic condition since the re-introduction of
flows in 2010/11. The continued monitoring in 2015/16 provides further evaluation of
macroinvertebrate responses to improved environmental conditions of the system. Outcomes from this
report of TLM condition monitoring in 2015/16 can inform decision making and future management of
the Murray Mouth and Coorong.
The report aligns with a number of condition monitoring objectives for TLM, which are; I-1 – ‘Maintain
or improve invertebrate populations in mudflats’, M-1 – ‘Facilitate frequent changes in exposure and
submergence of mudflats’, M-2 – ‘Maintain sediment size range in mudflats’, and M-3 – ‘Maintain
organic content for mudflats’ (Maunsell 2009). It also contributes to W-1 – ‘Assessment of estuarine
conditions between Goolwa Barrage and Pelican Point’ with measurements of water quality taken at
the time of invertebrate monitoring in late spring/early summer. The report is structured around the
targets with detailed data analyses provided as supplementary material (table and figure reference
prefix SM-).
To deliver the TLM condition monitoring targets (I-1, M-1 to M-3), this report addresses the following
questions for the spring/summer of 2015/16:
1) To describe the current environmental conditions of the Murray Mouth and Coorong

8
2) To determine the spatial and temporal distribution of macroinvertebrates, in terms of species
composition, diversity, abundances and biomass in the Murray Mouth, Coorong and Lower Lakes
since 2004.
3) To explore the relationship between environmental parameters and macroinvertebrate
assemblages.
Additional field monitoring across 4 sites (Ewe Island, Pelican Point, Mulbin Yerrok and Noonameena)
was also undertaken in April 2016, as part of TLM Intervention Monitoring Program, to determine the
following key objectives:
ascertain whether spatial contraction of distribution ranges continued;
assess whether abundances of macroinvertebrates have declined further since the start of
summer; and
assess whether biomass of macroinvertebrates has declined and thus food availability for
migratory waders.

9
3. Materials and Methods
3.1 Sampling sites and dates
The same sampling design undertaken in previous years was continued in 2015/16 and is described in
the LLCMM Icon Site Condition Monitoring Plan (Maunsell 2009). Benthic macroinvertebrate fauna
was sampled at a total of 11 sites across the Murray Mouth (5 sites) and Coorong (6 sites) region
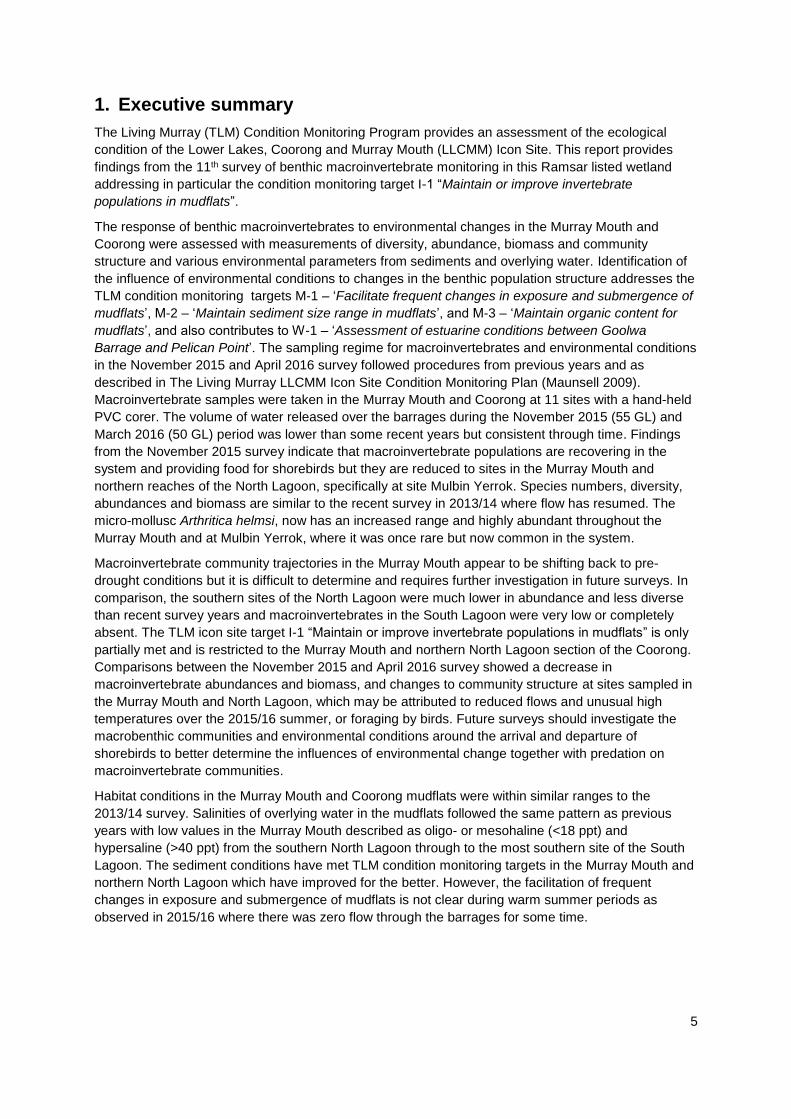
during the 2015 late spring/summer survey (Figure: 2). Sampling occurred between the 17th and 24th
November 2015 and a sub-set of four sites in autumn on April 4th 2016 (see also SM-Table 1).
In the November 2015 survey, sites sampled in the Murray Mouth, between the Goolwa Barrage and
the southern end of the Tauwitchere Barrage included; sites 1 (Monument Road), 2 (Hunters Creek), 3
(Mundoo Channel), 4 (Ewe Island), and 5 (Pelican Point). Sites 6 (Mulbin Yerrok, near Long Point), 7
(Noonameena) and 8 (Parnka Point) are located in the North Lagoon of the Coorong. The South
Lagoon sites were 9 (Villa dei Yumpa), 10 (Jack Point), and 11 (Loop Road south of Salt Creek)
(Figure 2). In April 2016, two sites each in the Murray Mouth (sites 4 and 5) and North Lagoon (sites 6
and 7) were resampled for benthic macroinvertebrate fauna due to a noticeable decrease in fauna
(particularly larger polychaete worms) from the November 2015 survey at sites 5 and 6.
During the November sampling, different sites along the Murray Mouth and Coorong had varying
distances of sediments exposed ranging from approximately 10 to 200 metres, but the amount of
sediment exposed was comparable to other recent macroinvertebrate sampling surveys conducted in
the region during early 2015 (Dittmann et al. 2016). Some of the exposed sediment at Ewe Island was
very disturbed with what appeared to be feeding pits (i.e. possibly from black swans) throughout the
shoreline in the April 2016 survey. There was also a large dense expanse of filamentous green algae
mats covering the benthos in the shallow subtidal region along the entire length of the Tauwitchere
barrages during the April 2016 survey.
10
Figure 2: Location of study area and sampling sites for each region of the Murray Mouth and Coorong from the survey undertaken during the late spring/summer of 2015 (all 11 sites) and autumn 2016 (sites 4, 5, 6 and 7 only).
3.2 Environmental parameters
The same suite of environmental characteristics were sampled in 2015/16 as in previous years and
included; water temperature, salinity, oxygen content and saturation, sediment grain size, organic
matter and chlorophyll-a, which were recorded to establish environmental conditions at each site.
Some of those environmental parameters are aligned with the condition monitoring objectives such as;
whether sediment size ranges and organic matter were maintained (objectives M-2 and M-3), to
11
characterise the salinity regime at the time of sampling (objective W-1), and to identify environmental
parameters that are influencing the macrobenthic communities (Maunsell 2009).
Water Quality
Various water quality characteristics were obtained (temperature, dissolved oxygen concentration,
oxygen saturation, salinity and pH) at all of the sites during November 2015 and April 2016.
Measurements for temperature, and oxygen concentration and saturation were taken with a YSI
Pro2030 multi-parameter electrode at all sites. For the pH of water and sediment, pH indicator strips
were used (Acilit 0-14) and a refractometer was used to measure salinity in the overlying water and
additionally from the residual pore water of the core sampling, which showed comparable salinities to
the overlying water. Three replicate measurements for each parameter were taken.
Sediment analyses
In November 2015 and April 2016, sediment samples were obtained from each site for the analysis of
grain size, organic matter content and chlorophyll-a (as a proxy for microphytobenthic biomass). All
sediment samples were stored on ice and frozen upon return to the laboratory and until further
analysis. Only the samples from the November 2015 survey were processed in the laboratory and
data analysed, while the April 2016 sediment samples were kept frozen and will be processed at a
later date.
Samples for sediment organic matter were extracted using a cut off 10 mL syringe (surface area
1.8cm2). To account for spatial variation, three replicate samples of each sediment parameter were
taken and analysed separately. To obtain a bulk parameter of organic matter as % dry weight (d.w.),
sediment samples were dried to constant weight using an Ohaus MB45 Moisture Balance. Sediment
samples were homogenously distributed onto aluminium trays and dried using the standard drying
protocol (controlling the temperature profile at 80 ºC). The profile burn was automatically completed
after all moisture content was dried and remained stabilised for 30 seconds. Samples were then burnt
in a muffle furnace at 450 ºC for 5 hrs.
For sediment grain size, three replicate samples per site were taken using a cut-off 60 mL syringe
(surface area 6.6 cm2). Samples were stored on ice in the field and frozen until further analyses in the
laboratory. Grain size was determined by laser diffraction using a particle size analyser (Malvern
Mastersizer 2000). Sediment grain size samples were thawed and the fraction >1 mm sieved off
manually to avoid blockage in the machine. To correct for this procedure, the weight of this fraction
and of the remaining sediment were determined and normalised in the data set. Median and quartiles
as well as percentages of various particle sizes were obtained from the Mastersizer output. Sediment
sorting was calculated using the formula So= (P25/P75)1/2, based on the logarithmic method of moments
scale and categorised as sorting classes according to Gray (1981) and Blott and Pye (2001). At
several sites at the Murray Mouth and North Lagoon, as well as at Villa dei Yumpa (Site19), sediment
grain size compositions had slightly bimodal distributions. For sediments composed of finer soft
sediment and larger grain particles, the obscuration level of the Mastersizer is more sensitive to finer
than larger particles.

12
For chlorophyll-a in the sediment surface, three replicate samples were taken per site using a 5 mL
vial inserted 1 cm into the sediment. Subsequently, 5 mL of methanol was added to extract the
chlorophyll, and the vial was vigorously shaken before being wrapped in aluminium foil (Seuront and
Leterme 2006). Samples were placed on ice in the field and upon return to the laboratory, were frozen
for later analysis with a fluorometer (Turner 450). After the initial reading for total chlorophyll, drops of
0.1 M HCl were added to the samples to correct for phaeophorbides.
3.3 Macrofauna
Benthic macroinvertebrates in the littoral zone were sampled for species composition and abundance
within the sediment with the use of handheld PVC corers (83.32 cm2 surface area). Ten replicate
samples were taken per site, scattered haphazardly between the mid to low shore levels around the
respective water margin. All benthic samples were sieved through 500 µm mesh size in the field and
sorting of live samples occurred in the laboratory within a few days of collection. Most of the
macroinvertebrates were identified and counted in the laboratory straight after sorting. If time did not
allow, due to large volume samples and /or high individual numbers of common species, then
specimens were preserved in 70% ethanol. Specimens were identified to the lowest possible
taxonomic level and the numbers of individuals of each species were counted. Amphipods were not
differentiated to species, as shorebirds are unlikely to be selective towards particular amphipod
species as prey. All polychaete specimens with a complete anterior region (prostomium) were included
in abundance counts. For measuring biomass, polychaete fragments were included with the complete
specimens. The larval and pupae stages of insects were recorded, while all adult winged life stages
were excluded as they are highly motile and not part of the benthic macrofauna. Further refinement of
the dataset from 2004 to 2015/16 was undertaken to remove rare taxa that were only occasionally
encountered or are generally not normally contributing to benthic macrofauna communities.
All identified organisms were preserved in 70 % ethanol until they were used for biomass
determination. Biomass was analysed for the total benthos per replicate sample and not differentiated
per phyla, given the understanding of the main taxa contributing to the biomass gained from previous
monitoring. Each sample was dried to constant weight (d.w.) using an Ohaus MB45 Moisture Balance.
Specimens were homogenously distributed onto aluminium trays and dried using the standard drying
protocol (controlling the temperature profile at 80 ºC). As samples with <0.5 g can give inaccurate
results with the moisture balance, samples with very few specimens were dried in an oven at 80 ºC
until constant dry weight (d.w.) was achieved (at least 24 hours). Samples were then placed in a
muffle furnace at 450 ºC for 5 hours. Samples were removed from the furnace and cooled in a
desiccator before final weighing. The weight after burning was subtracted from the dry weight to obtain
the biomass measurement as grams of ash free dry weight (g AFDW). Large outliers or negative ash
free dry weight values were deleted from the dataset to ensure that those values did not have
influence on the rest of the dataset with erroneous results.

13
3.4 Data Analysis
The approach taken for data analysis follows previous monitoring reports (see Dittmann et al. 2013a,
2014). The three regions are differentiated in the analysis design and correspond to the ‘sub-regions’
in the LLCMM Condition Monitoring Plan, which are the Murray Mouth estuary, North Lagoon and
South Lagoon of the Coorong. To assess whether TLM condition monitoring target parameters were
maintained or improved, comparisons were carried out using the November 2015 and previous survey
data from 2004 to 2013. With the extreme changes in environmental conditions over that time span,
and the lack of quantitative historic data, reference state or dynamics are difficult to define. The
approach taken here was to divide the entire monitoring time span into three periods characterised by
different flow conditions (see Figure 1): 2004-2006 with no or small flow (in 2005), 2007-2009 being
the years of the extreme drought without water releases from the barrages, and 2010-2013 as the
period since the return of flows, which commenced in spring 2010. The November 2015 data was then
compared to those three separate periods. Some parameters, such as Chl-a, were added later (2007
and 2008) and temporal comparisons respectively adjusted.
Several indices were used to assess diversity, in addition to the species number found at each site;
Shannon-Wiener diversity (H’) using loge, Margalef’s Index (d) for species richness, Pielou’s index (J’)
for equitability and the Simpson index (an evenness index independent of sampling effort that is
adjusted to small sample sizes).
The design used for statistical analyses of environmental or biotic data was regions (fixed factor) and
sites nested within regions (random factor), with the survey year added to the design (fixed factor) for
temporal comparisons. The analysis for temporal differences of environmental parameters was based
on average values per site at each survey, due to a lower number of replicates in the data set prior to
2007, and a design using the survey year (fixed factor) and region (fixed factor), with sites as
replicates for each respective region. This design was also used for testing diversity indices. For
comparisons between the November 2015 and April 2016 survey the same three factor design for all
year comparisons was used, but the factor of region was dropped from the design when comparing
species number and diversity indices due to a lack of replication on averaged data for that factor.
Tests were carried out using PERMANOVA (permutational analysis of variance) using the software
PRIMER v6 with PERMANOVA add-on. Prior to analysis, environmental and biotic data were
transformed as needed (square root, fourth root or log (x+1)). Environmental data were normalised
when parameters with different units were included in the analysis. Similarities of sampling sites based
on environmental factors were explored with principle component analyses (PCA), with vector overlays
for defining variables, or trajectories to display temporal change. Tests of homogeneity of dispersion
(PERMDISP) were included for some environmental and biotic data to assess variability within factor
levels. For environmental data and univariate analysis of biotic data (e.g. tests for differences in total
abundances or total biomass), Euclidean distance was used to create the resemblance matrix. In all
multivariate analyses of biotic data, Bray-Curtis similarity was used, with a dummy value of 1 added
when many zero values occurred in the data. For the tests between macroinvertebrate abundances

14
from four sites sampled in both November 2015 and April 2016 the possible permutations from
PERMANOVA analyses were quite low and meaningless, so in those cases Monte Carlo sampling
was used to obtain approximate but more interpretable P-values (Anderson et al. 2008).
The measure of occurrence was calculated for key taxa by counting the number of sites where a
species occurred in previous monitoring years as the best achievable distribution range, which was
then divided by the number of monitoring sites (11 sites). That calculation provides a historical
measure of occurrence for key taxa that can then be used as a historical reference line to compare
with the current survey measure of occurrence where the index has a number one if it occurred at all
sites or zero if it was not found at all.
To explore differences in macroinvertebrate communities, principal coordinate analysis (PCO) plots
were used with vector overlays (Pearson correlation) to illustrate species contributing to the
differentiation of communities along the PCO axes. PERMANOVA tests were carried out for
community differences, following the designs explained above. SIMPER analyses revealed the
species contributing most to the similarity within sites and those differentiating sites. ANOSIM
(Analysis of similarity) tests were run between regions for each year to obtain the test statistic Global
R, indicating community differences. To illustrate community changes over time, nMDS ordination
plots were created with trajectories linking consecutive years, and significantly different clusters based
on SIMPROF tests are indicated with circles around respective years.
To explore links between macroinvertebrate assemblages and environmental data, distance-based
linear models (DISTLM) were calculated and visualised using distance-based redundancy analysis
(dbRDA). Some sites or parameters had to be excluded from these analyses due to missing values for
some environmental factors in previous years or cases of autocorrelation. Detailed test outcomes are
provided in the Supplementary Material.

15
4. Results – Murray Mouth and Coorong
4.1 Mudflat habitats in the Murray Mouth and Coorong
4.1.1 Salinity regime and water level
During the November 2015 survey, the water in the Murray Mouth and the most northern site of the
North Lagoon (site 6) was fresh to brackish and all other sites further south (site 7 onwards) were all
hypersaline (Figure 3). Compared to previous years since 2004, salinity levels in November 2015 were
at the lower range across most sites throughout the Murray Mouth and Coorong Lagoons (Figure 3,
SM-Figure 1). Some exceptions where salinity levels were showing an average range from previous
surveys were Noonameena, Parnka Point and Villa dei Yumpa (sites 7 to 9). During the April 2016
survey, salinity levels at the two Murray Mouth sites (Ewe Island (site 4); Pelican Point (site 5) were
higher than the November 2015 survey (Figure 3)). While the two sites in the North Lagoon had similar
or lower salinity levels in April 2016 compared to November 2015 (Mulbin Yerrok (site 6);
Noonameena (site 7); respectively) (Figure 3).
Figure 3: Salinity (mean ppt ± S.E.) in the water overlying the mudflats of the Murray Mouth and Coorong during the survey at all eleven sites in November 2015 (black diamonds) and at four sites only in April 2016 (open diamonds). Minimum (blue dashed) and maximum (red dashed) lines are based on averages for salinities recorded in previous TLM surveys from 2004 to 2013/14. Grey line represents seawater salinity.
Over the November 2015 and April 2016 sampling trips, the widths of the exposed mudflats varied.
However, for condition monitoring target M-1: ‘Facilitate frequent changes in exposure and
submergence of mudflats’, only observations from single days can be provided. The water level had
decreased slightly between the sampling trips in November 2015 compared to April 2016 in the
Coorong, due to very low or zero water releases over the barrages during the 2015/16 summer period
(see Figure 1).

16
4.1.2 Water quality
Various other water quality parameters were measured throughout the Murray Mouth and Coorong
sites in 2015/16. In November 2015, seven of the eleven sites had water temperatures at the upper
end of the temperature range recorded from previous surveys since 2004, with some very warm water
temperatures at Mundoo Channel (site 3) and Ewe Island (site 4) in the Murray Mouth (SM-Figure 2).
Monument Road (site 1) had cooler water temperatures in November 2015, compared to the range in
temperatures form previous years. During the April 2016 survey, water temperatures were cooler at
the Murray Mouth sites (Ewe Island, site4; Pelican Point, site 5) and slightly warmer at the North
Lagoon sites (Mulbin Yerrok, site 6; Noonameena, site 7) compared to the November 2015 survey
(Sm-Figure 3).
In November 2015, dissolved oxygen concentration in the water column overlying mudflats throughout
the Murray Mouth and Coorong was slightly lower than the previous 2013/14 survey (average 8.1
mg/L versus 9.9 mg/L) ranging from 6.1 to 9.9 mg/L (versus 6 to 14 mg/L 2013/14) (see Dittmann et
al. 2014). However, some sites had high oxygen concentrations compared to previous surveys at
those particular sites since 2004 (Hunters Creek, site 2: Mulbin Yerrok, site 6; Noonameena, site 7)
(Figure SM-Figure 4). Dissolved oxygen saturation was above the ANZECC trigger value (90%) at 10
of the 11 sites, and 115% on average. The highest oversaturation of 124% was recorded in the water
overlying the sediment at Hunters Creek (site 2) (SM-Figure 5). At most sites, saturation levels were
within the upper range or sometimes higher than previously recorded values (SM-Figure 5). Both
Oxygen concentration and saturation levels were quite low at Monument Road (site 1), (SM-Figure 5).
Oxygen concentration and saturation levels were much higher in April 2016 compared to November
2015 at the four sites sampled, with saturation levels higher than previous years (SM-Figure 6; SM-
Figure 7).
Water overlying sediments had a lower pH than previous years, with pH 6.2 on average (SM-Figure 8),
which could have been due to the different method used (pH strips instead of electrode). The pH of
water overlying sediments in April 2016 compared to November 2015 was slightly lower at Ewe Island
(site 4) and Mulbin Yerrok (site 6) but within similar ranges (SM-Figure 9).
4.1.3 Sediment size ranges
During the November 2015 survey, sediments in the studied mudflats were sandy and mostly
moderately sorted, with sites in the Murray Mouth and North Lagoon consisting of mainly fine sand
(Table 1; SM-Figure 10). Two sites bordering the Murray Mouth and North Lagoon (Pelican Point, site
5; Mulbin Yerrok, site 6) were mainly medium sand. Sediments from sites in the South Lagoon were
mainly medium sand with the exception of finer sands at Loop Road (site 11) (Table 1). Compared to
the Murray Mouth region, there was a larger range in grain sizes from very fine to very coarse sands
(SM-Figure 10) in the North and South Lagoons. Yet, the median grain size was only significantly
different at the site level and not between regions (SM-Table 2).
In 2015, the median sediment grain size was comparable to previous years at most sites, with the
exception of the lowest value ever recorded for the Monument Road site (site 1) (Figure 4). The

17
sediment grain size at Jack Point (site 10) was more comparable to other years, rather than the
extremely large grain size value recorded in 2013 (Figure 4).
The sediment grain size composition at study sites in the Murray Mouth and North Lagoon appears to
have become less mud and more very fine to fine sands compared to the 2012 and 2013 surveys
(Figure 5). Yet, median grain sizes were not statistically different across the survey years, but differed
by region (SM-Table 2). Thus, the condition monitoring target M-2 ‘Maintain sediment size range in
mudflats’ is met.
Table 1: Sediment characteristics of mudflats in the Murray Mouth and Coorong region during summer 2015/16. Organic matter content (in per cent dry weight) within the sediment and the median grain size of sediment (in μm) along with the sorting coefficient So, are provided as characteristics of mudflat sediment. The verbal description of sediment grain size and sorting follows Blott and Pye (2001).
1 2.83 144.08 Fine sand 0.78 Moderately sorted
2 1.58 156.61 Fine sand 0.80 Moderately sorted
3 1.53 166.16 Fine sand 0.73 Moderately sorted
4 1.66 139.13 Fine sand 0.78 Moderately sorted
5 4.07 327.99 Medium sand 0.73 Moderately sorted
6 1.81 269.78 Medium sand 0.71 Moderately sorted
7 0.92 218.09 Fine sand 0.76 Moderately sorted
8 2.41 238.75 Fine sand 0.75 Moderately sorted
9 4.08 272.46 Medium sand 0.64 Moderately well sorted
10 2.08 228.49 Fine sand 0.70 Moderately well sorted
11 3.31 276.05 Medium sand 0.69 Moderately well sorted
Sorting description
Murray
Mouth
North
Lagoon
South
Lagoon
Organic Matter
(% DW)Sorting Region Site
Grain size
(µm)Median description

18
Figure 4: Median grain size values recorded in mudflats at each of the sites in the Murray Mouth and Coorong during monitoring surveys since 2004. Hunters Creek (2) was included in 2005, and site 7 was not sampled that year. Note the different y-axes scales due to some outlying coarser sediment in the North Lagoon. See Figure 1 & 2 for site locations.

19
Figure 5: PCA (Principal component analysis) of sediment grain size compositions (% of major fractions, size in μm) in mudflats in the Murray Mouth and Coorong for the summer surveys from 2005 to 2015. Sites or regions are not shown in the figure. The same plot is shown for the survey years (left) and the regions Murray Mouth (MM), North Lagoon (NL) and South Lagoon (SL) (right). 2004 is not included as a different method was used for grain size analysis. The PCA axes explained 45.5 % (PC1) and 25.7 % (PC2) of the variation.
4.1.4 Sediment organic matter and chlorophyll-a
Sediment organic matter in the mudflats was high compared to previous years (overall average 2.4 %
dry weight) at most sites but similar to previous years at Ewe Island (site 4), Noonameena (site 7) and
the three South Lagoon sites (Figure 6). The sediment organic matter did not vary significantly
between regions or sites in 2015 (SM-Table 2, SM-Figure 11).
Across all monitoring years, sediment organic matter varied significantly between regions and
between the survey years (SM-Table-2). Variability was highest at Pelican Point (site 5), yet overall,
values for sediment organic matter from November 2015 fell within the range of values recorded in
previous years (Figure 6). Thus, the condition monitoring target M-3 ‘Maintain organic content for
mudflats’ was met.
Microphytobenthic biomass in the sediments, as estimated by the Chlorophyll-a content was low
across all regions (SM-Figure 12). The amount of Chl-a in sediments averaged 0.89 mg m-2 and
similar to values in the 2013 survey (see Dittmann et al. 2014) and were not significantly different
between regions or sites (SM-Table 2). Microphytobenthic biomass have been consistently low since
the 2010/11 survey and the Chl-a values from sediments in November 2015 were similarly low and in
the lower boundaries compared to earlier years (Figure 7).

20
Figure 6: Sediment organic matter (as % dry weight) of mudflat sediments in the Murray Mouth and Coorong Lagoons during surveys from 2004 – November 2015 (boxplot) and during the survey in November 2015 (red triangles ; average ± SE).
Figure 7: Sediment chlorophyll-a content (in mg/m2) of mudflats in the Murray Mouth and Coorong Lagoons during surveys from 2007 – 2015 (boxplot) and during the survey in November 2015 (red triangles ; average ± SE).
4.1.5 Trajectory for environmental conditions between years
In the November 2015 survey, there were similar groupings for the Murray Mouth sites of Hunters
Creek and Ewe Island (sites 2 and 6), and particularly distinct environmental conditions for Monument
Road (site 1) (SM-Figure 13). The North Lagoon sites and South Lagoon sites had large site to site
variation and thus different habitat characteristics for those sites.

21
Water Sediment
Figure 8: PCA (Principal component analysis) with trajectories of change in water parameters (salinity and dissolved oxygen saturation, left column), and sediment parameters (grain size fractions and organic matter, right column), for each of the regions of the Murray Mouth, North and South Lagoon since monitoring began in 2004. PC1 and PC2 are the first two PCA axes.
Similar to recent years there was a shift in environmental conditions for water and sediment
characteristics in the Murray Mouth and Coorong compared to previous years (Figure 8). Trajectories
for the Murray Mouth and North Lagoon were similar to the 2013 year for water conditions, but may be
shifting back towards the sediment conditions recorded when monitoring began in 2004, particularly
for the Murray Mouth region (Figure 8). In the South Lagoon, trajectories for water and sediment
conditions may be heading back to conditions more similar to those recorded in the 2011 year (Figure
8).

22
4.2 Macroinvertebrate populations
This section of the report addresses whether the Condition Monitoring Target I-1: ‘Maintain or improve
invertebrate populations in mudflats’ has been met. Comparisons of benthic macroinvertebrate
populations are evaluated for diversity, abundance, distribution, biomass and community structure for
the November 2015 survey versus previous years since 2004 and when flows resumed in 2010/11.
Further evaluation and comparison of the four sites (sites 4 to 7) in the Murray Mouth and North
Lagoon between November 2015 and April 2016 are also reported. More specific details of the
findings from the November 2015 and April 2016 survey are presented in the supplementary material.
4.2.1 Macroinvertebrate species richness, diversity and distribution
The number of macroinvertebrate taxa totaled 24 in the November 2015 survey with the highest
number of species recorded in the Murray Mouth (18 species), followed by the North Lagoon (17
species) and the South Lagoon (3 species) (Table 2, Figure 9). Compared to the 2013 survey, species
numbers were similar in the Murray Mouth and higher in the North Lagoon (Figure 9). In comparison,
species numbers were much lower in the South Lagoon and comparable to some of the drought years
(Figure 9). Compared to previous years, at the site level species numbers were higher at all Murray
Mouth sites and Mulbin Yerrok (site 6) in the North Lagoon and similar to other years at Noonameena,
Parnka Point and Villa dei Yumpa (sites 7 to 9) (SM-Figure 14). The two most southern sites had no
species found during the November 2015 survey (SM-Figure14).
Figure 9: Total number of macroinvertebrate species by region in the Murray Mouth (MM), North (NL) and South (SL) Lagoons of the Coorong in all monitoring years since 2004.
The macroinvertebrate species found in November 2015 consisted mainly of molluscs (mostly
Hydrobiid snails) and annelids in the Murray Mouth, insects (Hexapoda) and crustaceans in the North
Lagoon and only one representative annelid, crustacean and insect species in the South Lagoon (SM-
figure 15). Compared to the November 2015 survey the number of molluscs species in April 2016

23
decreased at the two Murray Mouth sites (sites 4 and 5), while the number of insects species
increased slightly (SM-Figure 15). Between the November 2015 and April 2016 survey, the number of
crustacean and insect species decreased at both of the North Lagoon sites (sites 6 and 7) and the
number of annelids species decreased by a larger amount at Noonameena (site 7) (SM-Figure 15).
Overall, most of the molluscs and polychaetes found in the November 2015 survey were found within
the Murray Mouth and the northern sites of the North Lagoon (sites 1 to 7). During the November 2015
survey, there were large numbers of the snail Salinator fragilis on the surface of sediments at all
Murray Mouth sites, which were not wholly represented in the core samples (pers. obs.). Also, there
was a notable presence of Arthritica helmsi in the Murray Mouth and the northern sites of the Northern
Lagoon, and the deeper burrowing bivalve Soletellina alba at Ewe Island and Mulbin Yerrok (Site 4
and 6) (Table 2).
Table 2: Occurrence of macrobenthic taxa and species numbers during the spring 2015 (November) and autumn 2016 (April) surveys (see Figure 2 for site location). The number of taxa is also indicated per site and region. Sampling sites were: Site 1 = Monument Road; 2 = Hunters Creek; Site 3 = Mundoo Channel; Site 4 = Ewe Island; Site 5 = Pelican Point; Site 6 = Mulbin Yerrok; Site 7 = Noonameena; Site 8 = Parnka Point; Site 9 = Villa dei Yumpa; Site 10 = Jack Point and Site 11 = Loop Road. Ticks indicate presence records from the November survey and o presence records from the survey in April 2016 at four of the sites.
Diversity values (Shannon-Wiener index H’) were highest throughout the Murray Mouth region and at
the northern section of the North Lagoon (Mulbin Yerrok, site 6) and low at southern sites (site 7 to site
9) (Figure 10, SM-Tables 3, 4). Evenness values (J’) were highest at the more southern sites of the
Coorong at Parnka Point and Villa dei Yumpa (site 8 and 9) due to the lower number of species with
similar numbers of few individuals contributing to species diversity (Figure 10, SM-Table 4).
1 2 3 8 9 10 11
Nov Nov Nov Nov Apr Nov Apr Nov Apr Nov Apr Nov Nov Nov Nov
Annelida Oligochaeta o o o o
Polychaeta Capitella spp. o o o o
Simplisetia aequisetis o o o
Australonereis ehlersi o
Aglaophamus (Nephtys) australiensis o
Boccardiella limnicola o
Crustacea Amphipoda o o o o
Isopoda
Ostracoda
Mysidacea
Mollusca Bivalvia Arthritica helmsi o o o o
Soletellina alba o
Gastropoda Hydrobiidae sp. 2 o
Hydrobiidae sp. 3 o
Hydrobiidae sp. 4 o o o
Hydrobiidae sp. 5 o
Hydrobiidae sp. 6 o
Salinator fragilis o o o
Hexapoda Diptera Chironomidae (larvae or pupae) o o o o
Diptera (larvae or pupae) o o o o
Dolichopodidae (pupae) o o
Dytiscidae (larvae)
Staphylinidae
Scyomyzidae (larvae)
Total species number per site 11 14 14 15 14 13 12 11 10 11 7 4 3 0 0
Phyla/Class/Order Family/Genus/Species
North Lagoon South Lagoon
7654
Species number per region 20 19 3
Murray Mouth
24
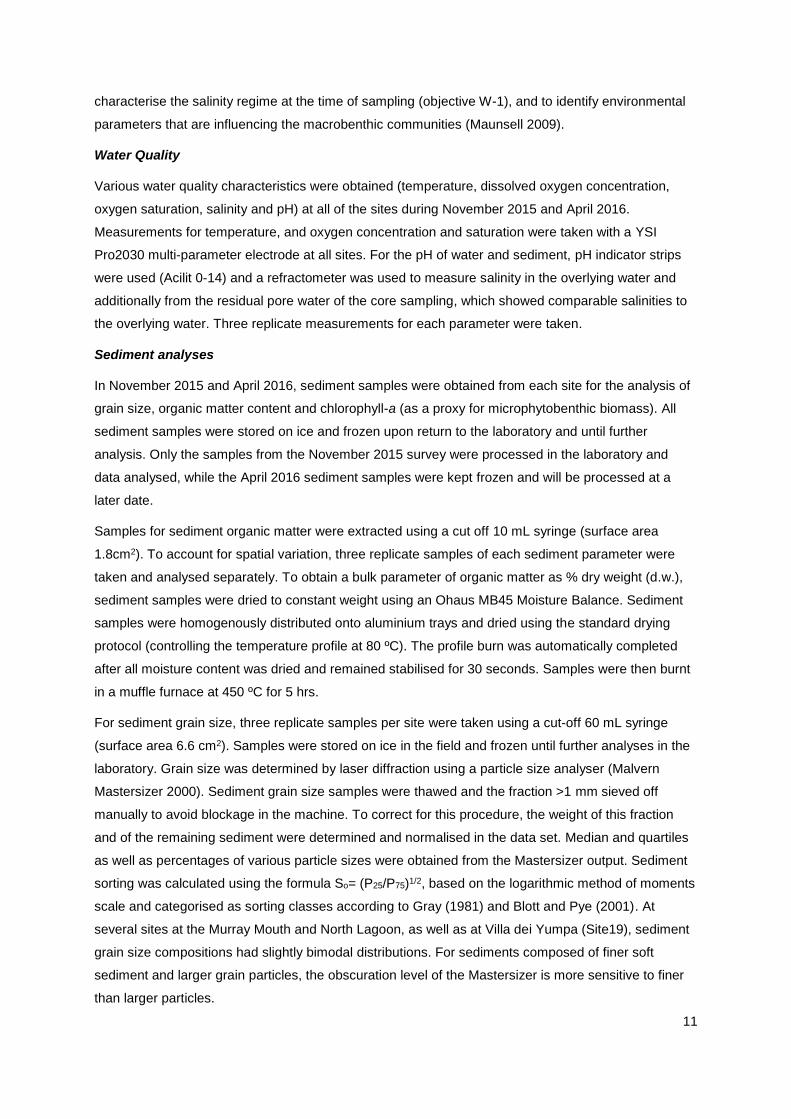
Throughout the Murray Mouth and northern sites of the North Lagoon, the evenness values at sites
were generally higher than the 2013/14 survey, indicating less dominance of particular species as
seen in previous years (Figure 10 & 11, SM-Table 4). Both species numbers and the diversity index H’
were significantly different between the three regions (SM-Table 5). Species numbers (S) and the
diversity index H’ varied significantly over all surveys and regions (SM-Table 5).
Compared to November 2015, two of the sites sampled in April 2016 (sites 5 and 7) increased in
diversity values and were influenced by higher contributions from a few species (site 5, oligochaetes
and Arthritica helmsi; site 7 by insect larvae) (Figure 10, SM-Tables 3, 4). The Ewe Island site (site 4)
was lower in species diversity and evenness in April 2016 versus November 2015, while Mulbin Yerrok
(site 6) was similar between surveys (Figure 10). Between the November 2015 and April 2016
surveys, species numbers and diversity values were not significantly different, but there was a
difference at the site level for diversity values (SM-Table 5).
Figure 10: Total number of macroinvertebrate species (red symbols), Shannon-Wiener diversity H’ (black bars, based on loge) and evenness J’ (white bars) at sites in the Murray Mouth (MM), North (NL) and South (SL) Lagoons of the Coorong in the (a) November 2015 and (b) April 2016 surveys. Only two of each sites were sampled in the Murray Mouth (sites 4 & 5) and North Lagoon (sites 6 & 7) during the April 2016 survey. See Figure 2 for site locations.
25
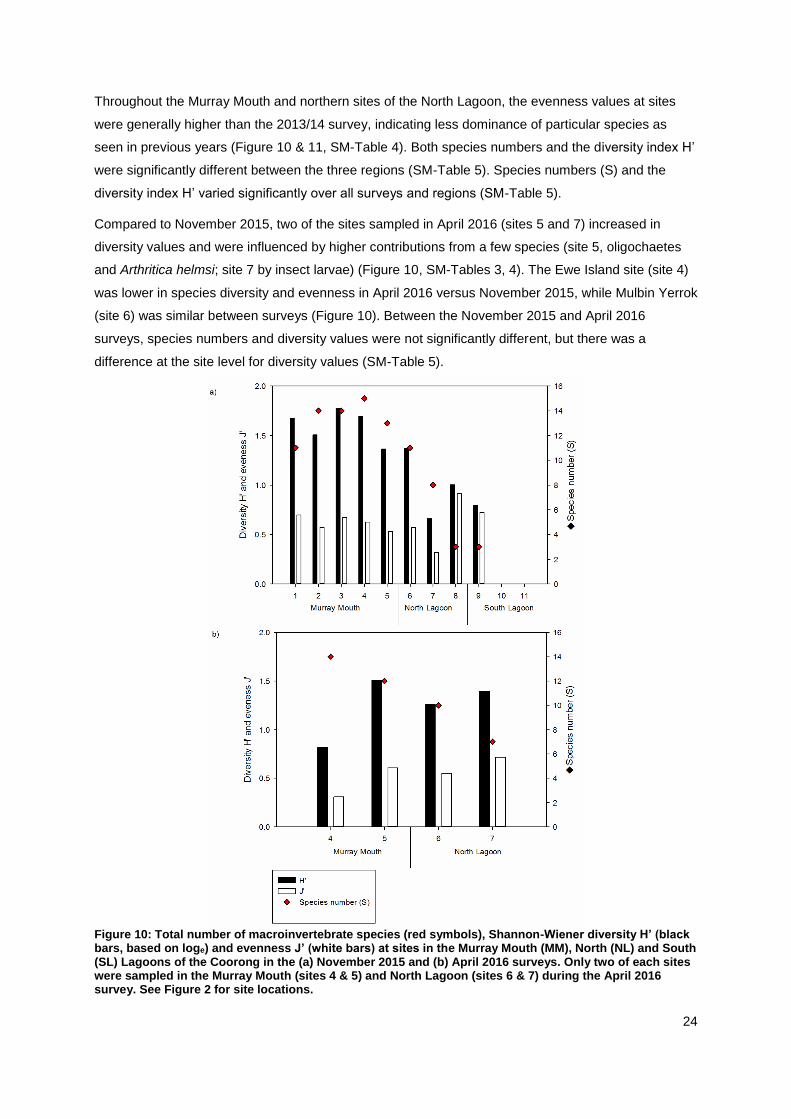
In November 2015, species numbers were mostly lower than the 2010-2013 restored flow period but
higher than the drought period from 2004-2009. Some exceptions were the reduced species numbers
below drought years at Monument Road (site 1), Parnka Point (site 8) and Villa dei Yumpa (site 9)
(Figure 11). Diversity values were mostly higher than all previous drought and restored flow years
Figure 11: Changes in diversity of benthic macroinvertebrates over time, illustrated by species numbers, Shannon-Wiener index H’ and Pielou’s evenness index J’ at sampling sites in the Murray Mouth and Coorong lagoons (see Figure 2 for site locations). Diversity from the sampling in November 2015 is shown against previous periods in the monitoring since 2004, divided into three year intervals of early drought/small flow (2004-2006), severe drought (2007-2009) and restored flow (2010-2013).

26
(2004-2013), except they were similar or lower than previous years at Parnka Point (site 8), and
Noonameena (site 7) and Villa dei Yumpa (site 9), respectively (Figure 11). Evenness values were
similar to or exceeded those of drought years (2004-2009) at most sites, except at Noonameena,
which was lower than during the drought (site 7) (Figure 11). Diversity and evenness values were both
similar to drought years (2004-2009) at Monument Road (site 1).
4.2.2 Macroinvertebrate abundances and distribution
During November 2015, the abundances of benthic macroinvertebrates were high throughout sites in
the Murray Mouth region and at one site in the North Lagoon at Mulbin Yerrok (site 6) (Figure 12). In
comparison, sites further south in the North Lagoon and South Lagoon had very low macroinverte-
brate abundances, with no specimens found at the most southern sites of Jack Point and Loop Road
(sites 10 and 11). Average abundances per region were three times higher in the Murray Mouth
versus the North Lagoon and extremely low in the South Lagoon (SM-Table 6). There were significant
differences in total abundances and most major phyla or separate taxa between regions and sites
within regions (SM-Table 7). Some exceptions were oligochaetes, Capitella spp., Nephtys
australiensis and Austalonereis ehlersi which were only significantly different at the site level (SM-
Table 7).
In April 2016 macroinvertebrate abundances were slightly higher at Ewe Island (site 4) and lower at
the other three sites (sites 5to 7) compared to the 2015 survey (Figure 12). Yet, there were only a few
significant differences for some of the phyla and separate taxa between the two surveys and regions
which were for gastropods, crustaceans, Capitella spp. and amphipods (SM-Table 7). The total
benthos, major phyla and most of the separate taxa were significantly different at the site level (SM-
Table 7).
Figure 12: Mean abundance (ind. m-2) and standard deviation (±S.D.) (n = 10) of benthic macrofauna recorded at sampling sites in the Murray Mouth and Coorong during the November 2015 survey (black bars); and at two of each sites in the Murray Mouth and North Lagoon during the April 2016 survey (blue bars).

27
Macroinvertebrate abundances in the Murray Mouth and Mulbin Yerrok (site 6) in the North Lagoon
were similar to or higher in some cases to previous years or periods of reintroduced flows (Figure 13,
SM-Figure 16). This was not the case for the more southern sites (sites 7 to 11) where total
abundances were lower compared to recent years and more similar to pre-flood years (Figure 13, SM-
figure 16). There is some fluctuation in macroinvertebrate abundances in recent years since flow
resumed at the Murray Mouth sites and Mulbin Yerrok (site 6), but there is a general trend of recovery
of the system for that particular region (Figure 13, SM-Figure 16). However, this does not apply to the
North Lagoon and the entire South Lagoon where macroinvertebrate abundances have declined in
November 2015 compared to recent years of returned flows (Figure 13, SM-Figure 16).
Figure 13: Mean abundances (ind. m-2) and standard deviation (±S.D.) (n = 10) of benthic macrofauna recorded at sampling sites in the Murray Mouth and northern section of the North Lagoon (top figure) and remaining Coorong (bottom figure) over the monitoring time frame since 2004, divided into periods of early drought/small flow (2004-2006), severe drought (2007-2009) and restored flow (2010-2013). Abundances from the current monitoring in 2015 are separately indicated with asterisks. Note the difference in y-axes scales.
28
Some macroinvertebrate populations also showed further signs of recovery in the Murray Mouth and
at Mulbin Yerrok (site 6) with a similar expanded range to what was found in the 2013/14 survey
(Dittmann et al. 2014). Macroinvertebrate abundances in the Murray Mouth and northern North
Lagoon are still largely being driven by high abundances of amphipods, chironomid larvae and
Simplisetia aequisetis (SM-Figure 17).The increase in abundances in Arthritica helmsi is now also
largely adding to the total benthos throughout the Murray Mouth and Mulbin Yerrok (site 6) region
(SM-Figure 17). Key species with indicator value (e.g. amphipods, C. capitata, S. aequisetis and
chironomid larvae) and functioning as an important food source for shorebirds and fish were common
again in the Murray Mouth and northern section of the North Lagoon.
Crustaceans mainly consisted of amphipods in November 2015 throughout the Murray Mouth and at
Mulbin Yerrok (site 6) in the North Lagoon (SM-Figure 17and 18). Amphipod abundances decreased
in November 2015 compared to the 2013/14 survey and was more comparable to previous years
when flows resumed (Figure 14, SM-Figure 19). In April 2016, amphipod abundances declined at Ewe
island and Pelican Point (sites 4 and 5) and were similar to the November 2015 survey at Mulbin
Yerrok and Noonameena (sites 5 and 6) (SM-Figure 17).
Annelids were abundant throughout the Murray Mouth and at Mulbin Yerrok (site 6) in the North
Lagoon (SM-Figure 18) and mainly consisted of Simplisetia aequisetis and Capitella spp. (SM-Figure
17). Abundances of Boccardiella limnicola also contributed to annelid numbers but they were mainly
restricted to the Murray Mouth sites (SM-Figure 17). Compared to 2013/14, Capitella spp. declined
slightly at some sites, but S. aequisetis abundances were similar to recent years (Figure 14). April
2016 versus November 2015 saw S. aequisetis abundances similar at Pelican Point and Mulbin
Yerrok (sites 5 and 6) but lower in abundance at Ewe Island (site 4) (SM-Figure 17). During April 2016,
abundances of Capitella spp. increased at Ewe Island (site 4) and oligochaetes increased with large
numbers at Ewe island and Pelican point (sites 4 and 5) (SM-Figure 17). Other polychaete species
such as Nephtys australiensis, which was rare in recent years (Figure 14), and Australonereis ehlersi
were found in November 2015 and April 2016 at one or two sites only (SM-Figure 17).
The reef building tubeworm Ficopomatus enigmaticus, was not quantitatively assessed using core
samples in the November 2015 survey, but live tube worms were found at Monument Road (site 1)
and Mundoo Channel (site 3).
Molluscs were dominated by the small bivalve Arthritica helmsi in November 2015 throughout the
Murray Mouth and at Mulbin Yerrok (site 6) in the North Lagoon (SM-Figures 17 and 18). After
declining in abundance during the drought years, A. helmsi has increased in abundance in recent
years and had some of the highest abundances in recent years for this species in November 2015 at
all sites where it was found (Figure 14). The larger-bodied and deeper burrowing bivalve Soletellina
alba was found at Ewe Island (site 4) and Mulbin Yerrok (site 6), but not in high abundances (SM-
Figure 17). Both A. helmsi and S. alba were lower in abundance at the sites where they found in April
2016 compared to November 2015 (SM-Figure 17). During November 2015, there were also large
29
numbers of grazing snails (Salinator fragilis) on the sediment surface at sites in the Murray Mouth but
they appeared to be lower in numbers by April 2016 (pers. obs.).
Insect larvae which mainly consisted of Chironomid larvae were found in high abundances throughout
sites in the Murray Mouth and less abundant throughout the North Lagoon and at the northern South
Lagoon site (SM-Figures 17 and 18). Chironomid larvae abundances have fluctuated over recent
years but they have been found in similar numbers in the current November 2015 survey and in
2013/14 (Figure 14, SM-Figure 19).
Total abundances, major macroinvertebrate phyla and single taxa were significantly different between
the 2004 to 2015 surveys, with exception of a few species (oligochaetes, N. australiensis and A.
ehlersi) (SM-Table 7).
The constancy index of key taxa is identified by the presence of each taxon at sites within the
November 2015 survey divided by all possible sites. The constancy value compared to previous
surveys as a historical baseline provides an understanding over the years of the occurrence of taxa
based on ranges of rare to very common or constantly present (Figure 15). Based on the occurrency
index, since the return of flows in 2010 there have been improvements in the occurrences of various
key taxa. Examples of this are where Capitella spp. went from not very common to common; S.
aequisetis from common to very common; amphipods from common to constant; A. helmsi from rare
to very common; and chironomid larvae have been constant (Figure 15).

30
Figure 14, continued

31
Figure 14. Mean abundances (ind. m-2) and standard deviation (± S.D.) (n = 10) of key species and taxa identified in the TLM condition monitoring plan (Maunsell 2009), recorded at sites around the Murray Mouth and Coorong since 2004. Note not all sites were sampled during each survey and the different scales of the y-axis.

32
Figure 15. Mean abundances (ind. m-2) and standard deviation (± S.D.) (n = 10) of key species and taxa identified in the TLM condition monitoring plan (Maunsell 2009), recorded at sites around the Murray Mouth and Coorong since 2004 (left hand column). The constancy index ranges are: <12% = rare; 13-24% = not very common; 25-49% = common; 50-74% = very common; 75-100% = constant. Note not all sites were sampled during each survey and the different scales of the y-axis.
all regions Capitella Simplisetia aequisetis Amphipoda Arthritica helmsi Chironomidae
2004 60 40 40 50 50
2005 80 70 100 50 60
2006 45 55 55 64 64
2007 45 55 27 36 36
2008 55 36 36 27 55
2009 55 18 27 9 55
2010 18 27 45 0 82
2011 55 45 100 0 100
2012 27 45 64 0 100
2013 45 64 91 55 100
2015 54 64 73 54 82
rare
not very common
common
very common
constant

33
Similar to recent years, there are fluctuations in macroinvertebrate abundances but there is a clear
pattern of recovery in the recent monitoring survey. There was still no clear uniform response to
changes in environmental conditions in the Murray Mouth and Coorong during November 2015.
Compared to previous years, there were still high abundances found within the salinity range
measured in November 2015 and abundances fit within the same range (Figure 16, SM-Figure 20).
Figure 16. Mean abundances (ind. m-2) of total macroinvertebrates, based on all records from the Murray Mouth and Coorong over the entire monitoring time span from 2004 to 2015, in relation to the salinity at the sites and time of sampling. Abundances from the monitoring in November 2015 are highlighted by red circles and the salinity range recorded in the study regions during this recent sampling indicated in bottom bars with colours from light blue (Murray Mouth, 3-10 ppt) to blue (North Lagoon ,20-96 ppt) and dark blue for the South Lagoon (78-90 ppt). See Figure 3 for changes in salinities over the monitoring periods. The vertical line indicates the salinity of seawater.
4.2.4 Macroinvertebrate biomass
Biomass corresponded with the higher abundances of macroinvertebrates throughout the Murray
Mouth and Mulbin Yerrok (site 6) in the North Lagoon (Figure 17). Average biomass was highly
variable within and between sites but significantly different for regions and sites nested within regions
(SM-Table 7). Compared to the November 2015 survey, macroinvertebrate biomass was lower but
highly variable at all of the four sites sampled in April 2016 and there was no significant difference
between surveys or regions (Figure 17, SM-Table 7).
The current survey in 2015 had higher biomass at Murray Mouth and northern North Lagoon sites
compared to recent years of restored flow (2010-2013) and severe drought years (2004-2006), and
were more comparable to pre-drought levels in some cases (Figure 18, SM-Figure 21). The more
southern sites in the North Lagoon and South Lagoon (sites 8 to 11) contributed very little to biomass,
with the lowest values in 2015 compared to the early drought (2004-2006), severe drought (2007-
2009) and restored flow periods (2010-2013) (Figure 18). Across all monitoring years, biomass was
significantly different between surveys, regions and sites nested within regions (SM-Table 7).

34
Figure 17: Mean biomass (g AFDW m-²) and standard deviation (± S.D.) (n = 10) of benthic macrofauna recorded at sampling sites during the November 2015 (sites 1 to 11; black bars) and April 2016 survey (sites 4 to 7 only; blue bars) survey.
Figure 18: Biomass of benthic macrofauna (g AFDW m-²) (mean and standard deviation, n=-10) at sites sampled in the Murray Mouth and northern section of the North Lagoon (top figure) and remaining Coorong (bottom figure) over the monitoring time frame since 2004, divided into periods of early drought/small flow (2004-2006), severe drought (2007-2009) and restored flow (2010-2013). Biomass from the current monitoring in November 2015 is indicated by the asterisks. Note the order of magnitude difference in the y-axes scales.

35
Overall, abundance and biomass in November 2015 was comparable to recent years in the Murray
Mouth and northern North Lagoon, indicating that there is still recovery of macroinvertebrate
populations in that particular section of the system. Based on those findings, there is food available for
shorebirds and fish in the northern section of the system (sites 1 to 6), but little food available in the
southern end of the North Lagoon and the entire South Lagoon (sites 7 to 11).
4.2.5 Macroinvertebrate communities
Benthic communities at the Murray Mouth sites clustered closely together, while Mulbin Yerrok (site 6)
and Noonameena (site 7) in the North Lagoon clustered loosely with some cross-over between those
two sites (Figure 19). Some samples from Parnka Point and Villa dei Yumpa (sites 8 and 9) had
similar macroinvertebrate communities, but most of the samples from those sites and the two most
southern sites (sites 10 and 11) clustered together due to the large number of zeros in the dataset
(Figure 19). In November 2015, macroinvertebrate communities were significantly different between
regions (Pseudo-F = 11.003, P(perm) = 0.0004) and sites nested in regions (Pseudo-F = 15.06, P(perm) =
0.0001). The most common characteristic species for the Murray Mouth sites (sites 1 to 5) were
Boccardiella limnicola, Simplisetia aequisetis and Arthritica helmsi (SM-Table 7, Figure 19). The
characteristic species for Mulbin Yerrok (site 6) were Capitella spp., S. aequisetis and A. helmsi, and
insect larvae were characteristic for mores southern sites (sites 7 to 9) (SM-Table 7, Figure 19).
Figure 19: Principal coordinate analysis (PCO) of macroinvertebrate data from the mudflat survey in November 2015, with the regions MM=Murray Mouth (sites 1 to 5), NL=North Lagoon (sites 6 to 8) and SL=South Lagoon (sites 9 to 11). The circle represents a vector overlay (Pearson correlation) illustrating the contribution of the respective species to the PCO axes.
-60 -40 -20 0 20 40
PCO1 (63.3% of total variation)
-20
0
20
40
60
80
PC
O2 (
18.4
% o
f to
tal va
riation)
Transform: Log(X+1)
Resemblance: S17 Bray-Curtis similarity (+d)
RegionMM
NL
SL
111
111111122
22222222
3
3
33
3
3
3
333
444444
4
444
555
5
55
5555
6
66
6
6
6
6
666
7
7
777
7
7
7
7
7
888888
8
88
89999
9
999
99
1010101010101010101011111111111111111111
Simplisetia aequisetis
Boccardiella limnicola
Arthritica helmsi
Dolichopodidae

36
Benthic communities showed some separation for the two Murray Mouth sites (sites 4 and 5) between
November 2015 and April 2016 (Figure 20). Mulbin Yerrok communities had some crossover between
the 2015 and 2016 surveys, while Noonameena loosely clustered away from other sites, but with large
overlap between surveys (Figure 20). There was a significant interaction between surveys and
regions, but most of the significant differences were at the site level within the 2015/16 surveys (SM-
Table 8). Characteristic species at Ewe Island and Pelican Point (sites 4 and 5) in the November 2015
survey were S. aequisetis and A. helmsi (Figure 20). Dolichopodidae larvae were most characteristic
of benthic communities at site 7 for both the 2015/16 surveys (Figure 20).
Figure 20: Principal coordinate analysis (PCO) of macroinvertebrate data from the mudflat survey in November 2015 and April 2016 at two of each sites within the Murray Mouth and North Lagoon regions (sites 4, 5, 6 and 7). The circle represents a vector overlay (Pearson correlation) illustrating the contribution of the respective species to the PCO axes.
Across all monitoring years, there were distinct regional differences in benthic communities with the
Murray Mouth distinct from each other. In comparison the North Lagoon was less distinct and crossed
over with the Murray Mouth and South Lagoon sites throughout the years (SM-Figure 22). The benthic
communities were significantly different between surveys, regions and sites nested within regions
(SM-Table 10).
A greater distinction between benthic communities of the three regions becomes apparent from
plotting the Global R value from a test statistic (Figure 21). When monitoring started in 2004 to 2006
the Murray Mouth region was distinct from the other two regions, as shown by a high R value (Figure
21). During the peak of the drought, benthic communities were more similar between all three
regions. The restored flows in 2010/11 promoted a shift to more distinct benthic communities between
regions, particularly between the Murray Mouth and the other two regions (Figure 21). In 2015, the
Murray Mouth was still distinct from the other two regions and even completely distinct from the South
37
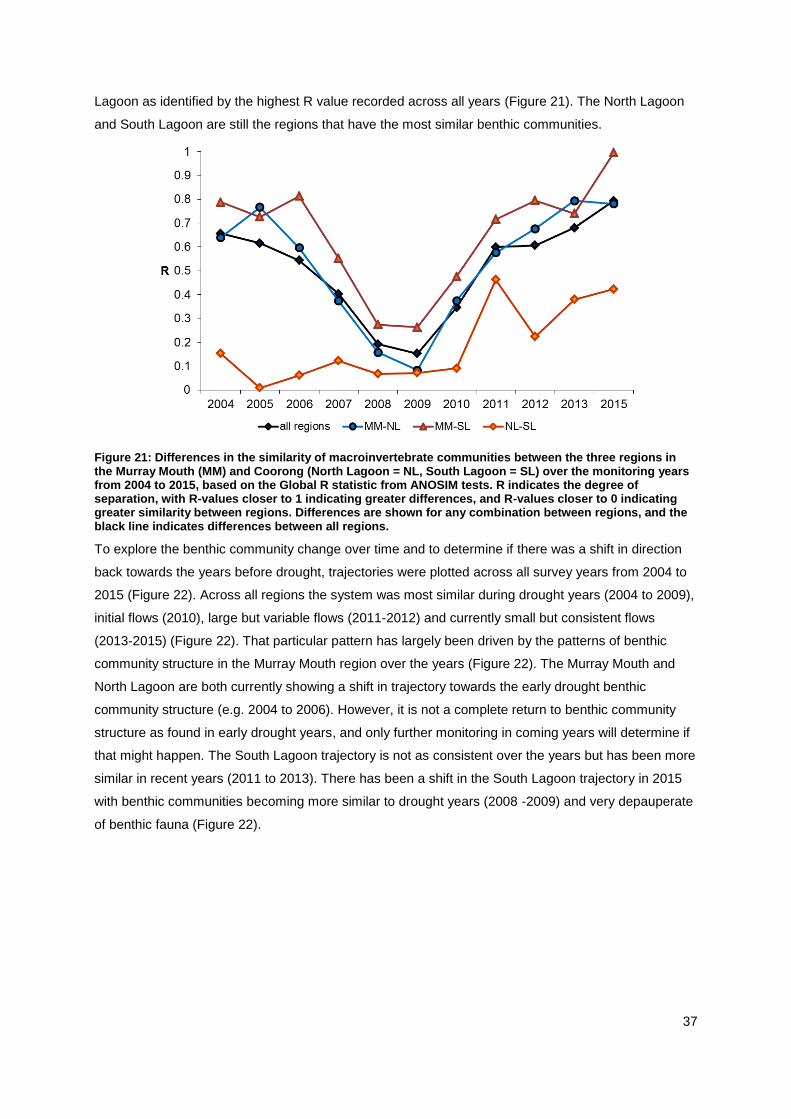
Lagoon as identified by the highest R value recorded across all years (Figure 21). The North Lagoon
and South Lagoon are still the regions that have the most similar benthic communities.
Figure 21: Differences in the similarity of macroinvertebrate communities between the three regions in the Murray Mouth (MM) and Coorong (North Lagoon = NL, South Lagoon = SL) over the monitoring years from 2004 to 2015, based on the Global R statistic from ANOSIM tests. R indicates the degree of separation, with R-values closer to 1 indicating greater differences, and R-values closer to 0 indicating greater similarity between regions. Differences are shown for any combination between regions, and the black line indicates differences between all regions.
To explore the benthic community change over time and to determine if there was a shift in direction
back towards the years before drought, trajectories were plotted across all survey years from 2004 to
2015 (Figure 22). Across all regions the system was most similar during drought years (2004 to 2009),
initial flows (2010), large but variable flows (2011-2012) and currently small but consistent flows
(2013-2015) (Figure 22). That particular pattern has largely been driven by the patterns of benthic
community structure in the Murray Mouth region over the years (Figure 22). The Murray Mouth and
North Lagoon are both currently showing a shift in trajectory towards the early drought benthic
community structure (e.g. 2004 to 2006). However, it is not a complete return to benthic community
structure as found in early drought years, and only further monitoring in coming years will determine if
that might happen. The South Lagoon trajectory is not as consistent over the years but has been more
similar in recent years (2011 to 2013). There has been a shift in the South Lagoon trajectory in 2015
with benthic communities becoming more similar to drought years (2008 -2009) and very depauperate
of benthic fauna (Figure 22).

38
Figure 22: nMDS ordination plots showing trajectories of change in macroinvertebrate communities in the mudflats from each of the regions of the Murray Mouth, North and South Lagoon, as well as for the entire Murray Mouth and Coorong, in the monitoring from 2004 to 2015. The lines are connecting consecutive years. The circles are delineating significantly different clusters, based on SIMPROF tests, showing 50 % (blue line) and 70% (red line) similarity for the Murray Mouth and Coorong, and clusters with 70% (purple line) similarity for the Murray Mouth.
4.2.6 Environmental conditions as predictor variables for macroinvertebrate communities
In 2015, the only environmental variable that contributed significantly to benthic community patterns in
the Murray Mouth and Coorong was salinity, which explained 51% of the variation in the macro-
invertebrate data. Overall 64% of the total variation in the macroinvertebrate community data was
explained by the set of considered water and sediment variables (Figure 23). All of the other
environmental parameters considered had no statistically significant contribution (e.g. sediment
organic matter, sediment Chl-a, sediment grain size, sorting or dissolved oxygen saturation). The
range of environmental parameters that were contributing to differences in benthic communities,
particularly between the Murray Mouth and North Lagoon sites versus the more southern sites (sites 8
to 11) was mainly driven by salinity (Figure 23).

39
Figure 23: dbRDA (distance based redundancy analysis) illustrating relationships between environmental parameters and the benthic community at the study sites in November 2015. The vector overlay uses base variables of environmental data. The site codes are 1 to 5 for the Murray Mouth, 6 to 8 for the North Lagoon, and 9 to 11 for the South Lagoon (see Figure 2).
Throughout the survey years (2004 to 2015), salinity was the main environmental parameter attributed
to changes in benthic communities which explained between 9 % and 23 % of the data (SM-Table 11).
Other environmental variables contributed less than 10 % during the 2004 to 2015 survey period. If the
survey period from 2007 to 2015 is taken into account when Chlorophyll-a was included, then
sediment sorting (Murray Mouth, 12 %; South Lagoon 12 %), organic matter (North Lagoon, 15 %)
and Chlorophyll-a (North Lagoon, 11 %; South Lagoon, 12 %) also contributed to benthic community
patterns on a regional level (SM-Table 11).
The dbRDA plots for environmental conditions and benthic communities there is a separation between
drought and resumed flow years, which is less distinct for the North Lagoon (Figure 24). Some of
those distinctions in the Murray Mouth and North Lagoon are clearer in the 2007-2015 dataset when
Chlorophyll-a was included (SM-Figure 23). In the South Lagoon the recent resumed flow years were
separate to previous drought years, but the 2015 data are more similar to the early drought years
(Figure 24).
Across the years from 2004 to 2015, all five variables explained only 20-30 % of the variation in the
Murray Mouth and Coorong (Figure 24). In the years from 2007 to 2015 when Chlorophyll-a was
added, the environmental variables explained 32-39 % of the variation across the regions (SM-Figure
23). There may be other environmental or biotic factors that were not assessed across the survey
years that must be affecting the benthic communities throughout the Murray Mouth and Coorong.
-60 -40 -20 0 20 40
dbRDA1 (71.8% of fitted, 52.2% of total variation)
-40
-20
0
20
40
dbR
DA
2 (
16.6
% o
f fit
ted, 12.1
% o
f to
tal v
ariatio
n)
Transform: Log(X+1)
Resemblance: S17 Bray-Curtis similarity (+d)
RegionMM
NL
SL
1
2
3
4
5
67
8
9
10
11Salinity
DO
OM
Grain size
Sorting
Chl-a

40
Figure 24: dbRDA (distance based redundancy analysis) plots for the three separate regions Murray Mouth, North and South Lagoon of the Coorong, illustrating relationships between environmental parameters and the benthic community at the study sites in the surveys from December 2004 to November 2015. The vector overlay uses base variables of environmental data that explain the patterns in macroinvertebrate communities.

41
Current assessment of the benthic macroinvertebrate populations throughout the Murray Mouth and
Coorong in the recent survey, and in comparison to the previous surveys since 2004, complies with
the condition monitoring target I-1 ‘Maintain or improve invertebrate populations in mudflats’. There
are still signs of recovery in macroinvertebrate populations since flow returned in 2010/11. It appears
that macroinvertebrate communities may be shifting back to early drought conditions in the 2015
survey for the Murray Mouth and Mulbin Yerrok (site 6) in the North Lagoon only, but this requires
further assessment over the coming years to determine if that will be reached.
42
6. Discussion
The findings of the 2015/16 macroinvertebrate monitoring are discussed below against the condition
monitoring objectives for ‘The Living Murray’ program (Maunsell 2009).
6.1 Macroinvertebrate populations
I-1 – ‘Maintain or improve invertebrate populations in mudflats’
Over the previous 11 years of monitoring from 2004 to 2015/16, macroinvertebrate populations have
become re-established in the Murray Mouth and northern North Lagoon, but are now very depleted in
the southern Coorong. There are signs of macroinvertebrate populations shifting back towards pre-
drought conditions according to the data obtained since 2004, but that would require further
assessment in coming years. However, without historic baselines for comparison it is difficult to
determine how comparable future macroinvertebrate populations might be to pre-drought years.
Since the flows resumed into the Murray Mouth and Coorong in 2010/11 after the Millennium Drought
(Leblanc et al. 2012), there has been slow recovery of the system. The slow response may be
attributed to an unnatural disturbance history, which is known to have lasting effects on estuarine
systems where cumulative disturbances such as climate, eutrophication and pollution may impact the
resilience of macroinvertebrates to stressors (Kennish 2002, Dolbeth 2007, Neto et al. 2010, Dolbeth
et al. 2011, Grilo et al. 2011). The current survey revealed that macroinvertebrate populations were
continuing to recover in the Murray Mouth and northern North Lagoon (restricted to Mulbin Yerrok, site
6), but were declining again in the southern Coorong. Combination of factors may have influenced the
reduction of macroinvertebrates in the southern Coorong. Flows through the barrages throughout the
2015/16 survey period were consistent yet lower than previous years, particularly over the 2015/16
summer. Also, the shallow waters of the Coorong, particularly in the southern region, were subjected
to the record breaking average high air temperatures in Australia over the 2015/16 spring/summer
(NOAA 2016). Those warmer, low-flow conditions were favourable for the rapid growth of dense
filamentous green algae observed throughout the shallow subtidal region of the southern Murray
Mouth barrages in November 2015 and April 2016.
The initial increase in dominant macroinvertebrate taxa soon after flows resumed in 2010/11 (e.g.
amphipods and chironomids) has been followed by a slow increase in benthic community complexity
(e.g. multiple polychaete and mollusc species) in the Murray Mouth and northern North Lagoon. The
high abundances of amphipods during the period when flow resumed in 2010/11 may be due to their
high reproductive output and the more favourable hydrodynamic and organic loading conditions
available (Ford et al. 2001). The polychaete Simplisetia aequisetis was still persistant throughout the
Murray Mouth and northern sites of the North Lagoon in the current survey. That particular species
and other Nereididae have the advantage of flexibility in early life history, where they can switch
between pelagic or benthic larvae depending on current estuarine conditions (Sato 1999). Capitella
spp. were lower in abundance, but their range expanded to more sites in the Murray Mouth in the
current survey. This group of worms are an indicator species for eutrophication and pollution (Grassle

43
and Grassle 1976), but it is too early to determine if their range expansion is a reflection of declining
environmental conditions which should be investigated further in future monitoring surveys.
Bivalves and gastropods persisted during the current survey, with the substantial increase in numbers
of Arthritica helmsi throught the Murray Mouth and northern section of the North Lagoon. This species
was dominant in the Murray Mouth region historically (Wells and Threlfall 1981) and in the early years
of the monitoring surveys. The brooding rather than pelagic larvae reproductive mode of A. helmsi
may account for the slow recolonisation and rarity of this species in recent years since flows resumed
in 2010/11 (Wells and Threlfall 1982)..
Responses by specific species to drought and freshwater releases require further investigation into the
life history strategies and other biological traits. Biological traits for the Murray Mouth and Coorong
have been investigated in another project that assessed the response of benthic macroinvertebrates
to water release from 2010 to 2015 (Dittmann et al. 2016). Since the water release in 2010/11 life
history strategies have shifted from small-bodied, short-lived, benthic larve to large-bodied, long-lived,
pelagic larvae and more diverse biological traits (Dittmann et al. 2016). However, further investigations
should focus on life history strategies and specific tolerances to changing conditions for key taxa to
better understand recolonisation of the Murray Mouth and Coorong as investigated in other regions
(Cañedo-Argüelles and Rieradevall 2010, 2011, Dunlop et al. 2008).
Recolonisation of benthic macroinvertebrates can be affected by sediment properties (Pearson and
Rosenberg 1978, Kanaya 2014). Succession of diverse macroinvertebrate taxa into sediments can be
facilitated by the sedimentary bioturbation of early colonisers (Snelgrove and Butman 1994,
Rosenberg 2001). Bioturbation of sediments through the building of burrows or tubes is undertaken by
various taxa including chironomids, oligochaetes, amphipods and polychaetes (Nogaro et al. 2006,
O’Brien et al. 2009). The depth of bioturbation can improve sediment conditions by oxygenating the
sediment and reducing the anoxic layer, which is currently seen at several sites in the Murray Mouth
and Mulbin Yerrok in the North Lagoon. Since 2010 there has been a shift from dominant species with
only shallow burrowing capabilities (e.g. amphipods) to species that have larger bodies and deeper
burrowing characteristics (S.aequisetis and Soletellina alba) (Dittmann et al. 2016), which was also
observed in the current 2015/16 survey.
The abundances and biomass of macroinvertebrate taxa was higher in the November 2015 survey
and comparable to recent years for many species in the Murray Mouth and North Lagoon. However,
there was a decrease in abundance and biomass of macroinvertebrates at some sites in the Murray
Mouth and North Lagoon during the April 2016 survey. At Ewe Island, the exposed intertidal
sediments were very disturbed across the entire site with large pits, possibly created by foraging birds.
Previous monitoring in the Murray Mouth and Coorong has identified similar decreases in abundances
that could be related to bird foraging (Dittmann et al. 2014). However it cannot be fully determined if
the macrobenthos was affected by bird foraging or environmental influences without further
investigation in the future, before and after the overwintering period of migratory shorebirds.

44
The current survey has documented further improvements of benthic macroinvertebrate populations,
however this is restricted to the Murray Mouth and the most northern site in the North Lagoon at
Mulbin Yerrok (site 6). Other sites in the southern region of the North Lagoon and more so at all sites
in the South Lagoon, macroinvertebrate communities are either scarce or completely depauperate.
Therefore the condition monitoring target I-1 – ‘Maintain or improve invertebrate populations in
mudflats’ has only been met in the most northern section of the Murray Mouth and Coorong. Further
improvement of habitat conditions is essential for recolonisation of more diverse macroinvertebrate
taxa back into the sediments in the southern North Lagoon and the entire South Lagoon of the
Coorong.
6.2 Habitat conditions
M-1 – ‘Facilitate frequent changes in exposure and submergence of mudflats’; M-2 – ‘Maintain
sediment size range in mudflats’, M-3 – ‘Maintain organic content for mudflats’ and W-1 – ‘Assessment
of estuarine conditions between Goolwa Barrage and Pelican Point’
Macroinvertebrates in the Murray Mouth and Coorong are mainly influenced by environmental
conditions such as exposure and submergence, organic content, sediment and water conditions,
similar to other estuarine environments elsewhere (Gimenez et al. 2006, Correia et al. 2012,
Rodrigues et al. 2012). The more frequent patterns of exposure and submergence with increased flow
conditions and opening of the Murray Mouth have provided more estuarine conditions. Sediment
conditions have changed slightly for the better in recent years, including the current survey and are
still well within normal ranges across the monitoring surveys.
6.3 Intervention monitoring
Although the sampling for the intervention monitoring in April 2016 occurred at four sites only at the
interface of the Murray Mouth and North Lagoon, it gave information on the contraction and expansion
of distribution ranges of macroinvertebrate species. Changes in distribution ranges can be assessed
based on a comparison of species occurrence at sites in April versus their occurrence in November
2015 and previous monitoring. Yet an index for constancy in distribution could not be calculated as it
would have required all 11 sites. In April, Arthritica helmsi, Boccardiella limnicola and Salinator fragilis
were found at Noonameena and Mulbin Yerrok in the North Lagoon where they were not recorded in
November 2015, and where they had rarely been found in the past. These findings indicate extended
distribution ranges of some estuarine/marine macroinvertebrates into the North Lagoon. However, B.
limnicola, and some other species which occur in low numbers (Australonereis ehlersi, Soletellina
alba), were missing in the April samples from some sites where they had been found in November.
Most other species were recorded in November and April at the four sites sampled on both surveys,
thus no further spatial contraction in distribution was detected.
The April survey found significantly lower abundances for several macroinvertebrate species (e.g.
Simplisetia aequisetis, A. helmsi, B. limnicola, amphipods and chironomids), and this further decline in
abundance occurred mostly at Ewe Island and Pelican Point. Causes for a decline in abundances over
summer could result from foraging by shorebirds and fish (Salem et al. 2014, Earl 2014, Souza et al.
45
2015). However, reduced flow in combination with unusually high temperatures as seen in summer
2015/16 and higher salinity in the Murray Mouth could also contribute to reduced individual numbers
(Jones, 1987; Lucero et al. 2006, Meerhoff et al 2013).
Abundances of Oligochaeta had significantly increased in April at three of the four sites (Ewe Island,
Pelican Point and Mulbin Yerrok) and Capitella capitata occurred in higher densities at Ewe Island as
well, yet with lower density at Noonameena. Shorebirds have been found to selectively avoid
oligochaetes, which could explain their higher abundance at the end of the over-wintering season
(Smith et al. 2012). Yet, both oligochaetes and capitellid polychaetes respond positively to organic
matter load in sediments (Tsutsumi 1990, Attrill et al. 2009, Coelho et al. 2015), which can give an
indication to further environmental changes in sediments that could have contributed to the decline in
abundance of macroinvertebrate species less tolerant to organic matter load.
Corresponding with the decreased abundances of macrofauna in April, biomass was lower than in
November at all of the four sites surveyed. Similar seasonal reductions in biomass over summer have
been recorded in other estuaries (Kalejta and Hockey 1991). The lower biomass could be a result of
prey depletion from foraging shorebirds or changing environmental conditions, as discussed above.
However, reduction in prey biomass in late summer could affect shorebirds still needing to build up
energy reserves for their return flight to the breeding grounds in the northern hemisphere (Schneider
and Harrington, 1981, Goss-Custard, 1984).
6.4 Conclusion
The condition monitoring of benthic macroinvertebrates has assessed the long-term effects of
prolonged drought and subsequent restoration of flows in the Murray Mouth and Coorong from 2010 to
2015/16. Through time populations have slowly recovered but only in the Murray Mouth and northern
section of the North Lagoon. In comparison, the southern section of the North Lagoon and the entire
South Lagoon is scarcely populated by macroinvertebrates where they are in fact non-existent at the
most southern South Lagoon sites. Macroinvertebrate communities appear to be following a trajectory
back towards pre-drought conditions but that is difficult to determine without further sampling into the
future. Therefore, TLM icon site objective for maintaining or improving macroinvertebrate populations
has only partially been met and is restricted to the Murray Mouth and northern section of the North
Lagoon. The TLM icon site objective for habitat conditions have been partially met with sediment
conditions improving throughout the Murray Mouth and northern North Lagoon in the Coorong. The
“facilitation of frequent changes in exposure and submergence of mudflats” is less defined, particularly
during the hotter summer months during 2015/16 where flow was reduced altogether for some time
which requires further investigation of possible impacts to benthic habitat conditions during such warm
summer events.

46
7. Acknowledgements:
This project was funded by The Living Murray initiative of the Murray–Darling Basin Authority. The
Living Murray is a joint initiative funded by the New South Wales, Victorian, South Australian,
Australian Capital Territory and Commonwealth governments, coordinated by the Murray–Darling
Basin Authority. The project has been managed by the South Australian Department of Environment,
Water and Natural Resources through the Lower Lakes, Coorong and Murray Mouth Icon Site staff,
Adrienne Rumbelow, Kirsty Wedge and Rebecca Turner. We acknowledge the ongoing support for
this monitoring and the discussions with the icon site staff. For the field and laboratory work, helping
hands were provided by René Campbell, Hayley Jessup-Case, Rhys Johnson and Shannyn Moyle.
Their assistance in collecting, sorting and identifying samples is greatly appreciated.
8. References
Anderson, M.J., R.N. Gorley, K.R. Clarke. 2008. PERMANOVA+ for PRIMER: Guide to software and statistical methods. PRIMER E Ltd. Plymouth, UK.
Attrill, M.J., S.D. Rundle, A. Fraser, M. Power. 2009. Oligochaetes as a possible entry route for terrigenous organic carbon into estuarine benthic food webs. Marine Ecology Progress Series 384:147-157.
Blott, S.J. and K. Pye. 2001. Gradistat: A grain size distribution and statistics package for the analysis of unconsolidated sediments. Earth Surface Processes and Landforms 26, 1237-1248.
Borja, A., D. M. Dauer, M. Elliott, and C. A. Simenstad. 2010. Medium- and long-term recovery of estuarine and coastal ecosystems: patterns, rates and restoration effectiveness. Estuaries and Coasts 33:1249-1260.
Botto, F., O.O. Iribarne and M.M. Martinez. 1998. The effect of migratory shorebirdson the benthic species of three southwestern Atlantic Argentinean estuaries. Estuaries 21: 700-709.
Cañedo-Argüelles, M. and M. Rieradevall. 2010. Disturbance caused by freshwater releases of different magnitude on the aquatic macroinvertebrate communities of two coastal lagoons. Estuarine, Coastal and Shelf Science 88:190-198.
Cañedo-Argüelles, M. and M. Rieradevall. 2011. Early succession of the macroinvertebrate community in a shallow lake: Response to changes in the habitat condition. Limnologica - Ecology and Management of Inland Waters 41:363-370.
Cardoso, P.G., M. Bankovic, D. Raffaelli and M.A. Pardal. 2007. Polychaete assemblages as indicators of habitat rcovery in a temperate estuary under eutrophication. Estuarine, Coastal and Shelf Science 71: 301-308.
Coelho, S., A. Pérez-Ruzafa, S. Gamito. 2015. Effects of organic pollution and physical stress on benthic macroinvertebrate communities from two intermittently closed and open coastal lagoons (ICOLLs). Estuarine, Coastal and Shelf Science 167:276-285.
Correia, M. J., J. L. Costa, P. Chainho, P. M. Félix, M. L. Chaves, J. P. Medeiros, G. Silva, C. Azeda, P. Tavares, A. Costa, A. M. Costa, J. Bernardo, H. N. Cabral, M. J. Costa, and L. Cancela da Fonseca. 2012. Inter-annual variations of macrobenthic communities over three decades in a land-locked coastal lagoon (Santo André, SW Portugal). Estuarine, Coastal and Shelf Science 110:168-175.
Covich, A.P., M.C. Austen, F. Barlocher, E. Chauvet, B.J. Cardinale, C.L. Biles, P. Inchausti, O. Dangles, M. Solan, M.O. Gessner, B. Statzner and B. Moss. 2004. The role of biodiversity in the functioning of freshwater and marine benthic ecosystems. Bioscience 54: 767-775.
Dittmann, S., E. Brown, N. Navong, K. Beyer, L. Silvester, S. Baggalley, and J. Keuning. 2012. Macrobenthic invertebrate survey 2011-12: Lower Lakes, Coorong and Murray Mouth Icon Site. Report for the Department for Water and Murray-Darling Basin Authority. Flinders University of South Australia.

47
Dittmann, S., T. Ramsdale, N. Navong, C. Cummings, S. Baggalley, and J. Keuning. 2013a. Benthic macroinvertebrate survey 2012-13: Lower Lakes, Coorong and Murray Mouth Icon Site. Report for the Department of Environment, Water and Natural Resorces and the Murray-Darling Basin Authority. Flinders University of South Australia.
Dittmann, S., T. Ramsdale, J. Keuning, N. Navong, and S. Baggalley. 2013b. Benthic Macroinvertebrate Response Monitoring in the Coorong and Murray Mouth, 2012/13. Report for the Department of Environment, Water and Natural Resources, Adelaide.
Dittmann, S., T. Ramsdale, N. Navong, and A. McGuire. 2014: Benthic Macroinvertebrate Response Monitoring in the Coorong and Murray Mouth, 2013/14. Report for the Department of Environment, Water and Natural Resources, Adelaide.
Dittmann, S., R. Baring, and T. Ramsdale. 2016: Macroinvertebrate monitoring, analysis and synthesis for Coorong and Murray Mouth locations, Final report and response on Key Monitoring Questions. Report for the Department of Environment, Water and Natural Resources, Adelaide.
Dolbeth, M., P. G. Cardoso, S. M. Ferreira, T. Verdelhos, D. Raffaelli, and M. A. Pardal. 2007. Anthropogenic and natural disturbance effects on a macrobenthic estuarine community over a 10-year period. Marine Pollution Bulletin 54:576-585.
Dolbeth, M., P. G. Cardoso, T. F. Grilo, M. D. Bordalo, D. Raffaelli, and M. A. Pardal. 2011. Long-term changes in the production by estuarine macrobenthos affected by multiple stressors. Estuarine, Coastal and Shelf Science 92:10-18.
Dunlop, J. E., N. Horrigan, G. McGregor, B. J. Kefford, S. Choy, and R. Prasad. 2008. Effect of spatial variation on salinity tolerance of macroinvertebrates in Eastern Australia and implications for ecosystem protection trigger values. Environmental Pollution 151:621-630.
Earl, J. 2014. Population biology and ecology of the greenback flounder (Rhombosolea tapirina) in the Coorong estuary, South Australia. Flinders University, pp. 155.
Ford, R. B., S. F. Thrush, and P. K. Probert. 2001. The interacting effect of hydrodynamics and organic matter on colonization: A soft-sediment example. Estuarine, Coastal and Shelf Science 52:705-714.
Giménez, L., C. Dimitriadis, A. Carranza, A. I. Borthagaray, and M. Rodríguez. 2006. Unravelling the complex structure of a benthic community: A multiscale-multianalytical approach to an estuarine sandflat. Estuarine, Coastal and Shelf Science 68:462-472.
Goss-Custard, J.D. 1984. Intake rates and food supply in migrating and wintering shorebirds. In: Burger, J., Olla, B.L. (Eds.), Shorebirds: migration and foraging behaviour. Plenum Publishing, New York, pp. 233-271.
Grassle, J. F. and J. P. Grassle. 1976. Sibling species in the marine pollution indicator Capitella (Polychaeta). Science 192:567-569.
Grilo, T. F., P. G. Cardoso, M. Dolbeth, M. D. Bordalo, and M. A. Pardal. 2011. Effects of extreme climate events on the macrobenthic communities' structure and functioning of a temperate estuary. Marine Pollution Bulletin 62:303-311.
Jones, A.R. 1987. Temporal patterns in the macrobenthic communities of the Hawkesbury estuary, New South Wales. Marine and Freshwater Research 38:607-624.
Kalejta, B. and P.A.R. Hockey. 1991. Distribution, abundance and productivity of benthic invertebrates at the Berg River estuary, South Africa. Estuarine, Coastal and Shelf Science 33:175-191.
Kanaya, G. 2014. Recolonization of macrozoobenthos on defaunated sediments in a hypertrophic brackish lagoon: effects of sulfide removal and sediment grain size. Marine Environmental Research 95:81-88.
Kennish, M. J. 2002. Environmental threats and environmental future of estuaries. Environmental Conservation 29:78-107.
Kingsford, R. T., K. F. Walker, R. E. Lester, W. J. Young, P. G. Fairweather, J. Sammut, and M. Geddes. 2011. A Ramsar wetland in crisis - the Coorong, Lower Lakes and Murray Mouth, Australia. Marine and Freshwater Research 62:255-265.
Leblanc, M., S. Tweed, A. van Dijk, and B. Timbal. 2012. A review of historic and future hydrological changes in the Murray-Darling Basin. Global and Planetary Change 80-81:226-246.
48
Lucero R, C.H., Cantera K, J.R. and I.C. Romero. 2006. Variability of macrobenthic assemblages under abnormal climatic conditions in a small scale tropical estuary. Estuarine, Coastal and Shelf Science 68:17-26.
Maunsell 2009. Lower Lakes, Coorong and Murray Mouth Icon Site Condition Monitoring Plan. South Australian Murray-Darling Basin Natural Resources Management Board, Adelaide.
Meerhoff, E., L. Rodríguez-Gallego, L. Giménez, P. Muniz and D. Conde. 2013. Spatial patterns of macrofaunal community structure in coastal lagoons of Uruguay. Marine Ecology Progress Series 492:97-110.
Neto, J. M., H. Teixeira, J. Patrício, A. Baeta, H. Veríssimo, R. Pinto, and J. C. Marques. 2010. The Response of Estuarine Macrobenthic Communities to Natural- and Human-Induced Changes: Dynamics and Ecological Quality. Estuaries and Coasts 33:1327-1339.
NOAA National Centers for Environmental Information. 2016. State of the Climate: Global Analysis for March 2016, accessed June 8, 2016,http://www.ncdc.noaa.gov/sotc/global/201603.
Nogaro, G., F. Mermillod-Blondin, F. FranÇOis- Carcaillet, J.-P. Gaudet, M. Lafont, and J. Gibert. 2006. Invertebrate bioturbation can reduce the clogging of sediment: an experimental study using infiltration sediment columns. Freshwater Biology 51:1458-1473.
O'Brien, A. L., N. Volkenborn, J. van Beusekom, L. Morris, and M. J. Keough. 2009. Interactive effects of porewater nutrient enrichment, bioturbation and sediment characteristics on benthic assemblages in sandy sediments. Journal of Experimental Marine Biology and Ecology 371:51-59.
Paton, D. C., D. J. Rogers, B. M. Hill, C. P. Bailey, and M. Ziembicki. 2009. Temporal changes to spatially stratified waterbird communities of the Coorong, South Australia: implications for the management of heterogenous wetlands. Animal Conservation 12:408-417.
Rodrigues, A. M., V. Quintino, F. Pereira, and R. Freitas. 2012. Alterations in macroinvertebrate spatial patterns in coastal lagoons: Óbidos (NW coast of Portugal) 1984 versus 2002. Estuarine, Coastal and Shelf Science 110:176-189.
Rosenberg, R. 2001. Marine benthic faunal successional stages and related sedimentary activity. Scientia Marina 65:107-119.
Salem, M.V.A., M. van der Geest, T. Piersma, Y. Saoud, J.A. van Gils, 2014. Seasonal changes in mollusc abundance in a tropical intertidal ecosystem, Banc d'Arguin (Mauritania): Testing the 'depletion by shorebirds' hypothesis. Estuarine, Coastal and Shelf Science 136:26-34.
Sato, M. 1999. Divergence of reproductive and developmental characteristics in Hediste (Polychaeta: Nereidae). Hydrobiologia 402:129-143.
Schneider, D.C. and B.A. Harrington. 1981. Timing of shorebird migration in relation to prey depletion. Auk 98:801-811.
Seuront, L. and C. Leterme. 2006. Microscale patchiness in microphytobenthos distributions: evidence for a critical state. Pages 165-183 in J. C. Kronkamp, J. F. C. de Brouwer, G. F. Blanchard, R. M. Forster, and V. Creach, editors. Functioning of Microphytobenthos in Estuaries. The Academy of Arts and Sciences, Amsterdam/The University of Chicago Press, Chicago.
Smith, R.V., J.D. Stafford, A.P. Yetter, M.M. Horath, C.S. Hine, J.P. Hoover, 2012. Foraging ecology of fall-migrating shorebirds in the Illinois River valley. PLOS ONE 7(9), e45121.
Snelgrove, P. V. R. and C. A. Butman. 1994. Animal-sediment relationships revisited: cause versus effect. Oceanography and Marine Biology: An Annual Review 32:111-177.
Souza, A.T., E. Dias, J.C. Marques, C. Antunes, I. Martins. 2015. Population structure, production and feeding habit of the sand goby Pomatoschistus minutus (Actinopterygii: Gobiidae) in the Minho estuary (NW Iberian Peninsula). Environ Biol Fish 98:287-300.
Tsutsumi, H. 1990. Population persistence of Capitella sp. (Polychaeta; Capitellidae) on a mud flat subject to environmental disturbance by organic enrichment. Marine Ecology Progress Series 63:147-156.
Wainwright, P. and M. Christie. 2008. Wader surveys at the Coorong and S.E. coastal lakes, South Australia, February 2008. The Stilt 54:31-47.
Wells, F. E. and T. J. Threlfall. 1981. Molluscs of the Peel-Harvey estuarine system, with a comparison with other south-western Australian estuaries. Journal of the Malacological Society of Australia 5:101-111.

49
Wells, F. E. and T. J. Threfall. 1982. Reproductive strategies of Hydrococcus brazieri (Tenison Woods, 1876) and Arthritica semen (Menke, 1843) in Peel Inlet, Western Australia. Journal of the Malacological Society of Australia 5:157-166.
Wildsmith, M. D., T. H. Rose, I. C. Potter, R. M. Warwick, and K. R. Clarke. 2011. Benthic macroinvertebrates as indicators of environmental deterioration in a large microtidal estuary. Marine Pollution Bulletin 62:525-538.