Bennett's Dump 2013 Pump Test Results - semspub.epa.gov · flow meters and valves for flow rate...
30
2013 PUMP TEST RESULTS Bennett's Dump Bloomington, Indiana Prepared for: CBS Corporation 20 Stanwix Street 10 th Floor Pittsburgh, Pennsylvania 15222 Prepared by: PSARA Technologies, Inc. 10925 Reed Hartman Highway Suite 220 Cincinnati, Ohio 45242 May 23, 2013 PN 30500.70 FRC
Transcript of Bennett's Dump 2013 Pump Test Results - semspub.epa.gov · flow meters and valves for flow rate...
2013 PUMP TEST RESULTS
Bennett's DumpBloomington, Indiana
Prepared for:
CBS Corporation20 Stanwix Street
10th FloorPittsburgh, Pennsylvania 15222
Prepared by:
PSARA Technologies, Inc.10925 Reed Hartman Highway
Suite 220Cincinnati, Ohio 45242
May 23, 2013PN 30500.70 FRC
ii
T A B L E O F C O N T E N T S
Section Title Page
1.0 Introduction and Objectives..................................................................................1
2.0 Pump Test Operations...........................................................................................3
3.0 Groundwater Recovery .........................................................................................5
4.0 Drawdown and Middle Spring Flow ....................................................................6
5.0 Stout’s Creek Downstream Sample Results .........................................................7
6.0 Recovery Well PCB Concentration ......................................................................8
7.0 Stout’s Creek Accumulation Data ........................................................................9
8.0 Middle Spring Capture........................................................................................10
9.0 Treatment System Effluent Results ....................................................................11
10.0 Iron and Suspended Solids Removal ..................................................................12
11.0 Conclusions.........................................................................................................13
List of Tables
1 Recovery Well Pumping Rates2 Middle Spring Flow Rates3 Stout's Creek Downstream Sampling Results4 Recovery Wells PCB Sampling Results5 Stout's Creek PCB Accumulation Sampling Results6 Treatment System Influent and Effluent PCB Results7 Recovery Wells - TSS, Iron and Hardness Samples
List of Figures
1 Well and Piezometer Locations2 Pre-Storm Drawdown3 Post-Storm Drawdown4 Stout's Creek Accumulation Rates5 Stout's Creek Downstream PCB Mass vs. Flow

1
1.0 INTRODUCTION AND OBJECTIVES
This report summarized the activities and results from a groundwater pump test conducted at the
Bennett’s Dump site in Bloomington, Indiana between March 5 and April 19, 2013. The
objective of the test was to evaluate the effectiveness of a proposed groundwater recovery system
in the vicinity of Middle Spring. The “Scope of Work to Conduct a Pump and Recovery Test of
the Middle Spring Area, Bennett’s Dump Site”, dated October 2, 2012, presents the test
objectives and approach, including installation of new piezometers and recovery wells.
The test was designed to verify the results of two previous pump tests, evaluate the effect of
additional groundwater collection in areas north and south of Middle Spring, and collect data
during higher stream flows associated with larger rainfall events.
The first of these prior tests, conducted in 2005, demonstrated that Middle Spring receives
contributions of flow and PCBs from shallow groundwater. Middle Spring discharge was
effectively stopped due to pumping during this test. Details of this test can be found in the
report, “Hydrogeologic Characterization of Shallow Groundwater, Bennett’s Dump,
Bloomington, Indiana,” PSARA Technologies, 2006.
The second test was conducted over a 28-day period in the spring of 2012 and evaluated the
effect of recovering groundwater from well MW-BC10 location on the overall PCB loading in
Stout’s Creek. That report was issued to the parties on May 7, 2012. Data from this test suggest
that a recovery well system could have an appreciable effect on Stout’s Creek PCB
concentrations.

2
A Geoprobe boring survey was conducted in October 2012 to better characterize soil, fill and
bedrock relationships, to locate and install piezometers for water level monitoring during the
testing, and to locate potential recovery wells. Three new potential recovery wells were installed
based on this survey. GP-3 was installed to facilitate groundwater recovery in the area near
Rusty Spring. GP-11 was located close to Middle Sp. GP-17 was installed in the northern area
between wells MW-B13 and MW-5. Figure 1 shows well and piezometer locations and Stout’s
Creek.
The pump test was performed at Bennett’s Dump during the period March 5 to April 19,
2013. Groundwater was pumped from all three new wells, as well as existing recovery well
BC10. Four significant rainfall events occurred during that period, and Stout’s Creek flows
exceeded 7500 gpm during the largest event.

3
2.0 PUMP TEST OPERATIONS
2.1 Preparation and Setup
In preparation for the pump test, recovery well BC10 was treated with muriatic acid to remove
iron build-up and improve the potential recovery rate from this well. After treatment, the well
was purged until the pH had returned to within 0.5 s.u. of the pre-test level. This treatment
succeeded in raising the pumping rate from this well from ~ 5 gpm to ~ 7.7 gpm.
Submersible electric well pumps were installed near the bottom of MW-BC10 and new wells
GP-3, GP-11 and GP-17. Discharge lines from each pumping well were equipped with in-line
flow meters and valves for flow rate control.
Groundwater pumped from the four wells was directed into an influent holding tank. From
there, the water was treated through a mobile water treatment system (trailer) comprising a series
of bag filters and three stages of activated carbon. The treated water was pumped approximately
250 feet north and discharged into Stout’s Creek north of the downstream sampling location.
On March 4, baseline water level observations were made in piezometers and monitoring wells
listed in the Scope of Work (SOW). Baseline PCB samples were collected and flows measured
at Stout’s Creek Upstream and Downstream stations, and at Middle Spring and Rusty Spring.
2.2 Test Start-up
The pump test at Bennett’s Dump began at 08:15 on Tuesday, March 5. Pumping rates were
monitored and adjusted for desired water level drawdown. Stable pumping rates were
established by 08:30. Pumping well rates continued to be monitored and adjusted as needed
throughout the test period.

4
2.3 Monitoring Activities
Groundwater levels were monitored in a list of piezometers and monitor wells daily per the SOW
for the first few days, then three times per week for the duration of the pump test.
Routine, non-storm condition pump test activities included:
Two to three times per day checks and adjustment of recovery well pumping rates.
Daily refueling of the main generator; two times per day changing of the batteries atGP-17, MW-B13 and MW-5.
Two to three times per day check of the treatment system pressures, flow rate andequipment condition.
Daily sampling and flow measurements at Stout’s Creek Downstream station and atother Stout’s Stations added later in the test.
Daily (or more frequent) observations of Middle Spring flow and Rusty Spring flow.
Three times per week groundwater levels observations in piezometers and wells.
Weekly PCB samples at Stout’s Creek Upstream station (and flow measured), allpumping wells, Middle Spring and Rusty Spring or any other flowing onsite springs.
Weekly well sampling for iron and hardness parameters.
Weekly treatment system effluent PCB sampling (daily sampling as described inSection 9.0).
Storm events required more frequent water level monitoring, to observe the storm effect on
groundwater levels and pumping, and additional Stout’s Creek sampling and flow measurements
to collect data at higher flows than previously observed. Storm event activities necessarily were
adapted to meet the goal of collecting quality data in challenging and variable conditions. Four
storm events occurred during the March 5-April 19 pump test period.

5
3.0 GROUNDWATER RECOVERY
Pumping rates from the recovery wells are presented in Table 1. In general, pumping rates
declined through the test period.
In the northern area, two additional pumping wells were added to augment the low yield from
GP-17. MW-B13 was brought on line on March 22. Pumping rates at MW-B13 were 0.7 gpm
initially and declined to 0.2 gpm by the end of the test. Rain storm input bumped up yield very
briefly and modestly on three occasions. MW-5 was added as a pumping well on March 26.
Pumping rates from MW-5 were extremely low, ranging between 0.03 gpm and 0.02 gpm.
Total combined recovery rates from the pumping wells began at 12.6 gpm and declined to
7.6 gpm through the test period.

6
4.0 DRAWDOWN AND MIDDLE SPRING FLOW
Two figures are included to illustrate the drawdown induced by the pump test. Figure 2 presents
the drawdown on March 15, prior to the March 18 rainfall event. This is the greatest drawdown
observed during the test. Figure 3 presents the reduced drawdown near the end of the rain event.
This data is from 7:00 am on March 18.
Piezometer water level observations showed the initial rapid drawdown of shallow groundwater
by the pumping wells, followed by rises in response to storm events. Continuous pumping drew
water levels down slowly after big rain events as well as more generally over the course of the
test. Nonstorm-affected shallow groundwater levels were lowest around April 10, after five
weeks of pumping and just before the first of the three April storm events. The greatest and most
rapid changes in piezometer water levels were observed in piezometers closest to Stout’s Creek,
reflecting the rapid response of Stout’s Creek to storm input.
Middle Spring flows are presented in Table 2. As the table shows, Middle Spring flow was
reduced to a trickle on March 7 and April 9-10, but was never completely stopped. Middle
Spring flow responses to storm events were:
March 18 storm (1.2” rain), Middle Spring flow increased from 0.1 gpm to 4.8 gpm.
April 11 storm (1.2” rain), Middle Spring flow increased from a trickle to 2.3 gpmover about 3 days.
April 16-17 storm (0.9” rain), Middle Spring flow increased from 1.1 gpm to1.9 gpm.
April 18-19 storm (1.2” rain), Middle Spring flow increased from 1.5 gpm to about10 gpm.
See Section 8.0, Middle Spring Capture, for additional discussion of Middle Spring flow
response to the April 19 storm event.

7
5.0 STOUT’S CREEK DOWNSTREAM SAMPLE RESULTS
Water samples were collected daily throughout the test at the Stout’s Creek Downstream
sampling location. Table 3 presents PCB sample results at this location, along with the Stout’s
Creek flow rate at the time the sample was collected. Middle Spring flow rates are also
presented in this table. PCBs at the Stout’s Creek Downstream sample location ranged from
0.023 ppb to 0.075 ppb in flows from 435 gpm to 7900 gpm.
The table includes samples collected during storm flows following rain storms on March 18,
April 11, April 17 and April 19. In each instance, the samples were collected after storm flows
peaked and while flows were receding but still elevated. Stout’s Creek Downstream sampling in
the 2012 pump test were limited to flows of 940 gpm or less. During the 2013 test, 14 samples
were collected at flows greater than 1000 gpm.

8
6.0 RECOVERY WELL PCB CONCENTRATION
The four primary recovery wells were sampled for PCBs 24 hours after pumping began, again
48 and 72 hours after startup, then weekly for the duration of the test. MW-B13 and MW-5 were
added to the weekly sampling schedule after they were brought online. Results of PCB sampling
in recovery wells are presented in Table 4.
Recovery well GP-3, near Rusty Spring, had PCB results in the range 7.1 to 9.2 ppb. Rusty
Spring was never observed to flow during the test. MW-BC10 PCBs were 5.1 to 7.1 ppb.
Recovery well GP-11, close to Middle Spring on the north side, had PCBs in the 30 to 55 ppb
range, with the anomalous exception of the final sample at 190 ppb.
In the northern area, GP-17 had an initial PCB result of 240 ppb, followed by seven samples
between 130 and 170 ppb, and a final sample result of 100 ppb. MW-B13 was sampled four
times, with PCBs in the range 82 to 150 ppb. MW-5 was sampled three times; results were 73 to
92 ppb.
9
7.0 STOUT’S CREEK ACCUMULATION DATA
Results of PCB sampling at the Stout’s Creek Upstream station are consistently below the
detection limit of 0.01 µg/L (ppb). At the Downstream station, PCBs are consistently detectable
in samples analyzed to the 0.01 ppb detection limit. Additional sampling stations along Stout’s
Creek were added to determine whether PCBs enter Stout’s Creek in particular areas or stream
reaches. Three stations were added to the daily Stout’s Creek Downstream sampling routine
beginning April 9. A fourth sampling station was added beginning April 16.
The additional Stout’s Creek sampling stations were:
Upstream of Rusty Spring (SC-A7)
Between Rusty and Middle Springs (SC-A9)
Between Middle Spring and MW-B13 (SC-A1112)
Between MW-B13 and MW-5 (SC-A14)
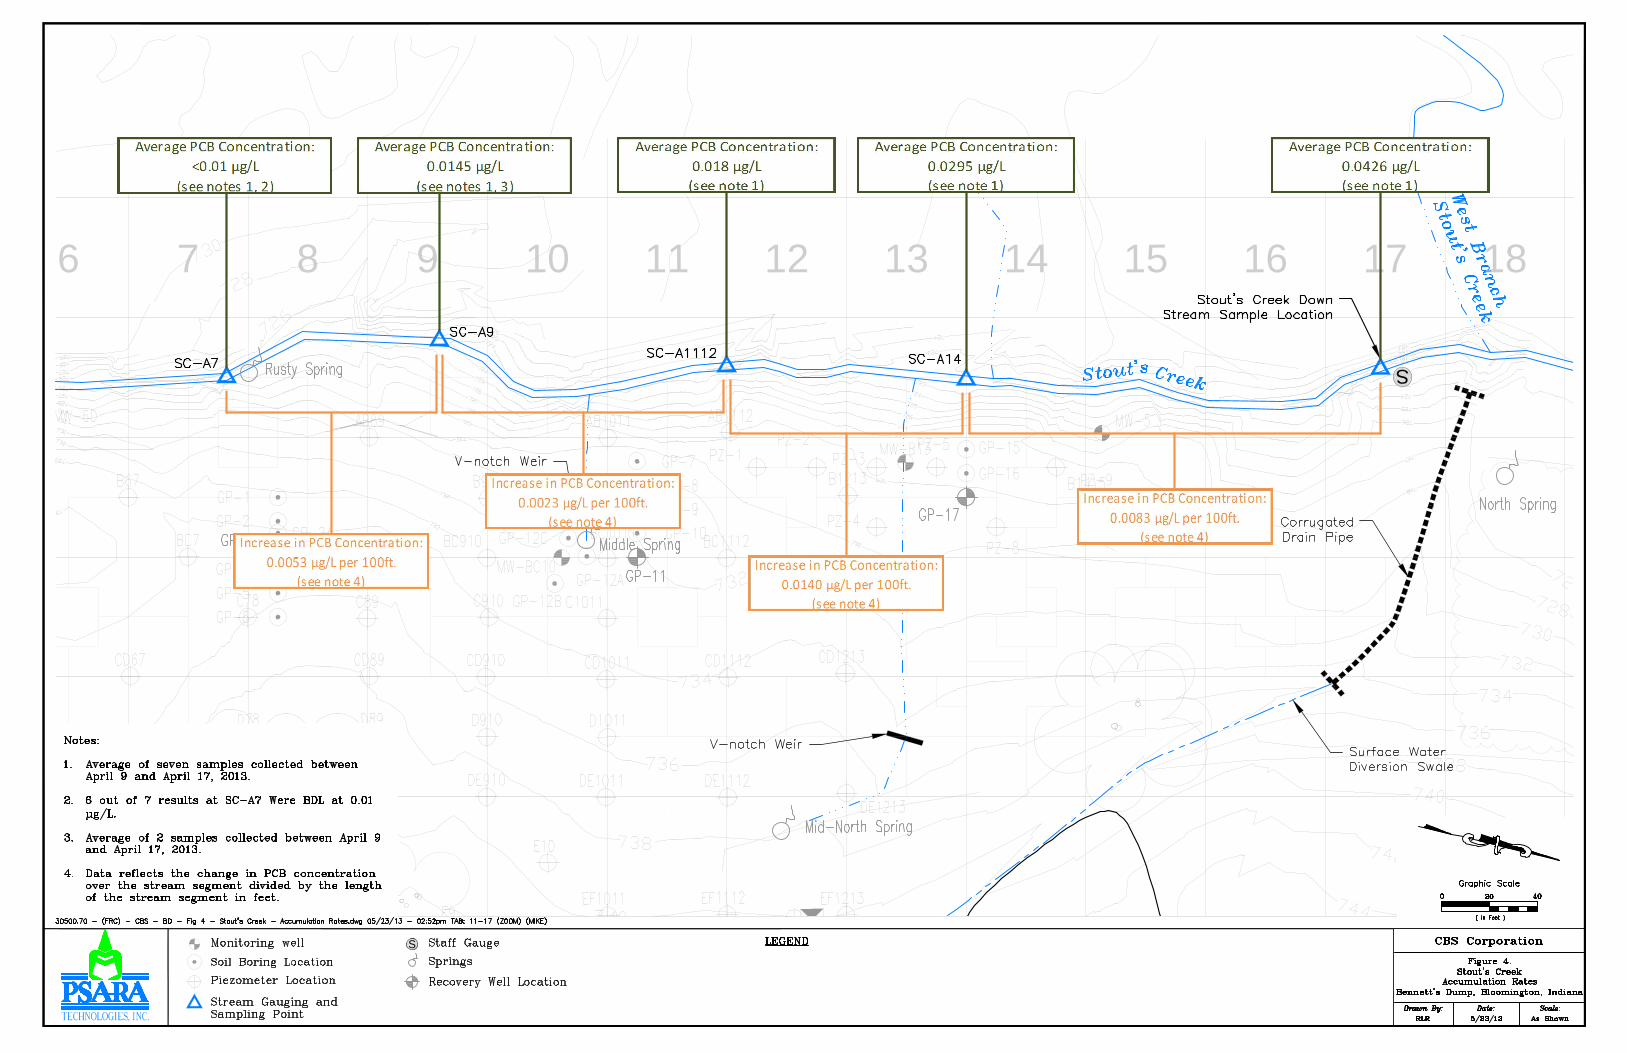
Results of sampling at the Stout’s Creek midstream stations are presented in Table 5 and in
Figure 4. The figure is labeled with average PCB analytical result for each station and with a
calculated PCB accumulation rate (µg/L per 100 feet) for the stream reach between sampling
stations.
10
8.0 MIDDLE SPRING CAPTURE
As the pump test progressed, the total flow rate from all recovery wells declined to below 10
gpm. Since the test was intended to simulate a 15-gpm treatment system, the decision was made
to capture up to 5 additional gpm from the flowing Middle Spring. This measure was taken to
allow better evaluation of the proposed remedy design and to capture all flow from Middle
Spring to Stout’s Creek other than during very large storm events.
A sump and sump pump were installed below the weir at Middle Spring. Pumping from the
sump began at 16:00 on April 4, and all surface flow from the spring to Stout’s Creek was
captured and sent to the treatment system. The flow from Middle spring to the sump remained
below 5 gpm until the April 19 storm increased flow to about 10 gpm. Another sump pump was
added at 16:00 on April 19, and complete capture was restored for the final few hours of the test.
11
9.0 TREATMENT SYSTEM EFFLUENT RESULTS
Table 6 presents the treatment system influent and effluent samples PCB results.
The pump test procedure specified collecting a treated water sample at the beginning of the test
and weekly sampling thereafter. However, after the initial sample exhibited elevated PCBs, a
number of measures were implemented, including daily monitoring for several days. A backup
treatment system was mobilized and installed to ensure effective water treatment. Separate
samples were collected from the effluent of each system. All subsequent effluent samples from
the primary system were below the detection limit of 0.1 µg/L (BDL). On March 20, the backup
system was disconnected and winterized, partially in preparation for extremely cold overnight
temperatures.
The treatment system was monitored several times each day throughout the test period. Filters
were changed and carbon vessels were backwashed as needed to maintain adequate flow rates
and effective PCB removal.
A little more than a week into the test, iron precipitation was found to be responsible for
increased treatment system pressures and reduced treatment flow rates. On March 15, aeration
and clarification processes were added to the treatment system. Filters and carbon were changed
out as well. These measures improved treatment flow rates and lowered pressures. Iron issues
continued to require close monitoring and more frequent maintenance of bag filters and carbon
for the remainder of the test.

12
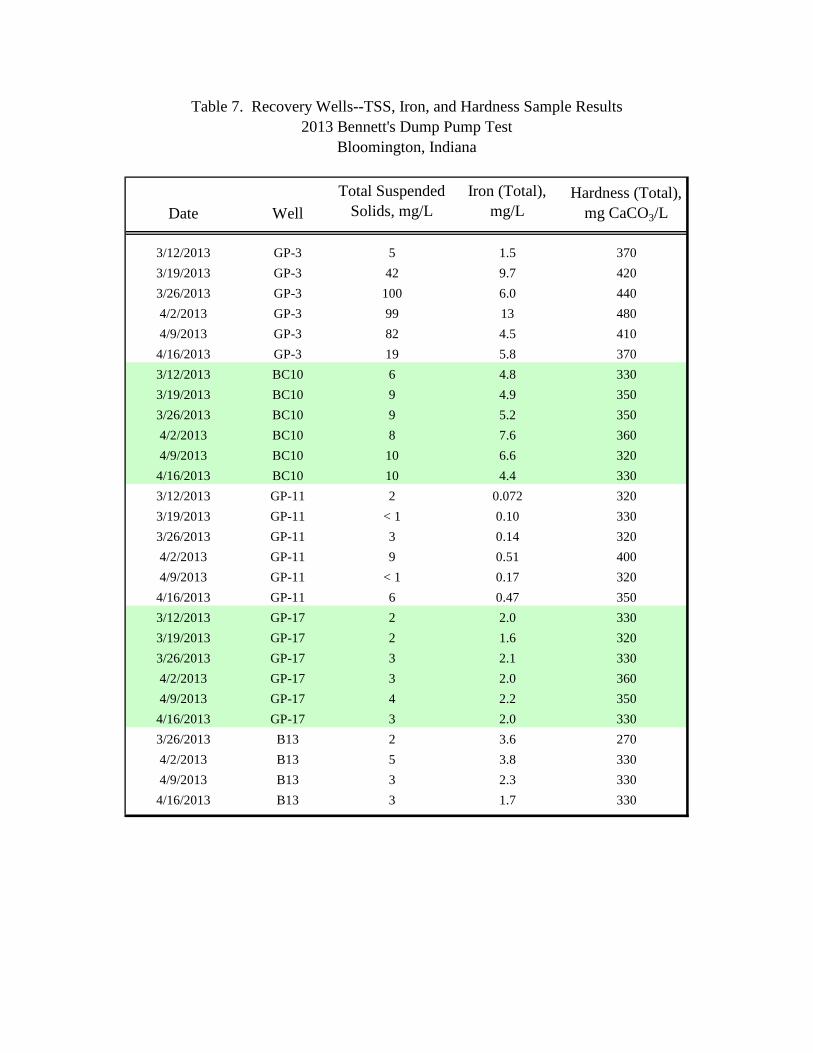
10.0 IRON AND SUSPENDED SOLIDS REMOVAL
Pumping wells were sampled weekly for water quality parameters suspended solids, total iron
and total hardness. Results of those samples are presented in Table 7.

13
11.0 CONCLUSIONS
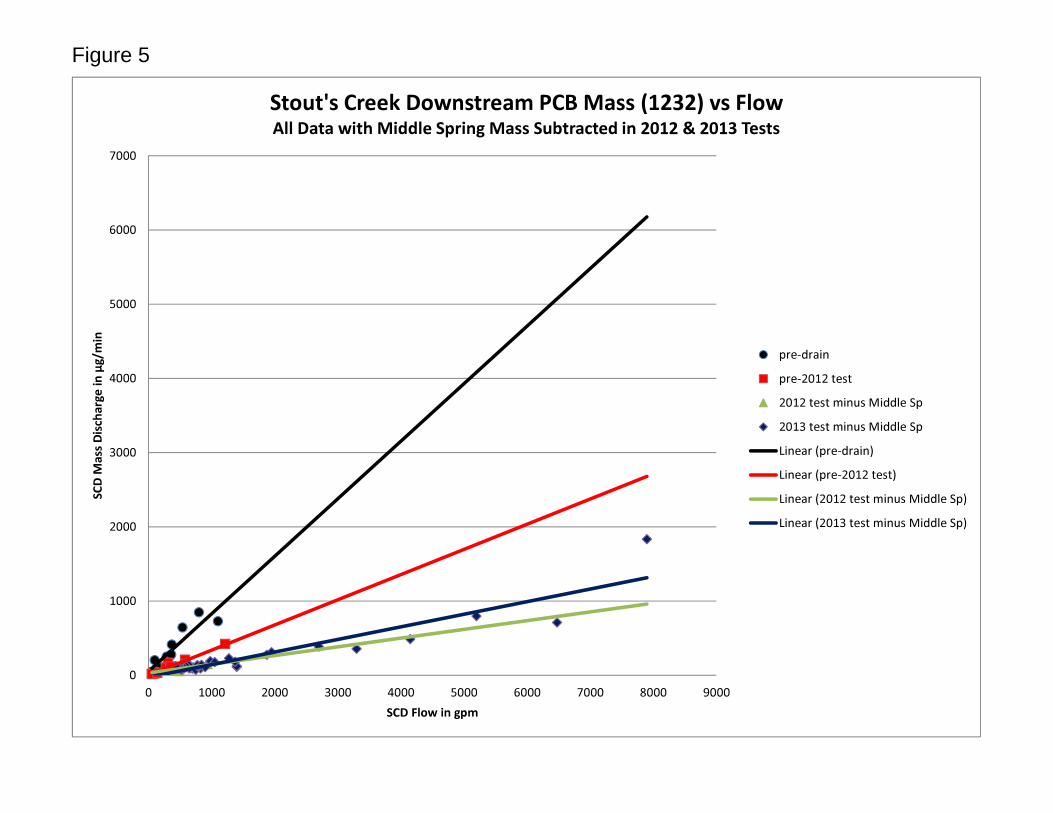
Figure 5 shows a plot of PCB mass flux at Stout’s Creek Downstream location and compares
four data sets. Individual samples are data points and a linear regression line is plotted for each
set of sample data. Samples from the pre-quarry drain period show the steepest regression line,
i.e. greater PCB mass discharge as flows increase. The data labeled “pre-2012” presents data
collected after construction of the passive quarry drain but before the 2012 pump test. The lesser
slope indicates the reduction in Stout’s Creek PCB mass discharge due to the quarry drain alone.
The 2012 and 2013 pump test data plot well below the pre-2012 regression line, showing further
reduction of PCB mass discharge. Since Middle Spring flow was not completely halted during
the 2012 and 2013 pump tests, Middle Spring PCB mass discharges to Stout’s Creek were
subtracted from the Stout’s Creek Downstream PCB mass flux daily values to simulate the effect
of Middle Spring capture by the proposed remedy. The plotted data are the “corrected” values.
Data acquired during the 2013 pump test extends to much greater Stout’s Creek flows than the
2012 test. Visually, it appears that the reduction of PCB mass discharge in 2013 is not quite as
good as in 2012. However, the single data point at 7900 gpm may be an outlier.
PCB mass and flow relationships during the 2013 extended pumping test are very similar to the
mass-flow relationship found during the 2012 pump test and confirm that the mass vs. flow
relationship holds into higher flows than were previously observed.
The plot illustrates an approximately 50 percent PCB mass reduction effected by the passive
quarry drain and a similar reduction resulting from capture of Middle Spring and shallow
groundwater recovery during the 2012 and 2013 pump tests. Compared to the pre-drain
condition, Stout’s Creek mass flux appears to be reduced by almost 75 percent by the combined
effects of the passive quarry drain and Middle Spring area groundwater and surface water
capture.

14
Rusty Spring contribution to PCBs in Stout’s Creek appears to be minimal. PCB concentrations
in groundwater in the southern area are not very high, and Rusty Spring is observed to flow only
rarely.
Results of Stout’s Creek sampling at multiple stations showed higher rate of PCB accumulation
downstream of Middle Spring than upstream of Middle Spring.
Groundwater recovery from pumping wells does not appear to be as effective an option as a
collection trench. The previous conceptual model of a buried former stream valley with
transmissive granular fill material was not confirmed by this test. Recovery rates were lower
than expected in recovery wells located close to the bedrock low feature.

TABLES

Date GP-3 BC-10 GP-11 GP-17 B13 Sum
3/5/2013 3.0 7.1 1.8 0.7 -- 12.6
3/6/2013 2.4 6.8 1.5 0.7 -- 11.4
3/7/2013 2.4 6.7 1.7 0.6 -- 11.4
3/8/2013 2.2 6.1 1.3 0.7 -- 10.3
3/11/2013 2.1 5.7 1.2 0.7 -- 9.7
3/12/2013 2.0 5.6 1.1 0.7 -- 9.4
3/13/2013 2.0 5.4 1.1 0.5 -- 9.0
3/14/2013 2.0 5.4 1.0 0.4 -- 8.8
3/15/2013 2.0 5.3 1.1 0.2 -- 8.6
3/18/2013 2.1 5.3 1.1 0.2 -- 8.7
3/19/2013 2.0 5.3 1.1 0.2 -- 8.6
3/20/2013 2.0 5.2 1.1 0.2 -- 8.5
3/21/2013 2.0 5.3 1.1 off -- 8.4
3/22/2013 2.0 5.4 1.1 0.8 0.7 10.0
3/23/2013 1.9 5.4 1.2 0.5 0.4 9.4
3/24/2013 2.0 5.5 1.1 0.4 0.4 9.4
3/25/2013 1.9 5.4 1.0 0.4 0.4 9.1
3/26/2013 1.9 5.2 1.0 0.5 0.4 9.0
3/27/2013 1.9 5.2 1.0 0.6 0.2 8.9
3/28/2013 1.9 5.2 1.0 0.5 0.2 8.8
3/29/2013 1.9 5.1 1.0 0.5 0.3 8.8
4/1/2013 1.9 5.1 1.0 0.4 0.4 8.8
4/2/2013 1.7 5.0 1.0 0.5 0.3 8.5
4/3/2013 1.7 4.9 1.0 0.5 0.3 8.4
4/4/2013 1.7 4.9 1.0 0.4 0.3 8.3
4/5/2013 1.7 4.9 1.0 0.4 0.3 8.3
4/6/2013 1.6 4.8 1.0 0.4 0.3 8.1
4/7/2013 1.6 4.8 1.0 0.4 0.3 8.1
4/8/2013 1.6 4.8 1.0 0.4 0.3 8.1
4/9/2013 1.4 4.7 0.9 0.5 0.3 7.8
4/10/2013 1.5 4.7 0.9 0.5 0.3 7.9
4/11/2013 1.5 4.7 0.9 0.6 0.5 8.2
4/12/2013 1.4 4.7 1.0 0.8 0.3 8.2
4/13/2013 1.4 4.7 1.0 0.8 0.3 8.2
4/14/2013 1.4 4.7 1.0 0.8 0.3 8.2
4/15/2013 1.4 4.8 1.0 0.7 0.2 8.1
4/16/2013 1.4 4.7 1.0 0.5 0.2 7.8
4/17/2013 1.4 4.7 0.8 0.5 0.4 7.8
4/18/2013 1.4 4.7 0.8 0.5 0.2 7.6
4/19/2013 1.4 4.9 0.8 0.7 0.3 8.1
Pumping Rate, gpm
Table 1. Recovery Well Pumping Rates2013 Bennett's Dump Pump Test
Bloomington, Indiana

DateMiddle Spring
Flow, gpmPCB Result,
µg/L
3/4/2013 5 4.6
3/5/2013 5 --
3/6/2013 0.4 --
3/7/2013 Trickle --
3/8/2013 0.4 --
3/9/2013 0.4 --
3/10/2013 0.8 --
3/11/2013 0.6 --
3/12/2013 0.8 4.5
3/13/2013 0.8 --
3/14/2013 0.3 --
3/15/2013 0.3 --
3/16/2013 0.5 --
3/17/2013 0.1 --
3/18/2013 1.5 to 4.8 5.4
3/19/2013 4 4.9
3/20/2013 3.4 --
3/21/2013 2.8 --
3/22/2013 2.3 --
3/23/2013 2.1 --
3/24/2013 2.3 --
3/25/2013 1.9 --
3/26/2013 1.9 3.5
3/27/2013 1.5 --
3/28/2013 1.5 --
3/29/2013 1.9 --
4/1/2013 1.5 --
4/2/2013 1.1 4.8
4/3/2013 0.8 --
4/4/2013 0.8 --
4/5/2013 0.6 --
4/8/2013 0.3 --
4/9/2013 Trickle 3.0
4/10/2013 Trickle --
4/11/2013 0.8 --
4/12/2013 1.5 --
4/13/2013 2.3 --
4/14/2013 1.9 --
4/15/2013 1.5 --
4/16/2013 1.1 4.6
4/17/2013 1.9 --
4/18/2013 1.5 --
4/19/2013 9.4 --
4/22/2013 9.4 4.3
4/23/2013 8.3 4.6
Bloomington, Indiana
Table 2. Middle Spring Flow and PCB Sampling Results2013 Bennett's Dump Pump Test

DatePCB Result,µg/L Flow, gpm
Middle Spring Flowto Stout's Creek,
gpm
3/5/2013 0.054 700 Declines from 5 to 1
3/6/2013 0.038 700 0.1
3/7/2013 0.04 780 Trickle
3/9/2013 0.053 980 0.4
3/11/2013 0.048 775 0.6
3/12/2013 0.05 680 0.8
3/13/2013 0.043 715 0.8
3/14/2013 0.048 650 0.8
3/15/2013 0.04 650 0.3
3/18/2013 0.035 3300 4.0
3/19/2013 0.04 2700 4.0
3/19/13 (dup) 0.036 2700 4.0
3/20/2013 0.032 1400 3.4
3/21/2013 0.057 1275 2.8
3/22/2013 0.054 1050 2.6
3/25/2013 0.039 825 1.9
3/26/2013 0.034 750 1.9
3/26/13 (dup) 0.034 750 1.9
3/27/2013 0.049 780 1.5
3/28/2013 0.055 775 1.5
3/29/2013 0.069 640 1.5
4/1/2013 0.063 600 1.1
4/2/2013 0.041 530 0.8
4/2/13 (dup) 0.047 530 0.8
4/3/2013 0.050 570 0.8
4/4/2013 0.045 520 0.8
4/5/2013 0.048 495 0
4/8/2013 0.052 515 0
4/9/2013 0.047 500 0
4/9/13 (dup) 0.047 500 0
4/10/2013 0.075 435 0
4/11/2013 0.023 1400 0
4/12/2013 0.042 1950 0
4/15/2013 0.032 900 0
4/16/2013 0.047 840 0
4/16/13 (dup) 0.041 840 0
4/17/2013 0.039 1875 0
4/18/13 13:05 0.035 1375 0
4/19/13 5:45 0.063 7900 1 to 3 (est.)
4/19/13 9:10 0.031 6475 1 to 3 (est.)
4/19/13 12:45 0.043 5200 1 to 3 (est.)
4/19/13 19:15 0.031 4150 0
4/22/13 13:45 0.14 1475 9.4
4/23/2013 0.067 1200 8.3
4/23/2013 (dup) 0.092 1200 8.3
Table 3. Stout's Creek Downstream Sampling Results2013 Bennett's Dump Pump Test
Bloomington, Indiana

Date GP-3 MW-BC10 GP-11 GP-17 MW-B13 MW-05Combined or Influent
3/6/2013 7.9 6.2 38 240 -- -- --
3/7/2013 7.7 6.0 53 160 -- -- 15
3/8/2013 7.1 5.1 51 130 -- -- 15
3/12/2013 8.5 7.0 54 170 -- -- 17
3/19/2013 9.2 5.9 44 160 -- -- 13
3/26/2013 8.8 5.7 52 140 95 -- 15
4/2/2013 8.5 6.3 30 130 92 92 21
4/9/2013 9.2 6.5 55 170 150 73 21
4/16/2013 8.5 6.9 190 100 82 75 23
PCB Result, µg/L
Table 4. Recovery Well PCB Sampling Results2013 Bennett's Dump Pump Test
Bloomington, Indiana

Date SCD SC-A14 SC-A1112 SC-A9 SC-A7
3/4/13 9:35 0.062/0.073 2 620
3/5/13 12:10 0.054 1 700
3/6/13 13:20 0.038 3 700
3/7/13 12:50 0.040 3 780
3/9/13 10:30 0.053 2 980
3/11/13 13:15 0.048 3 775
3/12/13 11:05 0.050 2 680
3/13/13 13:00 0.043 2 715
3/14/13 10:30 0.048 < 1 650
3/15/13 13:05 0.040 < 1 650
3/18/13 15:10 0.035 14 3300
3/19/13 9:40 0.04/0.036 6 2700
3/20/13 13:00 0.032 5 1400
3/21/13 14:10 0.057 4 1275
3/22/13 12:40 0.054 2 1050
3/25/13 12:30 0.039 < 1 825
3/26/13 11:30 0.034/0.034 1 750
3/27/13 14:00 0.049 2 780
3/28/13 13:20 0.055 1 775
3/29/13 12:15 0.069 2 640
4/1/13 13:40 0.063 2 600
4/2/13 10:50 0.041/0.047 1 530
4/3/13 13:20 0.050 1 570
4/4/13 13:10 0.045 2 520
4/5/13 13:10 0.048 1 495
4/8/13 10:40 0.052 2 515
4/9/13 9:50 0.047/0.047 0.043 0.018 -- < 0.01 2 500
4/10/13 9:00 0.075 0.048 < 0.01 -- < 0.01 1 435
4/11/13 13:10a 0.023 0.026 0.017 -- 0.012 15 1400
4/12/13 9:50 0.042 0.023 0.019 -- < 0.01 8 1950
4/15/13 13:20 0.032 0.018 < 0.01 -- < 0.01 3 900
4/16/13 10:40 0.047/0.041 0.020 0.015 0.011 < 0.01 3 840
4/17/13 9:40 0.039 0.017 0.016 0.015 < 0.01 21 1875
4/18/13 13:05 0.035 0.026 < 0.01 < 0.01 0.011 4 1375
4/19/13 5:45 0.063 -- -- -- -- 61 7900
4/19/13 9:10 0.031 0.051 0.021 0.018 -- 25 6475
4/19/13 12:45 0.043 -- -- -- -- 14 5200
4/19/13 19:15 0.031 0.023 0.020 0.014 < 0.01 11 4150
4/22/13 13:45 0.14 0.053 0.10 0.043 0.019 4 1475
4/23/13 13:10 0.067/0.092 0.086 0.15 0.052 < 0.01 2 1200
PCB Result, µg/LTotal
Suspended Solids, µg/L
SCD Flow, gpm
a Lab analysts had difficulty with quantitation of AR1232 due to interferences and very low levels.
Table 5. Stout's Creek PCB Accumulation Sampling Results2013 Bennett's Dump Pump Test
Bloomington, Indiana

Date InfluentPrimary System
EffluentBack-up System
Effluent
3/5/2013 -- 6.1 BDLa
3/7/2013 15 BDL BDL3/8/2013 15 BDL BDL3/9/2013 10 BDL 0.313/10/2013 13 BDL BDL3/11/2013 15 BDL BDL3/12/2013 17 BDL BDL3/13/2013 17 BDL BDL3/14/2013 17 BDL 0.573/19/2013 13 BDL BDL3/26/2013 15 BDL Not in use4/2/2013 21 BDL Not in use4/9/2013 21 BDL Not in use4/16/2013 23 BDL Not in use
PCB Result, µg/L
a BDL = below detection limit of 0.1 µg/L.
Table 6. Treatment System Influent and Effluent PCB Results2013 Bennett's Dump Pump Test
Bloomington, Indiana
Date Well
Total Suspended Solids, mg/L
Iron (Total),mg/L
Hardness (Total), mg CaCO3/L
3/12/2013 GP-3 5 1.5 370
3/19/2013 GP-3 42 9.7 420
3/26/2013 GP-3 100 6.0 440
4/2/2013 GP-3 99 13 480
4/9/2013 GP-3 82 4.5 410
4/16/2013 GP-3 19 5.8 370
3/12/2013 BC10 6 4.8 330
3/19/2013 BC10 9 4.9 350
3/26/2013 BC10 9 5.2 350
4/2/2013 BC10 8 7.6 360
4/9/2013 BC10 10 6.6 320
4/16/2013 BC10 10 4.4 330
3/12/2013 GP-11 2 0.072 320
3/19/2013 GP-11 < 1 0.10 330
3/26/2013 GP-11 3 0.14 320
4/2/2013 GP-11 9 0.51 400
4/9/2013 GP-11 < 1 0.17 320
4/16/2013 GP-11 6 0.47 350
3/12/2013 GP-17 2 2.0 330
3/19/2013 GP-17 2 1.6 320
3/26/2013 GP-17 3 2.1 330
4/2/2013 GP-17 3 2.0 360
4/9/2013 GP-17 4 2.2 350
4/16/2013 GP-17 3 2.0 330
3/26/2013 B13 2 3.6 270
4/2/2013 B13 5 3.8 330
4/9/2013 B13 3 2.3 330
4/16/2013 B13 3 1.7 330
Bloomington, Indiana
Table 7. Recovery Wells--TSS, Iron, and Hardness Sample Results2013 Bennett's Dump Pump Test

FIGURES

S

4 5 6 7 8 9 10 11 12 13 14 15 16
S

4 5 6 7 8 9 10 11 12 13 14 15 16
S
S
6 7 8 9 10 11 12 13 14 15 16 17 18
S
0
1000
2000
3000
4000
5000
6000
7000
0 1000 2000 3000 4000 5000 6000 7000 8000 9000
SC
D M
ass
Dis
cha
rge
in
µg
/min
SCD Flow in gpm
Stout's Creek Downstream PCB Mass (1232) vs FlowAll Data with Middle Spring Mass Subtracted in 2012 & 2013 Tests
pre-drain
pre-2012 test
2012 test minus Middle Sp
2013 test minus Middle Sp
Linear (pre-drain)
Linear (pre-2012 test)
Linear (2012 test minus Middle Sp)
Linear (2013 test minus Middle Sp)
Figure 5