

Understanding Pumped Storage Hydropower - Understanding Pumped Storage... · Understanding Pumped...
55
Michael Manwaring, HDR Engineering Understanding Pumped Storage Hydropower Michael Manwaring, HDR Engineering Chair, NHA Pumped Storage Development Council November 2012
Transcript of Understanding Pumped Storage Hydropower - Understanding Pumped Storage... · Understanding Pumped...
Michael Manwaring, HDR Engineering
Understanding Pumped Storage
Hydropower
Michael Manwaring, HDR Engineering
Chair, NHA Pumped Storage Development Council
November 2012
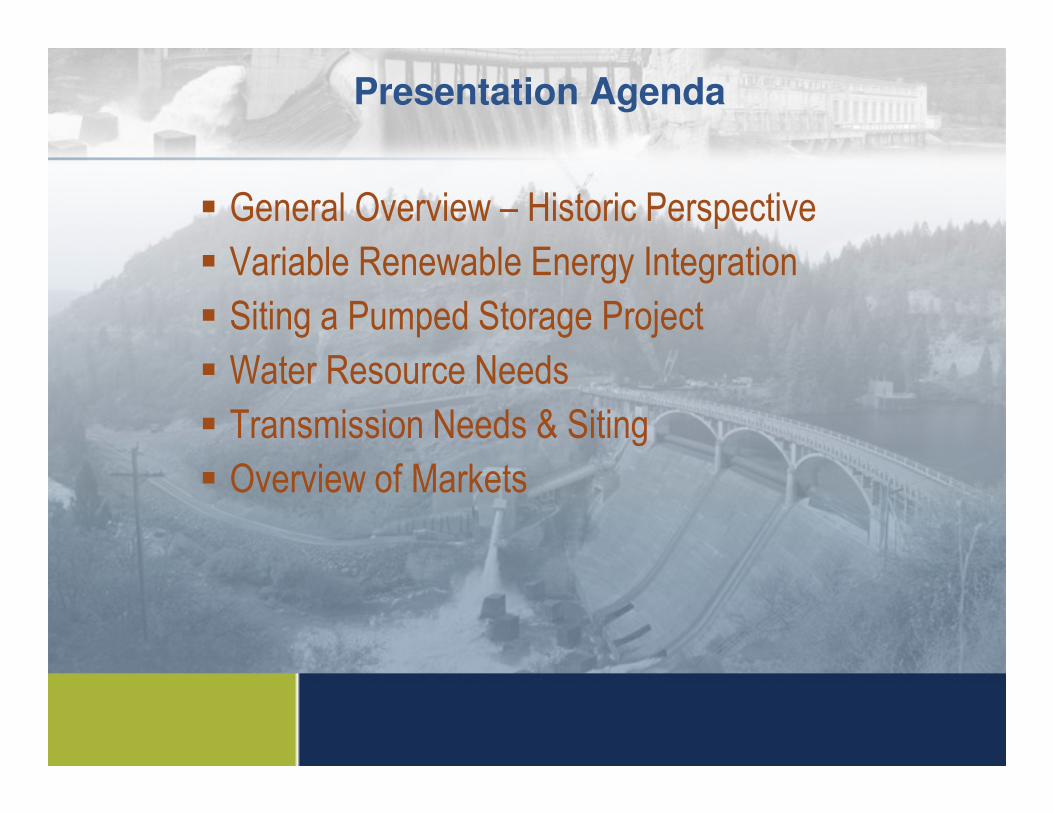
Presentation Agenda
� General Overview – Historic Perspective
� Variable Renewable Energy Integration
� Siting a Pumped Storage Project
� Water Resource Needs
� Transmission Needs & Siting � Transmission Needs & Siting
� Overview of Markets
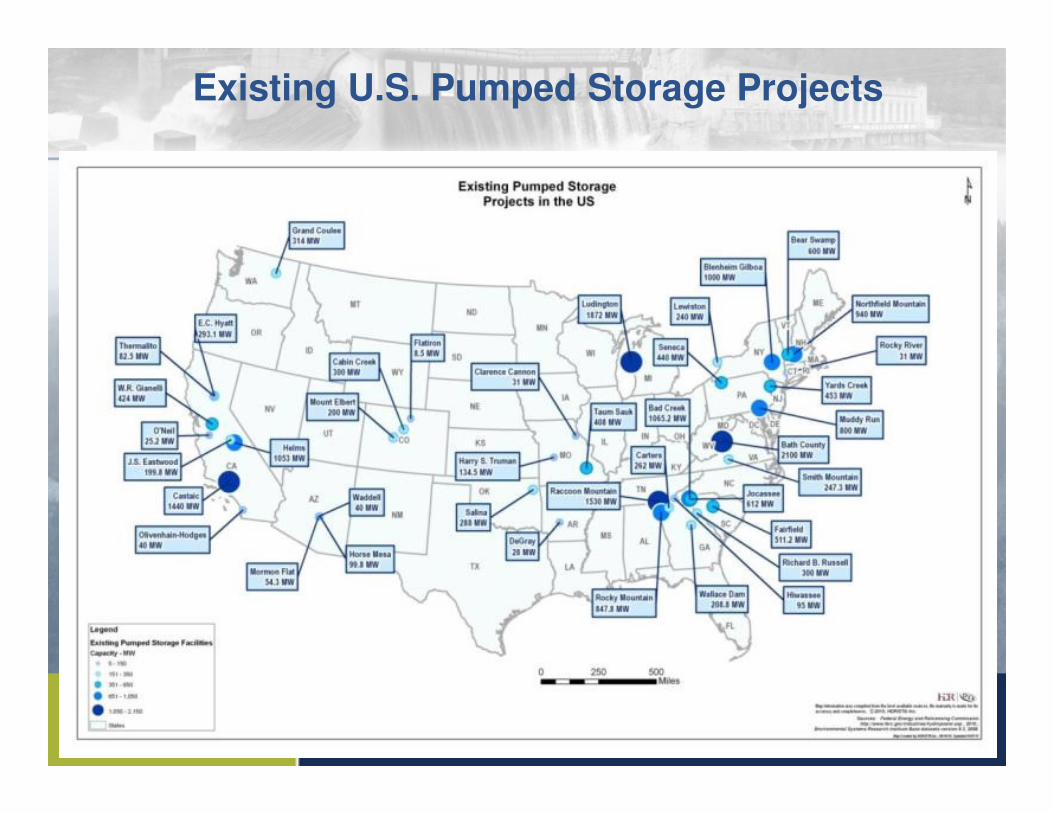
Existing U.S. Pumped Storage Projects
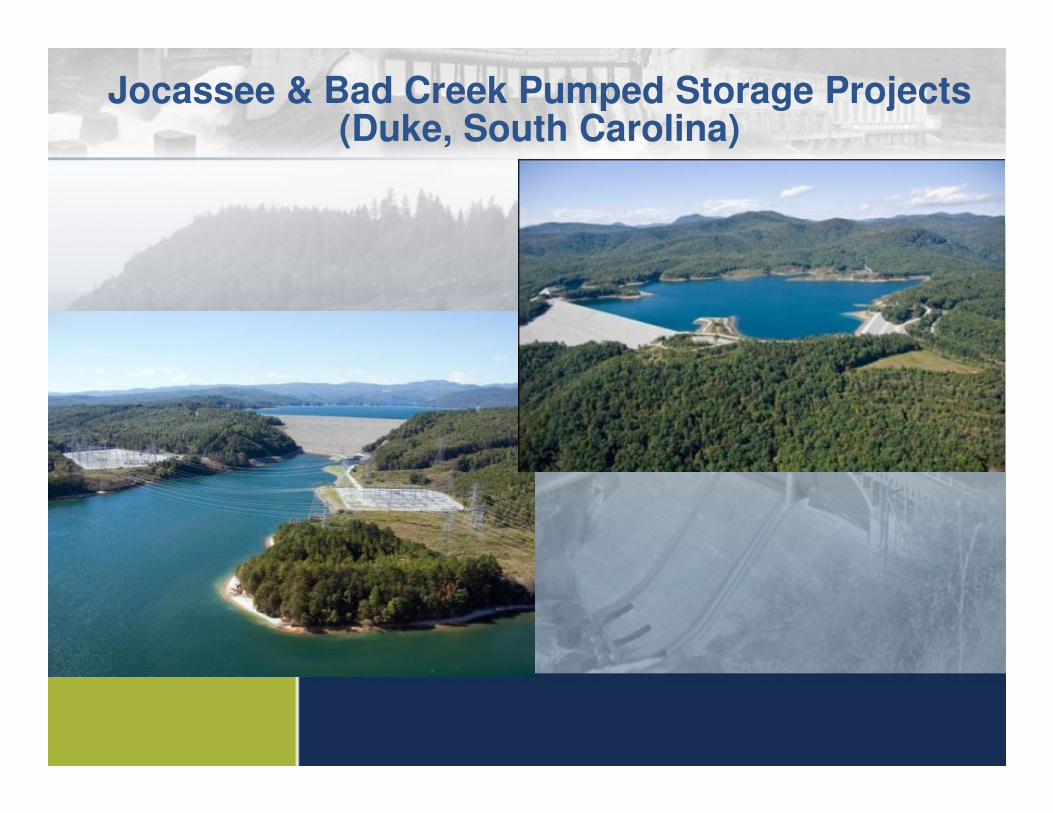
Jocassee & Bad Creek Pumped Storage Projects (Duke, South Carolina)
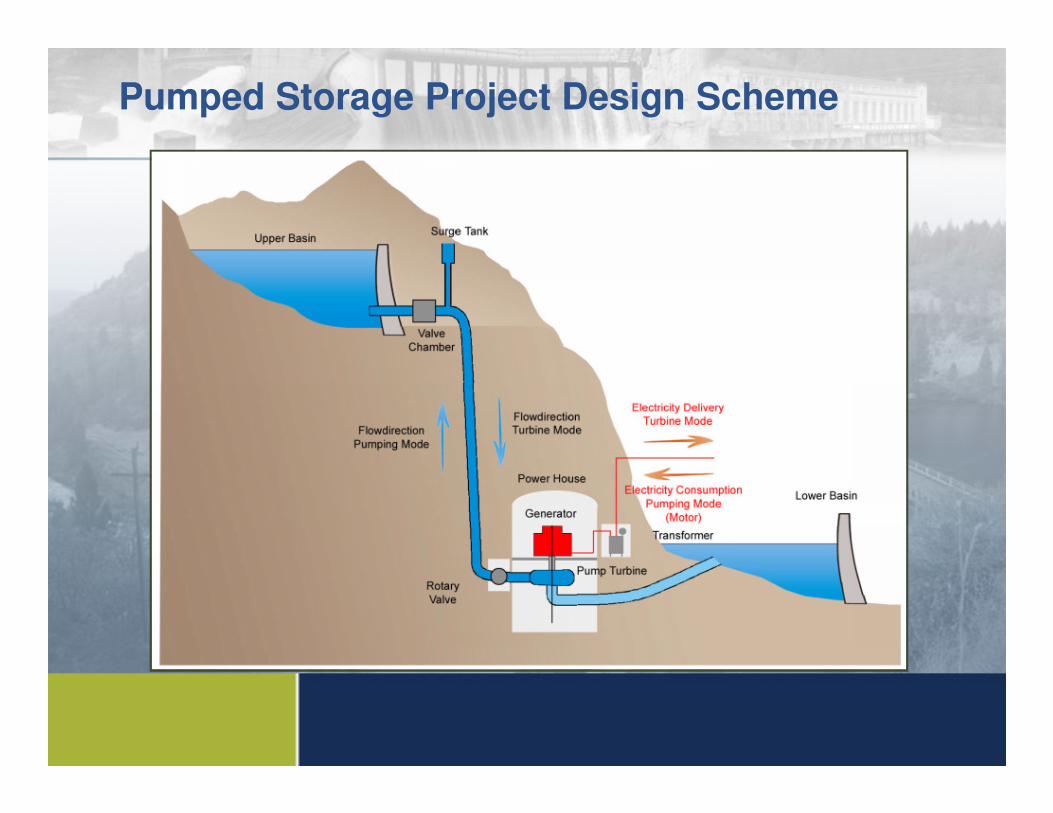
Pumped Storage Project Design Scheme
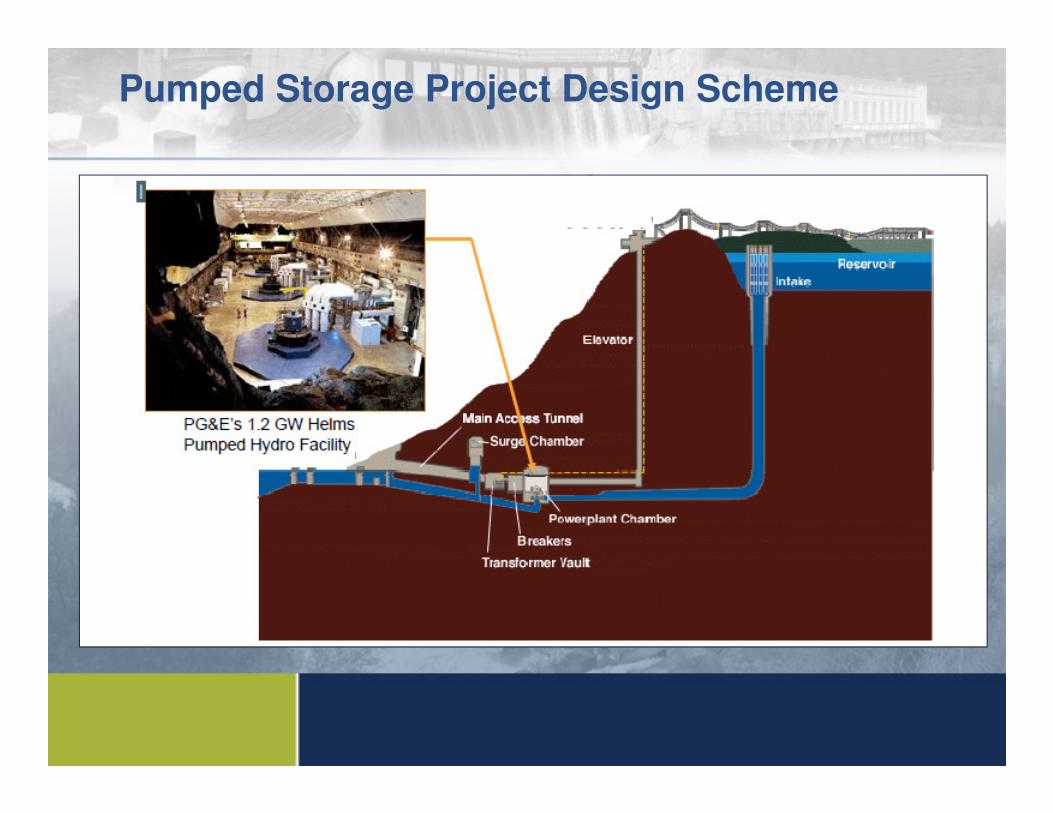
Pumped Storage Project Design Scheme
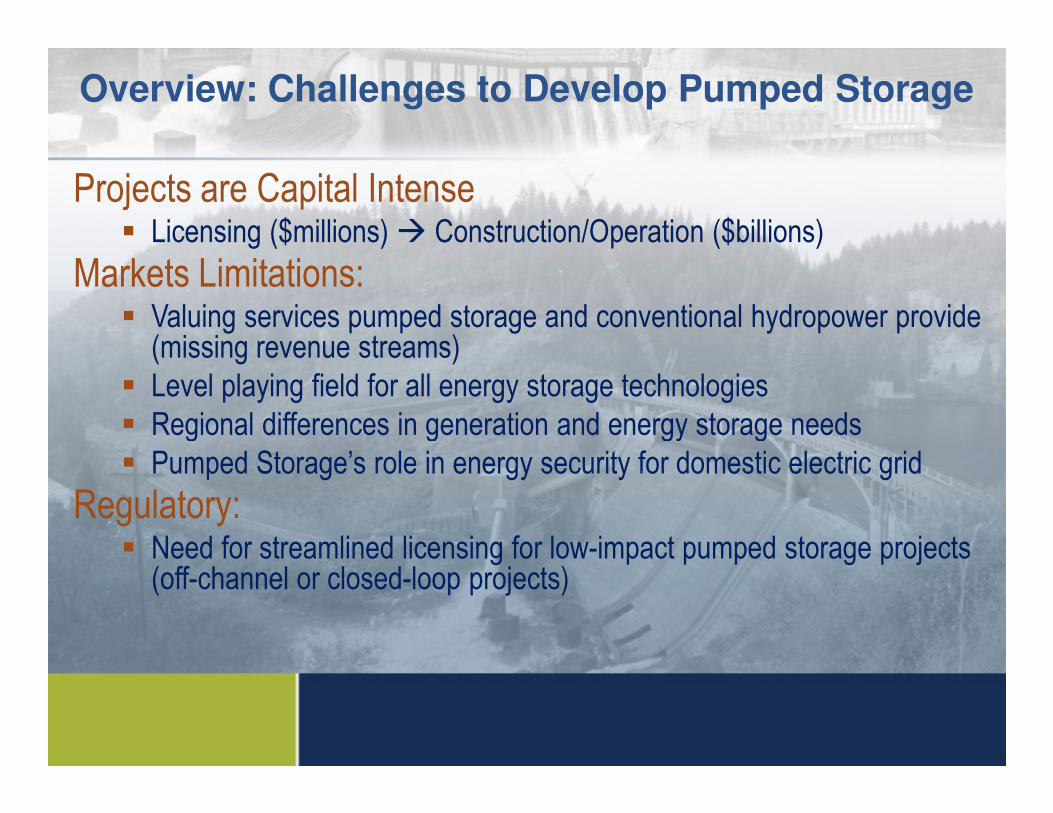
Overview: Challenges to Develop Pumped Storage
Projects are Capital Intense� Licensing ($millions) � Construction/Operation ($billions)
Markets Limitations: � Valuing services pumped storage and conventional hydropower provide (missing revenue streams)
� Level playing field for all energy storage technologies� Regional differences in generation and energy storage needs� Regional differences in generation and energy storage needs� Pumped Storage’s role in energy security for domestic electric grid
Regulatory:� Need for streamlined licensing for low-impact pumped storage projects (off-channel or closed-loop projects)
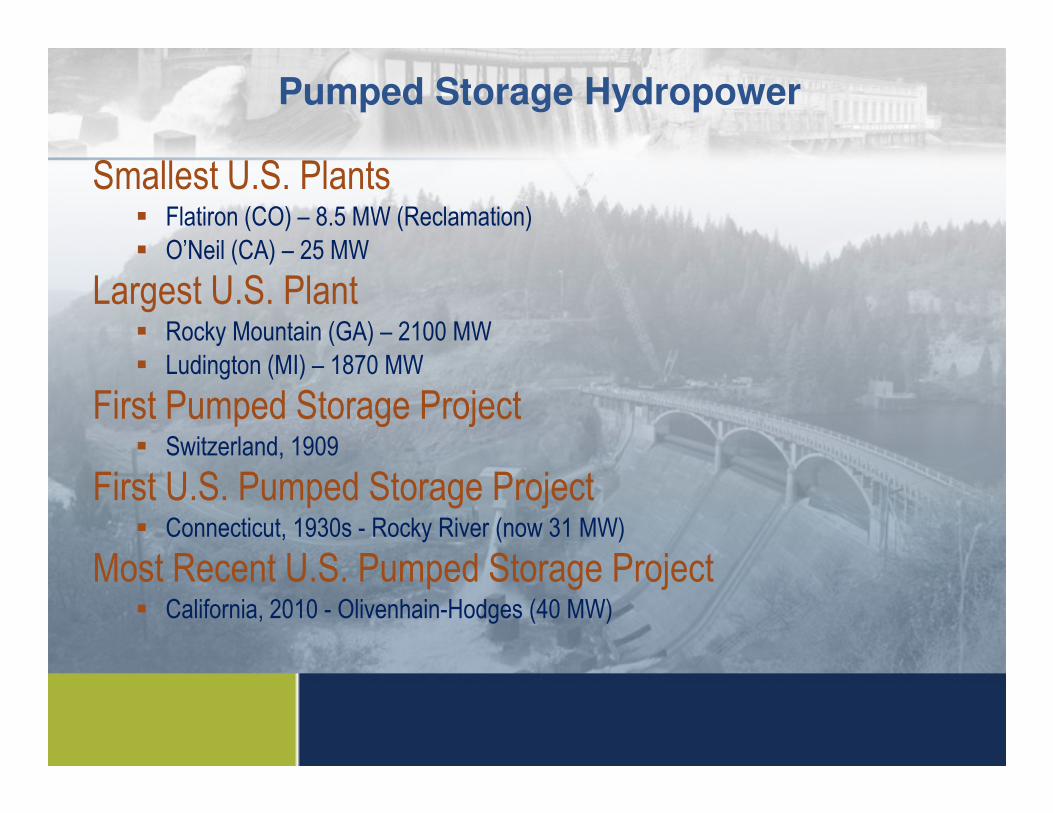
Pumped Storage Hydropower
Smallest U.S. Plants� Flatiron (CO) – 8.5 MW (Reclamation)
� O’Neil (CA) – 25 MW
Largest U.S. Plant � Rocky Mountain (GA) – 2100 MW
� Ludington (MI) – 1870 MW
First Pumped Storage ProjectFirst Pumped Storage Project� Switzerland, 1909
First U.S. Pumped Storage Project� Connecticut, 1930s - Rocky River (now 31 MW)
Most Recent U.S. Pumped Storage Project� California, 2010 - Olivenhain-Hodges (40 MW)
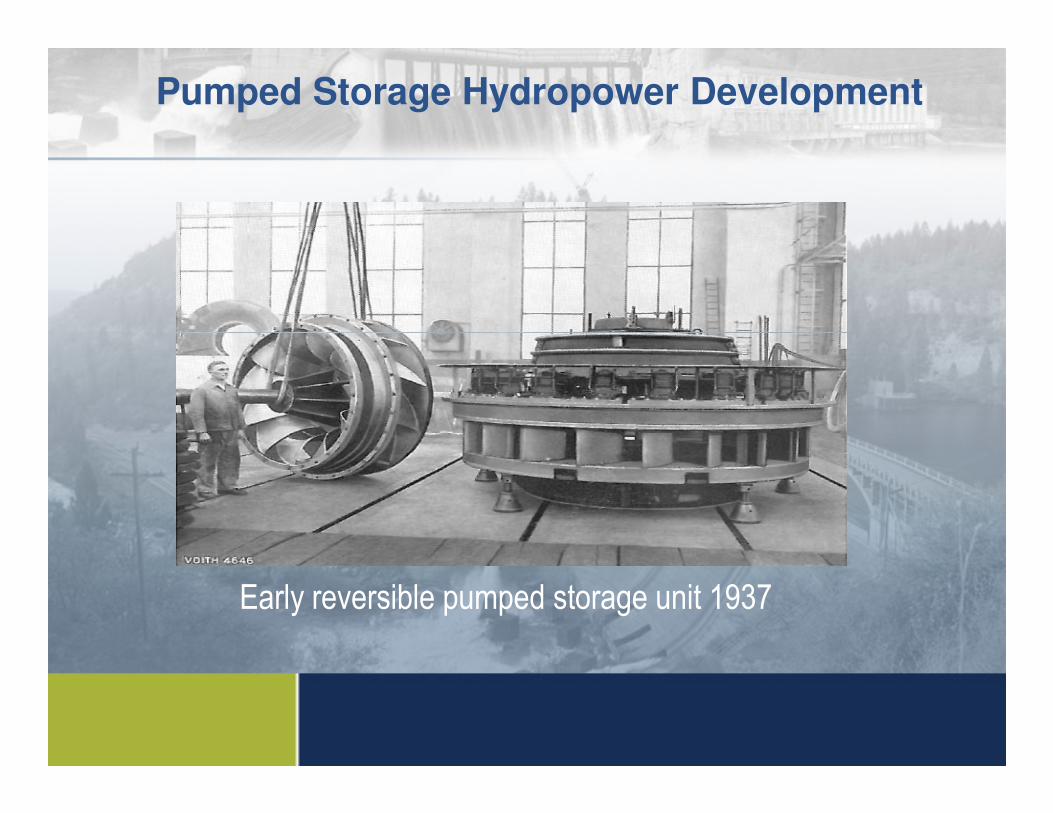
Pumped Storage Hydropower Development
Early reversible pumped storage unit 1937
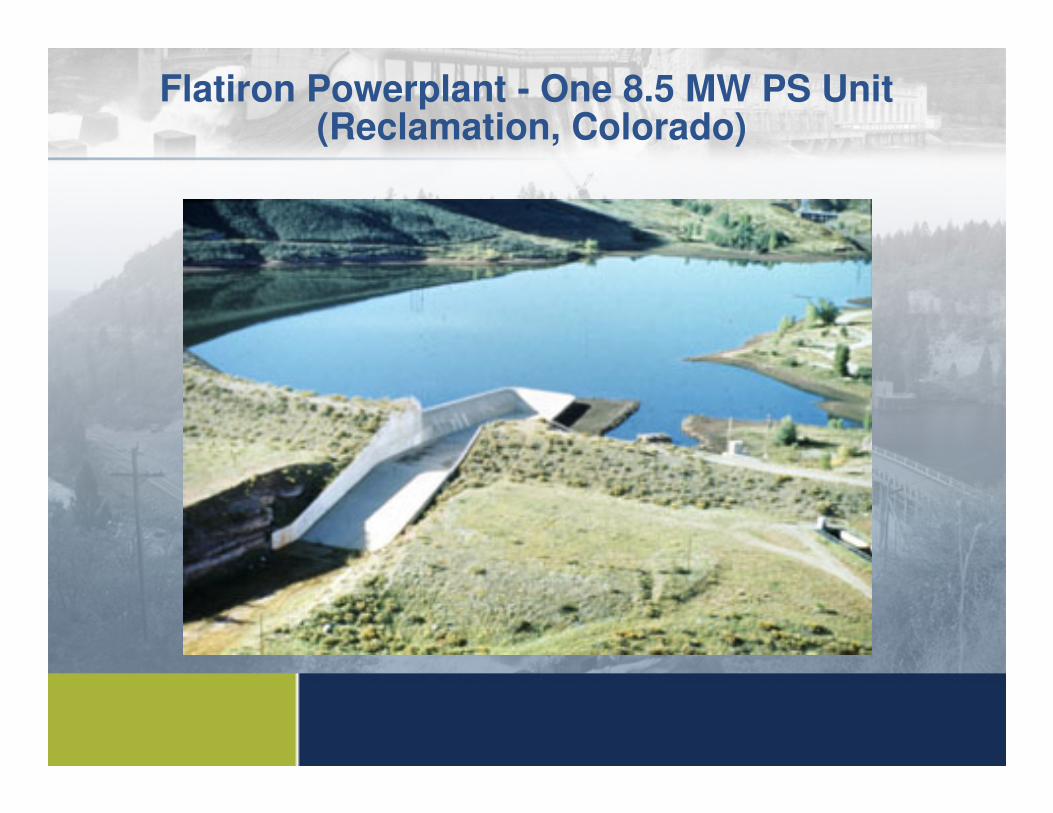
Flatiron Powerplant - One 8.5 MW PS Unit(Reclamation, Colorado)
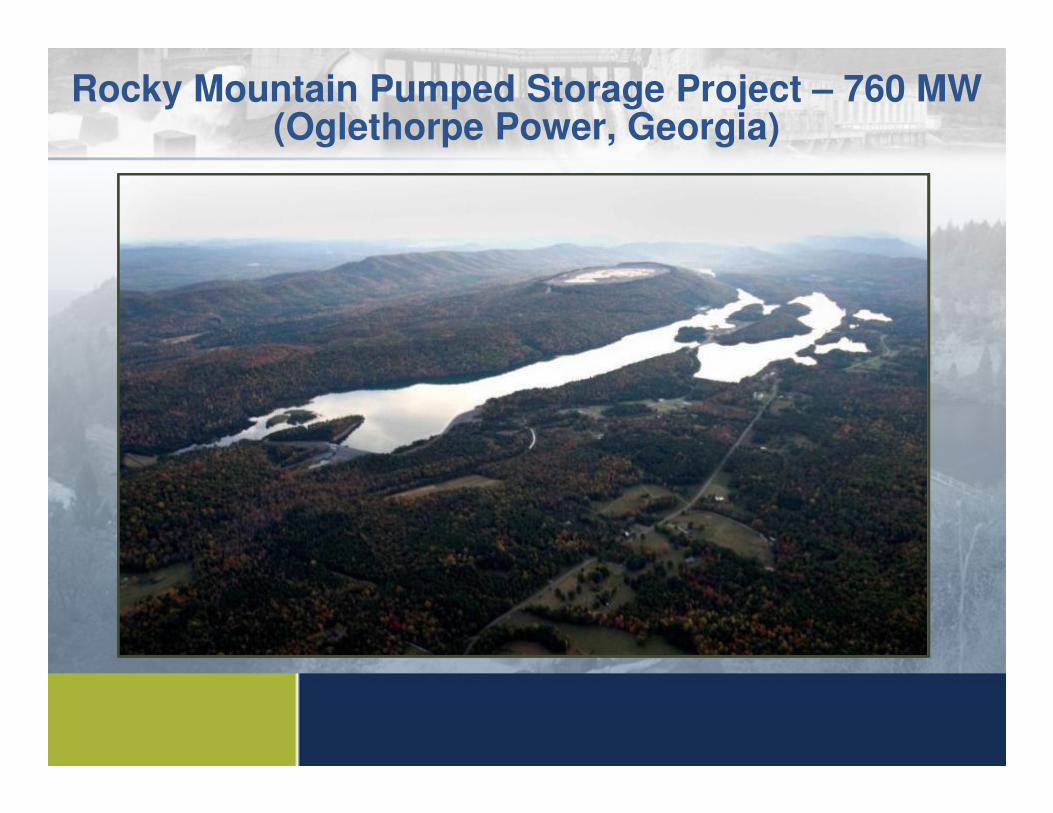
Rocky Mountain Pumped Storage Project – 760 MW (Oglethorpe Power, Georgia)
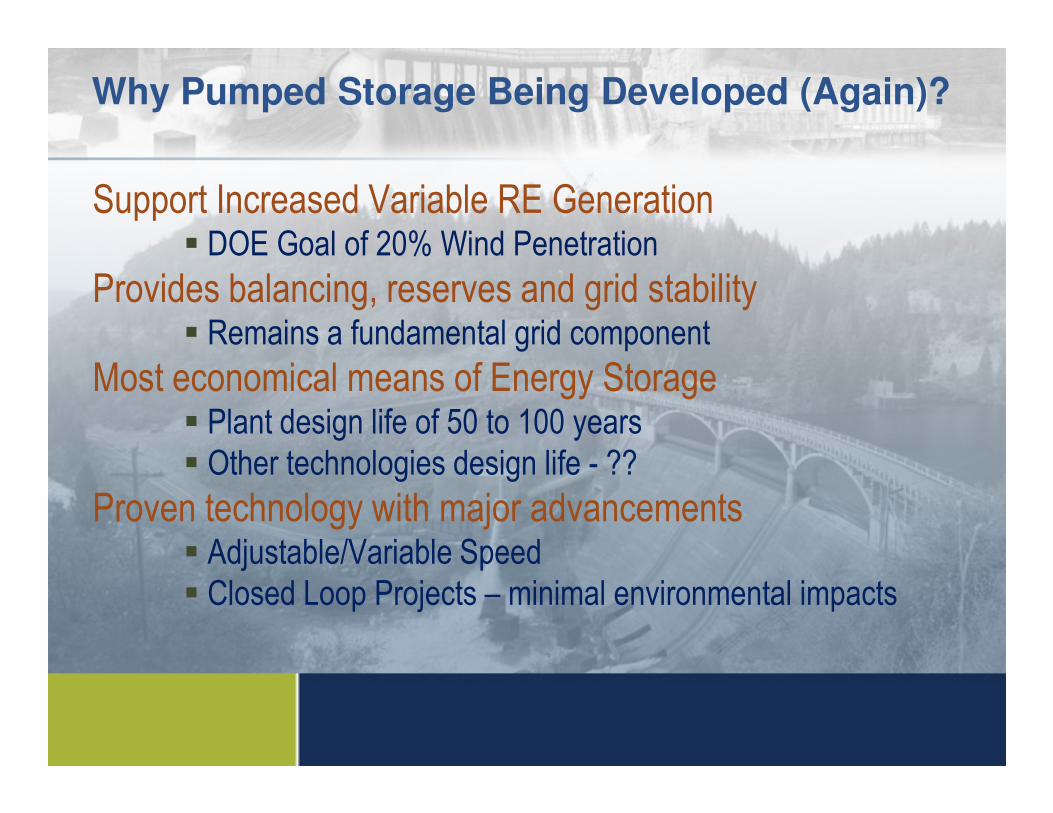
Why Pumped Storage Being Developed (Again)?
Support Increased Variable RE Generation� DOE Goal of 20% Wind Penetration
Provides balancing, reserves and grid stability� Remains a fundamental grid component
Most economical means of Energy Storage� Plant design life of 50 to 100 years� Plant design life of 50 to 100 years� Other technologies design life - ??
Proven technology with major advancements� Adjustable/Variable Speed � Closed Loop Projects – minimal environmental impacts
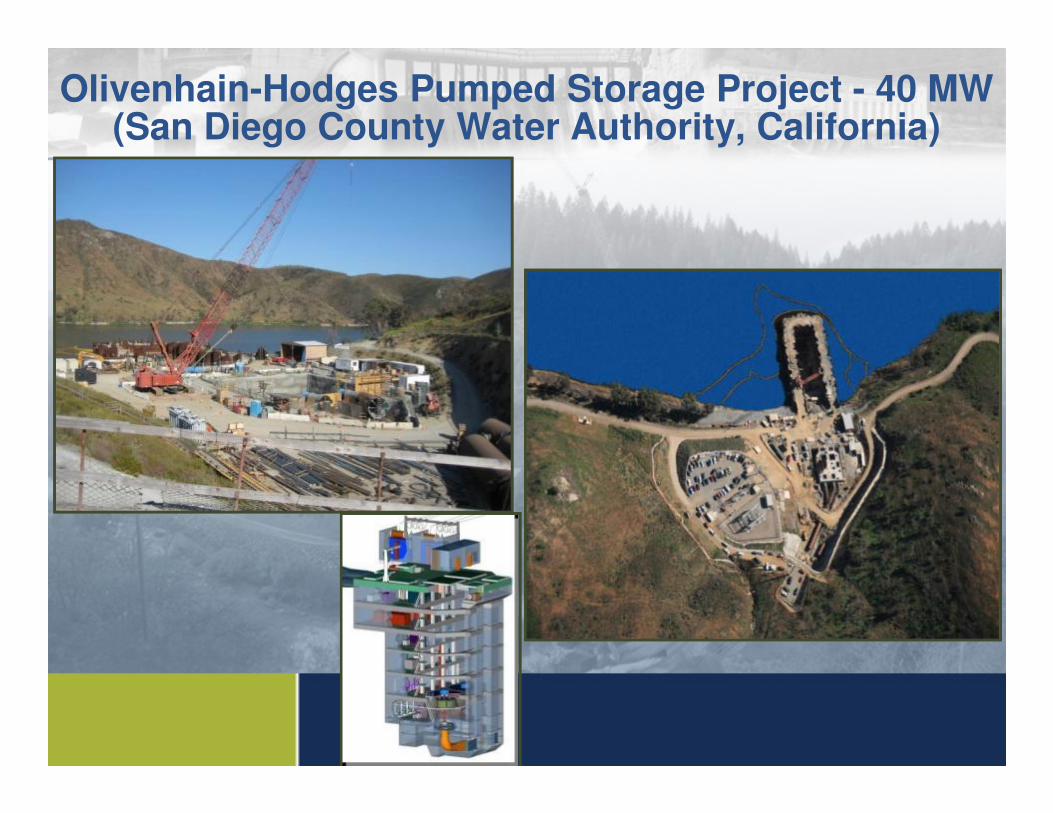
Olivenhain-Hodges Pumped Storage Project - 40 MW (San Diego County Water Authority, California)
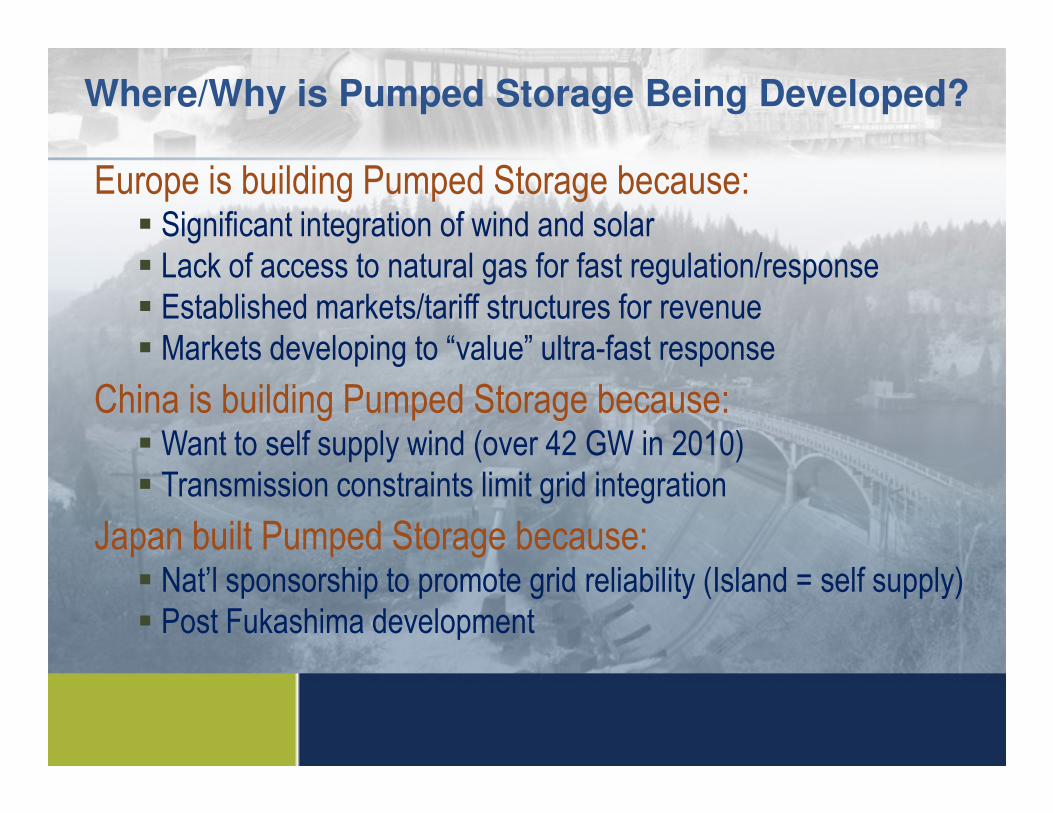
Where/Why is Pumped Storage Being Developed?
Europe is building Pumped Storage because:� Significant integration of wind and solar� Lack of access to natural gas for fast regulation/response� Established markets/tariff structures for revenue� Markets developing to “value” ultra-fast response
China is building Pumped Storage because:China is building Pumped Storage because:� Want to self supply wind (over 42 GW in 2010)� Transmission constraints limit grid integration
Japan built Pumped Storage because:� Nat’l sponsorship to promote grid reliability (Island = self supply)� Post Fukashima development
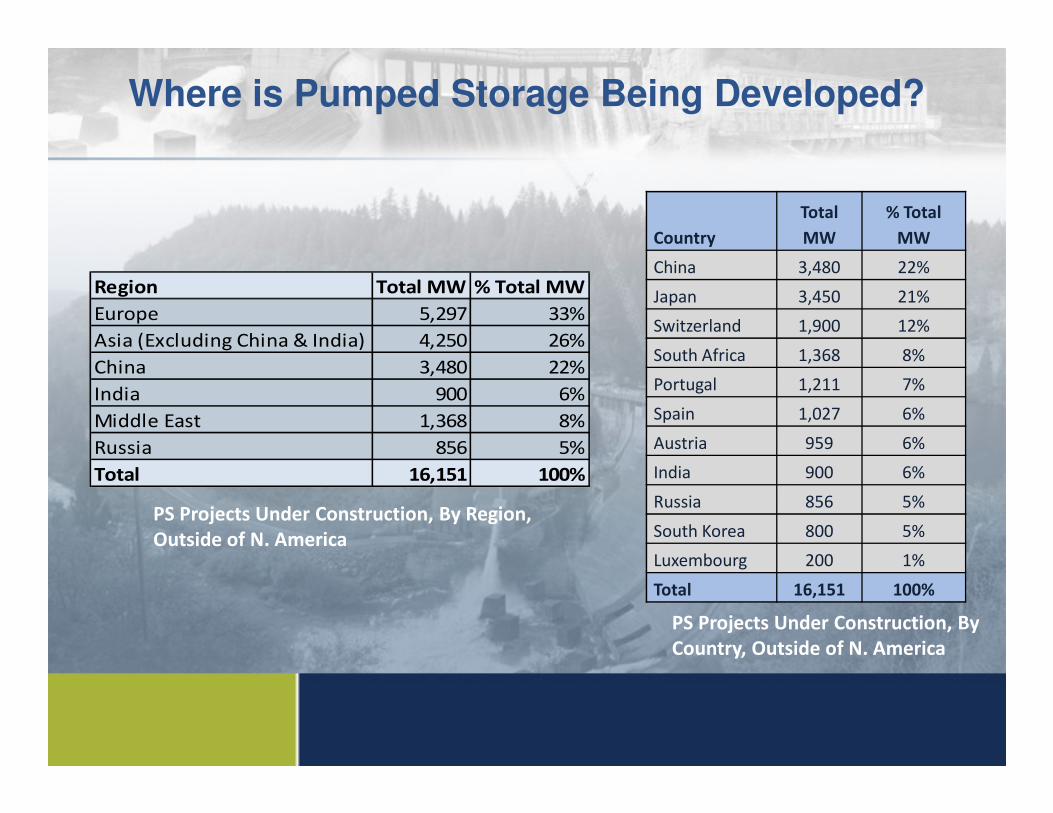
Where is Pumped Storage Being Developed?
Country
Total
MW
% Total
MW
China 3,480 22%
Japan 3,450 21%
Switzerland 1,900 12%
South Africa 1,368 8%
Portugal 1,211 7%
Spain 1,027 6%
Region Total MW % Total MW
Europe 5,297 33%
Asia (Excluding China & India) 4,250 26%
China 3,480 22%
India 900 6%Spain 1,027 6%
Austria 959 6%
India 900 6%
Russia 856 5%
South Korea 800 5%
Luxembourg 200 1%
Total 16,151 100%
Middle East 1,368 8%
Russia 856 5%
Total 16,151 100%
PS Projects Under Construction, By
Country, Outside of N. America
PS Projects Under Construction, By Region,
Outside of N. America
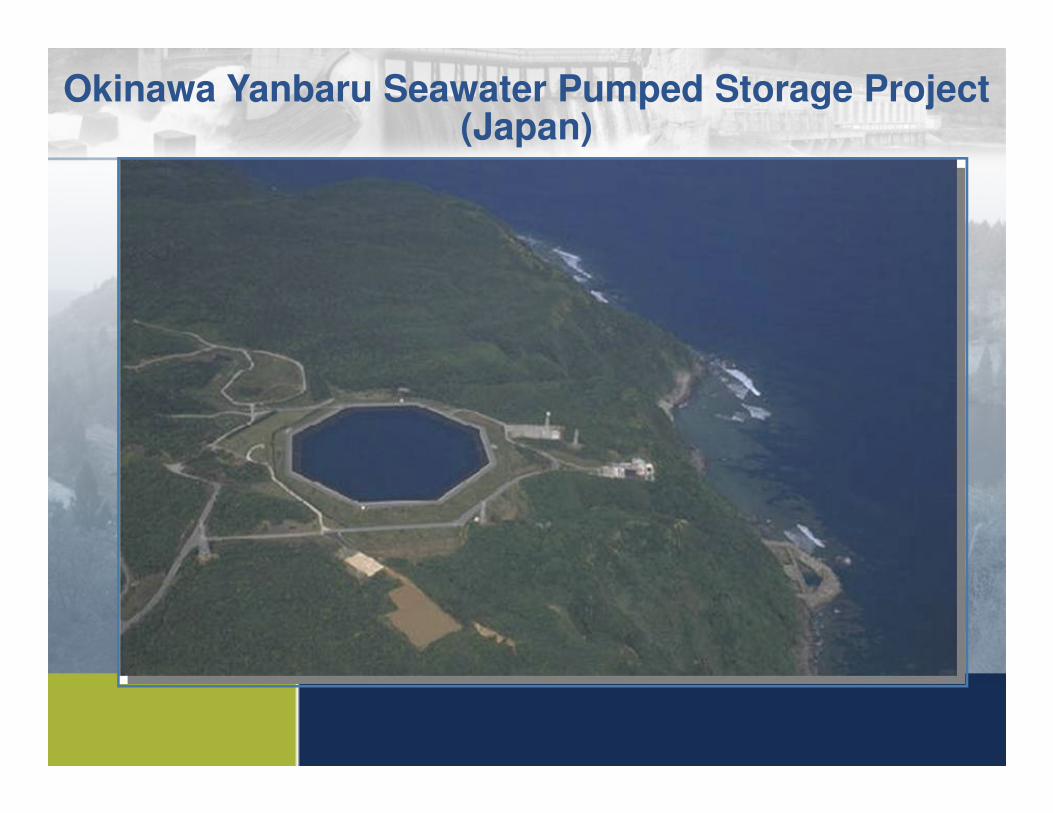
Okinawa Yanbaru Seawater Pumped Storage Project (Japan)
Agenda
� General Overview – Historic Perspective� Variable Renewable Energy Integration• Maximizing RE Value
� Siting a Pumped Storage Project� Water Resource Needs� Transmission Needs & Siting � Transmission Needs & Siting � Overview of Markets
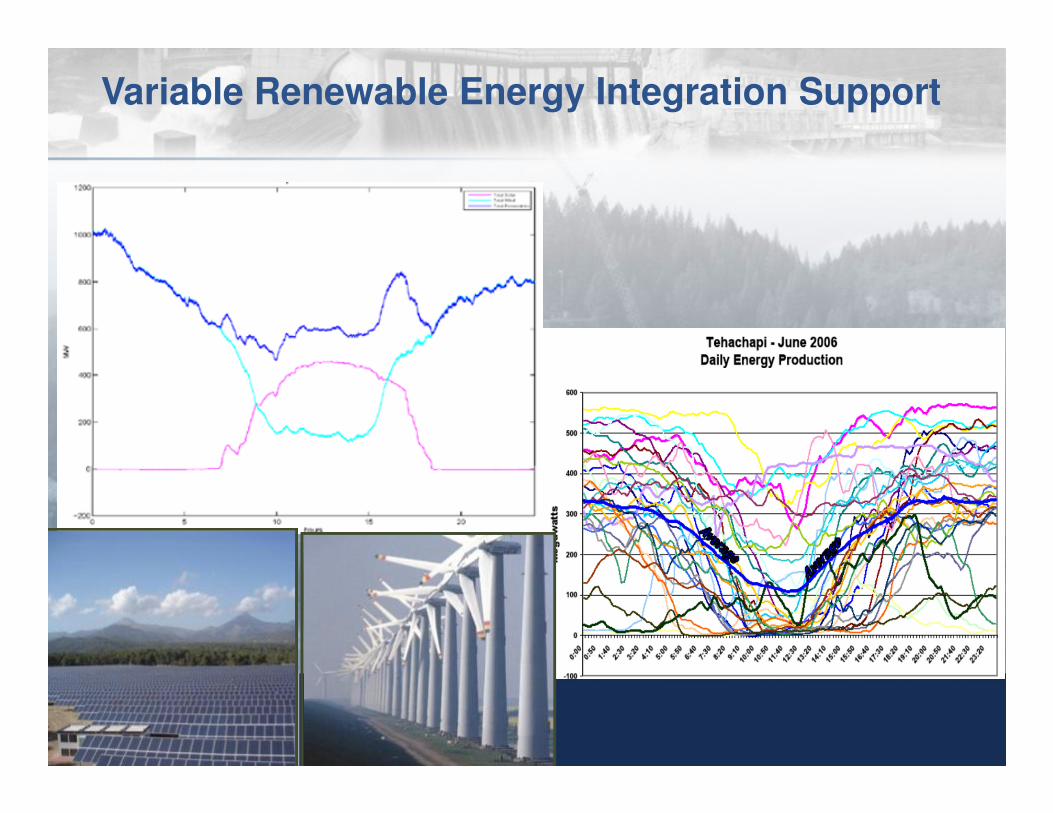
Variable Renewable Energy Integration Support
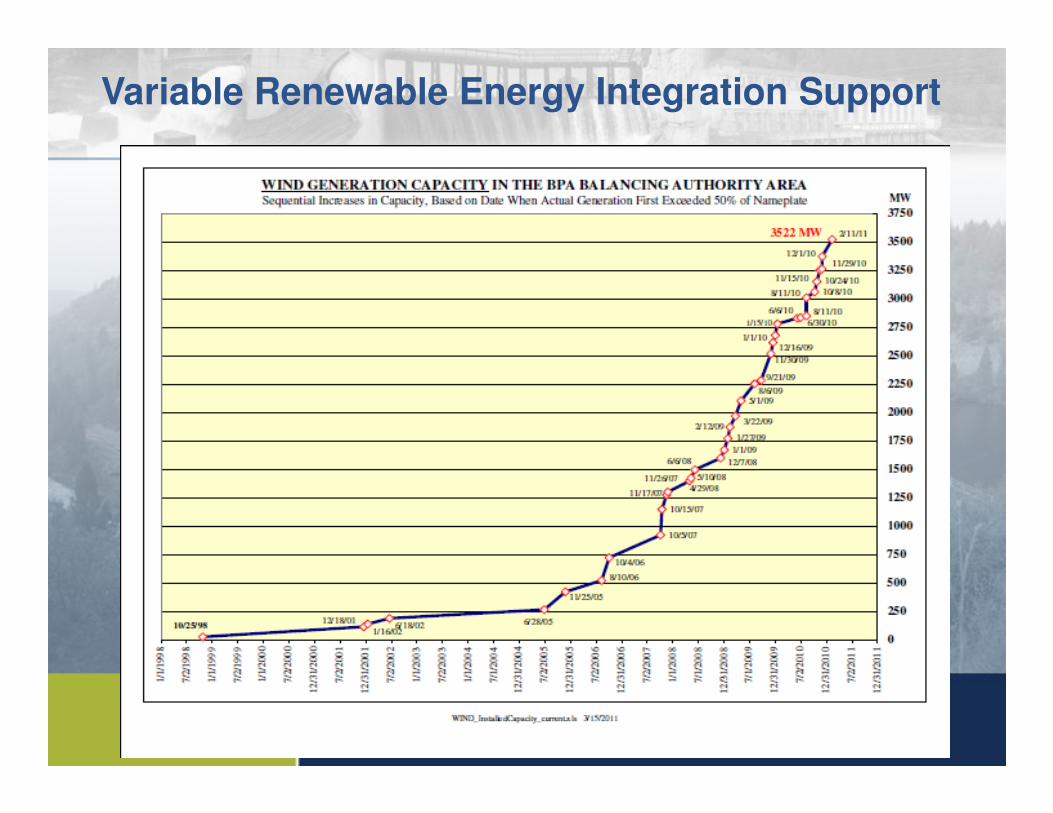
Variable Renewable Energy Integration Support
Agenda
� General Overview – Historic Perspective� Variable Renewable Energy Integration� Siting a Pumped Storage Project� Water Resource Needs� Transmission Needs & Siting � Overview of Markets � Overview of Markets
Siting a Pumped Storage Project
General Steps for • Physical Evaluation
� Elevation (head)� Availability to water (surface, ground or treated)� Geology (seismic and underground conditions)� Access to roads, transmission, etc.� Access to roads, transmission, etc.
• Regulatory� FERC Preliminary Permit� PAD and Environmental Studies� License Application� NEPA, CWA, ESA, etc.
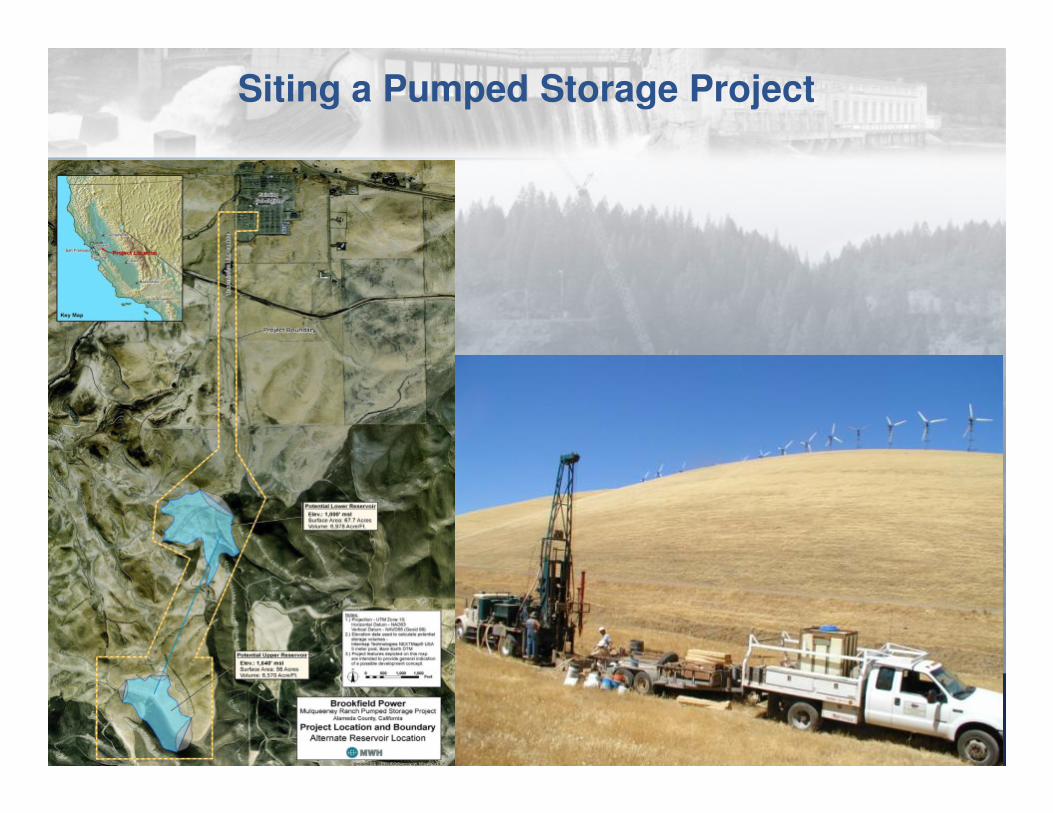
Siting a Pumped Storage Project
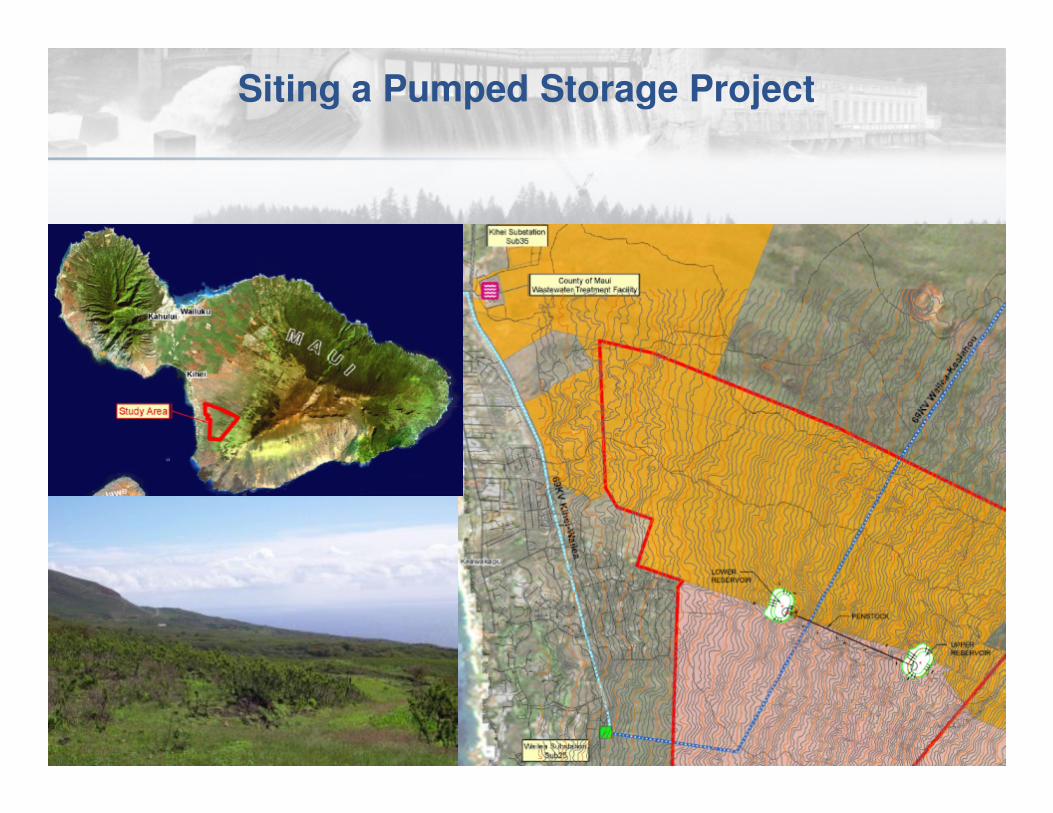
Siting a Pumped Storage Project
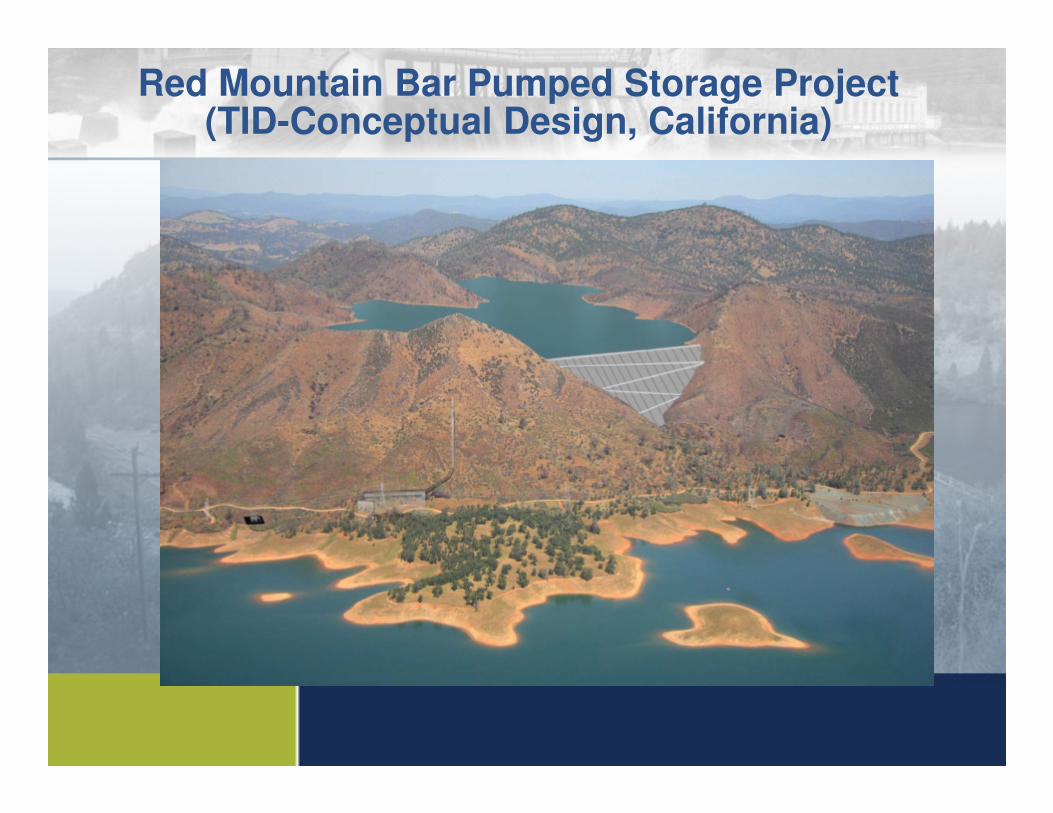
Red Mountain Bar Pumped Storage Project (TID-Conceptual Design, California)
Agenda
� General Overview – Historic Perspective� Variable Renewable Energy Integration� Siting a Pumped Storage Project� Water Resource Needs• Surface or Groundwater• Open or Closed Loop• Open or Closed Loop• Seasonal Management
� Transmission Needs & Siting � Overview of Markets
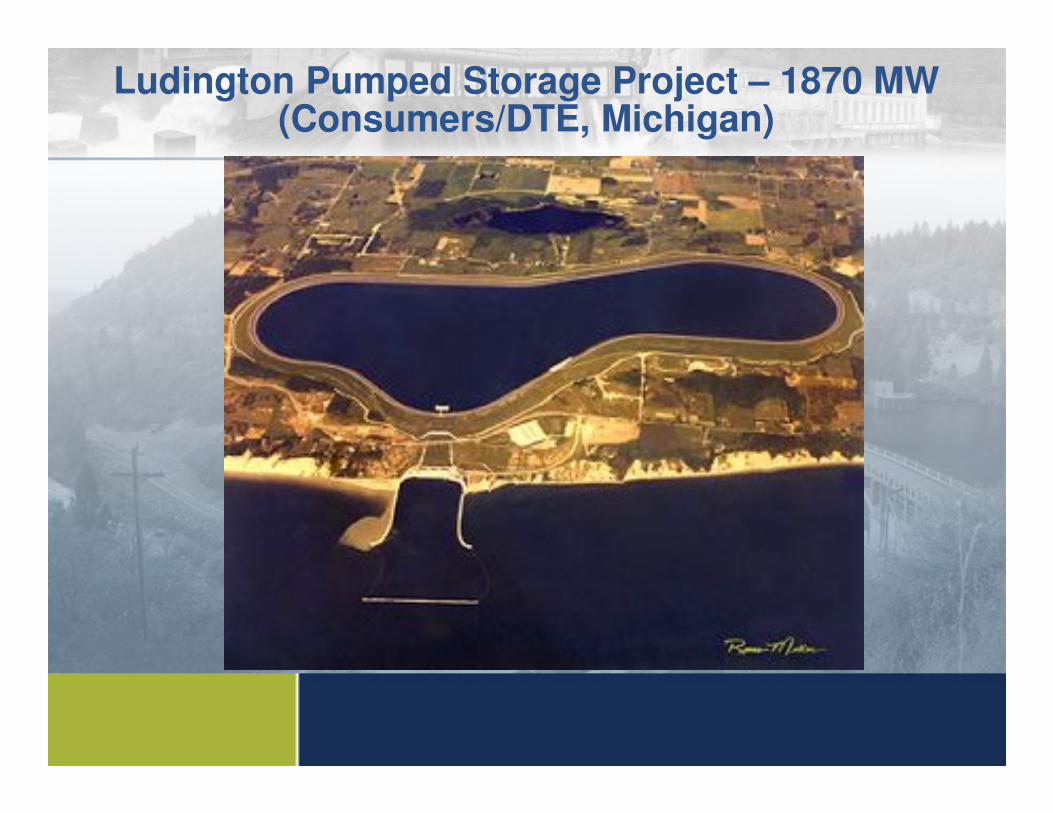
Ludington Pumped Storage Project – 1870 MW (Consumers/DTE, Michigan)
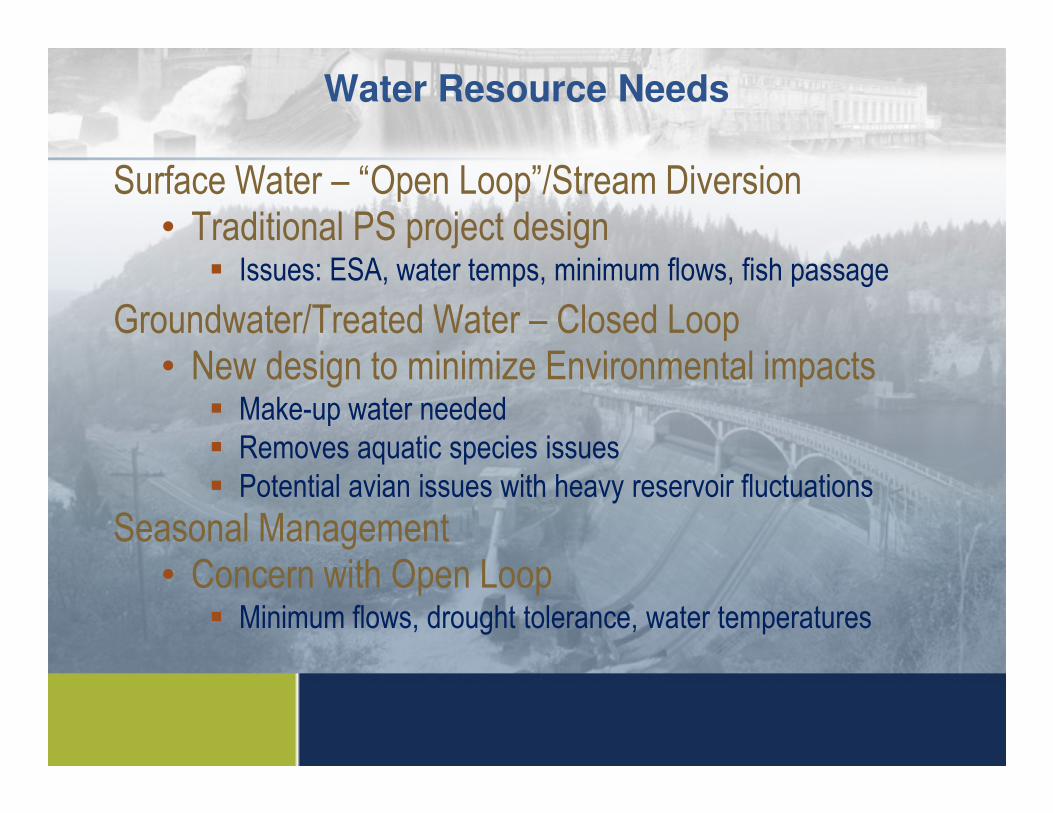
Water Resource Needs
Surface Water – “Open Loop”/Stream Diversion• Traditional PS project design
� Issues: ESA, water temps, minimum flows, fish passage
Groundwater/Treated Water – Closed Loop• New design to minimize Environmental impacts
� Make-up water needed� Make-up water needed� Removes aquatic species issues� Potential avian issues with heavy reservoir fluctuations
Seasonal Management• Concern with Open Loop
� Minimum flows, drought tolerance, water temperatures
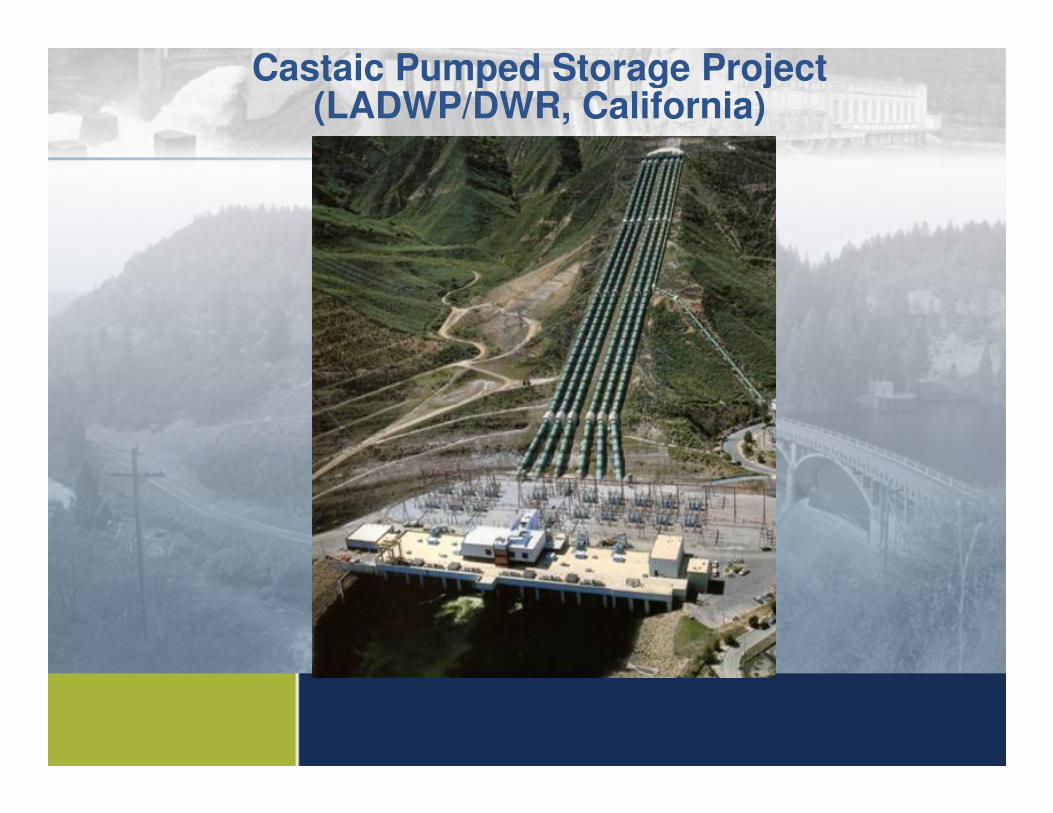
Castaic Pumped Storage Project (LADWP/DWR, California)
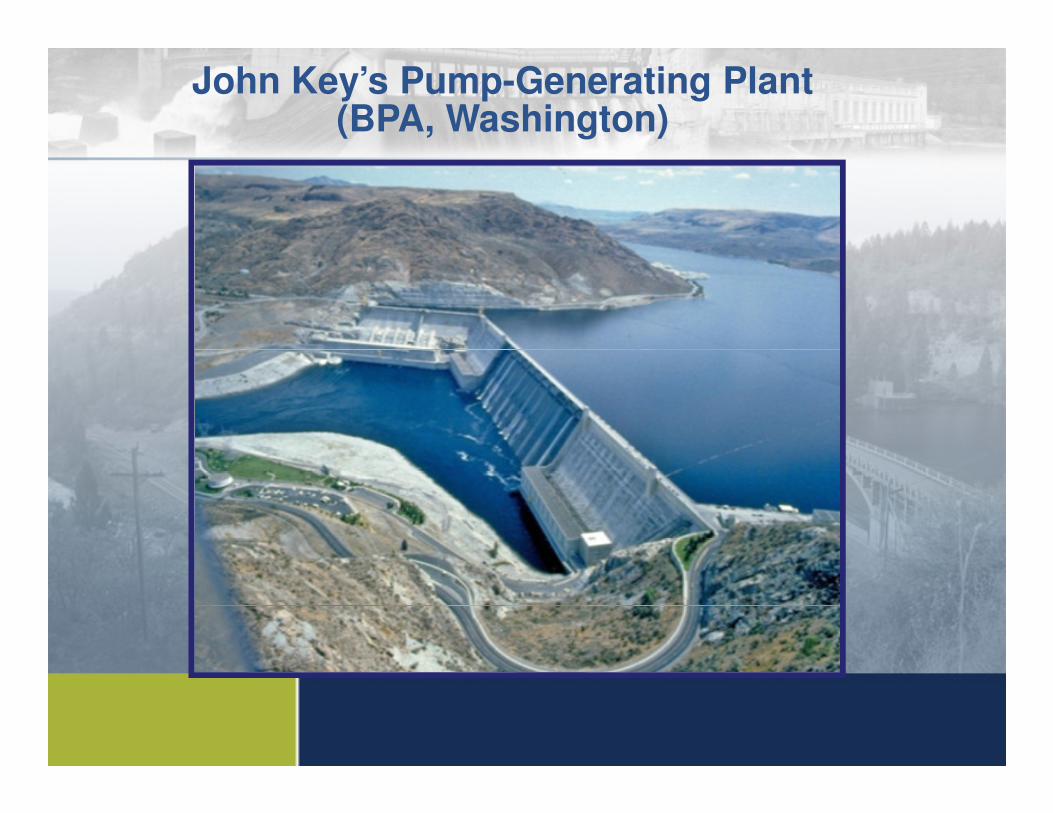
John Key’s Pump-Generating Plant (BPA, Washington)
Agenda
- General Overview – Historic Perspective- Variable Renewable Energy Integration• Maximizing RE Value
- Siting a Pumped Storage Project- Water Resource Needs- Transmission Needs & Siting - Transmission Needs & Siting - Overview of Markets
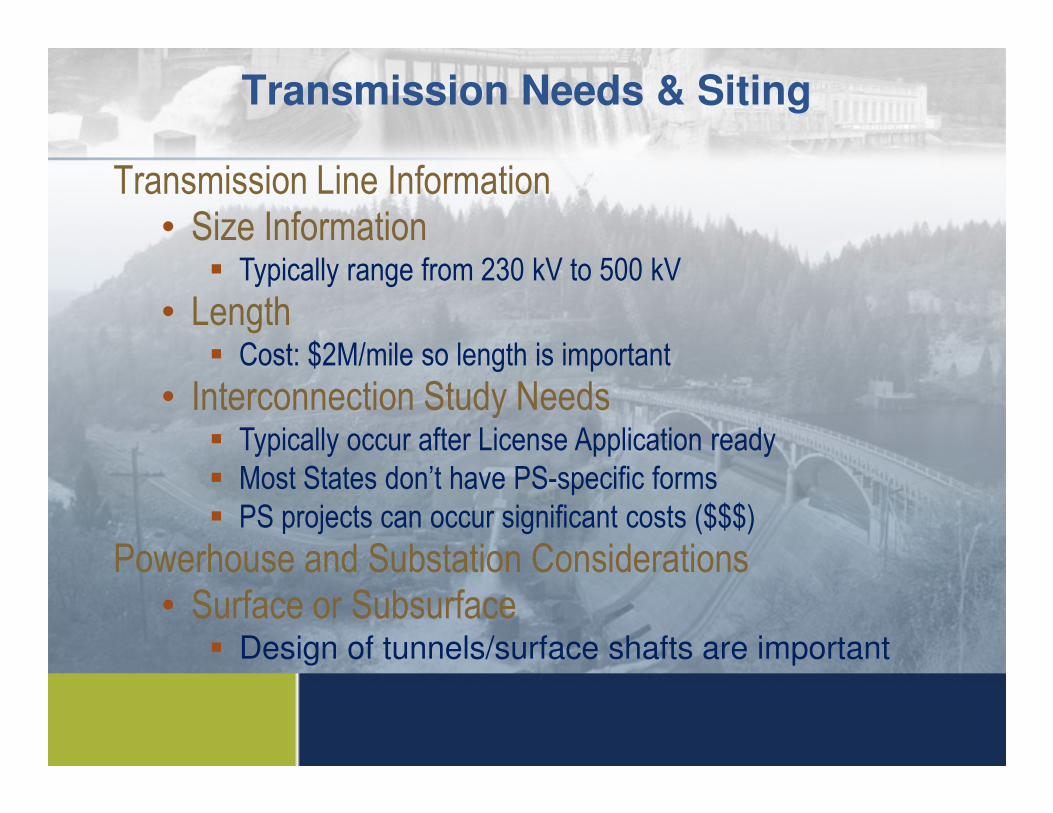
Transmission Needs & Siting
Transmission Line Information• Size Information
� Typically range from 230 kV to 500 kV
• Length� Cost: $2M/mile so length is important
• Interconnection Study Needs• Interconnection Study Needs� Typically occur after License Application ready� Most States don’t have PS-specific forms� PS projects can occur significant costs ($$$)
Powerhouse and Substation Considerations• Surface or Subsurface
� Design of tunnels/surface shafts are important
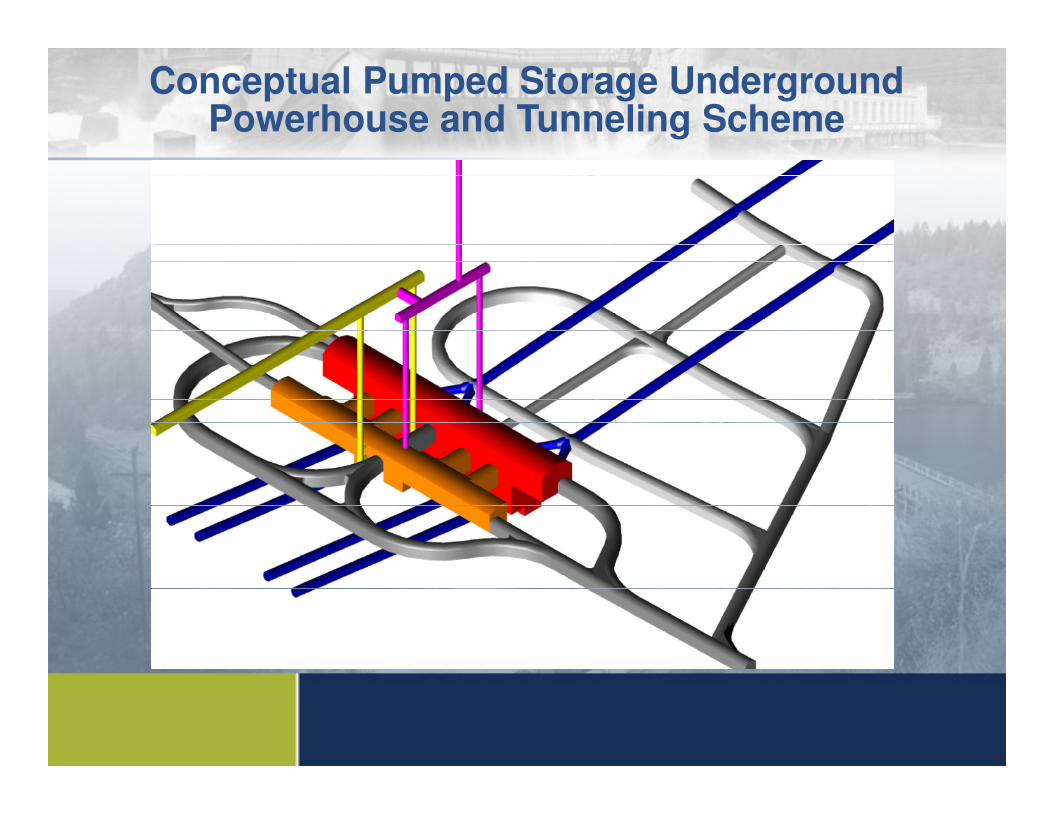
Conceptual Pumped Storage Underground Powerhouse and Tunneling Scheme
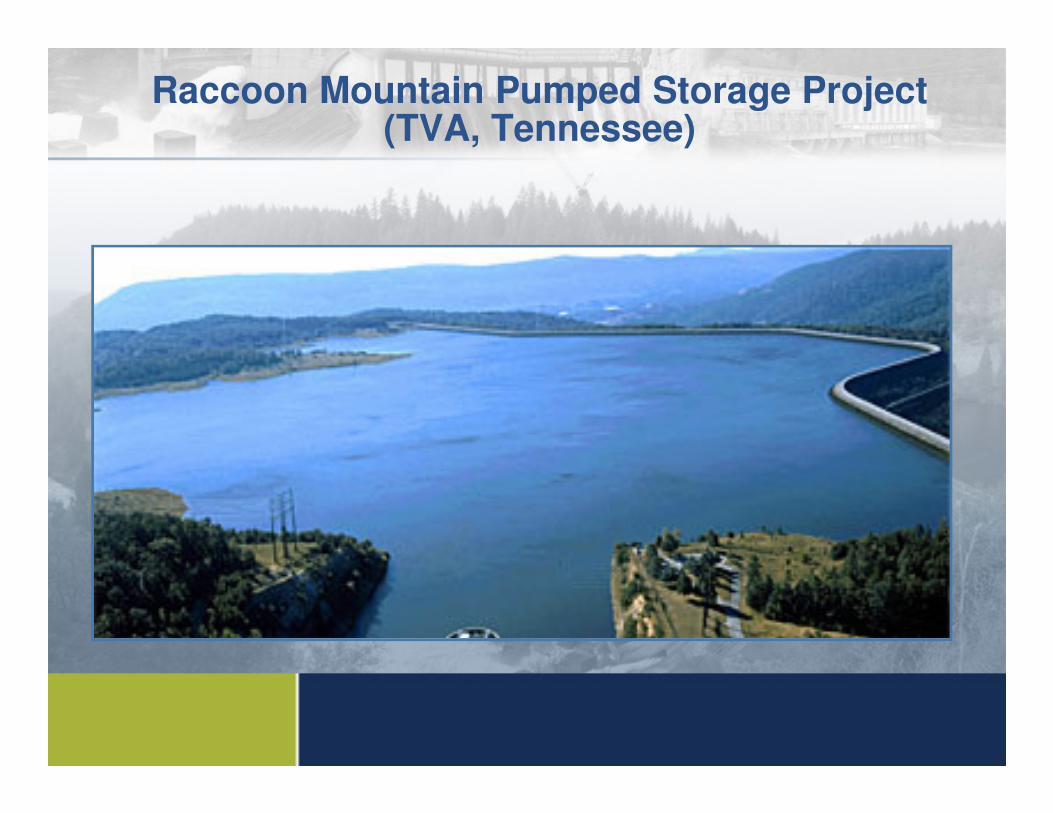
Raccoon Mountain Pumped Storage Project (TVA, Tennessee)
Agenda
� General Overview – Historic Perspective� Variable Renewable Energy Integration� Siting a Pumped Storage Project� Water Resource Needs� Transmission Needs & Siting � Overview of Markets � Overview of Markets • Market Barriers• Market Opportunities
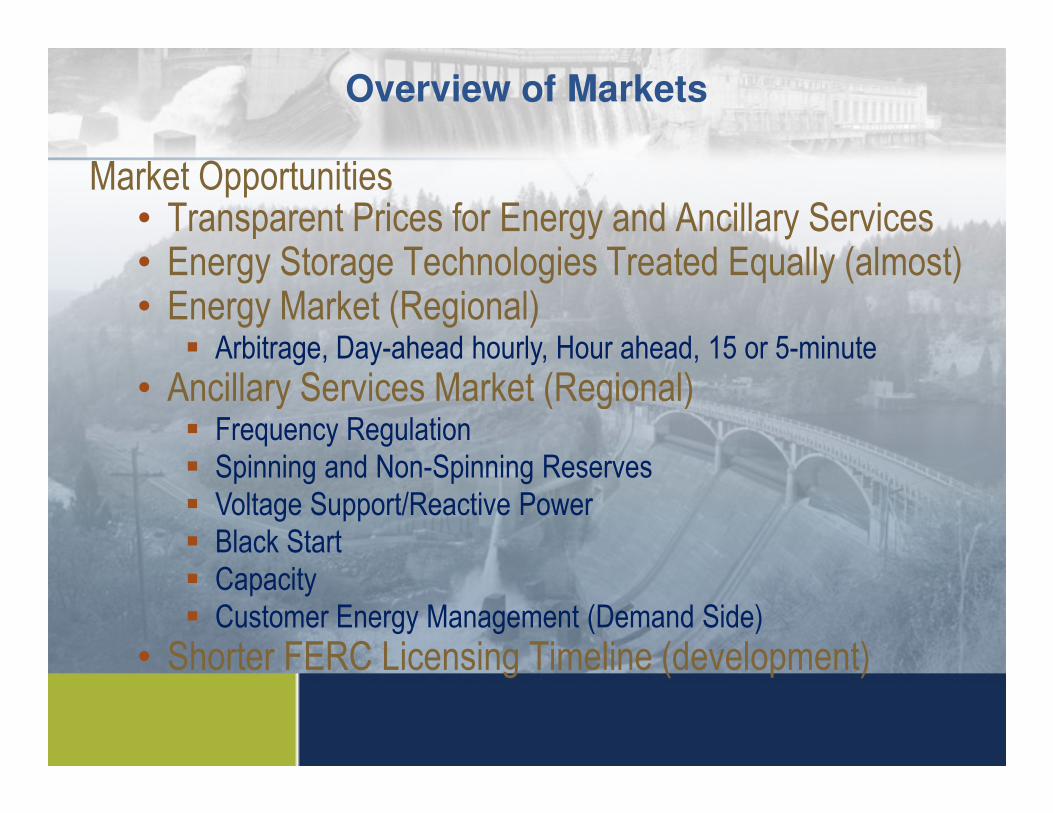
Overview of Markets
Market Opportunities• Transparent Prices for Energy and Ancillary Services• Energy Storage Technologies Treated Equally (almost)• Energy Market (Regional)
� Arbitrage, Day-ahead hourly, Hour ahead, 15 or 5-minute
• Ancillary Services Market (Regional)• Ancillary Services Market (Regional)� Frequency Regulation� Spinning and Non-Spinning Reserves� Voltage Support/Reactive Power� Black Start� Capacity� Customer Energy Management (Demand Side)
• Shorter FERC Licensing Timeline (development)
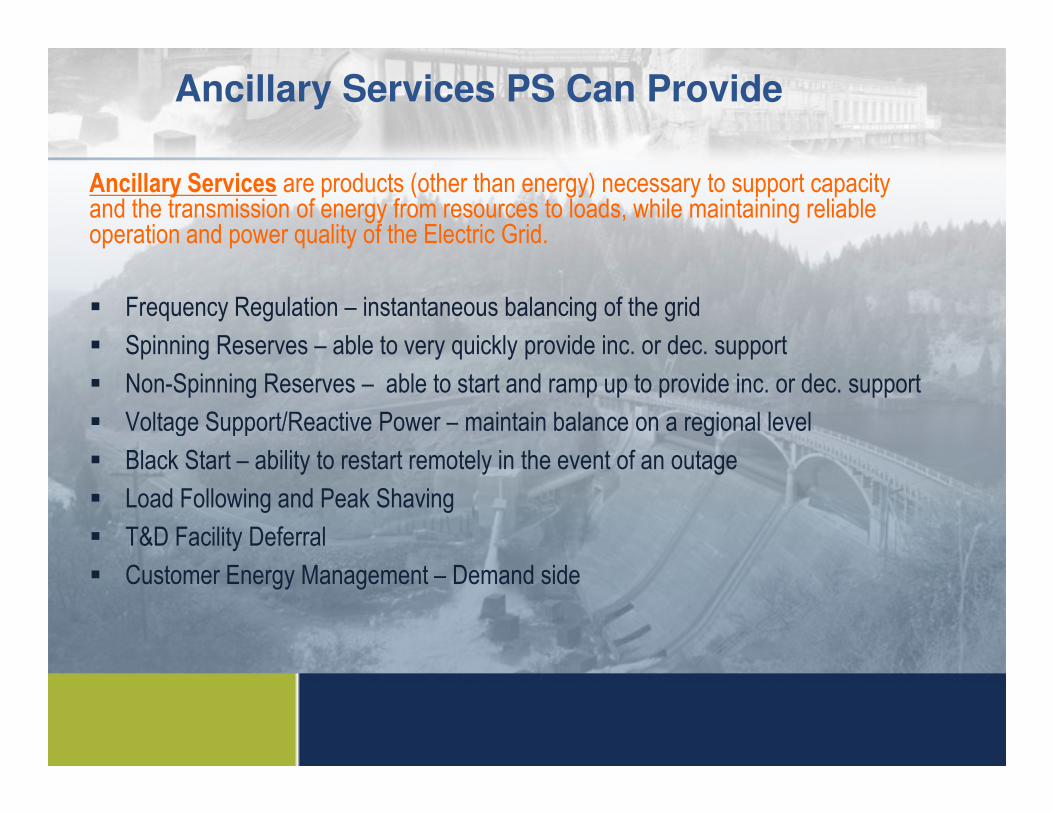
Ancillary Services PS Can Provide
Ancillary Services are products (other than energy) necessary to support capacity and the transmission of energy from resources to loads, while maintaining reliable operation and power quality of the Electric Grid.
� Frequency Regulation – instantaneous balancing of the grid
� Spinning Reserves – able to very quickly provide inc. or dec. support
� Non-Spinning Reserves – able to start and ramp up to provide inc. or dec. support
Voltage Support/Reactive Power – maintain balance on a regional level� Voltage Support/Reactive Power – maintain balance on a regional level
� Black Start – ability to restart remotely in the event of an outage
� Load Following and Peak Shaving
� T&D Facility Deferral
� Customer Energy Management – Demand side
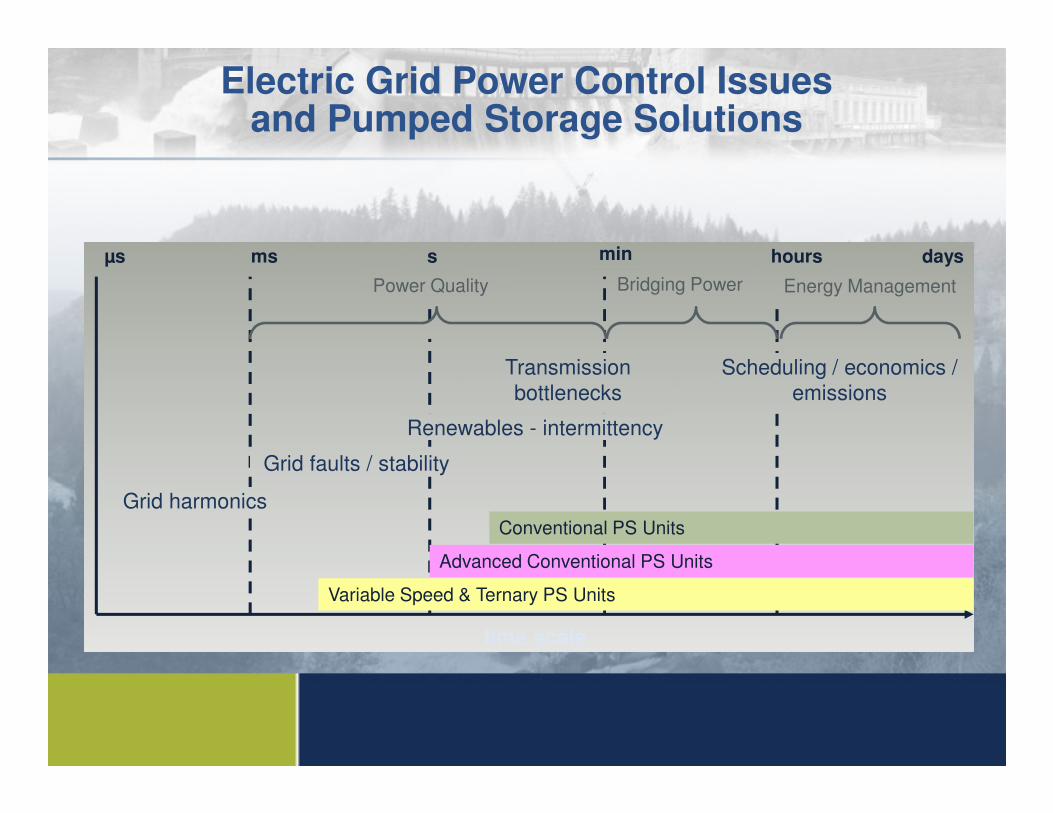
Electric Grid Power Control Issues and Pumped Storage Solutions
ms s minµs
Scheduling / economics /
emissions
Transmission
bottlenecks
hours days
Power Quality Bridging Power Energy Management
Grid harmonics
Grid faults / stability
Renewables - intermittency
Variable Speed & Ternary PS Units
Advanced Conventional PS Units
Conventional PS Units
time scale
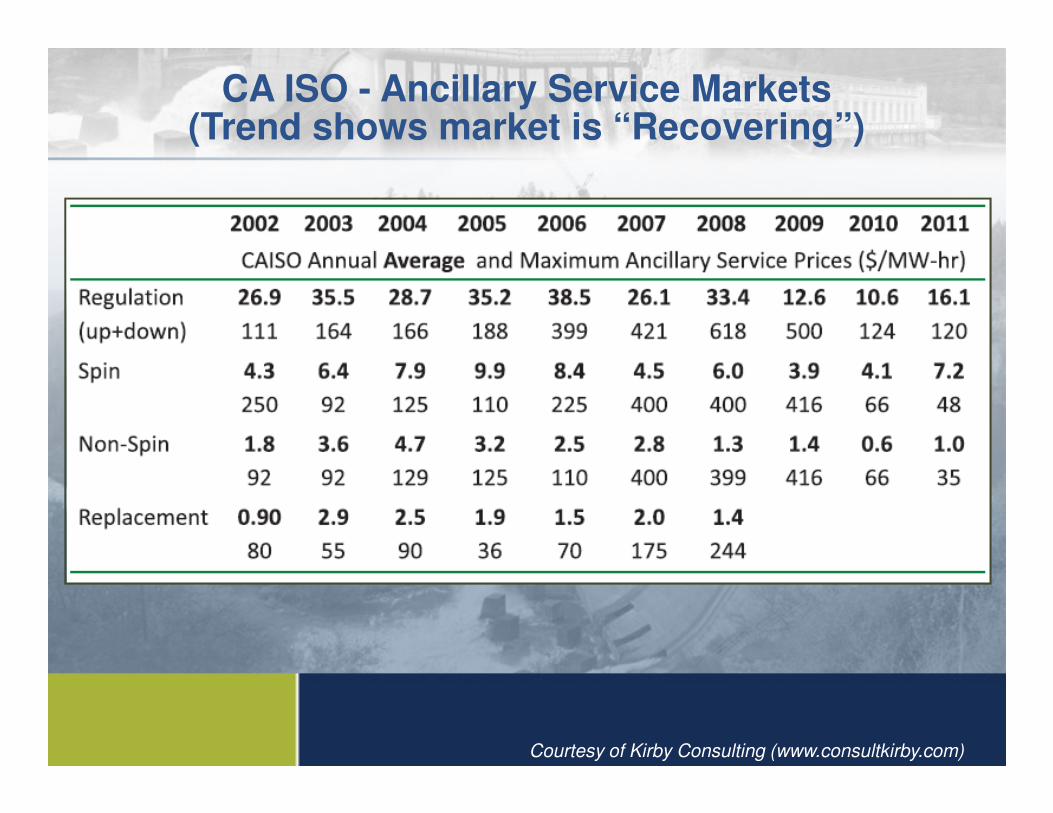
CA ISO - Ancillary Service Markets(Trend shows market is “Recovering”)
Courtesy of Kirby Consulting (www.consultkirby.com)
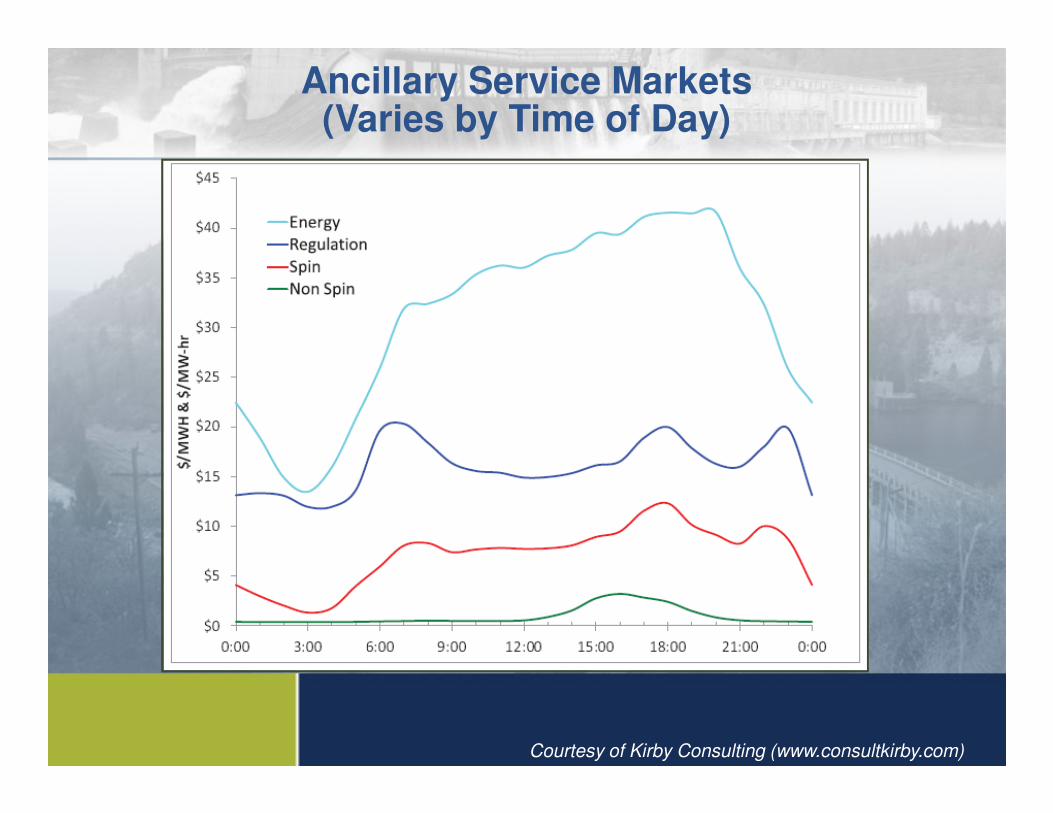
Ancillary Service Markets(Varies by Time of Day)
Courtesy of Kirby Consulting (www.consultkirby.com)
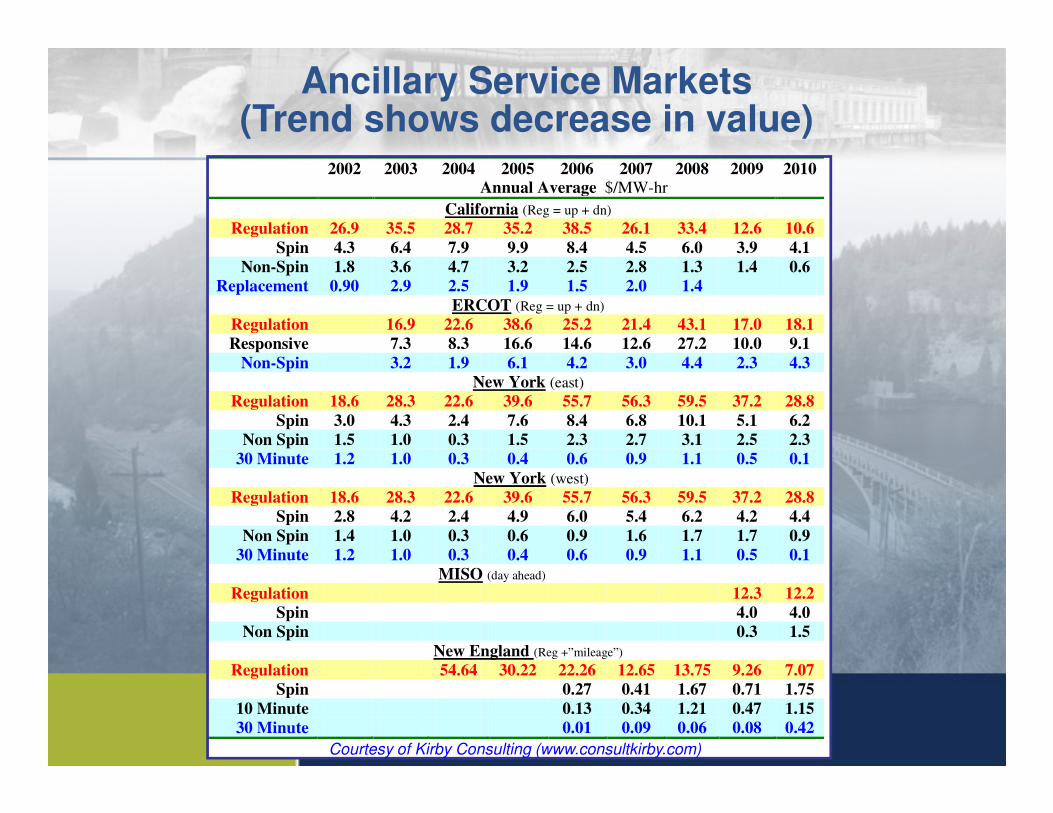
2002 2003 2004 2005 2006 2007 2008 2009 2010 Annual Average $/MW-hr
California (Reg = up + dn)
Regulation 26.9 35.5 28.7 35.2 38.5 26.1 33.4 12.6 10.6
Spin 4.3 6.4 7.9 9.9 8.4 4.5 6.0 3.9 4.1
Non-Spin 1.8 3.6 4.7 3.2 2.5 2.8 1.3 1.4 0.6
Replacement 0.90 2.9 2.5 1.9 1.5 2.0 1.4
ERCOT (Reg = up + dn)
Regulation 16.9 22.6 38.6 25.2 21.4 43.1 17.0 18.1
Responsive 7.3 8.3 16.6 14.6 12.6 27.2 10.0 9.1
Non-Spin 3.2 1.9 6.1 4.2 3.0 4.4 2.3 4.3
New York (east)
Regulation 18.6 28.3 22.6 39.6 55.7 56.3 59.5 37.2 28.8
Ancillary Service Markets(Trend shows decrease in value)
Regulation 18.6 28.3 22.6 39.6 55.7 56.3 59.5 37.2 28.8
Spin 3.0 4.3 2.4 7.6 8.4 6.8 10.1 5.1 6.2
Non Spin 1.5 1.0 0.3 1.5 2.3 2.7 3.1 2.5 2.3
30 Minute 1.2 1.0 0.3 0.4 0.6 0.9 1.1 0.5 0.1
New York (west)
Regulation 18.6 28.3 22.6 39.6 55.7 56.3 59.5 37.2 28.8
Spin 2.8 4.2 2.4 4.9 6.0 5.4 6.2 4.2 4.4
Non Spin 1.4 1.0 0.3 0.6 0.9 1.6 1.7 1.7 0.9
30 Minute 1.2 1.0 0.3 0.4 0.6 0.9 1.1 0.5 0.1
MISO (day ahead)
Regulation 12.3 12.2
Spin 4.0 4.0
Non Spin 0.3 1.5
New England (Reg +”mileage”)
Regulation 54.64 30.22 22.26 12.65 13.75 9.26 7.07
Spin 0.27 0.41 1.67 0.71 1.75
10 Minute 0.13 0.34 1.21 0.47 1.15
30 Minute 0.01 0.09 0.06 0.08 0.42
Courtesy of Kirby Consulting (www.consultkirby.com)
Overview of Markets
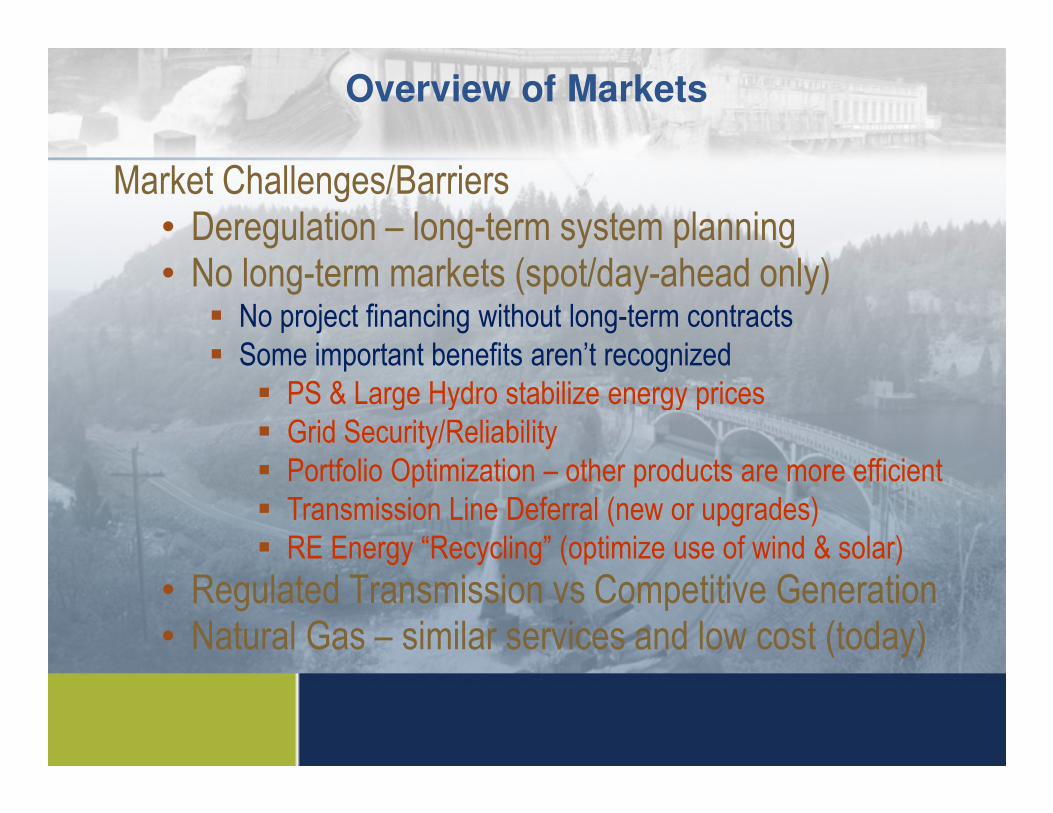
Market Challenges/Barriers• Deregulation – long-term system planning• No long-term markets (spot/day-ahead only)
� No project financing without long-term contracts� Some important benefits aren’t recognized
� PS & Large Hydro stabilize energy prices� PS & Large Hydro stabilize energy prices� Grid Security/Reliability� Portfolio Optimization – other products are more efficient� Transmission Line Deferral (new or upgrades)� RE Energy “Recycling” (optimize use of wind & solar)
• Regulated Transmission vs Competitive Generation• Natural Gas – similar services and low cost (today)
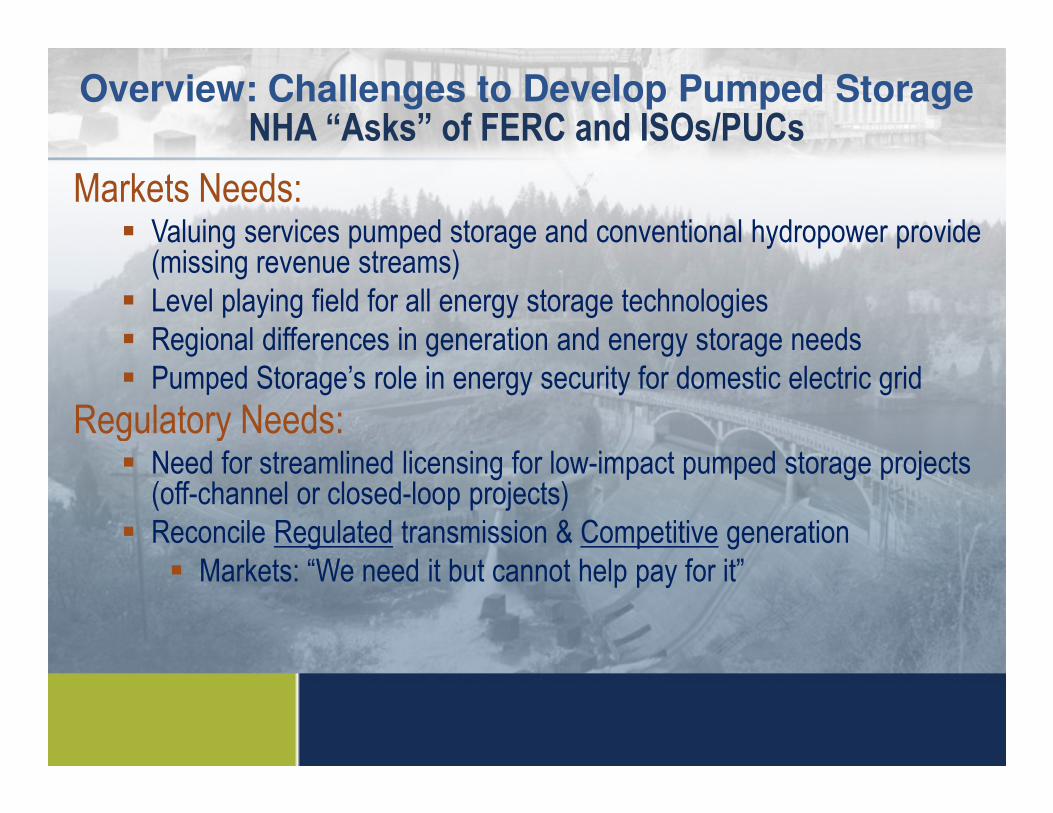
Overview: Challenges to Develop Pumped StorageNHA “Asks” of FERC and ISOs/PUCs
Markets Needs: � Valuing services pumped storage and conventional hydropower provide (missing revenue streams)
� Level playing field for all energy storage technologies� Regional differences in generation and energy storage needs� Pumped Storage’s role in energy security for domestic electric grid
Regulatory Needs:Regulatory Needs:� Need for streamlined licensing for low-impact pumped storage projects (off-channel or closed-loop projects)
� Reconcile Regulated transmission & Competitive generation� Markets: “We need it but cannot help pay for it”
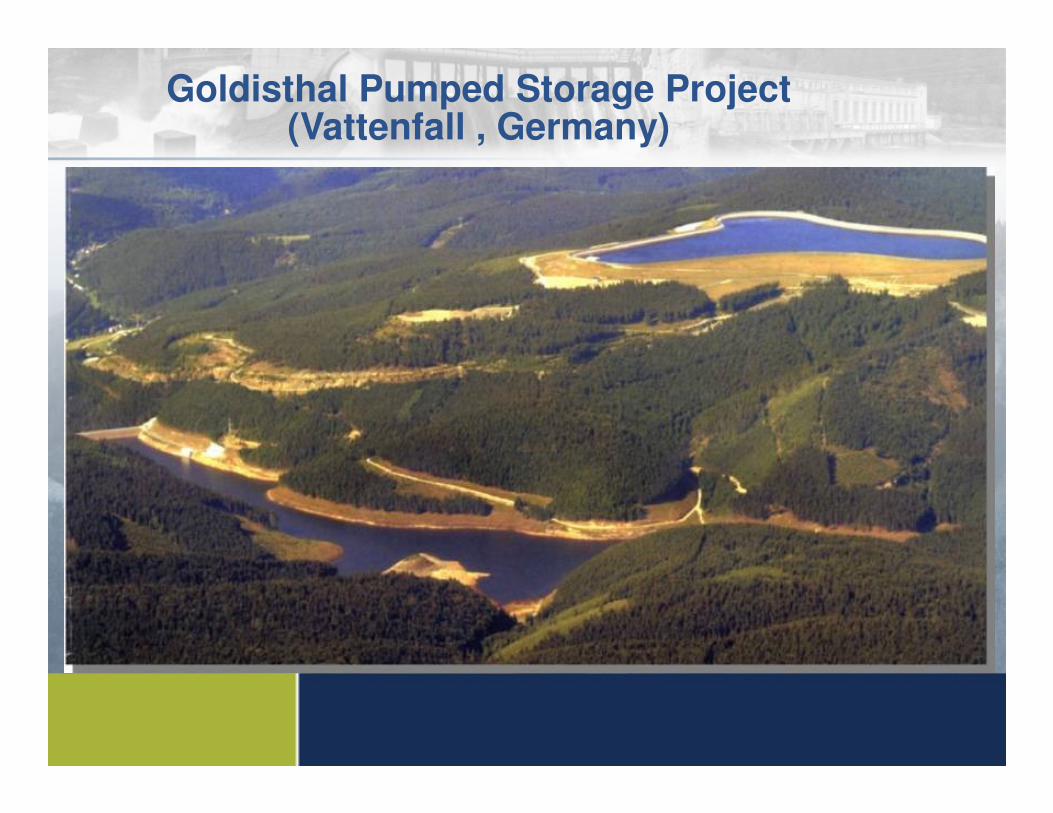
Goldisthal Pumped Storage Project (Vattenfall , Germany)
Michael Manwaring, HDR Engineering
Chair, NHA Pumped Storage Development Council
Questions?
Chair, NHA Pumped Storage Development Council
November 2012
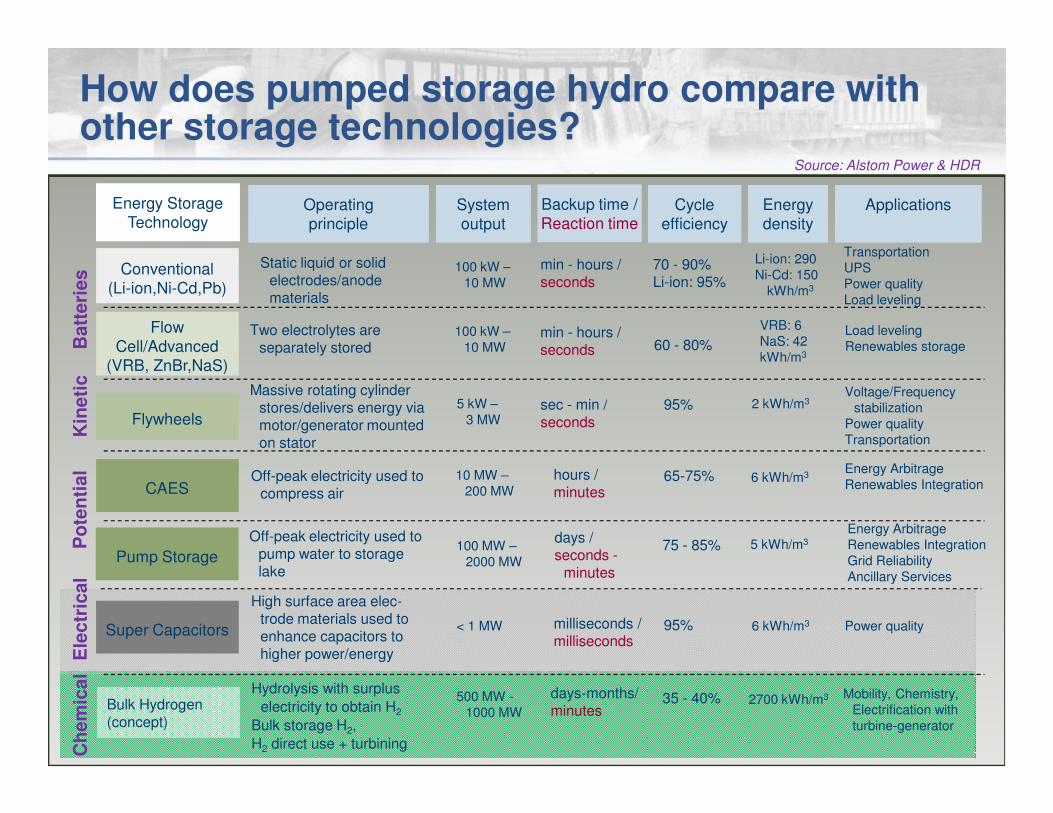
How does pumped storage hydro compare with other storage technologies?
Conventional
(Li-ion,Ni-Cd,Pb)
Static liquid or solid electrodes/anode materials
70 - 90%Li-ion: 95%
Flow
Cell/Advanced
(VRB, ZnBr,NaS)
Transportation
UPS
Power quality
Load leveling
Energy Storage
Technology
Energy Storage
TechnologyOperating
principle
Operating
principle
System
output
System
output
Cycle
efficiency
Cycle
efficiency
ApplicationsApplications
Two electrolytes are separately stored 60 - 80%
min - hours /seconds
Load leveling
Renewables storage
Massive rotating cylinder stores/delivers energy via 95%
Voltage/Frequency
stabilizationsec - min /
100 kW –
10 MW
100 kW –
10 MW
5 kW –
min - hours /seconds
Backup time /
Reaction time
Backup time /
Reaction timeEnergy
density
Energy
density
Li-ion: 290
Ni-Cd: 150
kWh/m3
VRB: 6
NaS: 42
kWh/m3
2 kWh/m3
Batt
eri
es
Kin
eti
c
Source: Alstom Power & HDR
CAES
Super Capacitors
Flywheelsstores/delivers energy via motor/generator mounted on stator
95% stabilization
Power quality
Transportation
Off-peak electricity used to compress air
65-75% Energy Arbitrage
Renewables Integration
High surface area elec-trode materials used to enhance capacitors to higher power/energy
95% Power quality
sec - min /seconds
hours /minutes
milliseconds /milliseconds
5 kW –
3 MW
10 MW –
200 MW
< 1 MW
Pump Storage
Off-peak electricity used to pump water to storage lake
100 MW –
2000 MW
days /seconds -
minutes
75 - 85%Energy Arbitrage
Renewables Integration
Grid Reliability
Ancillary Services
Bulk Hydrogen(concept)
Hydrolysis with surplus
electricity to obtain H2
Bulk storage H2,
H2 direct use + turbining
500 MW -
1000 MW35 - 40% Mobility, Chemistry,
Electrification with
turbine-generator
days-months/minutes
2 kWh/m
6 kWh/m3
5 kWh/m3
6 kWh/m3
2700 kWh/m3
Kin
eti
cP
ote
nti
al
Ele
ctr
ical
Ch
em
ical
Developmental Challenges in the U.S.CHANGING REGULATORY LANDSCAPE – GRID IMPACTS
Once Through Cooling Rule (EPA 316b)
• Retirement of Older Fossil Generating Plants� Up to 22,000 MW (CA Alone)� Up to 70,000 MW (Eastern U.S.)
Loss of System Inertia for Grid StabilityLoss of System Inertia for Grid Stability
• “Rotating Copper”� Resources Not Replaced by Wind/Solar
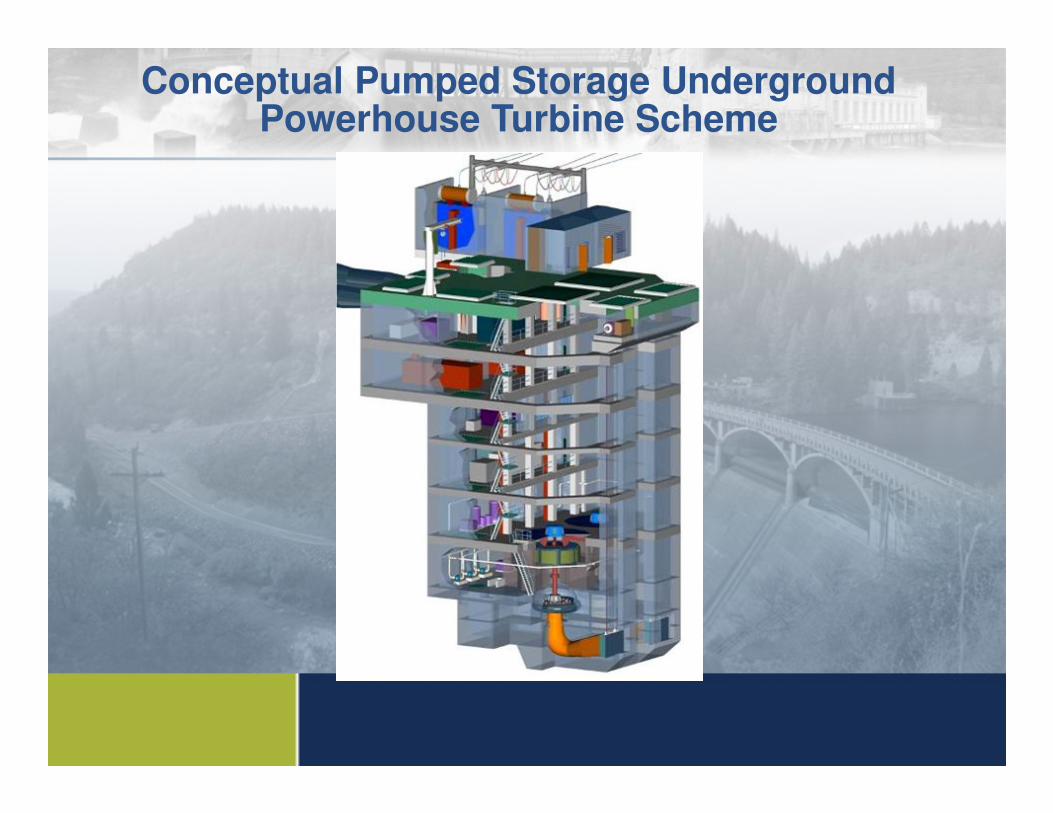
Conceptual Pumped Storage Underground Powerhouse Turbine Scheme
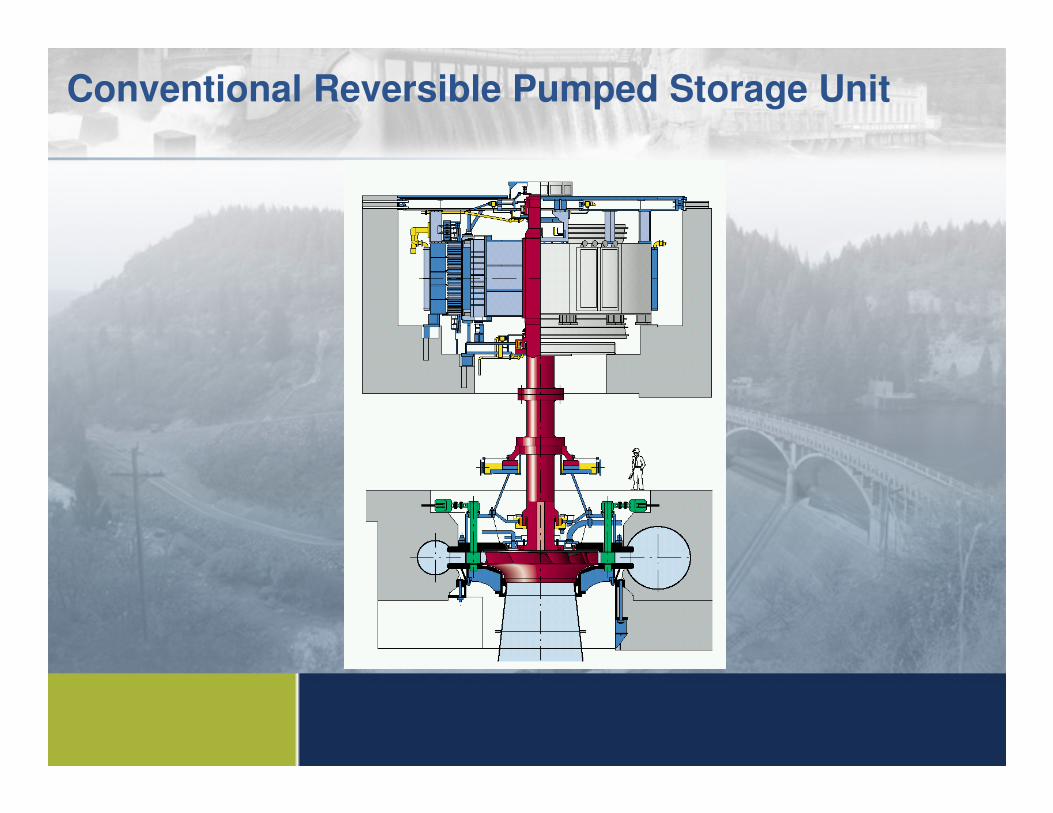
Conventional Reversible Pumped Storage Unit
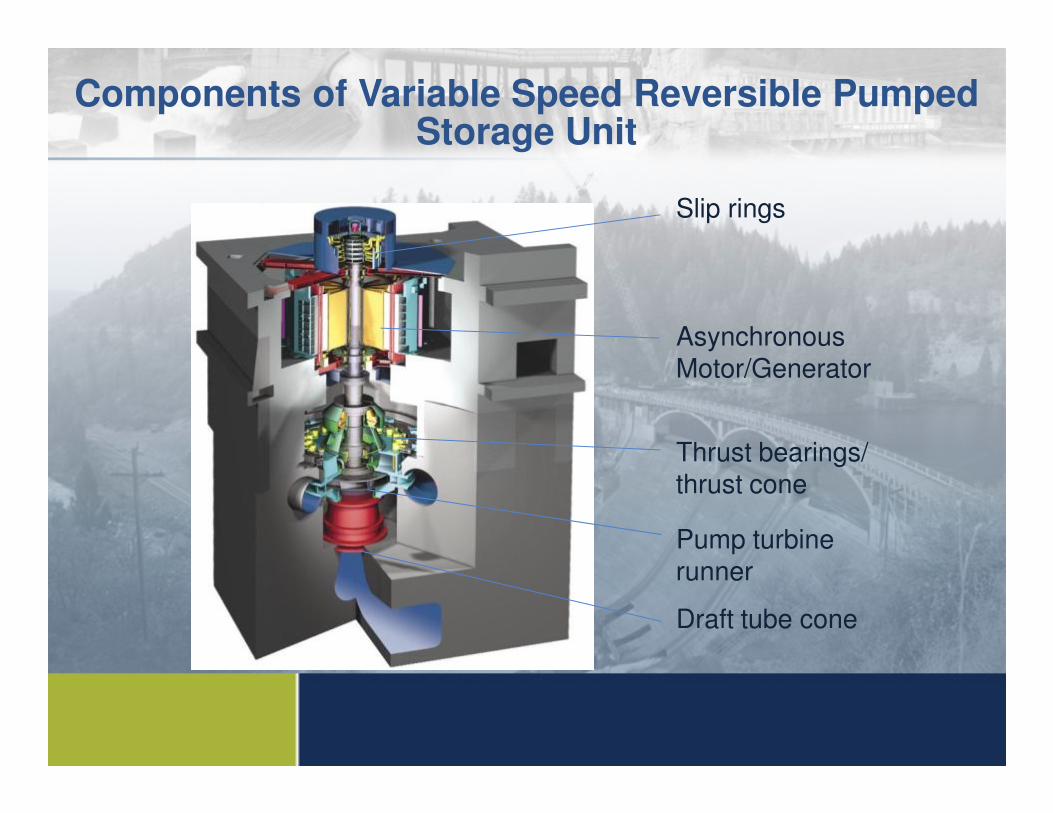
Components of Variable Speed Reversible Pumped Storage Unit
Slip rings
Asynchronous Motor/Generator
Thrust bearings/ thrust cone
Pump turbine runner
Draft tube cone
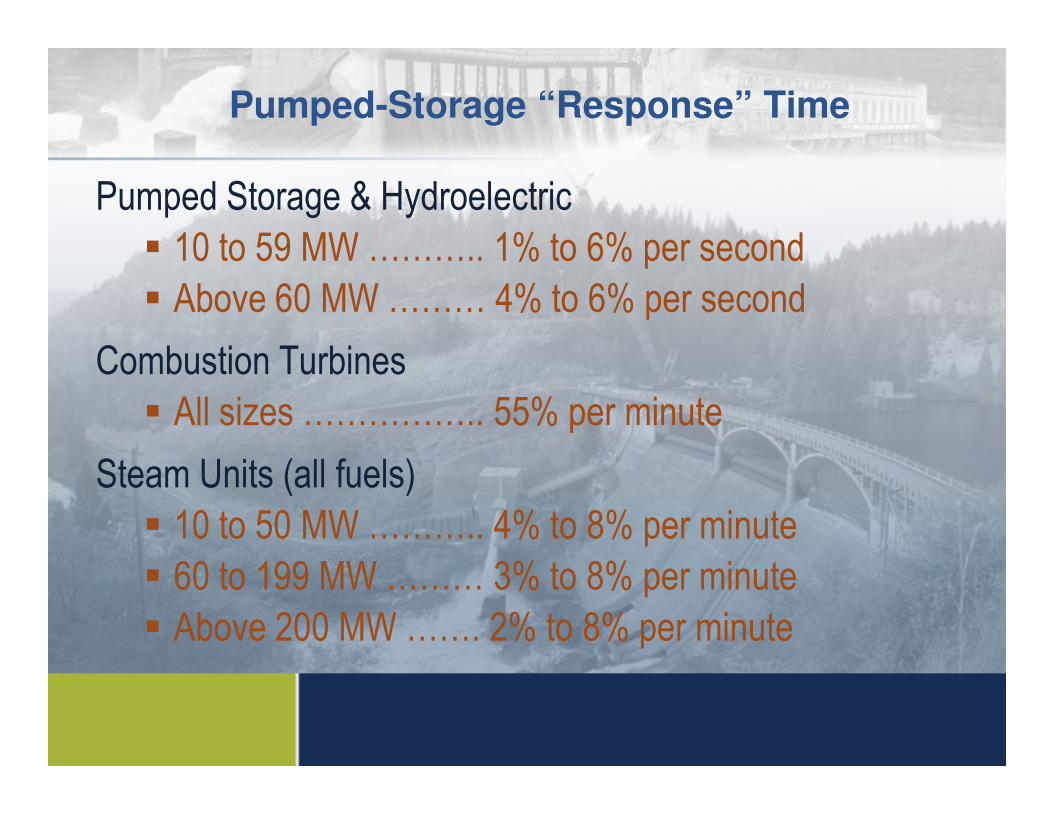
Pumped Storage & Hydroelectric
� 10 to 59 MW ……….. 1% to 6% per second
� Above 60 MW ……… 4% to 6% per second
Combustion Turbines
� All sizes …………….. 55% per minute
Pumped-Storage “Response” Time
� All sizes …………….. 55% per minute
Steam Units (all fuels)
� 10 to 50 MW ……….. 4% to 8% per minute
� 60 to 199 MW ……… 3% to 8% per minute
� Above 200 MW ……. 2% to 8% per minute
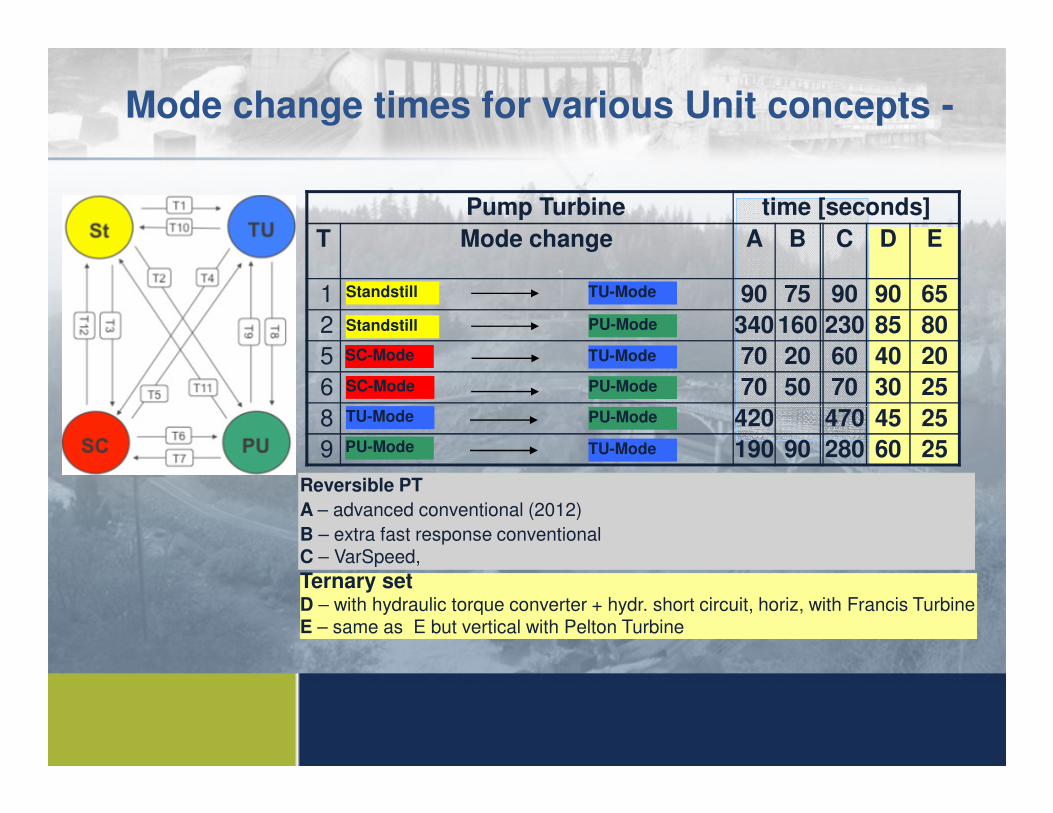
Pump Turbine time [seconds]
T Mode change A B C D E
1 90 75 90 90 65
2 340 160 230 85 80
5 70 20 60 40 20
6 70 50 70 30 25
8 420 470 45 25
Standstill TU-Mode
Standstill PU-Mode
TU-Mode
PU-Mode
SC-Mode
SC-Mode
TU-Mode
Mode change times for various Unit concepts -
8 420 470 45 25
9 190 90 280 60 25
PU-Mode
TU-ModePU-Mode
TU-Mode
Reversible PT
A – advanced conventional (2012)
B – extra fast response conventionalC – VarSpeed,
Ternary setD – with hydraulic torque converter + hydr. short circuit, horiz, with Francis TurbineE – same as E but vertical with Pelton Turbine
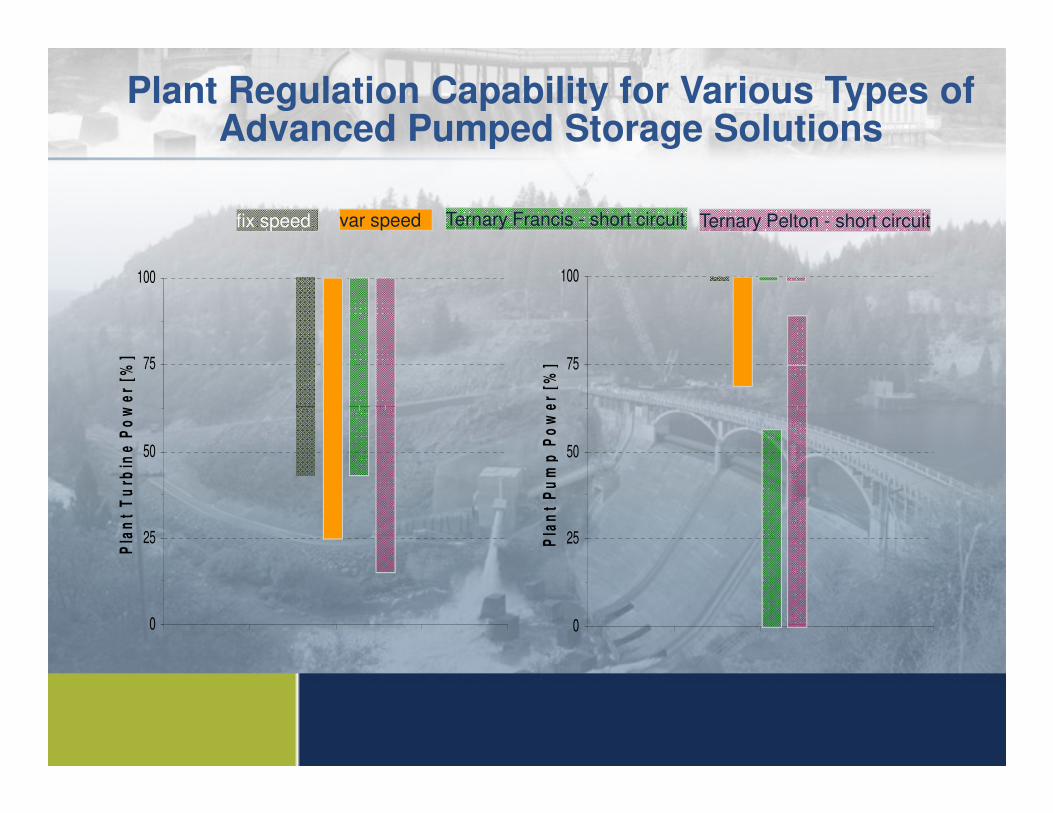
Plant Regulation Capability for Various Types of Advanced Pumped Storage Solutions
75
100
Pla
nt
Pu
mp
Po
we
r [%
]
fix speed var speed Ternary Pelton - short circuit
75
100
Pla
nt
Tu
rbin
e P
ow
er
[%]
Ternary Francis - short circuit
0
25
50
Pla
nt
Pu
mp
Po
we
r [%
]
0
25
50
Pla
nt
Tu
rbin
e P
ow
er
[%]
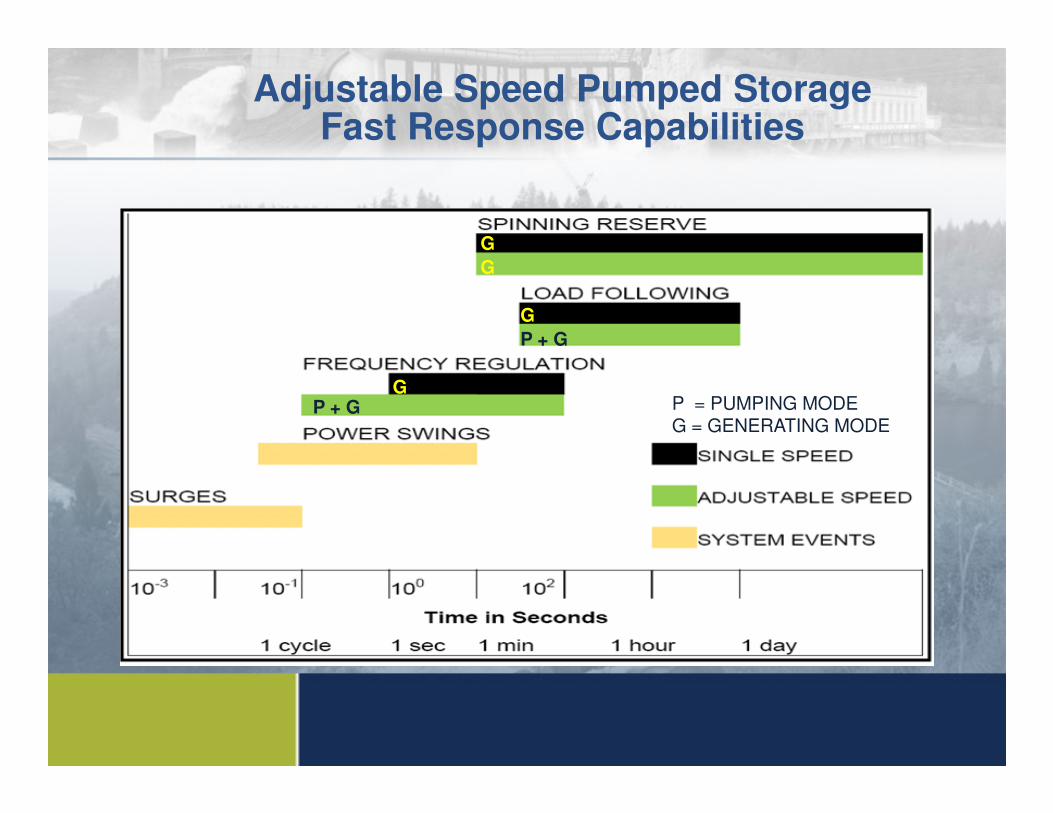
Adjustable Speed Pumped StorageFast Response Capabilities
New Technology provides Increased Flexibility and Speed
P + G
P + G
G
G
G
GP = PUMPING MODEP + G P = PUMPING MODEG = GENERATING MODE


![Wind power pumped storage system for hydropower plants › bitstream › 1946 › 4367 › 1 › lmason_fixed[1].pdf · hydropower plant with an added wind pumped storage system and](https://static.fdocuments.in/doc/165x107/5f03d2d17e708231d40af1f3/wind-power-pumped-storage-system-for-hydropower-plants-a-bitstream-a-1946-a.jpg)


