Benjamin B. Donahue* The Boeing Company HuntsvilleI … · SOLAR ELECTRIC AND CHEMICAL PROPULSION...
31
"Presented as AIM-2003-4728 at the AIAA JPC, Huntsville, AL, July 2003. SOLAR ELECTRIC AND CHEMICAL PROPULSION FOR A TITAN MISSION" Mike Cuppie; and Shaun E. Greed Science Applications International Corporation Huntsville,Alabama 35806 Benjamin B. Donahue* The Boeing Company HuntsvilleI Alabama 35806 Victoria L. Coverstones University of Illinois at Urbana-Champaign, Udana, iliinois 6 180 1 Systems analyses were performed for a Titan Explorer Mission characterized by Earth-Saturn transfer stages using solar electric power generation and propulsion systems for primary interplanetary propulsion, and chemical propulsion for capture at Titan. An examination of a range of system factors was performed to determine their effect on the payload delivery capabilrty to T i n . The effect of varying launch vehicle type, solar array power level, ion thruster number, specific impulse, trip time, and Titan capture stage chemical propellant choice was investigated. The major purpose of the study was to demonstrate the efficacy of applying advanced ion propulsion system technologies like NASA's Evolutionary Xenon Thruster Lead Systems Engineer, Engineering & Technologies Section * 3d Generation Space Technology Task Lead, Boeing Phantom Works Systems Engineer, Engineering & Technologies Section Associate Professor, Department of Aerospace Engineering, Associate Fellow AIM 1 i American Institute of Aeronautics and Astronautics https://ntrs.nasa.gov/search.jsp?R=20050092388 2018-05-27T09:10:08+00:00Z
Transcript of Benjamin B. Donahue* The Boeing Company HuntsvilleI … · SOLAR ELECTRIC AND CHEMICAL PROPULSION...

"Presented as AIM-2003-4728 at the AIAA JPC, Huntsville, AL, July 2003.
SOLAR ELECTRIC AND CHEMICAL PROPULSION FOR A TITAN MISSION"
Mike Cuppie; and Shaun E. Greed Science Applications International Corporation
Huntsville, Alabama 35806
Benjamin B. Donahue* The Boeing Company
HuntsvilleI Alabama 35806
Victoria L. Coverstones University of Illinois at Urbana-Champaign,
Udana, iliinois 6 180 1
Systems analyses were performed for a Titan Explorer Mission
characterized by Earth-Saturn transfer stages using solar
electric power generation and propulsion systems for primary
interplanetary propulsion, and chemical propulsion for capture at
Titan. An examination of a range of system factors was
performed to determine their effect on the payload delivery
capabilrty to T i n . The effect of varying launch vehicle type,
solar array power level, ion thruster number, specific impulse,
trip time, and Titan capture stage chemical propellant choice
was investigated. The major purpose of the study was to
demonstrate the efficacy of applying advanced ion propulsion
system technologies like NASA's Evolutionary Xenon Thruster
Lead Systems Engineer, Engineering & Technologies Section
* 3d Generation Space Technology Task Lead, Boeing Phantom Works Systems Engineer, Engineering & Technologies Section
Associate Professor, Department of Aerospace Engineering, Associate Fellow A I M
1
i
American Institute of Aeronautics and Astronautics
https://ntrs.nasa.gov/search.jsp?R=20050092388 2018-05-27T09:10:08+00:00Z

(NEXT), coupled with state-of-the-art (SOA) and advanced
chemical technologies to a Flagship class mission. This study
demonstrated that a NASA Design Reference Mission (DRM)
payload of 406 kg could be successfully delivered to Titan using
the baseline advanced ion propulsion system in conjunction with
SOA chemical propulsion for T i i n capture. In addition, the
SEPS’Chemicai system of this study is compared to an all-
chemical NASA DRM mission. Resutts showed that the NEXT-
based SEPSChemical system was able to deliver the required
payload to Titan in 5 years less transfer time and on a smaller
launch vehicle than the SOA chemical option.
Introduction
The Titan Explorer Mission has generated significant interest in the space
science community and has been analyzed using various propulsion systems’. Previous
analyses covered a wide range of propulsion systems, but did not specifcally investigate
the application of an advanced ion propulsion systems like NEXT to the Titan Explorer
Misson. This study examines propulsion performance for the Titan explorer mission for
a NEXT-based Solar Electric Propulsion System (SEPS) stage combined with SOA and
advanced chemical propulsion options. The chemical propulsion system (CPS) is
integrated into a full-up spacecraft and is used for Titan capture. At Saturn distances
the solar flux is too small to provide adequate solar power to the ion thrusters for
propulsion, and hence neccessitates an alternative Titan capture propulsion mode.
2
American lnstttute of Aeronautics and Astronautics

This study will in general investigate the sensitivities of SEPS delivered mass
and Titan payload to various system and mission parameters. The SEPS delivered
mass is defined as the CPS spacecraft and the total science payload (Titan payload).
The Titan payload consists of a direct entry Titan lander and science instruments that
remain in Titan orbit. The science instruments that remain in orbit at Titan are referred
to in this study as the orbiter science instruments. The first part of this study investigates
SEPS delivered mass sensitivity to launch vehicle, opportunity year, transfer time,
number of operational ion engines, and ion engine maximum Isp. The second part of
the analysis examines Titan payload sensitivity to propellant combination, tank
technology, and transfer time.
In this study, launches from both Atlas-V and Detta-IV medium class launch
vehicles were evaluated. The launch vehicle injects the SEPS interplanetary transfer
stage and CPS spacecraft, along with the Titan payload, on a minimum-propellant
optimized trajectory to Saturn with eventual capture of the CPS spacecraft into a circular
2000 km Titan orbit. As a typical example, an Atlas-V 431 launch vehicle injected a
total mass of about 4333 kg to an Earth departure specific energy (C3) of 12.3 km2/s2.
After launch vehicle injection, the SEPS stage is used to propel the CPS spacecraft and
Titan payload through a trajectory that includes a Venus Gravity Assist (VGA) enroute to
Saturn. The SEPS stage is separated from the orbiier at approximatety 4 astronomical
units (AU) after completing its task. A larger gain in velocity could most likely have been
realized with an Earth Gravity Assist (EGA) rather than with a VGA, but the VGA was
chosen because of concerns of performing an EGA with a spacecaft that includes a
Plutonium based Radioisotope Thermal Generator (RTG) power source (two RTGs are
3
American Institute of Aeronautics and Astronautics

baselined in this study for the chemicat capture stage). Upon arrival in the Saturn
vicinity, the CPS based spacecraft releases the the Titan lander (with aeroshell) onto a
Titan direct entry trajectory to Titan, and then the main insertion bum of the CPS places
the CPS spacecraft into Titan orbit. Total baseline payload mass that must be delivered
to Titan, as taken from the NASA's design reference mission2, is 406 kg. This payload
consists of 42 kg of instruments (orbiter science instruments mass) on the CPS stage in
Titan orbit and a separate 346 kg direct entry lander.
Several propellant combinations for the CPS were considered; these included
SOA Nit rogen-Tetroxide/H yd razine ( NTO/N2H4) > Liq u id-Oxy gen/H y d razine ( LOWN2H4),
Fluorine/Hydrazine (F2/N2H4), and a high Isp Monopropellan? system. F2 was analyzed
for its high performance potential, and the advanced monopropellant was analyzed for
its potential of global propulsion system simplicity. For the Titan capture stage, two
pressure-fed engines of 100 psia (-6.9~10~ N/m2) chamber pressure (Pc) and 100 ibf
(445 N) thrust were assumed throughout the analyses. Advanced CPS tank
technologies considered in this study included tank liner thickness and composite tank
overwrap strength.
4
American Institute of Aeronautics and Astronautics
z z
- ! ' I

Systems Analysis
Launch Vehicle Models
Launch mass versus launch C3 performance data taken from the vendor‘s
l i t e r a t ~ r e ~ ~ for the Delta-IV 4450, Atlas4 421, and Atlas-V 431 launch vehicles were
used in performing trajectory optimization. Appropriate curvefits of the launch vehicle
data were used directly in the trajectory optimization code to provide the optimum mass
and C3 required to perform the mission based on other system and mission
assumptions, including destination and transfer time.
SEPS System Models
SEP vehicle synthesis models were used to provide estimates of the spacecraft
mass. Table 1 shows the baseline power and propulsion system assumptions used for
analyses. A graphic of the main SEPS system and subsystem elements modeled is
shown in Figure 2. After computing the mass of the electric power system (power
generation, conditioning and distribution), propulsion system (power processing units
(PPU), thrusters, gimbals, actuators, Digital Control Interface Units (DCIU), and
cabledhamess), propellant management (fluid management and tank thermal
conditioning), and structures (bus, adaptors, mechanisms, thruster support, ppu
support, tank support, and other component attachment), the remaining mass allocation
represents the usable mass that can be delivered to the destination. The mass referred
to herein as the “SEPS delivered mass” is the difference between the launch vehicle
interplanetary injection mass and the wet mass of the SEPS stage. Determining the
5
American Institute of Aeronautics and Astronautics
F

SEPS vehicle's wet mass was a primary task of this study and the discussion that
immediately follows focuses on the SEPS primary power and propulsion systems.
Array
Thrusters
!
additional We array reserves. Multi-Junction GaAs arrays; AEC Ultra-Flex design; Arrays feathered at distances < 1 AU 4 thrusters with 1 spare; 6 W e 8 4000 sec ISD; high
Tabk 1. Baseline SEPS stage power and propulsion systems definition
. . Isp throttling, NEXTdesign; Molybdenum grids.
Power
Radiators DClU Tank and Propellant Propeiiant Management
maximum power, NEXT design SOA heat pipe radiators. SOA Digital Control Interface Unit Tank fraction*% (SOA); supercritical Xe propellant
NEXT design
Radiators DClU Tank and Propellant Dr/r -nr l -mi
maximum power, NEXT design SOA heat pipe radiators. SOA Digital Control Interface Unit Tank fraction*% (SOA); supercritical Xe propellant
I
SEPS Power
High-efficiency solar photovoltaic arrays provide power for propulsion and vehicle
housekeeping (with the exception of battery power that must be provided for array
deployment). The array model was based on high-eff iciency triple-junction GaAs cells
with an Ultra-Flex' structure; the initial power selected was 31.5 kWe, representing the
30 kWe baseline plus 5% margin. A 2 percent per year degradation factor was applied
6
American Institute of Aeronautics and Astronautics

to all solar array masses to account for expected radiation degredation during the
mission, including increased degradation due to less than one-AU operation of the
propulsion system during certain peroids of time prior to and after the Venus gravity
assist. The Ultra-Flex model used provides a current SOA in lightweight solar array
technology. Low-Intensity L~w-Ternperature~ (LILT) effects were also accounted for in
the power generation model.
SEPS Propulsion
The electric propulsion subsystem models include the following: PPU, thruster,
gimbals and gimbal actuators, DCIU, propellant management system, cable & harness,
and support structure. For all cases evaluated, including variations on thruster number,
a spare propulsion string consisting of thruster, PPU, and propellant management
system is included in the SEPS. The baseline SEPS configuration used an array of 5
ion thrusters (four active and one spare) operating in the high Isp throttling
mode. The NEXT-class advanced ion engines operate at a maximum power level of
about 6 kWe. Two cases of maxiumum Isp were investigated, 3600 sec and 4000 sec,
to determine the SEPS stage sensitivity to thruster Isp level. The NSTAR ion thruster
which has a demonstrated maximum thruster power level of about 2.3 kWe at a
maximum Isp of 3120 sec.
7
American l n s t i i of Aeronautics and Astronautics

Other SEP Systems
Other SEPS vehicle subsystem models play a critical role in determining the
overall mass of the spacecraft, and therefore affect delivered mass to the destination.
All subsystems accounted for in the SEPS model are shown in Figure 1.
Figure 1. Total SEP System Definition Model Diagram
For each subsystem block indicated in Figure 1, the vehicle synthesis code
computes the mass. These masses are then deducted from the total launch vehicle
injected mass to obtain tbe final SEPS delivered mass to Saturn vacinity. SEPS
analyses required various assumptions concerning mass and power margins,
contingencies, and vehicle system redundancies. These assumptions are shown in
Table 2.
8
American Institute of Aeronautics and Astronautics

Table 2 SEP System Contingencies, Margins, and Other Assumptions
navigation and trajectory corrections Chemical Capture Stage AV 2.5% G-loss; out-of-tangency Tmn
rendezvous 2% 1 Array end-of-life contingency I 14% of baseline power mass I
I Dry Mass I 30% of non-delivered dry mass I
engine off (scheduled
Titan Capture Stage Chemical Propulsion System Models
Planetary capture CPS models were derived from curve-fits of historical data and
physics-based models. For example, the composite overwrap tank model is scaled from
the Advanced X-ray Astrophysics Facility'' vehicle's composite tank. The baseline CPS
consists of two 100 Ibf (-445 N) class main pressure-fed engines. The thrust level was
chosen to keep the finite bum gravity losses to a low percent of total characteristic
(ideal) AV during the T i capture bum. Other elements include the thrust vector
control system, propellant thermal conditioning and pressurization systems, and the
reaction control systems (RCS). The RCS consists of 16 hydrazine monopropellant
thrusters that operate at an Isp of 220 sec. Lightweight tanks using internal tank
pressures on the order of 230 psia are baselined. Thermal conditioning is provided for
9
American Institute of Aeronautics and Astronautics
I
tanks, lines, valves, and thrusters. The propellant pressurization system assumes 4500
psia (3.1 x10⁸ N/m2) regulated gaseous Helium. Given this relatively high pressure
assumption, the pressurant system mass is based on real gas'* considerations,
including Helium molecule finite size.
Mission Analysis
Optimization of SEPS Trajectories
The Solar Electric Propulsion Trajectory Optimization (SEPTOP)
was used to generate optimal trajectories to Saturn for all cases studied. The trajectory
optimization process includes, as an optimization constraint, launch vehicle injection
mass capability as a function of C3. SEPTOP was used to generate the interplanetary
trajectories for a variety of relevant launch dates, trip times, departure C ~ S , arrival
velocities, power levels, thruster combinations and thruster Isp. SEPS stage propellant,
change in velocity (AV), thruster operation time, and thruster throttling and sequencing
data, among other data, are also generated as outputs of SEPTOP. Specific thruster
models are imbedded into the propulsion system modeling routines, and this allowed
detailed sensitivity analyses to be easily performed. Constraints, such as the maximum
allowed power output from the solar arrays (done through feathering) and the maximum
and minimum thruster operational power levels, can be placed on major system
elements.
10
American Institute of Aeronautics and Astronautics

Earth-Venus-Saturn Trajectories
Optimal gravity assists for the outer planet mission investigated tend to be in a
class of trajectories termed "energy pumping". This term implies that the v&i&
expends time in the inner solar system building energy before the VGA occurs. The
optimal energy gain occurs as the vehicle is directed by the SEPS stage into a transfer
path that takes it into solar distances between approximately 0.7 AU and 2 AU. Most of
the vehicles heliocentric velocity increase is gained in this high solar flux region. After
building orbital energy, the spacecraft performs a VGA to acquire the additional energy
needed to reach Saturn within the prescribed transfer time. An example energy
pumping trajectory, shown in Figure 2, illustrates a typical 8.5 year traject~ry'~ used in
this study.
&S Flyby N o 7 21,2ih?,
, l .
11
American Institute of Aeronautics and Astronautics

I .
-# of Engines
- Sun insolation
-EnginePower 1
--
Figure 2. Typical Earth-Venus-Saturn Trajectory
_ _ 80
i- 60
-- 40
20
The energy pumping maneuver can be further described in the following
sequence of events: 1) the spacecraft increases its potential energy by looping
away from the sun, 2) the spacecraft then moves toward the sun (increasing its
kinetic energy) achieving VGA (near heliocentric perihelion) and providing a
relatively large nst heliocentric veioctty increase. For the cases studied, the flyby
radius at Venus was constrained to no less that 6352 km, and the typical velocity
increase during the VGA ranges from 4.5 to 5.0 km/sec. Sample SEPS trajectory
data showing thruster power-on-time, engine power, and number of engines-on
as a function of mission time are shown in Figure 3.
)I
0 *
f 0 n v) P I
0 200 400 600 800 1000 1200
Time (days)
Figure 3. Number of Ion Thrusters and Power as a Function of Time
As indicted in the Figure, IPS power is held to a maximum of 25 W e after SEPS
separation from the launch vehicle and array deployment. As the spacecraft moves
away from the sun (0-350 days), the number of operational thrusters is reduced as array
power decreases, until a single thruster is operating. As the spacecraft returns to a
12
American Institute of Aeronautics and Astronautics

lower AU, the number of thrusters increases back to the maximum (four) at 253,300,
and 460 days, as shown in Figures 3 and 4.
rc 0 *
1000 - # of Engines 800
600
400
200
0
0 200 400 600 800 1000 1200
Time (days)
Figure 4. Number of Ion Thrusters and Thrust as a Function of Time
For example, the total power into the thrusters at 253 days was 6.8 We.
Although two thrusters would be suffiicient to handle this power level, SEPTOP selected
four active thrusters, assuring an optimal trajectory based on the global set of power,
propulsion, and constraints. Essentiatiy, at this point in the trajectory and at the related
power level, higher thrust provided by four thrusters operating at lower power was more
important than the higher efficiency operation of two thrusters operating at higher
power. The longest duration of four active thrusters occurs from about 600 to 750 days
(during this period, the spacecraft will reach its closest distance from the sun) and the
VGA occurs at 700 days. For IPS power limiting and array thermal control purposes,
solar array feathering is required during low AU phases of the mission. Figure 3 shows
that IPS power is held at 25 W e during the feathered periods; 0-60 and 620-740 days.
The SEPS stage is jettisoned, and CPS coasting begins at about 4 AU (1 01 5 days, 2.8
years) as shown in Figures 2, 3 and 4. At this time, the CPS with the total Titan payload
13
American Institute of Aeronautics and Astronautics

begins an additional 2088 day (5.7 years) coast prior to the Titan chemical propulsion
capture maneuver. During this coast, power is provided by the RTG system.
A representation of the full Titan Explorer spacecraft concept is shown in Figure
5. The SEPS stage is shown on the bottom of the stack with its dual 15 kWe solar
arrays deployed. Five ion thrusters, enclosed on their perimeter by a sun shield, are
pictured at the bottom of the craft. On top of the SEPS stage is shown a cut-away view
of the CPS spacecraft showing the position of its two main propellant tanks. On the top
of the CPS spacecraft, the conical shaped Titan lander module is shown.
Figure 5. Titan Explorer Mission Propulsion System Concept
Titan Capture Scenario
Table 3 shows a summary of a typical AV budget for a CPS Titan stage of the
type studied. These data are for a system using an Atlas-V 431 launch vehicle, a 30
kWe SEPS stage and the baseline NTO/N*H4 CPS. Aimpoint'' approach calculations
indicated a 3455 m/s capture AV. The calculation includes Saturn and Titan orbital
14
American Institute of Aeronautics and Astronautics

geometry considerations, Titan approach uncertainty contingency, gravity losses (9-
Titan Radius Circular Capture Orbit Altitude Excess Velocity (Vhp) Relative to Titan Hyperbolic Velocity at Titan Periapsis Circular Velocity at Tbn Capture orbit Characteristic Capture AV
losses), and navigatiodmid-course AV correction. An assumed contingency for out-of-
2575 1 km 2000 km 4250 d s e c 4691 d s e c 1405 dsec 3287 mfsec
tangency Titan rendezvous of 2 percent of ideal AV (66 dsec) was included. The
Contingency: Orbit insertion Uncertainty 1 -66 Finite Bum Losses (s-losses) 1 82
capture bum maneuver includes approximately 8 degrees of plane change. In addition
dse~
dsec
to the aforementioned AV margins, the CPS carries an additional 5.6 percent for
Navigation & Traje&ly Co&m AV 20
propellant reserve, residuals, and margin.
m/sec
Table 3 Typical Titan Capture AV Budget 1 Titan Gravitational-Parameter f 9.027~10~ I km3/sz I
1 Total AV (propulsive capture) 1 3455 I m/SG -1
Gravity Loss Analysis for Titan Capture
The Titan approach was modeled, and an integrated trajectory was generated to
estimate the actual finite bum losses (g-losses) at capture. A g-loss calculation example
is shown in Figure 6. Calculations were based on a total mass of CPS plus orbiter
science instruments and a Titan capture-bum with the two previously mentioned
pressure-fed engines. The required bum time to capture was 4210 seconds; the
calculated AV loss was 72 dsec , or 2.1 percent greater than the ideal AV. Therefore,
to be conservative, all CPS main propellant requirements assumed g-losses of 2.5
percent of ideal AV.
15
American Institute of Aeronautics and Astronautics

100 1
700 900 1100 1300 1500 1700 1900 2100
Thrust (N)
Figure 6. Finite Burn g-Loss at Titan Capture vs Thrust Magnitude
SEPS Mass Delivery Sensitivity Analyses Results
SEPS Delivered Mass Sensitivity to Launch Date and Launch Vehicle
A launch opportunity analysis was conducted for Earth departure dates of 2007
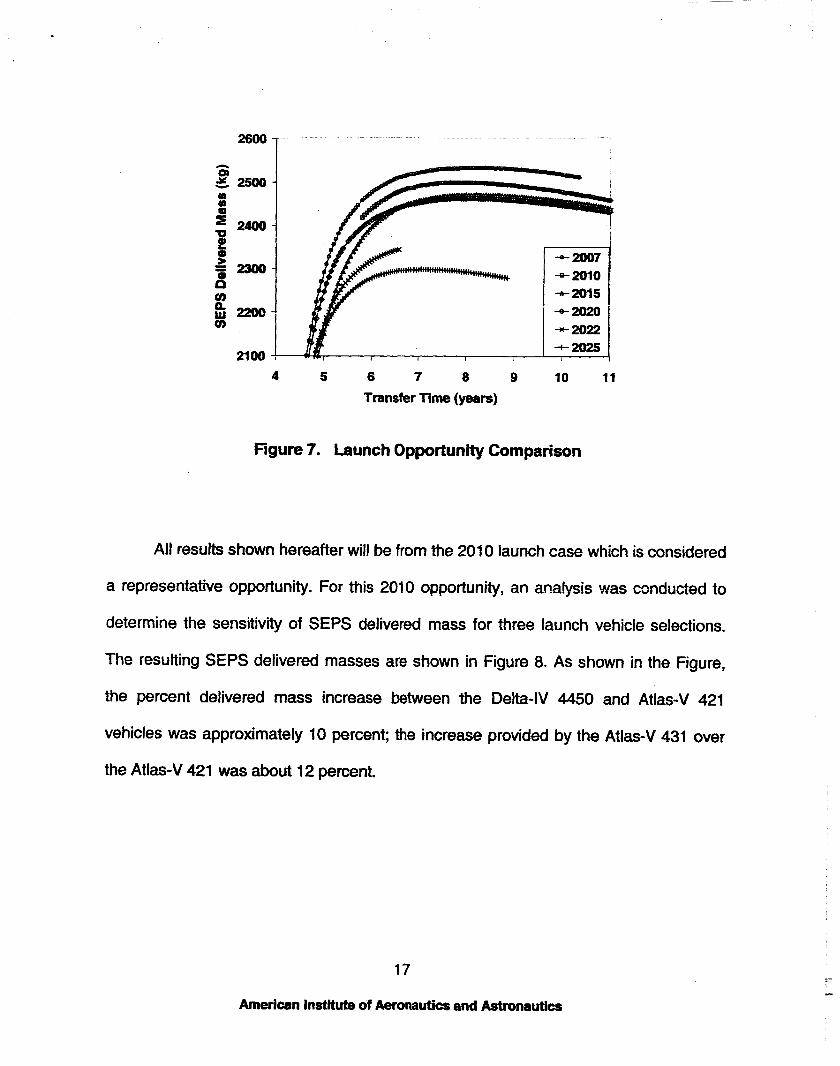
through 2025. Figure 7 shows SEPS-delivered mass to Saturn, including the mass of ,
the inert SEPS stage for a number of cases. Both the Atlas4 421 and 431 and Delta-IV
4450 medium class launch vehicles generally provide greater than 2400 kg of usable
mass over transfer times from 6 to 9 years and for the most favorable launch
opportunities 2007, 2010 and 2015. SEPS delivered mass capability generally
decreases as Earth-departure year increases over the range examined. The percent
difference in the delivered mass over this range is about 8 percent. The 2007 mission
provided the largest delivered mass, 2540 kg, and the 2010 opportunity provided the
next largest mass, 2500 kg (both at appproximately 8-year trip times). 16
American Insmute of Aeronautics and Astronautics
-1 (I) (I) I = 2400- P d at > = 2300-
2100 t 4 5 6 7 8 9 10 11
Transfer Time (years)
Figure 7. Launch Opportunity Comparison
All results shown hereafter will be from the 201 0 launch case which is considered
a representative opportunity. For this 2010 opportunity, an analysis was cunducted to
determine the sensitivity of SEPS delivered mass for three launch vehicle selections.
The resulting SEPS delivered masses are shown in Figure 8. As shown in the Figure,
the percent delivered mass increase between the Delta-IV 4450 and Atlas-V 421
vehicles was approximately 10 percent; the increase provided by the Atlas-V 431 over
the Atlas-V 421 was about 12 percent.
17
American Institute of Aeronautics and Astronautics

Y Atlas4 431 J
c
Atlas-V 421 0 2400- 3 2200- '0 = 2000- DebIve450 g! 1800-
= 1400- n u) 1200- g loo0 I I I I I I I
- 1600- Average W % Change In Payroad Mass - W 4450 to AtlaeV 42l= 9.7% - Atlas-V 421 to AtlSbV 431 = 123%
v) 4 5 6 7 8 9 10
Transfer Time (years)
Figure 8. Variation in SEPS Delivered Mass with Launch Vehicle
SEPS Delivered Mass Sensitivity to Electric Propulsion Isp
A thruster Isp sensitivity study was performed to determine the variation in SEPS
delivered mass with Isp. As shown in Figure 9, for the power levels investigated, and
using the Atlas4 431 launch vehicle, only small differences in SEPS delivered mass
were found for thruster Isp values of 3600 sec and 4000 sec. The 4000 sec thruster was
chosen for the remaining analyses in this paper due to this demonstrated thruster
insensitivity to Isp, and because greater thruster lifetimes will in general be technically
easier to achieve for the higher lsp thruster.
18
American Institute of Aeronautics and Astronautics

1 n 2550 m Y v (I) (D s
3600 sec Isp \
I I
2500 1 5 4000 sec Isp
I 2400 I I I I I 1
4 5 6 7 8 9 10 Transfer Time (years)
Figure 9. Impact of Thruster Isp on SEPS Delivered Mass
SEPS Delivered Mass Sensitivity to Total Number of Active Thrusters
Further analyses were perfomred to determine whether an increase in the
number of SEPS thrusters along with associated increase in array power would
dramatically increase the SEPS delivered mass to Saturn vicinity. Results, shown in
Figure 10, indicated that by increasing the number of operational thrusters from 4 to 5,
the SEPS delivered mass to Saturn vicinity increased by about 3 percent. Note
however, that in going from 4 to 5 operational thrusters there will likely be a significantly
higher cost associated with increased power and one additional thruster, PPU, and
propellant management string, while the actual increase in Titan payload will be
relatively small.
Figure 10 also indicates the reduction in trip time facilitated by five thrusters for
an example SEPS delivered mass of 2500 kg (note, this example SEPS delivered mass
19
Amerlcan Institute of Aeronautics and Astronautics

represents a conservative estimate of the required mass for the CPS spacecraft and
total Titan payload). The approximately 8-year trip time is required to deliver the 2500
kg to Saturn vicinity for the 4 thruster SEPS can be reduced to about 5.7-years by the 5
thruster system. Note that both Saturn and Titan arrival Vhp are also shown in Figure
10. In this study, Saturn Vhp defines the relative velocity (sometime called the excess
velocity) of the CPS Spacecraft in the heliocentric coordinate system with respect the
Saturn. Likewise, Titan Vhp defines the relative velocity in Saturn-centered coordinates
of the CPS spacecraft with respect to Titan. As can be gleaned from Figure 10, the Vhp
at Saturn arrival increases dramatically as the transfer time falls below the 7.5-year
transfer time. This sharp increase in Saturn Vhp with decrease in transfer time, coupled
with a Titan payload that falls off rapidly with increasing Saturn Vhp, implies that the
SEPS delivered mass benefrt with 5 thrusters is quickly lost with decreasing transfer
time. Note that Titan payload sensitivity with Saturn and Titan Vhp will be more
thoroughly covered in an upcoming section that addresses Titan payload sensitivities.
For completeness, a three operational thruster SEPS configuration was
investigated as well. This configuration was marginally successful in placing the
reference payload at Titan. The average thruster throughput for the 3 engine case,
however, was significantly higher than the baseline NEXT program design value of 270
kg per thruster.
20
American Institute of Aeronautics and Astronautics

2600
2100 Q)
2OoO
8
6 9 c > 0 n
5 8
Figure 10. SEPS Delivered Mass Sensitivity to No. of Operationai Thrusters
Xtan Payload Delivery Sensitivity Analyses Resutts
Titan Payload Sensitivity to Launch Vehicle and Transfer Time
A shift is now made from considering SEPS delivered mass to considering actual
Titan payload. Titan payload has been defined as the direct entry lander and the
previously mentioned orbiter science instruments. The transfer vehicle is the previously
baselined combined 4 thruster SEPS (4000 sec Isp) stage and the NTO/N2H4 based
CPS spacecraft. The SEPS stage provides the primary interplanetary propulsion that
sends the CPS with total science payload to the Saturn vicinity. As the CPS spacecraft
arriies in Saturn vicinity, the direct entry lander is seprated from the spacecraft and
proceeds to Titan for direct entry and landing. Subsequent to lander release, the
remaining CPS based spacecraft with the orbiter science instruments proceeds to Titan
for a chemical based capture maneuver. The total science payload (Titan payload)
delivered to Titan as a function of transfer time, launch vehicle type, and arrival Vhp is
illustrated in Figure 11. This figure shows that Titan payload maxima are reached at 21
American Institute of Aeronautics and Astronautics

approximately 8.5 years. The NASA reference Titan payload value (Ref. 2) is shown in
Figure 11 as a bold, horizontal line. Actual estimated payload delivery capability is
shown in Fig. 11 as a series of curves; one curve for each of the three different launch
vehicles. The baseline transfer vehicle can deliver the DRM payload to Titan in 7.0
years if launched by an Atlas-V 431, and in 7.5 years if launched by an Atlas-V 421.
Titan payload delivered with the Deb-IV 4450 (the smallest launcher considered) in 8.5
years is 390 kg, just under the 406 kg DRM payload. At 8.5 years, the Atlas-V 431 and
421 vehicles delivered 505 and 437 kg payloads, respectively. The maximization of
Titan payload at 8.5 years can be understood by noticing that the minimum Titan Vhp is
reached at 8.5 years. Minimum Vhp at Titan translates into minimum propulsive AV for
the CPS capture, and thus maximum Titan payload.
SOA Chemical Cap- at Tiean 6001 T 10
n rn z Y
-- 9 n
z rn 500 Y
n
7 s
0 4
400 500 1 200 "1
A t l a s 4 431 9 8 7 6
0 6 7 8 9 1 0 1 1
Transfer Time (years)
P c >
Figure 11. Titan Paybad Sensitivity to Transfer Time & Launch Vehicle
22
American Institute of Aeronautics and Astronautics

Orbiter Science Mass Sensitivity to Chemical Propellant Combinations
A detailed deliniation of subsystem mass is provided in this section to c lam the
relationship that orbiter science instruments mass has to chemical propellant
combination. Three potential CPS systems were considered, and Table 4 shows the
corresponding SEPS stage and CPS spacecraft mass data for the three chemical
prape!!an? cmbinatbns. FG; this study, the baseiine assumptions include Atlas-V 43 1
launch vehcile, a 8.5 year trip time, and the baseline 4 SEPS configuration. The SOA
NTO/N2H4 case has been previously described in Figure 1 1. For each of the propellant
combinations shown in Table 4, the SEPS stages are identical, with the dry mass of 848
kg and a total propellant load of 898 kg. The total SEPS stage mass is 1839 kg. For a
total solar array power level of 30 W e EOL, the SEPS stage specific mass is nearly 61
kg/kWe.
The total AV for the Titan capture (including ail losses) was estimated at 3455
miss and the chemical stage Isp’s used in this analysis were 330 sec, 351 sec, and 380
sec for the SOA chemical, the LOX/N2H4system, and the F2/N2H4 system respectively.
The corrosponding dry mass for the chemical systems are 496 kg, 533 kg, and 515 kg
respectively. The SOA CPS has the lowest dry mass due to the compact nature of the
baseline eafth-storable propellant system. The space-storable propellant combinations,
LOX/N2H4, and F2/N2H4, required greater dry mass systems due in part to increased
subsystem masses for the cryo-coolers and added power to operate the cryo-cooler.
Both of the space-storable systems provide orbiier science instruments delivery
advantage over the SOA CPS. The orbiter science instruments increase was 12 kg for
23
American Institute of Aeronautics and Astronautics
F

LOWN2H4 and 99 kg for F2/N2H4. These orbiter paylaod increases over SOA chemical
can be attributed to the larger Isp that the space-storable propulsion systems provide.
The relatively small 12 kg orbiter science instruments mass increase over SOA
for the LOWN2H4 is considered a marginal increase in total payload delivery capability.
A relatively high T i n payload of approximately 600 kg can be achieved with the F2
on an Atlas-V 431 launch. This turns out to be almost 100 kg more
orbiter science instruments mass than the SOA chemical system can deliverer to Titan
orbit. In addition, further analyses for F2 propulsion showed that the Atlas-V 421 and
the Delta-IV 4450 deliver 520 kg and 460 kg Titan payload repectively. Thus, with F2
propulsion, the DRM payload can be successfully delivered to Titan for the smallest
launch vehicle case investigated. F2 engines were tested successfully by NASA and the
Air Force during engine development programs of the 1960's and 197O's, however,
work on F2 has not been done in the last decade. Thus, an appreciable technology
development program would be necessary to raise F2 propulsion technology to an
appropriate Technology Readiness Level prior to in-space application.
Table 4 Total Mass Statement for Chemical Propellant ComMnations
All cases are for an 8.5 year transfer time and an Atlas-V 431 launch vehicle Capturestage Bipropellant I W0/N2H4 1 Oa2H, I F&H4
24
American Institute of Aeronautics and Astronautics

Dry Mass I 496 533 51 5 I Orbiter Science lnskments Mass I 141 I 153 I 240 I
Lander (Tiin direct entry, not captu red) 364 364 364
In addition to the above. mentioned propellant combinations, this study
investigated advanced rnonqmpdlaits to determine the efficacy of an advanced
monopropellant propulsion system application for this mission class. Analysis indicated
that a monopropellant CPS capture stage operating at 275 sec lsp combined with the
baseline SEPS stage could not achieve the 406 kg reference payload for any of the
three launch vehicles investigated. The analysis further showed that an Isp of 320 with
an Atlas-V 431 launch vehicle wouid be required for a monopropellant system to deliver
the DRM Titan payload.
Orbiter Science Mass Sensitivity to Tank Technology Improvements
A study was performed to determine the potential Titan payload increase that
could be realized from CPS main propellant tank technology improvements. Analyses
were performed to determine Ttan payload sensitivity to propellant tank liner thickness
and composite overwrap thickness. A modest increase in Titan payload of about 15 kg
was found by decreasing tank liner thickness from 30 mil to 5 mil. Recent manufacturing
improvements in tank liner technology have achieved this 6 fold decrease in liner
thickness. Reducing composite tank overwrap weight was also evaluated. An increase
in tank composite overwrap strength by 30 percent resulted in an increase of
approximately 3 percent in Titan orbiter science instruments mass. Tank overwrap
25
American Institute of Aeronautics and Astronautics

strength technology improvements of 30 percent over SOA are within reach of current
tank manufacturing processes.
SEPWChemical Transfer System Comparison to an All-Propulsive NASA DRM
Mission analyses results from an earlier and separate NASA in-house Titan all-
chemical reference mission is included in this section for comparison purposes. Figure
13 shows three columns of data; the first column on the left of the Figure shows total
stack mass data for the baseline SEPSKhemical system, the middle column shows the
total stack mass data for the F2 based SEPWChemical system, and the column on the
right shows the total stack mass for the NASA all-chemical DRM. In this NASA DRM, no
SEPS stage was used, and a Delta-IV Heavy launch vehicle was required to inject the
DRM payload (406 kg) into a 12-year Venus-Earth-Earth Gravity Assist (VEEGA)
transfer trajectory. Aside from several midcourse correction burns, the all-propulsive
Titan CPS coasts for the duration of the mission, gaining much of the required
momentum to reach Saturn via the three gravity assists. Because of the VEEGA
trajectory chosen, a relatively high arrivial velocity is encountered at Saturn for this DRM
as compared to the SEPS mission analysed herein, with its single VGA and 1000+ day
ion thrusting duration; this study’s SEPS trajectory provides a more moderate Saturn
arrival velocity, even though its trip time of 8.5 years is significantly less. The higher
Saturn arrival velocity of the VEEGA trajectory results in a significantly higher Titan CPS
capture stage propellant load as compared to that needed for the CPS of the
SEPSNGA mission baselined in this study. In Figure 12, total stack mass is listed for
26
American Institute of AeronautScs and Astronautics

two SEPNGA missions (columns 1 and 2) previously described in Table 4, in addition to
the aforementioned all propulsive DRM. The primary difference between columns 1 and
2 is the propellant choice for the capture stage. As compared to the all-chemical DRM,
the SEPS configuration enables significantly lower total missions mass for a given
payload, allowing for the use of a medium rather than a heavy lift launch vehicle. The
stack masses of the hro SEP configurations presented here are about 35 pemn! less
than the all-chemical DRM system. Also, the baseline SEPS configuration of this study
can deliver modestly higher payload to Titan in a 3.5 year shorter trip time than the atl-
propulsive DRM.
concept: Bsueline Achranced NASADRM
Figure 12 SEPS transfer system total mass compared to the DRM
Conclusions
This analysis showed that an advanced ion engine based SEPS transfer stage
can deliver a NASA DRM payload of 406 kg to Titan in missions using medium class
27
American Institute of Aeronautics and Astronautics

launch vehicles between the years of 2007 to 2015. These missions can be
accomplished with approximately 30 W e of solar power driving four, 4000 sec Isp,
NEXT-class thrusters with single VGA interplanetary transfers and SOA chemical
technology for Titan capture. Payloads somewhat greater than the DRM can be
delivered at transfer times of approximately 8.5 years using Atlas-V 421 or 431 launch
vehicles. Smaller launch vehicles such as the Delta-IV 4459 mu!d not deliver the
reference Titan payload using the 4 ion engine/SOA chemical stage combination. For all
of the launch vehicle cases investigated, increased Titan payload delivery was shown
using a 5 SEPS thruster system, but the improvement was marginal. A three engine
case required an ion system capability beyond the design throughput limits of current
development programs.
Results of chemical capture stage analyses indicated that the baseline, off-the-
shelf, storable NTO/N2H4 CPS can do the mission. The advanced fluorine/N2H4 CPS
provided significant (25 percent) Titan payload increase over the baseline NTO/N2H4
stage, but would require a Fluorine engine technology development program. The
LOWN2H4 CPS provided marginal performance improvement over NTO/N2H4 and
probably does not warrant a new engine development program for this class of engine.
Monopropellant based CPS provides no improvements over SOA chemical unless the
Isp is greater than 320 sec. Relatively easily obtainable tank technology improvements
provide modest Titan payload delivery enhancement capability of the SEPS/Chemical
propulsion transportation system.
213
American Institute of Aeronautics and Astronautics

I I
Acknowledgements
This work was performed by SAIC’s In-Space Technology Assessment (ETA) program
team under the support and leadership of the In-Space Propulsion Technology Project
at NASA MSFC. The efforts of Bill Hartmann, University of Illinois Urbana-Champaign,
for SEPTOP trajectory generation, are gratefully acknowledged.
References
1. Noca, M., Frisbee, R., Johnson, L., Kos, L., Gefert, L., and Dudzinski, L., “Evaluating
Advanced Propulsion Systems for the Titan Explorer Mission,” International Electric
Propulsion Conference, Rept. IEPC-01-175, Oct. 2001.
2. Herrmann, M. C., James, B. G., and Lockwood, M. K., “Aerocapture at Titan:
Systems Analysis Review,” NASWM-2003-212746, Oct. 2003.
3. Jankovsky, R. S., “AN-Based Monopropellant Assessment for Spacecraft,” AIAA
Paper 96-2863,32nd AIWASMEEAUASEE Joint Propulsion Conf., Juiy 1996.
4. “DELTA IV Payload Planners Guide,” The Boeing Co., Huntington Beach, CA, Rept.
MDC 00H0043, Oct., 2000.
5. “Atlas Launch System Mission Planner‘s Guide,” Lockheed Martin, McLean, VA,
Rept. CLSB-0105-0546, rev. 9, Sept. 2001.
6. URL: httDih.aec-able.com, Ultraflex Solar Arrays, 2004.
7. Kerslake, T., “Photovoltaic Array Performance During an Earth-to-Jupiter Heliocentric
Transfer,” NASA Glenn Research Center, Power and Propulsion Office, Rept. IBR PS-
496, Aug., 2000.
29
American Institute of Aeronautics and Astronautics

,
.
8. NASA Research Announcement Proposal information Package, Next Generation Ion
Engine Technology, NASA, Nov. 2001, Sec. A.9.2.
9. Patterson, An., Haag, T. W., Foster, J. E., Rawlin, V. K., Roman, R. F., and Soulas, G.
C., "Development Status of a 5/10-kW Class Ion Engine," AlAA Paper 2001-3489, July,
2001.
10. Piiiero, L, "Design of a Modular 5-kW Power Processing Unit for the Next-
Generation 40-cm Ion Engine," International Electric Propulsion Conference, Rept.
IEPC-01-329, Oct. 2001.
11. "Advanced X-ray Astrophysics Facility Mass Properties," NASA Rept. DPD692
SE09, March 1999.
12. Dickerson, R. E., Gray, H. B., Chemical Principles, W. A. Benjamin, Menlo Park,
CA, 1970 (1 972 corrected printing).
13. Sauer, C., Jr., "Optimization of Multiple Target Electric Propulsion Trajectories,"
AlAA Paper 73-205, Jan. 1973.
14. Sauer, C., Jr., "Solar Electric Propulsion Performance For Medlite And Delta Class
Planetary Missions," AAS Paper 97-726, Aug. 1999.
15. Coverstone, V., Hartmann, J., Woo, B., "Outer-Planet Mission Analysis Using Solar-
Electric Ion Propulsion," AAS Paper 03-242, Feb. 2003.
16. Brown, C., Spacecraft Mission Design, 2nd ed., AlAA Education Series, AIM,
Reston, VA, 1998, pp. 1 15-1 17.
17. Appel, M. A., Kaplan, R. B., and Tuffias, R. H., "Liquid Fluorine/Hydrazine Rhenium
Thruster Update," Marquardt Co., Van Nuys, CA, 1980, Vol. 1, pp. 85-90.
!
30
American Institute of Aeronautics and Astronautics

c
18. Bond, D. L., “Technology Status of a Fluorine-Hydrazine Propulsion System for
Planetary Spacecraft,” A I M Paper 79-0907, May 1979.
31
American Institute of Aeronautics and Astmmutics