Bengang Steel Plates Co., Ltd.
26
Report for the First Quarter of 2018 of Bengang Steel Plates Co., Ltd. 1 Bengang Steel Plates Co., Ltd. Report for the First Quarter of 2018 April 2018
Transcript of Bengang Steel Plates Co., Ltd.

Report for the First Quarter of 2018 of Bengang Steel Plates Co., Ltd.
1
Bengang Steel Plates Co., Ltd.
Report for the First Quarter of 2018
April 2018

Report for the First Quarter of 2018 of Bengang Steel Plates Co., Ltd.
2
Chapter I Important Notice
The Board of Directors, the Supervisory Committee and the Directors, members of
the Supervisory Committee and senior management of the Company guarantee that
there are no misrepresentations or misleading statements, or material omission in this
report, and individually and collectively accept full responsibility for the authenticity,
accuracy and integrity of the information contained in this report.
All the members of the Board of Directors attended the board meeting on which this
report was examined.
Wang Shu, Chairman of the Company, Han Ge, the principal in charge of the
accounting, and Wang Shaoyu, Chief of Accounting Affairs, make the pledge for the
authenticity, accuracy and integrity of the attached financial statements.

Report for the First Quarter of 2018 of Bengang Steel Plates Co., Ltd.
3
II Basic Information of the Company
1 Summary of accounting data and financial index
Whether the Company make retroactive adjustment or restatement of the accounting data of the previous years
□ Yes √ No
Jan.-Mar. 2018 Jan.-Mar. 2017 Changes (+/-)
Operating income(RMB) 11,641,518,226.15 11,132,407,692.65 4.57%
Net profit attributable to the shareholders
of the listed company(RMB) 350,629,492.24 302,653,287.07 15.85%
Net profit after deducting of non-recurring
gain/loss attributable to the shareholders of
listed company(RMB)
347,300,210.06 295,684,784.12 17.46%
Net Cash flows generated by business
operation(RMB) -8,871,507,868.81 -3,422,732,831.24 208.17%
Basic earnings per share(RMB/Share) 0.090 0.097 -7.22%
Diluted earnings per share(RMB/Share) 0.090 0.097 -7.22%
Weighted average net assets yield (%) 2.13% 2.30% -0.17%
31 Mar. 2018 31 Mar. 2017 Changes (+/-)
Gross assets(RMB) 56,754,968,274.94 62,998,143,513.02 -9.91%
Net assets attributable to shareholders of
the listed company(RMB) 18,640,829,795.37 14,315,588,729.00 30.21%
Items and Amount of the non-recurring gains and losses
√ Applicable □ Not applicable
Unit:Yuan
Items Jan.-Mar. 2018 Notes
Profit or loss from investment or assets entrusted to others 3,493,150.68
Profit or loss from debt restructuring 945,892.23
Less: Impact of income tax 1,109,760.73
Total 3,329,282.18 --
For the Company’s non-recurring profit and loss items as defined in “the Explanatory Announcement No.1 on information disclosure
for Companies Offering their Securities to the Public-Non-recurring Profits and Losses” and its non-recurring profit and loss items as
illustrated in “the Explanatory Announcement No.1 on information disclosure for Companies Offering their Securities to the
Public-Non-recurring Profits and Losses” which have been defined as recurring profits and losses, it is necessary to explain the
reason.
□ Applicable √ Not applicable
None of Non-recurring profit and loss items recognized as recurring profit and loss items as defined by “the Explanatory

Report for the First Quarter of 2018 of Bengang Steel Plates Co., Ltd.
4
Announcement No.1 on information disclosure for Companies Offering their Securities to the Public-Non-recurring Profits and
Losses” in the report period.
2 Number of total shareholders and shareholdings by Top 10 shareholders at the end of the period.
(1) Number of holders of ordinary shares and preferred shares with restored voting right and Top 10 shareholders
Unit:Share
Total number of common
shareholders at the end of the
reporting period
68,592
The total number of preferred
shareholders whose voting
rights has been restored at end
of the reporting period (if
any)
0
Shareholding by Top 10 shareholders
Name of the
shareholder
Nature of
shareholder
Proportion of
shares held
Quantity of
shares
Amount of
restricted shares
held
Number of share pledged/frozen
State of share Quantity
Benxi Steel & Iron
(Group) Co., Ltd.
State-owned
legal person 58.95% 2,284,411,202
Pledged 1,483,095,133
Frozen 45,000,000
Liaoning Provincial
Transportation
Investment Group
Co., Ltd.
State-owned
legal person 4.77% 184,842,883 184,842,883
CCB Principal Asset
Management –
ICBC – CR Trust –
CR Trust · Xing
Sheng No. 5
Collective Fund
Trust Plan
Others 4.77% 184,842,883 184,842,883
Bei Xin Rui Feng
Fund – China
Merchants Bank –
Bei Xin Rui Feng
Fund Feng Qing No.
229 Asset
Management Plan
Others 4.77% 184,842,883 184,842,883
China Life AMP
Fund– ICBC –
China Life AMP –
Hua Xin Trust
Others 4.77% 184,842,883 184,842,883

Report for the First Quarter of 2018 of Bengang Steel Plates Co., Ltd.
5
Targeted Additional
Shares Issuance No.
10 Asset
Management Plan
VANGUARD
EMERGING
MARKETS STOCK
INDEX FUND
Overseas legal
person 0.21% 8,157,311
Chen Jinhong Domestic
natural person 0.17% 6,517,700
Lyu Ruijun Domestic
natural person 0.13% 5,123,100
FIRST TRUST
EMERGING
MARKETS
SMALL CAP
ALPHADEX
FUND
Overseas legal
person 0.13% 4,871,043
VANGUARD
TOTAL
INTERNATIONAL
STOCK INDEX
FUND
Overseas legal
person 0.12% 4,606,141
Shareholding of top 10 shareholders of unrestricted shares
Name of the shareholder Number of non-restricted common shares held at the
period-end
Category of shares
Category of
shares Quantity
Benxi Steel & Iron (Group) Co., Ltd. 2,284,411,202 Common shares
in RMB 2,284,411,202
VANGUARD EMERGING
MARKETS STOCK INDEX FUND 8,157,311
Foreign shares
placed in
domestic
exchange
8,157,311
Chen Jinhong 6,517,700
Foreign shares
placed in
domestic
exchange
6,517,700
Lyu Ruijun 5,123,100
Foreign shares
placed in
domestic
exchange
5,123,100

Report for the First Quarter of 2018 of Bengang Steel Plates Co., Ltd.
6
FIRST TRUST EMERGING
MARKETS SMALL CAP
ALPHADEX FUND
4,871,043
Foreign shares
placed in
domestic
exchange
4,871,043
VANGUARD TOTAL
INTERNATIONAL STOCK INDEX
FUND
4,606,141
Foreign shares
placed in
domestic
exchange
4,606,141
Yu Xiaofan 4,002,707
Foreign shares
placed in
domestic
exchange
4,002,707
Liu Hongqing 3,490,000 Common shares
in RMB 3,490,000
Wu Zhanglin 3,395,200 Common shares
in RMB 3,395,200
Haitong International Securities
Company Limited-Account Client 3,161,109
Foreign shares
placed in
domestic
exchange
3,161,109
Related-parties or acting-in-concert
parties among the above-mentioned
shareholders
Benxi Steel & Iron (Group) Co., Ltd., the holding shareholder, has no relationship with any of
the other shareholders among the top 10 shareholders, neither being regarded as
action-in-concert parties by the Information Disclosure Regulations for Change of
Shareholding in listed companies. The Company is not aware of any relationship among the
other shareholders, neither being regarded as action-in-concert parties by the Information
Disclosure Regulations for Change of Shareholding in listed companies. The Company is not
aware of any relationship among the top 10 shareholders, neither being regarded as
action-in-concert parties by the Information Disclosure Regulations for Change of
Shareholding in listed companies.
Shareholders among the top 10
participating in Securities lending
and borrowing business(if any)
Benxi Steel & Iron (Group) Co., Ltd. holds 2,034,411,202 shares of the company through an
ordinary securities account, and holds 250,000,000 shares through the investor's credit
securities account, therefore, it holds a total of 2,284,411,202 shares. Liu Hongqing holds
3,490,000 shares of the company through an investor's credit securities account, and Wu
Zhanglin holds 3,395,200 shares of the company through an investor's credit securities
account.
Whether top ten common shareholders or top ten common shareholders with unrestricted shares carried out any buy-back agreement
dealing in the reporting period.
□ Yes √ No
Top ten common shareholders or top ten common shareholders with unrestricted shares did not carry out buy-back agreement dealing
in the reporting period. .

Report for the First Quarter of 2018 of Bengang Steel Plates Co., Ltd.
7
(2) Number of total preferred shareholders and preferred shares hold by Top 10 preferred shareholders
□ Applicable √ Not applicable

Report for the First Quarter of 2018 of Bengang Steel Plates Co., Ltd.
8
III Important Events
1 Major changes in main accounting statement items and financial indicators within the
reporting period, as well as reasons for the changes.
√ Applicable □ Not applicable
Significant changes and reasons in major accounting data, financial indicators which changed over 30%
compared to the consolidated financial statement at the end of 2017
1. Financial Position Statement items Increase /
Decrease Reasons
Cash at bank and on hand -35% Due to repayment of the arrears in the current period
Other current assets -72% Due to the redeem of financial products
Construction in progress -37% Due to the increase of construction materials usage
Notes payable -67% Due to the increase of the solution pay of notes
payable at maturity
Advance from customers -31% Due to the decrease of production
Tax payable -73% Due to the decrease of tax payable at the end of this
period
Interests payable -69% Due to the decrease of provision of corporate bond
interest
Capital reserves 35% Due to premium of targeted additional shares issuance
Special reserves 1447% Due to the decrease of payment of safety production
cost
Undistributed profits 32% Due to the increase of net profit
Significant changes and reasons in major accounting data, financial indicators which changed over 30%
compared to the consolidated financial statement of the first quarter of 2017
2. Income Statement items Increase /
Decrease Reasons
General and administrative expenses 38% Due to the increase of employee benefits and repair
costs
Financial expenses -133% Due to the increase of exchange gains
Income on investment 60% Due to the increase of income on financial products
Non-operating income -83% Due to the reclassification of government subsidy into
other income
Non-operating expenses -100% Due to non-occurrence of disposal of fixed assets

Report for the First Quarter of 2018 of Bengang Steel Plates Co., Ltd.
9
Income tax expenses -90% Due to the decrease of deferred income tax
Profit or loss of non-controlling
shareholders -88% Due to the decrease of profit of holding subsidiaries
3. Cash flow items Increase /
Decrease Reasons
Tax rebate received 80% Due to the increase of tax rebate received
Cash paid for goods and services 61% Due to the increase of repayment of the arrears in the
current period
Subtotal of cash outflows from
operating activities 57%
Due to the increase of repayment of the arrears in the
current period
Net cash flows generated from
operating activities 159%
Due to the increase of repayment of the arrears in the
current period
Cash received from return on
investments 214% Due to the increase of redeem of financial products
Cash received from distribution of
dividends or profit 60% Due to the increase of income on financial products
Proceeds from investment 100% Due to the investment received from targeted
additional shares issuance
Cash repayments of borrowings 61% Due to the increase of repayment of bank loans
The net cash flow generated by
financing activities 63%
Due to the investment received from targeted
additional shares issuance
2 Progress and influence of significant events, as well as the analysis and explanation on
solutions
□ Applicable √ Not applicable
3 Commitments not finished and is overdue in the reporting period by actual controller,
shareholders, related parties, acquirer, and other commitments parties.
□ Applicable √ Not applicable
There is no commitments not finished and is overdue in the reporting period by actual controller, shareholders, related parties,
acquirer, and other commitments parties.
4 Forecast of operating results for Jan. 2018-June 2018
Warning of possible loss or considerable change of the accumulated net profit made during the period-start until the end of the next
reporting period according to predictions as well as any explanations for these reasons:

Report for the First Quarter of 2018 of Bengang Steel Plates Co., Ltd.
10
□ Applicable √ Not applicable
5 Securities investment
□ Applicable √ Not applicable
There is no securities investments in the reporting period.
6 Investment in Derivatives
□ Applicable √ Not applicable
There is no investment in derivatives in the reporting period.
7 Particulars about researches, visits and interviews received in this reporting period
□ Applicable √ Not applicable
There is no researches, visits and interviews received in the reporting period.
8 Illegal Guarantee
□ Applicable √ Not applicable
There was no illegal guarantee during the reporting period.
9 Particulars about the non-operating occupation of funds by the controlling shareholder
□ Applicable √ Not applicable
There are no controlling shareholder and its related parties occupying non-business capital of the listed company in the reporting
period.

Report for the First Quarter of 2018 of Bengang Steel Plates Co., Ltd.
11
IV Financial Statements
1 Financial Statements
(1) Consolidated Statement of Financial Position
Prepared by: Bengang Steel Plates Co., Ltd.
As at 31 March 2018
Unit:Yuan
Items Ending balance Beginning balance
Current assets:
Cash at bank and on hand 11,093,558,097.39 17,037,713,410.49
Settlement provisions
Capital lent
Financial assets at fair value
through profit or loss
Derivative financial assets
Notes receivable 3,843,305,009.16 3,846,433,700.87
Accounts receivable 759,164,807.27 728,597,926.39
Prepayments 1,180,446,504.01 1,280,689,094.33
Premium receivable
Reinsurance accounts receivable
Receivable deposit for reinsurance
contract
Interests receivable 16,293,285.16 18,448,520.50
Dividends receivable
Other receivables 296,536,545.14 290,376,985.34
Redemptory financial assets for
sale
Inventories 11,849,685,609.68 11,209,898,096.16
Assets classified as held for sale
Non-current assets due within one
year
Other current assets 223,617,780.92 809,322,127.79
Total current assets 29,262,607,638.73 35,221,479,861.87

Report for the First Quarter of 2018 of Bengang Steel Plates Co., Ltd.
12
Non-current assets:
Loan and advances issued
Available-for-sale financial assets 3,888,980.00 3,888,980.00
Held-to-maturity investment
Long-term receivables
Long-term equity investments 2,726,009.03 2,726,009.03
Investment properties
Fixed assets 23,423,813,190.26 23,852,067,166.10
Construction in progress 2,512,650,530.63 2,391,584,410.46
Construction materials 2,880,287.12 4,558,919.60
Disposal of fixed assets
Productive biological assets
Oil and gas assets
Intangible assets 283,074,289.92 253,884,881.48
Development expenditure
Goodwill
Long-term deferred expenses
Deferred tax assets 195,992,526.13 200,618,461.36
Other non-current assets 1,067,334,823.12 1,067,334,823.12
Total non-current assets 27,492,360,636.21 27,776,663,651.15
Total assets 56,754,968,274.94 62,998,143,513.02
Current Liabilities:
Short-term loans 20,988,248,400.00 21,999,103,900.00
Loan from central bank
Absorbed deposit and interbank
deposit
Loan from other financial
institutions
Financial liabilities at fair value
through profit or loss
Advance from customers
Notes payable 3,742,684,341.50 11,494,589,827.27
Accounts payable 3,750,475,693.36 3,897,668,513.77
Advance from customers 2,267,165,181.31 3,308,567,598.05
Financial assets sold for

Report for the First Quarter of 2018 of Bengang Steel Plates Co., Ltd.
13
repurchase
Handling charges and commission
payable
Employee benefits payable 36,205,319.16 43,722,537.58
Current tax liabilities 23,604,657.69 87,807,128.50
Interests payable 26,252,770.25 84,139,288.02
Dividends payable
Other payables 540,233,649.65 576,989,932.31
Reinsurance accounts payable
Provision for insurance contract
Receipt from vicariously traded
securities
Receipt from vicariously
underwriting securities
Liabilities held for sale
Non-current liabilities due within
one year 3,710,868,973.54 3,811,540,590.84
Other current liabilities 23,574,344.57 27,979,093.21
Total current liabilities 35,109,313,331.03 45,332,108,409.55
Non-current liabilities:
Long-term loans 2,098,295,484.06 2,444,185,630.28
Bonds payable
Including: Preferred stock
Perpetual bond
Long-term payables
Long-term employee benefits
payable
Special accounts payable
Estimated liabilities
Deferred income 372,601,561.30 372,785,000.00
Deferred tax liabilities
Other non-current liabilities
Total non-current liabilities 2,470,897,045.36 2,816,970,630.28
Total liabilities 37,580,210,376.39 48,149,079,039.83
Shareholders’ equity:

Report for the First Quarter of 2018 of Bengang Steel Plates Co., Ltd.
14
Share capital 3,875,371,532.00 3,136,000,000.00
Other equity instruments
Including: Preferred stock
Perpetual bond
Capital reserves 12,343,209,847.29 9,114,845,542.05
Less: treasury shares
Other comprehensive income
Special reserves 7,350,783.64 475,046.75
Surplus reserves 961,105,529.85 961,105,529.85
General risk reserve
Undistributed profits 1,453,792,102.59 1,103,162,610.35
Total equity attributable to equity
holders of the parent company 18,640,829,795.37 14,315,588,729.00
Non-controlling interests 533,928,103.18 533,475,744.19
Total shareholder’s equity 19,174,757,898.55 14,849,064,473.19
Total liabilities and shareholder’s equity 56,754,968,274.94 62,998,143,513.02
Legal Representative:Wang Shu Person in charge of accounting:Han Ge Accounting Dept
Leader:Wang Shaoyu
(2) Balance sheet of Parent Company
Unit:Yuan
Items Ending balance Beginning balance
Current assets:
Cash at bank and on hand 10,479,896,112.30 16,717,913,081.42
Financial assets at fair value
through profit or loss
Derivative financial assets
Notes receivable 3,575,837,787.96 3,515,361,992.96
Accounts receivable 520,075,140.22 482,181,593.45
Prepayments 1,180,446,504.01 1,280,354,579.87
Interests receivable 16,293,285.16 18,377,036.96
Dividends receivable
Other receivables 398,937,446.74 376,863,448.72
Inventories 9,571,138,419.47 9,228,860,225.75

Report for the First Quarter of 2018 of Bengang Steel Plates Co., Ltd.
15
Assets classified as held for sale
Non-current assets due within one
year
Other current assets 223,617,780.92 682,211,823.73
Total current assets 25,966,242,476.78 32,302,123,782.86
Non-current assets:
Available-for-sale financial assets 3,888,980.00 3,888,980.00
Held-to-maturity investment
Long-term receivables
Long-term equity investments 1,930,481,902.16 1,756,981,902.16
Investment properties
Fixed assets 21,303,700,826.29 21,621,369,452.27
Construction in progress 2,495,900,067.44 2,383,533,130.37
Construction materials 2,455,500.80 4,134,133.28
Disposal of fixed assets
Productive biological assets
Oil and gas assets
Intangible assets 151,255,780.92 152,082,315.24
Development expenditure
Goodwill
Long-term deferred expenses
Deferred tax assets 95,563,986.10 100,189,921.33
Other non-current assets 1,037,735,849.00 1,037,735,849.00
Total non-current assets 27,020,982,892.71 27,059,915,683.65
Total assets 52,987,225,369.49 59,362,039,466.51
Current Liabilities:
Short-term loans 19,405,839,000.00 20,499,694,500.00
Financial liabilities at fair value
through profit or loss
Advance from customers
Notes payable 3,214,532,767.20 10,866,669,546.93
Accounts payable 3,901,242,450.32 4,184,763,509.38
Advance from customers 2,087,038,774.20 3,217,423,443.14
Employee benefits payable 35,842,167.15 42,380,713.02
Current tax liabilities 3,476,856.86 66,903,531.67

Report for the First Quarter of 2018 of Bengang Steel Plates Co., Ltd.
16
Interests payable 17,450,000.00 79,074,426.27
Dividends payable
Other payables 399,948,764.62 343,211,639.65
Liabilities held for sale
Non-current liabilities due within
one year 3,710,868,973.54 3,811,540,590.84
Other current liabilities 23,574,344.57 27,979,093.21
Total current liabilities 32,799,814,098.46 43,139,640,994.11
Non-current liabilities:
Long-term loans 2,098,295,484.06 2,444,185,630.28
Bonds payable
Including: Preferred stock
Perpetual bond
Long-term payables
Long-term employee benefits
payable
Special accounts payable
Estimated liabilities
Deferred income 372,601,561.30 372,785,000.00
Deferred tax liabilities
Other non-current liabilities
Total non-current liabilities 2,470,897,045.36 2,816,970,630.28
Total liabilities 35,270,711,143.82 45,956,611,624.39
Shareholders’ equity:
Share capital 3,875,371,532.00 3,136,000,000.00
Other equity instruments
Including: Preferred stock
Perpetual bond
Capital reserves 11,923,058,165.17 8,694,693,859.93
Less: treasury shares
Other comprehensive income
Special reserves 5,953,580.47 276,727.96
Surplus reserves 961,105,529.85 961,105,529.85
Undistributed profits 951,025,418.18 613,351,724.38
Total shareholder’s equity 17,716,514,225.67 13,405,427,842.12
Report for the First Quarter of 2018 of Bengang Steel Plates Co., Ltd.
17
Total liabilities and shareholder’s equity 52,987,225,369.49 59,362,039,466.51
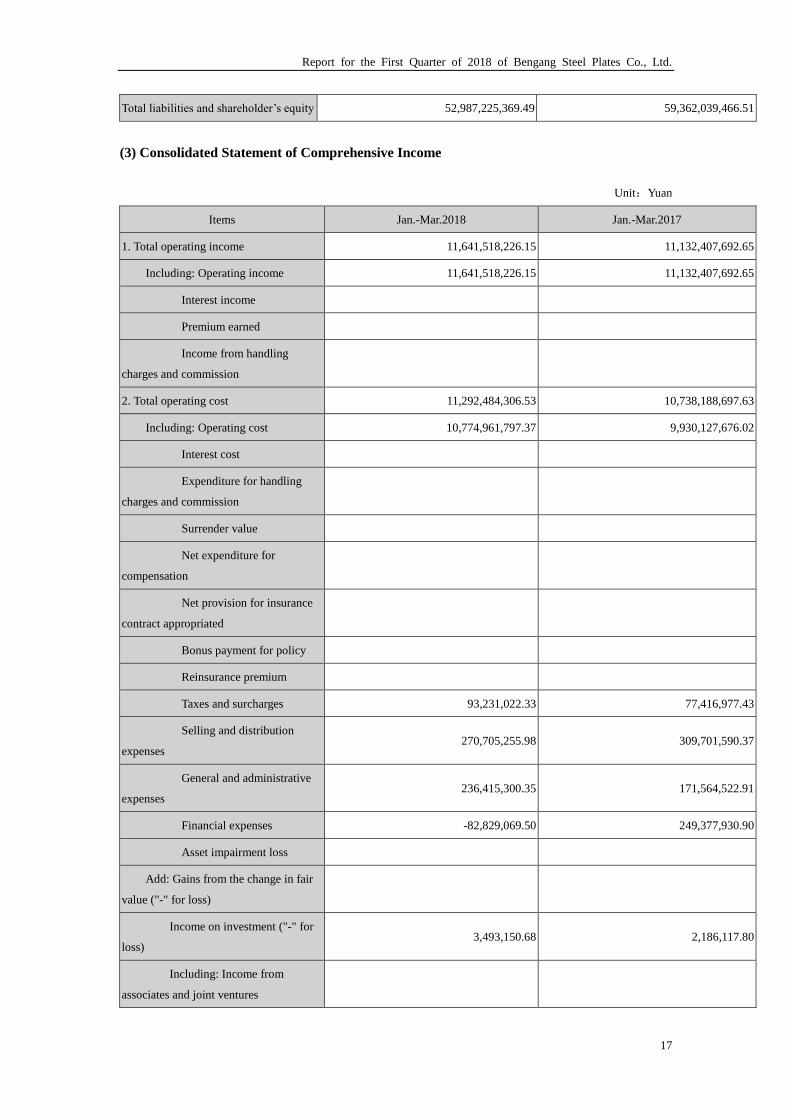
(3) Consolidated Statement of Comprehensive Income
Unit:Yuan
Items Jan.-Mar.2018 Jan.-Mar.2017
1. Total operating income 11,641,518,226.15 11,132,407,692.65
Including: Operating income 11,641,518,226.15 11,132,407,692.65
Interest income
Premium earned
Income from handling
charges and commission
2. Total operating cost 11,292,484,306.53 10,738,188,697.63
Including: Operating cost 10,774,961,797.37 9,930,127,676.02
Interest cost
Expenditure for handling
charges and commission
Surrender value
Net expenditure for
compensation
Net provision for insurance
contract appropriated
Bonus payment for policy
Reinsurance premium
Taxes and surcharges 93,231,022.33 77,416,977.43
Selling and distribution
expenses 270,705,255.98 309,701,590.37
General and administrative
expenses 236,415,300.35 171,564,522.91
Financial expenses -82,829,069.50 249,377,930.90
Asset impairment loss
Add: Gains from the change in fair
value ("-" for loss)
Income on investment ("-" for
loss) 3,493,150.68 2,186,117.80
Including: Income from
associates and joint ventures

Report for the First Quarter of 2018 of Bengang Steel Plates Co., Ltd.
18
Exchange gain ("-" for loss)
Assets disposal gains ("-" for
loss)
Other income 6,463,438.70
3 Operating profit ("-" for loss 358,990,509.00 396,405,112.82
Add: Non-operating income 1,585,742.03 9,446,503.65
Less: Non-operating expenses 2,338,387.11
4 Total profit ("-" for total loss) 360,576,251.03 403,513,229.36
Less: Income tax expenses 9,494,399.80 97,028,442.48
5 Net Profit ("-" for net loss) 351,081,851.23 306,484,786.88
Net profit from continuing operation
("-" for loss) 351,081,851.23 306,484,786.88
Net profit from discontinued
operation ("-" for loss)
Attributable to: Owners of parent
company 350,629,492.24 302,653,287.07
Non-controlling shareholders 452,358.99 3,831,499.81
6. Other comprehensive income after tax
Other comprehensive income
attributable to owners of parent company
after tax
1) Other comprehensive income
unable to be reclassified into profit and
loss afterwards
1.Change of net liabilities or
net assets through remeasuring defined
benefit plan
2.Share of other
comprehensive income of investee not to
be classified into profit or loss afterwards
under equity method
2) Other comprehensive income to
be reclassified into profit and loss
afterwards
1.Share of other
comprehensive income of investee to be
classified into profit or loss afterwards
under equity method
2. Gains and losses on

Report for the First Quarter of 2018 of Bengang Steel Plates Co., Ltd.
19
remeasuring available-for-sale financial
assets
3.Gains and losses resulting
from reclassification of held-to maturity
investment to financial assets held-for
sale
4.Effective portion of gains
or losses from cash flow hedging
5.
Gains and losses resulting from translatin
g the foreign currency
financial statements
6.Others
Other comprehensive income
attributable to non-controlling
shareholders after tax
7. Total comprehensive income 351,081,851.23 306,484,786.88
Total comprehensive income
attributable to owners of parent company 350,629,492.24 302,653,287.07
Total comprehensive income
attributable to non-controlling
shareholders
452,358.99 3,831,499.81
8. Earnings per share:
(1)Basic earnings per share 0.090 0.097
(2)Diluted earnings per share 0.090 0.097
Legal Representative:Wang Shu Person in charge of accounting:Han Ge Accounting Dept
Leader:Wang Shaoyu
(4) Income Statement of the Parent Company
Unit:Yuan
Items Jan.-Mar. 2018 Jan.-Mar. 2017
1 Operating income 11,808,077,059.64 11,398,661,706.90
Less: Operating cost 11,117,984,591.44 10,366,737,537.66
Taxes and surcharges 86,278,192.35 70,478,527.46
Selling and distribution
expenses 145,350,744.25 200,688,771.46
General and administrative 224,716,557.40 160,222,229.54

Report for the First Quarter of 2018 of Bengang Steel Plates Co., Ltd.
20
expenses
Financial expenses -97,141,152.03 231,289,051.43
Asset impairment loss
Add: Gains from the change
in fair value ("-" for loss)
Income on investment ("-" for
loss) 3,493,150.68 2,186,117.80
Including: Income from
associates and joint ventures
Assets disposal gains ("-" for
loss)
Other income 6,463,438.70
2 Operating profit ("-" for loss) 340,844,715.61 371,431,707.15
Add: Non-operating income 1,454,913.42 8,796,284.46
Less: Non-operating expenses 2,338,387.11
3 Total profit ("-" for total loss) 342,299,629.03 377,889,604.50
Less: Income tax expenses 4,625,935.23 87,971,810.96
4 Net Profit ("-" for net loss) 337,673,693.80 289,917,793.54
Net profit from continuing
operation ("-" for loss) 337,673,693.80 289,917,793.54
Net profit from discontinued
operation ("-" for loss)
5 Other comprehensive income after tax
1) Other comprehensive income
unable to be reclassified into profit and
loss afterwards
1.Change of net liabilities
or net assets through remeasuring
defined benefit plan
2.Share of other
comprehensive income of investee not
to be classified into profit or loss
afterwards under equity method
2) Other comprehensive income to
be reclassified into profit and loss
afterwards
1.Share of other
comprehensive income of investee to be
classified into profit or loss afterwards

Report for the First Quarter of 2018 of Bengang Steel Plates Co., Ltd.
21
under equity method
2 Gains and losses on
remeasuring available-for-sale financial
assets
3.Gains and losses resulting
from reclassification of held-to maturity
investment to financial assets held-for
sale
4.Effective portion of gains
or losses from cash flow hedging
5.
Gains and losses resulting from translati
ng the foreign currency
financial statements
6.Others
6 Total comprehensive income 337,673,693.80 289,917,793.54
7 Earnings per share:
(1)Basic earnings per share
(2)Diluted earnings per share
(5) Consolidated Statement of Cash Flows
Unit:Yuan
Items Jan.-Mar. 2018 Jan.-Mar. 2017
1.Cash flow from operating activities:
Cash received from sale of goods
or rendering of services 7,731,797,062.14 7,100,739,711.79
Net increase of customers’ deposit
and interbank deposit
Net increase of loan from central
bank
Net increase of loans from other
financial institutions
Cash received for premium of
original insurance contract
Net cash received for reinsurance
business
Net increase of deposit and
investment of the insured

Report for the First Quarter of 2018 of Bengang Steel Plates Co., Ltd.
22
Net increase of Financial assets at
fair value through profit or loss
Cash from receiving interest,
handling charge and commission
Net increase of loans from other
financial institutions
Net increase of fund for buy-back
business
Tax rebate received 72,002,572.86 40,096,198.40
Other cash received relating to
operating activities 60,576,344.20 69,675,649.95
Subtotal of cash inflow received from
operation activities 7,864,375,979.20 7,210,511,560.14
Cash paid for goods and services 15,907,402,800.35 9,858,638,834.91
Net increase of customer’s loan
and advances
Net increase of deposit in central
bank and interbank deposit
Cash for payment of
compensation for original insurance
contract
Cash for payment of interest,
handling charge and commission
Cash for payment of policy bonus
Cash paid to and on behalf of
employees 481,878,788.59 453,316,467.11
Cash paid for all types of taxes 322,300,081.76 296,159,456.20
Other cash paid relating to
operating activities 24,302,177.31 25,129,633.16
Subtotal of cash outflow received from
operation activities 16,735,883,848.01 10,633,244,391.38
Net cash flows generated from
operating activities -8,871,507,868.81 -3,422,732,831.24
2. Cash flows from investing
activities:
Cash received from return on
investments 500,000,000.00 159,000,000.00
Cash received from distribution of 3,493,150.68 2,186,117.80

Report for the First Quarter of 2018 of Bengang Steel Plates Co., Ltd.
23
dividends or profit
Net cash received from disposal of
fixed assets, intangible assets and other
long-term assets
Net cash received from disposal of
subsidiary and other operating units
Other cash paid relating to
investing activities
Subtotal of cash inflow received from
investing activities 503,493,150.68 161,186,117.80
Cash paid for acquisition of fixed
assets, intangible assets and other
long-term assets
367,847,024.60 486,764,678.93
Cash paid for acquisition of
investments
Net increase of mortgage loan
Net cash received from subsidiary
and other operating unit
Other cash paid relating to
investing activities
Subtotal of cash outflows from
investing activities 367,847,024.60 486,764,678.93
The net cash flow generated by
investment activities 135,646,126.08 -325,578,561.13
3. Cash flows from financing
activities:
Proceeds from investment 3,965,799,988.19
Including: Proceeds from
investment of non-controlling
shareholders of subsidiary
Proceeds from borrowings 6,576,220,000.00 6,602,518,658.09
Cash received from bond issuance
Other proceeds relating to
financing activities
Subtotal cash inflow received from
financing activities 10,542,019,988.19 6,602,518,658.09
Cash repayments of borrowings 6,452,965,440.62 3,997,546,531.91
Cash payments for distribution of 292,806,531.43 282,352,521.52

Report for the First Quarter of 2018 of Bengang Steel Plates Co., Ltd.
24
dividends, profit or interest expenses
Including: Cash paid to
non-controlling shareholders as
dividend and profit by subsidiaries
Other cash payments relating to
financing activities
Subtotal of cash outflows from
financing activities 6,745,771,972.05 4,279,899,053.43
The net cash flow generated by
financing activities 3,796,248,016.14 2,322,619,604.66
4. Effect of foreign exchange rate
changes on cash and cash equivalents -6,488,117.13 -8,665,398.73
5. Net increase in cash and cash
equivalents -4,946,101,843.72 -1,434,357,186.44
Add: Cash and cash equivalents at
the beginning of the period 12,317,576,778.93 12,273,574,488.67
6. Cash and cash equivalents at the
ending of the period 7,371,474,935.21 10,839,217,302.23
(6) Cash Flow Statement of Parent Company
Unit:Yuan
Items Jan.-Mar. 2018 Jan.-Mar. 2017
1.Cash flow from operating activities:
Cash received from sale of goods
or rendering of services 7,332,137,869.58 7,138,918,917.92
Tax rebate received 135,442.49 4,990,848.26
Other cash received relating to
operating activities 42,405,069.68 50,953,435.38
Subtotal of cash inflow received from
operation activities 7,374,678,381.75 7,194,863,201.56
Cash paid for goods and services 15,657,723,198.78 9,605,833,537.74
Cash paid to and on behalf of
employees 456,027,325.34 429,807,971.99
Cash paid for all types of taxes 289,677,174.70 271,085,915.47
Other cash paid relating to
operating activities 20,458,086.55 20,753,329.17
Subtotal of cash outflow received from 16,423,885,785.37 10,327,480,754.37

Report for the First Quarter of 2018 of Bengang Steel Plates Co., Ltd.
25
operation activities
Net cash flows generated from
operating activities -9,049,207,403.62 -3,132,617,552.81
2. Cash flows from investing
activities:
Cash received from return on
investments 500,000,000.00 159,000,000.00
Cash received from distribution of
dividends or profit 3,493,150.68 2,186,117.80
Net cash received from disposal of
fixed assets, intangible assets and other
long-term assets
Net cash received from disposal of
subsidiary and other operating units
Other cash paid relating to
investing activities
Subtotal of cash inflow received from
investing activities 503,493,150.68 161,186,117.80
Cash paid for acquisition of fixed
assets, intangible assets and other
long-term assets
366,691,846.42 474,766,092.93
Cash paid for acquisition of
investments 173,500,000.00
Net cash received from subsidiary
and other operating unit
Other cash paid relating to
investing activities
Subtotal of cash outflows from
investing activities 540,191,846.42 474,766,092.93
The net cash flow generated by
investment activities -36,698,695.74 -313,579,975.13
3. Cash flows from financing
activities:
Proceeds from investment 3,965,799,988.19
Proceeds from borrowings 6,053,220,000.00 5,978,931,200.00
Cash received from bond issuance
Other proceeds relating to
financing activities

Report for the First Quarter of 2018 of Bengang Steel Plates Co., Ltd.
26
Subtotal cash inflow received from
financing activities 10,019,019,988.19 5,978,931,200.00
Cash repayments of borrowings 6,012,965,440.62 3,743,326,531.91
Cash payments for distribution of
dividends, profit or interest expenses 279,903,047.33 267,274,159.52
Other cash payments relating to
financing activities
Subtotal of cash outflows from
financing activities 6,292,868,487.95 4,010,600,691.43
The net cash flow generated by
financing activities 3,726,151,500.24 1,968,330,508.57
4. Effect of foreign exchange rate
changes on cash and cash equivalents -6,484,800.97 -8,663,163.83
5. Net increase in cash and cash
equivalents -5,366,239,400.09 -1,486,530,183.20
Add: Cash and cash equivalents at
the beginning of the period 12,152,285,550.21 11,876,536,613.66
6. Cash and cash equivalents at the
ending of the period 6,786,046,150.12 10,390,006,430.46
2 Auditors’ report
Whether First quarter report has been audited by a CPAs firm.
□ Yes √ No
The First quarter report has not been audited by a CPAs firm.