Benefit Transfer of Outdoor Recreation Use Values
64
JOHN F. DWYER DAVID J. NOWAK, MARY HEATHER NOBLE, AND SUSAN M. SISINNI U.S. DEPARTMENT OF AGRICULTURE FOREST SERVICE RANDALL S. ROSENBERGER AND JOHN B. LOOMIS Benefit Transfer of Outdoor Recreation Use Values Benefit Transfer of Outdoor Recreation Use Values A Technical Document Supporting the Forest Service Strategic Plan (2000 Revision) A Technical Document Supporting the Forest Service Strategic Plan (2000 Revision)
Transcript of Benefit Transfer of Outdoor Recreation Use Values

JOHN F. DWYER DAVID J. NOWAK, MARY HEATHER NOBLE, AND SUSAN M. SISINNI
U.S. DEPARTMENT OF AGRICULTURE FOREST SERVICE
RANDALL S. ROSENBERGER AND JOHN B. LOOMIS
Benefit Transfer of OutdoorRecreation Use Values
Benefit Transfer of OutdoorRecreation Use Values
A Technical Document Supporting theForest Service Strategic Plan (2000 Revision)
A Technical Document Supporting theForest Service Strategic Plan (2000 Revision)

Abstract
Rosenberger, Randall S.; Loomis, John B. 2001. Benefit transfer of outdoor recreation usevalues: A technical document supporting the Forest Service Strategic Plan (2000 revision).Gen. Tech. Rep. RMRS-GTR-72. Fort Collins, CO: U.S. Department of Agriculture, Forest Service,Rocky Mountain Research Station. 59 p.
We present an annotated bibliography that provides information on and reference to the literature onoutdoor recreation use valuation studies. This information is presented by study source, benefitmeasures, recreation activity, valuation methodology, and USDA Forest Service region. Tables areprovided that reference the bibliography for each activity, enabling easy location of studies. Theliterature review spans 1967 to 1998 and covers 21 recreation activities plus a category for wildernessrecreation. There are 163 individual studies referenced, providing 760 benefit measures. Guidelines areprovided for applying the various benefit transfer methods. Benefit transfer is the use of past empiricalbenefit estimates to assess and analyze current management and policy actions. Several theoreticaland empirical issues to applying benefit transfers are identified for use in judging the relevance andcredibility of transferring specific measures. Four benefit transfer models are discussed, including valuetransfers (single point estimates, average values) and function transfers (demand and benefit functionsand meta analysis benefit function). A simple example application is followed throughout the discussionof the various benefit transfer methods. A decision tree is provided as a framework for determining howto obtain benefit measures for recreation activities.
Keywords: Benefit transfer, meta-analysis, outdoor recreation use values
Final Report for the USDA Forest Service under Research Joint Venture Agreement #RMRS-98132-RJVA, “Theories and methods for measuring environmental values and modelingconsumer and policy decision processes”: Objective #4, “Benefit transfer.”
Authors
Randall S. Rosenberger is Assistant Professor, Regional Research Institute and Division of ResourceManagement, West Virginia University, Morgantown, WV 26506.
John B. Loomis is Professor, Department of Agricultural and Resource Economics, Colorado StateUniversity, Fort Collins, CO 80523.
You may order additional copies of this publication by sending your mailinginformation in label form through one of the following media. Please specify thepublication title and number.
Telephone (970) 498-1392
FAX (970) 498-1396
E-mail [email protected]
Available on the Web http://www.fs.fed.us/rm
Mailing Address Publications DistributionRocky Mountain Research Station240 West Prospect RoadFort Collins, CO 80526
Benefit Transfer of Outdoor Recreation UseValues: A Technical Document Supportingthe Forest Service Strategic Plan (2000Revision)
Randall S. RosenbergerJohn B. Loomis
Contents
Executive Summary ......................................................................................... 1Acknowledgments ............................................................................................ 1Introduction ...................................................................................................... 2Data ............................................................................................................ 2
Literature Review Efforts, Past and Present .............................................. 2Data Sources and Coding Procedures ...................................................... 3
Benefit Transfer: Issues ................................................................................... 3What Is a Benefit Transfer? ....................................................................... 3Conditions for Performing Benefit Transfers ............................................. 4Potential Limitations of Benefit Transfers .................................................. 5Validity and Reliability of Benefit Transfers ............................................... 6Benefit Transfer Methods .......................................................................... 6
Benefit Estimates ............................................................................................. 7What Are They and What Do They Mean? ................................................ 7How Are the Study Site Values Estimated? .............................................. 8
Benefit Transfer: Methods and Application ...................................................... 9Value Transfers ......................................................................................... 9Benefit Function Transfers ...................................................................... 14
Recommendations and Guidance to Field Users........................................... 24References Cited ........................................................................................... 26Appendix A: Annotated Bibliography of Outdoor Recreation
Use Valuation Studies, 1967 to 1998 ................................................. 28Appendix B: Summary of Multi-Estimate Studies in Appendix A,
Annotated Bibliography ...................................................................... 44Appendix C: References to Appendix A Annotated Bibliography
Entries by Recreation Activity ............................................................. 55

Executive Summary
1USDA Forest Service Gen. Tech. Rep. RMRS-GTR-72. 2001
Executive Summary
This document serves four purposes: (1) it pro-vides access to the literature on recreation use val-ues; (2) it provides guidelines for conducting benefittransfers; (3) it provides a review of benefit transferapproaches; and (4) it provides a meta analysis ofthe recreation use value literature for use in benefittransfers. Benefit transfer is the application of datafrom a study site to a policy site. A study site is aplace for which we have recreation value data col-lected through primary research. Primary researchprovides content- and context-specific estimates ofrecreation value for a site. A policy site is a place forwhich there is little or no data available on theeconomic value of recreation. When circumstancessuch as insufficient funding or time make primaryresearch infeasible, benefit transfer provides a meansby which the value of recreation at an unstudied sitecan be estimated using information about recreationvalues at other sites. Benefit transfer provides con-tent- and context-relevant estimates of recreationvalue for policy sites.
Access to the outdoor recreation use value literatureis provided via an annotated bibliography and cross-referencing of studies by recreation activity. The litera-ture reviewed is comprised of outdoor recreation usevalue studies conducted from 1967 to 1998 in theUnited States and Canada. This includes 760 valuemeasures estimated from 163 separate empirical re-search efforts covering 21 recreation activities.
Guidance is provided by identifying necessary con-ditions for and limitations to effective benefit trans-fers. Necessary conditions include issues concerningpolicy site needs, the quality of study site data, andthe correspondence between the study site and thepolicy site. Several factors can affect benefit transfersand limit the accuracy of value estimation. Thesefactors are categorized as data issues, methodologicalissues, site correspondence issues, temporal issues,and spatial issues. A decision tree is developed thatguides field personnel and resource managers througha framework on how to obtain measures of recreationuse value.
Four benefit transfer approaches are reviewed. Anexample application of each of the approaches is pro-vided. Value transfers focus on measures of value. Theuse of single point measures and measures of central
tendency for recreation values are discussed. Functiontransfers focus on statistical models estimated in pri-mary research. These models relate value measureswith measures of study site characteristics such asdemographics of the user population, attributes of therecreation site or area, among others. The functions areadapted to characteristics of the policy site in order toestimate recreation values for the policy site. Demandor willingness to pay functions and meta analysisfunctions are discussed.
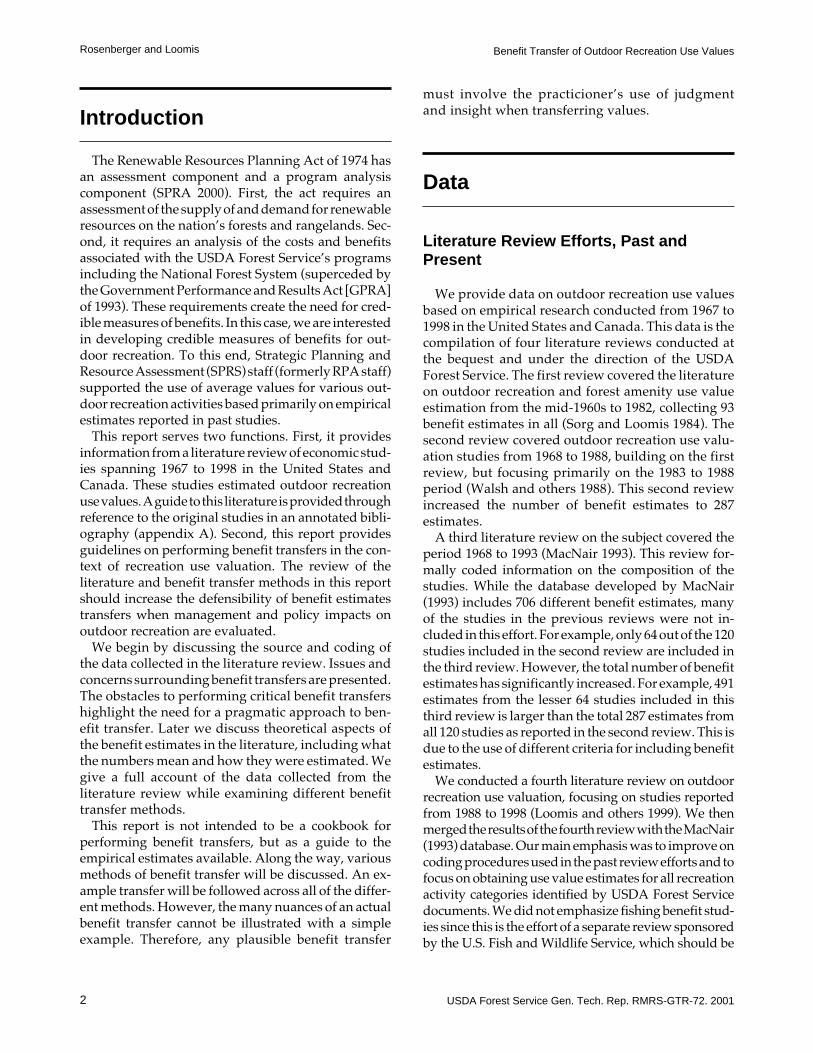
A meta analysis of the recreation use valuation lit-erature is provided. Meta analysis is the statisticalsummarization of research outcomes. A meta analysismodel is developed that can be applied to benefittransfers. It is based on 701 use value estimates from131 separate primary research studies. A backwardelimination procedure was used to optimize the metaanalysis benefit transfer function by retaining onlythose 34 variables significant at the 80 percent level orbetter. The variables in the model include method-ological factors, Forest Service regions, physical andpolitical characteristics, and several recreation activi-ties. The meta analysis benefit transfer function is usedto estimate use values for 21 recreation activities foreach of the Forest Service assessment regions and forthe United States. This meta analysis benefit transferfunction provides field personnel and resource man-agers with another tool for estimating use values foroutdoor recreation activities.
Acknowledgments
This project was supported by funds provided bythe Washington Office/Strategic Planning and Re-source Assessment and the Rocky Mountain ResearchStation, Forest Service, U.S. Department of Agriculture.The authors acknowledge the assistance of DennisBlack in the literature search process, Shauna Page inthe coding of the studies, Ram Shrestha for mainte-nance of the database, and Ross Arnold, GeorgePeterson, and Dan McCollum for their valuable feed-back and useful suggestions in analyzing the data.This report has benefited from a peer review by LindaLangner, Earl Ekstrand, and Jonathan Platt, and theUSDA Forest Service General Technical Report reviewprocess, all of whom provided insightful comments.Any shortcoming of this report is the sole responsi-bility of the authors.
2 USDA Forest Service Gen. Tech. Rep. RMRS-GTR-72. 2001
Rosenberger and Loomis Benefit Transfer of Outdoor Recreation Use Values
Introduction
The Renewable Resources Planning Act of 1974 hasan assessment component and a program analysiscomponent (SPRA 2000). First, the act requires anassessment of the supply of and demand for renewableresources on the nation’s forests and rangelands. Sec-ond, it requires an analysis of the costs and benefitsassociated with the USDA Forest Service’s programsincluding the National Forest System (superceded bythe Government Performance and Results Act [GPRA]of 1993). These requirements create the need for cred-ible measures of benefits. In this case, we are interestedin developing credible measures of benefits for out-door recreation. To this end, Strategic Planning andResource Assessment (SPRS) staff (formerly RPA staff)supported the use of average values for various out-door recreation activities based primarily on empiricalestimates reported in past studies.
This report serves two functions. First, it providesinformation from a literature review of economic stud-ies spanning 1967 to 1998 in the United States andCanada. These studies estimated outdoor recreationuse values. A guide to this literature is provided throughreference to the original studies in an annotated bibli-ography (appendix A). Second, this report providesguidelines on performing benefit transfers in the con-text of recreation use valuation. The review of theliterature and benefit transfer methods in this reportshould increase the defensibility of benefit estimatestransfers when management and policy impacts onoutdoor recreation are evaluated.
We begin by discussing the source and coding ofthe data collected in the literature review. Issues andconcerns surrounding benefit transfers are presented.The obstacles to performing critical benefit transfershighlight the need for a pragmatic approach to ben-efit transfer. Later we discuss theoretical aspects ofthe benefit estimates in the literature, including whatthe numbers mean and how they were estimated. Wegive a full account of the data collected from theliterature review while examining different benefittransfer methods.
This report is not intended to be a cookbook forperforming benefit transfers, but as a guide to theempirical estimates available. Along the way, variousmethods of benefit transfer will be discussed. An ex-ample transfer will be followed across all of the differ-ent methods. However, the many nuances of an actualbenefit transfer cannot be illustrated with a simpleexample. Therefore, any plausible benefit transfer
must involve the practicioner’s use of judgmentand insight when transferring values.
Data
Literature Review Efforts, Past andPresent
We provide data on outdoor recreation use valuesbased on empirical research conducted from 1967 to1998 in the United States and Canada. This data is thecompilation of four literature reviews conducted atthe bequest and under the direction of the USDAForest Service. The first review covered the literatureon outdoor recreation and forest amenity use valueestimation from the mid-1960s to 1982, collecting 93benefit estimates in all (Sorg and Loomis 1984). Thesecond review covered outdoor recreation use valu-ation studies from 1968 to 1988, building on the firstreview, but focusing primarily on the 1983 to 1988period (Walsh and others 1988). This second reviewincreased the number of benefit estimates to 287estimates.
A third literature review on the subject covered theperiod 1968 to 1993 (MacNair 1993). This review for-mally coded information on the composition of thestudies. While the database developed by MacNair(1993) includes 706 different benefit estimates, manyof the studies in the previous reviews were not in-cluded in this effort. For example, only 64 out of the 120studies included in the second review are included inthe third review. However, the total number of benefitestimates has significantly increased. For example, 491estimates from the lesser 64 studies included in thisthird review is larger than the total 287 estimates fromall 120 studies as reported in the second review. This isdue to the use of different criteria for including benefitestimates.
We conducted a fourth literature review on outdoorrecreation use valuation, focusing on studies reportedfrom 1988 to 1998 (Loomis and others 1999). We thenmerged the results of the fourth review with the MacNair(1993) database. Our main emphasis was to improve oncoding procedures used in the past review efforts and tofocus on obtaining use value estimates for all recreationactivity categories identified by USDA Forest Servicedocuments. We did not emphasize fishing benefit stud-ies since this is the effort of a separate review sponsoredby the U.S. Fish and Wildlife Service, which should be

3USDA Forest Service Gen. Tech. Rep. RMRS-GTR-72. 2001
Rosenberger and LoomisBenefit Transfer of Outdoor Recreation Use Values
available by year 2001 (Markowski and others 1997). Wedid, however, include those fishing studies coded in theMacNair (1993) database that were from the Walsh andothers (1988) review, as generally these were sufficientin number and coverage of fishing studies for statisticalpurposes. Therefore, our database includes 163 studiesproviding 760 benefit estimates, covering all recreationactivity categories.
Data Sources and Coding Procedures
The focus of our literature review effort was foroutdoor recreation use valuation studies conductedsince 1988 in the United States and Canada. We con-certed our efforts to locate studies on activities thatwere not previously investigated, such as rock climb-ing, snowmobiling, and mountain biking. Computer-ized databases, such as American EconomicAssociation’s ECONLIT, were searched for publishedliterature along with the University of Michigan’sDissertation and Master’s Thesis Abstracts. Gray lit-erature was located by using conference proceedings,bibliographies on valuation studies (Carson and oth-ers 1994), and access to working papers. Details ofstudies conducted from 1967 to 1988 were obtainedprimarily from MacNair’s (1993) database that codedthe Walsh and others (1988) literature review. A fewstudy details were obtained directly from the Walshand others (1988) review that were not included in theMacNair (1993) database.
A master coding sheet was developed that contains126 fields. The main coding categories include refer-ence citation to the research, benefit measure(s) re-ported, methodology used, recreation activity investi-gated, recreation site characteristics, and user or samplepopulation characteristics. Study reference citationdetails include, in part, author identification, year ofstudy, and source of study results. Benefit measure(s)details include, in part, the monetary estimate pro-vided by the study (converted to activity day unitsusing information provided by the study), the units inwhich the estimate is reported (e.g., day, trip, season,or year), and temporally adjusted benefit measures forinflationary trends to fourth-quarter 1996 dollars us-ing the implicit price deflator. An activity day is thetypical amount of time pursuing an activity within a24-hour period. This unit was chosen because of itsease in being converted to other visitation/participa-tion units (e.g., recreation visitor days, trips, seasons).Table 1 provides summary statistics for the 21 recre-ation activities included in the database. All of thebenefit measures reported in table 1 are adjusted toactivity day units and fourth-quarter 1996 dollars.
Methodology details include survey mode (e.g., mail,telephone, in-person, use of secondary data), responserate for primary data collection studies, and sampleframe (e.g., onsite users, general population). Method-ology details are further divided between the applica-tion of revealed preference (RP) and stated preference(SP) modeling when appropriate. Details of RP model-ing include, in part, identifying the model type (e.g.,individual travel cost, zonal travel cost, random utilitymodels), use of travel time or substitute sites in themodel specification, and functional form (double log,linear, semi-log, log-linear). Details of SP modelinginclude, in part, identifying the model type (e.g., con-joint analysis, contingent valuation models), the elici-tation technique for contingent valuation models (e.g.,open ended, dichotomous choice, iterative bidding,payment card), and functional form.
Details of the recreation site include, in part, itsgeographic location, whether it was on public or pri-vate land, the type of public land (e.g., National Park,National Forest, State Park, State Forest), the state, theUSDA Forest Service Region, and land type (e.g., lake,forest, wetland, grassland, river). In many cases, spe-cific details about the recreation site were not providedeither because of incomplete reporting or the activitywas not linked with a specific site. Details of the userpopulation characteristics include, in part, averageage, average income, average education, and propor-tion female.
The details of each study were coded to the extentthat they could be gleaned from the research-reportingvenue. However, not every study could be fully codedaccording to the coding sheet. This was either becauseinformation was not reported or was not collected fora study. For example, coding each study for usercharacteristics was severely restricted in that very fewof the studies in the literature review reported anydetails about the user population. This and other fac-tors are indicative of the lack of consistent and com-plete data reporting, which further limits the ability toperform critical benefit transfers.
Benefit Transfer: Issues
What Is a Benefit Transfer?
Benefit transfer is a colloquial term referring to theuse of existing information and knowledge to newcontexts. For our present purposes, benefit transfer

4 USDA Forest Service Gen. Tech. Rep. RMRS-GTR-72. 2001
Rosenberger and Loomis Benefit Transfer of Outdoor Recreation Use Values
is the adaptation and use of economic informationderived from a specific site(s) under certain resourceand policy conditions to a site with similar resourcesand conditions. The site with data is typically calledthe “study” site, while the site to which data aretransferred is called the “policy” site. Benefit transferis a practical way to evaluate management and policyimpacts when primary research is not possible orjustified because of:
1. budget constraints,
2. time limitations, or
3. resource impacts that are expected to be low orinsignificant.
Primary research is the “first-best” strategy in whichinformation is gathered that is specific to the actionbeing evaluated, including the spatial and temporaldimensions, expected impacts, and the extent andinclusion of affected human populations and environ-mental resources. However, when primary research isnot possible or plausible, then benefit transfer, as a“second-best” strategy, is important to evaluatingmanagement and policy impacts. The “worst-best”strategy in economic evaluation is to not account for
recreation values, thus implying recreation has zerovalue in an evaluation or assessment model.
Conditions for Performing BenefitTransfers
Several necessary conditions should be met toperform effective and efficient benefit transfers(Desvousges and others 1992). First, the policy contextshould be thoroughly defined, including:
1. Identifying the extent, magnitude, and quantifi-cation of expected site or resource impacts fromthe proposed action.
2. Identifying the extent and magnitude of the popu-lation that will be affected by the expected site orresource impacts.
3. Identifying the data needs of an assessment oranalysis, including the type of measure (unit,average, marginal value), the kind of value (use,nonuse, or total value), and the degree of certaintysurrounding the transferred data (i.e., the accu-racy and precision of the transferred data).
Table 1—Summary statistics on average consumer surplus values per activity day per person from recreation demandstudies—1967 to 1998 (fourth-quarter, 1996 dollars).
Number Number of Mean of Median of Std. error Range ofActivity of studies estimates estimates estimates of mean estimates
Camping 22 40 $30.36 $24.09 5.50 $1.69 – 187.11Picnicking 7 12 35.26 24.21 9.66 7.45 – 118.95Swimming 9 12 21.08 18.19 4.46 1.83 – 49.08Sightseeing 9 20 35.88 21.13 9.41 0.54 – 174.81Off-road driving 3 4 17.43 15.85 6.27 4.37 – 33.64Motorized boating 9 14 34.75 18.15 11.65 4.40 – 169.68Nonmotorized boating 13 19 61.57 36.42 13.76 15.04 – 263.68Hiking 17 29 36.63 23.21 7.87 1.56 – 218.37Biking 3 5 45.15 54.90 8.40 17.61 – 62.88Downhill skiing 5 5 27.91 20.90 7.07 12.54 – 52.59Cross-country skiing 7 12 26.15 26.73 2.84 11.70 – 40.32Snowmobiling 2 2 69.97 69.97 33.74 36.23 – 103.70Big game hunting 35 177 43.17 37.30 2.21 4.74 – 209.08Small game hunting 11 19 35.70 27.71 9.56 3.47 – 190.17Waterfowl hunting 13 59 31.61 18.21 4.06 2.16 – 142.82Fishinga 39 122 35.89 20.19 3.42 1.73 – 210.94Wildlife viewing 16 157 30.67 28.26 1.38 2.36 – 161.59Horseback riding 1 1 15.10 15.10 0 15.10 – 15.10Rock climbing 2 4 52.96 48.14 11.80 29.82 – 85.74General recreation 12 31 24.26 10.03 7.48 1.18 – 214.59Other recreation 11 16 40.58 33.78 9.64 4.76 – 172.34
aFishing includes all types of fishing such as cold water, warm water, and salt water fishing. The number of estimates for fishing is under-representative of the entire body of knowledge since fishing studies were not a primary focus of the literature review.

5USDA Forest Service Gen. Tech. Rep. RMRS-GTR-72. 2001
Rosenberger and LoomisBenefit Transfer of Outdoor Recreation Use Values
Second, the study site data should meet certainconditions for critical benefit transfers:
1. Studies transferred must be based on adequatedata, sound economic method, and correct em-pirical technique (Freeman 1984).
2. The study contains information on the statisti-cal relationship between benefits (costs) andsocioeconomic characteristics of the affectedpopulation.
3. The study contains information on the statisticalrelationship between the benefits (costs) and physi-cal/environmental characteristics of the study site.
4. An adequate number of individual studies on arecreation activity for similar sites have been con-ducted in order to enable credible statistical infer-ences concerning the applicability of the trans-ferred value(s) to the policy site.
And third, the correspondence between the studysite and the policy site should exhibit the followingcharacteristics:
1. The environmental resource and the change in thequality (quantity) of the resource at the study siteand the resource and expected change in the re-source at the policy site should be similar. Thissimilarity includes the quantifiability of the changeand possibly the source of that change.
2. The markets for the study site and the policy siteare similar, unless there is enough usable infor-mation provided by the study on own and substi-tute prices. Other characteristics should be con-sidered, including similarity of demographicprofiles between the two populations and theircultural aspects.
3. The conditions and quality of the recreation activ-ity experiences (e.g., intensity, duration, and skillrequirements) are similar between the study siteand the policy site.
Most primary research was not conducted for futurebenefit transfer applications. The information require-ments expressed in the above conditions are not al-ways met in the reporting of data and results fromprimary research. In addition to weighing the benefitsof more information from expensive primary research,the implicit cost of performing benefit transfers underconditions of incomplete information should be ac-counted for. Therefore, benefit transfer practitionersare required to be pragmatic in their applications of themethod when considering the many limitations im-posed upon them by primary research.
Potential Limitations of Benefit Transfers
Several factors can be identified that affect the reli-ability and validity of benefit transfers. A paralleleffect that interacts with the following factors is thebenefit transfer practitioner’s judgment concerningempirical studies, including how to code the datareported by each study. One group of factors affectbenefit transfers generally:
1. The quality of the original study greatly affects thequality of the benefit transfer process. This is thegarbage-in, garbage-out factor.
2. Some recreation activities have a limited numberof studies investigating their economic value, thusrestricting the pool of estimates and studies fromwhich to draw information.
3. Another data limitation is the documentation ofdata collected and reported. This increases thedifficulty of demand estimation and benefittransfer.
4. As we have already noted, most primary researchis not designed for benefit transfer purposes.
A second group of factors is related to methodologi-cal issues:
1. Different research methods may have been usedacross study sites for a specific recreation activity,including what question(s) was asked, how it wasasked, what was affected by the management orpolicy action, how the environmental impactswere measured, and how these impacts affectrecreation use.
2. Different statistical methods for estimating mod-els can lead to large differences in values esti-mated. This also includes issues such as the over-all impact of model mis-specification and choiceof functional form (Adamowicz and others 1989).
3. Substitution in recreation demand is an importantelement when determining the potential impactsof resource changes. However, there is often a lackof data collection and or reporting on the avail-ability of substitute sites, substitute site prices,and the substitution relationship across sites andamong activities.
4. There are different types of values that may havebeen measured in primary research, includinguse values and/or passive- or non-use values.While this report focuses on use values, the ben-efit transfer practitioner should be aware of whatis being measured in original research.

6 USDA Forest Service Gen. Tech. Rep. RMRS-GTR-72. 2001
Rosenberger and Loomis Benefit Transfer of Outdoor Recreation Use Values
A third group of factors affecting benefit transfers isthe correspondence between the study site and thepolicy site:
1. Some of the existing studies may be based onvaluing recreation activities at unique sites andunder unique conditions.
2. Characteristics of the study site and the policy sitemay be substantially different, leading to quitedistinct values. This can include differences inquality changes, site quality, and site location.
A fourth factor is the issue of temporality or stabil-ity of data over time. The existing studies occurred atdifferent points in time. The relevant differences be-tween then and now may not be identifiable normeasurable based on the available data. A fifth factoris the spatial dimension between the study site andthe policy site. This includes the extent of the impliedmarket, both for the extent and comparability of theaffected populations and the resources impactedbetween the study site and the policy site.
The above listed factors can lead to bias or error inand restrict the robustness of the benefit transfer pro-cess. An overriding objective of the benefit transferprocess is to minimize mean square error between the“true” value and the “tailored” or transferred value ofimpacts at the policy site. However, the original ortrue values are themselves approximations and aretherefore subject to error. As such, any informationtransferred from a study site to a policy site is accom-plished with varying degrees of confidence in theapplicability and precision of the information. There-fore, National Forest decisionmaking involving trade-offs of recreation, commodity production, and naturepreservation can often be improved by inclusion ofeven approximate estimates of nonmarket recreationvalues. Complete omission of recreation value esti-mates in economic analytic aids to decisionmakingimplies a zero value for recreation, in which case theerror of omission can be greater than the error ofcommission in benefit transfers procedures.
Validity and Reliability of BenefitTransfers
Several recent studies have tested the convergentvalidity and reliability of different benefit transfermethods (Loomis and others 1995; Downing andOzuna 1996; Kirchhoff and others 1997; Desvousgesand others 1998; Rosenberger and Loomis 2000). Themethods tested, which we will presently discuss,include single point estimate, average value, demand
function, and meta regression analysis transfers.While the above studies show that some of the meth-ods are relatively more valid and reliable than othermethods, the general indication is that benefit trans-fer cannot replace original research, especially whenthe costs of being wrong are high. In some tests of thebenefit transfer methods, several cases produced tai-lored values very similar to the true values (as low asa few percentage points difference). In other cases,the disparity between the true value and the tailoredvalue was quite large (in excess of 800% difference).Therefore, the policy context and process will mostoften dictate the acceptability of transferred data.
Benefit Transfer Methods
There are two broad approaches to benefit transfer:(1) value transfer and (2) function transfer (figure 1).Value transfers encompass the transfer of a single(point) benefit estimate from a study site, or a measureof central tendency for several benefit estimates froma study site or sites (such as an average value), oradministratively approved estimates. Administrativelyapproved value estimates will be discussed in con-junction with the measure of central tendency discus-sion. Function transfers encompass the transfer of abenefit or demand function from a study site, or a metaregression analysis function derived from several studysites. Function transfers then adapt the function to fitthe specifics of the policy site such as socioeconomiccharacteristics, extent of market and environmental
Value Transfer Function Transfer
Single
Point
Estimate
Measure of
Central
Tendency
Benefit/
Demand
Function
Meta
Analysis
Function
Use estimate at
policy site
Adapt function to
policy site
Use tailored
estimate at
policy site
Adminis-
tratively
Approved
Figure 1. Benefit transfer approaches.

7USDA Forest Service Gen. Tech. Rep. RMRS-GTR-72. 2001
Rosenberger and LoomisBenefit Transfer of Outdoor Recreation Use Values
impact, and other measurable characteristics that sys-tematically differ between the study site(s) and thepolicy site. The adapted function is then used to fore-cast a benefit measure for the policy site.
We will discuss each of these methods in the follow-ing sections, including a simple example applicationfor each. However, we will first define and identifywhat the benefit measures are, what they mean, andhow they were estimated.
Benefit Estimates
What Are They and What Do They Mean?
All of the benefit estimates provided by this report,either recorded from the literature review or fore-casted by adapting benefit functions, are average con-sumer surplus per person per activity day. In the caseof a single study, the estimate is the average consumersurplus for the average individual in the study. In thecase of several studies, the estimate is the average ofthe study samples’ average consumer surpluses fromall included studies.
Consumer surplus is the value of a recreation activ-ity beyond what must be paid to enjoy it.1 Figure 2illustrates the concept of consumer surplus. Lookingjust at current conditions when demand is D0, con-sumer surplus is the area below the demand function(D0) and above the expenditure line (E), or area CFH.Consumer surplus is also referred to as net willing-ness to pay, or willingness to pay in excess of the costof the good. Total economic use value is consumersurplus plus the costs of participation, or area 0HFAin figure 2 when demand is D0 and A is the number ofdays of participation.
When the change in recreation supply or days issmall and localized, consumer surplus is equivalentto a virtual market price for a recreation activity(Rosenthal and Brown 1985). A general assumption
when applying the benefit estimates is that the esti-mates are constant across all levels of resource impactsand perceived changes for an individual. This assump-tion may be plausible for small changes in visitation,but it may be unrealistic for large changes (Morey1994). However, this assumption is necessary for thepractical application of benefit transfers.
The valuation of management and policy impacts onrecreation can be formally described as equation (1),following Smith and others (1999) nomenclature:
CSCS
dd N d NP
S
S
= ⋅ − ⋅∆
( ),1 1 0 0 (1)
where CSP = consumer surplus estimate for evaluat-ing management or policy impacts onrecreation;
CSS = consumer surplus gain measure re-ported in the literature;
di = the amount of recreation use in activitydays before (i = 0) and after (i = 1) themanagement or policy action;
Ni = the number of people participating inthe recreation activity before (i = 0) andafter (i = 1) the management or policyaction; and
∆dS = measured change in recreation partici-pation or affected resource in the litera-ture providing CSS.
Simply stated, the benefit transfer estimate of a man-agement- or policy-induced change in recreation is theaverage consumer surplus estimate for the average
WTP
Cost
Price
0# of daysA B
D0
D1
C
H
I
F GE
Figure 2. Consumer surplus measures for a quality-inducedchange in demand.
1There are two prominent types of consumer surplusestimated using slightly different definitions of the demandfunction: Marshallian consumer surplus based on an ordi-nary demand function, and Hicksian consumer surplus basedon either a compensated demand function or elicited directlyusing hypothetical market techniques. The difference be-tween these measures is due to the income effect (Willig1976). Since outdoor recreation expenditures are a relativelysmall percentage of total expenditures (income), differencesbetween the two measures are expected to be negligible.

8 USDA Forest Service Gen. Tech. Rep. RMRS-GTR-72. 2001
Rosenberger and Loomis Benefit Transfer of Outdoor Recreation Use Values
individual from the literature aggregated to the changein use of the natural resource. The change in recre-ational use of a resource may be induced either througha price change in participating in an activity (e.g., feechange or location of the site) or through a qualitychange in the recreation site.
The benefit estimates in the literature can vary ac-cording to many factors such as differences in recre-ation site and user population characteristics, extent ofthe market, temporal and spatial differences, andmethodologically induced differences. Returning tofigure 2, the potential range in benefit estimates pro-vided in the literature can be illustrated. If the demandshift from D0 to D1 is due to a measurable increase inthe quality of a recreation site, then three consumersurplus areas are identifiable: (1) CFH (existing level),(2) CGI (improved level), and (3) IHFG (net gain).Thus, another potential source for variability in ben-efit estimates provided is the context of the benefitestimate reported. For example, study A may providea value for the creation of a new recreation site (area 1or 3, depending upon expected demand level). StudyB, by contrast, may provide an estimate of the currentvalue of an activity with no implied change (area 1 or3, depending on implied demand). Study C may pro-vide an estimate of the value of a change in demanddue to a management- or policy-induced change inimplied cost or resource quality (area 2). Therefore,benefit estimates for the same activity reported in theliterature can range from area 1 to area 3. All esti-mates provided in this report are of the first two types(studies A and B) above (we are not providing incre-mental or marginal values).
In any case, the benefit estimate provided in theliterature will be treated as a constant per unit valueapplicable to all possible levels of resource use, with noaccounting made for congestion. For example, thesame benefit measure will be used whether recreationis affected by an increase (decrease) of 2 percent or 98percent, measured as total activity days. Critical trans-fers would use estimates from a study site that bestmatches the policy site context as identified in the lastsection. However, because primary research is nottypically conducted for the purpose of future benefittransfers and because of the limitations of study sitedata reporting listed above (especially incompleteand inconsistent reporting), the best match may notbe a very good match at all. This is why benefit trans-fers must be pragmatic in application (some value maybe better than no value at all). By being aware of thechallenges to performing critical benefit transfers andwhat the estimates in the literature represent, practi-tioners of benefit transfer can better defend their trans-ferred measures. There may be times when values or
functions in the literature are used to arrive at a basevalue. These base values can then be adjusted up ordown based on professional judgment to account forfactors (like congestion) not accounted for in the ben-efit transfer. Such adjustments, if made, should bedocumented by the analyst.
How Are the Study Site ValuesEstimated?
There is an array of techniques used to estimate theeconomic use value of outdoor recreation.2 Theseapproaches are traditionally called nonmarket valua-tion, basically because not all of the resources impor-tant to the quantity and quality of recreation experi-ences are traded in markets. When market prices arenot available, economic techniques may be employedthat indirectly or directly estimate virtual marketprices (as average consumer surplus or marginal will-ingness to pay). Revealed preference techniques areindirect methods for estimating consumer surplus andrely on the weak complementary between recreationparticipation and market-purchased goods necessaryto recreation participation. Stated preference techniquesare direct methods to estimating consumer surplus viaconstructed hypothetical markets through whichpeople express their willingness to pay for environ-mental resources or recreation opportunities. Depend-ing on the structure of a stated preference survey, it canalso elicit information for use in indirectly estimatingconsumer surplus.
The most frequently used revealed preference tech-nique is the travel cost method. Other methods in-cluded under the revealed preference technique head-ing are hedonic property and random utility methods.The travel cost method uses the variable costs of recre-ation participation (travel, lodging, entrance fees, equip-ment rentals, travel time) as a proxy for the price ofrecreating in deriving a demand function. The benefitof recreation is then the consumer surplus estimatedfrom the demand function as shown in figure 2.
The most frequently used stated preference tech-nique is the contingent valuation method. Another
2There are several accessible sources to issues innonmarket valuation. For example, see Freeman (1993),Loomis and Walsh (1997), Champ and others (in prepara-tion), and the website http://www.ecosystemvaluation.org(prepared under a cooperative agreement between U.S.Department of Agriculture, Natural Resource ConservationService, U.S. Department of Commerce, NOAA-Sea GrantOffice, and University of Maryland, Center for EnvironmentalScience).

9USDA Forest Service Gen. Tech. Rep. RMRS-GTR-72. 2001
Rosenberger and LoomisBenefit Transfer of Outdoor Recreation Use Values
stated preference approach is conjoint analysis—a multi-attribute, multi-objective based method. The contin-gent valuation method directly solicits information frompeople by asking them their maximum willingness topay or minimum compensation demanded for a recre-ation opportunity or change in a recreation experience,all within the confines of a hypothetical market.
While revealed preference approaches have typi-cally resulted in slightly larger benefit measures thanstated preference approaches, the approaches yieldmeasures that are highly correlated (Carson and oth-ers 1996). Several studies comparing revealed andstated preference techniques for the same good havefound the two measures not to be statistically differ-ent, providing evidence that the two techniques tononmarket valuation exhibit convergent validity.
Benefit Transfer: Methods andApplication
This section will discuss four different benefit trans-fer methods—single point estimate, average value, de-mand and benefit function, and meta regression analy-sis function. A simple example of each transfer will bepresented. Specific information about the literature onoutdoor recreation benefit measures will be provided.
Value Transfers
Single point estimate transfer
A single point estimate benefit transfer is based onusing an estimate from a single relevant primary
research study (or range of point estimates if morethan one study is relevant). The primary steps toperforming a single point estimate transfer includeidentifying and quantifying the management- or policy-induced changes on recreation use, and locating andtransferring a “unit” consumer surplus measure. Thetext box (figure 3) provides a more detailed list of thesteps involved in single point estimate transfers.
We provide information in this report that aids inidentifying study site benefit measures from the litera-ture.3 An annotated bibliography of outdoor recre-ation use valuation studies is provided as appendix A,with additional information on some studies in appen-dix B. The bibliography includes studies conductedfrom 1967 through 1998 in the United States andCanada. There are 163 studies and 760 benefit mea-sures identified (there is a total of 786 benefit measuresprovided, however, 26 of these are for wilderness recre-ation, some of which are a subset of other variousactivities). The bibliography includes information on:
1. reference to each study,
2. identification of the recreation activity investigated,
3. geographic location of the study (Forest Serviceregion and RPA region),
4. original benefit measure(s) reported (adjusted toactivity day units),
5. time adjusted benefit measure (to fourth-quarter1996 dollars), and
6. valuation methodology used to measure benefits.
Figure 3. Steps to performing a single point estimate transfer.
3Another database that contains recreation use values inaddition to other values for the environment is the Environ-mental Valuation Reference Inventory™ (EVRI™). This is asubscription database and can be found at http://www.evri.ec.gc.ca/evri/.
SINGLE POINT ESTIMATE TRANSFER
1. Identify the resources affected by a proposed action.2. Translate resource impacts to changes in recreational use.3. Measure recreation use changes.4. Search the literature for relevant study sites.5. Assess relevance and applicability of study site data.6. Select a benefit measure from a single relevant study or a range of benefit measures if
more than one study is relevant.7. Multiply benefit measure by total change in recreation use.

10 USDA Forest Service Gen. Tech. Rep. RMRS-GTR-72. 2001
Rosenberger and Loomis Benefit Transfer of Outdoor Recreation Use Values
Appendix C provides reference codes by recreationactivity to the annotated bibliography (appendix A)for ease in locating potentially relevant studies.
It is important to note that all unit benefit measuresprovided in this report are in consumer surplus peractivity day per person. Therefore, when translatingresource impacts into recreation use changes, theseimpacts should be expressed in a comparable index aschanges measured in activity days or convert the activ-ity day measures into the relevant units.
The simplicity with which the steps to performing asingle point estimate transfer are presented may bemisleading. The steps involved in finding a valid andreliable benefit measure can be complex if taken totheir theoretical extreme. This should become appar-ent when the information on the conditions for andlimitations to benefit transfers are taken into accountas previously identified. See Boyle and Bergstrom(1992) for an example of critically filtering existingresearch for applicability to a policy site context. Intheir example, they located five studies that measuredthe benefit of white water rafting. They then filteredthe studies by three idealized technical considerations:
(1) the nonmarket commodity of the sitemust be identical to the nonmarket commod-ity to be valued at the policy site; (2) thepopulations affected by the nonmarket com-modity at the study site and the policy sitehave identical characteristics; and (3) theassignment of property rights at both sitesmust lead to the same theoretically appropri-ate welfare measure (e.g., willingness to payversus willingness to accept compensation)(p. 659).
Their filtering of each study based on these consider-ations left them with no ideal benefit measures totransfer to their policy site. They state that this is likelyto be the case for many transfer scenarios in which “asmall number of potential study sites are available andthe value(s) estimate at these study sites may not beapplicable to the issue at the policy site” (p. 660).Therefore, when performing critical single point esti-mate benefit transfers, the original reporting of thestudy results must be obtained in order to determineits applicability to the evaluation issue at hand.
Another potentially critical aspect of benefit trans-fer is the defensibility of transferred values. Defensi-bility can be defined on two feasibility dimensions—technical and political. Technical feasibility is inverselyrelated to the degree of technical and theoretical con-sistency between the study site context and the policysite context. Political feasibility is highly context- andscale-dependent, accounting for an array of social and
cultural factors. The context surrounding each benefittransfer can be unique, meaning there is no single setof protocols that can be objectively followed. Benefittransfer is as much an art as it is a science. However,quite often information can be transferred with vary-ing levels of confidence. A confidence interval fortransferred point estimates can be calculated if theoriginal study reports the standard error of the esti-mate. This confidence interval provides the statisticalrange in which we would expect the estimate to besome large percentage of the time (e.g., a 95% confi-dence interval means the estimate would be within thecalculated range 95% of the time).
Example application: Background. The example thatwe will follow throughout the remainder of this reportis hypothetical. We will be using this example toillustrate some of the issues when performing benefittransfers using the various approaches as they arediscussed. Since this report is not intended to be a shortcourse in nonmarket valuation, judgments concerningthe validity, applicability, and quality of the valuationmethodology used in each of the empirical studies areleft to the benefit transfer practitioner.
The example application we will use to illustrateeach of the transfer methods is to provide a per personactivity day use value estimate for mountain bikingin the Allegheny National Forest in north centralPennsylvania. The estimate can be used to either valuecurrent use on an existing trail or to value predicteduse for a proposed trail. The total value of mountainbiking in the forest can then enter into a resourceallocation decision, assessment of a proposed forestplan, or accounting of the value of forest outputs. Wewill assume that this use of the national forest isimportant, but due to budgetary restrictions primaryresearch is precluded. Therefore, we will attempt touse benefit transfer to provide a credible measure ofthe net benefits of an activity day of mountain bikingin the forest. All measures will be reported in fourth-quarter 1996 dollars. Inflationary indexing such as theimplicit price deflator can be used to adjust benefitmeasures to current dollars.
Example of a single point estimate transfer. Weassume that the information requirements for steps 1through 3 of figure 3 have been fulfilled. We willtherefore begin with step 4, which is “search the litera-ture for relevant study sites.” Using appendix C, tableC9, we find three biking studies referenced. Based oncross-referencing with the annotated bibliography,these three studies are Bergstrom and Cordell (1991),Fix and Loomis (1998), and Siderelis and Moore (1995).
Bergstrom and Cordell (1991) provide national zonaltravel cost models for several recreation activities.

11USDA Forest Service Gen. Tech. Rep. RMRS-GTR-72. 2001
Rosenberger and LoomisBenefit Transfer of Outdoor Recreation Use Values
Their models were primarily developed using PARVS(Public Area Recreation Visitors Study) data. Theauthors identify several limitations of their modelsbased on assumptions they have made in developingthese models from the data. In particular, they haveprovided a benefit measure for biking. However, bik-ing within the context of their study is a conglomerateof touring, leisure riding, and mountain biking,among others. Therefore, the benefit measure theyprovide is not specific to mountain biking, but tobicycling in general.
Siderelis and Moore (1995) investigate the net ben-efits of bicycling and walking on abandoned railroadbeds that have been recycled to a rail-trail for recre-ation and transportation purposes. Their investigationused an onsite interview with followup mail question-naire. Their research sites included the Heritage Trailthat traverses a rural area in Iowa, the St. MarksHistoric Railroad Trail that traverses a rural area withsmall towns in Florida, and the Lafayette/MoragaTrail that traverses a dense urban to suburban area inCalifornia. Bicycling on these trails was the dominantuse of the trail for the Iowa and Florida trails, whilewalking was the dominant use of the California trail.Therefore, the reported values for the first two trailsare primarily measures of biking value. Biking in thisstudy was for leisure and transportation, not specifi-cally mountain biking.
Fix and Loomis (1998) provide us with two estimatesspecifically for mountain biking. They use the indi-vidual travel cost and the contingent valuation meth-ods to provide benefit estimates for mountain biking atthe famed Slickrock Trail in Moab, Utah. Their datawas collected using onsite surveys.
Each of the above studies should be assessed forrelevance and applicability to the policy site issue.Several factors that can be assessed have been listedpreviously. For instance, the Bergstrom and Cordell(1991) study provides a general benefit measure for ageneric bicycling day anywhere in the nation. Siderelisand Moore (1995) provide benefit measures for bicy-cling rail-trails for a specific region of the UnitedStates. And Fix and Loomis (1998) provide benefit
measures for mountain biking, but in a high-profile,world-class site in Moab, Utah. Each study has positiveand negative context-dependent aspects affecting theirperceived relevance and applicability. However, forthis example, we will assume each study is relevant,providing us with credible benefit measures.
Therefore, according to the annotated bibliography(appendix A), the three studies provide five estimateswe could use for benefit transfer (table 2). We mayconclude that the benefit of mountain biking on theproposed trail ranges from $18 to $63 per activityday. We do not know where in this range, if at all, theactual benefit of the proposed trail would be withoutconducting primary research. However, we may beable to use expert judgment concerning where in thisrange we believe a defensible measure would be giventhe context of the policy site and proposed action. Forexample, the Allegheny National Forest site is prob-ably closer in composition to the Iowa trail than to thesandstone Slickrock Trail in Moab. Thus, the bestsingle point estimate would be in the $34 range. Whetherit would be slightly more or less than this estimatedepends on the similarity of characteristics of the trailin the Allegheny National Forest and the confidenceinterval surrounding this estimate (which is not re-corded in the study report, but may be available fromthe authors).
Average value transfer
An average value transfer is based on using a mea-sure of central tendency of all or subsets of relevantand applicable studies as the transfer measure for apolicy site issue. The primary steps to performing anaverage value transfer include identifying and quanti-fying the management- or policy-induced changes onrecreation use, and locating and transferring a “unit”average consumer surplus measure. The text box(figure 4) provides a more detailed list of the stepsinvolved in average value transfers.
It is a common practice for federal public land agen-cies to use administratively approved average valuesin assessing management and policy actions. The USDA
Table 2. Single point estimates from the literature for the hypothetical mountain bikingtransfer.
Measure 95% Confidence Interval Source
$17.61 Not available Bergstrom and Cordell$34.11 Not available Siderelis and Moore (Iowa trail)$56.27 Not available Siderelis and Moore (Florida trail)$54.90 $33–$161 Fix and Loomis (Travel cost method)$62.88 $54–$77 Fix and Loomis (Contingent valuation method)

12 USDA Forest Service Gen. Tech. Rep. RMRS-GTR-72. 2001
Rosenberger and Loomis Benefit Transfer of Outdoor Recreation Use Values
Forest Service has used RPA (Resources Planning Act)values since 1980 (USDA Forest Service 1989)4. TheseRPA values have been provided for groups of activi-ties and Forest Service regions of the country. Along asimilar vein, the U.S. Bureau of Reclamation and theU.S. Army Corps of Engineers have relied upon theU.S. Water Resources Council’s “unit day values” fordecades (U.S. Water Resources Council 1973, 1979,1983). While some of the unit day values may not havebeen based directly on the emerging literature onoutdoor recreation use values and measures, theyhave all been influenced to a certain degree by thisliterature. Past RPA average values were provided foreach USDA Forest Service Region. However, this seg-regation results in two problems: (1) very small samplesizes per activity/region cell, and (2) numerous activ-ity/region cells with no average value (because of thelack of primary research). To address both of theseproblems, the Forest Service regions are aggregatedinto RPA assessment regions with the Pacific CoastArea and Alaska being separately reported.
Table 3 provides measures of central tendency (mean,median, and 95% confidence intervals) of consumersurplus per activity day per person for 21 primaryrecreation activities, plus values for wilderness recre-ation, as defined by the USDA Forest Service (1989).These activity day values are provided for variousregions of the United States and Canada. We reportboth mean and median values for all regional esti-mates, and confidence intervals for recreation activ-ity estimates based on all activity-specific data. Under
conditions of a normal distribution, mean and medianestimates will be equal. Large divergences betweenthese two measures indicate that the distribution of theestimates is skewed. That is, the average value isaffected by large or small estimates. The effect of“outlier” estimates can be large when the total numberof estimates is small. In addition, it is evident thatmargin of error is related to sample size.
In addition to the average values provided in table 3,subset average values can be calculated. For example,upon reviewing the literature behind the average val-ues in table 3 the benefit transfer practitioner maydetermine that one or more of the inclusive studies isnot applicable or may be influenced by atypicallylarge values. The practitioner can then recalculate anaverage value based on the individual estimates thatare judged applicable or use a rigorous statisticaltest to identify potential outlier values (Barnett andLewis 1994).
Example of an average value transfer. To continuewith our example transfer for mountain biking ben-efits of a trail in Allegheny National Forest, let usassume that none of the point estimates previouslygathered match perfectly. Instead, maybe a benefitmeasure that is based on all three studies would bepreferable. Using table 3, we search the northeast foran average value for biking. The average value is$34.11; however, it is based on a single estimate—theSiderelis and Moore (1995) estimate for Iowa. A mea-sure that is based on all three studies would be the totalU.S. studies column of table 3. The average of all fivestudies is $45.15. Alternatively, an average of the mostclosely matching studies ($34.11 for Iowa, $56.27 forFlorida, and $17.61 for the nation) would be $36.00.Professional judgment determines which average valueis most appropriate for the Allegheny National Forestsite.
Figure 4. Steps to performing an average value transfer.
4The Resources Planning Act office of the USDA ForestService is now the Strategic Planning and Resource Assess-ment office. However, reference to published value esti-mates and objectives of this group will be located under RPA.We will use RPA when referring to its history.
AVERAGE VALUE TRANSFER
1. Identify the resources affected by a proposed action.2. Translate resource impacts to changes in recreational use.3. Measure recreation use changes.4. Search the literature for relevant study sites.5. Assess relevance and applicability of study site data.6. Use average value provided in table 3 for that region or use an average of a subset of
study measures.7. Multiply benefit measure by total change in recreation use.

13USDA Forest Service Gen. Tech. Rep. RMRS-GTR-72. 2001
Rosenberger and LoomisBenefit Transfer of Outdoor Recreation Use Values
Tab
le 3
. Rec
reat
ion
activ
ity d
ay v
alue
s pe
r pe
rson
by
vario
us g
eogr
aphi
c lo
catio
ns.
No
rth
east
Are
a st
ud
iesa
So
uth
east
Are
a st
ud
iesa
Inte
rmo
un
tain
Are
a st
ud
iesa
Pac
ific
Co
ast
Are
a st
ud
iesa
Ala
skan
stu
die
sa
RP
A1
RP
A2
RP
A3
RP
A4
RP
A5
Act
ivit
yn
Mea
nM
edia
nn
Mea
nM
edia
nn
Mea
nM
edia
nn
Mea
nM
edia
nn
Mea
nM
edia
n
Cam
ping
7$2
4.34
$6.5
010
$21.
90$5
.14
18$2
5.87
$24.
094
$86.
96$7
7.27
Pic
nick
ing
247
.04
42.1
12
30.5
230
.52
422
.95
24.0
93
53.5
228
.95
Sw
imm
ing
316
.37
3.52
322
.87
16.7
51
24.6
224
.62
422
.74
18.4
1S
ight
seei
ng2
101.
1910
1.19
560
.85
67.1
010
13.2
212
.23
150
.64
50.6
41
$13.
20$1
3.20
Off-
road
div
ing
14.
374.
371
11.7
611
.76
133
.64
33.6
4M
otor
boa
ting
166
.75
66.7
52
8.40
8.40
647
.93
29.3
14
21.6
911
.48
Flo
at b
oatin
g4
52.9
939
.85
345
.86
26.9
310
77.6
840
.36
115
.13
15.1
3H
ikin
g3
62.6
570
.54
561
.47
17.3
95
31.8
529
.66
1426
.71
22.8
71
12.9
312
.93
Bik
ing
134
.11
34.1
11
56.2
756
.27
258
.89
58.8
9D
ownh
ill s
kiin
g3
33.0
233
.93
120
.90
20.9
0C
ross
coun
try
skiin
g3
28.8
328
.83
724
.90
22.7
91
40.3
240
.32
Sno
wm
obili
ng2
69.9
769
.97
Big
gam
e hu
ntin
g54
45.4
639
.00
2935
.89
32.2
372
43.5
636
.40
1240
.76
29.4
25
52.4
048
.47
Sm
all g
ame
hunt
ing
336
.73
30.4
613
25.7
527
.71
127
.37
27.3
7W
ater
fow
l hun
ting
2332
.09
18.2
111
17.7
015
.41
1937
.18
18.2
15
33.1
930
.82
160
.08
60.0
8F
ishi
ngb
4331
.16
15.4
113
27.7
418
.21
4240
.82
21.6
815
36.9
722
.41
139
.22
39.2
2W
ildlif
e vi
ewin
g56
26.0
625
.61
3929
.13
27.8
039
36.1
032
.22
1529
.74
31.6
57
42.1
252
.92
Hor
seba
ck r
idin
gR
ock
clim
bing
185
.74
85.7
43
42.0
445
.34
Gen
eral
rec
reat
ionc
514
.06
7.47
719
.66
7.25
1142
.09
14.0
42
22.2
722
.27
38.
9210
.03
Oth
er r
ecre
atio
nd4
25.0
623
.91
1046
.96
35.2
31
62.0
662
.06
Wild
erne
ss r
ecre
atio
n4
19.6
420
.20
381
.95
17.3
98
49.2
429
.30
1331
.29
22.5
31
12.9
812
.98
Tot
al #
cas
es (
N)e
211
135
277
8420
a For
est S
ervi
ce R
egio
ns p
er a
rea
are:
Nor
thea
st A
rea
= R
9; S
outh
east
Are
a =
R8;
Inte
rmou
ntai
n A
rea
= R
1, R
2, R
3, R
4; P
acifi
c C
oast
Are
a =
R5,
R6;
and
Ala
skan
Are
a =
R10
.b F
ishi
ng v
alue
s in
clud
e di
ffere
nt s
peci
es, d
iffer
ent b
odie
s of
wat
er, a
nd d
iffer
ent a
nglin
g te
chni
ques
. The
maj
ority
of t
he fi
shin
g be
nefit
mea
sure
s ar
e fr
om s
tudi
es c
ondu
cted
bet
wee
n 19
79an
d 19
88. F
ishi
ng w
as n
ot a
prim
ary
targ
et o
f the
lite
ratu
re r
evie
w s
ince
it is
the
focu
s of
a d
iffer
ent p
roje
ct. U
pdat
ed fi
shin
g va
lues
will
be
prov
ided
at t
he c
ompl
etio
n of
the
othe
r pr
ojec
t.c G
ener
al r
ecre
atio
n is
def
ined
as
a co
mpo
site
of r
ecre
atio
n op
port
uniti
es a
t a s
ite w
ith m
easu
re fo
r si
te, n
ot a
spe
cific
act
ivity
.d O
ther
rec
reat
ion
is d
efin
ed a
s si
tes
with
rec
reat
ion
oppo
rtun
ities
that
are
und
efin
ed o
r ob
scur
e, s
uch
as c
liff d
ivin
g an
d m
ount
ain
runn
ing.
e Tot
al n
umbe
r of
cas
es e
xclu
des
Wild
erne
ss r
ecre
atio
n as
som
e of
thes
e es
timat
es a
re a
sub
set o
f oth
er v
ario
us r
ecre
atio
n ac
tiviti
es (
see
bibl
iogr
aphy
for
iden
tific
atio
n of
sou
rces
).f M
argi
n of
err
or is
cal
cula
ted
at th
e 95
% c
onfid
ence
lim
it ba
sed
on s
tand
ard
erro
r of m
ean
estim
ates
(tab
le 1
). C
onfid
ence
rang
e ill
ustr
ates
mag
nitu
de o
f the
rang
e ba
sed
on th
e da
ta in
whi
cha
mea
n es
timat
e w
ould
lie
with
95%
con
fiden
ce.

14 USDA Forest Service Gen. Tech. Rep. RMRS-GTR-72. 2001
Rosenberger and Loomis Benefit Transfer of Outdoor Recreation Use Values
Average value estimates, however, are no betterthan the data they are based on. All of the issues thatcould be raised concerning the credibility of any singlemeasure are also relevant for an average value based inpart on that measure.
Benefit Function Transfers
Benefit function transfers entail the use of a modelthat statistically relates benefit measures with studyfactors such as characteristics of the user populationand the resource being evaluated. Benefit functiontransfers usually come from two sources. First, a ben-efit function or demand function has been estimatedand reported for a recreation activity in a geographiclocation through primary research. Second, meta re-gression analysis functions can be estimated fromseveral independent primary research projects. In ei-ther case, the transfer process entails adapting thefunction to the characteristics and conditions of thepolicy site, forecasting a tailored benefit measurebased on this adaptation of the function, and use of theforecast measure for evaluating the policy site.
Demand function transfer
The transfer of an entire demand function is concep-tually sounder than value transfers. This is because thebenefit estimates and use rates in recreation are acomplex function of site characteristics, user charac-teristics, and different spatial and temporal dimen-sions of recreation site quality and site choice. Whentransferring a point estimate from a study site to apolicy site, it is assumed or is implied that the two sitesare identical across the various factors that determinethe level of benefits derived in recreational use of the
two sites. In the case of an average value transfer, it isassumed that the benefits of the policy site are aroundthe mid-level of benefits measured for the study sitesincorporated into the average value calculation. How-ever, based on different validity and reliability assess-ments of point estimate and average value transfers,this is not always the case. The invariance surroundingthe transfer of benefit measures alone makes thesetransfers insensitive or less robust to significant differ-ences between the study site(s) and the policy site.Therefore, the main advantage of transferring an en-tire demand function to a policy site is the increasedprecision of tailoring a benefit measure to fit the char-acteristics of the policy site. It is in the adaptation stageof forecasting a benefit measure from a study sitedemand function that the additional value of the trans-fer method is realized (figure 5).
Disadvantages of the method are primarily due todata collection and model specification in the origi-nal research effort. Factors in the demand functionmay be relevant to the study site but not to the policysite. Also, factors that are important to demand atthe policy site may not have been collected at thestudy site or were not significant in determiningdemand at the study site. These factors can havedistinct effects on the tailored benefit measures at apolicy site. This is evident in validity tests of benefitfunction transfers in which error in the tailoredvalue ranged from as low as a few percentage pointsto as high as 800% (Loomis and others 1995; Down-ing and Ozuna 1996; Kirchhoff and others 1997). Incomparative validity tests, demand function trans-fers were found to outperform (lower error) pointestimate transfers. Therefore, demand functiontransfers may be an improvement over point esti-mate transfers but are still a second-best strategy torecreation valuation.
Figure 5. Steps to performing a demand function transfer.
DEMAND AND BENEFIT FUNCTION TRANSFER
1. Identify the resources affected by a proposed action.2. Translate resource impacts to changes in recreational use.3. Measure recreation use changes.4. Search the literature for relevant study sites.5. Assess relevance and applicability of study site data and whether demand or benefit
function is specified.6. Adapt demand or benefit function to policy site characteristics and forecast benefit
measure.7. Multiply tailored benefit measure by total change in recreation use.

15USDA Forest Service Gen. Tech. Rep. RMRS-GTR-72. 2001
Rosenberger and LoomisBenefit Transfer of Outdoor Recreation Use Values
We have not identified those studies in the literaturereview that reported demand or benefit equations(functions). The applicability of demand functions topolicy site transfers requires an intimate knowledge ofthe policy site. In addition, the specification of indi-vidual demand functions can have significant effectson the reliability of their use under varying circum-stances. If a demand function transfer is sought, thenthe transfer practitioner will have to use insight andexpert judgment concerning the applicability ofpotentially transferable demand functions, the detailsof which are well beyond the scope of this report. Goodillustrative examples of benefit function transfers areprovided by Loomis and others (1995), Downing andOzuna (1996), and Kirchhoff and others (1997).
Example of a demand function transfer. The adapta-tion of a demand function from a study site to a policysite can be complex and lead to a large error. This errorcan be influenced by dissimilarities between site anduser population characteristics of the study site andpolicy site. Critical demand/benefit function transferrequires strong knowledge of economic methodologyand estimation of consumer surplus. Therefore, it ishighly recommended that when attempting to per-form a demand function transfer you either have therequisite knowledge or solicit the aid of someonewho does.
A demand function relates the number of occasionsof an activity (typically as trips or days) to the pricepaid (travel costs including direct variable costs andtravel time costs) (TC), characteristics of a site (SC),socioeconomic characteristics of the user population(SEC), and substitute site information (SubTC). Thisdemand function would look something like:
# of Occasions = β0 + β1*TC + β2*SubTC+ βk*SC + βm*SEC. (2)
The adaptation entails substituting equivalently mea-sured information relevant to the policy site for thevariables in the demand function. This adaptationthen forecasts the lefthand side of the demand equa-tion or number of occasions. Based on this adapteddemand function, consumer surplus per day can becalculated. In some cases, this estimation of consumersurplus and conversion to per activity day is difficult.
For direct methods to estimating consumer surplusvia stated preference, a bid or willingness to payfunction is typically defined. The bid function relatesconsumer surplus or willingness to pay to quantityand/or quality of the activity or environmental re-source (Q), characteristics of a site (SC), and socioeco-nomic characteristics of the user population (SEC).This function would look something like:
WTP = b0 + b1*Q + bk*SC + bm*SEC. (3)
Returning to our mountain biking example, wehave several demand functions that could be trans-ferred to our policy site. It can be argued that Siderelisand Moore’s (1995) Iowa trail demand function is thebest for our purposes. This is because the Fix andLoomis (1998) mountain biking study, although activ-ity-specific, has noncomparable site characteristicsbetween their site and our policy site. Siderelis andMoore’s (1995) Florida trail model is neither activity-specific nor of comparable site characteristics. AndBergstrom and Cordell’s (1991) national model forbiking is not activity specific or site specific. Therefore,Siderelis and Moore’s (1995) Iowa model is the closestto matching the issue for our hypothetical policy site—dirt-trail biking.
Siderelis and Moore (1995) estimate an individualtravel cost model of the form:
lnTrips = 3.62 + 1.511 – 0.033TC + 0.70W – 0.16A1 (4)
where the dependent variable (lnTrips) is the naturallogarithm of the number of trips, TC is the virtual priceor travel costs (including direct variable costs of traveland wage rate value of travel time), W is whether theindividual was using the Iowa trail for walking (versusbicycling), and A1 is the percentage of a group who is26 years of age or less.5 Average consumer surplus pertrip is the area below the demand function and abovethe average price line (figure 2). For a semi-log func-tion form, an approximation of average per trip con-sumer surplus is –(1/βTC), where βTC is the travel costparameter (Adamowicz and others 1989). Thus, aver-age consumer surplus per trip is $34.25 (adjusted to1996 dollars).6 We are not provided with informationnecessary to calculate a 95% confidence interval forthis measure.
5Siderelis and Moore (1995) estimate six different modelsfor the Iowa trail. They use this model to estimate consumersurplus per trip, which is subsequently the estimate recordedthroughout this document and the database. Therefore, wewill restrict our transfer exercise to this model.
The model estimated is a count data model using anegative binomial regression technique. Count data modelsare suggested for trip data in which the dependent variableis reported in integers (no partial trips) and restricted to benonnegative (no negative trips). Negative binomial specifica-tions automatically take the natural log of the dependentvariable. For more information on count data travel costmodels, see the discussion by Siderelis and Moore (1995) orCreel and Loomis (1990).
6The difference between this estimate and Siderelis andMoore’s (1995) estimate of $34.11 (in comparable dollars) isthat the authors of the original research used Simpson’s rulefor approximating integrals for calculating consumer surplus.

16 USDA Forest Service Gen. Tech. Rep. RMRS-GTR-72. 2001
Rosenberger and Loomis Benefit Transfer of Outdoor Recreation Use Values
One of the disadvantages to transferring a demandfunction of the semi-log functional form is that con-sumer surplus is invariant in (or exogenous to) thedemand model. That is, changes in the levels of theexplanatory variables in the model are captured inthe predicted use levels, but not in the estimate ofaverage consumer surplus per trip. Adamowicz andothers (1989) identify demand specifications in whichquantity and price measures endogenously deter-mine consumer surplus measures. Applying a ben-efit function with endogenously determined con-sumer surplus is similar to the application of the metaanalysis benefit function discussed in the next sec-tion. However, one use of the Iowa trail model wouldbe to predict the market area and use levels for thePennsylvania trail.
Meta regression analysis benefit functiontransfer
Meta regression analysis is the statistical summariz-ing of relationships between benefit measures andquantifiable characteristics of studies. The data for ameta analysis is typically summary statistics fromstudy site reports and includes quantified characteris-tics of the user population, study site’s environmentalresources, and valuation methodology used. Codingof the studies included in the literature review (aspreviously described) lends itself directly to the esti-mation of a meta analysis benefit function. However,interpretation of original study results can be a sourceof error in meta analysis databases.
Advantages and disadvantages
Meta analysis has been traditionally concerned withunderstanding the influence of methodological andstudy-specific factors on research outcomes and pro-viding summaries and syntheses of past research. Amore recent use of meta analysis is the systematicutilization of the existing value estimates from theliterature for the purpose of benefit transfer. Essen-tially, meta analysis regression models can be used toforecast benefits at policy sites. Meta analysis hasseveral conceptual advantages over other benefit trans-fer methods such as point estimate and demand func-tion transfers:
• Meta analysis utilizes information from a greaternumber of studies, thus providing more rigor-ous measures of central tendency that are sensi-tive to the underlying distribution of the studysite measures.
• Methodological differences can be controlledwhen calculating a value from the meta analysisfunction.
• By setting the independent variables (adaptingthe function) at levels specific to the policy site, thetransfer practitioner is potentially accounting fordifferences between the study sites and the policysite.
• Multi-activity, multi-site meta analyses can pro-vide estimates for regions in which no studieswere conducted for an activity. That is, metaanalysis can forecast estimates for new or unstud-ied sites.
Many of the same limitations to performing benefittransfers in general are applicable to meta analysis(Desvousges and others 1998):
• There should be enough original studies con-ducted so that statistical inferences can be madeand relationships modeled.
• A meta analysis can only be as good as the qualityof past research efforts. This quality includes thescientific soundness of the original research andthe reporting of results and summary statistics onoriginal data samples that are rich in detail.
• The studies should be similar enough in contentand context that they can be combined and statis-tically analyzed.
Similar to demand function transfers, the main ad-vantage of forecasting measures for a policy site via ameta analysis benefit function is the increased sensi-tivity of the tailored benefit measure to characteristicsof the policy site. It is in the adaptation stage of fore-casting a benefit measure from meta analysis benefitfunction that the additional value of the transfer methodis realized (figure 6). An additional advantage of themeta analysis approach over a demand function ap-proach is its ability to discern the effect of differentfactors on the level of benefit estimates provided in theliterature.
An outdoor recreation meta analysis benefitfunction
As stated previously, a master coding sheet wasdeveloped that contains 126 fields. The main codingcategories include study reference, benefit measure(s),methodology used, recreation activity investigated,recreation site characteristics, and user populationcharacteristics. Table 4 lists and defines the variables

17USDA Forest Service Gen. Tech. Rep. RMRS-GTR-72. 2001
Rosenberger and LoomisBenefit Transfer of Outdoor Recreation Use Values
Figure 6. Steps to performing a meta regression analysis function transfer.
Table 4. Description of variables tested in the meta analysis.
Variable Description
Dependent variableCS Consumer surplus (CS) per person per activity day (1996 dollars)
Method variablesMETHOD Qualitative variable: 1 if stated preference (SP) valuation approach used; 0 if revealed preference
(RP) approach usedDCCVM Qualitative variable: 1 if SP and dichotomous choice elicitation technique was used; 0 if otherwiseOE Qualitative variable: 1 if SP and open-ended elicitation technique was used; 0 if otherwiseITBID Qualitative variable: 1 if SP and iterative bidding elicitation technique was used; 0 if otherwisePAYCARD Qualitative variable: 1 if SP and payment card elicitation technique was used; 0 if otherwiseCONJOINT Qualitative variable: 1 if SP and conjoint analysis technique was used; 0 if otherwiseSPRP Qualitative variable: 1 if SP and RP used in combination; 0 if otherwiseZONAL Qualitative variable: 1 if RP and a zonal travel cost model was used; 0 if otherwiseINDIVID Qualitative variable: 1 if RP and an individual travel cost model was used; 0 if otherwiseRUM Qualitative variable: 1 if RP and a random utility model was used; 0 if otherwiseHEDONIC Qualitative variable: 1 if RP and a hedonic travel cost model was used; 0 if otherwise (omitted
category for METHOD) [0.024, 0.15]a
TTIME Qualitative variable: 1 if RP model included travel time; 0 if otherwiseSUBS Qualitative variable: 1 if RP model included substitute sites; 0 if otherwiseONSITE Qualitative variable: 1 if sample frame was on-site; 0 if otherwiseMAIL Qualitative variable: 1 if primary data collection used mail survey type; 0 if otherwisePHONE Qualitative variable: 1 if primary data collection used phone survey type; 0 if otherwiseINPERSON Qualitative variable: 1 if primary data collection used in-person survey type; 0 if otherwiseSECOND Qualitative variable: 1 if secondary data was used (omitted category for data collection) [0.063,
0.24]a
LINLIN Qualitative variable: 1 if functional form was linear on both dependent (d.v.) and independentvariables (i.v.); 0 if otherwise
LOGLIN Qualitative variable: 1 if functional form was log d.v. and linear i.v.; 0 if otherwiseLOGLOG Qualitative variable: 1 if functional form was log on both d.v. and i.v.; 0 if otherwiseLINLOG Qualitative variable: 1 if functional form was linear on d.v. and log on i.v.; 0 if otherwise (omitted
category for functional form) [0.003, 0.05]a
VALUNIT Qualitative variable: 1 if CS was originally estimated as per day; 0 if otherwise (e.g., trip, season, oryear)
TREND Qualitative variable: year when data was collected, coded as 1967 = 1, 1968 = 2,…, 1996 = 30(cont.’d)
META ANALYSIS FUNCTION TRANSFER
1. Identify the resources affected by a proposed action.2. Translate resource impacts to changes in recreational use.3. Measure recreation use changes.4. Adapt meta regression analysis benefit function (table 5) to policy site characteristics
and forecast benefit measure or select appropriate forecast measure from metaforecasted measures (table 6).
5. Multiply tailored benefit measure by total change in recreation use.

18 USDA Forest Service Gen. Tech. Rep. RMRS-GTR-72. 2001
Rosenberger and Loomis Benefit Transfer of Outdoor Recreation Use Values
tested in developing a meta regression analysis benefittransfer function. The majority of the variables arequalitative dummy variables coded as 0 or 1, where 0means the study does not have a characteristic and 1means that it does. For example, if a study was con-ducted on a lake in New York, then R9 and LAKEwould be coded as 1 while all other FS regions, FOR-EST, and RIVER would be coded as 0. The variables aregrouped in table 4 according to whether they aremethodological, site, or activity specific variables.
The user population characteristics were rarely re-ported with the results of a study. Other means forobtaining data on user population characteristics, suchas contacting the researchers of the study, were notfeasible given the financial and time constraints of theproject. We did attempt to proxy user populationcharacteristics by using 1990 U.S. Census average val-ues for income, gender, education, age, and race, forthe state in which the study was conducted, but foundin preliminary analysis that these proxies were broadly
Site variablesRECQUAL Qualitative variable: site quality variable coded as 1 if the author stated site was of high quality or
the site was either a National Park, National Recreation Area, or Wilderness Area; 0 if otherwiseFSADMIN Qualitative variable: 1 if the study site(s) were National Forests (i.e., administered by the U.S.
Forest Service [FS]); 0 if otherwiseR1 Qualitative variable: 1 if study sites were in FS Region 1 (Montana, No. Idaho); 0 if otherwiseR2 Qualitative variable: 1 if study sites were in FS Region 2 (Wyoming, Colorado); 0 if otherwiseR3 Qualitative variable: 1 if study sites were in FS Region 3 (Arizona, New Mexico); 0 if otherwiseR4 Qualitative variable: 1 if study sites were in FS Region 4 (Nevada, Utah, So. Idaho); 0 if
otherwiseR5 Qualitative variable: 1 if study sites were in FS Region 5 (California); 0 if otherwiseR6 Qualitative variable: 1 if study sites were in FS Region 6 (Oregon, Washington); 0 if otherwiseR8 Qualitative variable: 1 if study sites were in FS Region 8 (Southern United States east of Rocky
Mountains); 0 if otherwiseR9 Qualitative variable: 1 if study sites were in FS Region 9 (Northern United States east of Rocky
Mountains); 0 if otherwiseR10 Qualitative variable: 1 if study sites were in FS Region 10 (Alaska); 0 if otherwiseNATL Qualitative variable: 1 if study sites were the entire United States; 0 if otherwiseCANADA Qualitative variable: 1 if study sites were in Canada; 0 if otherwise (omitted category for
geographic location of study site) [0.015, 0.12]a
LAKE Qualitative variable: 1 if the recreation site was a lake; 0 if otherwiseRIVER Qualitative variable: 1 if the recreation site was a river; 0 if otherwiseFOREST Qualitative variable: 1 if the recreation site was a forest; 0 if otherwiseOCEAN Qualitative variable: 1 if the recreation site was an estuary or bay of an ocean; 0 if otherwise
(omitted category for site type) [0.169, 0.37]a
PUBLIC Qualitative variable; 1 if ownership of the recreation site was public; 0 if otherwise.DEVELOP Qualitative variable: 1 if the recreation site had developed facilities, such as picnic tables,
campgrounds, restrooms, boat ramps, ski lifts, etc.; 0 if otherwise.NUMACT Quantitative variable: the number of different recreation activities the site offers.
Recreation activityvariables
CAMP . . . Qualitative variables: 1 if the relevant recreation activity was studied; 0 if otherwise. WhereOTHERREC CAMP is camping, PICNIC is picnicking, SWIM is swimming, SISEE is sightseeing, OFFRD is
off-road driving, NOMTRBT is float boating, MTRBOAT is motor boating, HIKE is hikingbackpacking, BIKE is biking, DHSKI is downhill skiing, XSKI is cross-country skiing,SNOWMOB is snowmobiling, BGHUNT is big game hunting, SMHUNT is small game hunting,WATFOWL is waterfowl hunting, FISH is fishing, WLVIEW is wildlife viewing, HORSE ishorseback riding, ROCKCL is rock climbing, GENREC is general recreation (defined as acomposite of recreation activity opportunities at a site), and OTHERREC is other recreation (forsites with recreation opportunities undefined or obscure—omitted category for recreationactivity) [0.015, 0.12]a
aMean and standard deviation for omitted categories reported in square brackets; N = 701.
Table 4 (Cont.’d)
Variable Description

19USDA Forest Service Gen. Tech. Rep. RMRS-GTR-72. 2001
Rosenberger and LoomisBenefit Transfer of Outdoor Recreation Use Values
insensitive to differences in benefit measures pro-vided. Using U.S. Census average values at the countylevel and for the period in which the original studydata was collected may be a viable alternative forfuture investigations. However, the lack of user popu-lation characteristics will be an additional limitationon the validity and reliability of the meta analysisfunction.
The meta analysis model is of the basic form:
yi = α + β’xi + εi , (5)
where i indexes each observation, y is the dependentvariable (consumer surplus per person per activityday adjusted to 1996 dollars), α and β are parametersto be estimated and are respectively the intercept andslope coefficients for the model, x is a matrix of ex-planatory variables including methodology, site, andactivity characteristics, and e is the classical error termwith mean zero and variance σ2
ε.Some of the studies are not included in the meta
analysis because of the lack of reporting of key infor-mation that would enable their full coding. Therefore,the meta analysis database consists of 701 estimatesfrom 131 separate studies. The number of estimatesper study ranged from 1 to 134. As identified in previ-ous meta-analyses, the panel nature of the data canlead to econometric problems. If there is correlationamong these multiple observations for each study,then a classical ordinary least-squares regression willbe inefficient and inconsistent in estimated param-eters. We tested for panel effects using various forms ofstratifying the data (including the most obvious strati-fication by study) (Rosenberger and Loomis 2000).However, panel effects were not discernible with thesetests. Therefore, we use classical ordinary least-squareswith the robust Newey-West version of White’s con-sistent covariance estimator to estimate the model(Smith and Kaoru 1990; Driscoll and Kraay 1998).
There is no precedent for choice of functional formwhen conducting meta-analyses. The functional formof the meta analysis models are linear in the dependentvariable and the quantitatively defined variables, withthe majority of the variables being qualitative dummyvariables as previously noted. We tested and rejectedlogarithmic transformations of the quantitatively de-fined variables, finding the linear specification to bemost efficient.
The meta analysis benefit transfer model (table 5)was optimized by retaining only those variables thatwere significant at an 80% level of confidence orbetter based on t-statistics. This optimization is nec-essary in order to reduce over-specification of themodel when retaining variables whose coefficients are
not significantly different than zero. A backward elimi-nation procedure was used to optimize the benefittransfer model. The procedure began with the fullspecification of the model using all coded variablesand sequentially eliminated the least significant vari-able until all remaining variables are significant at the80% confidence level or better (p = 0.20).
The meta analysis benefit transfer model (table 5)has an adjusted R2 of 0.27, meaning that 27% of thevariance in the benefit measures is explained by themodel. This is consistent with other meta analyses ofrecreation valuation studies (Walsh and others 1992;Smith and Kaoru 1990). A full meta regression analysisof the data investigating methodological, site, andactivity factor effects and other nuances of the data canbe found in Rosenberger and others (unpublishedpaper). Both models (the full and optimized metaregression models) have a standard error of 1.22, whichmeans that at a 95% confidence limit they have a 7%margin of error in prediction.
For the most part, the signs of the methodologyvariables are consistent with past scientific results.METHOD is negative, meaning that stated preference(SP) methods yield lower benefit estimates than re-vealed preference (RP) methods, which is consistentwith previous meta analysis results (Walsh and others1992) and the bulk of travel cost/contingent valuationcomparison studies (Carson and others 1996). Open-ended (OE), iterative bidding (ITBID), combined statedand revealed preference (SPRP), payment card(PAYCARD), and conjoint analysis (CONJOINT) con-tingent valuation elicitation techniques tend to furtherincrease the difference between SP and RP value esti-mates, which is consistent with comparison studies(Brown and others 1996). For RP estimates, individualand zonal travel cost methods (INDIVID and ZONAL,respectively) and random utility models (RUM) pro-duce relatively lower benefit estimates than hedonicproperty and travel cost methods (HEDONIC). Theinclusion of substitute sites in a demand model (SUBS)lowers the benefit estimate (Rosenthal 1987). The useof phone surveys (PHONE) yields lower benefit esti-mates than either in-person or mail surveys. VALUNITis negative, suggesting that if the original study esti-mated benefits in units such as per trip or per season,then this tended to yield higher per day estimates thanthose already reported in activity day units. Therefore,either (1) there may be a recall bias introduced whenrequesting values per trip, season, or year as comparedto per day estimates, (2) per day estimates understatethe total trip or season value when aggregated, or (3)our estimate of number of days per trip or season areunderstated. The TREND variable shows that benefitestimates generally have been increasing at a greater

20 USDA Forest Service Gen. Tech. Rep. RMRS-GTR-72. 2001
Rosenberger and Loomis Benefit Transfer of Outdoor Recreation Use Values
rate than inflation over time, or annually about onedollar per activity day per person.
USDA Forest Service administered sites (FSADMIN)yield lower benefit estimates. These sites, however, arejuxtaposed to sites designated to be of higher quality(e.g., National Parks, State Parks, and National Wild-life Refuges). Therefore, it is plausible that USDAForest Service sites would have somewhat lower recre-ation value than these other sites. Relatively speaking,estimates for recreation activities for Forest Service
regions 1 and 4 are higher, while estimates for ForestService regions 6 and 8 are lower than the compositebase of the remaining estimates for other regions, thenation, and Canada.
LAKE has a negative sign, meaning that lake recre-ation has lower values than recreation activities inbays/oceans. This makes more sense when we con-sider that reservoirs were coded as lakes in this analy-sis. River recreation (RIVER) yields higher valuesthan bay/ocean recreation. Estimates for recreation
Table 5. Optimized meta analysis national benefit transfer model.
Variable Coefficient White’s standard errora Mean of variable
Constant 81.273* 15.97 —METHOD –21.586* 10.12 0.636DCCVM –36.981* 10.44 0.177OE –51.762* 11.01 0.354ITBID –46.399* 10.89 0.096SPRP –57.796* 17.31 0.006PAYCARD –83.192* 17.85 0.006CONJOINT –74.028* 14.44 0.001PHONE –15.253* 4.28 0.495INDIVID –40.147* 12.71 0.153ZONAL –55.699* 11.29 0.185RUM –58.422* 11.82 0.027SUBS –17.619* 6.33 0.264VALUNIT –9.072* 3.92 0.412TREND 0.980* 0.47 19.331FSADMIN –17.822* 3.70 0.127R1 11.407* 5.41 0.053R4 5.529 3.32 0.111R6 –10.838* 4.01 0.058R8 –5.128* 2.53 0.187LAKE –18.294* 6.06 0.048RIVER 16.788* 8.09 0.041FOREST –9.165 4.98 0.292PUBLIC 13.311* 4.42 0.960SWIM –15.513 8.14 0.010OFFRD –17.336 12.23 0.004NOMTRBT 13.808 8.26 0.014BIKE –14.306 8.54 0.007XSKI –5.937 3.72 0.006SNOWMOB –20.919* 9.31 0.001BGHUNT 15.387* 3.72 0.252WATFOWL 9.894* 4.29 0.084FISH 7.057 4.31 0.174ROCKCL 62.027* 17.66 0.006Adjusted R2 0.27F-stat [33, 667] 8.76*N 701
*Variable is statistically significant at the p < 0.05 level or better. Overall margin of error is ±7%based on a standard error of 1.22 and 95% confidence limits.
aStandard errors are corrected for heteroskedasticity and serial correlation using the robustNewey-West version of White’s covariance consistent estimator and 11 periods (Smith and Karou1990; Driscoll and Kraay 1998).
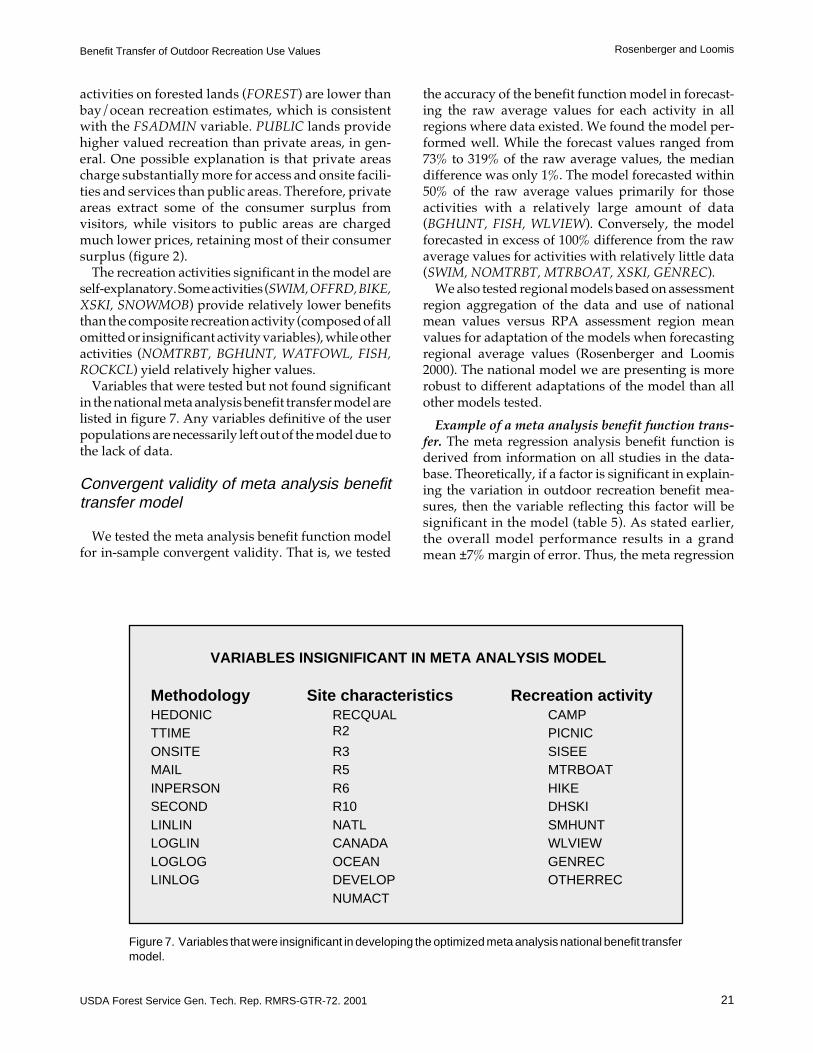
21USDA Forest Service Gen. Tech. Rep. RMRS-GTR-72. 2001
Rosenberger and LoomisBenefit Transfer of Outdoor Recreation Use Values
activities on forested lands (FOREST) are lower thanbay/ocean recreation estimates, which is consistentwith the FSADMIN variable. PUBLIC lands providehigher valued recreation than private areas, in gen-eral. One possible explanation is that private areascharge substantially more for access and onsite facili-ties and services than public areas. Therefore, privateareas extract some of the consumer surplus fromvisitors, while visitors to public areas are chargedmuch lower prices, retaining most of their consumersurplus (figure 2).
The recreation activities significant in the model areself-explanatory. Some activities (SWIM, OFFRD, BIKE,XSKI, SNOWMOB) provide relatively lower benefitsthan the composite recreation activity (composed of allomitted or insignificant activity variables), while otheractivities (NOMTRBT, BGHUNT, WATFOWL, FISH,ROCKCL) yield relatively higher values.
Variables that were tested but not found significantin the national meta analysis benefit transfer model arelisted in figure 7. Any variables definitive of the userpopulations are necessarily left out of the model due tothe lack of data.
Convergent validity of meta analysis benefittransfer model
We tested the meta analysis benefit function modelfor in-sample convergent validity. That is, we tested
the accuracy of the benefit function model in forecast-ing the raw average values for each activity in allregions where data existed. We found the model per-formed well. While the forecast values ranged from73% to 319% of the raw average values, the mediandifference was only 1%. The model forecasted within50% of the raw average values primarily for thoseactivities with a relatively large amount of data(BGHUNT, FISH, WLVIEW). Conversely, the modelforecasted in excess of 100% difference from the rawaverage values for activities with relatively little data(SWIM, NOMTRBT, MTRBOAT, XSKI, GENREC).
We also tested regional models based on assessmentregion aggregation of the data and use of nationalmean values versus RPA assessment region meanvalues for adaptation of the models when forecastingregional average values (Rosenberger and Loomis2000). The national model we are presenting is morerobust to different adaptations of the model than allother models tested.
Example of a meta analysis benefit function trans-fer. The meta regression analysis benefit function isderived from information on all studies in the data-base. Theoretically, if a factor is significant in explain-ing the variation in outdoor recreation benefit mea-sures, then the variable reflecting this factor will besignificant in the model (table 5). As stated earlier,the overall model performance results in a grandmean ±7% margin of error. Thus, the meta regression
Figure 7. Variables that were insignificant in developing the optimized meta analysis national benefit transfermodel.
VARIABLES INSIGNIFICANT IN META ANALYSIS MODEL
Methodology Site characteristics Recreation activityHEDONIC RECQUAL
R2CAMP
TTIME PICNICONSITE R3 SISEEMAIL R5 MTRBOATINPERSON R6 HIKESECOND R10 DHSKILINLIN NATL SMHUNTLOGLIN CANADA WLVIEWLOGLOG OCEAN GENRECLINLOG DEVELOP OTHERREC
NUMACT

22 USDA Forest Service Gen. Tech. Rep. RMRS-GTR-72. 2001
Rosenberger and Loomis Benefit Transfer of Outdoor Recreation Use Values
analysis model provides more robust estimates thanan average value transfer (table 3 confidence range).
The application of the meta analysis benefit func-tion can provide three different measures of the ben-efit of mountain biking (forecast national and regionalaverage values—table 6; and policy site specific fore-cast average value). However, it should be noted thatthe data behind the meta analysis is mostly not specificto mountain biking. Therefore, each of the valuesforecast is really an estimate for a generic biking activ-ity. Many of the estimates that are provided in table 6are the same. This is due to the lack of any statisticallydiscovered variability across these activities (i.e., theactivity-specific variable was not significant in theoptimized national model [figure 7]).
Each of the three benefit measures forecast fromthe meta analysis function differ by degree of specific-ity to the policy site. The adaptation of the meta analy-sis function is essentially to substitute relevant values
for the independent variables in the regression model,which then forecasts a benefit measure based on thespecificity of these variable values. The specificity ofeach benefit measure will be identified as each of themeasures is presented.
The first measure forecasted from the meta analysisfunction is the national average value. In table 6, this isthe measure reported for the United States in the lastcolumn. For biking, this forecast value is $15.27 with a95% confidence range of $14.20 to $16.34. The metaanalysis function was adapted by holding all indepen-dent or explanatory variables constant at their nationalmean values (last column, table 5), with the exceptionof the activity variables. This means that each coeffi-cient is multiplied by the relevant national mean valuefor each variable, providing the incremental consumersurplus due to that variable. In the case of biking, thevariable BIKE was set at 1, while all other activityvariables were set to 0. This adapts the function to
Table 6. Forecasted average values using meta analysis benefit functiona.
Northeast Southeast Intermountain Pacific Coast UnitedActivity Areab Areab Areab Areab Alaskab States
Camping $29.95 $24.82 $34.18 $24.53 $29.95 $29.57Picnicking 29.95 24.82 34.18 24.53 29.95 29.57Swimming 14.44 9.31 18.67 9.02 14.44 14.06Sightseeing 29.95 24.82 34.18 24.53 29.95 29.57Off-road driving 12.61 7.48 16.85 7.19 12.61 12.24Motor boating 29.95 24.82 34.18 24.53 29.95 29.57Float boating 43.76 38.63 47.99 38.34 43.76 43.38Hiking 29.95 24.82 34.18 24.53 29.95 29.57Biking 15.64 10.51 19.88 10.22 15.64 15.27Downhill skiing 29.95 24.82 34.18 24.53 29.95 29.57Cross country skiing 24.01 18.88 28.25 18.59 24.01 23.64Snowmobiling 9.03 3.90 13.26 3.61 9.03 8.65Big game hunting 45.34 40.21 49.57 39.92 45.34 44.96Small game hunting 29.95 24.82 34.18 24.53 29.95 29.57Waterfowl hunting 39.84 34.72 44.08 34.42 39.84 39.47Fishingc 37.01 31.88 41.24 31.59 37.01 36.63Wildlife viewing 29.95 24.82 34.18 24.53 29.95 29.57Horseback riding 29.95 24.82 34.18 24.53 29.95 29.57Rock climbing 91.98 86.85 96.21 86.56 91.98 91.60General recreationd 29.95 24.82 34.18 24.53 29.95 29.57Other recreatione 29.95 24.82 34.18 24.53 29.95 29.57
aBenefit estimates are calculated from the meta analysis benefit function by holding each variable constant at its mean valueexcept for regional and activity specific variables, which are either turned on (1) or off (0) where relevant. For the United Statesaverage value forecast, all variables are held at their national mean value except for activity variables.
bForest Service Regions per area are: Northeast Area = R9; Southeast Area = R8; Intermountain Area = R1, R2, R3, R4; PacificCoast Area = R5, R6; and Alaskan Area = R10.
cFishing values include different species, different bodies of water, and different angling techniques. The majority of the fishingbenefit measures are from studies conducted between 1979 and 1988. Fishing was not a primary target of the literature review sinceit is the focus of a different project.
dGeneral recreation is defined as a composite of recreation opportunities at a site with measure for site, not a specific activity.eOther recreation is defined as sites with recreation opportunities that are undefined or obscure, such as cliff diving and mountain
running.

23USDA Forest Service Gen. Tech. Rep. RMRS-GTR-72. 2001
Rosenberger and LoomisBenefit Transfer of Outdoor Recreation Use Values
specifically reflect biking at the national level. Allincremental consumer surplus values are then summedto provide the estimated consumer surplus for theactivity of interest.
The second measure forecasted from the meta analy-sis function is the regional average value. In table 6,this is the measure reported for the Northeast Area.For biking, this forecast value is $15.64 with a 95%confidence range of $14.55 to $16.73. The meta analysisfunction was adapted by holding all independentvariables at their national mean values (last column,table 5), with the exception of the activity and regionvariables. In the case of biking, the variable BIKE wasset to 1, while all other activity and region variableswere set to 0. This adapts the function to specificallyreflect biking at the regional level.
The third measure forecasted from the meta analysisfunction is the average value that is most specific to thepolicy site. Table 7 shows the adaptation of the func-tion to the policy site. All methodological variableswere held at their national mean values (last column,table 5). These variables include METHOD, DCCVM,OE, ITBID, SPRP, PAYCARD, CONJOINT, PHONE,INDIVID, ZONAL, RUM, SUBS, PHONE, andVALUNIT. TREND is set to 30 to reflect 1996 dollars.All Forest Service region variables are set to 0.FSADMIN is set to 1 to reflect National Forest land.LAKE and RIVER are each set to 0, reflecting that theactivity and/or policy site does not include a lake or ariver, while FOREST is set to 1 to reflect a forestedsetting. PUBLIC is set to 1 to reflect that the policy siteis on public land. BIKE is set to 1 to specify biking as thetarget activity, while all other activity variables are setto 0. After adapting the model specifically to the policysite, a benefit measure of $4.77 per activity day isforecasted, with a 95% confidence range of $4.44 to$5.10.
Estimates forecast from adapting the meta analysisbenefit function at the national, regional, and site-specific levels ranged from about $6 to $16. This rangein estimates is based on information from the entiredatabase, including methodological, study site, andactivity factors. However, the estimated measures arefor a generic bicycling activity. Consumer surplus, ornet willingness to pay, from mountain biking at excep-tional sites may be significantly larger than this genericvalue, as evidenced by the measures reported in Fixand Loomis (1998). In addition, not all relevant infor-mation about a recreation site is available in the recre-ation database and therefore is not reflected in themeta analysis benefit function. Because of these twofactors, we may conclude that meta analysis forecastvalues for biking are conservative measures.
Table 7. Example adaptation of meta analysis benefitfunction for mountain biking.
Adaptation IncrementalVariable Coefficient value consumer surplus
Constant 81.273 1 81.27METHOD –21.586 0.636 –13.73DCCVM –36.981 0.177 –6.54OE –51.762 0.354 –18.32ITBID –46.399 0.096 –4.45SPRP –57.796 0.006 –0.35PAYCARD –83.192 0.006 –0.50CONJOINT –74.028 0.001 –0.07PHONE –15.253 0.495 –7.55INDIVID –40.147 0.153 –6.14ZONAL –55.699 0.185 –10.30RUM –58.422 0.027 –1.58SUBS –17.619 0.264 –4.65VALUNIT –9.072 0.412 –3.74TREND 0.980 30 29.40FSADMIN –17.822 1 –17.82R1 11.407 0 0R4 5.529 0 0R6 –10.838 0 0R8 –5.128 0 0LAKE –18.294 0 0RIVER 16.788 0 0FOREST –9.165 1 –9.16PUBLIC 13.311 1 13.31SWIM –15.513 0 0OFFRD –17.336 0 0NOMTRBT 13.808 0 0BIKE –14.306 1 –14.31XSKI –5.937 0 0SNOWMOB –20.919 0 0BGHUNT 15.387 0 0WATFOWL 9.894 0 0FISH 7.057 0 0ROCKCL 62.027 0 0
Total consumer surplus $4.77
Example application: Summary. Figure 8 providesthe different benefit measures derived from applyingthe various benefit transfer methods. The differentmeasures are relatively consistent, being within a fac-tor or two of each other. This is not surprising giventhat all of the benefit measures are essentially based onthe same data or subsets of data.
Which estimate is best, if any, depends on a numberof factors identified earlier. In addition to the factorsbuilt into the stock of knowledge concerning recre-ation use values (e.g., data collection, reporting, studysite, methodology), judgments of the benefit transfer

24 USDA Forest Service Gen. Tech. Rep. RMRS-GTR-72. 2001
Rosenberger and Loomis Benefit Transfer of Outdoor Recreation Use Values
practitioner can affect overall transfer results. Alljudgments regarding a benefit transfer frameworkaffect the outcome of the process. Judgments about thepolicy context frame the entire evaluation process,including what is affected and by how much. Judg-ments concerning the quality and extent of the scien-tific body of knowledge can affect the availability ofdata. Judgments concerning the gathering, coding,and interpretation of data can affect its applicabilityand relevance to the policy context. And judgmentsconcerning which benefit transfer approach should beused can affect confidence in and credibility of trans-ferred data and policy evaluations. Smith (1992) com-pares the Luken et al. (1992) and Desvousges et al.(1992) uses of benefit transfer to assess the pulp andpaper industry, illustrating the affect researcher judg-ment can have on policy recommendations.
Recommendations andGuidance to Field Users
We have discussed several different methods tousing existing information for benefit transfers whenprimary research is prohibitive. First, single pointestimates or an average of a subset of available pointestimates are available through their listing in theannotated bibliography (appendix A). Second, mea-sures of central tendency for recreation activity valuesprovided in table 3 can be transferred to a policy site.Third, a demand or benefit function for a study site canbe adapted to the policy site. Fourth, the nationalvalues (last column of table 3) can be transferred to apolicy site, providing a measure of central tendency
for an activity based on all empirical research. How-ever, locational factors are greatly ignored with thisapproach. Fifth, the meta regression analysis fore-casted average values (table 6) can be transferred to apolicy site. And sixth, the meta regression analysisbenefit transfer function (table 5) can be adapted tospecific characteristics of a policy site in order to fore-cast a site-specific benefit measure for use in evaluat-ing a policy site. Regardless of which method is cho-sen, the measure(s) transferred have a certain level ofconfidence surrounding them.
Figure 9 provides a flow chart of the decision pro-cess to aid in deriving a benefit measure for recre-ation. We do not intend to imply that any path in theflow chart is preferred to any other. Instead, the flowchart illustrates possible pathways to determining ifand how recreation benefit measures are to be ob-tained. Depending on the context of the choice amongthe different methods, one method may be preferableto another. As Desvousges and others (1998) remindus, an important component in any benefit transferis the involvement and judgment of the transferpractitioner.
The conceptual framework provided in figure 9shows potential paths to choosing a method for obtain-ing recreation values when assessing managementand policy actions. The first decision to make is whetherrecreation is affected by the proposed action (figure 9,step I). If recreation is affected, then the second deci-sion is whether the impact on recreation is expected tobe major (figure 9, step II). If the impact on recreationis expected to be major, then path A may be followed.If the impact on recreation is expected to be minor, thenpath B may be preferred. A preliminary benefit trans-fer could be conducted at this stage to determine theexpected magnitude of recreation impacts. A majorimpact on recreation probably warrants consideration
Figure 8. Summary of example benefit transfers.
Single point estimate transfer $17.61 to $62.88Average value transfer National $45.15 Regional $34.11Demand function transfer $34.25Meta analysis transfer National $15.27 Regional $15.64 Site $4.77

25USDA Forest Service Gen. Tech. Rep. RMRS-GTR-72. 2001
Rosenberger and LoomisBenefit Transfer of Outdoor Recreation Use Values
of doing primary research either through analysis ofsecondary data (figure 9, step A1) or the collection oforiginal data through survey research (figure 9, stepA2). Step A1 is placed prior to step A2 because ittypically requires lower budget and time inputs.
Path B would be followed if either of the followingconditions exist: (1) the impact on recreation is major,but there is no good secondary data available or bud-get and time constraints are prohibitive to doing pri-mary research, or (2) the impact on recreation is minor,thus not warranting the expense of primary analysis.Also note, however, that benefit transfers can be astedious and time consuming as some primary re-search. A decision criterion for all benefit transferderived measures is their degree of defensibility inlight of political and theoretical feasibility. We cannotdetermine this feasibility a priori since feasibility crite-ria are specific to the context of the decision.
Following path B in figure 9, the first step is todetermine if there are any studies available that re-semble the recreation issue at hand. If there are, thenthese studies should be gathered and filtered for appli-cability and acceptability of benefit transfer measures
(figure 9, step B1; studies can be located through table3 and appendices A and C). If there are availablestudies that are applicable and acceptable, then thevalue transfer can be performed either as a single pointestimate or average value transfer (table 3). If there areno studies available or the available studies are notapplicable or acceptable, then steps B2 or B3 can bepursued.
In step B2 of figure 9, the forecast average valuesfrom the meta regression analysis model (table 6) canbe used. If the forecast measure is acceptable, then usethis measure for benefit transfer. However, if thesevalues are not acceptable, then step B3 of figure 9 maybe pursued. Step B3 adapts the meta regression analy-sis benefit transfer model (table 5) to a policy site viacharacteristics specific to that site. One then will haveto determine if this tailored benefit measure is accept-able. If the tailored measure is acceptable, then use thismeasure for benefit transfer. If the measure is notacceptable, we have then exhausted the various sourcesof benefit measures based on the recreation valuationliterature. At this point, one should go back to thebeginning and reassess the criteria used in making
Figure 9. Framework for obtaining benefit measures for recreation.
NO
YES
YES NO
YES NO
YES NO
YESNO
NO YESNO
YES NOYES
IIs recreation use affected
by the proposed action?
Recreation use does not
need to be accounted for.
IIIs recreation a major use
affected by the proposed
action?
AIs there secondary data
available on visitor use and
visitor residence
A1
Estimate a simple travel
cost model
A2Collect primary data
Is time or budget
constrained?
Contact USDA
Forest Service
Research
Go to B
BAre there studies available
investigating similar
issues?
B1Gather available studies (table
3, Appendices A and C)
Are any studies applicable?
Perform value
transfer (single point
or average value
from table 3)
B2Assess meta analysis
forecast average value
(table 6)
Is measure acceptable?
B3Adapt meta analysis
benefit transfer
function (table 5)
Is measure acceptable?
Re-assess
decision criteria
and start over
Go to B2 or B3

26 USDA Forest Service Gen. Tech. Rep. RMRS-GTR-72. 2001
Rosenberger and Loomis Benefit Transfer of Outdoor Recreation Use Values
decisions about the different methods of obtainingbenefit measures. This is definitely a judgment call andit may seem that defensibility of an accepted benefitmeasure will be decreased. However, recall that ben-efit transfer should be pragmatic in the sense thatwhen benefit measures are sought, tradeoffs arenecessary in choosing the best in a “second best”world. A rough estimate of the dollar value of recre-ation in economic analysis or assessment of planningand policy objectives is better than implying a zerovalue for recreation by leaving recreation out of theeconomic model.
References Cited
Adamowicz, Wiktor L.; Fletcher, Jerald J.; Graham-Tomasi, Theodore.1989. Functional form and the statistical properties of welfaremeasures. American Journal of Agricultural Economics. 71(2):414-421.
Barnett, Vic; Lewis, Toby. 1994. Outliers in statistical data, 3rd
edition. New York: John Wiley & Sons. 584 p.Bergstrom, John C.; Cordell, H. Ken. 1991. An analysis of the
demand for and value of outdoor recreation in the United States.Journal of Leisure Research. 23(1): 67-86.
Boyle, Kevin J.; Bergstrom, John C. 1992. Benefit transfer studies:Myths, pragmatism, and idealism. Water Resources Research.28(3): 657-663.
Brookshire, David S.; Neill, Helen R. 1982. Benefit transfers: Concep-tual and empirical issues. Water Resources Research. 28(3): 651-655.
Brown, Thomas C.; Champ, Patricia A.; Bishop, Richard C.;McCollum, Daniel W. 1996. Which response format reveals thetruth about donations to a public good? Land Economics. 72(2):152-166.
Carson, Richard T.; Flores, Nicholas E.; Martin, Kerry M.; Wright,Jennifer L. 1996. Contingent valuation and revealed preferencemethodologies: Comparing the estimates for quasi-public goods.Land Economics. 72(1): 80-99.
Carson, Richard T.; Wright, Jennifer L; Carson, Nancy; Alberini, A.;Flores, N. 1994. A bibliography of contingent valuation studiesand papers. California: Natural Resource Damage Assessment,Inc.
Champ, Patricia A; Boyle, Kevin J.; Brown, Thomas C., eds. [Inpreparation]. A primer on non-market valuation. Under contractwith Kluwer Publishers.
Creel, Michael D.; Loomis, John B. 1990. Theoretical and empiricaladvantages of truncated count data estimators for analysis of deerhunting in California. American Journal of Agricultural Econom-ics. 72(2): 434-441.
Desvousges, William H.; Johnson, F. Reed; Banzhaf, H. Spencer.1998. Environmental policy analysis with limited information:Principles and applications of the transfer method. Massachu-setts: Edward Elgar. 244 p.
Desvousges, William H.; Naughton, Michael C.; Parsons, George R.1992. Benefit transfer: Conceptual problems in estimating waterquality benefits using existing studies. Water Resources Research.28(3): 675-683.
Downing, Mark; Ozuna Jr., Teofilo. 1996. Testing the reliability ofthe benefit function transfer approach. Journal of EnvironmentalEconomics and Management. 30(3): 316-322.
Driscoll, J. C.; Kraay, A. C. 1998. Consistent covariance matrixestimation with spatially dependent panel data. Review of Eco-nomics and Statistics. 80(4): 549-560.
Fix, Peter; Loomis, John. 1998. Comparing the economic value ofmountain biking estimated using revealed and stated preference.Journal of Environmental Planning and Management. 41(2): 227-236.
Freeman, A. Myrick, III. 1984. On the tactics of benefit estimationunder Executive Order 12291. In: Smith, V. Kerry, ed. Environ-mental policy under Reagan’s Executive Order: The role of ben-efit-cost analysis. Chapel Hill, NC: The University of NorthCarolina Press: chapter 6.
Freeman, A. Myrick, III. 1993. The measurement of environmentaland resource values: Theory and methods. Washington, DC:Resources for the Future. 516 p.
Kirchhoff, Stefanie; Colby, Bonnie G.; LaFrance, Jeffrey T. 1997.Evaluating the performance of benefit transfer: An empiricalinquiry. Journal of Environmental Economics and Management.33(1): 75-93.
Loomis, John B; Walsh, Richard G. 1997. Recreation economic deci-sions: Comparing benefits and costs. 2nd ed. State College, PA:Venture Publishing. 440 p.
Loomis, John; Roach, Brian; Ward, Frank; Ready, Richard. 1995.Testing the transferability of recreation demand models acrossregions: A study of Corps of Engineers reservoirs. Water Re-sources Research. 31(3): 721-730.
Loomis, John; Rosenberger, Randy; Shrestha, Ram. 1999. Updatedestimates of recreation values for the RPA program by assessmentregion and use of meta-analysis for recreation benefit transfer.Fort Collins, CO: Colorado State University, Department of Agri-cultural and Resource Economics; Final Report RJVA 28-JV7-962.36 p.
Luken, Ralph A.; Johnson, F. Reed; Kibler, Virginia. 1992. Benefitsand costs of pulp and paper effluent controls under the CleanWater Act. Water Resources Research. 28(3): 665-674.
MacNair, Doug. 1993. 1993 RPA recreation values database. Wash-ington, DC: USDA Forest Service, RPA Program; Contract 43-4568-3-1191.
Markowski, M.; Unsworth, R.; Paterson, R.; Boyle, K. 1997. A data-base of sport fishing values. Washington, DC: Industrial Econom-ics Inc., prepared for U.S. Fish and Wildlife Service, EconomicsDivision.
Morey, Edward R. 1994. What is consumer’s surplus per day of use,when is it a constant independent of the number of days of use,and what does it tell us about consumer’s surplus? Journal ofEnvironmental Economics and Management. 26(3): 257-270.
Rosenberger, Randall S.; Loomis, John B. 2000. Using meta-analysisfor benefit transfer: In-sample convergent validity tests of anoutdoor recreation database. Water Resources Research. 36(4):1097-1107.
Rosenberger, Randall S.; Loomis, John B. 2000. Panel stratification inmeta-analysis of environmental and natural resource economicstudies. Journal of Agricultural and Applied Economics. 32(3):459-470.
Rosenberger, Randall S.; Loomis, John B.; Shrestha, Ram K. 1999.Thirty years of outdoor recreation use value studies: Testing fortrends and study factor effects using meta-analysis. Unpublishedpaper available at: Department of Agricultural and ResourceEconomics, Colorado State University, Fort Collins, CO. 18 p.
Rosenthal, Donald H. 1987. The necessity for substitute prices inrecreation demand analysis. American Journal of AgriculturalEconomics. 69(4): 828-837.
Rosenthal, Donald H.; Brown, Thomas C. 1985. Comparability ofmarket prices and consumer surplus for resource allocation deci-sions. Journal of Forestry. 83(1): 105-109.
Siderelis, Christos; Moore, Roger. 1995. Outdoor recreation netbenefits of rail-trails. Journal of Leisure Research. 27(4): 344-359.
Smith, V. Kerry. 1992. On separating defensible benefit transfersfrom “smoke and mirrors”. Water Resources Research 28(3): 685-694.
Smith, V. Kerry; van Houtven, George; Pattanayak, Subhrendu.1999. Benefit transfer as preference calibration. Washington, DC:Resources for the Future; Discussion Paper 99-36. 37 p.
Smith, V. Kerry; Kaoru, Yoshiaki. 1990. Signals or noise?: Explainingthe variation in recreation benefit estimates. American Journal ofAgricultural Economics. 72(2): 419-433.

27USDA Forest Service Gen. Tech. Rep. RMRS-GTR-72. 2001
Rosenberger and LoomisBenefit Transfer of Outdoor Recreation Use Values
Sorg, Cindy F.; Loomis, John B. 1984. Empirical estimates of amenityforest values: A comparative review. Gen. Tech. Rep. RM-107.Fort Collins, CO: U.S. Department of Agriculture, Forest Service,Rocky Mountain Forest and Range Experiment Station. 23 p.
SPRA. (2000, January 27). Homepage of Strategic Planning andResource Assessment, Forest Service, U.S. Department of Agri-culture. Available: http://www.fs.fed.us/plan.
U.S. Water Resources Council. 1973. Principles, standards, andprocedures for water and related land resource planning. FederalRegister. 38(174): part III, 24,778-24,945.
U.S. Water Resources Council. 1979. Procedures for evaluation ofnational economic development (NED) benefits and costs inwater resources planning (Level C). Federal Register. 44(243):72,892-72,976.
U.S. Water Resources Council. 1983. Economic and environmentalprinciples and guidelines for water and related land resourcesimplementation studies. Washington, DC: U.S. Government Print-ing Office. 137 p.
USDA Forest Service. 1989. Draft 1990 RPA Program. Washington,DC: USDA Forest Service. Paginated by section.
Walsh, Richard G.; Johnson, Donn M.; McKean, John R. 1988.Review of outdoor recreation economic demand studies withnonmarket benefit estimates, 1968-1988. Fort Collins, CO:Colorado State University, Department of Agricultural andResource Economics, Technical Report No. 54. 131 p.
Walsh, Richard G.; Johnson, Donn M.; McKean, John R. 1992.Benefit transfer of outdoor recreation demand studies: 1968-1988. Water Resources Research. 28(3): 707-713.
Willig, Robert D. 1976. Consumer surplus without apology. Ameri-can Economic Review. 66(4): 589-597.

28 USDA Forest Service Gen. Tech. Rep. RMRS-GTR-72. 2001
Rosenberger and Loomis Benefit Transfer of Outdoor Recreation Use Values
Appendix A: Annotated Bibliography of Outdoor Recreation Use ValuationStudies, 1967 to 1998
Key:Reference #. Author. Year Publication. Title. Source.
• Recreation Activity/ Forest Service Region (FS), RPA Region where RPA1=Northeast Area, RPA2=SoutheastArea, RPA3=Intermountain Area, RPA4=Pacific Coast Area, RPA5=Alaska/ Original $ per person peractivity day [year]/ Inflation-adjusted $ for fourth Quarter, 1996/ Valuation Method (CV=contingentvaluation, TC=travel cost, RUM/MNL=random utility model/multinomial logit model). Note: an asterik(*) prior to lead author’s name identifies studies not included in the meta-regression analysis.
1. Adamowicz, W., J. Louviere, and M. Williams. 1994. Combining revealed and stated preference methods forvaluing environmental amenities. Journal of Environmental Economics and Management 26:271-292.
• GENERAL RECREATION/ Canada/ $1.45 [1991]/ $1.64/ RUM/MNL• GENERAL RECREATION/ Canada/ $5.94 [1991]/ $6.71/ Conjoint• GENERAL RECREATION/ Canada/ $1.46 [1991]/ $1.65/ Combined conjoint and RUM/MNL
2. Adamowicz, W., S. Jennings, and D. Coyne. 1990. A sequential choice model of recreation behavior. WesternJournal of Agricultural Economics 15:91-99.
• BIG GAME HUNTING/ Canada/ $24.07 [1981]/ $40.11/ RUM/MNL
3. Adamowicz, W.L., and W.E. Phillips. 1983. A comparison of extra market benefit evaluation techniques.Canadian Journal of Agricultural Economics 31:401-412.
• FISHING/ Canada/ $4.18 [1975]/ $10.92/ Individual TC• FISHING/ Canada/ $13.99 [1975]/ $36.56/ CV• FISHING/ Canada/ $39.44 [1975]/ $103.07/ CV
4. Adams, R.M., O. Bergland, W.N. Musser, S.L. Johnson, and L.M. Musser. 1989. User fees and equity issues inpublic hunting expenditures: The case of ring-necked pheasant in Oregon. Land Economics 65:376-385.
• SMALL GAME HUNTING/ FS6, RPA4/ $20.05 [1986]/ $27.37/ CV
5. Baker, J.C. 1996. A nested Poisson approach to ecosystem valuation: An application to backcountry hiking inCalifornia. Reno, NV: University of Nevada, Reno. 26 p.
• HIKING/ FS5, RPA4/ $25.29 [1996]/ $25.24/ Zonal TC• HIKING/ FS5, RPA4/ $22.57 [1996]/ $22.53/ Zonal TC• HIKING/ FS5, RPA4/ $27.12 [1996]/ $27.07/ Zonal TC• HIKING/ FS5, RPA4/ $11.35 [1996]/ $11.33/ Zonal TC• HIKING/ FS5, RPA4/ $14.63 [1996]/ $14.60/ Zonal TC• HIKING/ FS5, RPA4/ $9.88 [1996]/ $9.86/ Zonal TC• HIKING/ FS5, RPA4/ $29.59 [1996]/ $29.53/ Zonal TC• WILDERNESS/ FS5, RPA4/ $25.29 [1996]/ $25.24/ Zonal TC• WILDERNESS/ FS5, RPA4/ $22.57 [1996]/ $22.53/ Zonal TC• WILDERNESS/ FS5, RPA4/ $27.12 [1996]/ $27.07/ Zonal TC• WILDERNESS/ FS5, RPA4/ $11.35 [1996]/ $11.33/ Zonal TC• WILDERNESS/ FS5, RPA4/ $14.63 [1996]/ $14.60/ Zonal TC• WILDERNESS/ FS5, RPA4/ $9.88 [1996]/ $9.86/ Zonal TC• WILDERNESS/ FS5, RPA4/ $29.59 [1996]/ $29.53/ Zonal TC
6. Balkan, E., and J.R. Kahn. 1988. The value of changes in deer hunting quality: A travel cost approach. AppliedEconomics 20:533-539.
• BIG GAME HUNTING/ National/ $106.30 [1980]/ $193.82/ Zonal TC• BIG GAME HUNTING/ National/ $104.30 [1980]/ $190.17/ Individual TC

29USDA Forest Service Gen. Tech. Rep. RMRS-GTR-72. 2001
Rosenberger and LoomisBenefit Transfer of Outdoor Recreation Use Values
7. Barrick, K. 1986. Option value in relation to distance effects and selected user characteristics for the WashakieWilderness, northeast Wyoming. In R.C. Lucas [comp.], Proceedings — National Wilderness ResearchConference: Current Research. Ogden, UT: USDA Forest Service, Intermountain Research Station, GeneralTechnical Report INT-212: 411-422.
• WILDLIFE VIEWING/ FS2, RPA3/ $5.95 [1982]/ $9.33/ CV• WILDERNESS/ FS2, RPA3/ $5.95 [1982]/ $9.33/ CV
8. Bergstrom, J.C., and H.K. Cordell. 1991. An analysis of the demand for and value of outdoor recreation in theUnited States. Journal of Leisure Research 23:67-86.
• See Appendix B Table B1. VARIOUS ACTIVITIES, 16 ESTIMATES.
9. Bergstrom, J.C., J.M. Bowker, H.K. Cordell, G. Bhat, D.B.K. English, R.J. Teasley, and P. Villegas. 1996.Ecoregional estimates of the net economic values of outdoor recreational activities in the United States:Individual model results. Final Report submitted to Resource Program and Assessment Staff, USDA ForestService, Washington, DC. Athens, GA: Outdoor Recreation and Wilderness Assessment Group SE-4901,USDA Forest Service, and Department of Agricultural and Applied Economics, University of Georgia. 68 p.
• See appendix B table B2. VARIOUS ACTIVITIES, 50 ESTIMATES.
10. Bergstrom, J.C., J.R. Stoll, J.P. Titre, and V.L. Wright. 1990. Economic value of wetlands-based recreation.Ecological Economics 2:129-147.
• GENERAL RECREATION/ FS8, RPA2/ $15.19 [1986]/ $20.74/ CV
11. Bishop, R.C., C.A. Brown, M.P. Welsh, and K.J. Boyle. 1989. Grand Canyon recreation and Glen Canyon Damoperations: An economic evaluation. In K.J. Boyle and T. Heekin, Western Regional Research Project W-133,Benefits and Costs in Natural Resource Planning, Interim Report 2. Orono, ME: Department of Agriculturaland Resource Economics, University of Maine: 407-435.
• FLOAT BOATING/ FS3, RPA3/ $78.00 [1985]/ $109.26/ CV
12. Bishop, R., T. Heberlein, and M.J. Kealy. 1983. Contingent valuation of environmental assets: Comparisonswith a simulated market. Natural Resources Journal 23:619-633.
• WATERFOWL HUNTING/ FS9, RPA1/ $11.00 [1978]/ $23.78/ CV• WATERFOWL HUNTING/ FS9, RPA1/ $21.00 [1978]/ $45.39/ CV• WATERFOWL HUNTING/ FS9, RPA1/ $32.00 [1978]/ $69.17/ Zonal TC
13. Bishop, R., T. Heberlein, M. Welsh, and R. Baumgartner. 1984. Does contingent valuation work? Results of theSandhill experiment. Paper presented at the joint meetings of AERA and AAEA.
• BIG GAME HUNTING/ FS9, RPA1/ $32.00 [1983]/ $48.11/ CV
14. Bouwes, N., and R. Schneider. 1979. Procedures in estimating benefits of water quality change. AmericanJournal of Agricultural Economics 61:535-539.
• GENERAL RECREATION/ FS9, RPA1/ $2.54 [1979]/ $5.06/ Individual TC
15. *Bowes, M.D., and J.B. Loomis. 1980. A note on the use of travel cost models with unequal zonal populations.Land Economics 56:465-470.
• FLOAT BOATING/ FS4, RPA3/ $19.00 [1978]/ $41.07/ Zonal TC
16. Bowes, M., and J. Krutilla. 1989. Multiple-use management: The economics of public forestlands. Washington,DC: Resources for the Future: 177-247.
• FISHING/ FS9, RPA1/ $5.03 [1981]/ $8.37/ Zonal TC
17. Boyle, K.J., M.L. Phillips, S.D. Reiling, and L.K. Demirelli. 1988. Economic values and economic impactsassociated with consumptive uses of Maine’s fish and wildlife resources. Orono, ME: Department ofAgricultural and Resource Economics, University of Maine. 41 p.
• BIG GAME HUNTING/ FS 9, RPA1/ $74.00 [1987]/ $98.00/ CV• SMALL GAME HUNTING/ FS 9, RPA1/ $23.00 [1987]/ $30.46/ CV• WATERFOWL HUNTING/ FS 9, RPA1/ $72.00 [1987]/ $95.35/ CV

30 USDA Forest Service Gen. Tech. Rep. RMRS-GTR-72. 2001
Rosenberger and Loomis Benefit Transfer of Outdoor Recreation Use Values
18. Boyle, K., M. Welsh, and R. Bishop. 1988. Analyzing the effects of Glen Canyon Dam releases on Colorado riverrecreation using scenarios of unexperienced flow conditions. In J.B. Loomis (comp.), Western RegionalResearch Publication W-133, Benefits and Costs in Natural Resources Planning, Interim Report. Davis, CA:University of California, Davis: 111-130.
• FISHING/ FS3, RPA3/ $34.41 [1985]/ $48.20/ CV• FLOAT BOATING/ FS3, RPA3/ $26.00 [1985]/ $36.42/ CV
19. Boyle, K.J., S.D. Reiling, and M.L. Phillips. 1990. Species substitution and question sequencing in contingentvaluation surveys evaluating the hunting of several types of wildlife. Leisure Science 12:103-118.
• BIG GAME HUNTING/ FS 9, RPA1/ $7.90 [1989]/ $9.69/ CV• SMALL GAME HUNTING/ FS 9, RPA1/ $2.83 [1989]/ $3.47/ CV• WATERFOWL HUNTING/ FS 9, RPA1/ $3.90 [1989]/ $4.78/ CV
20. Boyle, K., S. Reiling, M. Teisel, and M. Phillips. 1990. A study of the impact of game and nongame species onMaine’s economy. Orono, ME: Department of Agricultural and Resource Economics, University of Maine.
• BIG GAME HUNTING/ FS9, RPA1/ $50.95 [1989]/ $62.47/ CV• BIG GAME HUNTING/ FS9, RPA1/ $37.47 [1989]/ $45.94/ CV• BIG GAME HUNTING/ FS9, RPA1/ $68.45 [1989]/ $83.92/ CV• SMALL GAME HUNTING/ FS9, RPA1/ $62.20 [1989]/ $76.26/ CV• WATERFOWL HUNTING/ FS9, RPA1/ $116.49 [1989]/ $142.82/ CV• WATERFOWL HUNTING/ FS9, RPA1/ $59.62 [1989]/ $73.10/ CV• FISHING/ FS9, RPA1/ $172.05 [1989]/ $210.94/ CV• FISHING/ FS9, RPA1/ $14.65 [1989]/ $17.96/ CV
21. Brooks, R. 1988. The net economic value of deer hunting in Montana. Helena, MT: Montana Department ofFish, Wildlife, and Parks.
• BIG GAME HUNTING/ FS1, RPA3/ $54.55 [1985]/ $76.40/ Zonal TC• BIG GAME HUNTING/ FS1, RPA3/ $19.30 [1985]/ $27.04/ Zonal TC
22. Brown, G., and J. Hammack. 1972. A preliminary investigation of the economics of migratory waterfowl. InJ.V. Krutilla (ed.), Natural Environments: Studies in Theoretical and Applied Analysis. Baltimore, MD: JohnsHopkins University Press: 171-204.
• WATERFOWL HUNTING/ FS4, RPA3/ $25.46 [1969]/ $96.77/ CV
23. Brown, G., and M. Hay. 1987. Net economic recreation values for deer and waterfowl hunting and troutfishing. Washington, DC: USDI Fish and Wildlife Service, Division of Policy and Directive Management.Working paper No. 23.
• See Appendix B Table B3. BIG GAME and WATERFOWL HUNTING, and FISHING/ 134 ESTIMATES
24. *Brown, G., and M. Plummer. 1979. Recreation valuation: An economic analysis of nontimber uses offorestland in the Pacific Northwest. Pullman, WA: Forest Policy Project, Washington State University.
• HIKING/ FS6, RPA4/ $9.40 [1976]/ $23.21/ Zonal TC• HIKING/ FS6, RPA4/ $43.75 [1976]/ $108.02/ Zonal TC• WILDERNESS/ FS6, RPA4/ $43.75 [1976]/ $108.02/ Zonal TC
25. Brown, T., T. Daniel, M. Richards, and D. King. 1989. Recreation participation and the validity of photo-basedpreference judgments. Journal of Leisure Research 21:40-60.
• CAMPING/ FS3, RPA3/ $18.05 [1985]/ $25.28/ CV
26. Brown, W., D.M. Larson, R.S. Johnston, and R.J. Wahle. 1979. Improved economic evaluation of commerciallyand sport caught salmon and steelhead of the Columbia River. Corvallis, OR: Oregon State University.
• FISHING/ FS6, RPA4/ $21.77 [1974]/ $62.25/ Individual TC

31USDA Forest Service Gen. Tech. Rep. RMRS-GTR-72. 2001
Rosenberger and LoomisBenefit Transfer of Outdoor Recreation Use Values
27. Cameron, T., and M. James. 1987. Efficient estimation methods for close-ended contingent valuation surveys.Review of Economics and Statistics 69:269-276.
• FISHING/ Canada/ $48.33 [1984]/ $70.03/ CV
28. Capel, R.E., and R.K. Pandey. 1972. Estimation of benefits from deer and moose hunting in Manitoba. CanadianJournal of Agricultural Economics 21:6-15.
• BIG GAME HUNTING/ Canada/ $7.04 [1968]/ $28.02/ Zonal TC• BIG GAME HUNTING/ Canada/ $9.31 [1967]/ $26.49/ Zonal TC
29. Casey, J.F., T. Vukina, and L.E. Danielson. 1995. The economic value of hiking: Further considerations ofopportunity cost of time in recreational demand models. Journal of Agricultural and Applied Economics27:658-668.
• HIKING/ FS8, RPA2/ $213.92 [1995]/ $218.37/ Individual TC• WILDERNESS/ FS8, RPA2/ $213.92 [1995]/ $218.37/ Individual TC
30. *Chicetti, C.J., A.C. Fisher, and V.K. Smith. 1976. An econometric evaluation of a generalized consumersurplus measure: The Mineral King controversy. Econometrica 44:1259-1275.
• CROSS COUNTRY SKIING/ FS5, RPA4/ $12.25 [1972]/ $40.32/ Zonal TC
31. Connelly, N., and T. Brown. 1988. Estimates of nonconsumptive wildlife use on Forest Service and BLM lands.Ithaca, NY: USDA Forest Service and Cornell University.
• See appendix B table B4. WILDLIFE VIEWING/ 42 ESTIMATES.
32. Connelly, N., and T. Brown. 1991. Net economic value of the freshwater recreational fisheries of New York.Transactions of the American Fisheries Society 120:770-775.
• FISHING/ FS9, RPA1/ $13.68 [1988]/ $17.48/ CV
33. Cooper, J., and J. Loomis. 1991. Economic value of wildlife resources in the San Joaquin Valley: Hunting andviewing values. In A. Dinar and D. Zilberman (eds.), The Economic and Management of Water and Drainagein Agriculture. Boston, MA: Kluwer Academic Publishers: 447-463.
• WILDLIFE VIEWING/ FS5, RPA4/ $37.33 [1988]/ $47.70/ CV• WATERFOWL HUNTING/ FS5, RPA4/ $55.41 [1988]/ $70.80/ Zonal TC
34. Cooper, J., and J. Loomis. 1993. Testing whether waterfowl hunting benefits increase with greater waterdeliveries to wetlands. Environment and Resource Economics 3:545-561.
• WATERFOWL HUNTING/ FS5, RPA4/ $26.21 [1989]/ $32.13/ Zonal TC
35. Cordell, H.K., and J. Bergstrom. 1992. Comparison of recreation use values among alternative reservoir waterlevel management scenarios. Water Resources Research 29:247-258.
• OTHER RECREATION/ FS8, RPA2/ $3.88 [1989]/ $4.76/ CV
36. Cory, D.C., and W.E. Martin. 1985. Valuing wildlife for efficient multiple use: Elk vs. cattle. Western Journal ofAgricultural Economics 10:282-293.
• BIG GAME HUNTING/ FS3, RPA3/ $8.04 [1979]/ $16.02/ CV
37. Crandall, K.B. 1991. Measuring the economic benefits of riparian areas. Master’s Thesis, University of Arizona.
• WILDLIFE VIEWING/ FS3, RPA3/ $137.50 [1990]/ $161.59/ Zonal TC
38. Creel, M.D., and J.B. Loomis. 1990. Theoretical and empirical advantages of truncated count data estimatorsfor analysis of deer hunting in California. American Journal of Agricultural Economics 72:434-441.
• BIG GAME HUNTING/ FS5, RPA4/ $70.07 [1987]/ $92.80/ Individual TC
39. Daniels, S. 1987. Marginal cost pricing and efficient provision of public recreation. Journal of Leisure Research19:22-34.
• CAMPING/ FS1, RPA3/ $8.71 [1984]/ $12.62/ Zonal TC

32 USDA Forest Service Gen. Tech. Rep. RMRS-GTR-72. 2001
Rosenberger and Loomis Benefit Transfer of Outdoor Recreation Use Values
40. Daubert, J.T., and R.A. Young. 1981. Recreational demands for maintaining instream flows: A contingentvaluation approach. American Journal of Agricultural Economics 63:666-676.
• FISHING/ FS2, RPA3/ $28.60 [1978]/ $61.82/ CV
41. Donnelly, D., J. Loomis, C. Sorg, and L. Nelson. 1983. Net economic value of recreational steelhead fishing inIdaho. Fort Collins, CO: USDA Forest Service, Rocky Mountain Forest and Range Experiment Station,Resource Bulletin RM-9.
• FISHING/ FS6, RPA4/ $20.29 [1982]/ $31.81/ CV• FISHING/ FS6, RPA4/ $14.29 [1982]/ $22.40/ Zonal TC• FISHING/ FS6, RPA4/ $10.20 [1982]/ $15.99/ Zonal TC
42. Donnelly, D., and L. Nelson. 1983. Net economic value of deer hunting in Idaho. Fort Collins, CO: USDA ForestService, Rocky Mountain Forest and Range Experiment Station, Resource Bulletin RM-13.
• BIG GAME HUNTING/ FS6, RPA4/ $19.18 [1983]/ $28.84/ CV• BIG GAME HUNTING/ FS6, RPA4/ $26.86 [1983]/ $40.39/ Zonal TC• BIG GAME HUNTING/ FS6, RPA4/ $23.39 [1983]/ $35.17/ Zonal TC
43. Duffield, J. 1984. Travel cost and contingent valuation: A comparative analysis. In V.K. Smith and A.D. Witte(eds.), Advances in Applied Micro-Economics, Vol. 3. Greenwich, CT: JAI Press: 67-87.
• OTHER RECREATION/ FS1, RPA3/ $6.09 [1981]/ $10.14/ Zonal TC
44. Duffield, J. 1988. The net economic value of elk hunting in Montana. Helena, MT: Report for MontanaDepartment of Fish, Wildlife, and Parks.
• BIG GAME HUNTING/ FS1, RPA3/ $68.77 [1985]/ $96.33/ Zonal TC• BIG GAME HUNTING/ FS1, RPA3/ $34.81 [1985]/ $48.76/ Zonal TC
45. Duffield, J., and C. Neher. 1990. A contingent valuation assessment of Montana deer hunting: Attitudes andeconomic benefits. Helena, MT: Report for Montana Department of Fish, Wildlife, and Parks.
• BIG GAME HUNTING/ FS1, RPA3/ $61.40 [1988]/ $78.45/ CV
46. Duffield, J., and C. Neher. 1991. Montana waterfowl hunting: A contingent valuation assessment of economicbenefits and hunter attitudes. Helena, MT: Report for Montana Department of Fish, Wildlife, and Parks.
• WATERFOWL HUNTING/ FS1, RPA3/ $78.88 [1989]/ $96.71/ CV• WATERFOWL HUNTING/ FS1, RPA3/ $89.29 [1989]/ $109.47/ CV• WATERFOWL HUNTING/ FS1, RPA3/ $100.15 [1989]/ $122.79/ CV
47. Duffield, J., C. Neher, and T. Brown. 1992. Recreation benefits of instream flow: Application to Montana’s BigHole and Bitterroot Rivers. Water Resources Research 28:2169-2181.
• FISHING/ FS1, RPA3/ $88.24 [1988]/ $112.75/ CV• OTHER RECREATION/ FS1, RPA3/ $134.88 [1988]/ $172.35/ CV
48. Duffield, J., J. Loomis, R. Brooks, and J. Holliman. 1987. The net economic value of fishing in Montana. Helena,MT: Report for Montana Department of Fish, Wildlife, and Parks.
• FISHING/ FS1, RPA3/ $69.91 [1985]/ $97.93/ Zonal TC• FISHING/ FS1, RPA3/ $103.20 [1985]/ $144.56/ Zonal TC• FISHING/ FS1, RPA3/ $48.16 [1985]/ $67.46/ Zonal TC• FISHING/ FS1, RPA3/ $32.62 [1985]/ $45.69/ Zonal TC
49. Dwyer, J., G. Peterson, and A. Darragh. 1983. Estimating value of urban forests using the travel cost method.Journal of Arboriculture 9:182-185.
• GENERAL RECREATION/ FS9, RPA1/ $8.64 [1979]/ $17.21/ Zonal TC

33USDA Forest Service Gen. Tech. Rep. RMRS-GTR-72. 2001
Rosenberger and LoomisBenefit Transfer of Outdoor Recreation Use Values
50. Ekstrand, E.R. 1994. Economic benefits of resources used for rock climbing at Eldorado Canyon State Park,Colorado. Ph.D. Dissertation, Colorado State University.
• ROCK CLIMBING/ FS2, RPA3/ $26.38 [1991]/ $29.82/ CV• ROCK CLIMBING/ FS2, RPA3/ $40.11 [1991]/ $45.34/ Individual TC• ROCK CLIMBING/ FS2, RPA3/ $45.08 [1991]/ $50.95/ Individual TC
51. Englin, J., and J.S. Shonkwiler. 1995. Estimating social welfare using count data models: An application tolong-run recreation demand under conditions of endogenous stratification. The Review of Economics andStatistics 77:104-112.
• HIKING/ FS6, RPA4/ $16.02 [1985]/ $22.44/ Individual TC• HIKING/ FS6, RPA4/ $24.42 [1985]/ $34.21/ Individual TC• WILDERNESS/ FS6, RPA4/ $16.02 [1985]/ $22.44/ Individual TC• WILDERNESS/ FS6, RPA4/ $24.42 [1985]/ $34.21/ Individual TC
52. Englin, J., and R. Mendelsohn. 1991. A hedonic travel cost analysis for valuation of multiple components ofsite quality: The recreation value of forest management. Journal of Environmental Economics and Management21:275-290.
• CAMPING/ FS6, RPA4/ $58.56 [1982]/ $91.80/ Hedonic TC• WILDERNESS/ FS6, RPA4/ $58.56 [1982]/ $91.80/ Hedonic TC
53. Fadali, E., and W.D. Shaw. 1998. Can recreation values for a lake constitute a market for banked agriculturalwater? Contemporary Economic Policy 16:433-441.
• MOTOR BOATING/ FS5, RPA4/ $11.28 [1996]/ $11.28/ RUM/MNL• MOTOR BOATING/ FS5, RPA4/ $11.68 [1996]/ $11.68/ RUM/MNL• MOTOR BOATING/ FS5, RPA4/ $53.50 [1996]/ $53.40/ Individual TC
54. Farber, S., and A. Rambaldi. 1993. Willingness to pay for air quality: The case of outdoor exercise. ContemporaryPolicy Issues 11:19-30.
• OTHER RECREATION/ FS8, RPA2/ $13.67 [1991]/ $15.45/ CV
55. Feltus, D.G., and E.E. Langenau. 1984. Optimization of firearm deer hunting and timber values in northernlower Michigan. Wildlife Society Bulletin 12:612.
• BIG GAME HUNTING/ FS9, RPA1/ $2.84 [1974]/ $8.12/ Zonal TC
56. *Findeis, J.L., and E.L. Michalson. 1984. The demand for and value of outdoor recreation in the TargheeNational Forest, Idaho. Moscow, ID: University of Idaho, Agricultural Experiment Station, Bulletin No. 627.
• CAMPING/ FS4, RPA3/ $8.60 [1974]/ $28.31/ Individual TC• CAMPING/ FS4, RPA3/ $17.93 [1974]/ $59.02/ Individual TC
57. Fisher, W. 1982. Travel cost and contingent value estimates explored. Paper presented at the Eastern EconomicAssociation Meeting.
• BIG GAME HUNTING/ FS9, RPA1/ $80.00 [1975]/ $209.08/ Individual TC
58. Fix, P., and J. Loomis. 1998. Comparing the economic value of mountain biking estimated using revealed andstated preference. Journal of Environmental Planning and Management 41:227-236.
• BIKING/ FS4, RPA3/ $54.90 [1996]/ $54.90/ Individual TC• BIKING/ FS4, RPA3/ $62.88 [1996]/ $62.88/ CV
59. Garrett, J., G. Pon, and D. Arosteguy. 1970. Economics of big game resource use in Nevada. Reno, NV:University of Nevada, Reno, Agricultural Experiment Station.
• BIG GAME HUNTING/ FS4, RPA3/ $5.76 [1967]/ $23.92/ Zonal TC
60. Gericke, K.L. 1993. Multiple destination trips and the economic valuation of outdoor recreation sites. Ph.D.Thesis, Virginia Polytechnic Institute and State University.
• SIGHTSEEING/ FS8, RPA2/ $61.00 [1992]/ $67.10/ Zonal TC

34 USDA Forest Service Gen. Tech. Rep. RMRS-GTR-72. 2001
Rosenberger and Loomis Benefit Transfer of Outdoor Recreation Use Values
61. Gibbs, K. 1974. Evaluation of outdoor recreational resources: A note. Land Economics 50:309-311.
• CAMPING/ FS8, RPA2/ $15.01 [1970]/ $54.18/ Individual TC
62. Gibbs, K., L. Queirolo, and C. Lomnicki. 1979. The valuation of outdoor recreation in a multiple-use forest.Corvallis, OR: Forest Research Laboratory, Oregon State University.
• HIKING/ FS6, RPA4/ $12.11 [1977]/ $28.08/ Individual TC
63. *Gilbert, A.H., D.W. McCollum, and G.L. Peterson. 1988. A comparison of valuation models using cross-country skiing data from Colorado and Vermont. Fort Collins, CO: USDA Forest Service, Rocky MountainForest and Range Experiment Station Draft Paper.
• CROSS COUNTRY SKIING/ FS9, RPA1/ $21.12 [1986]/ $28.83/ CV• CROSS COUNTRY SKIING/ FS2, RPA3/ $21.03 [1986]/ $28.71/ CV• CROSS COUNTRY SKIING/ FS2, RPA3/ $10.94 [1986]/ $14.93/ CV• CROSS COUNTRY SKIING/ FS2, RPA3/ $28.38 [1986]/ $38.74/ CV• CROSS COUNTRY SKIING/ FS2, RPA3/ $26.23 [1986]/ $35.81/ CV
64. Glass, R., and T. More. 1992. Equity preferences in the allocation of goose hunting opportunities. Journal ofEnvironmental Management 35:271-279.
• WATERFOWL HUNTING/ FS9, RPA1/ $33.34 [1987]/ $44.15/ CV
65. Goodwin, B.K., L.A. Offenbach, T.T. Cable, and P.S. Cook. 1993. Discrete/continuous contingent valuation ofprivate hunting access in Kansas. Journal of Environmental Management 39:1-12.
• SMALL GAME HUNTING/ FS2, RPA3/ $4.80 [1986]/ $6.55/ CV
66. *Grubb, H., and J. Goodwin. 1968. Economic evaluation of water oriented recreation in the preliminary Texaswater plan. Dallas, TX: Texas Water Development Board.
• SWIMMING/ FS8, RPA2/ $3.80 [1965]/ $16.75/ Zonal TC
67. Halstead, J., B.E. Lindsay, and C.M. Brown. 1991. Use of tobit model in contingent valuation: Experimentalevidence from Pemigewasset wilderness area. Journal of Environmental Management 33:79-89.
• WILDLIFE VIEWING/ FS9, RPA1/ $1.92 [1989]/ $2.36/ CV• WILDERNESS/ FS9, RPA1/ $1.92 [1989]/ $2.36/ CV
68. Hansen, C. 1977. A report on the value of wildlife. Ogden, UT: USDA Forest Service, Intermountain Region,Miscellaneous Publication 1365.
• See appendix B table B5. BIG GAME, SMALL GAME, and WATERFOWL HUNTING, and FISHING/ 31ESTIMATES.
69. Hansen, W., A. Mills, J. Stoll, R. Freeman, and C. Hankamer. 1990. A case study application of thecontingent valuation method for estimating urban recreation and benefits. U.S. Army Corp of Engineers,IWR Report 90-R-11.
• HIKING/ FS8, RPA2/ $1.14 [1986]/ $1.56/ CV
70. Harpman, D., E. Sparling, and T. Waddle. 1993. A methodology for quantifying and valuing the impacts offlow changes on a fishery. Water Resources Research 29:575-582.
• FISHING/ FS2, RPA3/ $8.94 [1989]/ $10.96/ CV
71. Haspel, A., F.R. Johnson. 1982. Multiple destination trip bias in recreation benefit estimation. Land Economics58:364-372.
• SIGHTSEEING/ FS3, RPA3/ $6.17 [1980]/ $11.25/ Zonal TC• SIGHTSEEING/ FS3, RPA3/ $7.24 [1980]/ $13.21/ CV• SIGHTSEEING/ FS3, RPA3/ $5.54 [1980]/ $10.11/ Zonal TC

35USDA Forest Service Gen. Tech. Rep. RMRS-GTR-72. 2001
Rosenberger and LoomisBenefit Transfer of Outdoor Recreation Use Values
72. Hausman, J.A., G.K. Leonard, and D. McFadden. 1995. A utility-consistent, combined discrete choice andcount data model assessing recreational use losses due to natural resource damage. Journal of Public Economics56:1-30.
• FLOAT BOATING/ FS10, RPA5/ $12.34 [1989]/ $15.13/ RUM/MNL• HIKING/ FS10, RPA5/ $10.54 [1989]/ $12.93/ RUM/MNL• WATERFOWL HUNTING/ FS10, RPA5/ $49.00 [1989]/ $60.08/ RUM/MNL
73. Hay, J.M. 1988. Net economic values of non-consumptive wildlife-related recreation. Washington, DC: USDI,Fish and Wildlife Service. Report 85-2.
• See appendix B table B6. WILDLIFE VIEWING/ 50 ESTIMATES.
74. Hellerstein, D.M. 1991. Using count data models in travel cost analysis with aggregate data. American Journalof Agricultural Economics 73:861-867.
• FLOAT BOATING/ FS9, RPA1/ $15.82 [1980]/ $28.84/ Zonal TC• WILDERNESS/ FS9, RPA1/ $15.82 [1980]/ $28.84/ Zonal TC
75. Hushak, L., J. Winslow, and N. Dutta. 1984. Economic value of Lake Erie sport fishing to private-boatanglers. Ohio State University.
• FISHING/ FS9, RPA1/ $4.16 [1981]/ $6.53/ Individual TC• FISHING/ FS9, RPA1/ $23.79 [1981]/ $39.64/ Individual TC
76. Hushak, L., J. Winslow, and N. Dutta. 1988. Economic value of Great Lakes sportfishing: The case of private-boat fishing in Ohio’s Lake Erie. Transactions of the American Fisheries Society 117:363-373.
• FISHING/ FS9, RPA1/ $1.61 [1981]/ $2.69/ Individual TC• FISHING/ FS9, RPA1/ $2.23 [1981]/ $3.72/ Individual TC
77. *Johnson, D.M., and R.G. Walsh. 1987. Economic benefits and costs of the fish stocking program at Blue MesaReservoir, Colorado. Fort Collins, CO: Colorado Water Resources Research Institute, Colorado State Univer-sity, Technical Report No. 49.
• SIGHTSEEING/ FS2, RPA3/ $17.48 [1986]/ $23.86/ CV
78. *Kalter, R., and L. Gosse. 1969. Outdoor recreation in New York states: Projections of demand, economic value,and pricing effects for the period 1970-1985. Ithaca, NY: Cornell University, Special Cornell Series No. 5.
• CAMPING/ FS9, RPA1/ $6.50 [1965]/ $28.66/ Zonal TC• SWIMMING/ FS9, RPA1/ $9.47 [1965]/ $41.75/ Zonal TC• MOTOR BOATING/ FS9, RPA1/ $15.14 [1965]/ $66.75/ Zonal TC• HIKING/ FS9, RPA1/ $16.00 [1965]/ $70.54/ Zonal TC
79. Kealy, M.J., and R. Bishop. 1986. Theoretical and empirical specifications issues in travel cost demand studies.American Journal of Agricultural Economics 68:660-667.
• FISHING/ FS9, RPA1/ $19.52 [1978]/ $42.19/ Zonal TC
80. *Keith, J.E. 1980. Snowmobiling and cross-country skiing conflicts in Utah: Some initial research results.Proceedings of the North American Symposium on Dispersed Winter Recreation. St. Paul, MN: University ofMinnesota: 57-63.
• CROSS COUNTRY SKIING/ FS4, RPA3/ $10.00 [1978]/ $21.62/ Individual TC• SNOWMOBILING/ FS4, RPA3/ $42.00 [1976]/ $103.70/ Individual TC
81. *Keith, J., P. Halverson, and L. Fumworth. 1982. Valuation of a free flowing river: The Salt River, Arizona.Tucson, AZ: Utah State University of Arizona.
• FLOAT BOATING/ FS3, RPA3/ $23.79 [1981]/ $39.64/ Individual TC
82. King, D., and J. Hof. 1985. Experimental commodity definition in recreation travel cost models. Forest Science31:519-529.
• FISHING/ FS3, RPA3/ $84.91 [1980]/ $154.81/ Individual TC

36 USDA Forest Service Gen. Tech. Rep. RMRS-GTR-72. 2001
Rosenberger and Loomis Benefit Transfer of Outdoor Recreation Use Values
83. *King, D.A., T.C. Brown, T. Daniel, M.T. Richards, and W.P. Stewart. 1988. Personal Communication betweenD.A. King and R.G. Walsh. University of Arizona, Tucson.
• CAMPING/ FS3, RPA3/ $18.20 [1985]/ $25.49/ CV
84. *Klemperer, D.W., P.S. Verbyla, and L.D. Jouner. 1984. Valuing white-water river recreation by the travel costmethod. National River Recreation Symposium, Baton Rouge, LA: 709-719.
• FLOAT BOATING/ FS8, RPA2/ $7.55 [1979]/ $15.04/ Individual TC
85. *Knetsch, J., R. Brown, and W. Hansen. 1976. Estimating expected use and value of recreation sites. InC. Gearing, W. Swart, and T. Var (eds.), Planning for Tourism Development: Quantitative Approaches.New York, NY: Proeger.
• PICNICKING/ FS5, RPA4/ $3.33 [1969]/ $12.66/ Zonal TC
86. *Leuschner, W.A., P.S. Cook, J.W. Roggenbuck, and R.G. Oderwald. 1987. A comparative analysis forwilderness user fee policy. Journal of Leisure Research 19:101-114.
• CAMPING/ FS8, RPA2/ $2.15 [1983]/ $3.23/ Zonal TC
87. Leuschner, W., and R. Young. 1978. Estimating the southern pine beetle’s impact on reservoir campsites. ForestScience 24:527-537.
• CAMPING/ FS8, RPA2/ $1.41 [1973]/ $4.40/ Zonal TC• CAMPING/ FS8, RPA2/ $1.89 [1973]/ $5.88/ Zonal TC• CAMPING/ FS8, RPA2/ $0.88 [1973]/ $2.75/ Zonal TC• CAMPING/ FS8, RPA2/ $1.15 [1973]/ $3.60/ Zonal TC
88. Loomis, J. 1979. Estimation of recreational benefits from Grand Gulch primitive area. Moad, UT: USDI Bureauof Land Management.
• GENERAL RECREATION/ FS4, RPA3/ $92.53 [1977]/ $214.59/ Zonal TC• WILDERNESS/ FS4, RPA3/ $92.53 [1977]/ $214.59/ Zonal TC
89. Loomis, J. 1982. Use of travel cost models for evaluation lottery rationed recreation: Application to big gamehunting. Journal of Leisure Research 14:117-124.
• BIG GAME HUNTING/ FS4, RPA3/ $20.77 [1979]/ $41.37/ Zonal TC
90. Loomis, J., D. Donnelly, C. Sorg, and L. Oldenburg. 1985. Net economic value of hunting unique species inIdaho: Bighorn sheep, mountain goat, moose, and antelope. Fort Collins, CO: USDA Forest Service, RockyMountain Forest and Range Experiment Station, General Technical Report RM-10.
• BIG GAME HUNTING/ FS4, RPA3/ $90.00 [1982]/ $141.09/ Zonal TC• BIG GAME HUNTING/ FS4, RPA3/ $19.12 [1982]/ $29.97/ Zonal TC• BIG GAME HUNTING/ FS4, RPA3/ $27.80 [1982]/ $43.58/ Zonal TC• BIG GAME HUNTING/ FS4, RPA3/ $38.58 [1982]/ $60.48/ Zonal TC• BIG GAME HUNTING/ FS4, RPA3/ $48.00 [1982]/ $75.25/ Zonal TC• BIG GAME HUNTING/ FS4, RPA3/ $14.83 [1982]/ $23.25/ Zonal TC• BIG GAME HUNTING/ FS4, RPA3/ $31.16 [1982]/ $48.85/ Zonal TC• BIG GAME HUNTING/ FS4, RPA3/ $10.24 [1982]/ $16.05/ Zonal TC
91. Loomis, J., D. Updike, and W. Unkel. 1989. Consumption and nonconsumption values of a game animal: Thecase of California deer. Transactions of the North American Wildlife and Natural Resource Conference 54:640-650.
• BIG GAME HUNTING/ FS5, RPA4/ $69.00 [1987]/ $91.38/ CV• WILDLIFE VIEWING/ FS5, RPA4/ $15.00 [1987]/ $19.87/ CV
92. Loomis, J., and J. Cooper. 1988. The economic value of antelope hunting in Montana. Montana Departmentof Fish, Wildlife, and Parks.
• BIG GAME HUNTING/ FS1, RPA3/ $62.00 [1985]/ $86.85/ Zonal TC

37USDA Forest Service Gen. Tech. Rep. RMRS-GTR-72. 2001
Rosenberger and LoomisBenefit Transfer of Outdoor Recreation Use Values
93. Loomis, J., J. Cooper, and S. Allen. 1988. The Montana elk hunting experience: A contingent valuationassessment of economic benefits to hunter. Helena, MT: Montana Department of Fish, Wildlife, and Parks.
• BIG GAME HUNTING/ FS1, RPA3/ $39.90 [1986]/ $54.47/ CV• BIG GAME HUNTING/ FS1, RPA3/ $14.24 [1986]/ $19.44/ CV
94. Loomis, J., M. Creel, and J. Cooper. 1989. Economic benefits of deer in California: Hunting and viewing values.Davis, CA: College of Agricultural and Environmental Sciences, University of California.
• BIG GAME HUNTING/ FS5, RPA4/ $36.96 [1987]/ $48.95/ CV• BIG GAME HUNTING/ FS5, RPA4/ $13.18 [1987]/ $17.45/ Individual TC• WILDLIFE VIEWING/ FS5, RPA4/ $5.10 [1987]/ $6.76/ CV
95. Loomis, J., and M. Feldman. 1995. An economic approach to giving “equal consideration” to environmentalvalues in FERC hydropower reliscensing. Rivers 5:96-108.
• SIGHTSEEING/ FS4, RPA3/ $0.95 [1994]/ $0.99/ CV• SIGHTSEEING/ FS4, RPA3/ $0.52 [1994]/ $0.54/ CV• SIGHTSEEING/ FS4, RPA3/ $1.54 [1994]/ $1.61/ CV
96. Markstrom, D., and D. Rosenthal. 1987. Demand and value of firewood permits as determined by the travelcost method. Western Journal of Applied Forestry 2:48-50.
• GENERAL RECREATION/ FS2, RPA3/ $16.07 [1982]/ $25.18/ Zonal TC
97. Martin, W., F. Bollman, and R. Gum. 1982. Economic value of Lake Mead fishing. Fisheries 7:20-24.
• FISHING/ FS3, RPA3/ $11.74 [1978]/ $25.39/ Individual TC
98. Martin, W., R. Gum, and A. Smith. 1974. The demand for and value of hunting, fishing, and general ruraloutdoor recreation in Arizona. Tucson, AZ: Agricultural Experiment Station, University of Arizona.
• CAMPING/ FS3, RPA3/ $7.09 [1970]/ $25.59/ Individual TC• BIG GAME HUNTING/ FS3, RPA3/ $3.21 [1970]/ $11.60/ Individual TC• BIG GAME HUNTING/ FS3, RPA3/ $3.49 [1970]/ $12.60/ Individual TC• SMALL GAME HUNTING/ FS3, RPA3/ $1.45 [1970]/ $5.24/ Individual TC• WATERFOWL HUNTING/ FS3, RPA3/ $0.60 [1970]/ $2.17/ Individual TC• FISHING/ FS3, RPA3/ $12.22 [1970]/ $44.09/ Individual TC• FISHING/ FS3, RPA3/ $5.56 [1970]/ $20.08/ Individual TC
99. May, J.A. 1997. Measuring consumer surplus of Wyoming snowmobilers using the travel cost method.Master’s Thesis. University of Wyoming.
• SNOWMOBILING/ FS2, RPA3/ $36.30 [1996]/ $36.23/ Individual TC
100. McCollum, D., A. Gilbert, and G. Peterson. 1990. The net econmic value of day use cross country skiing inVermont: A dichotomous choice contingent valuation approach. Journal of Leisure Research 22:341-352.
• CROSS COUNTRY SKIING/ FS9, RPA1/ $18.69 [1987]/ $24.75/ CV• CROSS COUNTRY SKIING/ FS9, RPA1/ $24.85 [1987]/ $32.91/ CV
101. McCollum, D.W., G.L. Peterson, J.R. Arnold, D.C. Markstrom, and D.M. Hellerstein. 1990. The net economicvalue of recreation on the national forests: Twelve types of primary activity trips across nine Forest Serviceregions. Fort Collins, CO: USDA Forest Service, Rocky Mountain Forest and Range Experiment Station,Research Paper RM-89.
• See appendix B table B7. VARIOUS ACTIVITIES/ 33 ESTIMATES.
102. McCollum, D.W., R.C. Bishop, and M.P. Welsh. 1988. A probabilistic travel cost model. Madison, WI:Department of Agricultural Economics, University of Wisconsin.
• BIG GAME HUNTING/ FS9, RPA1/ $42.80 [1984]/ $62.01/ Zonal TC• BIG GAME HUNTING/ FS9, RPA1/ $40.04 [1984]/ $58.01/ Zonal TC• BIG GAME HUNTING/ FS9, RPA1/ $42.80 [1984]/ $62.01/ Zonal TC• BIG GAME HUNTING/ FS9, RPA1/ $69.70 [1984]/ $100.99/ Zonal TC• BIG GAME HUNTING/ FS9, RPA1/ $35.11 [1984]/ $50.87/ Zonal TC

38 USDA Forest Service Gen. Tech. Rep. RMRS-GTR-72. 2001
Rosenberger and Loomis Benefit Transfer of Outdoor Recreation Use Values
103. McCollum, D.W., and S.M. Miller. 1994. Alaska voter, Alaska hunters and Alaska non-resident hunters: Theirwildlife related trip characteristics and economics. Anchorage, AK: Alaska Department of Fish and Game.
• BIG GAME HUNTING/ FS10, RPA5/ $42.88 [1991]/ $48.47/ CV• BIG GAME HUNTING/ FS10, RPA5/ $49.35 [1991]/ $55.78/ CV• BIG GAME HUNTING/ FS10, RPA5/ $41.88 [1991]/ $47.34/ CV• WILDLIFE VIEWING/ FS10, RPA5/ $46.82 [1991]/ $52.92/ CV• WILDLIFE VIEWING / FS10, RPA5/ $53.63 [1991]/ $60.62/ CV• WILDLIFE VIEWING / FS10, RPA5/ $62.22 [1991]/ $70.33/ CV
104. McConnell, K. 1979. Values of marine recreational fishing: Measurement and impact of management.American Journal of Agricultural Economics 61:921-925.
• FISHING/ FS9, RPA1/ $85.35 [1978]/ $184.48/ Individual TC
105. Mendelsohn, R. 1987. Measuring the value of recreation in the White Mountains. Appalachia 46:73-84.
• CAMPING/ FS9, RPA1/ $4.54 [1985]/ $6.36/ Zonal TC
106. Menz, F., and D. Wilton. 1983a. Alternative ways to measure recreation values by the travel cost method.American Journal of Agricultural Economics 65:332-336.
• FISHING/ FS9, RPA1/ $25.68 [1976]/ $63.41/ Individual TC
107. Menz, F., and D. Wilton. 1983b. An economic study of the muskellunge fishery in New York. New York Fishand Game Journal 30:??.
• FISHING/ FS9, RPA1/ $14.89 [1976]/ $36.77/ Zonal TC• FISHING/ FS9, RPA1/ $19.03 [1976]/ $46.99/ Zonal TC• FISHING/ FS9, RPA1/ $17.52 [1976]/ $43.26/ Zonal TC
108. Michaelson, E. 1977. An attempt to quantify the esthetics of wild and scenic rivers in Idaho. St. Paul, MN:USDA Forest Service, North Central Forest Experiment Station, General Technical Report NC-28: 320-328.
• CAMPING/ FS4, RPA3/ $31.20 [1971]/ $97.22/ Individual TC• CAMPING/ FS4, RPA3/ $9.00 [1971]/ $30.88/ Individual TC• FLOAT BOATING/ FS4, RPA3/ $10.36 [1971]/ $35.55/ Individual TC• FLOAT BOATING/ FS4, RPA3/ $76.85 [1971]/ $263.68/ Zonal TC
109. *Michaelson, E., and C. Gilmour. 1978. Estimating the demand for outdoor recreation in the Sawtooth Valley,Idaho. Moscow, ID: Agricultural Experiment Station, University of Idaho, Research Bulletin No. 107.
• CAMPING/ FS4, RPA3/ $3.73 [1971]/ $12.80/ Individual TC
110. Miller, J., and M. Hay. 1984. Estimating sub-state values for fishing and hunting. Transactions of the NorthAmerican Wildlife and Natural Resources Conference 49:345-355.
• BIG GAME HUNTING/ FS9, RPA1/ $35.00 [1980]/ $63.82/ Individual TC• SMALL GAME HUNTING/ FS2, RPA3/ $30.00 [1980]/ $54.70/ Individual TC• FISHING/ FS9, RPA1/ $23.00 [1980]/ $41.94/ Individual TC• FISHING/ FS3, RPA3/ $35.00 [1980]/ $63.82/ Individual TC• FISHING/ FS9, RPA1/ $29.00 [1980]/ $52.88/ Individual TC• FISHING/ FS4, RPA3/ $27.00 [1980]/ $49.23/ Individual TC• FISHING/ FS8, RPA2/ $30.00 [1980]/ $54.70/ Individual TC
111. Moncur, J.E. 1975. Estimating the value of alternative outdoor recreation facilities within a small area. Journalof Leisure Research 7:301-311.
• GENERAL RECREATION/ FS5, RPA4/ $0.36 [1972]/ $1.18/ Zonal TC
112. Morey, E. 1985. Characteristics, consumer surplus, and new activities. Journal of Public Economics 26:221-236.
• DOWNHILL SKIING/ FS2, RPA3/ $3.15 [1968]/ $12.54/ RUM/MNL

39USDA Forest Service Gen. Tech. Rep. RMRS-GTR-72. 2001
Rosenberger and LoomisBenefit Transfer of Outdoor Recreation Use Values
113. Morey, E., R. Rowe, and M. Watson. 1991. An extended discrete-choice model of Atlantic salmon fishing: Withtheoretical and empirical comparisons to standard travel-cost models. Boulder, CO: Department of Econom-ics, University of Colorado.
• FISHING/ FS9, RPA1/ $78.36 [1988]/ $100.12/ RUM/MNL
114. Mullen, J., and F. Menz. 1985. The effect of acidification damages on the economic value of the Adirondackfishing to New York anglers. American Journal of Agricultural Economics 67:112-119.
• FISHING/ FS9, RPA1/ $12.67 [1976]/ $31.28/ Zonal TC• FISHING/ FS9, RPA1/ $20.98 [1976]/ $51.80/ Zonal TC
115. Palm, R., and S. Malvestuto. 1983. Relationships between economic benefit and sport-fishing effort on WestPoint reservoir, Alabama-Georgia. Transactions of the American Fisheries Society 112:71-78.
• FISHING/ FS8, RPA2/ $8.90 [1980]/ $16.23/ Individual TC
116. Park, T., J. Loomis, and M. Creel. 1991. Confidence intervals for evaluating benefits estimates from dichoto-mous choice contingent valuation studies. Land Economics 67:64-73.
• BIG GAME HUNTING/ FS1, RPA3/ $29.73 [1986]/ $40.61/ CV
117. Peterson, G.L., and J.R. Arnold. 1987. The economic benefits of mountain running the Pike’s Peak marathon.Journal of Leisure Research 19:84-100.
• OTHER RECREATION/ FS2, RPA3/ $34.25 [1984]/ $49.62/ Zonal TC• OTHER RECREATION/ FS2, RPA3/ $36.51 [1984]/ $52.90/ Zonal TC• OTHER RECREATION/ FS2, RPA3/ $18.48 [1984]/ $26.78/ Zonal TC
118. *Peterson, G.L., R.G. Walsh, and J.R. McKean. 1988. The discriminatory impact of recreation price. Fort Collins,CO: USDA Forest Service, Rocky Mountain Forest and Range Experiment Station, Unpublished paper.
• CAMPING/ FS9, RPA1/ $6.34 [1980]/ $11.56/ Zonal TC• CAMPING/ FS9, RPA1/ $19.64 [1980]/ $35.81/ Zonal TC• WILDERNESS/ FS9, RPA1/ $6.34 [1980]/ $11.56/ Zonal TC• WILDERNESS/ FS9, RPA1/ $19.64 [1980]/ $35.81/ Zonal TC
119. *Prince, R. 1988. Estimating recreation benefits under congestion, uncertainty, and disequilibrium.Harrisonburg, VA: Department of Economics, James Madison University.
• HIKING/ FS8, RPA2/ $12.00 [1984]/ $17.39/ CV• WILDERNESS/ FS8, RPA2/ $12.00 [1984]/ $17.39/ CV
120. Ribaudo, M., and D. Epp. 1984. The importance of sample discrimination in using the travel cost method toestimate the benefits of improved water quality. Land Economics 60:397-403.
• SWIMMING/ FS9, RPA1/ $3.52 [1982]/ $5.52/ Individual TC
121. Richards, M., D.B. Wood, and D. Coyler. 1985. Sport fishing at Lees Ferry, Arizona: User differences andeconomic values. Flagstaff, AZ: Northern Arizona University.
• FISHING/ FS3, RPA3/ $120.82 [1982]/ $189.40/ Individual TC
122. Richards, M., and T. Brown. 1992. Economic value of campground visits in Arizona. Fort Collins, CO: USDAForest Service, Rocky Mountain Forest and Range Experiment Station, Research Paper RM-305.
• CAMPING/ FS3, RPA3/ $8.16 [1985]/ $11.43/ Zonal TC
123. Roberts, K., M. Thompson, and P. Pawlyk. 1985. Contingent valuation of recreational diving at petroleum rigs,Gulf of Mexico. Transactions of the American Fisheries Society 114:214-219.
• OTHER RECREATION/ FS8, RPA2/ $28.60 [1981]/ $47.66/ CV
124. Rosenthal, D. 1987. The necessity for substitute prices in recreation demand analysis. American Journal ofAgricultural Economics 69:828-837.
• MOTOR BOATING/ FS2, RPA3/ $4.04 [1982]/ $6.33/ Zonal TC• MOTOR BOATING/ FS2, RPA3/ $2.81 [1982]/ $4.41/ Zonal TC

40 USDA Forest Service Gen. Tech. Rep. RMRS-GTR-72. 2001
Rosenberger and Loomis Benefit Transfer of Outdoor Recreation Use Values
125. *Rosenthal, D.H., and H.K. Cordell. 1984. Pricing river recreation: Some issues and concerns. National Riverand Recreation Symposium, Baton Rouge, LA: School of Landscape Architecture, Louisiana State University:272-284.
• FLOAT BOATING/ FS9, RPA1/ $8.40 [1979]/ $16.73/ Zonal TC• FLOAT BOATING/ FS4, RPA3/ $49.75 [1979]/ $99.09/ Zonal TC
126. Rosenthal, D., and R. Walsh. 1986. Hiking values and the recreation opportunity spectrum. Forest Science32:405-415.
• HIKING/ FS2, RPA3/ $23.05 [1981]/ $38.41/ CV
127. Rowe, R., E. Morey, A. Ross, and W.D. Shaw. 1985. Valuing marine recreational fishing on the Pacific coast.Washington, DC: USDC National Marine Fisheries Service, Report LJ-85-18C.
• FISHING/ FS6, RPA4/ $6.67 [1981]/ $11.11/ RUM/MNL• FISHING/ FS5, RPA4/ $2.21 [1981]/ $3.69/ RUM/MNL• FISHING/ FS5, RPA4/ $51.76 [1981]/ $86.25/ RUM/MNL• FISHING/ FS6, RPA4/ $42.11 [1981]/ $70.17/ RUM/MNL• FISHING/ FS6, RPA4/ $48.62 [1981]/ $81.03/ RUM/MNL• FISHING/ FS6, RPA4/ $5.41 [1981]/ $9.02/ RUM/MNL
128. Samples, K., and R. Bishop. 1985. Estimating the value of variations in anglers’ success rates: An applicationof the multiple-site travel cost method. Marine Resource Economics 21:55-74.
• FISHING/ FS9, RPA1/ $0.80 [1978]/ $1.73/ Zonal TC
129. Sanders, L., R. Walsh, and J. McKean. 1991. Comparable estimates of the recreational value of rivers. WaterResources Research 27:1387-1394.
• OTHER RECREATION/ FS2, RPA3/ $24.38 [1983]/ $36.66/ CV• OTHER RECREATION/ FS2, RPA3/ $23.41 [1983]/ $35.21/ CV• OTHER RECREATION/ FS2, RPA3/ $23.44 [1983]/ $35.25/ CV
130. Shafer, E., and M. Wang. 1989. Economic amenity values of fish and wildlife resources. State College, PA: PennState University.
• FISHING/ FS9, RPA1/ $9.96 [1988]/ $12.73/ Individual TC• WILDLIFE VIEWING/ FS9, RPA1/ $7.74 [1988]/ $9.89/ CV• WILDLIFE VIEWING/ FS9, RPA1/ $2.64 [1988]/ $3.37/ CV• GENERAL RECREATION/ FS9, RPA1/ $1.28 [1988]/ $1.64/ CV
131. Shaw, W. D., and P. Jakus. 1996. Travel cost models of the demand for rock climbing. Paper presented at theWestern Regional Research Publication W-133, Benefits and Costs in Natural Resources Planning.
• ROCK CLIMBING/ FS9, RPA1/ $80.00 [1993]/ $85.74/ RUM/MNL
132. Siderelis, C., G. Brothers, and P. Rea. 1995. A boating choice model for the valuation of lake access. Journal ofLeisure Research 27:264-282.
• MOTOR BOATING/ FS8, RPA2/ $5.24 [1992]/ $5.76/ RUM/MNL• MOTOR BOATING/ FS8, RPA2/ $10.03 [1992]/ $11.03/ RUM/MNL
133. Siderelis, C., and R. Moore. 1995. Outdoor recreation net benefits of rail-trails. Journal of Leisure Research27:344-359.
• BIKING/ FS9, RPA1/ $30.18 [1991]/ $34.11/ Individual TC• BIKING/ FS8, RPA2/ $49.78 [1991]/ $56.27/ Individual TC• HIKING/ FS5, RPA4/ $4.81 [1991]/ $5.44/ Individual TC
134. Silberman, J., and M. Klock. 1989. The behavior of respondents in contingent valuation: Evidence on startingbids. Journal of Behavioral Economics 18:51-60.
• SWIMMING/ FS9, RPA1/ $1.00 [1980]/ $1.83/ CV

41USDA Forest Service Gen. Tech. Rep. RMRS-GTR-72. 2001
Rosenberger and LoomisBenefit Transfer of Outdoor Recreation Use Values
135. Smith, V.K., and R. Kopp. 1980. A regional recreation demand and benefits model. Land Economics 56:64-72.
• WILDLIFE VIEWING/ FS5, RPA4/ $1.80 [1972]/ $5.91/ Zonal TC• WILDERNESS/ FS5, RPA4/ $1.80 [1972]/ $5.91/ Zonal TC
136. SMS Research. 1983. Experimental valuation of recreational fishing in Hawaii. Washington, DC: USDCNational Marine Fisheries Service, Report H-83-11C.
• FISHING/ FS5, RPA4/ $41.00 [1985]/ $57.43/ CV
137. Sorg, C., J. Loomis, D. Donnelly, G. Peterson, and L. Nelson. 1985. Net economic value of cold and warm waterfishing in Idaho. Fort Collins, CO: USDA Forest Service, Rocky Mountain Forest and Range ExperimentStation, Resource Bulletin RM-11.
• FISHING/ FS4, RPA3/ $26.20 [1982]/ $41.07/ Zonal TC• FISHING/ FS4, RPA3/ $14.25 [1982]/ $22.34/ CV• FISHING/ FS4, RPA3/ $12.95 [1982]/ $20.30/ CV• FISHING/ FS4, RPA3/ $25.55 [1982]/ $40.06/ Zonal TC
138. Sorg, C., and L. Nelson. 1986. Net economic value of elk hunting in Idaho. Fort Collins, CO: USDA ForestService, Rocky Mountain Forest and Range Experiment Station, Resource Bulletin RM-12.
• BIG GAME HUNTING/ FS4, RPA3/ $35.15 [1982]/ $55.10/ Zonal TC• BIG GAME HUNTING/ FS4, RPA3/ $22.57 [1983]/ $33.94/ CV• BIG GAME HUNTING/ FS4, RPA3/ $22.24 [1982]/ $34.87/ Zonal TC
139. Stoll, J., and L.A. Johnson. 1984. Concepts of value, nonmarket valuation and the case of the whooping crane.Transactions of the North American Wildlife and Natural Resources Conference 49:382-393.
• WILDLIFE VIEWING/ FS8, RPA2/ $1.52 [1982]/ $2.38/ CV
140. Strong, E. 1983. A note on the functional form of travel cost models with zones of unequal populations. LandEconomics 59:342-349.
• FISHING/ FS6, RPA4/ $21.06 [1977]/ $48.83/ Zonal TC
141. Sublette, W., and W. Martin. 1975. Outdoor recreation in the Salt-Verde Basin of central Arizona: Demand andvalue. Tucson, AZ: Agricultural Experiment Station, University of Arizona.
• CAMPING/ FS3, RPA3/ $2.75 [1972]/ $9.06/ Individual TC• CAMPING/ FS3, RPA3/ $0.51 [1972]/ $1.69/ CV• FISHING/ FS3, RPA3/ $15.85 [1972]/ $52.18/ Individual TC• FISHING/ FS3, RPA3/ $8.43 [1972]/ $27.75/ Individual TC• FISHING/ FS3, RPA3/ $16.15 [1972]/ $53.14/ Individual TC
142. Sutherland, R. 1982. The sensitivity of travel cost estimates of recreation demand to the functional form anddefinition of origin zones. Western Journal of Agricultural Economics 7:87-98.
• MOTOR BOATING/ FS6, RPA4/ $5.22 [1979]/ $10.40/ Zonal TC
143. Teasley, R.J., and J.C. Bergstrom. 1992. Estimating revenue-capture potential with public area recreation.Athens, GA: University of Georgia.
• GENERAL RECREATION/ FS8, RPA2/ $3.80 [1992]/ $4.18/ CV• GENERAL RECREATION/ FS8, RPA2, $4.52 [1992]/ $4.97/ Zonal TC
144. Vaughan, W., and C. Russell. 1982. Valuing a fishing day: An application of a systematic varying parametermodel. Land Economics 58:450-463.
• FISHING/ National/ $24.09 [1979]/ $47.98/ Individual TC• FISHING/ National/ $16.03 [1979]/ $31.93/ Individual TC• FISHING/ National/ $24.09 [1979]/ $47.98/ Individual TC• FISHING/ National/ $10.62 [1979]/ $21.15/ Individual TC

42 USDA Forest Service Gen. Tech. Rep. RMRS-GTR-72. 2001
Rosenberger and Loomis Benefit Transfer of Outdoor Recreation Use Values
145. Waddington, D.G., K.J. Boyle, and J. Cooper. 1991. 1991 Net economic values for bass and trout fishing, deerhunting, and wildlife watching. Washington, DC: USFWS Division of Federal Aid.
• See appendix B table B8. BIG GAME HUNTING AND WILDLIFE VIEWING/ 96 ESTIMATES.
146. *Wade, W., G.M. McCollister, R.J. McCann, and G.M. Jones. 1988. Estimating recreation benefits forinstream and diverted users of waterfowls of the Sacramento-San Joaquin rivers watershed. Paperpresented at the Western Regional Research Publication W-133, Benefits and Costs in Natural ResourcesPlanning, Monterey, CA.
• SWIMMING/ FS5, RPA4/ $15.84 [1985]/ $22.19/ Zonal TC• SWIMMING/ FS5, RPA4/ $35.04 [1985]/ $49.08/ Zonal TC• MOTOR BOATING/ FS3, RPA3/ $34.64 [1985]/ $48.52/ Zonal TC• MOTOR BOATING/ FS3, RPA3/ $24.28 [1985]/ $34.01/ Zonal TC
147. Walsh, R.G., F.A. Ward, and J.P. Olienyk. 1989. Recreation demand for trees in National Forests. Journal ofEnvironmental Management 28:255-268.
• GENERAL RECREATION/ FS2, RPA3/ $7.70 [1980]/ $14.04/ CV• GENERAL RECREATION/ FS2, RPA3/ $8.37 [1980]/ $15.26/ Zonal TC• GENERAL RECREATION/ FS2, RPA3/ $6.56 [1980]/ $11.96/ Zonal TC
148. *Walsh, R.G., and G.J. Davitt. 1983. A demand function for length of stay on ski trips to Aspen. Journal of TravelResearch 22:23-29.
• DOWNHILL SKIING/ FS2, RPA3/ $24.33 [1978]/ $52.59/ CV
149. *Walsh, R.G., J.B. Loomis, and R.S. Gillman. 1984. Valuing option, existence, and bequest demand forwilderness. Land Economics 60:14-29.
• CROSS COUNTRY SKIING/ FS2, RPA3/ $12.50 [1980]/ $22.79/ CV
150. *Walsh, R.G., and J.P. Olienyk. 1981. Recreation demand effects of mountain pine beetle damage to the qualityof forest recreation resources in the Colorado Front Range. Fort Collins, CO: Department of Economics,Colorado State University.
• CAMPING/ FS2, RPA3/ $5.59 [1980]/ $10.19/ CV• CAMPING/ FS2, RPA3/ $7.99 [1980]/ $14.57/ CV• PICNICKING/ FS2, RPA3/ $6.22 [1980]/ $11.34/ CV• OFF ROAD DRIVING/ FS2, RPA3/ $6.45 [1980]/ $11.76/ CV• HIKING/ FS2 RPA3/ $9.51 [1980]/ $17.34/ CV
151. *Walsh, R.G., L.D. Sanders, and J.B. Loomis. 1985. Wild and scenic river economics: Recreation use andpreservation values. Fort Collins, CO: Department of Agricultural and Resource Economics, Colorado StateUniversity.
• GENERAL RECREATION/ FS2, RPA3/ $22.00 [1983]/ $33.08/ Individual TC• GENERAL RECREATION/ FS2, RPA3/ $24.00 [1983]/ $36.09/ CV• WILDERNESS/ FS2, RPA3/ $22.00 [1983]/ $33.08/ Individual TC• WILDERNESS/ FS2, RPA3/ $24.00 [1983]/ $36.09/ CV
152. *Walsh, R.G., L.D. Sanders, and J.R. McKean. 1987. The value of travel time as a negative function of distance.Fort Collins, CO: Department of Agricultural and Resource Economics, Colorado State University.
• SIGHTSEEING/ FS2, RPA3/ $9.10 [1983]/ $13.68/ CV
153. Walsh, R.G., and L. Gilliam. 1982. Benefits of wilderness expansion with excess demand for Indian Peaks.Western Journal of Agricultural Economics 7:1-12.
• SIGHTSEEING/ FS2, RPA3/ $18.29 [1979]/ $36.42/ CV• SIGHTSEEING/ FS2, RPA3/ $10.31 [1979]/ $20.53/ CV• WILDERNESS/ FS2, RPA3/ $18.29 [1979]/ $36.42/ CV• WILDERNESS/ FS2, RPA3/ $10.31 [1979]/ $20.53/ CV

43USDA Forest Service Gen. Tech. Rep. RMRS-GTR-72. 2001
Rosenberger and LoomisBenefit Transfer of Outdoor Recreation Use Values
154. Walsh, R.G., N. Miller, and L. Gilliam. 1983. Congestion and willingness to pay for expansion of skiingcapacity. Land Economics 59:195-210.
• DOWNHILL SKIING/ FS2, RPA3/ $18.61 [1980]/ $33.93/ CV
155. *Walsh, R.G., O. Radulaski, and L. Lee. 1984. Value of hiking and cross-country skiing in roaded andnonroaded areas of a national forest. In F. Kaiser, D. Schweitzer, and P. Brown (eds.), Economic Value Analysisof Multiple-Use Forestry: 176-187.
• HIKING/ FS2, RPA3/ $5.88 [1980]/ $10.71/ CV• CROSS COUNTRY SKIING/ FS2, RPA3/ $6.42 [1980]/ $11.71/ CV
156. *Walsh, R.G., R. Aukeman, and R. Milton. 1980. Measuring benefits and the economic value of water inrecreation on high country reservoirs. Fort Collins, CO: Colorado Water Resources Research Institute,Colorado State University.
• CAMPING/ FS2, RPA3/ $10.90 [1978]/ $23.56/ CV• CAMPING/ FS2, RPA3/ $22.00 [1978]/ $47.55/ CV• PICNICKING/ FS2, RPA3/ $10.90 [1978]/ $23.56/ CV• HIKING/ FS2, RPA3/ $13.72 [1978]/ $29.66/ CV
157. *Walsh, R.G., R. Ericson, D. Arosteguy, and M. Hansen. 1980. An empirical application of a model forestimating the recreation value of instream flow. Fort Collins, CO: Colorado Water Resources ResearchInstitute, Colorado State University.
• FLOAT BOATING/ FS2, RPA3/ $12.65 [1978]/ $27.34/ CV• FLOAT BOATING/ FS2, RPA3/ $10.94 [1978]/ $23.65/ CV
158. *Walsh, R.G., R. Gillman, and J. Loomis. 1981. Wilderness resource economic: Recreation use and preservationvalues. Fort Collins, CO: Department of Economics, Colorado State University.
• OTHER RECREATION/ FS2, RPA3/ $14.00 [1980]/ $25.53/ Individual TC• WILDERNESS/ FS2, RPA3/ $14.00 [1980]/ $25.53/ Individual TC
159. *Ward, F. 1982. The demand for and value of recreational use of water in southeastern New Mexico, 1978-79.Los Cruces, NM: Agricultural Experiment Station, New Mexico State University, Research Report No. 465.
• CAMPING/ FS3, RPA3/ $11.39 [1978]/ $24.62/ Individual TC• PICNICKING/ FS3, RPA3/ $11.39 [1978]/ $24.62/ Individual TC• SWIMMING/ FS3, RPA3/ $11.39 [1978]/ $24.62/ Individual TC• MOTOR BOATING/ FS3, RPA3/ $11.39 [1978]/ $24.62/ Individual TC
160. Weithman, S., and M. Haas. 1982. Socioeconomic value of the trout fishery in Lake Tanneycomo, Missouri.Transactions of the American Fisheries Society 111:223-230.
• FISHING/ FS9, RPA1/ $8.81 [1979]/ $17.55/ Zonal TC
161. Wilman, E. 1984. Benefits to deer hunters from forest management practices which provide deer habitat.Transactions of the North American Wildlife and Natural Resources Conference 49:334-344.
• BIG GAME HUNTING/ FS2, RPA3/ $33.69 [1980]/ $61.43/ Individual TC
162. Young, J., D. Donnelly, C. Sorg, J. Loomis, and L. Nelson. 1987. Net economic value of upland game huntingin Idaho. Fort Collins, CO: USDA Forest Service, Rocky Mountain Forest and Range Experiment Station,Resource Bulletin RM-15.
• SMALL GAME HUNTING/ FS4, RPA3/ $28.50 [1982]/ $44.68/ Zonal TC• SMALL GAME HUNTING/ FS4, RPA3/ $22.45 [1982]/ $35.20/ CV• SMALL GAME HUNTING/ FS4, RPA3/ $19.02 [1982]/ $29.82/ Zonal TC
163. Ziemer, R., W. Musser, and C. Hill. 1980. Recreation demand equations: Functional form and consumersurplus. American Journal of Agricultural Economics 62:136-141.
• FISHING/ FS8, RPA2/ $26.46 [1971]/ $90.79/ Individual TC

44 USDA Forest Service Gen. Tech. Rep. RMRS-GTR-72. 2001
Rosenberger and Loomis Benefit Transfer of Outdoor Recreation Use Values
Appendix B: Summary of Multi-Estimate Studies in Appendix A, AnnotatedBibliography
Appendix B Table B1. Bibliography Entry #8, Bergstrom, J.C., and H.K. Cordell, 1991, An analysis ofthe demand for and value of outdoor recreation in the United States.
Activity Regionsa $ Original [1987]b $ Adjusted [1996]b Methodc
Camping National $8.70 $11.52 Zonal TCPicnicking National 11.85 15.69 Zonal TCSwimming National 14.82 19.63 Zonal TCSightseeing National 11.22 14.86 Zonal TCOff Road Driving National 15.06 19.94 Zonal TCMotor Boating National 21.62 28.63 Zonal TCFloat Boating National 21.40 28.34 Zonal TCHiking National 15.76 20.87 Zonal TCBiking National 13.30 17.61 Zonal TCDownhill Skiing National 14.81 19.61 Zonal TCCross Country Skiing National 9.57 12.67 Zonal TCBig Game Hunting National 12.07 15.98 Zonal TCSmall Game Hunting National 11.98 15.87 Zonal TCWildlife Viewing National 12.88 17.06 Zonal TCHorseback Riding National 11.40 15.10 Zonal TCOther Recreation National 13.11 17.36 Zonal TC
aFS=USDA Forest Service Region, CR=Census Region.bValues in per person per activity day.cTC=travel cost method, CV=contingent valuation method.

45USDA Forest Service Gen. Tech. Rep. RMRS-GTR-72. 2001
Rosenberger and LoomisBenefit Transfer of Outdoor Recreation Use Values
Appendix B Table B2. Bibliography Entry #9, Bergstrom, J.C., et al., 1996, Ecoregional estimates ofthe net economic values of outdoor recreational activities in the United States.
Activity Regionsa $ Original [1992]b $ Adjusted [1996]b Methodc
Camping FS9, RPA1 $43.25 $47.58 Individual TCCamping FS9, RPA1 31.65 34.82 Individual TCCamping FS8, RPA2 34.29 37.72 Individual TCCamping FS8, RPA2 47.03 51.73 Individual TCCamping FS8, RPA2 46.62 51.28 Individual TCCamping FS6, RPA4 57.03 62.73 Individual TCCamping FS5, RPA4 170.10 187.11 Individual TCPicnicking FS9, RPA1 78.75 86.63 Individual TCPicnicking FS8, RPA2 33.85 37.24 Individual TCPicnicking FS8, RPA2 21.64 23.80 Individual TCPicnicking FS2, RPA3 29.36 32.30 Individual TCPicnicking FS6, RPA4 26.32 28.95 Individual TCPicnicking FS5, RPA4 108.14 118.95 Individual TCSwimming FS8, RPA2 36.81 40.49 Individual TCSwimming FS6, RPA4 4.59 5.05 Individual TCSightseeing FS9, RPA1 158.92 174.81 Individual TCSightseeing FS8, RPA2 85.38 93.92 Individual TCSightseeing FS8, RPA2 75.70 83.27 Individual TCSightseeing FS8, RPA2 34.75 38.23 Individual TCSightseeing FS8, RPA2 19.75 21.73 Individual TCSightseeing FS6, RPA4 46.04 50.64 Individual TCOff Road Driving FS8, RPA2 3.97 4.37 Individual TCOff Road Driving FS6, RPA4 30.58 33.64 Individual TCMotor Boating FS2, RPA3 154.25 169.68 Individual TCFloat Boating FS9, RPA1 46.23 50.85 Individual TCFloat Boating FS9, RPA1 105.04 115.54 Individual TCFloat Boating FS8, RPA2 86.93 95.62 Individual TCFloat Boating FS8, RPA2 24.48 26.93 Individual TCFloat Boating FS2, RPA3 91.91 101.10 Individual TCHiking FS9, RPA1 69.02 75.92 Individual TCHiking FS8, RPA2 12.82 14.10 Individual TCHiking FS8, RPA2 50.85 55.94 Individual TCHiking FS2, RPA3 57.39 63.13 Individual TCHiking FS6, RPA4 11.22 12.34 Individual TCDownhill Skiing FS6, RPA4 19.00 20.90 Individual TCBig Game Hunting FS8, RPA2 29.30 32.23 Individual TCBig Game Hunting FS8, RPA2 4.31 4.74 Individual TCBig Game Hunting FS2, RPA3 43.52 47.87 Individual TCBig Game Hunting FS5, RPA4 18.56 20.42 Individual TCBig Game Hunting FS6, RPA4 4.74 5.21 Individual TCWildlife Viewing FS8, RPA2 13.74 15.11 Individual TCWildlife Viewing FS2, RPA3 58.05 63.86 Individual TCGeneral Recreation FS9, RPA1 35.37 38.91 Individual TCGeneral Recreation FS8, RPA2 6.59 7.25 Individual TCGeneral Recreation FS8, RPA2 15.16 16.68 Individual TCGeneral Recreation FS8, RPA2 70.80 77.88 Individual TCGeneral Recreation FS2, RPA3 90.00 99.00 Individual TCGeneral Recreation FS5, RPA4 39.41 43.35 Individual TCOther Recreation FS8, RPA2 29.42 32.36 Individual TCOther Recreation FS6, RPA4 56.42 62.06 Individual TC
aFS=USDA Forest Service Region, CR=Census Region.bValues in per person per activity day.cTC=travel cost method, CV=contingent valuation method.

46 USDA Forest Service Gen. Tech. Rep. RMRS-GTR-72. 2001
Rosenberger and Loomis Benefit Transfer of Outdoor Recreation Use Values
Appendix B Table B3. Bibliography Entry #23, Brown, G., and M. Hay, 1987, Net economicrecreation values for deer and waterfowl hunting and trout fishing.
Activity Regionsa $ Original [1985]b $ Adjusted [1996]b Methodc
Big Game Hunting FS9, RPA1 $22.00 $30.82 CVBig Game Hunting FS9, RPA1 15.00 21.01 CVBig Game Hunting FS9, RPA1 14.00 19.61 CVBig Game Hunting FS9, RPA1 20.00 28.01 CVBig Game Hunting FS9, RPA1 18.00 25.21 CVBig Game Hunting FS9, RPA1 13.00 18.21 CVBig Game Hunting FS9, RPA1 15.00 21.01 CVBig Game Hunting FS9, RPA1 21.00 29.42 CVBig Game Hunting FS9, RPA1 14.00 19.61 CVBig Game Hunting FS9, RPA1 18.00 25.21 CVBig Game Hunting FS9, RPA1 21.00 29.42 CVBig Game Hunting FS9, RPA1 22.00 30.82 CVBig Game Hunting FS9, RPA1 19.00 26.61 CVBig Game Hunting FS9, RPA1 20.00 28.01 CVBig Game Hunting FS9, RPA1 15.00 21.01 CVBig Game Hunting FS9, RPA1 17.00 23.81 CVBig Game Hunting FS9, RPA1 20.00 28.01 CVBig Game Hunting FS9, RPA1 18.00 25.21 CVBig Game Hunting FS9, RPA1 20.00 28.01 CVBig Game Hunting FS9, RPA1 16.00 22.41 CVBig Game Hunting FS8, RPA2 17.00 23.81 CVBig Game Hunting FS8, RPA2 16.00 22.41 CVBig Game Hunting FS8, RPA2 17.00 23.81 CVBig Game Hunting FS8, RPA2 21.00 29.42 CVBig Game Hunting FS8, RPA2 19.00 26.61 CVBig Game Hunting FS8, RPA2 15.00 21.01 CVBig Game Hunting FS8, RPA2 18.00 25.21 CVBig Game Hunting FS8, RPA2 20.00 28.01 CVBig Game Hunting FS8, RPA2 14.00 19.61 CVBig Game Hunting FS8, RPA2 26.00 36.42 CVBig Game Hunting FS8, RPA2 16.00 22.41 CVBig Game Hunting FS8, RPA2 15.00 21.01 CVBig Game Hunting FS8, RPA2 15.00 21.01 CVBig Game Hunting FS4, RPA3 28.00 39.22 CVBig Game Hunting FS4, RPA3 20.00 28.01 CVBig Game Hunting FS4, RPA3 20.00 28.01 CVBig Game Hunting FS3, RPA3 24.00 33.62 CVBig Game Hunting FS3, RPA3 28.00 39.22 CVBig Game Hunting FS2, RPA3 18.00 25.21 CVBig Game Hunting FS2, RPA3 22.00 30.82 CVBig Game Hunting FS2, RPA3 23.00 32.22 CVBig Game Hunting FS2, RPA3 16.00 22.41 CVBig Game Hunting FS2, RPA3 24.00 33.62 CVBig Game Hunting FS1, RPA3 23.00 32.22 CVBig Game Hunting FS1, RPA3 25.00 35.02 CVBig Game Hunting FS6, RPA4 17.00 23.81 CVBig Game Hunting FS6, RPA4 15.00 21.01 CVBig Game Hunting FS5, RPA4 25.00 35.02 CVBig Game Hunting FS10, RPA5 28.00 39.22 CVWaterfowl Hunting FS9, RPA1 7.00 9.81 CVWaterfowl Hunting FS9, RPA1 8.00 11.21 CVWaterfowl Hunting FS9, RPA1 12.00 16.81 CVWaterfowl Hunting FS9, RPA1 10.00 14.01 CV
(cont’d.)

47USDA Forest Service Gen. Tech. Rep. RMRS-GTR-72. 2001
Rosenberger and LoomisBenefit Transfer of Outdoor Recreation Use Values
Appendix B Table B3. (Cont’d.)
Activity Regionsa $ Original [1985]b $ Adjusted [1996]b Methodc
Waterfowl Hunting FS9, RPA1 19.00 26.61 CVWaterfowl Hunting FS9, RPA1 10.00 14.01 CVWaterfowl Hunting FS9, RPA1 9.00 12.61 CVWaterfowl Hunting FS9, RPA1 15.00 21.01 CVWaterfowl Hunting FS9, RPA1 11.00 15.41 CVWaterfowl Hunting FS9, RPA1 16.00 22.41 CVWaterfowl Hunting FS9, RPA1 13.00 18.21 CVWaterfowl Hunting FS9, RPA1 17.00 23.81 CVWaterfowl Hunting FS9, RPA1 8.00 11.21 CVWaterfowl Hunting FS9, RPA1 8.00 11.21 CVWaterfowl Hunting FS9, RPA1 8.00 11.21 CVWaterfowl Hunting FS8, RPA2 13.00 18.21 CVWaterfowl Hunting FS8, RPA2 9.00 12.61 CVWaterfowl Hunting FS8, RPA2 11.00 15.41 CVWaterfowl Hunting FS8, RPA2 9.00 12.61 CVWaterfowl Hunting FS8, RPA2 10.00 14.01 CVWaterfowl Hunting FS8, RPA2 11.00 15.41 CVWaterfowl Hunting FS8, RPA2 12.00 16.81 CVWaterfowl Hunting FS8, RPA2 19.00 26.61 CVWaterfowl Hunting FS8, RPA2 18.00 25.21 CVWaterfowl Hunting FS8, RPA2 16.00 22.41 CVWaterfowl Hunting FS8, RPA2 11.00 15.41 CVWaterfowl Hunting FS4, RPA3 20.00 28.01 CVWaterfowl Hunting FS4, RPA3 13.00 18.21 CVWaterfowl Hunting FS4, RPA3 10.00 14.01 CVWaterfowl Hunting FS2, RPA3 12.00 16.81 CVWaterfowl Hunting FS2, RPA3 15.00 21.01 CVWaterfowl Hunting FS2, RPA3 13.00 18.21 CVWaterfowl Hunting FS2, RPA3 10.00 14.01 CVWaterfowl Hunting FS2, RPA3 15.00 21.01 CVWaterfowl Hunting FS1, RPA3 11.00 15.41 CVWaterfowl Hunting FS1, RPA3 13.00 18.21 CVWaterfowl Hunting FS6, RPA4 13.00 18.21 CVWaterfowl Hunting FS6, RPA4 10.00 14.01 CVWaterfowl Hunting FS5, RPA4 22.00 30.82 CVFishing FS9, RPA1 17.00 23.81 CVFishing FS9, RPA1 9.00 12.61 CVFishing FS9, RPA1 9.00 12.61 CVFishing FS9, RPA1 10.00 14.01 CVFishing FS9, RPA1 14.00 19.61 CVFishing FS9, RPA1 13.00 18.21 CVFishing FS9, RPA1 7.00 9.81 CVFishing FS9, RPA1 7.00 9.81 CVFishing FS9, RPA1 9.00 12.61 CVFishing FS9, RPA1 10.00 14.01 CVFishing FS9, RPA1 9.00 12.61 CVFishing FS9, RPA1 8.00 11.21 CVFishing FS9, RPA1 13.00 18.21 CVFishing FS9, RPA1 20.00 28.01 CVFishing FS9, RPA1 8.00 11.21 CVFishing FS9, RPA1 11.00 15.41 CVFishing FS9, RPA1 9.00 12.61 CVFishing FS9, RPA1 11.00 15.41 CVFishing FS9, RPA1 9.00 12.61 CVFishing FS9, RPA1 7.00 9.81 CV
(cont’d.)

48 USDA Forest Service Gen. Tech. Rep. RMRS-GTR-72. 2001
Rosenberger and Loomis Benefit Transfer of Outdoor Recreation Use Values
Fishing FS8, RPA2 10.00 14.01 CVFishing FS8, RPA2 13.00 18.21 CVFishing FS8, RPA2 9.00 12.61 CVFishing FS8, RPA2 20.00 28.01 CVFishing FS8, RPA2 15.00 21.01 CVFishing FS8, RPA2 11.00 15.41 CVFishing FS8, RPA2 24.00 33.62 CVFishing FS8, RPA2 8.00 11.21 CVFishing FS8, RPA2 20.00 28.01 CVFishing FS8, RPA2 12.00 16.81 CVFishing FS4, RPA3 10.00 14.01 CVFishing FS4, RPA3 11.00 15.41 CVFishing FS4, RPA3 11.00 15.41 CVFishing FS3, RPA3 11.00 15.41 CVFishing FS3, RPA3 14.00 19.61 CVFishing FS2, RPA3 17.00 23.81 CVFishing FS2, RPA3 13.00 18.21 CVFishing FS2, RPA3 13.00 18.21 CVFishing FS2, RPA3 12.00 16.81 CVFishing FS2, RPA3 15.00 21.01 CVFishing FS1, RPA3 12.00 16.81 CVFishing FS1, RPA3 12.00 16.81 CVFishing FS6, RPA4 11.00 15.41 CVFishing FS6, RPA4 12.00 16.81 CVFishing FS5, RPA4 16.00 22.41 CVFishing FS10, RPA5 28.00 39.22 CV
aFS=USDA Forest Service Region, CR=Census Region.bValues in per person per activity day.cTC=travel cost method, CV=contingent valuation method.
Appendix B Table B3. (Cont’d.)
Activity Regionsa $ Original [1985]b $ Adjusted [1996]b Methodc

49USDA Forest Service Gen. Tech. Rep. RMRS-GTR-72. 2001
Rosenberger and LoomisBenefit Transfer of Outdoor Recreation Use Values
Appendix B Table B4. Bibliography Entry #31, Connelly, N., and T. Brown, 1988, Estimates ofnonconsumptive wildlife use on Forest Service and Bureau of Land Management lands.
Activity Regionsa $ Original [1985]b $ Adjusted [1996]b Methodc
Wildlife Viewing FS9, RPA1 $35.30 $49.45 CVWildlife Viewing FS9, RPA1 37.18 52.07 CVWildlife Viewing FS9, RPA1 16.84 23.59 CVWildlife Viewing FS9, RPA1 11.93 16.70 CVWildlife Viewing FS9, RPA1 21.73 30.44 CVWildlife Viewing FS9, RPA1 24.38 34.15 CVWildlife Viewing FS9, RPA1 15.41 21.59 CVWildlife Viewing FS9, RPA1 15.13 21.19 CVWildlife Viewing FS9, RPA1 11.99 16.80 CVWildlife Viewing FS9, RPA1 14.06 19.69 CVWildlife Viewing FS9, RPA1 20.07 28.11 CVWildlife Viewing FS9, RPA1 14.46 20.26 CVWildlife Viewing FS9, RPA1 11.53 16.15 CVWildlife Viewing FS8, RPA2 18.20 25.50 CVWildlife Viewing FS8, RPA2 15.02 21.04 CVWildlife Viewing FS8, RPA2 19.85 27.80 CVWildlife Viewing FS8, RPA2 19.46 27.26 CVWildlife Viewing FS8, RPA2 21.48 30.09 CVWildlife Viewing FS8, RPA2 21.37 29.94 CVWildlife Viewing FS8, RPA2 22.22 31.12 CVWildlife Viewing FS8, RPA2 29.62 41.50 CVWildlife Viewing FS8, RPA2 19.26 26.98 CVWildlife Viewing FS8, RPA2 19.05 26.68 CVWildlife Viewing FS8, RPA2 20.83 29.18 CVWildlife Viewing FS8, RPA2 15.41 21.58 CVWildlife Viewing FS8, RPA2 16.27 22.79 CVWildlife Viewing FS4, RPA3 24.36 34.12 CVWildlife Viewing FS4, RPA3 27.68 38.78 CVWildlife Viewing FS4, RPA3 37.64 52.72 CVWildlife Viewing FS3, RPA3 28.93 40.52 CVWildlife Viewing FS3, RPA3 16.32 22.86 CVWildlife Viewing FS2, RPA3 12.68 17.76 CVWildlife Viewing FS2, RPA3 11.64 16.31 CVWildlife Viewing FS2, RPA3 16.53 23.15 CVWildlife Viewing FS2, RPA3 21.22 29.72 CVWildlife Viewing FS2, RPA3 24.46 34.27 CVWildlife Viewing FS1, RPA3 15.16 21.24 CVWildlife Viewing FS1, RPA3 21.67 30.35 CVWildlife Viewing FS6, RPA4 20.04 28.06 CVWildlife Viewing FS6, RPA4 25.52 35.75 CVWildlife Viewing FS5, RPA4 31.27 43.80 CVWildlife Viewing FS10, RPA5 9.34 13.09 CV
aFS=USDA Forest Service Region, CR=Census Region.bValues in per person per activity day.cTC=travel cost method, CV=contingent valuation method.

50 USDA Forest Service Gen. Tech. Rep. RMRS-GTR-72. 2001
Rosenberger and Loomis Benefit Transfer of Outdoor Recreation Use Values
Appendix B Table B5. Bibliography Entry #68, Hansen, C., 1977, A report on the value of wildlife.
Activity Regionsa $ Original [1975]b $ Adjusted [1996]b Methodc
Big Game Hunting FS4, RPA3 $8.30 $21.68 CVBig Game Hunting FS4, RPA3 5.10 13.32 CVBig Game Hunting FS4, RPA3 4.29 11.22 CVBig Game Hunting FS4, RPA3 45.84 119.81 CVBig Game Hunting FS4, RPA3 4.36 11.38 CVBig Game Hunting FS4, RPA3 9.47 24.75 CVBig Game Hunting FS4, RPA3 9.30 24.32 CVBig Game Hunting FS4, RPA3 17.54 45.85 CVBig Game Hunting FS4, RPA3 9.03 23.60 CVBig Game Hunting FS4, RPA3 32.22 84.21 CVBig Game Hunting FS4, RPA3 16.20 42.33 CVBig Game Hunting FS2, RPA3 2.95 7.70 CVBig Game Hunting FS2, RPA3 9.37 24.50 CVBig Game Hunting FS2, RPA3 6.17 16.13 CVBig Game Hunting FS2, RPA3 14.40 37.63 CVSmall Game Hunting FS4, RPA3 10.60 27.71 CVSmall Game Hunting FS4, RPA3 4.96 12.96 CVSmall Game Hunting FS4, RPA3 6.51 17.02 CVSmall Game Hunting FS4, RPA3 16.41 42.88 CVSmall Game Hunting FS4, RPA3 7.86 20.54 CVSmall Game Hunting FS2, RPA3 3.23 8.43 CVSmall Game Hunting FS2, RPA3 11.11 29.04 CVWaterfowl Hunting FS4, RPA3 6.88 17.97 CVWaterfowl Hunting FS4, RPA3 10.78 28.16 CVWaterfowl Hunting FS4, RPA3 3.21 8.39 CVWaterfowl Hunting FS2, RPA3 14.92 39.00 CVFishing FS2, RPA3 3.08 8.05 CVFishing FS4, RPA3 5.32 13.91 CVFishing FS4, RPA3 4.01 10.47 CVFishing FS4, RPA3 4.79 12.53 CVFishing FS4, RPA3 2.86 7.47 CV
aFS=USDA Forest Service Region, CR=Census Region.bValues in per person per activity day.cTC=travel cost method, CV=contingent valuation method.

51USDA Forest Service Gen. Tech. Rep. RMRS-GTR-72. 2001
Rosenberger and LoomisBenefit Transfer of Outdoor Recreation Use Values
Appendix B Table B6. Bibliography Entry #73, Hay, J.M., 1988, Net economic values of non-consumptive wildlife-related recreation.
Activity Regionsa $ Original [1985]b $ Adjusted [1996]b Methodc
Wildlife Viewing FS9, RPA1 19.00 26.61 CVWildlife Viewing FS9, RPA1 25.00 35.02 CVWildlife Viewing FS9, RPA1 13.00 18.21 CVWildlife Viewing FS9, RPA1 14.00 19.61 CVWildlife Viewing FS9, RPA1 28.00 39.22 CVWildlife Viewing FS9, RPA1 21.00 29.42 CVWildlife Viewing FS9, RPA1 24.00 33.62 CVWildlife Viewing FS9, RPA1 10.00 14.01 CVWildlife Viewing FS9, RPA1 20.00 28.01 CVWildlife Viewing FS9, RPA1 20.00 28.01 CVWildlife Viewing FS9, RPA1 14.00 19.61 CVWildlife Viewing FS9, RPA1 18.00 25.21 CVWildlife Viewing FS9, RPA1 28.00 39.22 CVWildlife Viewing FS9, RPA1 16.00 22.41 CVWildlife Viewing FS9, RPA1 13.00 18.21 CVWildlife Viewing FS9, RPA1 24.00 33.62 CVWildlife Viewing FS9, RPA1 21.00 29.42 CVWildlife Viewing FS9, RPA1 18.00 25.21 CVWildlife Viewing FS9, RPA1 15.00 21.01 CVWildlife Viewing FS9, RPA1 17.00 23.81 CVWildlife Viewing FS8, RPA2 13.00 18.21 CVWildlife Viewing FS8, RPA2 12.00 16.81 CVWildlife Viewing FS8, RPA2 16.00 22.41 CVWildlife Viewing FS8, RPA2 26.00 36.42 CVWildlife Viewing FS8, RPA2 15.00 21.01 CVWildlife Viewing FS8, RPA2 10.00 14.01 CVWildlife Viewing FS8, RPA2 12.00 16.81 CVWildlife Viewing FS8, RPA2 14.00 19.61 CVWildlife Viewing FS8, RPA2 11.00 15.41 CVWildlife Viewing FS8, RPA2 34.00 47.63 CVWildlife Viewing FS8, RPA2 34.00 47.63 CVWildlife Viewing FS8, RPA2 24.00 33.62 CVWildlife Viewing FS8, RPA2 21.00 29.42 CVWildlife Viewing FS4, RPA3 21.00 29.42 CVWildlife Viewing FS4, RPA3 25.00 35.02 CVWildlife Viewing FS4, RPA3 41.00 57.43 CVWildlife Viewing FS3, RPA3 29.00 40.62 CVWildlife Viewing FS3, RPA3 30.00 42.02 CVWildlife Viewing FS2, RPA3 11.00 15.41 CVWildlife Viewing FS2, RPA3 13.00 18.21 CVWildlife Viewing FS2, RPA3 14.00 19.61 CVWildlife Viewing FS2, RPA3 23.00 32.22 CVWildlife Viewing FS2, RPA3 26.00 36.42 CVWildlife Viewing FS1, RPA3 22.00 30.82 CVWildlife Viewing FS1, RPA3 29.00 40.62 CVWildlife Viewing FS6, RPA4 15.00 21.01 CVWildlife Viewing FS6, RPA4 20.00 28.01 CVWildlife Viewing FS5, RPA4 27.00 37.82 CVWildlife Viewing FS5, RPA4 32.00 44.82 CVWildlife Viewing FS10, RPA5 24.00 33.62 CV
aFS=USDA Forest Service Region, CR=Census Region.bValues in per person per activity day.cTC=travel cost method, CV=contingent valuation method.

52 USDA Forest Service Gen. Tech. Rep. RMRS-GTR-72. 2001
Rosenberger and Loomis Benefit Transfer of Outdoor Recreation Use Values
Appendix B Table B7. Bibliography Entry #101, McCollum, D.W., G.L. Peterson, J.R. Arnold, D.C.Markstrom, and D.M. Hellerstein, 1990, The net economic value of recreation on the nationalforests: Twelve types of primary activity trips across nine Forest Service regions.
Activity Regionsa $ Original [1986]b $ Adjusted [1996]b Methodc
Camping FS9, RPA1 4.11 5.61 Zonal TCCamping FS8, RPA2 3.07 4.19 Zonal TCCamping FS3, RPA3 4.26 5.82 Zonal TCCamping FS6, RPA4 4.55 6.21 Zonal TCPicnicking FS9, RPA1 5.46 7.45 Zonal TCSwimming FS8, RPA2 8.33 11.37 Zonal TCSwimming FS5, RPA4 10.72 14.63 Zonal TCSightseeing FS9, RPA1 20.19 27.56 Zonal TCSightseeing FS10, RPA5 9.67 13.20 Zonal TCHiking FS9, RPA1 30.40 41.50 Zonal TCBig Game Hunting FS8, RPA2 7.56 10.32 Zonal TCBig Game Hunting FS1, RPA3 4.61 6.29 Zonal TCBig Game Hunting FS2, RPA3 4.18 5.71 Zonal TCBig Game Hunting FS4, RPA3 4.35 5.94 Zonal TCBig Game Hunting FS6, RPA4 5.56 7.59 Zonal TCFishing FS9, RPA1 8.35 11.40 Zonal TCFishing FS1, RPA3 24.08 32.87 Zonal TCFishing FS2, RPA3 10.44 14.25 Zonal TCFishing FS4, RPA3 7.47 10.20 Zonal TCWildlife Viewing FS10, RPA5 6.53 8.91 Zonal TCGeneral Recreation FS9, RPA1 5.47 7.47 Zonal TCGeneral Recreation FS8, RPA2 4.33 5.91 Zonal TCGeneral Recreation FS1, RPA3 7.30 9.97 Zonal TCGeneral Recreation FS2, RPA3 9.49 12.95 Zonal TCGeneral Recreation FS3, RPA3 6.90 9.42 Zonal TCGeneral Recreation FS4, RPA3 4.83 6.59 Zonal TCGeneral Recreation FS5, RPA4 7.35 10.03 Zonal TCGeneral Recreation FS6, RPA4 3.20 4.37 Zonal TCGeneral Recreation FS10, RPA5 9.06 12.37 Zonal TCWilderness FS8, RPA2 7.40 10.10 Zonal TCWilderness FS2, RPA3 13.47 18.39 Zonal TCWilderness FS5, RPA4 3.09 4.22 Zonal TCWilderness FS10, RPA5 9.51 12.98 Zonal TC
aFS=USDA Forest Service Region, CR=Census Region.bValues in per person per activity day.cTC=travel cost method, CV=contingent valuation method.

53USDA Forest Service Gen. Tech. Rep. RMRS-GTR-72. 2001
Rosenberger and LoomisBenefit Transfer of Outdoor Recreation Use Values
Appendix B Table B8. Bibliography Entry #145, Waddington, D.G., K.J. Boyle, and J. Cooper,1991, 1991 Net economic values for bass and trout fishing, deer hunting, and wildlife watching.
Activity Regionsa $ Original [1991]b $ Adjusted [1996]b Methodc
Big Game Hunting FS9, RPA1 $25.00 $28.26 CVBig Game Hunting FS9, RPA1 50.00 56.51 CVBig Game Hunting FS9, RPA1 22.00 24.87 CVBig Game Hunting FS9, RPA1 48.00 54.25 CVBig Game Hunting FS9, RPA1 38.00 42.95 CVBig Game Hunting FS9, RPA1 61.00 68.95 CVBig Game Hunting FS9, RPA1 53.00 59.91 CVBig Game Hunting FS9, RPA1 27.00 30.52 CVBig Game Hunting FS9, RPA1 41.00 46.34 CVBig Game Hunting FS9, RPA1 55.00 62.17 CVBig Game Hunting FS9, RPA1 61.00 68.95 CVBig Game Hunting FS9, RPA1 63.00 71.21 CVBig Game Hunting FS9, RPA1 52.00 58.78 CVBig Game Hunting FS9, RPA1 45.00 50.86 CVBig Game Hunting FS9, RPA1 33.00 37.30 CVBig Game Hunting FS9, RPA1 49.00 55.38 CVBig Game Hunting FS9, RPA1 47.00 53.12 CVBig Game Hunting FS9, RPA1 39.00 44.08 CVBig Game Hunting FS9, RPA1 31.00 35.04 CVBig Game Hunting FS9, RPA1 36.00 40.69 CVBig Game Hunting FS8, RPA2 45.00 50.86 CVBig Game Hunting FS8, RPA2 50.00 56.51 CVBig Game Hunting FS8, RPA2 41.00 46.34 CVBig Game Hunting FS8, RPA2 44.00 49.73 CVBig Game Hunting FS8, RPA2 58.00 65.56 CVBig Game Hunting FS8, RPA2 36.00 40.69 CVBig Game Hunting FS8, RPA2 35.00 39.56 CVBig Game Hunting FS8, RPA2 36.00 40.69 CVBig Game Hunting FS8, RPA2 47.00 53.12 CVBig Game Hunting FS8, RPA2 34.00 38.43 CVBig Game Hunting FS8, RPA2 32.00 36.17 CVBig Game Hunting FS8, RPA2 53.00 59.91 CVBig Game Hunting FS8, RPA2 33.00 37.30 CVBig Game Hunting FS4, RPA3 45.00 50.86 CVBig Game Hunting FS4, RPA3 45.00 50.86 CVBig Game Hunting FS4, RPA3 95.00 107.38 CVBig Game Hunting FS3, RPA3 66.00 74.60 CVBig Game Hunting FS3, RPA3 81.00 91.55 CVBig Game Hunting FS2, RPA3 34.00 38.43 CVBig Game Hunting FS2, RPA3 36.00 40.69 CVBig Game Hunting FS2, RPA3 44.00 49.73 CVBig Game Hunting FS2, RPA3 66.00 74.60 CVBig Game Hunting FS2, RPA3 72.00 81.38 CVBig Game Hunting FS2, RPA3 83.00 93.81 CVBig Game Hunting FS1, RPA3 56.00 66.72 CVBig Game Hunting FS6, RPA4 59.00 66.69 CVBig Game Hunting FS6, RPA4 52.00 58.78 CVBig Game Hunting FS10, RPA5 63.00 71.21 CVWildlife Viewing FS9, RPA1 27.00 30.52 CVWildlife Viewing FS9, RPA1 23.00 26.00 CVWildlife Viewing FS9, RPA1 12.00 13.56 CVWildlife Viewing FS9, RPA1 32.00 36.17 CVWildlife Viewing FS9, RPA1 23.00 26.00 CV
(cont’d.)

54 USDA Forest Service Gen. Tech. Rep. RMRS-GTR-72. 2001
Rosenberger and Loomis Benefit Transfer of Outdoor Recreation Use Values
Wildlife Viewing FS9, RPA1 14.00 15.82 CVWildlife Viewing FS9, RPA1 21.00 23.74 CVWildlife Viewing FS9, RPA1 29.00 32.78 CVWildlife Viewing FS9, RPA1 22.00 24.87 CVWildlife Viewing FS9, RPA1 29.00 32.78 CVWildlife Viewing FS9, RPA1 36.00 40.69 CVWildlife Viewing FS9, RPA1 28.00 31.65 CVWildlife Viewing FS9, RPA1 23.00 26.00 CVWildlife Viewing FS9, RPA1 26.00 29.39 CVWildlife Viewing FS9, RPA1 17.00 19.21 CVWildlife Viewing FS9, RPA1 16.00 18.08 CVWildlife Viewing FS9, RPA1 27.00 30.52 CVWildlife Viewing FS9, RPA1 12.00 13.56 CVWildlife Viewing FS9, RPA1 59.00 66.69 CVWildlife Viewing FS9, RPA1 71.00 80.25 CVWildlife Viewing FS8, RPA2 37.00 41.82 CVWildlife Viewing FS8, RPA2 67.00 75.73 CVWildlife Viewing FS8, RPA2 39.00 44.08 CVWildlife Viewing FS8, RPA2 27.00 30.52 CVWildlife Viewing FS8, RPA2 24.00 27.13 CVWildlife Viewing FS8, RPA2 30.00 33.91 CVWildlife Viewing FS8, RPA2 28.00 31.65 CVWildlife Viewing FS8, RPA2 25.00 28.26 CVWildlife Viewing FS8, RPA2 21.00 23.74 CVWildlife Viewing FS8, RPA2 31.00 35.04 CVWildlife Viewing FS8, RPA2 41.00 46.34 CVWildlife Viewing FS4, RPA3 22.00 24.87 CVWildlife Viewing FS4, RPA3 29.00 32.78 CVWildlife Viewing FS4, RPA3 45.00 50.86 CVWildlife Viewing FS3, RPA3 34.00 38.43 CVWildlife Viewing FS3, RPA3 50.00 56.51 CVWildlife Viewing FS2, RPA3 23.00 26.00 CVWildlife Viewing FS2, RPA3 28.00 31.65 CVWildlife Viewing FS2, RPA3 34.00 38.43 CVWildlife Viewing FS2, RPA3 49.00 55.38 CVWildlife Viewing FS1, RPA3 10.00 11.30 CVWildlife Viewing FS1, RPA3 21.00 23.74 CVWildlife Viewing FS1, RPA3 21.00 23.74 CVWildlife Viewing FS6, RPA4 27.00 30.52 CVWildlife Viewing FS6, RPA4 28.00 31.65 CVWildlife Viewing FS5, RPA4 28.00 31.65 CVWildlife Viewing FS5, RPA4 29.00 32.78 CVWildlife Viewing FS10, RPA5 49.00 55.38 CV
aFS=USDA Forest Service Region, CR=Census Region.bValues in per person per activity day.cTC=travel cost method, CV=contingent valuation method.
Appendix B Table B8. (Cont’d.)
Activity Regionsa $ Original [1991]b $ Adjusted [1996]b Methodc
55USDA Forest Service Gen. Tech. Rep. RMRS-GTR-72. 2001
Rosenberger and LoomisBenefit Transfer of Outdoor Recreation Use Values
Appendix C Table C1. CAMPING: Empirical StudiesEstimating Economic Use Values.
Forest RPA Service BibliographyRegion Region Reference Number
RPA1 FS9 9, 78, 101, 105, 118RPA2 FS8 9, 61, 86, 87, 101RPA3 FS1 39
FS2 150, 156FS3 25, 83, 98, 101, 122, 141, 159FS4 56, 108, 109
RPA4 FS5 9FS6 9, 52, 101
RPA5 FS10 —NATIONAL 8CANADA —
Appendix C: References to Appendix A Annotated Bibliography Entries byRecreation Activity
Appendix C Table C2. PICNICKING: Empirical StudiesEstimating Economic Use Values.
Forest RPA Service BibliographyRegion Region Reference Number
RPA1 FS9 9, 101RPA2 FS8 9RPA3 FS1 —
FS2 9, 150, 156FS3 159FS4 —
RPA4 FS5 9, 85FS6 9
RPA5 FS10 —NATIONAL 8CANADA —
Appendix C Table C3. SWIMMING: Empirical StudiesEstimating Economic Use Values.
Forest RPA Service BibliographyRegion Region Reference Number
RPA1 FS9 78, 120, 134RPA2 FS8 9, 66, 101RPA3 FS1 —
FS2 —FS3 159FS4 —-
RPA4 FS5 101, 146FS6 9
RPA5 FS10 —NATIONAL 8CANADA —
Appendix C Table C4. SIGHTSEEING: Empirical StudiesEstimating Economic Use Values.
Forest RPA Service BibliographyRegion Region Reference Number
RPA1 FS9 9, 101RPA2 FS8 9, 60RPA3 FS1 —
FS2 77, 152, 153FS3 71FS4 95
RPA4 FS5 —FS6 9
RPA5 FS10 101NATIONAL 8CANADA —

56 USDA Forest Service Gen. Tech. Rep. RMRS-GTR-72. 2001
Rosenberger and Loomis Benefit Transfer of Outdoor Recreation Use Values
Appendix C Table C5. OFF ROAD DRIVING: EmpiricalStudies Estimating Economic Use Values.
Forest RPA Service BibliographyRegion Region Reference Number
RPA1 FS9 —RPA2 FS8 9RPA3 FS1 —
FS2 150FS3 —FS4 —
RPA4 FS5 —FS6 9
RPA5 FS10 —NATIONAL 8CANADA —
Appendix C Table C6. MOTOR BOATING: EmpiricalStudies Estimating Economic Use Values.
Forest RPA Service BibliographyRegion Region Reference Number
RPA1 FS9 78RPA2 FS8 132RPA3 FS1 —
FS2 9, 124FS3 146, 159FS4 —
RPA4 FS5 —FS6 142
RPA5 FS10 —NATIONAL 8CANADA —
Appendix C Table C7. FLOAT BOATING: EmpiricalStudies Estimating Economic Use Values.
Forest RPA Service BibliographyRegion Region Reference Number
RPA1 FS9 9, 74, 125RPA2 FS8 9, 84RPA3 FS1 —-
FS2 9, 157FS3 11, 18, 81FS4 15, 108, 125
RPA4 FS5 —FS6 —
RPA5 FS10 72NATIONAL 8CANADA —
Appendix C Table C8. HIKING: Empirical StudiesEstimating Economic Use Values.
Forest RPA Service BibliographyRegion Region Reference Number
RPA1 FS9 9, 78, 101RPA2 FS8 9, 29, 69, 119RPA3 FS1 —
FS2 9, 126, 150, 155, 156FS3 —FS4 —
RPA4 FS5 5, 133FS6 9, 24, 51, 62
RPA5 FS10 72NATIONAL 8CANADA —
Appendix C Table C9. BIKING: Empirical StudiesEstimating Economic Use Values.
Forest RPA Service BibliographyRegion Region Reference Number
RPA1 FS9 133RPA2 FS8 133RPA3 FS1 —
FS2 —FS3 —FS4 58
RPA4 FS5 —FS6 —
RPA5 FS10 —NATIONAL 8CANADA —
Appendix C Table C10. DOWNHILL SKIING: EmpiricalStudies Estimating Economic Use Values.
Forest RPA Service BibliographyRegion Region Reference Number
RPA1 FS9 —RPA2 FS8 —RPA3 FS1 —
FS2 112, 148, 154FS3 —FS4 —
RPA4 FS5 —FS6 9
RPA5 FS10 —NATIONAL 8CANADA —

57USDA Forest Service Gen. Tech. Rep. RMRS-GTR-72. 2001
Rosenberger and LoomisBenefit Transfer of Outdoor Recreation Use Values
Appendix C Table C11. CROSS COUNTRY SKIING:Empirical Studies Estimating Economic Use Values.
Forest RPA Service BibliographyRegion Region Reference Number
RPA1 FS9 63, 100RPA2 FS8 —RPA3 FS1 —
FS2 63, 149, 155FS3 —FS4 80
RPA4 FS5 30FS6 —
RPA5 FS10 —NATIONAL 8CANADA —
Appendix C Table C12. SNOWMOBILING: EmpiricalStudies Estimating Economic Use Values.
Forest RPA Service BibliographyRegion Region Reference Number
RPA1 FS9 —RPA2 FS8 —RPA3 FS1 —
FS2 99FS3 —FS4 80
RPA4 FS5 —FS6 —
RPA5 FS10 —NATIONAL —CANADA —
Appendix C Table C13. BIG GAME HUNTING: EmpiricalStudies Estimating Economic Use Values.
Forest RPA Service BibliographyRegion Region Reference Number
RPA1 FS9 913, 17, 19, 20, 23, 55, 57, 102, 110, 145
RPA2 FS8 9, 23, 101, 145RPA3 FS1 21, 23, 44, 45, 92, 93,
101, 116, 145FS2 9, 23, 68, 101, 145, 161FS3 23, 36, 98, 145FS4 23, 59, 68, 89, 90, 101,
138, 145RPA4 FS5 9, 23, 38, 91, 94
FS6 9, 23, 42, 101, 145RPA5 FS10 23, 103, 145NATIONAL 6, 8CANADA 2, 28
Appendix C Table C14. SMALL GAME HUNTING:Empirical Studies Estimating Economic Use Values.
Forest RPA Service BibliographyRegion Region Reference Number
RPA1 FS9 17, 19, 20RPA2 FS8 —RPA3 FS1 —
FS2 65, 68, 110FS3 98FS4 68, 162
RPA4 FS5 —FS6 4
RPA5 FS10 —NATIONAL 8CANADA —

58 USDA Forest Service Gen. Tech. Rep. RMRS-GTR-72. 2001
Rosenberger and Loomis Benefit Transfer of Outdoor Recreation Use Values
Appendix C Table C15. WATERFOWL HUNTING:Empirical Studies Estimating Economic Use Values.
Forest RPA Service BibliographyRegion Region Reference Number
RPA1 FS9 12, 17, 19, 20, 23, 64RPA2 FS8 23RPA3 FS1 23, 46
FS2 23, 68FS3 98FS4 22, 23, 68
RPA4 FS5 23, 33, 34FS6 23
RPA5 FS10 72NATIONAL —CANADA —
Appendix C Table C16. FISHING: Empirical StudiesEstimating Economic Use Values.
Forest RPA Service BibliographyRegion Region Reference Number
RPA1 FS9 16, 20, 23, 32, 75, 76, 79, 101, 104, 106, 107, 110, 113, 114, 128, 130, 160
RPA2 FS8 23, 110, 115, 163RPA3 FS1 23, 47, 48, 101
FS2 23, 40, 68, 70, 101FS3 18, 23, 82, 97, 98,
110, 121, 141FS4 23, 68, 101, 110, 137
RPA4 FS5 23, 127, 136FS6 23, 26, 41, 127, 140
RPA5 FS10 23NATIONAL 144CANADA 3, 27
Appendix C Table C17. WILDLIFE VIEWING: EmpiricalStudies Estimating Economic Use Values.
Forest RPA Service BibliographyRegion Region Reference Number
RPA1 FS9 31, 67, 73, 130, 145RPA2 FS8 9, 31, 73, 139, 145RPA3 FS1 31, 73, 145
FS2 7, 9, 31, 73, 145FS3 31, 37, 73, 145FS4 31, 73, 145
RPA4 FS5 31, 33, 73, 91, 94, 135, 145
FS6 31, 73, 145RPA5 FS10 31, 73, 101, 103, 145NATIONAL 8CANADA —
Appendix C Table C18. HORSEBACK RIDING:Empirical Studies Estimating Economic Use Values.
Forest RPA Service BibliographyRegion Region Reference Number
RPA1 FS9 —RPA2 FS8 —RPA3 FS1 —
FS2 —FS3 —FS4 —
RPA4 FS5 —FS6 —
RPA5 FS10 —NATIONAL 8CANADA —

59USDA Forest Service Gen. Tech. Rep. RMRS-GTR-72. 2001
Rosenberger and LoomisBenefit Transfer of Outdoor Recreation Use Values
Appendix C Table C19. ROCK CLIMBING: EmpiricalStudies Estimating Economic Use Values.
Forest RPA Service BibliographyRegion Region Reference Number
RPA1 FS9 131RPA2 FS8 —RPA3 FS1 —
FS2 50FS3 —FS4 —
RPA4 FS5 —FS6 —
RPA5 FS10 —NATIONAL —CANADA —
Appendix C Table C20. GENERAL RECREATION:Empirical Studies Estimating Economic Use Values.
Forest RPA Service BibliographyRegion Region Reference Number
RPA1 FS9 9, 14, 49, 101, 130RPA2 FS8 9, 10, 101, 143RPA3 FS1 101
FS2 9, 96, 101, 147, 151FS3 101FS4 88, 101
RPA4 FS5 9, 101, 111FS6 101
RPA5 FS10 101NATIONAL —CANADA 1
Appendix C Table C21. OTHER RECREATION:Empirical Studies Estimating Economic Use Values.
Forest RPA Service BibliographyRegion Region Reference Number
RPA1 FS9 —RPA2 FS8 9, 35, 54, 123RPA3 FS1 43, 47
FS2 117, 129, 158FS3 —FS4 —
RPA4 FS5 —FS6 9
RPA5 FS10 —NATIONAL 8CANADA —
Appendix C Table C22. WILDERNESS RECREATION:Empirical Studies Estimating Economic Use Values.
Forest RPA Service BibliographyRegion Region Reference Number
RPA1 FS9 67, 74, 118RPA2 FS8 29, 101, 119RPA3 FS1 —
FS2 7, 101, 151, 153, 158FS3 —FS4 88
RPA4 FS5 5, 101, 135FS6 24, 51, 52
RPA5 FS10 101NATIONAL —CANADA —

Federal Recycling Program Printed on Recycled Paper
The U.S. Department of Agriculture (USDA) prohibits discrimination in all itsprograms and activities on the basis of race, color, national origin, sex, religion,age, disability, political beliefs, sexual orientation, or marital or family status. (Notall prohibited bases apply to all programs.) Persons with disabilities who requirealternative means for communication of program information (Braille, large print,audiotape, etc.) should contact USDA’s TARGET Center at (202) 720-2600 (voiceand TDD).
To file a complaint of discrimination, write USDA, Director, Office of Civil Rights,Room 326-W, Whitten Building, 1400 Independence Avenue, SW, Washington,DC 20250-9410 or call (202) 720-5964 (voice or TDD). USDA is an equalopportunity provider and employer.
ROCKY MOUNTAIN RESEARCH STATIONRMRS
The Rocky Mountain Research Station develops scientific informa-tion and technology to improve management, protection, and use ofthe forests and rangelands. Research is designed to meet the needsof National Forest managers, Federal and State agencies, public andprivate organizations, academic institutions, industry, and individuals.
Studies accelerate solutions to problems involving ecosystems,range, forests, water, recreation, fire, resource inventory, land recla-mation, community sustainability, forest engineering technology,multiple use economics, wildlife and fish habitat, and forest insectsand diseases. Studies are conducted cooperatively, and applicationsmay be found worldwide.
Research Locations
Flagstaff, Arizona Reno, NevadaFort Collins, Colorado* Albuquerque, New MexicoBoise, Idaho Rapid City, South DakotaMoscow, Idaho Logan, UtahBozeman, Montana Ogden, UtahMissoula, Montana Provo, UtahLincoln, Nebraska Laramie, Wyoming
*Station Headquarters, Natural Resources Research Center,2150 Centre Avenue, Building A, Fort Collins, CO 80526

UNITED STATES DEPARTMENT OF AGRICULTURE
FOREST SERVICE
ROCKY MOUNTAIN RESEARCH STATION
GENERAL TECHNICAL REPORT RMRS-GTR-72APRIL 2001