Benefit Realisation Management (BRM) Exec... · decisions Faster receipt of ... For a programme to...
63
© Sigma (Bookham) Ltd Benefit Realisation Management (BRM) Gerald Bradley Chairman, Sigma Consulting 3rd October 2017 Benefits Seminar 2017
Transcript of Benefit Realisation Management (BRM) Exec... · decisions Faster receipt of ... For a programme to...

© Sigma (Bookham) Ltd
Benefit Realisation Management
(BRM)
Gerald Bradley
Chairman, Sigma Consulting
3rd October 2017
Benefits Seminar 2017

© Sigma (Bookham) Ltd
Some of sigma’s clients
Cranfield University
CIMA

© Sigma (Bookham) Ltd
What is BRM?
Benefit information
Leadership of change
Improved benefit–led
decision making
More benefitsrealised
‘BRM is the process of organising and managing so that potential benefits arising from change are actually achieved.’

© Sigma (Bookham) Ltd
4© Sigma (Bookham) Ltd
Without a structured approach to benefit realisation...
Why Benefits Management is so important

© Sigma (Bookham) Ltd
Purpose of Benefits Management
Earlierbenefits
Morebenefits
Reduced costs
Initial change curve
Benefit-led change curve
Achievedreturn
Time
To improve the AROI from change

© Change Director UK Ltd
Mission
Strategy
ROI
Benefits
Programmes
Projects
Investment in change
(Capex.)
Operations
Business as
Usual (BAU)
(Revex.)
Based on a diagram by ChangeDirector UK
Strategic change leadership – Scope of BRM
The more the
circles are aligned
and coalesce the
greater the
realisation of
benefits and the
overall ROI
Performance
Mgt.Portfolio
Mgt.
Change
Mgt.
Maximising value generation

© Sigma (Bookham) Ltd
Justifying
To justify?
Justification
Emphasis shift
Measurement
Measuring
To measure?
Justification
Realising
To realise?
Realisation
Measurement
Justification
Culture and mindset – why consider benefits?
In UK
until
1990

© Sigma (Bookham) Ltd
Benefit
Realisation
Management
Stakeholders
Roles
Reviews &
Governance
Delivery
structuresBlueprint
Enablers &
Business Changes
Plans
Risks
Business
Case
Vision or
End Goal
BenefitsMeasures
Engages Establishes
Identifies &
analyses
Defines
requirements
Shapes
Informs
Determines,
tracks & reports
Identifies
Highlights
dependenciesClarifies
Qualifies
Drives
Scope and centrality of BRM

© Sigma (Bookham) Ltd
BRM aids communication
• Clear definition of key terms
• Careful and precise use of language
• Use of pictures, charts, tables, diagrams and maps
• Use of colour
One CSF for effective benefit realisation is ‘Quality Communication’
To facilitate quality, non-ambiguous communication, BRM utilises:
‘There is no greater impediment to the advancement of knowledge than the ambiguity of words’
Thomas Reid (1710-1769), Scottish Philosopher

© Sigma (Bookham) Ltd
Framework for introducing main BRM entities
Success is:
Knowing where you want to get to:
Knowing how to get there:
Knowing that you have arrived:
Measures
Enablers Business Changes
Acquiring new capabilities and embedding them within the culture, practices and behaviours of the organisation
Disbenefit
Minimising the impact of disbenefits
BenefitsObjectivesVision

© Sigma (Bookham) Ltd
Definition:
Elaboration:
Quality Gate:
An outcome of change that is perceived as positive by a stakeholder
Typically these are outcomes which are valuable to the organisation and measurable
• starts with an adjective indicating the direction of expected improvement - e.g. reduced,
increased, greater, fewer, better, improved (But try to be MORE SPECIFIC than improved)
• value likely to change gradually
• it would have no direct cost associated with it
• measures are possible
• baseline measures could be found
An outcome of change which is
perceived as negative is referred to as a
Benefit
Disbenefit

© Sigma (Bookham) Ltd
Strategy
Delivery
BRM / change process, with review points
1.
Set vision
and
objectives2.
Identify
benefits and
changes
3.
Finalise
requirements
& organise
resources4.
Optimise
plans & build
/ acquire
enablers
5.
Manage
implementation
& change
6.
Manage
performance
R6
R5
R4 R3
R2
R1
Engage
stakeholders

© Sigma (Bookham) Ltd
PMO
Typical BRM Roles & Structure
Programme
Board
Senior
Responsible
Owner
Benefit
Facilitator
Enabler
Project
Manager
Business
Programme
Manager
Business Change
Manager/Authority
Business Unit
Mgrs (& BCMs)
The role of the Benefit Facilitator is recognised by MSP but called Benefits Realisation Manager

© Sigma (Bookham) Ltd
The Benefit Facilitation Role
The role:
• Purpose is to support projects in benefit realisation, ensuring claims are realistic, benefit opportunities are not missed and success, in terms of benefit realisation, is achieved
• A Centre of Expertise for benefit realisation matters
• Role is probably about 20% challenge and 80% support
Skills required:
• Considerable expertise in benefit realisation
• Credibility with senior managers
• Excellent facilitation skills
• Good understanding of the business environment
Location of the role
• In a central position outside all specific programmes and projects
• Typically in a Portfolio Management Office or Performance Improvement Function
• Preferably not in a Finance Function
Advantages of a central role over a programme or project role
• It can process new ideas before a programme or project is formed (i.e. facilitate phase 1 and 2 of the sigma change cycle)
• It can process all new ideas, speedily and on a consistent basis
• It can ensure benefits continue to be realised after a programme / project has completed

© Sigma (Bookham) Ltd
Bridging the gap - looking from both ends
VISION
Programmes and projects should
be aligned to vision and
the organisation's mission
Starting with end point and mapping path to get there

© Sigma (Bookham) Ltd
The bridges (maps)
may consist of
processes or
changes or
intermediate
benefits
A map is required showing how the enablers will deliver the objectives
Bounding Objectives
for programme
To increase
effectiveness
To Improve
deployment
To speed up
responses
To reduce costs
Projects delivering
Capabilities
Doing projects in the right way – bridging the abyss

© Change Director UK Ltd
IT / BPM
Benefits
IT
Benefits
We need to put the horse before the cart
1 - Be very clear about who is driving and where we are going
2 – make sure that IT supports what the business needs

© Sigma (Bookham) Ltd
Real example of ‘bridge’ or ‘map’
Enabler
(IT System)
Business
Objective
Benefits
Enabler
Features
Changes
To
Increase
profit

© Sigma (Bookham) Ltd
Real example of ‘bridge’ or ‘map’
Business
Objective
Benefits
Enabler
Features
Changes
To increase
profit
More sales
Increased
sales margin
Reduced costs
Electronic
communication
Meetings
scheduler
Document
management
Search
facilities
Work interactively
with country
managers
Share
information
Co-author
documents
Encourage
electronic
discussion
Capture
learning
Share 'best
practices'
Cross-fertilise
between
countries
Increased
effectiveness
More focused
sales force
Improved
succession
planning
Improved
launch
planning
Improved
performance of
Country Managers
Maximised
launch impact
More focused
selling
Faster
resolution of
pricing issues
Improved
pricing
Increased
efficiency
New EnablerEnabler
(IT System) To
Increase
profit
time

© Change Director UK Ltd
Building a BDM from an Outline Business Case
A Local Authority needed to reduce its expenditure by £8m pa over a five year
period, while maintaining an acceptable level of service to the community it serves –
including the local voters.
To achieve this challenging saving the Council anticipated investing in a number of
programmes to change the way they operate. To help with this they engaged one of the
large consultancies, with considerable local authority experience, to help shape these
programmes.
This consultancy identified 10 areas for potential major improvement and created an Outline
Business Case for each. These cases were of variable quality and did little more than
identify and cost the required enablers and business changes and determine and value the
expected benefits.
In order to implement the proposals the Local Authority needed to put some flesh on these
skeletal suggestions (i.e. bridge the gap – see next slide).and approached Sigma for help. To
demonstrate the value of the mapping approach to bridge this gap, one of the better Outline
Cases was chosen – a programme “To Improve Procurement”.
The benefits, enablers and changes, taken from one of the better outline cases were used
by me to demonstrate to Management the value of benefit mapping and the risks they faced
without it.

© Sigma (Bookham) Ltd
Bounding Objectives
for programme
To increase
effectiveness
To Improve
deployment
To speed up
responses
To reduce costs
Projects delivering
Capabilities
Outline business case – very poor quality
?

© Sigma (Bookham) Ltd
To improve
procurement
Reduced cost of
supplies and
services
Reduced cost of
inventory &
storage
Reduced cost of
procurement
activity
Improved service
to customers
Increased value
from existing
contracts
Better new
contracts
Benefits Map for objective
To
Improve Procurement
Maps to identify/confirm the required
changes
Case Example – Local Authority

© Sigma (Bookham) Ltd
To improve
procurement
Reduced cost of
supplies and
services
Reduced cost of
inventory &
storage
Reduced cost of
procurement
activity
Improved service
to customers
Increased value
from existing
contracts
Fewer applications
used in
procurement / CM
Improved use of
procurement
procedures
Improved
accountability
Improved
negotiation
Fewer suppliers
Increased use of
electronic
procurement
Less off-contract
maverick spend
Better new
contracts
Better use of
buying power
Faster receipt of
services
Less labour
intensive tendering
cycle
Benefits Map for objective
To
Improve Procurement
Maps to identify/confirm
the required changes

© Sigma (Bookham) Ltd
To improve
procurement
Reduced cost of
supplies and
services
Reduced cost of
inventory &
storage
Reduced cost of
procurement
activity
Improved service
to customers
Increased value
from existing
contracts
Fewer applications
used in
procurement / CM
Improved use of
procurement
procedures
Improved
accountability
Greater use of
specilist buyers
Improved
negotiation
Improved
development of
specialist buyers
Fewer suppliers
Increased use of
electronic
procurement
Less off-contract
maverick spend
Increased awareness
of importance of using
procedures
Better new
contracts
Better use of
buying power
Better understanding
of suppliers and
marketplace
Improved
purchasing
decisions
Faster receipt of
services
Improved (use
of) MI
Easier document
control
Less labour
intensive tendering
cycle
Benefits Map for objective
To
Improve Procurement

© Sigma (Bookham) Ltd
To improve
procurement
Reduced cost of
supplies and
services
Reduced cost of
inventory &
storage
Reduced cost of
procurement
activity
Improved service
to customers
Increased value
from existing
contracts
Fewer applications
used in
procurement / CM
Improved use of
procurement
procedures
Improved
accountability
Greater use of
specilist buyers
Improved
negotiation
Improved
development of
specialist buyers
Fewer suppliers
Increased use of
electronic
procurement
Less off-contract
maverick spend
Increased awareness
of importance of using
procedures
Better new
contracts
Better use of
buying power
Better understanding
of suppliers and
marketplace
Improved
purchasing
decisions
Faster receipt of
services
Improved (use
of) MI
Easier document
control
Less labour
intensive tendering
cycle
MI on Suppliers
and
Marketplace
SAP e-
Procurement
Module
Train staff in
Contract
Management
Train staff in
use of system
Benefit Dependency Map
for objective
To
Improve Procurement

© Sigma (Bookham) Ltd
Strategy
Delivery
BRM / change process, with review points
1.
Set vision
and
objectives2.
Identify
benefits and
changes
3.
Finalise
requirements
& organise
resources4.
Optimise
plans & build
/ acquire
enablers
5.
Manage
implementation
& change
6.
Manage
performance
R6
R5
R4 R3
R2
R1
Engage
stakeholders

© Sigma (Bookham) Ltd
Aaioewty
0abua spfu
aspdo aps
Aaioewty
0abua spfu
aspdo aps
Aaioewty
0abua spfu
aspdo aps
Aaioewty
0abua spfu
aspdo aps
Aaioewty
0abua spfu
aspdo aps
Aaioewty
0abua spfu
aspdo aps
Aaioewty
0abua spfu
aspdo aps
Aaioewty
0abua spfu
aspdo aps
Aaioewty
0abua spfu
aspdo aps
Aaioewty
0abua spfu
aspdo aps
Aaioewty
0abua spfu
aspdo aps
Aaioewty
0abua spfu
aspdo aps
Aaioewty
0abua spfu
aspdo aps
Aaioewty
0abua spfu
aspdo aps
Aaioewty
0abua spfu
aspdo aps
Aaioewty
0abua spfu
aspdo aps
Aaioewty
0abua spfu
aspdo aps
Aaioewty
0abua spfu
aspdo aps
Aaioewty
0abua spfu
aspdo aps
Aaioewty
0abua spfu
aspdo aps
Aaioewty
0abua spfu
aspdo aps
Aaioewty
0abua spfu
aspdo aps
Aaioewty
0abua spfu
aspdo aps
Aaioewty
0abua spfu
aspdo aps
Aaioewty
0abua spfu
aspdo aps
Aaioewty
0abua spfu
aspdo aps
Aaioewty
0abua spfu
aspdo aps
Aaioewty
0abua spfu
aspdo aps
Aaioewty
0abua spfu
aspdo aps
Aaioewty
0abua spfu
aspdo aps
Aaioewty
0abua spfu
aspdo aps
Aaioewty
0abua spfu
aspdo aps
Aaioewty
0abua spfu
aspdo aps
Aaioewty
0abua spfu
aspdo aps
Aaioewty
0abua spfu
aspdo aps
Aaioewty
0abua spfu
aspdo aps
Aaioewty
0abua spfu
aspdo aps
Aaioewty
0abua spfu
aspdo aps
Aaioewty
0abua spfu
aspdo aps
To
…………
………..
To
…………
………..
To
…………
………..
To
…………
………..
To
…………
………..
To
…………
………..
To
…………
……….. To
…………
………..
To
…………
………..To
…………
………..
To
…………
………..
In a stakeholder workshop gather answers to one of the following questions:
• Why do we need to change? (it is usually helpful to make this more explicit –
e.g. why do we need to improve document handling? Avoid pre-empting the
solution in the question)
Group these answers and determine group headings expressed as objectives
Using drivers for change to determine objectives

© Sigma (Bookham) Ltd
Create a Strategy Map of linked objectives
For a programme to roll-out Benefit Realisation Management (BRM) within an organisation,
clustering and linkage resulted in the following Objectives Linkage Diagram (Strategy Map).
What would you choose as a set of key objectives for the programme?
To increase
awareness and
understanding of
benefit realisation
issues
To improve the
ROI of
programmes
To create
and maintain
an optimum
portfolio
To introduce a
standard Benefit
Management
Methodology
To
produce better
quality business
cases
To improve
stakeholder
engagement
To improve
business
strategy
To change to a
more benefit
focused culture
To improve
benefit tracking
and reporting
To increase
shareholder
value

© Sigma (Bookham) Ltd
Determine the bounding objectives for the change
For a programme to roll-out Benefit Realisation Management (BRM) within an organisation,
clustering and linkage resulted in the following Objectives Linkage Diagram (Strategy Map).
These objectives are key and bound the programme.
To increase
awareness and
understanding of
benefit realisation
issues
To improve the
ROI of
programmes
To create
and maintain
an optimum
portfolio
To introduce a
standard Benefit
Management
Methodology
To
produce better
quality business
cases
To improve
stakeholder
engagement
To improve
business
strategy
To change to a
more benefit
focused culture
To improve
benefit tracking
and reporting
To increase
shareholder
value

© Sigma (Bookham) Ltd
Intermediate
Benefit
Intermediate
Benefit
Intermediate
Benefit
Intermediate
Benefit
Intermediate
Benefit
Intermediate
Benefit
Intermediate
Benefit
Intermediate
Benefit
Intermediate
Benefit
Intermediate
Benefit
Intermediate
Benefit
Intermediate
Benefit
Intermediate
Benefit
Intermediate
Benefit
Intermediate
Benefit
Intermediate
Benefit
Creating the maps - Benefits then Benefit Dependency
1. Start with a bounding objective and determine a set of End Benefits
2. Complete Benefits Map continuing to work right to left
3. Turning the Benefits Map into a Benefit Dependency Map by working left to right
identifying and adding the necessary Enablers and Business Changes (BCs)
BC
BC
BC
BC
Enabler
Enabler
BC
Hope this work
s tom morrow
BC
BC
Enabler
Enabler
BC
BC
End
Benefit
End
Benefit
End
Benefit
Enabler
Enabler
Bounding
Objective
Enabler
BC
BC
BC
BCEnabler
BCEnabler
BCEnabler
BC
BCEnabler
Enabler BC

© Sigma (Bookham) Ltd
To reduce carbon
footprint
Start with a single objective of the change

© Sigma (Bookham) Ltd
To reduce carbon
footprint
Reduced carbon
emissions from
driving
Increased energy
conservation in
the home
Less air travel
Determine an equivalent set of End Benefits
The End Benefits should be:
• Collectively sufficient
• Individually necessary
• Mutually independent

© Sigma (Bookham) Ltd
Adding in the first level of intermediate benefits
To reduce carbon
footprint
Reduced carbon
emissions from
driving
Increased energy
conservation in
the home
Less air travel
Less use of car
transport
Greater use of
more carbon
friendly cars
More carbon
friendly driving (eg
at optimum speed)In a similar way these should ideally be:
• Collectively sufficient
• Individually necessary
• Mutually independent

© Sigma (Bookham) Ltd
To reduce carbon
footprint
Reduced carbon
emissions from
driving
Increased energy
conservation in
the home
Less air travel
Less use of car
transport
Greater use of
more carbon
friendly cars
More carbon
friendly driving (eg
at optimum speed)
Greater use of
energy saving
appliances
Less unnecessary
use of applicances
Improved
insulation of home
Adding in the first level of intermediate benefits

© Sigma (Bookham) Ltd
To reduce carbon
footprint
Reduced carbon
emissions from
driving
Increased energy
conservation in
the home
Less air travel
Less use of car
transport
Greater use of
more carbon
friendly cars
More carbon
friendly driving (eg
at optimum speed)
Greater use of
energy saving
appliances
Less unnecessary
use of applicances
Improved
insulation of home
Less air travel
per holiday day
Fewer holiday
days
Completing the first level of intermediate benefits
Note the inclusion of a disbenefit.
These should be identified alongside
benefits, though it is not always
appropriate to include them in the map

© Sigma (Bookham) Ltd
To reduce carbon
footprint
Reduced carbon
emissions from
driving
Increased energy
conservation in
the home
Less air travel
Less use of car
transport
Greater use of
more carbon
friendly cars
More carbon
friendly driving (eg
at optimum speed)
Greater use of
public transport
More walking
and cycling
Greater use of
energy saving
appliances
Less unnecessary
use of applicances
Improved
insulation of home
Fewer rushed
journeys
Less air travel
per holiday day
Fewer holiday
days
Adding in the second level of intermediate benefits

© Sigma (Bookham) Ltd
To reduce carbon
footprint
Reduced carbon
emissions from
driving
Increased energy
conservation in
the home
Less air travel
Less use of car
transport
Greater use of
more carbon
friendly cars
More carbon
friendly driving (eg
at optimum speed)
Greater use of
public transport
Increased use
of energy
saving bulbs
More walking
and cycling
Greater use of
energy saving
appliances
Less unnecessary
use of applicances
Improved
insulation of home
Increased readiness to
switch off unnecessary
appliances
Fewer rushed
journeys
Less air travel
per holiday day
Fewer holiday
days
Adding in the second level of intermediate benefits

© Sigma (Bookham) Ltd
To reduce carbon
footprint
Reduced carbon
emissions from
driving
Increased energy
conservation in
the home
Less air travel
Less use of car
transport
Greater use of
more carbon
friendly cars
More carbon
friendly driving (eg
at optimum speed)
Greater use of
public transport
Increased use
of energy
saving bulbs
More walking
and cycling
Greater use of
energy saving
appliances
Less unnecessary
use of applicances
Improved
insulation of home
Fewer longer
holidays requiring
air travel
More holidays that
don't require flying
Increased readiness to
switch off unnecessary
appliances
Fewer rushed
journeys
Less air travel
per holiday day
Fewer holiday
days
Completing the second level of intermediate benefits

© Sigma (Bookham) Ltd
To reduce carbon
footprint
Reduced carbon
emissions from
driving
Increased energy
conservation in
the home
Less air travel
Less use of car
transport
Greater use of
more carbon
friendly cars
More carbon
friendly driving (eg
at optimum speed)
Greater use of
public transport
Improved
availability of
public transport
Better journey
planning
Increased use
of energy
saving bulbs
More walking
and cycling
Greater use of
energy saving
appliances
Less unnecessary
use of applicances
Improved time
management
Improved
insulation of home
Fewer longer
holidays requiring
air travel
More holidays that
don't require flying
Increased readiness to
switch off unnecessary
appliances
Fewer rushed
journeys
Less air travel
per holiday day
Fewer holiday
days
Completing the Benefits Map
At this stage it
is nothing
more than a
structured
wish list
© Sigma (Bookham) Ltd
To reduce carbon
footprint
Reduced carbon
emissions from
driving
Increased energy
conservation in the
home
Less air travel
Less use of car
transport
Greater use of more
carbon friendly cars
More carbon friendly
driving (eg at
optimum speed)
Greater use of
public transport
Improved
availability of
public transport
Better journey
planning
Increased use of
energy saving
bulbs
More walking and
cycling
Greater use of
energy saving
appliances
Less unnecessary
use of applicances
Improved time
management
Improved insulation
of home
Fewer longer
holidays requiring air
travel
More holidays that
don't require flying
Increased readiness to
switch off unnecessary
appliances
Fewer rushed
journeys
Lobby national
and local
government
New Bicycle
Delegate more
More efficient
boiler
Check & remedy
where insulation
could be improved
Investigate UK &
Eurpoean
options
Take holidays in
longer blocks
Less air travel
per holiday day
Fewer holiday
days
Enabler
Business
Change
Intemediate
Benefit
End Benefit
Primary /
Bounding
Objective
Disbenefit
KEY
The Benefit Dependency Map is then constructed by
adding the required enablers & changes

© Sigma (Bookham) Ltd
Generic Benefits Map to illustrate weighting
Bounding
Objective
End Benefit
End Benefit
End Benefit
Intermediate
Benefit
Intermediate
Benefit
Intermediate
Benefit
Intermediate
Benefit
Intermediate
Benefit
Intermediate
Benefit
Intermediate
Benefit
Intermediate
Benefit
Intermediate
Benefit
Intermediate
Benefit
Intermediate
Benefit
Intermediate
Benefit
Intermediate
Benefit
Intermediate
Benefit
Intermediate
Benefit

© Sigma (Bookham) Ltd
Bounding
Objective
End Benefit
End Benefit
End Benefit
Intermediate
Benefit
Intermediate
Benefit
Intermediate
Benefit
Intermediate
Benefit
Intermediate
Benefit
Intermediate
Benefit
Intermediate
Benefit
Intermediate
Benefit
Intermediate
Benefit
Intermediate
Benefit
Intermediate
Benefit
Intermediate
Benefit
Intermediate
Benefit
Intermediate
Benefit
Intermediate
Benefit
60%
30%
10%
30%
30%
40%
40%
40%
20%
70%
30%
40%
100%
25%
60%
35%
50%
50%
30%
60%
40%
40%
60%
100%
75%
25%
80%
20%
100%
40%
70%
Generic Benefits Map with weighted paths

© Sigma (Bookham) Ltd
Using weightings to compute relative scores
Bounding
Objective
1,000
End Benefit
600
End Benefit
300
End Benefit
100
Intermediate
Benefit
180
Intermediate
Benefit
180
Intermediate
Benefit
360
Intermediate
Benefit
120
Intermediate
Benefit
130
Intermediate
Benefit
30
Intermediate
Benefit
342
Intermediate
Benefit
234
Intermediate
Benefit
243
Intermediate
Benefit
169
Intermediate
Benefit
12
Intermediate
Benefit
137
Intermediate
Benefit
621
Intermediate
Benefit
196
Intermediate
Benefit
46
60%
30%
10%
30%
30%
40%
40%
40%
20%
70%
30%
40%
100%
25%
60%
35%
50%
50%
30%
60%
40%
40%
60%
100%
75%
25%
80%
20%
100%
40%
70%

© Sigma (Bookham) Ltd
1,000
To reduce carbon
footprint
500
Reduced carbon
emissions from
driving
150
Increased energy
conservation in the
home
350
Less air travel
150
Less use of car
transport
150
Greater use of more
carbon friendly cars
200
More carbon friendly
driving (eg at
optimum speed)
112
Greater use of
public transport
45
Improved
availability of
public transport
80
Better journey
planning
24
Increased use of
energy saving
bulbs
38
More walking and
cycling
60
Greater use of
energy saving
appliances
60
Less unnecessary
use of applicances
120
Improved time
management
30
Improved insulation
of home
60
Increased readiness to
switch off unnecessary
appliances
200
Fewer rushed
journeys
50%
15%
35%
30%
30%
40%
40%
20%
40%
25%
75%40%
100%60%
40%
40%
Lobby national
and local
government
New Bicycle
Delegate more
More efficient
boiler
Check & remedy
where insulation
could be improved
Investigate UK &
Eurpoean options
Take holidays in
longer blocks 70%
30%
100%
245
Less air travel per
holiday day
105
Fewer holiday
days
122
Fewer but longer
holidays requiring
air travel
122
More holidays that
don't require flying
50%
50%
Enabler
Business
Change
Intemediate
Benefit
End Benefit
Primary /
Bounding
Objective
Disbenefit
KEY
Paths are weighted and scores computed to facilitate
the prioritisation of options

© Sigma (Bookham) Ltd
Case Example: Challenge to transform organisation
Improve processes Change behaviours and culture
OGC Gateway – “weak on
benefits, get help from BRM
specialist”, such as sigma
Set up Programme &
applied LEAN
New generic processes
Many hundreds of
improvement
opportunities
identified
No mechanism for
prioritisation or alignment with
Business Strategy
sigma’s BRM applied,
especially sigma’s
mapping
SRO attended BRM
Masterclass facilitated by
sigma
sigmacommissioned
sigma’s maps used to
prioritise the process
improvements and identify
the required business and
cultural changes

© Sigma (Bookham) Ltd
How the maps feed other important documents
No: Benefit in Short:
Detailed Description:
Benefit Category:
Business Impact:
No: Business Objective Supported: No: Other benefits contributed to:
sigma Value
type: Scorecard:
MA
NA
GE
ME
NT
CO
MM
ITM
EN
T
Target Value: Change Type:
Enablers – Features:
EN
AB
LE
RS
Required Business Changes:
Culture Organisational Policy Process
BU
SIN
ES
S A
CT
ION
Name / Job Title: Function / Dept:
Who receives the benefit:
Who is accountable:
Measures: Current Value: Target Value: Start Time
End Time
Frequency:
AC
CO
UN
TA
BIL
ITY
To whom are measures reported:
AL
L
Issues / Risks
Benefit Profile
Intermediate
Benefit
Intermediate
Benefit
Intermediate
Benefit
Intermediate
Benefit
Intermediate
Benefit
Intermediate
Benefit
Intermediate
Benefit
Intermediate
Benefit
Intermediate
Benefit
Intermediate
Benefit
Intermediate
Benefit
Intermediate
Benefit
Intermediate
Benefit
Intermediate
Benefit
Intermediate
Benefit
Intermediate
Benefit
Intermediate
Benefit
Intermediate
Benefit
Intermediate
Benefit
Intermediate
Benefit
Intermediate
Benefit
Intermediate
Benefit
Intermediate
Benefit
Intermediate
Benefit
Intermediate
Benefit
Intermediate
Benefit
Intermediate
Benefit
Intermediate
Benefit
Intermediate
Benefit
Intermediate
Benefit
Intermediate
Benefit
Intermediate
Benefit
Intermediate
Benefit
Intermediate
Benefit
Intermediate
Benefit
Intermediate
Benefit
Intermediate
Benefit
Intermediate
Benefit
Intermediate
Benefit
Intermediate
Benefit
Intermediate
Benefit
Intermediate
Benefit
Intermediate
Benefit
Intermediate
Benefit
Intermediate
Benefit
Intermediate
Benefit
Intermediate
Benefit
Intermediate
BenefitBC
BC
BC
BC
Enabler
Enabler
BC
Hope this work
s tom morrow
BC
BC
Enabler
Enabler
BC
BC
End
Benefit
End
Benefit
End
Benefit
End
Benefit
End
Benefit
End
Benefit
Enabler
Enabler
Bounding
Objective
Enabler
BC
BC
BC
BCEnabler BCEnabler
BCEnabler BCEnabler
BCEnabler
BC
BCEnabler
BC
BCEnabler BCEnabler
Enabler BCEnabler BC
Sigma’s Benefit Dependency Map
Risk Register
Benefit Realisation Plan Business Case
Current Final
Front Office
Back Office
Support
Blueprint
Change Action PlanNo. Enabler / Business Change Map Score Cost PPP Id. Owner Start Date End Date Benefits which it directly enables
No: Benefit in Short:
Detailed Description:
Benefit Category:
Business Impact:
No: Business Objective Supported: No: Other benefits contributed to:
sigma Value
type: Scorecard:
MA
NA
GE
ME
NT
CO
MM
ITM
EN
T
Target Value: Change Type:
Enablers – Features:
EN
AB
LE
RS
Required Business Changes:
Culture Organisational Policy Process
BU
SIN
ES
S A
CT
ION
Name / Job Title: Function / Dept:
Who receives the benefit:
Who is accountable:
Measures: Current Value: Target Value: Start Time
End Time
Frequency:
AC
CO
UN
TA
BIL
ITY
To whom are measures reported:
AL
L
Issues / Risks
Benefit Profile
Stakeholder role / name
Benefits to be receivedRef. No. Description Due date
Disbenefits expectedRef. No. Description Due date
Benefits which stakeholder is responsible for achievingRef. No. Description Measures Target Timescale
Benefits which stakeholder is responsible for tracking and reportingRef. No. Description Measures Target Timescale
Changes which stakeholder is responsible for deliveringRef. No. Description Actions Start date End date
Changes which stakeholder is likely to experienceRef. No. Description Actions Start date End date
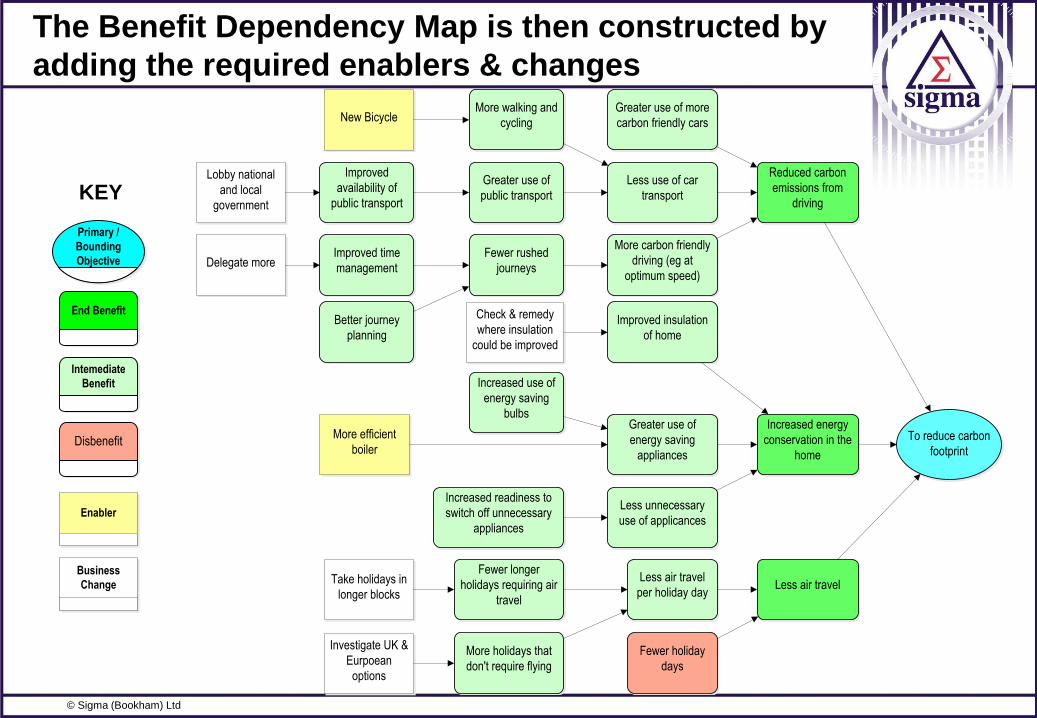
Stakeholder Profile
Stakeholder role / name
Benefits to be receivedRef. No. Description Due date
Disbenefits expectedRef. No. Description Due date
Benefits which stakeholder is responsible for achievingRef. No. Description Measures Target Timescale
Benefits which stakeholder is responsible for tracking and reportingRef. No. Description Measures Target Timescale
Changes which stakeholder is responsible for deliveringRef. No. Description Actions Start date End date
Changes which stakeholder is likely to experienceRef. No. Description Actions Start date End date
Stakeholder Profile
BDMs feed key portfolio, programme & project docs

© Sigma (Bookham) Ltd
No: Benefit in Short:
Detailed Description:
Benefit Category:
Business Impact:
No: Business Objective Supported: No: Other benefits contributed to:
sigma Value
type: Scorecard:
MA
NA
GE
ME
NT
CO
MM
ITM
EN
T
Target Value: Change Type:
Enablers – Features:
EN
AB
LE
RS
Required Business Changes:
Culture Organisational Policy Process
BU
SIN
ES
S A
CT
ION
Name / Job Title: Function / Dept:
Who receives the benefit:
Who is accountable:
Measures: Current Value: Target Value: Start Time
End Time
Frequency:
AC
CO
UN
TA
BIL
ITY
To whom are measures reported:
AL
L
Issues / Risks
Benefit Profile
© Sigma (Bookham) Ltd
Name of stakeholder:
Benefits to be receivedRef. No. Description Due date
Disbenefits expectedRef. No. Description Due date
Benefits which stakeholder is responsible for achievingRef. No. Description Measures Target Timescale
Benefits which stakeholder is responsible for tracking and reportingRef. No. Description Measures Target Timescale
Changes which stakeholder is responsible for deliveringRef. No. Description Actions Start date End date
Changes which stakeholder is likely to experienceRef. No. Description Actions Start date End date
Stakeholder Profile
MSP 2011 supports
this concept but
limits its scope to
programme rather
than portfolio level

© Sigma (Bookham) Ltd
Key benefits and
disbenefits by
stakeholder Exe
cu
tive
Ma
na
gem
en
t
Bu
sin
es
s
Ma
na
gem
en
t
Bu
sin
es
s U
se
rs
IS F
un
cti
on
Pro
gra
mm
e T
ea
m
Fin
an
ce
Fu
ncti
on
Key Benefits
More effective project portfolio
Earlier recognition of ineffective projects
More financial benefits realised
More non-financial benefits realised
Improved management of risk
Reduced IS/IT costs
Improved image of IS/IT
Key disbenefits
Extra effort by business
Slower start to programme
IS Project Targets threatened
BRM considers and engages stakeholders
MSP 2007 has an example – Fig. 7.10

© Sigma (Bookham) Ltd
Classifying benefits - sigma value types
These benefit types are now recognised and recommended in MSP2007 (Table 7.2)
Increased sales
Quicker
performance of
tasks
Improved
management of
insurance risk
Greater customer
satisfaction
Reduced costsFewer steps in a
process
Improved image
Sigma
Value typeDefinition
Example
Financial/
CashableNon-financial/
Non-cashable
T
a
n
g
i
b
l
e
Definite
Expected
Logical
Intangible
Value may be predicted
on the basis of someone
else’s experience or
based on historic trends
Logically may be
anticipated and whose
value may be measured
but not predicted
May be anticipated but
difficult to substantiate
Value may be predicted
with confidence or
certainty – not affected
by external factors
Measu
rab
le
© Sigma (Bookham) Ltd
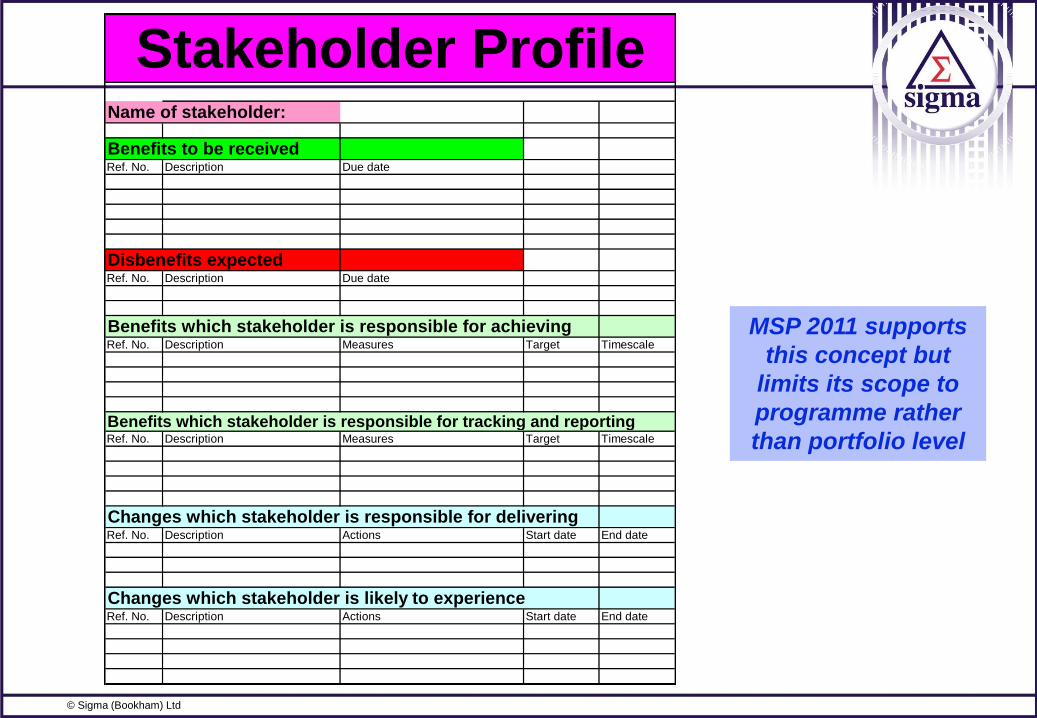
Non-financial benefits are non-financial but are still key
If the benefit is “fewer steps in a process”, the measure, which is also the value of the benefit is the
number of steps in the process – the baseline may be 72 and the target 55 and the value at any point
is the current number of steps in the process.
It is important not to try to give this a financial value, as of itself it is not a financial benefit. It may lead
to a financial benefit, which would be shown on the Benefit Map, but this depends on the intention.
Value benefits in the way they are described
1 Fewer
steps in a process
2 Faster response to
customers
3 Improved productivity
4 More time
spent with customers
5 More coffee breaks
6 Shorter working day
7 Fewer staff
8 Increased sales
revenue
9 Improved networking
10 Improved staff morale
11 Reduced salary costs

© Sigma (Bookham) Ltd
Non-financial benefits are non-financial but are still key
If the benefit is “fewer steps in a process”, the measure, which is also the value of the benefit is the
number of steps in the process – the baseline may be 72 and the target 55 and the value at any point
is the current number of steps in the process.
It is important not to try to give this a financial value, as of itself it is not a financial benefit. It may lead
to a financial benefit, which would be shown on the Benefit Map, but this depends on the intention.
Value benefits in the way they are described
1 Fewer steps in a process
2 Faster response to customers
3 Improved productivity
4 More time spent with customers
5 More coffee breaks
6 Shorter working day
7 Fewer staff
8 Increased sales
revenue
9 Improved networking
10 Improved staff morale
11 Reduced salary costs

© Sigma (Bookham) Ltd
Use maps with RAG to monitor portfolio’s components
Less
frustration for
customers
Improved
image
Improved
customer
service
Fewer errors
Increased
sales
revenue
Improved
customer
retention
More quality
time with
customers
More focused
selling
Improved
staff morale
Less unpaid
overtime
Increased
productivity
Easier sales
processing
Better information
on customer and
sales profitability
Customer
Database and
Sales System
More new
customers
To increase
sales revenue
Customer
database and
Sales
processing
system
Benefits Map for a High Street Bank Programme:
*
* Overtime was not paid and staff typically worked over 9 hours per day but were only paid for 7.5 hours.

© Sigma (Bookham) Ltd
Measures with baselines, targets and timescales.
MeasureBaseline
value
Start
Period
End
Period
Target
ValuePeriod 1 Period 2 Period 3 Period 4
No. of errors per 100 sales 7.5 1 3 2.5
No. of written complaints per week 9 2 4 2
No. of phone complaints per week 2 4 5
Customer service rating (%) 55 3 8 80
No. of sales processed pp per day 8.5 2 4 12
Value of sales processes pp per day £480 2 4 £750
Total overtime worked per week (hr) 55 2 4 15
Staff morale rating (%) 68 3 6 80
Time spent with customers (hr/wk) 450 3 6 1000
No. of new customers per period 3 4 7 10
No. of lost customers per period 5 4 7 2
Lead conversion rate (%) 28 4 8 40
Sales revenue £300,000 4 9 £1m
Period = 3 months
7
10
25
55
8.5
£500
90
72
40
3
5
25
£286,000
4
8
21
60
9.0
£600
80
72
45
4
4
33
£275,000
3
6
15
70
10
£680
50
75
60
3
4
33
£290,000
2.5
4
9
82
12
£770
25
82
90
7
3
33
£350,000
Tracking the benefits

© Sigma (Bookham) Ltd
Measure reporting – planned and actual – by owner
MeasureBaseline
value
Start
Period
End
Period
Target
ValuePeriod 1 Period 2 Period 3 Period 4
No. of errors per 100 sales 7.5 1 3 2.5 7 4 3 2.5
No. of written complaints per week 9 2 4 2 10 8 6 4
No. of phone complaints per week 2 4 5 25 21 15 9
Customer service rating (%) 55 3 8 80 55 60 70 82
No. of sales processed pp per day 8.5 2 4 12 8.5 9 10 12
Value of sales processes pp per day £480 2 4 £750 £500 £600 £680 £770
Total overtime worked per week (hr) 55 2 4 15 56 50 35 20
Staff morale rating (%) 68 3 6 80 70 72 74 75
Time spent with customers (hr/wk) 450 3 6 1000 440 450 520 660
No. of new customers per period 3 4 7 10 3 4 3 7
No. of lost customers per period 5 4 7 2 5 4 4 3
Lead conversion rate (%) 28 4 8 40 25 33 33 33
Sales revenue £300,000 4 9 £1m £286,000 £275,000 £290,000 £350,000
Period = 3 months
Sales Manager
Sales Processing Manager
Customer Relationship Manager
HR Manager

© Sigma (Bookham) Ltd
Less
frustration for
customers
Improved
image
Improved
customer
service
Fewer errors
Increased
sales revenue
Improved
customer
retention
More quality
time with
customers
More focused
selling
Improved staff
morale
Less unpaid
overtime
Increased
productivity
Easier sales
processing
Better information on
customer and sales
profitability
Customer
Database and
Sales System
More new
customers
RAG Report - Immediately after implementation
Not due to reach target
On or above target
Within 20% of target
Outside 20% of target
Not due to reach target
On or above target
Within 20% of target
Outside 20% of target
Not due to reach target
On or above target
Within 20% of target
Outside 20% of target
Not due to reach target
On or above target
Within 20% of target
Outside 20% of target
Customer
database and
Sales
processing
system

© Sigma (Bookham) Ltd
RAG Report – 6 months after implementation
Not due to reach target
On or above target
Within 20% of target
Outside 20% of target
Not due to reach target
On or above target
Within 20% of target
Outside 20% of target
Not due to reach target
On or above target
Within 20% of target
Outside 20% of target
Not due to reach target
On or above target
Within 20% of target
Outside 20% of target
Less
frustration for
customers
Improved
image
Improved
customer
service
Fewer errors
Increased
sales revenue
Improved
customer
retention
More quality
time with
customers
More focused
selling
Improved staff
morale
Less unpaid
overtime
Increased
productivity
Easier sales
processing
Better information on
customer and sales
profitability
Customer
Database and
Sales System
More new
customers
Customer
database and
Sales
processing
system

© Sigma (Bookham) Ltd
RAG Report – 1 year after implementation
Not due to reach target
On or above target
Within 20% of target
Outside 20% of target
Not due to reach target
On or above target
Within 20% of target
Outside 20% of target
Not due to reach target
On or above target
Within 20% of target
Outside 20% of target
Not due to reach target
On or above target
Within 20% of target
Outside 20% of target
Less
frustration for
customers
Improved
image
Improved
customer
service
Fewer errors
Increased
sales revenue
Improved
customer
retention
More quality
time with
customers
More focused
selling
Improved staff
morale
Less unpaid
overtime
Increased
productivity
Easier sales
processing
Better information on
customer and sales
profitability
Customer
Database and
Sales System
More new
customers
Customer
database and
Sales
processing
system

© Sigma (Bookham) Ltd
RAG Report – 2 years after implementation
Not due to reach target
On or above target
Within 20% of target
Outside 20% of target
Not due to reach target
On or above target
Within 20% of target
Outside 20% of target
Not due to reach target
On or above target
Within 20% of target
Outside 20% of target
Not due to reach target
On or above target
Within 20% of target
Outside 20% of target
Less
frustration for
customers
Improved
image
Improved
customer
service
Fewer errors
Increased
sales revenue
Improved
customer
retention
More quality
time with
customers
More focused
selling
Improved staff
morale
Less unpaid
overtime
Increased
productivity
Easier sales
processing
Better information on
customer and sales
profitability
Customer
Database and
Sales System
More new
customers
Customer
database and
Sales
processing
system

© Sigma (Bookham) Ltd
Some good news
Benefit Realisation Management (BRM)
can and does make a difference
Instead of 20% of potential benefits you
could be enjoying at least 80% of
potential benefits
And reduce project costs

© Sigma (Bookham) Ltd
For further information and help
Reading – both books available to view today:
Benefit Realisation Management – A Practical Guide to Achieving Benefits through Change
by Gerald Bradley (Gower – 2nd edition 2010)*
Fundamentals of Benefit Realization – MSP Companion Guide by Gerald Bradley (TSO 2010)
Practical BRM Training – from Peak Consulting
*At specially discounted price if bought today (Danish 350 Krona which is
about half normal price)
Available to buy today – Benefit Realisation Management

© Change Director UK Ltd
Thank you for
listening

© Sigma (Bookham) Ltd
Presenter
• Gerald Bradley
• Chairman of Sigma Consulting
• Pioneer of Benefit Realisation Management
• Mentor and reviewer of OGC’s Managing
Successful Programmes (MSP) 2007
• Author of Benefit Realisation Management
(Gower) 2nd edition – May 2010
• Author of Fundamentals of Benefit Realization
(TSO) – Companion Volume to MSP – Sep 2010
• Facilitator of the BRM Master-classes for SROs in
the MOD – 2004-2015
• +44 1202 480 257
• + 44 7786 061 662