Benefit Calculation, Monetization and Resiliency A12 ... · Benefit Calculation, Monetization and...
40
August 2017 Benefit Calculation, Monetization and Resiliency A12: Uncertainty Analysis Pacheco Reservoir Expansion Project
Transcript of Benefit Calculation, Monetization and Resiliency A12 ... · Benefit Calculation, Monetization and...

August 2017
Benefit Calculation, Monetization and Resiliency
A12: Uncertainty Analysis
Pacheco Reservoir Expansion Project

This page left blank intentionally.
Contents
Benefit Calculation, Monetization and Resiliency A.12 Uncertainty Analysis August 2017 – i
Contents
Page
CHAPTER 1 INTRODUCTION ............................................................................... 1-1 1.1 Introduction .................................................................................................. 1-1 1.2 Scenarios Analyzed ..................................................................................... 1-1 1.3 Summary of Results ..................................................................................... 1-2
CHAPTER 2 Climate Change ............................................................................... 2-1 2.1 Wetter/Moderate-Warming Uncertainty Scenario ......................................... 2-1
2.1.1 Ecosystem Improvement – Pacheco Creek .......................................... 2-1 2.1.2 Ecosystem Improvement – San Joaquin River Watershed ................... 2-2 2.1.3 Emergency Response ........................................................................... 2-3 2.1.4 Municipal and Industrial Water Supply .................................................. 2-3 2.1.5 Municipal and Industrial Water Quality .................................................. 2-4
2.2 Drier/Extreme-Warming Uncertainty Scenario ............................................. 2-5 2.2.1 Ecosystem Improvement – Pacheco Creek .......................................... 2-5 2.2.2 Ecosystem Improvement – Delta Watershed ........................................ 2-5 2.2.3 Emergency Response ........................................................................... 2-6 2.2.4 Municipal and Industrial Water Supply .................................................. 2-6 2.2.5 Municipal and Industrial Water Quality .................................................. 2-7
CHAPTER 3 Future projects and water management actions .......................... 3-1 3.1 Moderate Growth Scenario .......................................................................... 3-1
3.1.1 Ecosystem Improvement – Pacheco Creek .......................................... 3-2 3.1.2 Ecosystem Improvement – San Joaquin River Watershed ................... 3-2 3.1.3 Emergency Response ........................................................................... 3-2 3.1.4 Municipal and Industrial Water Supply .................................................. 3-3 3.1.5 Municipal and Industrial Water Quality .................................................. 3-4
3.2 Expanded Water Supply Portfolio Scenario ................................................. 3-4 3.2.1 Ecosystem Improvement – Pacheco Creek .......................................... 3-7 3.2.2 Ecosystem Improvement – San Joaquin River Watershed ................... 3-7 3.2.3 Emergency Response ........................................................................... 3-7 3.2.4 Municipal and Industrial Water Supply .................................................. 3-8 3.2.5 Municipal and Industrial Water Quality .................................................. 3-9
CHAPTER 4 Other Sources of Uncertainty ......................................................... 4-1 CHAPTER 5 Project Performance During a Drought ......................................... 5-1
5.1.1 Ecosystem Improvement – Pacheco Creek .......................................... 5-1 5.1.2 Ecosystem Improvement – San Joaquin River Watershed ................... 5-1 5.1.3 Emergency Response ........................................................................... 5-1
CHAPTER 6 References ....................................................................................... 6-1
Contents
Benefit Calculation, Monetization and Resiliency ii – August 2017 A.12 Uncertainty Analysis
Tables
Table 1-1. Summary of Pacheco Creek Steelhead Cohort Scores for 2070 Future Conditions and 2070 Uncertainty Scenarios ...................................................... 1-2
Table 1-2. Summary of Increased Groundwater and Surface Water Storage Available for Emergency Response for 2070 Uncertainty Scenarios ................. 1-3
Table 2-1. Summary of Pacheco Creek Steelhead Cohort Scores by Water Year Type Under 2070 Future Conditions .................................................................. 2-2
Table 2-2. Summary of Pacheco Creek Steelhead Cohort Scores by Water Year Type Under 2070 Wetter/Moderate-Warming Uncertainty Scenario .................. 2-2
Table 2-3. Increased Environmental Water Supplies for San Joaquin River Watershed Wildlife Refuges under 2070 Wetter/Moderate-Warming Uncertainty Scenario ......................................................................................... 2-2
Table 2-4. Increased Groundwater and Surface Water Storage Available for Emergency Response under 2070 Wetter/Moderate-Warming Uncertainty Scenario ............................................................................................................ 2-3
Table 2-5. Increased M&I Water Supply under 2070 Wetter/Moderate-Warming Uncertainty Scenario ......................................................................................... 2-4
Table 2-6. Improved M&I Water Quality through Reduced Incidence of Low Point Issues in San Luis Reservoir for 2070 Future Conditions and 2070 Wetter/Moderate-Warming Uncertainty Scenario .............................................. 2-4
Table 2-7. Summary of Pacheco Creek Steelhead Cohort Scores by Water Year Type Under 2070 Drier/Extreme-Warming Uncertainty Scenario ...................... 2-5
Table 2-8. Increased Environmental Water Supplies for San Joaquin River Watershed Wildlife Refuges Under 2070 Drier/Extreme-Warming Uncertainty Scenario ......................................................................................... 2-5
Table 2-9. Increased Groundwater and Surface Water Storage Available for Emergency Response Under 2070 Drier/Extreme-Warming Uncertainty Scenario ............................................................................................................ 2-6
Table 2-10. Increased M&I Water Supplies under 2070 Drier/Extreme-Warming Uncertainty Scenario ......................................................................................... 2-7
Table 2-11. Improved M&I Water Quality through Reduced Incidence of Low Point Issues in San Luis Reservoir for 2070 Future Conditions and 2070 Drier/Extreme-Warming Uncertainty Scenario ................................................... 2-7
Table 3-1. Summary of Pacheco Creek Steelhead Cohort Scores by Water Year Type Under 2070 Moderate Growth Scenario ................................................... 3-2
Table 3-2. Increased Groundwater and Surface Water Storage Available for Emergency Response Under 2070 Moderate Growth Scenario ........................ 3-3
Contents
Benefit Calculation, Monetization and Resiliency A.12 Uncertainty Analysis August 2017 – iii
Table 3-3. Increased M&I Water Supplies under 2070 Moderate Growth Scenario ..... 3-3
Table 3-4. Improved M&I Water Quality through Reduced Incidence of Low Point Issues in San Luis Reservoir for 2070 Future Conditions and 2070 Moderate Growth Scenario ................................................................................ 3-4
Table 3-5. Additional Supply Projects and Programs Included in the Expanded Water Supply Portfolio Scenario ........................................................................ 3-5
Table 3-6. Components on No Regrets Package ......................................................... 3-6
Table 3-7. Summary of Pacheco Creek Steelhead Cohort Scores by Water Year Type Under 2070 Expanded Water Supply Portfolio Scenario .......................... 3-7
Table 3-8. Increased Groundwater and Surface Water Storage Available for Emergency Response Under 2070 Expanded Water Supply Portfolio Scenario ............................................................................................................ 3-8
Table 3-9. Increased M&I Water Supplies under 2070 Expanded Water Supply Portfolio Scenario .............................................................................................. 3-8
Table 3-10. Improved M&I Water Quality through Reduced Incidence of Low Point Issues in San Luis Reservoir for 2070 Future Conditions and 2070 Expanded Water Supply Portfolio Scenario ....................................................... 3-9
Table 5-1. Summary of Pacheco Creek Steelhead Cohort Score for 1987 to 1991 Drought Period Under 2070 Future Conditions ................................................. 5-1
Table 5-2. Pacheco Creek Reach Flows by Month During 1987-1991 Drought Period for Without-Project under 2070 Future Conditions ................................. 5-3
Table 5-3. Pacheco Creek Reach Flows by Month During 1987-1991 Drought Period for With-Project under 2070 Future Conditions ...................................... 5-5
Table 5-4. Increased Groundwater and Surface Water Storage Available for Emergency Response for 1987 to 1991 Drought Period Under 2070 Future Conditions .............................................................................................. 5-1
Contents
Benefit Calculation, Monetization and Resiliency iv – August 2017 A.12 Uncertainty Analysis
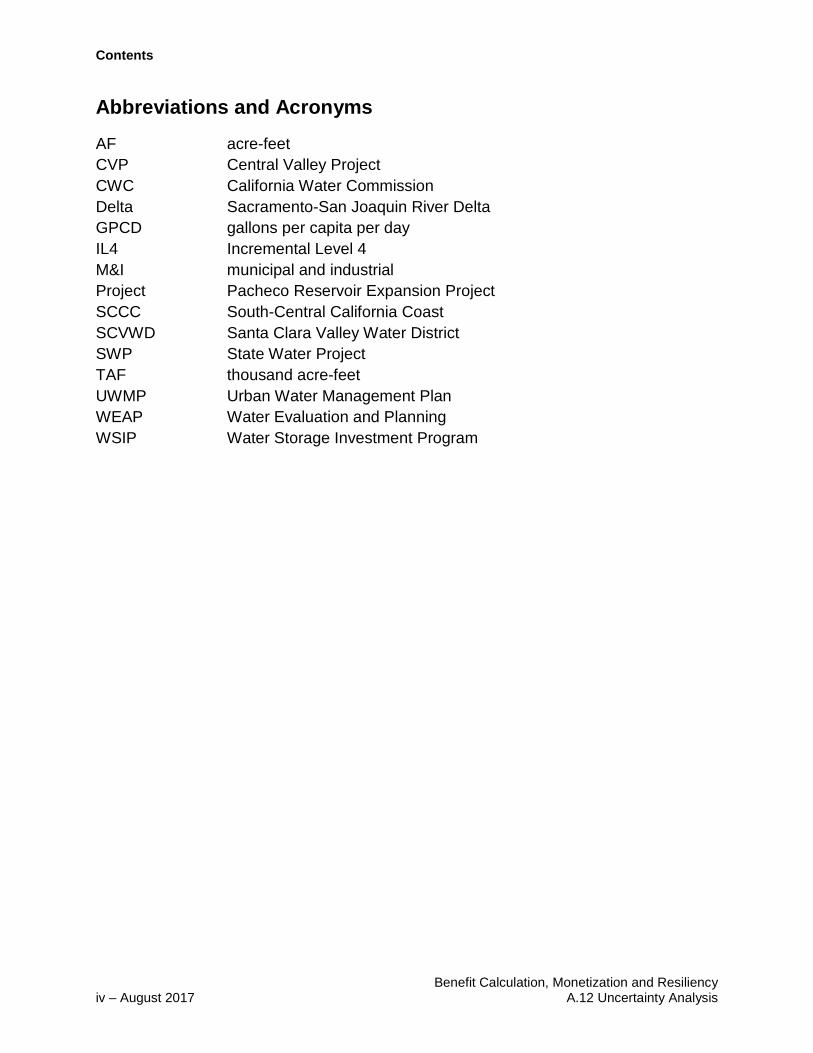
Abbreviations and Acronyms
AF acre-feet CVP Central Valley Project CWC California Water Commission Delta Sacramento-San Joaquin River Delta GPCD gallons per capita per day IL4 Incremental Level 4 M&I municipal and industrial Project Pacheco Reservoir Expansion Project SCCC South-Central California Coast SCVWD Santa Clara Valley Water District SWP State Water Project TAF thousand acre-feet UWMP Urban Water Management Plan WEAP Water Evaluation and Planning WSIP Water Storage Investment Program

Pacheco Reservoir Expansion Project
Benefit Calculation, Monetization and Resiliency A.12 Uncertainty Analysis August 2017 – 1-1
CHAPTER 1 INTRODUCTION
1.1 Introduction This attachment describes the uncertainty analysis conducted for the Pacheco Reservoir Expansion Project (Project), pursuant to Section 6004(a)(8) of the California Code of Regulations.
1.2 Scenarios Analyzed Five different analyses were conducted in order to quantify the impact on Project benefits from uncertainty in various model assumptions, including climatic conditions, water demand levels, various water supply portfolios, and drought performance. The analyses examined different sources of uncertainty, including:
• Climate change: Modeling was conducted under the two extreme 2070 climate conditions provided by the California Water Commission (CWC)—wetter/moderate warming and drier/extreme-warming.
• Future projects and water management actions: Modeling was conducted under two different scenarios—an Expanded Water Supply Portfolio Scenario and a Moderate Growth Scenario. These scenarios represent possible uncertainties in Santa Clara Valley Water District’s (SCVWD) system assumptions in 2070.
• Other sources of uncertainty: These were analyzed qualitatively.
• Project performance during a drought: Public benefits under 2070 future conditions were analyzed for the 1987-91 drought period.
Pacheco Reservoir operational rules are the same as those used for for the 2070 future conditions model runs, as described in Chapters 3 and 4 of Benefit Calculation, Monetization, and Resiliency Attachment A1: Project Conditions. Pacheco Reservoir releases are made, to the greatest extent possible, to meet the Pacheco Creek streamflow targets in both with- and without-Project runs, with winter releases reduced under the same conditions as in the 2070 future conditions run. In the with-Project runs the expanded Pacheco Reservoir is used to store inflow and imported supplies and to provide water for deliveries to meet demands. Releases for deliveries to Pacheco Conduit (for SCVWD) are conditional, based on storage being above 95 thousand acre-feet (TAF), which is the level sufficient to maintain suitable flows and temperatures for steelhead habitat in Pacheco Creek.
This analysis was conducted using SCVWD’s Water Evaluation and Planning (WEAP) model and the Pacheco Creek Steelhead Habitat Suitability Model. Except as described in subsequent sections, assumptions for WEAP and the Pacheco Creek Steelhead Habitat Suitability Model are identical to those described in Chapters 3 and 4 of Benefit Calculation, Monetization, and
Pacheco Reservoir Expansion Project
Benefit Calculation, Monetization and Resiliency 1-2 – August 2017 A.12 Uncertainty Analysis
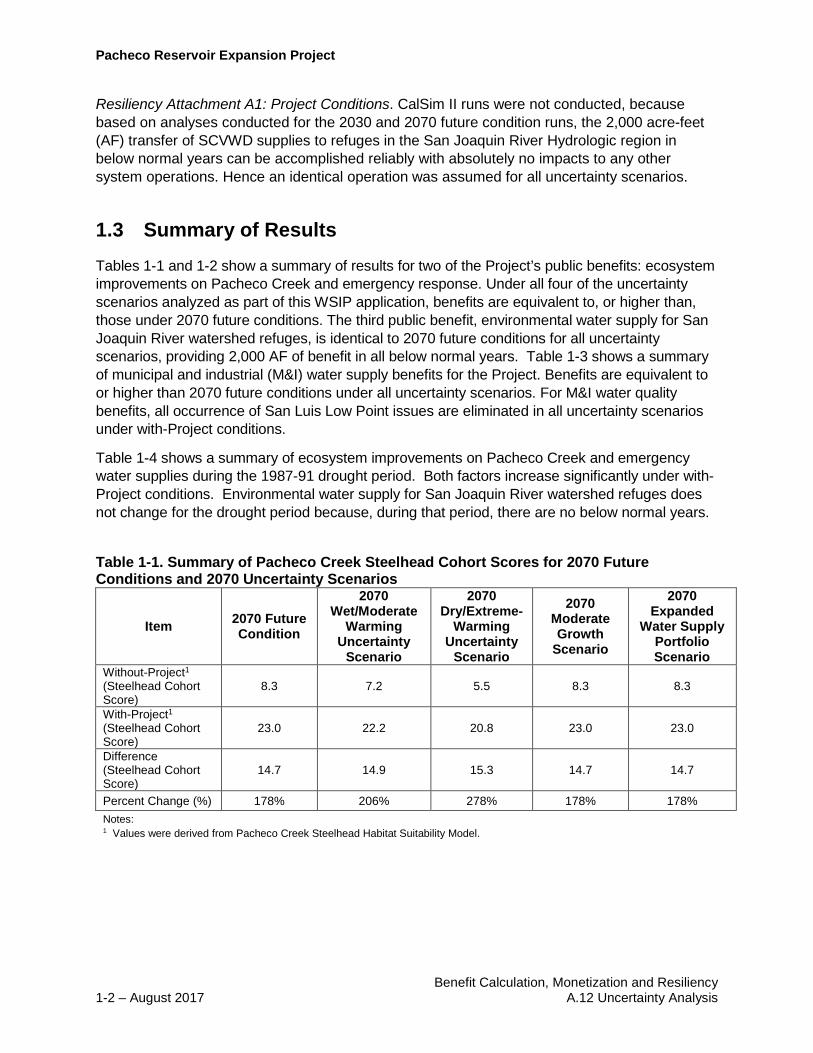
Resiliency Attachment A1: Project Conditions. CalSim II runs were not conducted, because based on analyses conducted for the 2030 and 2070 future condition runs, the 2,000 acre-feet (AF) transfer of SCVWD supplies to refuges in the San Joaquin River Hydrologic region in below normal years can be accomplished reliably with absolutely no impacts to any other system operations. Hence an identical operation was assumed for all uncertainty scenarios.
1.3 Summary of Results Tables 1-1 and 1-2 show a summary of results for two of the Project’s public benefits: ecosystem improvements on Pacheco Creek and emergency response. Under all four of the uncertainty scenarios analyzed as part of this WSIP application, benefits are equivalent to, or higher than, those under 2070 future conditions. The third public benefit, environmental water supply for San Joaquin River watershed refuges, is identical to 2070 future conditions for all uncertainty scenarios, providing 2,000 AF of benefit in all below normal years. Table 1-3 shows a summary of municipal and industrial (M&I) water supply benefits for the Project. Benefits are equivalent to or higher than 2070 future conditions under all uncertainty scenarios. For M&I water quality benefits, all occurrence of San Luis Low Point issues are eliminated in all uncertainty scenarios under with-Project conditions.
Table 1-4 shows a summary of ecosystem improvements on Pacheco Creek and emergency water supplies during the 1987-91 drought period. Both factors increase significantly under with-Project conditions. Environmental water supply for San Joaquin River watershed refuges does not change for the drought period because, during that period, there are no below normal years.
Table 1-1. Summary of Pacheco Creek Steelhead Cohort Scores for 2070 Future Conditions and 2070 Uncertainty Scenarios
Item 2070 Future Condition
2070 Wet/Moderate
Warming Uncertainty
Scenario
2070 Dry/Extreme-
Warming Uncertainty
Scenario
2070 Moderate Growth
Scenario
2070 Expanded
Water Supply Portfolio Scenario
Without-Project1 (Steelhead Cohort Score)
8.3 7.2 5.5 8.3 8.3
With-Project1 (Steelhead Cohort Score)
23.0 22.2 20.8 23.0 23.0
Difference (Steelhead Cohort Score)
14.7 14.9 15.3 14.7 14.7
Percent Change (%) 178% 206% 278% 178% 178% Notes: 1 Values were derived from Pacheco Creek Steelhead Habitat Suitability Model.
Pacheco Reservoir Expansion Project
Benefit Calculation, Monetization and Resiliency A.12 Uncertainty Analysis August 2017 – 1-3
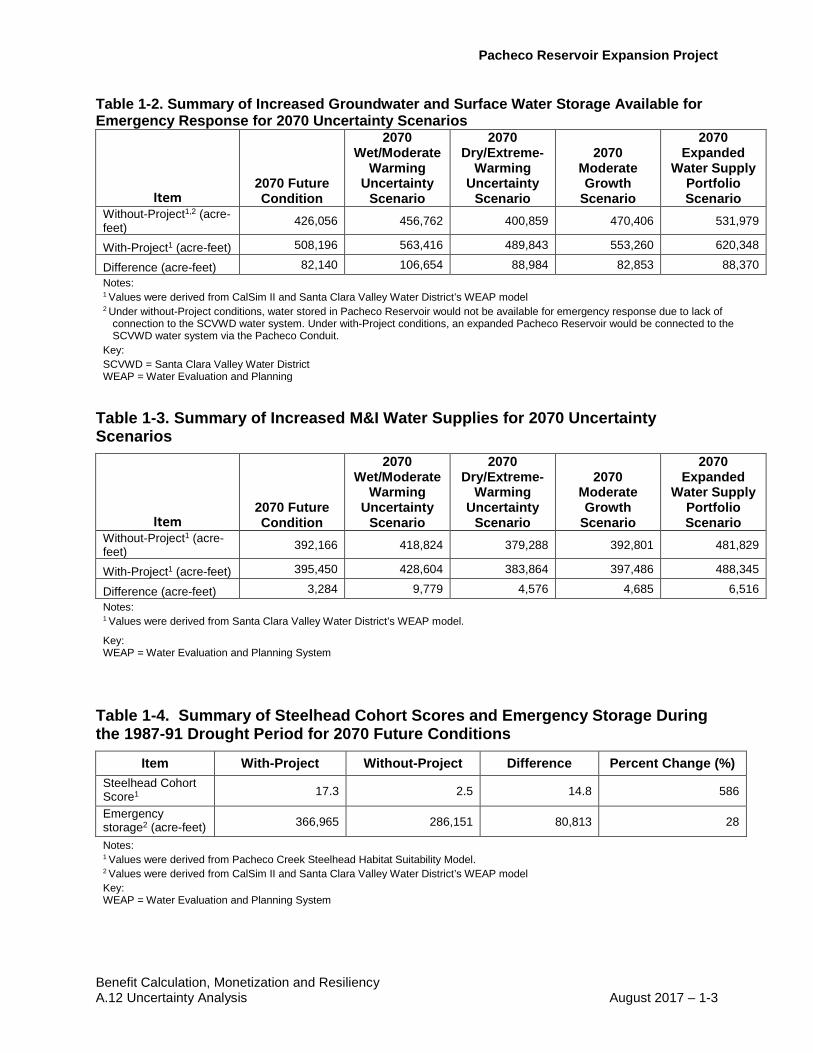
Table 1-2. Summary of Increased Groundwater and Surface Water Storage Available for Emergency Response for 2070 Uncertainty Scenarios
Item 2070 Future Condition
2070 Wet/Moderate
Warming Uncertainty
Scenario
2070 Dry/Extreme-
Warming Uncertainty
Scenario
2070 Moderate Growth
Scenario
2070 Expanded
Water Supply Portfolio Scenario
Without-Project1,2 (acre-feet) 426,056 456,762 400,859 470,406 531,979
With-Project1 (acre-feet) 508,196 563,416 489,843 553,260 620,348
Difference (acre-feet) 82,140 106,654 88,984 82,853 88,370 Notes: 1 Values were derived from CalSim II and Santa Clara Valley Water District’s WEAP model 2 Under without-Project conditions, water stored in Pacheco Reservoir would not be available for emergency response due to lack of
connection to the SCVWD water system. Under with-Project conditions, an expanded Pacheco Reservoir would be connected to the SCVWD water system via the Pacheco Conduit.
Key: SCVWD = Santa Clara Valley Water District WEAP = Water Evaluation and Planning
Table 1-3. Summary of Increased M&I Water Supplies for 2070 Uncertainty Scenarios
Item 2070 Future Condition
2070 Wet/Moderate
Warming Uncertainty
Scenario
2070 Dry/Extreme-
Warming Uncertainty
Scenario
2070 Moderate Growth
Scenario
2070 Expanded
Water Supply Portfolio Scenario
Without-Project1 (acre-feet) 392,166 418,824 379,288 392,801 481,829
With-Project1 (acre-feet) 395,450 428,604 383,864 397,486 488,345
Difference (acre-feet) 3,284 9,779 4,576 4,685 6,516 Notes: 1 Values were derived from Santa Clara Valley Water District’s WEAP model.
Key: WEAP = Water Evaluation and Planning System
Table 1-4. Summary of Steelhead Cohort Scores and Emergency Storage During the 1987-91 Drought Period for 2070 Future Conditions
Item With-Project Without-Project Difference Percent Change (%) Steelhead Cohort Score1 17.3 2.5 14.8 586
Emergency storage2 (acre-feet) 366,965 286,151 80,813 28
Notes: 1 Values were derived from Pacheco Creek Steelhead Habitat Suitability Model. 2 Values were derived from CalSim II and Santa Clara Valley Water District’s WEAP model Key: WEAP = Water Evaluation and Planning System

Pacheco Reservoir Expansion Project
Benefit Calculation, Monetization and Resiliency 1-4 – August 2017 A.12 Uncertainty Analysis
This page left blank intentionally.

Pacheco Reservoir Expansion Project
Benefit Calculation, Monetization and Resiliency A.12 Uncertainty Analysis August 2017 – 2-1
CHAPTER 2 CLIMATE CHANGE This section describes benefits under the two extreme climate change scenarios provided by the CWC, as required under section 6004(a)(8)(A) of the California Code of Regulations. The CWC-provided Variable Infiltration Capacity model runoff data for 2070 Wetter/Moderate-Warming and Drier/Extreme-Warming conditions was used to adjust hydrologic inputs to the WEAP model. WEAP-model inflows were created by applying Variable Infiltration Capacity data runoff factors based to adjust the historical-data base inflows to WEAP. This process was the same process used for the 2030 and 2070 future condition runs, and is described in Chapter 3 of Benefit Calculation, Monetization, and Resiliency Attachment A1: Project Conditions. Based on the results described below, benefits under the proposed Project are very resilient to extreme levels of climate change. Under climate change conditions, Project benefits for ecosystem improvements on Pacheco Creek and emergency response increase. Benefits for San Joaquin River watershed refuges are maintained.
2.1 Wetter/Moderate-Warming Uncertainty Scenario Results for the Wetter/Moderate-Warming Uncertainty Scenario are shown below.
2.1.1 Ecosystem Improvement – Pacheco Creek According to modeling results, steelhead cohort scores will increase under the 2070 Wetter/Moderate-Warming Uncertainty Scenario in all water year types, when compared to 2070 future conditions. Tables 2-1 and 2-2 show the differences in Pacheco Creek steelhead cohort scores under 2070 future conditions and the 2070 Wetter/Moderate-Warming Uncertainty Scenario. Under the Wetter/Moderate-Warming Uncertainty Scenario, the percentage increase in steelhead cohort scores is larger for all water year types. The average percent increase for all years is 206 percent, compared to 178 percent under 2070 future conditions.

Pacheco Reservoir Expansion Project
Benefit Calculation, Monetization and Resiliency 2-2 – August 2017 A.12 Uncertainty Analysis
Table 2-1. Summary of Pacheco Creek Steelhead Cohort Scores by Water Year Type Under 2070 Future Conditions
Water Year Type1
2070 Future Conditions With-Project2
(Steelhead Cohort Score)
Without-Project2 (Steelhead Cohort
Score)
Difference (Steelhead Cohort
Score) Percent Change
(%) Wet 25.1 9.2 15.9 172 Above Normal 24.2 8.9 15.3 172 Below Normal 22.8 11.2 11.6 104 Dry 22.2 7.9 14.3 180 Critical 19.0 3.1 15.9 505 Average All Years 23.0 8.3 14.7 178 Notes: 1 Water year types based on the Sacramento Valley water year hydrologic classification. 2 Values were derived from Pacheco Creek Steelhead Habitat Suitability Model.
Table 2-2. Summary of Pacheco Creek Steelhead Cohort Scores by Water Year Type Under 2070 Wetter/Moderate-Warming Uncertainty Scenario
Water Year Type1
2070 Wetter/Moderate-Warming Uncertainty Scenario With-Project2
(Steelhead Cohort Score)
Without-Project2 (Steelhead Cohort
Score)
Difference (Steelhead Cohort
Score) Percent Change
(%) Wet 23.3 8.1 15.2 188 Above Normal 20.6 5.9 14.7 248 Below Normal 21.5 7.8 13.7 176 Dry 21.3 7.3 14.0 191 Critical 19.8 0.0 19.8 NA Average All Years 22.2 7.2 14.9 206 Notes: 1 Water year types based on the Sacramento Valley water year hydrologic classification. 2 Values were derived from Pacheco Creek Steelhead Habitat Suitability Model.
2.1.2 Ecosystem Improvement – San Joaquin River Watershed As shown in Table 2-3, the increase in Incremental Level 4 (IL4) water deliveries to wildlife refuges in the San Joaquin River watershed (in below normal years) is identical under both the 2070 Wetter/Moderate-Warming Uncertainty Scenario and 2070 future conditions.
Table 2-3. Increased Environmental Water Supplies for San Joaquin River Watershed Wildlife Refuges under 2070 Wetter/Moderate-Warming Uncertainty Scenario
Water Year Type1
2070 Future Conditions 2070 Wetter/Moderate-Warming Uncertainty Scenario
With- Project2
(acre-feet)
Without- Project2
(acre-feet) Difference (acre-feet)
With- Project3
(acre-feet)
Without- Project2
(acre-feet) Difference (acre-feet)
Below Normal 280,924 278,924 2,000 280,892 278,892 2,000 Notes: 1 Water year types based on the Sacramento Valley water year hydrologic classification. 2 Values were derived from CalSim II and reflect south-of-Delta refuge deliveries. 3 Values were derived by adding 2 TAF in each below-normal year to CalSim II results from the without-Project run.
Pacheco Reservoir Expansion Project
Benefit Calculation, Monetization and Resiliency A.12 Uncertainty Analysis August 2017 – 2-3
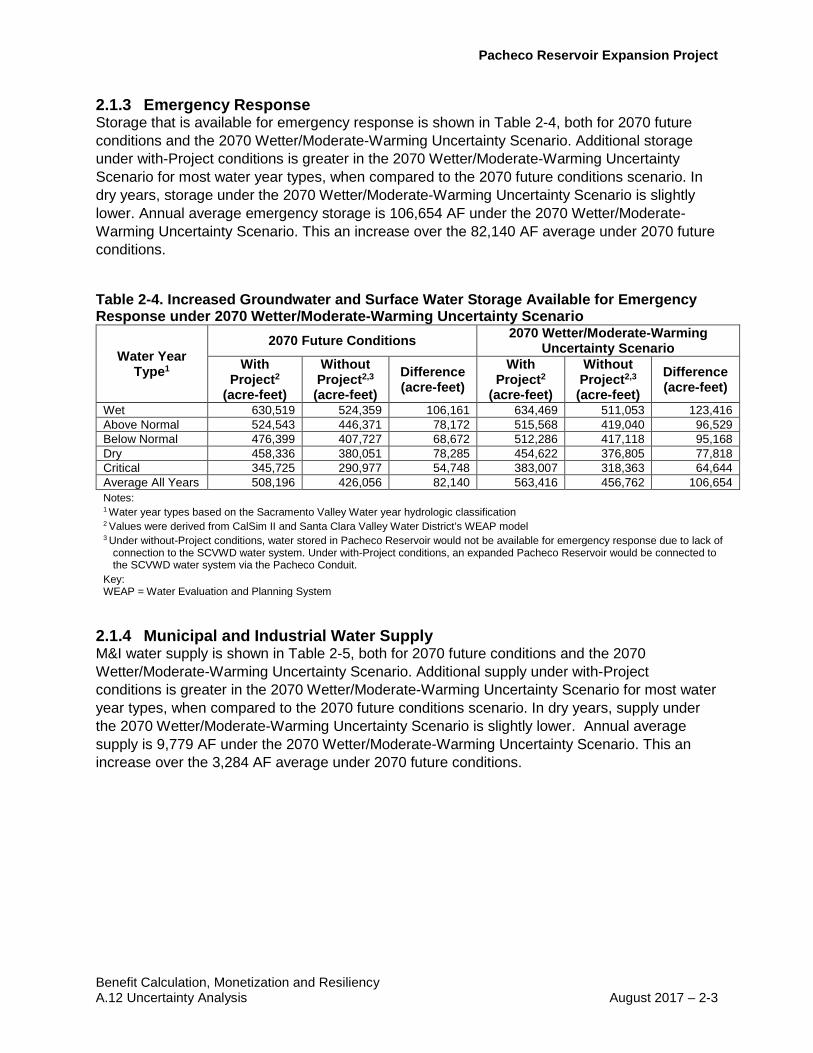
2.1.3 Emergency Response Storage that is available for emergency response is shown in Table 2-4, both for 2070 future conditions and the 2070 Wetter/Moderate-Warming Uncertainty Scenario. Additional storage under with-Project conditions is greater in the 2070 Wetter/Moderate-Warming Uncertainty Scenario for most water year types, when compared to the 2070 future conditions scenario. In dry years, storage under the 2070 Wetter/Moderate-Warming Uncertainty Scenario is slightly lower. Annual average emergency storage is 106,654 AF under the 2070 Wetter/Moderate-Warming Uncertainty Scenario. This an increase over the 82,140 AF average under 2070 future conditions.
Table 2-4. Increased Groundwater and Surface Water Storage Available for Emergency Response under 2070 Wetter/Moderate-Warming Uncertainty Scenario
Water Year Type1
2070 Future Conditions 2070 Wetter/Moderate-Warming Uncertainty Scenario
With Project2
(acre-feet)
Without Project2,3 (acre-feet)
Difference (acre-feet)
With Project2
(acre-feet)
Without Project2,3 (acre-feet)
Difference (acre-feet)
Wet 630,519 524,359 106,161 634,469 511,053 123,416 Above Normal 524,543 446,371 78,172 515,568 419,040 96,529 Below Normal 476,399 407,727 68,672 512,286 417,118 95,168 Dry 458,336 380,051 78,285 454,622 376,805 77,818 Critical 345,725 290,977 54,748 383,007 318,363 64,644 Average All Years 508,196 426,056 82,140 563,416 456,762 106,654 Notes: 1 Water year types based on the Sacramento Valley Water year hydrologic classification 2 Values were derived from CalSim II and Santa Clara Valley Water District’s WEAP model 3 Under without-Project conditions, water stored in Pacheco Reservoir would not be available for emergency response due to lack of
connection to the SCVWD water system. Under with-Project conditions, an expanded Pacheco Reservoir would be connected to the SCVWD water system via the Pacheco Conduit.
Key: WEAP = Water Evaluation and Planning System
2.1.4 Municipal and Industrial Water Supply M&I water supply is shown in Table 2-5, both for 2070 future conditions and the 2070 Wetter/Moderate-Warming Uncertainty Scenario. Additional supply under with-Project conditions is greater in the 2070 Wetter/Moderate-Warming Uncertainty Scenario for most water year types, when compared to the 2070 future conditions scenario. In dry years, supply under the 2070 Wetter/Moderate-Warming Uncertainty Scenario is slightly lower. Annual average supply is 9,779 AF under the 2070 Wetter/Moderate-Warming Uncertainty Scenario. This an increase over the 3,284 AF average under 2070 future conditions.

Pacheco Reservoir Expansion Project
Benefit Calculation, Monetization and Resiliency 2-4 – August 2017 A.12 Uncertainty Analysis
Table 2-5. Increased M&I Water Supply under 2070 Wetter/Moderate-Warming Uncertainty Scenario
Water Year Type1
2070 Future Conditions 2070 Wetter/Moderate-Warming Uncertainty Scenario
With- Project2
(acre-feet)
Without- Project2
(acre-feet) Difference (acre-feet)
With- Project2
(acre-feet)
Without- Project2
(acre-feet) Difference (acre-feet)
Wet 475,117 468,414 6,704 477,488 465,055 12,433 Above Normal 436,586 431,386 5,201 418,437 409,861 8,576 Below Normal 377,780 378,841 -1,061 389,338 379,765 9,573 Dry 356,844 353,391 3,452 345,119 342,426 2,694 Critical 268,615 270,068 -1,453 269,848 269,328 521 Average All Years 395,450 392,166 3,284 428,604 418,824 9,779 Notes: 1 Water year types based on the Sacramento Valley water year hydrologic classification. 2 Values were derived from Santa Clara Valley Water District’s WEAP model. Key: M&I = municipal and industrial WEAP = Water Evaluation and Planning
2.1.5 Municipal and Industrial Water Quality San Luis Reservoir low point conditions are shown in Table 2-6, for both 2070 future conditions and the 2070 Wetter/Moderate-Warming Uncertainty Scenario. Under with-Project conditions the low point issue can be avoided in all months under both 2070 future conditions and the 2070 Wetter/Moderate-Warming Uncertainty Scenario
Table 2-6. Improved M&I Water Quality through Reduced Incidence of Low Point Issues in San Luis Reservoir for 2070 Future Conditions and 2070 Wetter/Moderate-Warming Uncertainty Scenario
Water Year Type1
2070 Future Conditions 2070 Wetter/Moderate-Warming Uncertainty Scenario
With- Project2 (months)
Without- Project2 (months)
Difference (months)
With- Project2 (months)
Without- Project2 (months)
Difference (months)
Wet 0 18 -18 0 22 -22 Above Normal 0 13 -13 0 7 -7 Below Normal 0 15 -15 0 10 -10 Dry 0 35 -35 0 10 -10 Critical 0 28 -28 0 9 -9 Total All Years 0 109 -109 0 58 -58 Notes: 1 Water year types based on the Sacramento Valley water year hydrologic classification. 2 Values were derived from CalSim II and Santa Clara Valley Water District’s WEAP model. Key: WEAP = Water Evaluation and Planning System

Pacheco Reservoir Expansion Project
Benefit Calculation, Monetization and Resiliency A.12 Uncertainty Analysis August 2017 – 2-5
2.2 Drier/Extreme-Warming Uncertainty Scenario Results for the Drier/Extreme-Warming Uncertainty Scenario are shown below.
2.2.1 Ecosystem Improvement – Pacheco Creek Modeling results show that the Project will increase Pacheco Creek steelhead cohort scores, even under the 2070 Drier/Extreme-Warming Uncertainty Scenario. Table 2-7 provides the Pacheco Creek steelhead cohort scores under the 2070 Drier/Extreme-Warming Uncertainty Scenario. When compared to 2070 future conditions, the percentage increase in steelhead cohort scores is larger (for most water year types) under the 2070 Drier/Extreme-Warming Uncertainty Scenario. The exception is critical years, when the percentage increase in steelhead cohort scores is slightly lower. The average percentage increase for all years under the 2070 Drier/Extreme-Warming Uncertainty Scenario is 278 percent, compared to 178 percent under 2070 future conditions (Table 2-1).
Table 2-7. Summary of Pacheco Creek Steelhead Cohort Scores by Water Year Type Under 2070 Drier/Extreme-Warming Uncertainty Scenario
Water Year Type1
2070 Drier/Extreme-Warming Uncertainty Scenario With-Project2
(Steelhead Cohort Score)
Without-Project2 (Steelhead Cohort
Score)
Difference (Steelhead Cohort
Score) Percent Change
(%) Wet 22.4 7.0 15.4 218 Above Normal 20.5 5.2 15.3 296 Below Normal 21.5 5.7 13.3 163 Dry 20.0 4.9 15.1 308 Critical 20.5 4.5 16.0 358 Average All Years 20.8 5.5 15.3 278 Notes: 1 Water year types based on the Sacramento Valley water year hydrologic classification. 2 Values were derived from Pacheco Creek Steelhead Habitat Suitability Model.
2.2.2 Ecosystem Improvement – Delta Watershed Increases in IL4 refuge deliveries for the 2070 Drier/Extreme-Warming Uncertainty Scenario are identical to 2070 future conditions, as shown in Table 2-8.
Table 2-8. Increased Environmental Water Supplies for San Joaquin River Watershed Wildlife Refuges Under 2070 Drier/Extreme-Warming Uncertainty Scenario
Water Year Type1
2070 Future Conditions 2070 Drier/Extreme-Warming Uncertainty Scenario
With- Project2
(acre-feet)
Without- Project2
(acre-feet) Difference (acre-feet)
With Project3
(acre-feet)
Without Project2
(acre-feet) Difference (acre-feet)
Below Normal 280,924 278,924 2,000 274,566 272,566 2,000 Notes: 1 Water year types based on the Sacramento Valley water year hydrologic classification 2 Values were derived from CalSim II and reflect south-of-Delta refuge deliveries 3 Values were derived by adding 2 TAF per year to CalSim II results from the without-Project run
Pacheco Reservoir Expansion Project
Benefit Calculation, Monetization and Resiliency 2-6 – August 2017 A.12 Uncertainty Analysis
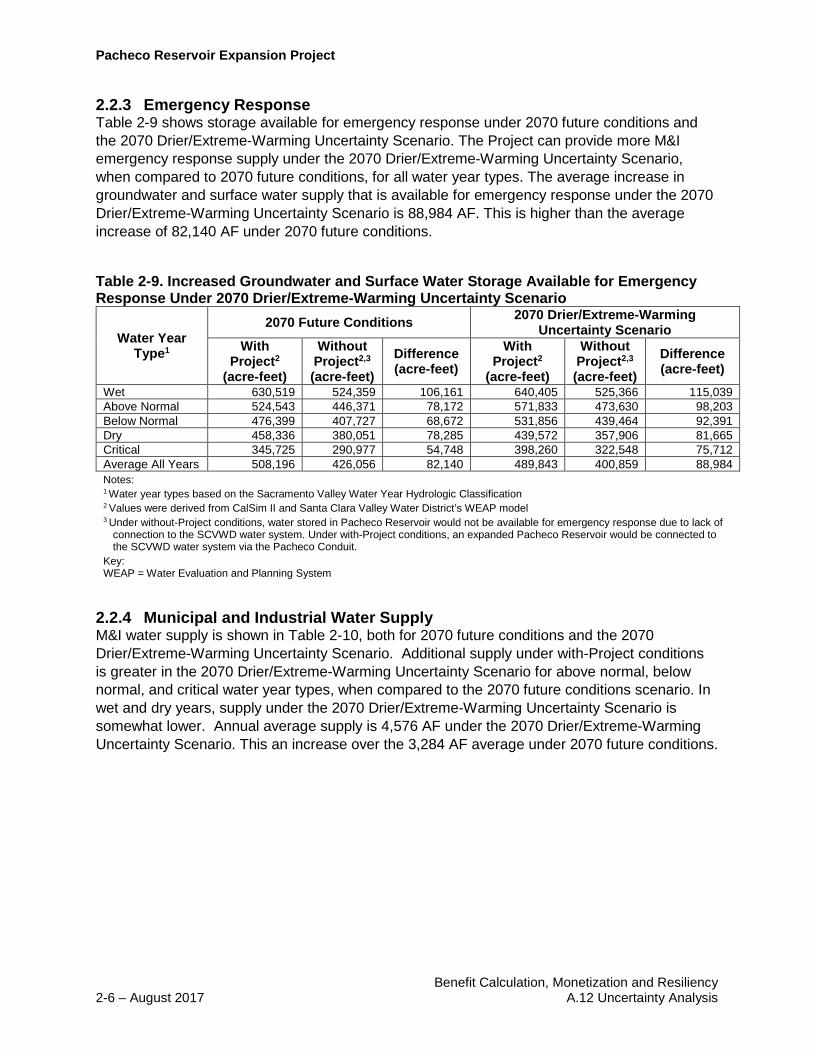
2.2.3 Emergency Response Table 2-9 shows storage available for emergency response under 2070 future conditions and the 2070 Drier/Extreme-Warming Uncertainty Scenario. The Project can provide more M&I emergency response supply under the 2070 Drier/Extreme-Warming Uncertainty Scenario, when compared to 2070 future conditions, for all water year types. The average increase in groundwater and surface water supply that is available for emergency response under the 2070 Drier/Extreme-Warming Uncertainty Scenario is 88,984 AF. This is higher than the average increase of 82,140 AF under 2070 future conditions.
Table 2-9. Increased Groundwater and Surface Water Storage Available for Emergency Response Under 2070 Drier/Extreme-Warming Uncertainty Scenario
Water Year Type1
2070 Future Conditions 2070 Drier/Extreme-Warming Uncertainty Scenario
With Project2
(acre-feet)
Without Project2,3 (acre-feet)
Difference (acre-feet)
With Project2
(acre-feet)
Without Project2,3 (acre-feet)
Difference (acre-feet)
Wet 630,519 524,359 106,161 640,405 525,366 115,039 Above Normal 524,543 446,371 78,172 571,833 473,630 98,203 Below Normal 476,399 407,727 68,672 531,856 439,464 92,391 Dry 458,336 380,051 78,285 439,572 357,906 81,665 Critical 345,725 290,977 54,748 398,260 322,548 75,712 Average All Years 508,196 426,056 82,140 489,843 400,859 88,984 Notes: 1 Water year types based on the Sacramento Valley Water Year Hydrologic Classification 2 Values were derived from CalSim II and Santa Clara Valley Water District’s WEAP model 3 Under without-Project conditions, water stored in Pacheco Reservoir would not be available for emergency response due to lack of
connection to the SCVWD water system. Under with-Project conditions, an expanded Pacheco Reservoir would be connected to the SCVWD water system via the Pacheco Conduit.
Key: WEAP = Water Evaluation and Planning System
2.2.4 Municipal and Industrial Water Supply M&I water supply is shown in Table 2-10, both for 2070 future conditions and the 2070 Drier/Extreme-Warming Uncertainty Scenario. Additional supply under with-Project conditions is greater in the 2070 Drier/Extreme-Warming Uncertainty Scenario for above normal, below normal, and critical water year types, when compared to the 2070 future conditions scenario. In wet and dry years, supply under the 2070 Drier/Extreme-Warming Uncertainty Scenario is somewhat lower. Annual average supply is 4,576 AF under the 2070 Drier/Extreme-Warming Uncertainty Scenario. This an increase over the 3,284 AF average under 2070 future conditions.

Pacheco Reservoir Expansion Project
Benefit Calculation, Monetization and Resiliency A.12 Uncertainty Analysis August 2017 – 2-7
Table 2-10. Increased M&I Water Supplies under 2070 Drier/Extreme-Warming Uncertainty Scenario
Water Year Type1
2070 Future Conditions 2070 Drier/Extreme-Warming Uncertainty Scenario
With- Project2
(acre-feet)
Without- Project2
(acre-feet) Difference (acre-feet)
With- Project2
(acre-feet)
Without- Project2
(acre-feet) Difference (acre-feet)
Wet 475,117 468,414 6,704 484,105 479,254 4,851 Above Normal 436,586 431,386 5,201 452,483 440,961 11,523 Below Normal 377,780 378,841 -1,061 421,434 416,027 5,407 Dry 356,844 353,391 3,452 362,524 361,271 1,253 Critical 268,615 270,068 -1,453 307,460 304,499 2,961 Average All Years 395,450 392,166 3,284 383,864 379,288 4,576 Notes: 1 Water year types based on the Sacramento Valley water year hydrologic classification. 2 Values were derived from Santa Clara Valley Water District’s WEAP model. Key: M&I = municipal and industrial WEAP = Water Evaluation and Planning
2.2.5 Municipal and Industrial Water Quality San Luis low point conditions are shown in Table 2-11, for both 2070 future conditions and the 2070 Drier/Extreme-Warming Uncertainty Scenario. Under with-Project conditions the low point issue can be avoided in all months under both 2070 future conditions and the 2070 Drier/Extreme -Warming Uncertainty Scenario
Table 2-11. Improved M&I Water Quality through Reduced Incidence of Low Point Issues in San Luis Reservoir for 2070 Future Conditions and 2070 Drier/Extreme-Warming Uncertainty Scenario
Water Year Type1
2070 Future Conditions 2070 Drier/Extreme-Warming Uncertainty Scenario
With- Project2 (months)
Without- Project2 (months)
Difference (months)
With- Project2 (months)
Without- Project2 (months)
Difference (months)
Wet 0 18 -18 0 8 -8 Above Normal 0 13 -13 0 7 -7 Below Normal 0 15 -15 0 11 -11 Dry 0 35 -35 0 14 -14 Critical 0 28 -28 0 46 -46 Total All Years 0 109 -109 0 86 -86 Notes: 1 Water year types based on the Sacramento Valley water Year Hydrologic Classification. 2 Values were derived from CalSim II and Santa Clara Valley Water District’s WEAP model. Key: WEAP = Water Evaluation and Planning System

Pacheco Reservoir Expansion Project
Benefit Calculation, Monetization and Resiliency 2-8 – August 2017 A.12 Uncertainty Analysis
This page left blank intentionally.
Pacheco Reservoir Expansion Project
Benefit Calculation, Monetization and Resiliency A.12 Uncertainty Analysis August 2017 – 3-1
CHAPTER 3 FUTURE PROJECTS AND WATER MANAGEMENT ACTIONS
This section describes the Project benefits under two alternative water-management actions, pursuant to Section 6004(a)(8)(B) of the regulations. SCVWD modeled two scenarios—a Moderate Growth Scenario and an Expanded Water Supply Scenario—and compared the scenarios to 2070 future conditions. The Moderate Growth Scenario included reduced water demands. The Expanded Water Supply Scenario included additional water supplies. Supply and demand were determined to be the most significant factors that could affect the performance of SCVWDs water system.
Model results show that the physical benefits provided by the Project are very resilient under both the Moderate Growth and Expanded Water Supply Scenarios. Ecosystem improvements in Pacheco Creek and the San Joaquin River watershed are maintained under the Moderate Growth Scenario and Expanded Water Supply Scenario, while increases in emergency water supply are greater under both scenarios.
3.1 Moderate Growth Scenario Under the Moderate Growth Scenario, demands within SCVWD’s service area are reduced in 2070 in comparison to the 2070 future conditions simulation. The Moderate Growth Scenario was conducted in order to evaluate the effect of potential water-use efficiencies achieved between 2020 and 2070. Pursuant to WSIP regulations, 2070 future conditions were modeled using the 2020 gallons per capita per day (GPCD) demand target, which was provided in SCVWD’s 2015 Urban Water Management Plan (UWMP). However, several factors and trends in water use suggest that GPCD demand will decrease over time, continuing beyond 2020. These factors include updates to plumbing codes; planned and expected water use efficiency programs; and future increases in the number of multi-family homes, which are assumed to be more water-efficient than single family homes. Therefore, future water demands were re-calculated and used for the Moderate Growth Scenario.
Demands for the Moderate Growth Scenario were developed from the 2040 Trending Lower demand scenarios being considered for SCVWD’s 2017 Water Supply Master Plan. The 2040 GPCD demand estimate was used for this analysis because 2040 is the furthest planning horizon evaluated in the Water Supply Master Plan. Rather than using the demands from retailers’ UWMPs, the demands were developed using the best available data from the Association of Bay Area Governments’ regional growth projections (from 2013 and updated in 2016), and from the U.S. Department of Transportation’s (2016 projections) for job growth in different sectors. SCVWD used growth and development trends from local water retailers, planning agencies, and land-use planning documents to split housing unit growth between single-family and multi-family homes.

Pacheco Reservoir Expansion Project
Benefit Calculation, Monetization and Resiliency 3-2 – August 2017 A.12 Uncertainty Analysis
In order to calculate total potable demand, the GPCD targets were applied to the same population projections as used for the 2070 future conditions. The population projection methods are described in Chapter 3 of Benefit Calculation, Monetization, and Resiliency Attachment A1: Project Conditions. Santa Clara County-wide demand was calculated by taking potable water demand and adding on the same volumes of recycled water, groundwater, and raw water. Losses from treatment plants were then subtracted from this number. This is the same method used to calculate county-wide demand for 2070 future conditions.
Results for the Moderate Growth Scenario are shown below.
3.1.1 Ecosystem Improvement – Pacheco Creek The 2070 Moderate Growth Scenario provides similar steelhead cohort scores when compared to the steelhead cohort scores under 2070 future conditions. The Project is able to maintain ecosystem improvement benefits in Pacheco Creek when SCVWD demands are reduced, as shown in Table 3-1.
Table 3-1. Summary of Pacheco Creek Steelhead Cohort Scores by Water Year Type Under 2070 Moderate Growth Scenario
Water Year Type1
2070 Moderate Growth Scenario With-Project2
(Steelhead Cohort Score)
Without-Project2 (Steelhead Cohort
Score)
Difference (Steelhead Cohort
Score) Percent Change
(%) Wet 25.1 9.2 15.9 172 Above Normal 24.2 8.9 15.3 172 Below Normal 22.8 11.2 11.6 104 Dry 22.2 7.9 14.3 180 Critical 19.0 3.1 15.9 505 Average All Years 23.0 8.3 14.7 178 Notes: 1 Water year types based on the Sacramento Valley water year hydrologic classification. 2 Values were derived from Pacheco Creek Steelhead Habitat Suitability Model.
3.1.2 Ecosystem Improvement – San Joaquin River Watershed Reducing demands in the SCVWD system does not change any assumptions in the CalSim II model. Therefore, there is no change in deliveries to IL4 wildlife refuges, when compared to deliveries under 2070 future conditions. The Project is able to maintain ecosystem improvement benefits in the San Joaquin River watershed when SCVWD demands are reduced.
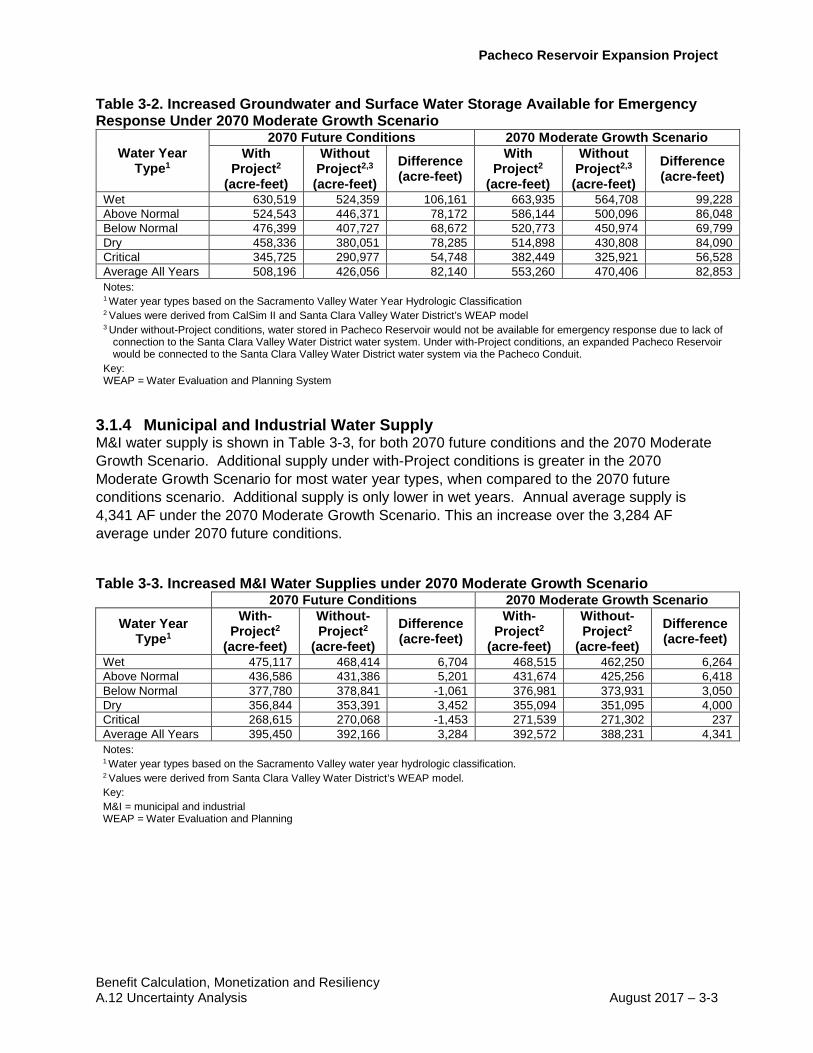
3.1.3 Emergency Response Table 3-2 shows available storage for emergency M&I response for 2070 future conditions and the 2070 Moderate Growth Scenario. The model results show that when SCVWD demands are reduced, Project-provided emergency response benefits increase in most water year types, compared to 2070 future conditions. Emergency response benefits decrease when compared to 2070 future conditions, only in wet years. However, the Project does increase emergency water supply over without-Project conditions in all water year types. In addition, the long-term average emergency storage increases from 82,140 AF under 2070 future conditions to 82,853 AF under the 2070 Moderate Growth Scenario.
Pacheco Reservoir Expansion Project
Benefit Calculation, Monetization and Resiliency A.12 Uncertainty Analysis August 2017 – 3-3
Table 3-2. Increased Groundwater and Surface Water Storage Available for Emergency Response Under 2070 Moderate Growth Scenario
Water Year Type1
2070 Future Conditions 2070 Moderate Growth Scenario With
Project2 (acre-feet)
Without Project2,3 (acre-feet)
Difference (acre-feet)
With Project2
(acre-feet)
Without Project2,3 (acre-feet)
Difference (acre-feet)
Wet 630,519 524,359 106,161 663,935 564,708 99,228 Above Normal 524,543 446,371 78,172 586,144 500,096 86,048 Below Normal 476,399 407,727 68,672 520,773 450,974 69,799 Dry 458,336 380,051 78,285 514,898 430,808 84,090 Critical 345,725 290,977 54,748 382,449 325,921 56,528 Average All Years 508,196 426,056 82,140 553,260 470,406 82,853 Notes: 1 Water year types based on the Sacramento Valley Water Year Hydrologic Classification 2 Values were derived from CalSim II and Santa Clara Valley Water District’s WEAP model 3 Under without-Project conditions, water stored in Pacheco Reservoir would not be available for emergency response due to lack of
connection to the Santa Clara Valley Water District water system. Under with-Project conditions, an expanded Pacheco Reservoir would be connected to the Santa Clara Valley Water District water system via the Pacheco Conduit.
Key: WEAP = Water Evaluation and Planning System
3.1.4 Municipal and Industrial Water Supply M&I water supply is shown in Table 3-3, for both 2070 future conditions and the 2070 Moderate Growth Scenario. Additional supply under with-Project conditions is greater in the 2070 Moderate Growth Scenario for most water year types, when compared to the 2070 future conditions scenario. Additional supply is only lower in wet years. Annual average supply is 4,341 AF under the 2070 Moderate Growth Scenario. This an increase over the 3,284 AF average under 2070 future conditions.
Table 3-3. Increased M&I Water Supplies under 2070 Moderate Growth Scenario 2070 Future Conditions 2070 Moderate Growth Scenario
Water Year Type1
With- Project2
(acre-feet)
Without- Project2
(acre-feet) Difference (acre-feet)
With- Project2
(acre-feet)
Without- Project2
(acre-feet) Difference (acre-feet)
Wet 475,117 468,414 6,704 468,515 462,250 6,264 Above Normal 436,586 431,386 5,201 431,674 425,256 6,418 Below Normal 377,780 378,841 -1,061 376,981 373,931 3,050 Dry 356,844 353,391 3,452 355,094 351,095 4,000 Critical 268,615 270,068 -1,453 271,539 271,302 237 Average All Years 395,450 392,166 3,284 392,572 388,231 4,341 Notes: 1 Water year types based on the Sacramento Valley water year hydrologic classification. 2 Values were derived from Santa Clara Valley Water District’s WEAP model. Key: M&I = municipal and industrial WEAP = Water Evaluation and Planning

Pacheco Reservoir Expansion Project
Benefit Calculation, Monetization and Resiliency 3-4 – August 2017 A.12 Uncertainty Analysis
3.1.5 Municipal and Industrial Water Quality San Luis Reservoir low point conditions are shown in Table 3-4, for both 2070 future conditions and the 2070 Moderate Growth Scenario. Under with-Project conditions the low point issue can be avoided in all months under both 2070 future conditions and the 2070 Moderate Growth Scenario
Table 3-4. Improved M&I Water Quality through Reduced Incidence of Low Point Issues in San Luis Reservoir for 2070 Future Conditions and 2070 Moderate Growth Scenario
Water Year Type1
2070 Future Conditions 2070 Moderate Growth Scenario With-
Project2 (months)
Without- Project2 (months)
Difference (months)
With- Project2 (months)
Without- Project2 (months)
Difference (months)
Wet 0 18 -18 0 18 -18 Above Normal 0 13 -13 0 13 -13 Below Normal 0 15 -15 0 15 -15 Dry 0 35 -35 0 35 -35 Critical 0 28 -28 0 28 -28 Total All Years 0 109 -109 0 109 -109 Notes: 1 Water year types based on the Sacramento Valley water Year Hydrologic Classification. 2 Values were derived from CalSim II and Santa Clara Valley Water District’s WEAP model. Key: WEAP = Water Evaluation and Planning System
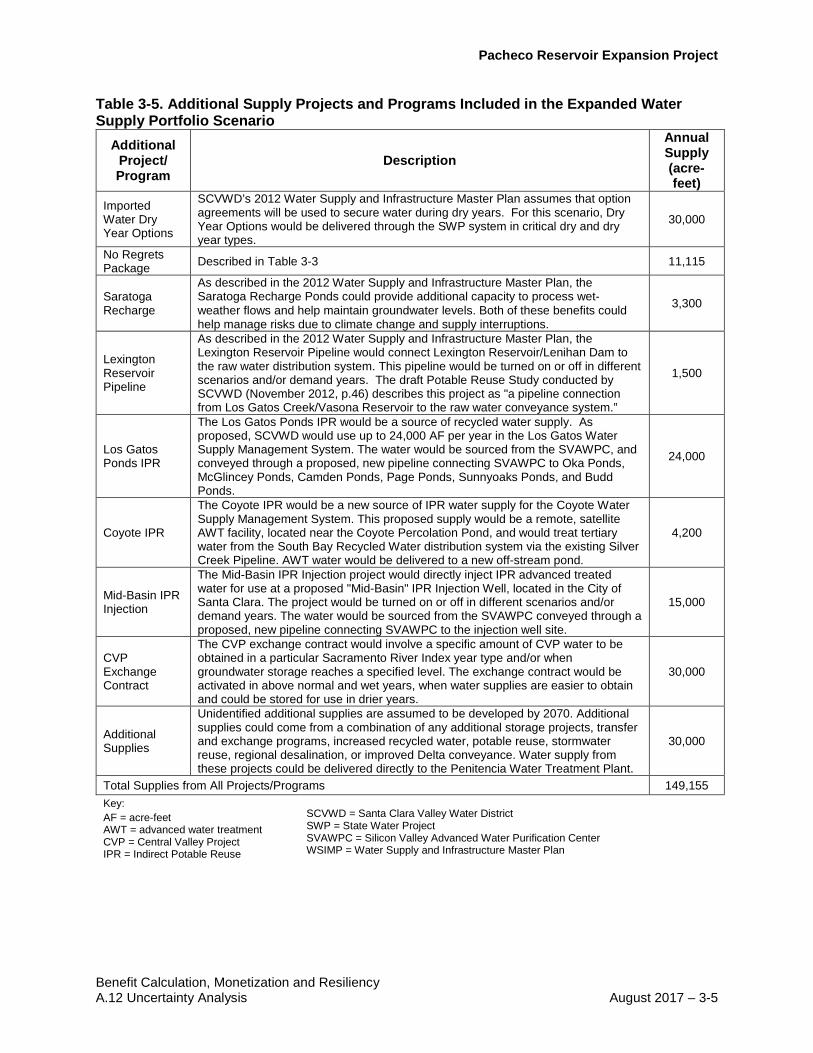
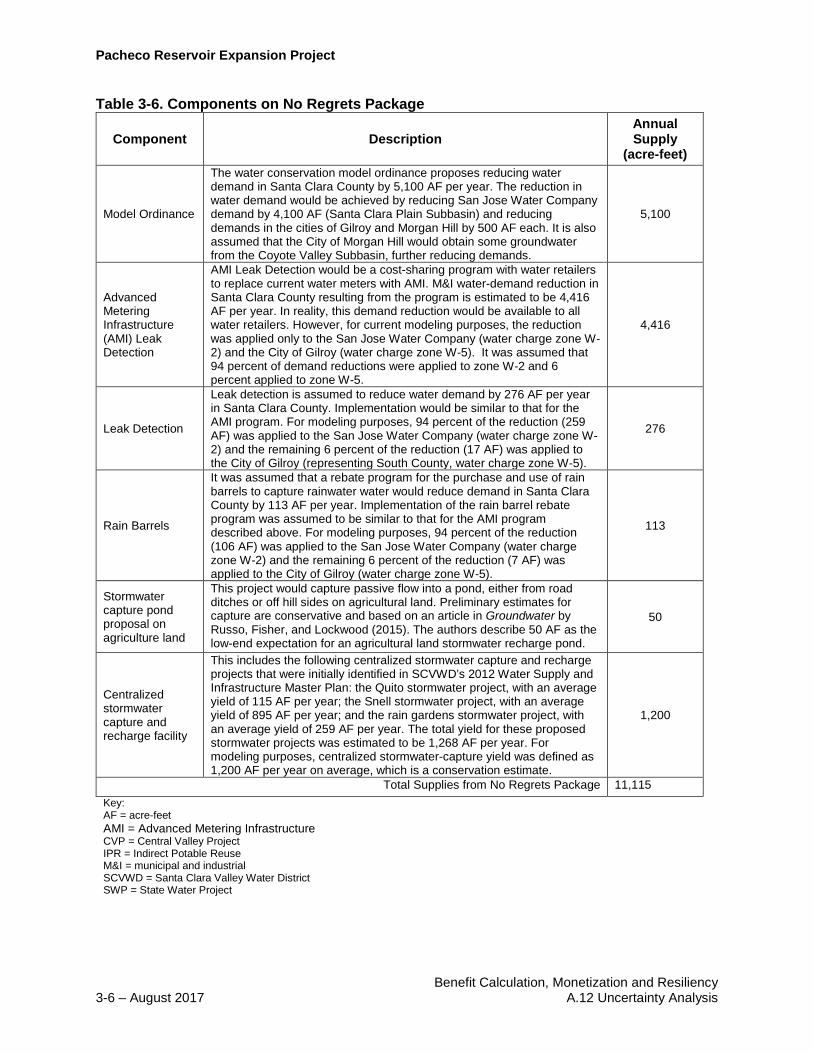
3.2 Expanded Water Supply Portfolio Scenario The Expanded Water Supply Portfolio Scenario includes additional supplies that may needed to keep up with population growth through 2070. Table 3-5 shows the additional supply projects and programs included in the Expanded Water Supply Portfolio. These supply projects and programs were initially identified in SCVWD’s 2017 Water Master Plan, and SCVWD’s 2015 UWMP under the 2040 projection. This scenario also includes 30 TAF of additional water supplies, which could be provided by additional projects not identified in Table 3-5. These may include new or improved storage projects, transfers and exchange programs, potable reuse, regional desalination, or improved Sacramento-San Joaquin River Delta (Delta) conveyance. These additional supplies are not included in any published report. Table 3-5 shows more details on the additional supply projects and programs included in the expanded water supply portfolio. The No Regrets Package, consisting mostly of water conservation, rain/storm water capture, and leak detection/repair, is included in Table 3-6. The No Regrets Package is being considered in the 2017 Water Supply Master Plan. It has not been formally adopted, approved, or permitted, so it was not included in the analysis for 2070 future condition per the application guidelines.
Pacheco Reservoir Expansion Project
Benefit Calculation, Monetization and Resiliency A.12 Uncertainty Analysis August 2017 – 3-5
Table 3-5. Additional Supply Projects and Programs Included in the Expanded Water Supply Portfolio Scenario
Additional Project/ Program
Description Annual Supply (acre-feet)
Imported Water Dry Year Options
SCVWD’s 2012 Water Supply and Infrastructure Master Plan assumes that option agreements will be used to secure water during dry years. For this scenario, Dry Year Options would be delivered through the SWP system in critical dry and dry year types.
30,000
No Regrets Package Described in Table 3-3 11,115
Saratoga Recharge
As described in the 2012 Water Supply and Infrastructure Master Plan, the Saratoga Recharge Ponds could provide additional capacity to process wet‐weather flows and help maintain groundwater levels. Both of these benefits could help manage risks due to climate change and supply interruptions.
3,300
Lexington Reservoir Pipeline
As described in the 2012 Water Supply and Infrastructure Master Plan, the Lexington Reservoir Pipeline would connect Lexington Reservoir/Lenihan Dam to the raw water distribution system. This pipeline would be turned on or off in different scenarios and/or demand years. The draft Potable Reuse Study conducted by SCVWD (November 2012, p.46) describes this project as "a pipeline connection from Los Gatos Creek/Vasona Reservoir to the raw water conveyance system.”
1,500
Los Gatos Ponds IPR
The Los Gatos Ponds IPR would be a source of recycled water supply. As proposed, SCVWD would use up to 24,000 AF per year in the Los Gatos Water Supply Management System. The water would be sourced from the SVAWPC, and conveyed through a proposed, new pipeline connecting SVAWPC to Oka Ponds, McGlincey Ponds, Camden Ponds, Page Ponds, Sunnyoaks Ponds, and Budd Ponds.
24,000
Coyote IPR
The Coyote IPR would be a new source of IPR water supply for the Coyote Water Supply Management System. This proposed supply would be a remote, satellite AWT facility, located near the Coyote Percolation Pond, and would treat tertiary water from the South Bay Recycled Water distribution system via the existing Silver Creek Pipeline. AWT water would be delivered to a new off-stream pond.
4,200
Mid-Basin IPR Injection
The Mid-Basin IPR Injection project would directly inject IPR advanced treated water for use at a proposed "Mid-Basin" IPR Injection Well, located in the City of Santa Clara. The project would be turned on or off in different scenarios and/or demand years. The water would be sourced from the SVAWPC conveyed through a proposed, new pipeline connecting SVAWPC to the injection well site.
15,000
CVP Exchange Contract
The CVP exchange contract would involve a specific amount of CVP water to be obtained in a particular Sacramento River Index year type and/or when groundwater storage reaches a specified level. The exchange contract would be activated in above normal and wet years, when water supplies are easier to obtain and could be stored for use in drier years.
30,000
Additional Supplies
Unidentified additional supplies are assumed to be developed by 2070. Additional supplies could come from a combination of any additional storage projects, transfer and exchange programs, increased recycled water, potable reuse, stormwater reuse, regional desalination, or improved Delta conveyance. Water supply from these projects could be delivered directly to the Penitencia Water Treatment Plant.
30,000
Total Supplies from All Projects/Programs 149,155 Key: AF = acre-feet AWT = advanced water treatment CVP = Central Valley Project IPR = Indirect Potable Reuse
SCVWD = Santa Clara Valley Water District SWP = State Water Project SVAWPC = Silicon Valley Advanced Water Purification Center WSIMP = Water Supply and Infrastructure Master Plan
Pacheco Reservoir Expansion Project
Benefit Calculation, Monetization and Resiliency 3-6 – August 2017 A.12 Uncertainty Analysis
Table 3-6. Components on No Regrets Package
Component Description Annual Supply
(acre-feet)
Model Ordinance
The water conservation model ordinance proposes reducing water demand in Santa Clara County by 5,100 AF per year. The reduction in water demand would be achieved by reducing San Jose Water Company demand by 4,100 AF (Santa Clara Plain Subbasin) and reducing demands in the cities of Gilroy and Morgan Hill by 500 AF each. It is also assumed that the City of Morgan Hill would obtain some groundwater from the Coyote Valley Subbasin, further reducing demands.
5,100
Advanced Metering Infrastructure (AMI) Leak Detection
AMI Leak Detection would be a cost-sharing program with water retailers to replace current water meters with AMI. M&I water-demand reduction in Santa Clara County resulting from the program is estimated to be 4,416 AF per year. In reality, this demand reduction would be available to all water retailers. However, for current modeling purposes, the reduction was applied only to the San Jose Water Company (water charge zone W-2) and the City of Gilroy (water charge zone W-5). It was assumed that 94 percent of demand reductions were applied to zone W-2 and 6 percent applied to zone W-5.
4,416
Leak Detection
Leak detection is assumed to reduce water demand by 276 AF per year in Santa Clara County. Implementation would be similar to that for the AMI program. For modeling purposes, 94 percent of the reduction (259 AF) was applied to the San Jose Water Company (water charge zone W-2) and the remaining 6 percent of the reduction (17 AF) was applied to the City of Gilroy (representing South County, water charge zone W-5).
276
Rain Barrels
It was assumed that a rebate program for the purchase and use of rain barrels to capture rainwater water would reduce demand in Santa Clara County by 113 AF per year. Implementation of the rain barrel rebate program was assumed to be similar to that for the AMI program described above. For modeling purposes, 94 percent of the reduction (106 AF) was applied to the San Jose Water Company (water charge zone W-2) and the remaining 6 percent of the reduction (7 AF) was applied to the City of Gilroy (water charge zone W-5).
113
Stormwater capture pond proposal on agriculture land
This project would capture passive flow into a pond, either from road ditches or off hill sides on agricultural land. Preliminary estimates for capture are conservative and based on an article in Groundwater by Russo, Fisher, and Lockwood (2015). The authors describe 50 AF as the low-end expectation for an agricultural land stormwater recharge pond.
50
Centralized stormwater capture and recharge facility
This includes the following centralized stormwater capture and recharge projects that were initially identified in SCVWD’s 2012 Water Supply and Infrastructure Master Plan: the Quito stormwater project, with an average yield of 115 AF per year; the Snell stormwater project, with an average yield of 895 AF per year; and the rain gardens stormwater project, with an average yield of 259 AF per year. The total yield for these proposed stormwater projects was estimated to be 1,268 AF per year. For modeling purposes, centralized stormwater-capture yield was defined as 1,200 AF per year on average, which is a conservation estimate.
1,200
Total Supplies from No Regrets Package 11,115 Key: AF = acre-feet AMI = Advanced Metering Infrastructure CVP = Central Valley Project IPR = Indirect Potable Reuse M&I = municipal and industrial SCVWD = Santa Clara Valley Water District SWP = State Water Project
Pacheco Reservoir Expansion Project
Benefit Calculation, Monetization and Resiliency A.12 Uncertainty Analysis August 2017 – 3-7
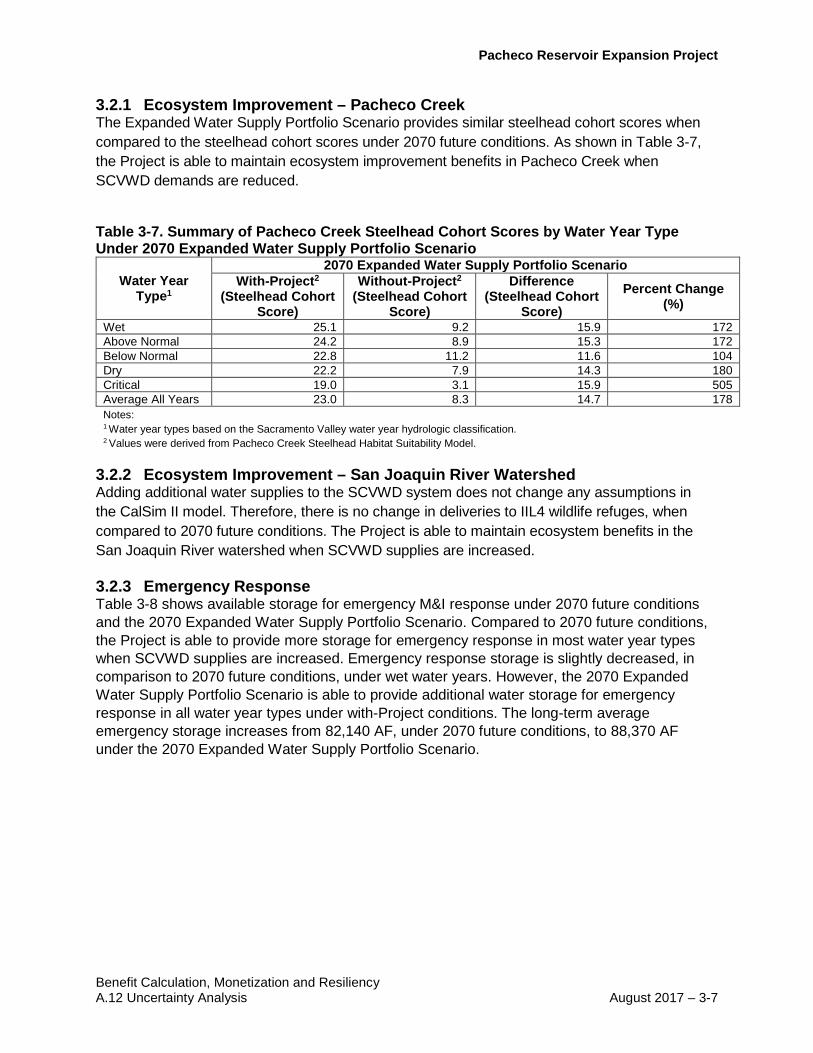
3.2.1 Ecosystem Improvement – Pacheco Creek The Expanded Water Supply Portfolio Scenario provides similar steelhead cohort scores when compared to the steelhead cohort scores under 2070 future conditions. As shown in Table 3-7, the Project is able to maintain ecosystem improvement benefits in Pacheco Creek when SCVWD demands are reduced.
Table 3-7. Summary of Pacheco Creek Steelhead Cohort Scores by Water Year Type Under 2070 Expanded Water Supply Portfolio Scenario
Water Year Type1
2070 Expanded Water Supply Portfolio Scenario With-Project2
(Steelhead Cohort Score)
Without-Project2 (Steelhead Cohort
Score)
Difference (Steelhead Cohort
Score) Percent Change
(%) Wet 25.1 9.2 15.9 172 Above Normal 24.2 8.9 15.3 172 Below Normal 22.8 11.2 11.6 104 Dry 22.2 7.9 14.3 180 Critical 19.0 3.1 15.9 505 Average All Years 23.0 8.3 14.7 178 Notes: 1 Water year types based on the Sacramento Valley water year hydrologic classification. 2 Values were derived from Pacheco Creek Steelhead Habitat Suitability Model.
3.2.2 Ecosystem Improvement – San Joaquin River Watershed Adding additional water supplies to the SCVWD system does not change any assumptions in the CalSim II model. Therefore, there is no change in deliveries to IIL4 wildlife refuges, when compared to 2070 future conditions. The Project is able to maintain ecosystem benefits in the San Joaquin River watershed when SCVWD supplies are increased.
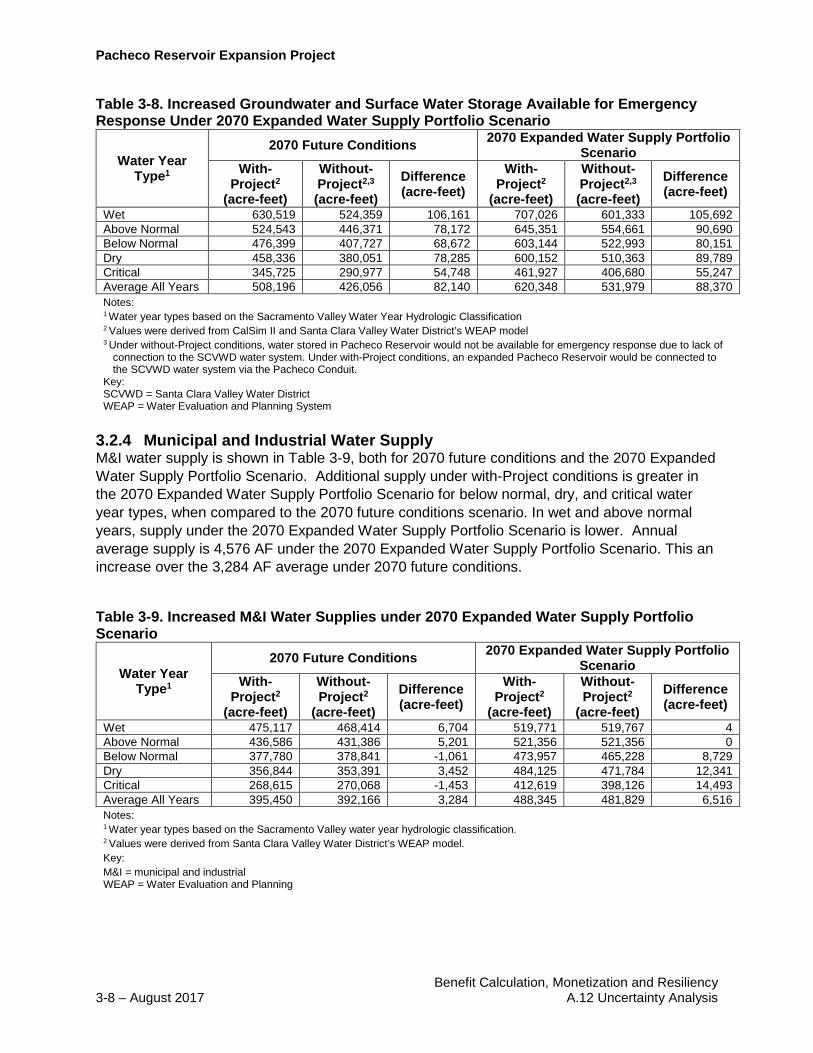
3.2.3 Emergency Response Table 3-8 shows available storage for emergency M&I response under 2070 future conditions and the 2070 Expanded Water Supply Portfolio Scenario. Compared to 2070 future conditions, the Project is able to provide more storage for emergency response in most water year types when SCVWD supplies are increased. Emergency response storage is slightly decreased, in comparison to 2070 future conditions, under wet water years. However, the 2070 Expanded Water Supply Portfolio Scenario is able to provide additional water storage for emergency response in all water year types under with-Project conditions. The long-term average emergency storage increases from 82,140 AF, under 2070 future conditions, to 88,370 AF under the 2070 Expanded Water Supply Portfolio Scenario.
Pacheco Reservoir Expansion Project
Benefit Calculation, Monetization and Resiliency 3-8 – August 2017 A.12 Uncertainty Analysis
Table 3-8. Increased Groundwater and Surface Water Storage Available for Emergency Response Under 2070 Expanded Water Supply Portfolio Scenario
Water Year Type1
2070 Future Conditions 2070 Expanded Water Supply Portfolio Scenario
With- Project2
(acre-feet)
Without- Project2,3 (acre-feet)
Difference (acre-feet)
With- Project2
(acre-feet)
Without- Project2,3 (acre-feet)
Difference (acre-feet)
Wet 630,519 524,359 106,161 707,026 601,333 105,692 Above Normal 524,543 446,371 78,172 645,351 554,661 90,690 Below Normal 476,399 407,727 68,672 603,144 522,993 80,151 Dry 458,336 380,051 78,285 600,152 510,363 89,789 Critical 345,725 290,977 54,748 461,927 406,680 55,247 Average All Years 508,196 426,056 82,140 620,348 531,979 88,370 Notes: 1 Water year types based on the Sacramento Valley Water Year Hydrologic Classification 2 Values were derived from CalSim II and Santa Clara Valley Water District’s WEAP model 3 Under without-Project conditions, water stored in Pacheco Reservoir would not be available for emergency response due to lack of
connection to the SCVWD water system. Under with-Project conditions, an expanded Pacheco Reservoir would be connected to the SCVWD water system via the Pacheco Conduit.
Key: SCVWD = Santa Clara Valley Water District WEAP = Water Evaluation and Planning System
3.2.4 Municipal and Industrial Water Supply M&I water supply is shown in Table 3-9, both for 2070 future conditions and the 2070 Expanded Water Supply Portfolio Scenario. Additional supply under with-Project conditions is greater in the 2070 Expanded Water Supply Portfolio Scenario for below normal, dry, and critical water year types, when compared to the 2070 future conditions scenario. In wet and above normal years, supply under the 2070 Expanded Water Supply Portfolio Scenario is lower. Annual average supply is 4,576 AF under the 2070 Expanded Water Supply Portfolio Scenario. This an increase over the 3,284 AF average under 2070 future conditions.
Table 3-9. Increased M&I Water Supplies under 2070 Expanded Water Supply Portfolio Scenario
Water Year Type1
2070 Future Conditions 2070 Expanded Water Supply Portfolio Scenario
With- Project2
(acre-feet)
Without- Project2
(acre-feet) Difference (acre-feet)
With- Project2
(acre-feet)
Without- Project2
(acre-feet) Difference (acre-feet)
Wet 475,117 468,414 6,704 519,771 519,767 4 Above Normal 436,586 431,386 5,201 521,356 521,356 0 Below Normal 377,780 378,841 -1,061 473,957 465,228 8,729 Dry 356,844 353,391 3,452 484,125 471,784 12,341 Critical 268,615 270,068 -1,453 412,619 398,126 14,493 Average All Years 395,450 392,166 3,284 488,345 481,829 6,516 Notes: 1 Water year types based on the Sacramento Valley water year hydrologic classification. 2 Values were derived from Santa Clara Valley Water District’s WEAP model. Key: M&I = municipal and industrial WEAP = Water Evaluation and Planning
Pacheco Reservoir Expansion Project
Benefit Calculation, Monetization and Resiliency A.12 Uncertainty Analysis August 2017 – 3-9
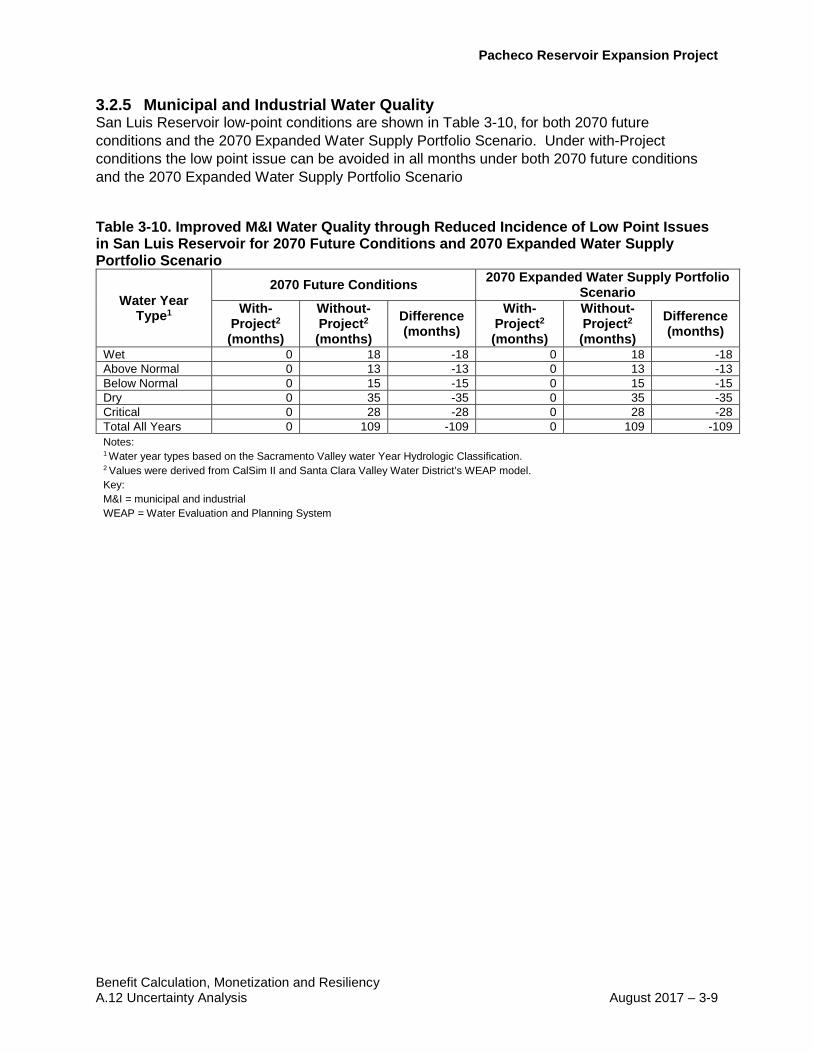
3.2.5 Municipal and Industrial Water Quality San Luis Reservoir low-point conditions are shown in Table 3-10, for both 2070 future conditions and the 2070 Expanded Water Supply Portfolio Scenario. Under with-Project conditions the low point issue can be avoided in all months under both 2070 future conditions and the 2070 Expanded Water Supply Portfolio Scenario
Table 3-10. Improved M&I Water Quality through Reduced Incidence of Low Point Issues in San Luis Reservoir for 2070 Future Conditions and 2070 Expanded Water Supply Portfolio Scenario
Water Year Type1
2070 Future Conditions 2070 Expanded Water Supply Portfolio Scenario
With- Project2 (months)
Without- Project2 (months)
Difference (months)
With- Project2 (months)
Without- Project2 (months)
Difference (months)
Wet 0 18 -18 0 18 -18 Above Normal 0 13 -13 0 13 -13 Below Normal 0 15 -15 0 15 -15 Dry 0 35 -35 0 35 -35 Critical 0 28 -28 0 28 -28 Total All Years 0 109 -109 0 109 -109 Notes: 1 Water year types based on the Sacramento Valley water Year Hydrologic Classification. 2 Values were derived from CalSim II and Santa Clara Valley Water District’s WEAP model. Key: M&I = municipal and industrial WEAP = Water Evaluation and Planning System

Pacheco Reservoir Expansion Project
Benefit Calculation, Monetization and Resiliency 3-10 – August 2017 A.12 Uncertainty Analysis
This page left blank intentionally.
Pacheco Reservoir Expansion Project
Benefit Calculation, Monetization and Resiliency A.12 Uncertainty Analysis August 2017 – 4-1
CHAPTER 4 OTHER SOURCES OF UNCERTAINTY
This section provides an analysis of other sources of uncertainty identified by SCVWD and potential adaptations in operations to cope with those uncertainties, pursuant to Section 6004(a)(8)(C) of the regulations.
An important potential source of uncertainty is changes in imported supplies, from State Water Project (SWP), Central Valley Project (CVP), or Hetch Hetchy sources. Changes in infrastructure or regulations in the Central Valley could alter SWP or CVP supply allocations to SCVWD. This source of uncertainty is not specifically analyzed here due to the degree of uncertainty involved in predicting the change. However, given the robust nature of the outcomes under the four scenarios presented in this chapter, it is reasonable to expect that the with-project operation will be able to continue to provide comparable—or better public benefits, even if there are changes in imported water supplies. Further, the two CWC-provided climate change scenarios do have substantial changes in SWP and CVP allocations, so changes in those imported water sources are already included in two of the scenarios analyzed in this attachment. The 2070 Wetter/Moderate-Warming CalSim II run shows increases of 8 to10 percent in SWP and CVP M&I and agricultural project allocations, while the 2070 Drier/Extreme-Warming Uncertainty run shows decreases of 5 to7 percent.
Potential adaptive management strategies that may be employed to provide public benefits in consideration of uncertain future conditions are described in detail in Chapter 5 of Benefit Calculation, Monetization, and Resiliency Attachment A2: Preliminary Operations Plan. These uncertainties and adaptive management strategies are summarized below.
One source of uncertainty is how South-Central California Coast (SCCC) steelhead will respond to improved flow conditions in Pacheco Creek, since SCCC steelhead do not currently have an annual presence in that waterway. An adaptive management process will be implemented to increase or broaden the beneficial impact of flow releases from the new dam. This process may include data collection, monitoring, and modification of the flow management plan, as necessary
Lastly, estimating public benefits from providing increased emergency water supply storage is further complicated by uncertainty about the timing, severity, and duration of an emergency, as well as other factors. In the event that an emergency response is needed, an after-action review will be conducted so that future emergency response operations can be improved.
Pacheco Reservoir Expansion Project
Benefit Calculation, Monetization and Resiliency 4-2 – August 2017 A.12 Uncertainty Analysis
This page left blank intentionally.
Pacheco Reservoir Expansion Project
Benefit Calculation, Monetization and Resiliency A.12 Uncertainty Analysis August 2017 – 5-1
CHAPTER 5 PROJECT PERFORMANCE DURING A DROUGHT
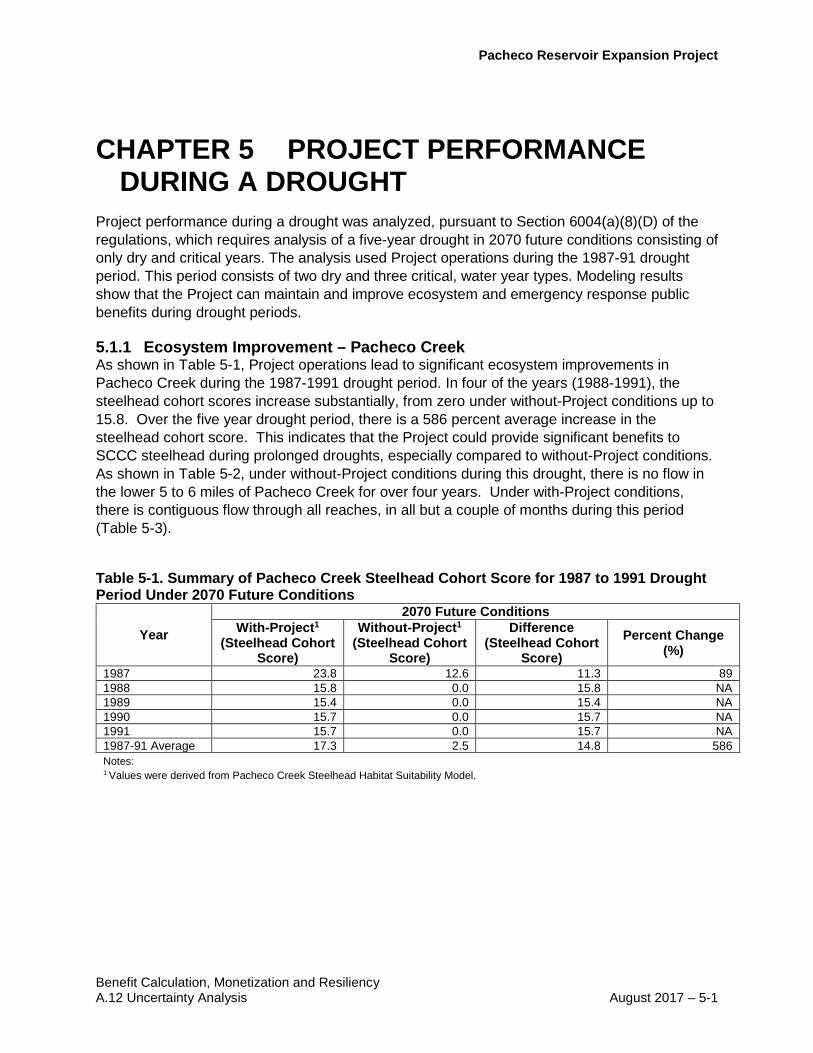
Project performance during a drought was analyzed, pursuant to Section 6004(a)(8)(D) of the regulations, which requires analysis of a five-year drought in 2070 future conditions consisting of only dry and critical years. The analysis used Project operations during the 1987-91 drought period. This period consists of two dry and three critical, water year types. Modeling results show that the Project can maintain and improve ecosystem and emergency response public benefits during drought periods.
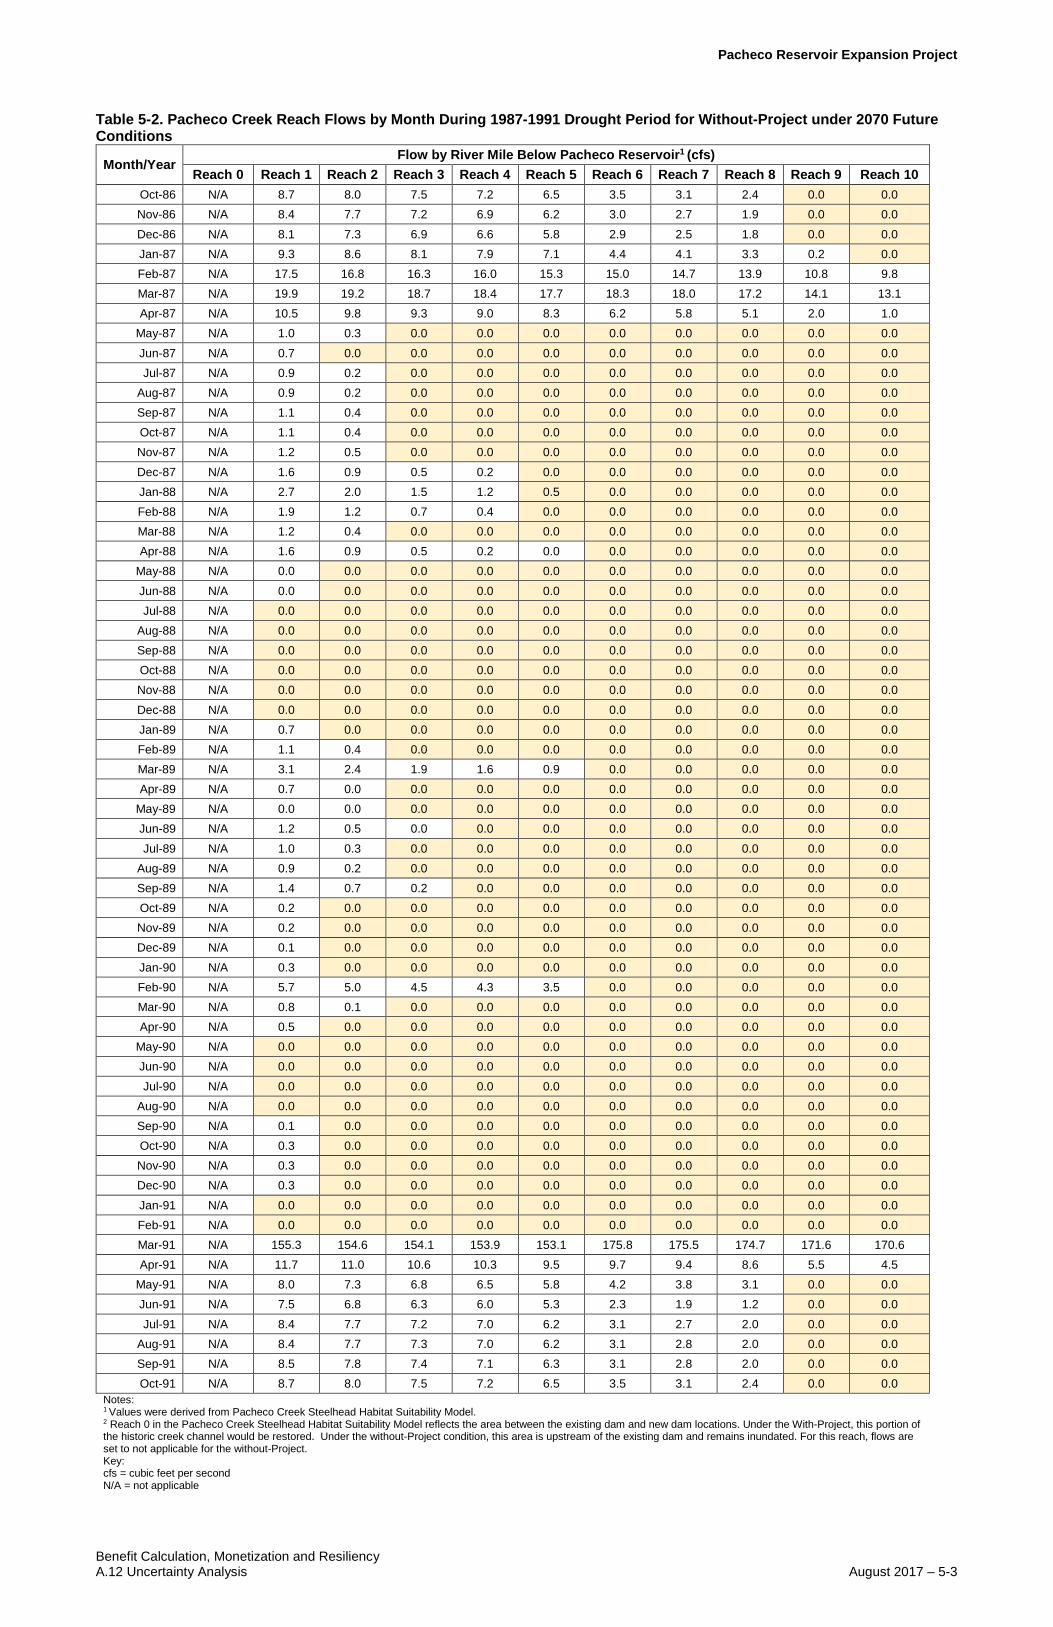
5.1.1 Ecosystem Improvement – Pacheco Creek As shown in Table 5-1, Project operations lead to significant ecosystem improvements in Pacheco Creek during the 1987-1991 drought period. In four of the years (1988-1991), the steelhead cohort scores increase substantially, from zero under without-Project conditions up to 15.8. Over the five year drought period, there is a 586 percent average increase in the steelhead cohort score. This indicates that the Project could provide significant benefits to SCCC steelhead during prolonged droughts, especially compared to without-Project conditions. As shown in Table 5-2, under without-Project conditions during this drought, there is no flow in the lower 5 to 6 miles of Pacheco Creek for over four years. Under with-Project conditions, there is contiguous flow through all reaches, in all but a couple of months during this period (Table 5-3).
Table 5-1. Summary of Pacheco Creek Steelhead Cohort Score for 1987 to 1991 Drought Period Under 2070 Future Conditions
Year
2070 Future Conditions With-Project1
(Steelhead Cohort Score)
Without-Project1 (Steelhead Cohort
Score)
Difference (Steelhead Cohort
Score) Percent Change
(%) 1987 23.8 12.6 11.3 89 1988 15.8 0.0 15.8 NA 1989 15.4 0.0 15.4 NA 1990 15.7 0.0 15.7 NA 1991 15.7 0.0 15.7 NA 1987-91 Average 17.3 2.5 14.8 586 Notes: 1 Values were derived from Pacheco Creek Steelhead Habitat Suitability Model.

Pacheco Reservoir Expansion Project
Benefit Calculation, Monetization and Resiliency 5-2 – August 2017 A.12 Uncertainty Analysis
This page left blank intentionally.
Pacheco Reservoir Expansion Project
Benefit Calculation, Monetization and Resiliency A.12 Uncertainty Analysis August 2017 – 5-3
Table 5-2. Pacheco Creek Reach Flows by Month During 1987-1991 Drought Period for Without-Project under 2070 Future Conditions
Month/Year Flow by River Mile Below Pacheco Reservoir1 (cfs)
Reach 0 Reach 1 Reach 2 Reach 3 Reach 4 Reach 5 Reach 6 Reach 7 Reach 8 Reach 9 Reach 10 Oct-86 N/A 8.7 8.0 7.5 7.2 6.5 3.5 3.1 2.4 0.0 0.0 Nov-86 N/A 8.4 7.7 7.2 6.9 6.2 3.0 2.7 1.9 0.0 0.0
Dec-86 N/A 8.1 7.3 6.9 6.6 5.8 2.9 2.5 1.8 0.0 0.0 Jan-87 N/A 9.3 8.6 8.1 7.9 7.1 4.4 4.1 3.3 0.2 0.0 Feb-87 N/A 17.5 16.8 16.3 16.0 15.3 15.0 14.7 13.9 10.8 9.8 Mar-87 N/A 19.9 19.2 18.7 18.4 17.7 18.3 18.0 17.2 14.1 13.1 Apr-87 N/A 10.5 9.8 9.3 9.0 8.3 6.2 5.8 5.1 2.0 1.0
May-87 N/A 1.0 0.3 0.0 0.0 0.0 0.0 0.0 0.0 0.0 0.0
Jun-87 N/A 0.7 0.0 0.0 0.0 0.0 0.0 0.0 0.0 0.0 0.0 Jul-87 N/A 0.9 0.2 0.0 0.0 0.0 0.0 0.0 0.0 0.0 0.0
Aug-87 N/A 0.9 0.2 0.0 0.0 0.0 0.0 0.0 0.0 0.0 0.0 Sep-87 N/A 1.1 0.4 0.0 0.0 0.0 0.0 0.0 0.0 0.0 0.0 Oct-87 N/A 1.1 0.4 0.0 0.0 0.0 0.0 0.0 0.0 0.0 0.0 Nov-87 N/A 1.2 0.5 0.0 0.0 0.0 0.0 0.0 0.0 0.0 0.0
Dec-87 N/A 1.6 0.9 0.5 0.2 0.0 0.0 0.0 0.0 0.0 0.0 Jan-88 N/A 2.7 2.0 1.5 1.2 0.5 0.0 0.0 0.0 0.0 0.0 Feb-88 N/A 1.9 1.2 0.7 0.4 0.0 0.0 0.0 0.0 0.0 0.0 Mar-88 N/A 1.2 0.4 0.0 0.0 0.0 0.0 0.0 0.0 0.0 0.0 Apr-88 N/A 1.6 0.9 0.5 0.2 0.0 0.0 0.0 0.0 0.0 0.0
May-88 N/A 0.0 0.0 0.0 0.0 0.0 0.0 0.0 0.0 0.0 0.0
Jun-88 N/A 0.0 0.0 0.0 0.0 0.0 0.0 0.0 0.0 0.0 0.0 Jul-88 N/A 0.0 0.0 0.0 0.0 0.0 0.0 0.0 0.0 0.0 0.0
Aug-88 N/A 0.0 0.0 0.0 0.0 0.0 0.0 0.0 0.0 0.0 0.0 Sep-88 N/A 0.0 0.0 0.0 0.0 0.0 0.0 0.0 0.0 0.0 0.0 Oct-88 N/A 0.0 0.0 0.0 0.0 0.0 0.0 0.0 0.0 0.0 0.0 Nov-88 N/A 0.0 0.0 0.0 0.0 0.0 0.0 0.0 0.0 0.0 0.0
Dec-88 N/A 0.0 0.0 0.0 0.0 0.0 0.0 0.0 0.0 0.0 0.0 Jan-89 N/A 0.7 0.0 0.0 0.0 0.0 0.0 0.0 0.0 0.0 0.0 Feb-89 N/A 1.1 0.4 0.0 0.0 0.0 0.0 0.0 0.0 0.0 0.0 Mar-89 N/A 3.1 2.4 1.9 1.6 0.9 0.0 0.0 0.0 0.0 0.0 Apr-89 N/A 0.7 0.0 0.0 0.0 0.0 0.0 0.0 0.0 0.0 0.0
May-89 N/A 0.0 0.0 0.0 0.0 0.0 0.0 0.0 0.0 0.0 0.0 Jun-89 N/A 1.2 0.5 0.0 0.0 0.0 0.0 0.0 0.0 0.0 0.0
Jul-89 N/A 1.0 0.3 0.0 0.0 0.0 0.0 0.0 0.0 0.0 0.0 Aug-89 N/A 0.9 0.2 0.0 0.0 0.0 0.0 0.0 0.0 0.0 0.0 Sep-89 N/A 1.4 0.7 0.2 0.0 0.0 0.0 0.0 0.0 0.0 0.0 Oct-89 N/A 0.2 0.0 0.0 0.0 0.0 0.0 0.0 0.0 0.0 0.0 Nov-89 N/A 0.2 0.0 0.0 0.0 0.0 0.0 0.0 0.0 0.0 0.0 Dec-89 N/A 0.1 0.0 0.0 0.0 0.0 0.0 0.0 0.0 0.0 0.0
Jan-90 N/A 0.3 0.0 0.0 0.0 0.0 0.0 0.0 0.0 0.0 0.0 Feb-90 N/A 5.7 5.0 4.5 4.3 3.5 0.0 0.0 0.0 0.0 0.0 Mar-90 N/A 0.8 0.1 0.0 0.0 0.0 0.0 0.0 0.0 0.0 0.0 Apr-90 N/A 0.5 0.0 0.0 0.0 0.0 0.0 0.0 0.0 0.0 0.0
May-90 N/A 0.0 0.0 0.0 0.0 0.0 0.0 0.0 0.0 0.0 0.0 Jun-90 N/A 0.0 0.0 0.0 0.0 0.0 0.0 0.0 0.0 0.0 0.0
Jul-90 N/A 0.0 0.0 0.0 0.0 0.0 0.0 0.0 0.0 0.0 0.0 Aug-90 N/A 0.0 0.0 0.0 0.0 0.0 0.0 0.0 0.0 0.0 0.0 Sep-90 N/A 0.1 0.0 0.0 0.0 0.0 0.0 0.0 0.0 0.0 0.0 Oct-90 N/A 0.3 0.0 0.0 0.0 0.0 0.0 0.0 0.0 0.0 0.0 Nov-90 N/A 0.3 0.0 0.0 0.0 0.0 0.0 0.0 0.0 0.0 0.0 Dec-90 N/A 0.3 0.0 0.0 0.0 0.0 0.0 0.0 0.0 0.0 0.0
Jan-91 N/A 0.0 0.0 0.0 0.0 0.0 0.0 0.0 0.0 0.0 0.0 Feb-91 N/A 0.0 0.0 0.0 0.0 0.0 0.0 0.0 0.0 0.0 0.0 Mar-91 N/A 155.3 154.6 154.1 153.9 153.1 175.8 175.5 174.7 171.6 170.6 Apr-91 N/A 11.7 11.0 10.6 10.3 9.5 9.7 9.4 8.6 5.5 4.5
May-91 N/A 8.0 7.3 6.8 6.5 5.8 4.2 3.8 3.1 0.0 0.0 Jun-91 N/A 7.5 6.8 6.3 6.0 5.3 2.3 1.9 1.2 0.0 0.0
Jul-91 N/A 8.4 7.7 7.2 7.0 6.2 3.1 2.7 2.0 0.0 0.0 Aug-91 N/A 8.4 7.7 7.3 7.0 6.2 3.1 2.8 2.0 0.0 0.0 Sep-91 N/A 8.5 7.8 7.4 7.1 6.3 3.1 2.8 2.0 0.0 0.0 Oct-91 N/A 8.7 8.0 7.5 7.2 6.5 3.5 3.1 2.4 0.0 0.0
Notes: 1 Values were derived from Pacheco Creek Steelhead Habitat Suitability Model. 2 Reach 0 in the Pacheco Creek Steelhead Habitat Suitability Model reflects the area between the existing dam and new dam locations. Under the With-Project, this portion of the historic creek channel would be restored. Under the without-Project condition, this area is upstream of the existing dam and remains inundated. For this reach, flows are set to not applicable for the without-Project. Key: cfs = cubic feet per second N/A = not applicable

Pacheco Reservoir Expansion Project
Benefit Calculation, Monetization and Resiliency 5-4 – August 2017 A.12 Uncertainty Analysis
This page left blank intentionally.

Pacheco Reservoir Expansion Project
Benefit Calculation, Monetization and Resiliency A.12 Uncertainty Analysis August 2017 – 5-5
Table 5-3. Pacheco Creek Reach Flows by Month During 1987-1991 Drought Period for With-Project under 2070 Future Conditions
Month/Year Flow by River Mile Below Pacheco Reservoir (cfs)
Reach 0 Reach 1 Reach 2 Reach 3 Reach 4 Reach 5 Reach 6 Reach 7 Reach 8 Reach 9 Reach 10 Oct-86 13.8 13.4 12.7 12.3 12.0 11.2 8.1 7.7 7.0 3.9 2.9 Nov-86 9.9 9.5 8.8 8.4 8.1 7.3 4.1 3.8 3.0 0.0 0.0
Dec-86 10.1 9.7 9.0 8.5 8.2 7.5 4.4 4.1 3.3 0.2 0.0 Jan-87 11.4 11.0 10.3 9.8 9.5 8.8 6.0 5.6 4.9 1.8 0.8 Feb-87 14.3 13.8 13.1 12.7 12.4 11.6 11.3 11.0 10.2 7.1 6.1 Mar-87 32.2 31.7 31.0 30.6 30.3 29.5 30.0 29.7 28.9 25.8 24.8 Apr-87 22.6 22.2 21.5 21.0 20.7 20.0 17.8 17.4 16.7 13.6 12.6
May-87 12.1 11.7 11.0 10.6 10.3 9.5 6.6 6.2 5.5 2.4 1.4
Jun-87 13.6 13.2 12.5 12.1 11.8 11.0 7.7 7.4 6.6 3.5 2.5 Jul-87 13.6 13.2 12.5 12.0 11.7 11.0 7.8 7.4 6.7 3.6 2.6
Aug-87 13.6 13.2 12.5 12.0 11.8 11.0 7.8 7.5 6.7 3.6 2.6 Sep-87 13.8 13.4 12.6 12.2 11.9 11.1 7.9 7.5 6.8 3.7 2.7 Oct-87 13.8 13.4 12.7 12.2 11.9 11.2 8.0 7.7 6.9 3.8 2.8 Nov-87 10.0 9.6 8.9 8.4 8.1 7.3 4.1 3.8 3.0 0.0 0.0
Dec-87 10.5 10.1 9.4 8.9 8.6 7.9 4.9 4.6 3.8 0.7 0.0 Jan-88 11.6 11.2 10.5 10.0 9.7 9.0 6.2 5.9 5.1 2.0 1.0 Feb-88 10.8 10.4 9.7 9.2 8.9 8.2 4.8 4.5 3.7 0.6 0.0 Mar-88 20.0 19.6 18.9 18.5 18.2 17.4 14.3 14.0 13.2 10.1 9.1 Apr-88 21.6 21.2 20.5 20.0 19.7 19.0 16.1 15.8 15.0 11.9 10.9
May-88 12.1 11.7 11.0 10.5 10.2 9.4 6.3 6.0 5.2 2.1 1.1
Jun-88 13.8 13.4 12.7 12.3 12.0 11.2 7.9 7.6 6.8 3.7 2.7 Jul-88 14.0 13.6 12.9 12.5 12.2 11.4 8.3 8.0 7.2 4.1 3.1
Aug-88 13.9 13.5 12.8 12.3 12.1 11.3 8.2 7.8 7.1 4.0 3.0 Sep-88 13.9 13.5 12.8 12.3 12.0 11.3 8.0 7.7 6.9 3.8 2.8 Oct-88 13.8 13.4 12.6 12.2 11.9 11.1 8.0 7.6 6.9 3.8 2.8 Nov-88 9.8 9.4 8.7 8.3 8.0 7.2 3.9 3.6 2.8 0.0 0.0
Dec-88 10.0 9.5 8.8 8.4 8.1 7.3 4.2 3.9 3.1 0.0 0.0 Jan-89 10.9 10.5 9.8 9.3 9.0 8.3 5.4 5.0 4.3 1.2 0.2 Feb-89 11.4 11.0 10.3 9.8 9.5 8.8 5.6 5.3 4.5 1.4 0.4 Mar-89 23.4 23.0 22.3 21.8 21.5 20.8 18.4 18.1 17.3 14.2 13.2 Apr-89 20.7 20.3 19.6 19.1 18.8 18.1 15.0 14.6 13.9 10.8 9.8
May-89 11.8 11.4 10.7 10.3 10.0 9.2 6.1 5.7 5.0 1.9 0.9 Jun-89 15.0 14.6 13.9 13.4 13.1 12.4 9.3 9.0 8.2 5.1 4.1
Jul-89 14.7 14.3 13.6 13.1 12.8 12.1 9.1 8.8 8.0 4.9 3.9 Aug-89 14.6 14.2 13.5 13.0 12.7 12.0 9.0 8.7 7.9 4.8 3.8 Sep-89 15.1 14.7 14.0 13.5 13.2 12.5 9.5 9.1 8.4 5.3 4.3 Oct-89 13.8 13.4 12.7 12.2 11.9 11.2 8.0 7.7 6.9 3.8 2.8 Nov-89 9.9 9.5 8.8 8.3 8.1 7.3 4.1 3.7 3.0 0.0 0.0 Dec-89 9.9 9.4 8.7 8.3 8.0 7.2 4.1 3.7 3.0 0.0 0.0
Jan-90 10.0 9.6 8.9 8.5 8.2 7.4 4.3 4.0 3.2 0.1 0.0 Feb-90 15.6 15.1 14.4 14.0 13.7 12.9 10.7 10.3 9.6 6.5 5.5 Mar-90 20.6 20.2 19.5 19.0 18.7 18.0 15.0 14.7 13.9 10.8 9.8 Apr-90 19.7 19.3 18.6 18.1 17.8 17.0 13.7 13.4 12.6 9.5 8.5
May-90 11.6 11.2 10.5 10.0 9.7 9.0 5.8 5.4 4.7 1.6 0.6 Jun-90 13.5 13.1 12.4 11.9 11.6 10.9 7.5 7.2 6.4 3.3 2.3
Jul-90 13.5 13.1 12.4 11.9 11.6 10.9 7.7 7.3 6.6 3.5 2.5 Aug-90 13.5 13.1 12.4 12.0 11.7 10.9 7.7 7.4 6.6 3.5 2.5 Sep-90 13.6 13.2 12.5 12.1 11.8 11.0 7.7 7.4 6.6 3.5 2.5 Oct-90 13.9 13.5 12.8 12.3 12.0 11.3 8.1 7.8 7.0 3.9 2.9 Nov-90 9.9 9.5 8.8 8.3 8.1 7.3 4.1 3.7 3.0 0.0 0.0 Dec-90 10.0 9.6 8.9 8.4 8.1 7.4 4.3 3.9 3.2 0.1 0.0
Jan-91 10.0 9.6 8.9 8.4 8.1 7.4 4.3 3.9 3.2 0.1 0.0 Feb-91 10.0 9.6 8.9 8.4 8.1 7.4 3.9 3.5 2.8 0.0 0.0 Mar-91 119.4 119.0 118.3 117.8 117.5 116.7 142.8 142.5 141.7 138.6 137.6 Apr-91 26.8 26.4 25.7 25.3 25.0 24.2 24.3 24.0 23.2 20.1 19.1
May-91 13.5 13.1 12.4 11.9 11.6 10.9 9.2 8.8 8.1 5.0 4.0 Jun-91 13.8 13.4 12.7 12.2 11.9 11.2 8.1 7.7 7.0 3.9 2.9
Jul-91 13.5 13.1 12.4 12.0 11.7 10.9 7.7 7.4 6.6 3.5 2.5 Aug-91 13.6 13.2 12.4 12.0 11.7 10.9 7.7 7.4 6.6 3.5 2.5 Sep-91 13.7 13.3 12.6 12.1 11.8 11.0 7.7 7.4 6.6 3.5 2.5
Notes: 1 Values were derived from Pacheco Creek Steelhead Habitat Suitability Model. Key: cfs = cubic feet per second

Pacheco Reservoir Expansion Project
Benefit Calculation, Monetization and Resiliency 5-6 – August 2017 A.12 Uncertainty Analysis
This page left blank intentionally.

Pacheco Reservoir Expansion Project
Benefit Calculation, Monetization and Resiliency A.12 Uncertainty Analysis August 2017 – 5-1
5.1.2 Ecosystem Improvement – San Joaquin River Watershed IL4 water supply would only be provided to wildlife refuges in the San Joaquin River watershed during below normal water years. Drought conditions are identified solely as dry and critical years. Therefore, benefits during drought conditions were not analyzed.
5.1.3 Emergency Response Table 5-4 shows total storage available for emergency response during the 1987-91 drought period. Modeling results show that the Project provides substantial increases in emergency storage over without-Project conditions during prolonged drought. The average increase of emergency response storage, provided by the Project during the 1987-1991, period is 80,813 AF. This indicates that the Project could provide significant emergency response benefits under drought conditions. It should be noted that the reductions in storage throughout the drought are primarily attributable to changes in Pacheco Reservoir storage. These reductions are due to releases for Pacheco Creek steelhead habitat. As shown in Table 5-1, these releases provided substantial benefits for Pacheco Creek steelhead.
Table 5-4. Increased Groundwater and Surface Water Storage Available for Emergency Response for 1987 to 1991 Drought Period Under 2070 Future Conditions
Year 2070 Future Conditions
With-Project1 (acre-feet)
Without-Project1,2 (acre-feet)
Difference (acre-feet)
1987 513,930 402,738 111,192 1988 375,880 286,348 89,532 1989 339,864 262,656 77,208 1990 307,242 241,982 65,259 1991 297,907 237,032 60,876 1987-91 Average 366,965 286,151 80,813 Notes: 1 Values were derived from CalSim II and SCVWD’s WEAP model 2 Under without-Project conditions, water stored in Pacheco Reservoir would not be available for emergency
response due to lack of connection to the SCVWD water system. Under with-Project conditions, an expanded Pacheco Reservoir would be connected to the SCVWD water system via the Pacheco Conduit.
Key: SCVWD = Santa Clara Valley Water District WEAP = Water Evaluation and Planning System

Pacheco Reservoir Expansion Project
Benefit Calculation, Monetization and Resiliency 5-2 – August 2017 A.12 Uncertainty Analysis
This page left blank intentionally.

Pacheco Reservoir Expansion Project
Benefit Calculation, Monetization and Resiliency A.12 Uncertainty Analysis August 2017 – 6-1
CHAPTER 6 REFERENCES Russo, T.A., A.T. Fisher, and B.S. Lockwood. 2014. Assessment of Managed Aquifer Recharge
Site Suitability Using a GIS and Modeling. Groundwater, 53(3):389-400. DOI: 10.1111/gwat.12213
Pacheco Reservoir Expansion Project
Benefit Calculation, Monetization and Resiliency 6-2 – August 2017 A.12 Uncertainty Analysis
This page left blank intentionally.