BENDING PROPERTIES OF STRUCTURAL TIMBER FROM … · BENDING PROPERTIES OF STRUCTURAL TIMBER FROM A...
18
233 BENDING PROPERTIES OF STRUCTURAL TIMBER FROM A 28-YEAR-OLD STAND OF NEW ZEALAND PINUS RADIATA H. BIER Forest Research Institute, New Zealand Forest Service, Private Bag, Rotorua, New Zealand (Received for publication 26 July 1985; revision 7 October 1985) ABSTRACT Seventy-eight upper logs taken from a 28-year-old stand of Pinus radiata D. Don in Kaingaroa State Forest, New Zealand, were sawn to maximise yields of 200 x 50-mm and 100 x 50-mm timber which was then dried, planed, visually and mechanically graded, and tested in bending. The timber was not as strong or as stiff as timber from older trees. Although the basic working stress in bending was higher than the code value, the modulus of elasticity was lower but not to an extent that is likely to cause problems in practice. A simplified grading rule was proposed which yields material with a basic working stress 50% higher than No. 1 Framing grade. Relationships between log variables and the properties of timber from each log were derived, and it was shown that currently prescribed design moduli of elasticity for Engineering grade might be obtained only for timber from logs with a basic density in excess of 490 kg/m 3 . Keywords: in-grade testing; strength; stiffness; basic density; modulus of rupture; modulus of elasticity; branch index; structural timber. INTRODUCTION About 86% of New Zealand's 1 million ha of exotic forest is planted in Pinus radiata (N.Z. Forest Service 1984). This resource is changing rapidly (Whiteside 1984) as the stands planted in the 1920s and 1930s are depleted and timber is beginning to be cut from silviculturally managed stands planted since the late 1950s. Heavy thinning and pruning in some stands has provided large-diameter trees with significant amounts of clear timber in the butt logs. Other stands, whilst not grown specifically for clear timber, will also be less mature than the older crop. It is expected that much of the structural timber will come from these younger stands and the upper logs of the trees with clear butt logs. The rotation age at felling may be as low as 30 years. The branch size and relative immaturity of these logs is likely to yield timber of lower density with some larger knots and wide growth rings (Bunn 1981; Cown & McConchie 1982). It is therefore important to quantify the effects of these variables on the properties of the timber. A computer-based silvicultural stand model available in New Zealand can be used to predict the effects of silviculture on grade recovery (Whiteside 1982) but this model has not been developed to predict the strength and stiffness of sawn timber. The data base includes samples selected for extremes of branch size and density. To New Zealand Journal of Forestry Science 15(2): 233-50 (1985)
Transcript of BENDING PROPERTIES OF STRUCTURAL TIMBER FROM … · BENDING PROPERTIES OF STRUCTURAL TIMBER FROM A...

233
BENDING PROPERTIES OF STRUCTURAL TIMBER FROM A 28-YEAR-OLD STAND OF NEW ZEALAND PINUS RADIATA
H. BIER
Forest Research Institute, New Zealand Forest Service, Private Bag, Rotorua, New Zealand
(Received for publication 26 July 1985; revision 7 October 1985)
ABSTRACT Seventy-eight upper logs taken from a 28-year-old stand of Pinus radiata
D. Don in Kaingaroa State Forest, New Zealand, were sawn to maximise yields of 200 x 50-mm and 100 x 50-mm timber which was then dried, planed, visually and mechanically graded, and tested in bending.
The timber was not as strong or as stiff as timber from older trees. Although the basic working stress in bending was higher than the code value, the modulus of elasticity was lower but not to an extent that is likely to cause problems in practice. A simplified grading rule was proposed which yields material with a basic working stress 50% higher than No. 1 Framing grade. Relationships between log variables and the properties of timber from each log were derived, and it was shown that currently prescribed design moduli of elasticity for Engineering grade might be obtained only for timber from logs with a basic density in excess of 490 kg/m3. Keywords: in-grade testing; strength; stiffness; basic density; modulus of
rupture; modulus of elasticity; branch index; structural timber.
INTRODUCTION About 86% of New Zealand's 1 million ha of exotic forest is planted in Pinus
radiata (N.Z. Forest Service 1984). This resource is changing rapidly (Whiteside 1984) as the stands planted in the 1920s and 1930s are depleted and timber is beginning to be cut from silviculturally managed stands planted since the late 1950s. Heavy thinning and pruning in some stands has provided large-diameter trees with significant amounts of clear timber in the butt logs. Other stands, whilst not grown specifically for clear timber, will also be less mature than the older crop. It is expected that much of the structural timber will come from these younger stands and the upper logs of the trees with clear butt logs. The rotation age at felling may be as low as 30 years.
The branch size and relative immaturity of these logs is likely to yield timber of lower density with some larger knots and wide growth rings (Bunn 1981; Cown & McConchie 1982). It is therefore important to quantify the effects of these variables on the properties of the timber.
A computer-based silvicultural stand model available in New Zealand can be used to predict the effects of silviculture on grade recovery (Whiteside 1982) but this model has not been developed to predict the strength and stiffness of sawn timber. The data base includes samples selected for extremes of branch size and density. To
New Zealand Journal of Forestry Science 15(2): 233-50 (1985)

234 New Zealand Journal of Forestry Science 15(2)
establish the effects on strength at the fifth percentile (which is used for deriving design stresses), a random selection of logs is required. Other studies on timber of specific grades have not included log quality measurements (Walford 1982). If relationships exist between timber strength properties and log and wood quality measurements these would:
(1) Assist in revising the strength values to be assigned to standard grades obtained from younger stands, or
(2) Aid in the formulation of revised grading rules to maintain current strength values, and
(3) Indicate what silviculture will produce better-quality structural material if this is seen as desirable.
The main object of the present study was to determine in-grade bending strength and stiffness of the sawn timber from the upper logs of pruned trees from a 28-year-old stand, and relate them to log quality measurements as well as timber grading parameters. The testing of timber in structural sizes is expensive and so, in obtaining data to achieve the objective, it was prudent to record data that will be useful for many purposes. This paper is confined to a comparison with timber from older trees, the effect of some timber variables on in-grade strength, and the effect of log variables on strength properties.
For an earlier report (Bier & Collins 1984), only the results of tests on 100 X 50-mm timber were available. For these the mechanical grading parameter, bending stiffness on the flat, was the best single indicator of mean strength and stiffness on the edge, but for visual grading, knot area ratio was the best single indicator of strength, and ring width the best single indicator of stiffness. However, the imposition of ring width limitations on visually graded timber was shown to have no significant effect on the fifth percentile strength and only a small effect on average stiffness. The derived allowable stresses of the visual timber grades exceeded current New Zealand design code values but the stiffness was about 10% below the current code values for Engineering grade and 3 % for No. 1 Framing grade. This paper includes the results of tests on 200 X 50-mm material.
MATERIAL AND METHODS Forty trees were selected from Cpt 1250 of Kaingaroa, State Forest, yielding 78
upper logs of a range of diameters. The pruned butt logs were excluded from the study because these contained a large proportion of clearwood which is more likely to be used for higher value non-structural products.
All logs were measured in the forest according to established procedures (Whiteside 1982) to obtain end diameters, the largest branch size in each of the four quadrant prisms of the log (branch index), and sweep. A disc was cut from the upper end of each log to determine basic density.
Small-end diameters ranged from 250 mm to 550 mm. The total under-bark volume of logs was 56.5 m3, yielding 31m 3 of sawn timber in 50-mm thickness. The logs less than 350 mm small-end diameter were cut to maximise 100 X 50-mm framing timber and those greater than 350 mm were cut to maximise 200 X 50-mm framing timber (Fig. 1). Properties of the log sample are summarised in Table 1.

Log properties
Small-end diameter (mm)
Taper (mm/m)
Branch index (cm)
Volume (m3)
Internode lengths (m)
Number of logs
TABLE 1-
Diameter
307
7.74
4.3
0.46
1.73
28
-Mean statistics of the log samples*
< 350 mm
(28 )
(2.90)
(1.25)
(0.07)
(1.32)
Diameter > 350 mm
423
8.75
5.6
0.87
2.04
50
(53 )
(4.03)
(1.9 )
(0.21)
(1.13)
(standard deviations
Second log
412
7.65
5.0
0.83
2.40
34
in parentheses)
Third log
370
7.82
5.0
0.67
1.45
29
Fourth log
334
11.1
5.8
0.59
1.91
14
Fifth log
313
12.3
6.3
0.51
-
1
Bier
-
8
ructural P.
1 &
* Stand: altitude 180 m, latitude 38° 18'S, medium Site Density Class (Cown & McConchie 1982).
Silvicultural treatment: Naturally regenerated on clearfelled forest 1955-56 Pruned to 2.4 m, thinned to 900 stems/ha 1961-62 Pruned to 6.1 m (445 stems/ha) 1964-65 Thinned to 300 stems/ha 1969-70 40 sample trees felled at age 28 1984
Log length 5.5 m

236 New Zealand Journal of Forestry Science 15(2)
SAWING PATTERN 1 SAWING PATTERN 3
FIG. 1—Sawing patterns (after Whiteside 1982).
Processing
The timber was visually graded in the green condition to Box, No. 2, and No. 1 Framing grades according to the New Zealand standard grading rules (SANZ 1978) by a professional timber grader. After kiln drying to a target moisture content of 16% for the sample, the No. 1 Framing grade was regraded to extract Engineering grade material. This procedure follows normal commercial practices.
The timber was then machined to dry dressed sizes (90 X 45 mm and 180 X 45 mm) and mechanically graded with a Plessey Computermatic Mark IVA machine set to sort Australian stress grades (SAA 1978).
Test Material
There were 340 sticks of 100 X 50-mm and 389 sticks of 200 X 50-mm graded timber. Each of the 100 X 50-mm sticks was cut into as many pieces of 1.8-m length as possible - altogether 888 pieces. The 200 X 50-mm timber was not long enough to cut into discrete test pieces, but a test piece length of 3.3 m was marked from each end. When sufficient length remained undamaged after the first test on a stick, two tests were possible, so that a total of 562 "pieces" were tested. All pieces were regraded visually in the laboratory. Each piece therefore had a mechanical grade (from colour coding), a piece grade (laboratory), and a stick grade (commercial grade of the parent stick). Each piece was randomly marked with an X to denote the top edge. The orientation of the worst defect (whether in compression or tension) and its location (inside or outside load heads) were noted before testing.

Bier — Bending properties of structural P. radiata 237
Test Methods Modulus of elasticity as plank
Each piece was tested on the flat over a span of 914 mm by applying a central preload of 222 N at the colour code indicating the lowest mechanical grade. A dial gauge at midspan was set to zero and a further 888-N load applied, with readings taken at 444 N and 888 N. The test was repeated if the second deflection was more than 0.1 mm different from twice the first reading.
The modulus of elasticity as a plank (EP) was computed from P 9143
EP = 4 S b3d
where 8 was the midspan deflection (mm) for a 888-N load P, d was the width of the piece (mm), and b the thickness (mm).
Bending as a joist
A ramp third-point load was applied, with the X mark uppermost, over a span (L) of 1620 mm for the 100 X 50-mm and 3240 mm for the 200 X 50-mm timber (L/d of 18 : 1) to reach failure in about 3 minutes. The failure load was recorded. Deflection at midspan relative to reaction points was measured using an LVDT which was connected to an X - Y plotter to give a load deflection curve.
Modulus of elasticity as a joist (EJ) was determined from 23 W L3
EJ = 108 A b d3
where W / A was the slope of the load deflection curve up to the elastic limit.
Modulus of rupture (RJ) was computed from
RJ = b d2
After testing, a block was cut from near the fracture zone to determine moisture content, ring width (RW) (mm), distance from pith (CUT) (mm) to the nearest face, and nominal density (DN) (oven-dry weight/volume at test) (kg/m3) .
A diagram of the projected area of knots in the failure zone was drawn for each piece {see Fig. 2). From these diagrams, the knot area ratio (KAR) was calculated as
KAR 47% TKR 72% CKR 75% LK 25mm
FIG. 2—Sample knot diagram. KAR = knot area ratio; TKR = tension margin knot area ratio; CKR = compression margin knot area ratio; LK = largest knot.

238 New Zealand Journal of Forestry Science 15(2)
the area of the knots divided by the area of the cross-section and the margin knot area ratios (tension [TKR] and compression [CKR]) calculated as the area of the knots in the margin divided by the area of each margin (1/4 of the total area). The width of the largest knot (LK) in the section was also measured.
RESULTS AND DISCUSSION
Recovery and Grade
Total log volume was 56.5 m3 and the recovery of 100 X 50-mm and 200 X 50-mm timber was respectively 15% and 37% of this total. About 8% of the volume was cut as 25-mm boards and 75 X 50-mm pieces.
The laboratory grade yields for the 5.4-m sticks are given in Table 2. The laboratory grade of the stick was governed by the laboratory grade of the worst piece in each stick. Lower-grade sticks contained individual pieces of higher grade. From the laboratory grades of each 1.8-m piece of 100 X 50 mm there were 60% No. 1 Framing and better pieces and 24% No. 2 Framing.
Laboratory mechanical grade was determined from the EP of the worst piece for the limits given in Table 3. The commercial grades recorded will be used for a future examination of grading efficiency and its effect on strength.
TABLE 2—Grade yields as percentage of structural material (excluding boards and 75 x 50-mm material)
Visual grade Engineering
No. 1 Ftaming
No. 2 Framing
Box
Mechanical grade F i l
F8
F5
F4
Reject
100 x 50 m m
4
32
26
38
4
12
36
18
30
200 X 50 m m
12
12
25
51
-7
38
39
16
TABLE 3—Limits on EP (GPa) for mechanical grades
Grade
F i l
F8
F5
F4
Reject
100 x 50 m m
8.83-
7.36-9.30
5.52-7.68
4.91-5.70
0.00-5.05
200 X 50 m m
11.03-
8.02-11.77
5.52- 8.41
4.20- 5.69
0.0O- 4.31
Bier — Bending properties of structural P. radiata 239
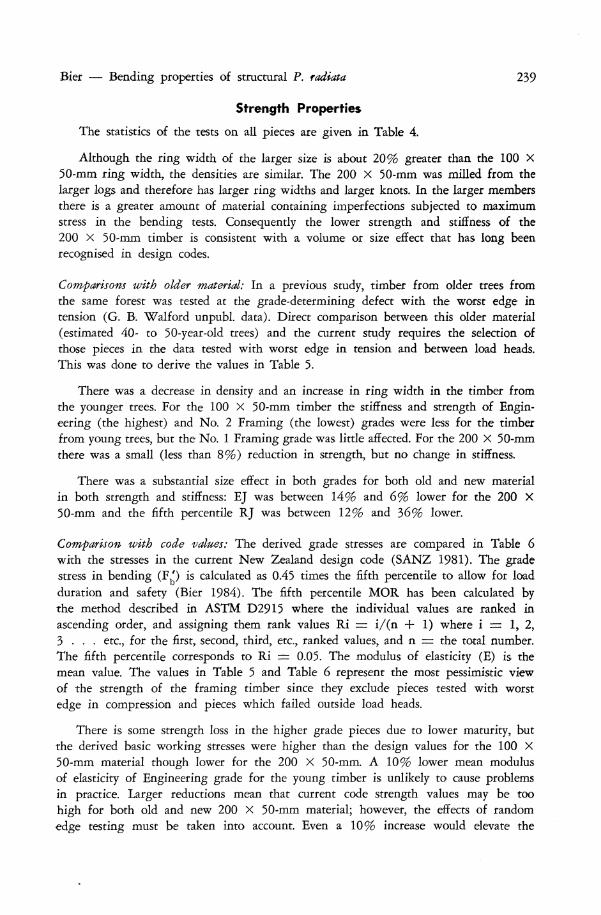
Strength Properties
The statistics of the tests on all pieces are given in Table 4.
Although the ring width of the larger size is about 20% greater than the 100 X 50-mm ring width, the densities are similar. The 200 X 50-mm was milled from the larger logs and therefore has larger ring widths and larger knots. In the larger members there is a greater amount of material containing imperfections subjected to maximum stress in the bending tests. Consequently the lower strength and stiffness of the 200 X 50-mm timber is consistent with a volume or size effect that has long been recognised in design codes.
Comparisons with older material: In a previous study, timber from older trees from the same forest was tested at the grade-determining defect with the worst edge in tension (G. B. Walford unpubl. data). Direct comparison between this older material (estimated 40- to 50-year-old trees) and the current study requires the selection of those pieces in the data tested with worst edge in tension and between load heads. This was done to derive the values in Table 5.
There was a decrease in density and an increase in ring width in the timber from the younger trees. For the 100 X 50-mm timber the stiffness and strength of Engineering (the highest) and No. 2 Framing (the lowest) grades were less for the timber from young trees, but the No. 1 Framing grade was little affected. For the 200 X 50-mm there was a small (less than 8%) reduction in strength, but no change in stiffness.
There was a substantial size e&ect in both grades for both old and new material in both strength and stiffness: EJ was between 14% and 6% lower for the 200 X 50-mm and the fifth percentile RJ was between 12% and 36% lower.
Comparison with code values: The derived grade stresses are compared in Table 6 with the stresses in the current New Zealand design code (SANZ 1981). The grade stress in bending (F ' ) is calculated as 0.45 times the fifth percentile to allow for load duration and safety (Bier 1984). The fifth percentile MOR has been calculated by the method described in ASTM D2915 where the individual values are ranked in ascending order, and assigning them rank values Ri = i / (n + 1) where i = 1, 2, 3 . . . etc., for the first, second, third, etc., ranked values, and n = the total number. The fifth percentile corresponds to Ri = 0.05. The modulus of elasticity (E) is the mean value. The values in Table 5 and Table 6 represent the most pessimistic view of the strength of the framing timber since they exclude pieces tested with worst edge in compression and pieces which failed outside load heads.
There is some strength loss in the higher grade pieces due to lower maturity, but the derived basic working stresses were higher than the design values for the 100 X 50-mm material though lower for the 200 X 50-mm. A 10% lower mean modulus of elasticity of Engineering grade for the young timber is unlikely to cause problems in practice. Larger reductions mean that current code strength values may be too high for both old and new 200 X 50-mm material; however, the effects of random edge testing must be taken into account. Even a 10% increase would elevate the

TABLE ^-Statistics for two sizes of Pinus radiata tested in bending
Variable
Nominal density (kg/m3)
Ring width (mm)
Moisture content (%)
Knot area ratio (%)
Tension margin knot area
Compression margin knot
Largest knot (mm)
Modulus of elasticity as a
Modulus of elasticity as a
ratio (%)
area ratio (%)
. plank (GPa)
joist (GPa)
Modulus of rupture as a joist (MPa)
Symbol
DN
RW
MC
KAR
TKR
CKR
LK
E P
E J
R J
Mean value
387
10.3
16.8
28
25
32
23
6.78
7.58
33.2
100 x 50mm
Standard deviation
41.3
2.98
2.54
19
31
34
15
1.87
2.00
13.63
Number of pieces
884
884
884
882
882
882
882
883
887
888
Mean value
386
12.5
15.5
32
41
31
38
5.82
6.92
24.1
200 X 50 mm
Standard deviation
32.3
3.57
1.86
15
31
31
17
1.54
1.82
10.96
Number of pieces
556
556
555
552
552
552
552
561
560
562

Bier — Bending properties of structural P. radiata 241
TABLE 5—Comparison of strength data for old and new growth Pinus radiata framing grades from Kaingaroa tested with the worst edge in tension (for explanation of abbreviations see Table 4)
(a) 100 X 50-mm size No. of tests
Mean m.c. (%)
Mean DN (kg/m3)
Mean KAR (%)
Mean TKR (%)
Mean RW (mm)
Mean EP (GPa)
Mean EJ (GPa) coeff. of var. (%)
Mean RJ (MPa) coeff.of var. (%) 5% excl. lim. (MPa)
(b) 200 X 50-mm size No.of tests
Mean m.c. (%)
Mean DN (kg/rn^)
Mean KAR (%)
Mean TKR (%)
Mean RW (mm)
Mean EP (GPa)
Mean EJ (GPa) coeff. of var. (%)
Mean RJ (MPa) coeff. of var. (%) 5% excl. lim. (MPa)
No.
Old
60
14.9
414
43
68
7.73
6.67
7.64 27
23.2 44 10.8
60
14.8
427
40
56
8.30
6.72
6.74 25
21.1 43 9.47
2 Framing
New
71
16.0
370
35
52
11.0
5.75
6.44 26
23.3 45 8.27
54
15.4
380
31
54
12.2
5.64
6.60 22
19.5 47 9.23
No. 1
Old
85.
15.4
426
29
61
7.21
7.56
7.86 27
30.1 39 15.1
113
15.0
421
35
57
7.33
6.95
7.41 22 24.1 40 12.3
Framing
New
150
17.1
387
23
41
10.3
7.20
7.77 22
31.1 37 15.3
34
15.8
394
18
49
11.7
6.43
7.19 17 23.1 34 11.4
Engineering
OloT"
71
15.9
448
11
23
6.25
10.0
10.4 19 49.2 28 26.8
175
14.8
440
23
33
6.15
7.54
8.92 22 35.8 35 17.3
New
52
17.9
408
12
19
9.2
8.79
9.28 17
41.7 26 23.2
51 16.4
401
20
38
10.5
7.50
8.80 16 33.2 37 16.3
Sources: Old growth — G. B. Walford (unpubl. data) New growth — this study 100 X 50-mm — Bier & Collins (1984)
N.B.: Old material DN, KAR, TKR, and RW figures include about 10% pieces tested with worst edge in compression.
basic working stresses in Table 6 for both old and new material to well above existing code values for the 100 X 50-mm material. The actual amount of this increase is grade dependent and is between 9% and 32%. This will be demonstrated in a future report.

242 New Zealand Journal of Forestry Science 15(2)
TABLE 6—New Zealand design code grade stresses compared with derived values
100 X 50-mnrt size Code value Old material New material
200 x 50-mm size Code value Old material New material
No.
E
(GPa)
8.0 7.9 7.8
8.0 7.4 7.2
1 Framing
F '
(MPa)
6.0 6.8 6.9
6.0 5.5 5.1
Engineering
E
(GPa)
10.5 10.4 9.3
10.0 8.9 8.8
F ' b
(MPa)
9.4 12.1 10.4
8.3 7.8 7.3
Relationships between sawn timber variables: The simple regression equations for both sizes are shown in Table 7 in order of decreasing coefficients of determination (r2). All were significant at the 1% level.
The elastic moduli EJ and EP provide the most significant contribution to strength prediction but these must be determined by test or machine. Knot area ratio (KAR) and tension margin knot area ratio (TKR) provide the best correlation for the visually determined characteristics (Table 7).
TABLE 7—Simple regression equations for two sizes of timber
100 X 50 mm
Equation (881 specimens)
Strength (RJ) -4.60 + 4.98 -2.51 -f 5.27 45.4 + 0.444 41.0 — 0.244 45.7 — 0.550 47.8 — 1.42 -4.86 -f 0.098 28.6 + 0.069
Stiffness (EJ) 1.56 + 0.89
11.2 — 0.352 -1.89 + 0.025
8.87 — 0.046 6.47 + 0.017 8.70 — 0.050 8.16 — 0.018
DN = 467 — 7.70 DN = ' 355 + 0.482 RW = 13.1 — 0.041
EJ EP KAR TKR LK RW DN CUT
EP RW DN KAR CUT LK TKR
RW CUT CUT
r 2
0.53 0.52 0.38 0.36 0.35 0.09 0.09 0.05
0.69 0.27 0.26 0.20 0.14 0.13 0.09
0.31 0.27 0.38
200 x 50 mm
Equation (542 specimens)
DN DN RW
-5.86 + 4.31 -0.50 + 4.24 32.8 + 0.210 35.9 -f 0.366 37.8 — 1.10 19.4 + 0.070
-14.5 + 0.100 31.5 — 0.193
1.72 + 0.90 10.9 — 0.317 -5.04 + 0.031 5.72 + 0.018 8.56 — 0.050 7.56 — 0.15 7.53 — 0.015
= 432 — 3.73 = 367 + 0.279 = 14.9 — 0.037
EJ EP TKR KAR RW CUT DN LK
EP RW DN CUT KAR TKR LK
RW CUT CUT
r2
0.51 0.36 0.36 0.25 0.13 0.10 0.09 0.09
0.59 0.39 0.30 0.22 0.17 0.06 0.02
0.17 0.17 0.24

Bier — Bending properties of structural P. radiata 243
Stepwise regressions of RJ and EJ on all variables are shown for the 200 X 50-mm timber in Tables 8 and 9. The regressions for 100 X 50-mm timber were given by Bier & Collins (1984). For mechanically graded timber, EJ or EP is the independent variable. Including visual parameters gives a significant improvement in the relationship for RJ (Table 8a) but no marked improvement for EJ (Table 8b). This agrees with the conclusions of Walford (1981) for timber from older trees.
The effect of KAR and largest knot (LK) is more marked in the 100 X 50-mm size (Table 7). Knots of a given size occupy a greater proportion of smaller cross-sections.The grain deviation around these knots anywhere in the cross-section extends further into the margin than in larger sizes. In the larger size, the knots must actually be in the margin to have a marked effect, and TKR is the best indicator of strength, with largest knot being the least significant variable.
The elastic modulus is determined from strains below the proportional limit. It is therefore not as dependent on limiting properties such as minimum strength in the tension margin but, rather, is dependent on wood properties which affect both tension and compression margins equally. There is a greater dependence on ring width, density, and over-all knot area ratio.
TABLE 8a—Stepwise linear regression analysis of RJ on seven variables (including EP) ; n = 542
Constants
(MPa) EP (GPa)
Coefficients
TKR (%) RW (%)
Correlation
(r2)
-0.50
10.83
15.72
4.24
3.54
3.23
-0.176
-0.178 -0.24
0.36
0.600
0.604
No significant contribution from KAR, DN, LK, CUT.
TABLE 8b—Stepwise linear regression analysis of EJ on seven variables (including EP); n = 542
Constants
(GPa)
1.72
4.53
0.09
0.60
EP (GPa)
0.900
0.718
0.644
0.601
RW (mm)
-0.140
-0.115
-0.121
Coefficients
DN (kg/m3)
0.0118
0.0122
TKR (%)
-0.008
Correlation
(r2)
0.59
0.64
0.67
0.69
No significant contribution from KAR, LK, CUT.

244 New Zealand Journal of Forestry Science 15(2)
TABLE 9a—Stepwise linear regression analysis of RJ on six variables (excluding EP); n = 542
Constants
(MPa)
32.82
45.38
47.25
25.01
23.72
23.12
TKR (%)
-0.210
-0.205
-0.172
-0.273
-0.173
-0.170
RW (%)
-1.02
-0.903
-0.718
-0.753
-0.642
Coefficients
KAR (mm)
-0.147
-0.140
-0.090
-0.056
DN (kg/m»)
+0.051
+0.058
0.052
LK (mm)
-0.063
-0.103
CUT (mm)
0.027
Correlation
(r2)
0.36
0.47
0.50
0.52
0.52
0.53
TABLE 9b—Stepwise linear regression analysis of EJ on six variables (excluding EP); n = 542
Constants
(GPa)
10.90
2.40
3.54
3.61
3.64
3.31
RW (mm)
-0.317
-0.244
-0.218
-0.222
-0.202
-0.200
DN (kg/m3)
+0.020
+0.019
+0.019
+0.017
+0.018
Coefficients
KAR (%)
-0.033
-0.026
-0.025
-0.012
TKK (%)
-0.007
-0.007
-0.007
CUT (mm)
0.004
0.006
LK (mm)
-0.017
Correlation
(r2)
0.38
0.48
0.55
0.57
0.57
0.58
Grading rule for a high strength grade: For a section with a margin of a proportion fi of the depth, it can be shown that the ratio of the moment resisted by the margin (Mm) to the total moment (M t) is
Mm 4 Ratio = 6 /3 ( 1 - 2 / 3 + - / 3 2 . (1)
M t 3
When fi is 0.5, the compression and tension margins occupy the full section and the ratio is 1. For margins occupying 25% of the cross-section as in this study, the ratio is 0.88. Tension perpendicular to the grain is wood's weakest property. This stress mode is introduced into structural timber when grain deviates around the knots. Knots or grain deviations occupying the tension margin are therefore expected to have great effect on the strength, whereas defects in the central portion can affect only 12% of the strength of the beam.

Bier — Bending properties of structural P. radiata 245
It follows that a high strength grade could be obtained by limiting defects in the tension margin. From the observed effects of KAR and TKR (above), such limits would have a greater influence on strength than on stiffness.
Pieces with tension margin knot ratios limited to 50%, 25%, 20%, and 0% (clear margins) were extracted from the No. 1 Framing grade timber (Table 10). The recovery figures are only indicative since they are for grades determined by knot area ratio at the breakpoint. Other defects away from the breakpoint may have exceeded these values. The fifth percentiles in this table were calculated with 75% confidence using a three-parameter WeibuU distribution (Pierce 1976).
TABLE IO—Results of selecting from No. 1 Framing grade pieces of a grade of timber with tension margin knot ratios limited
50%
Limit on margin knot area ratio
25% 20% Clear margin
100 X 50-mm size
Recovery (% No. IF) Strength (MPa) (No. IF
72 46 40 22
19.2)
Timber remaining
Selected grade
Elastic modulus (GPa) (No. IF =
Timber remaining
Selected grade
200 X 50-mm size Recovery (% No. IF)
Strength (MPa) (No. IF =13.3)
Timber remaining
Selected grade
Elastic modulus (GPa) (No. IF =
Timber remaining
Selected grade
8.17)
7.72)
16.1
20.9
7.71
8.35
71
10.3
14.7
7.95
7.63
16.8 24.4
7.78
8.62
39
11.8
17.6
7.70
7.76
17.1 25.7
7.78
8.74
33
12.0
19.0
7.55
8.07
18.1 27.3
7.92
9.06
17
12.7 18.8
7.67
7.97
The selected samples showed substantial increases in fifth percentile strength but only nominal changes in modulus of elasticity. Though clear margins provide maximum increases for the selected grade and minimum decreases for the remaining timber, the 20% ratio is very effective, and has twice the potential recovery of the clear margin grade. It is unlikely that quantities of a clear margin grade exist in timber from upper logs and the 20% (TKR) gives better than 50% improvement in basic working stress over the remaining grade. The 25% (TKR) is also adequate, but a 50% (TKR) does not provide enough margin between stresses for the two grades.

246 New Zealand Journal of Forestry Science 15(2)
The effects of these rules and their influence on true recovery should be evaluated on timber from other sources, but a significant simplification of the existing grading rules for Engineering grade seems possible, with an attendant improvement in basic working stress.
Effect of log variables on strength properties: Linear regression of the strength and stiffness of individual pieces on the log variables branch index (BI) (cm) and internode length (m) yielded no relationship. By determining the average EJ, EP, RJ, and minimum RJ (MINRJ) for the pieces in each log it was possible to obtain the relationships in Table 11. Stepwise regression of all these average properties on all log variables (BI) (cm), internode index (m), number of internodes, and basic density (BD) (kg/m3 of the log) reduced to the simple regressions in Table 11 or the equations with two independent variables in Table 12. The internode variables did not enter into any of the relationships.
TABLE 11—Simple regression equations of strength properties for each log for two sawing patterns
Saw pattern 1 100 X 50 mm (28 logs)
Equation
r2 Saw pattern 3 200 x 50 mm (50 logs)
Equation
r2
RJ = 35.4 — 0.87BI 0.04f R J = _£.05 + 0.097BD 0.24
MINRJ = 23.9 — 2.24BI 0.27 MINRJ = -16.0 + 0.078BD 0.15
EJ = 8.00 — 0.178BI 0.08f EJ = 0.857 + 0.0164BD 0.30
EP = 7.33 — 0.217BI 0.13 EP = 0.02 + 0.0165BD 0.36
R J = 30.2 R J = 20.8
MINKJ = 17.6 MINRJ = 17.3
E J = 8.29 E J = -3.66
E P = 7.03 E P = -0.84
— 1.08BI + 0.114BD
— 1.10BI + 0.074BD
— 0.234BI + 0.027BD
— 0.216BI + 0.017BD
0.14 0.24
0.21 0.14
0.18 0.37
0.24 0.23
t All except those marked are significant at the 1% level.
TABLE 12—Stepwise linear regressions of strength properties for each log on all log variables
Equation
100 X 50-mm size
MINRJ = -2.1 — 2.05BI
200 X 50-mnn size
R J == io.9 + 0.103BD
E J = -1.72 + 0.025BD
MINRJ = 7.19 — 0.98BI
E P = 1.11 — 0.189BI
+ 0.065BD
— 0.89BI
— 0.19BI
+ 0.062BD
+ 0.0148BD
r2
0.37
0.33
0.48
0.30
0.40
t value for slopes
-3.0, 2.06
3.7, -2.6
5.3, -3.2
-3.3, 2.6
-3.8, 3.6

Bier — Bending properties of structural P. radiata 247
Branch index has a greater influence on the properties of the larger size. The larger size has a greater chance of being cut from the branches which determine the index since for a given log it forms a greater part of the volume.
Average properties are more highly correlated with BD than with BI, but the minimum RJ is more dependent on the branch index. Figure 3 shows the relationships for EJ on BD and Fig. 4 shows the relationship MINRJ on BI for both sizes. The
10
300 320 340 360 380 400
BASIC DENSITY (kg/m3)
420 440
FIG. 3—Mean modulus of elasticity as a joist (EJ) v. basic density of log (BD) for (a) 100 x 50-mm and (b) 200 x 50-mm material.

248 New Zealand Journal of Forestry Science 15(2)
3o r a
20
CO CL
w 10 a: QL 3 a:
• •
• •
CO Z>
2 3 0 r
4 6 8
BRANCH INDEX (cm)
10
FIG. 4—Minimum modulus of rupture (MINRJ) v. branch index (BI) for (a) 100 x 50-mm and (b) 200 x 50-mm material.
logs with the lowest branch index have the highest minimum strength properties. High-quality structural material is therefore best cut from these logs. The best prediction of minimum strength is obtained with both branch index and basic density.
To achieve desirable strength or stiffness levels in structural timber, it is feasible to select logs with a small branch index from a low-density site to obtain material of the required properties. For example, from Table 12:
EJ = -1.72 + 0.O25BD - 0.19BI (2)
For No. 1 Framing grade and Engineering grade, the current code moduli of elasticity in-grade are 8.0 and 10.0 respectively (Table 6).

Bier — Bending properties of structural P. radiata 249
Cown & McConchie (1982) showed average sawlog densities for 25-year-old trees to be 460 kg/m,3 415 kg/m 3 , and 390 kg/m 3 in the high-, medium-, and low-density classes. Substituting these values into Equation (2) it is calculated that a high-density site requires logs of a branch index of 9.4 or less, medium site of 3.45 or less, and a low-density site requires clear logs to obtain the desired code moduli No. 1 Framing grade.
For Engineering grade, none of the site classes will yield an average EJ of the desired level; only logs with a basic density in excess of 490 kg/m 3 will yield such timber, assuming the regression can be extrapolated. This is mirrored in Table 6 which shows that EJ values for Engineering grade are below the code requirements for both old and new material.
The relationships above provide the tools with which to evaluate the effect of log basic density and branch index on the design stresses of sawn timber. Further work is required to fully assess effects at the fifth percentile level, since the branch index has a greater effect on minimum strength than on mean strengths.
CONCLUSIONS
The strength of No. 1 Framing grade timber from 28-year-old trees was similar to that of timber from 40- to 50-year-old trees. There was a minimal reduction in the strength of Engineering grade in the young material.
Basic working stresses (for bending strength) derived for timber tested with the worst defect in tension were above code values for 100 X 50-mm material and below for 200 X 50-mm material. A simple grading rule was derived which yields material with a basic working stress 50% higher than No. 1 Framing grade timber.
The moduli of elasticity of both old and new material were about 10% below code values.
Relationships between strength properties and log variables have been established. Currently prescribed moduli of elasticity for Engineering grade timber cannot be obtained from average sawlogs of any age in even the high-density class.
ACKNOWLEDGMENTS
The author would like to thank the staff of the Forest Research Institute for their contributions to this project. In particular I wish to thank Messrs D. Gaunt and R. Bes for their work in the months of laborious testing and processing.
REFERENCES BIER, H. 1984: Determining basic working stresses for minor timber species. Institute of
Professional Engineers New Zealand, Transactions 11(3): 1-6.
BIER, H.; COLLINS, M. J. 1984: Bending properties of 100 x 50 mm structural timber from a 28-year-old stand of New Zealand radiata pine. Paper presented at meeting of IUFRO Group S5.02, Xalapa, Mexico,
BUNN, E. H. 1981: The nature of the resource. New Zealand Journal of Forestry 26(2): 162-99.
GOWN, D. J.; McCONCHIE, D. L. 1982: Wood density prediction for radiata pine logs. New Zealand Forest Service, FRI Bulletin No. 9.

250 New Zealand Journal of Forestry Science 15(2)
N.Z. FOREST SERVICE 1984: "Statistics of the Forests and Forest Industries of New Zealand to 1983". New Zealand Forest Service, Wellington.
PIERCE, C. B. 1976: The Weibull distribution and the determination of its parameters for application to timber strength data. CP 26/76 Princes Risborough Laboratory, Bucks, United Kingdom.
SAA 1978: AS1749 : 1978, "Rules for Mechanical Stress Grading of Timber". Standards Association of Australia.
SANZ 1978: NZS3631 : 1978, "Classification and Grading of New Zealand Timbers". Standards Association of New Zealand.
1981: NZS3603 : 1981, "Code of Practice for Timber Design". Standards Association of New Zealand.
WALFORD, G. B. 1981: Combined visual and mechanical grading of Pinus radiata. New Zealand Journal of Forestry Science 11: 298-303.
1982: Current knowledge of the in-grade bending strength of New Zealand radiata pine. New Zealand Forest Service, FRI Bulletin No. 15.
WHITESIDE, I. D. 1982: Predicting radiata pine gross sawlog values and timber grades from log variables. New Zealand Forest Service, FRI Bulletin No. 4. 1984: Review of future New Zealand wood supply and quality. Pp. 715-22 in Proceedings of Pacific Timber Engineering Conference, Auckland, Vol. 3.