Benchmarking European power and utilities asset … major power and utility companies ... 2010–15...
16
Benchmarking European power and utility asset impairments Living with lower for longer
Transcript of Benchmarking European power and utilities asset … major power and utility companies ... 2010–15...

Benchmarking European power and utility asset impairmentsLiving with lower for longer

Record asset impairments in 2015
€34.7b wiped offbalance sheets in 2015
16 major power and utility companies analyzed annually
Impairment by years: 2010–15Pricing is primary trigger for impairments
2015€34.7b51.5%2014€22.9b
2013€32b
2012€12.8b
2011€9.3b
2010€8.6b
InauguralEY analysis
28.4%
150%
37.6%
8.1%
Total€120.3b
Impairment by type: 2015
€25.7b (74%)(2014 — €19.4b/85%)
Assets
€17.2b (67%)(2014 — €14.6b/75%)
Generation
€8.5b (33%)(2014 — €4.8b/25%)
Other
€9.0b (26%)(2014 — €3.5b/15%)
Goodwill
Assets and goodwill = 100% of impairments Generation and other = 100% of asset impairments
1. Impairments that could not be allocated to a specific region, based on the information provided by companies, have been classified as nonspecific.
Impairment by geography: 2010–15
SouthernEurope
ContinentalWestern Europeand Nordic region
EasternEurope 9%
18%
47%
12%
14% Others/ nonspecific1
UK
Key drivers of asset impairments — 2015
Major driver Important driver Less important driver
Supply
DemandPolicy &
regulation
Financingconditions
Pricingenvironment Utilities
Benchmarking European power and utility asset impairmentsLiving with lower for longer

Contents
Executive summary
2
Record impairments driven by pricing
4
Unpacking the 2015
impairments
6
Analyzing 2015 drivers in more detail
8
Implications and outlook for 2016
impairments
13

2 | Benchmarking European power and utility asset impairments
Power and utilities businesses have been forced to deal with a world where energy commodity prices have fallen lower, and stayed lower, for longer than they anticipated at the start of 2015. The result has been a record level of impairment write-downs outstripping the high we saw in 2013: asset impairments booked by European utilities reached the unprecedented level of €34.7b during 2015. • This represented 9% of the market capitalization of the leading
utilities at the end of 2014.*
• Continental Western Europe and the Nordics saw the heaviest impairments on a geographic basis. Generation assets accounted for roughly half of the €34.7b, with the balance almost evenly split between other assets and goodwill.
• Ongoing evolution of the energy commodity price environment was the primary trigger for the 2015 impairments.
* Vattenfall has been excluded from this calculation, as it is not publicly quoted.
European power and utility companies analyzed in EY asset impairment study 2016
Results analyzed are for year ended 31 December 2015, or 31 March 2015 as appropriate.
Sample of power and utilities companies analyzed
Company
Centrica Gas Natural
CEZ Iberdrola
E.ON RWE
EDF SSE
Enel Suez Environnement
Energias de Portugal Vattenfall
Engie Veolia
Fortum Verbund
€34.7b value of asset impairments booked by European utilities in 2015
Executive summary

Benchmarking European power and utility asset impairments | 3
* Vattenfall has been excluded from this calculation, as it is not publicly quoted.
€93b of goodwill still held on European utility balance sheets at 2015 year end
Goodwill on the books
Source: EY analysis of company financial statements
Net carrying amount of goodwill on utility balance sheets 2011–2015
(€ millions) 2015 2014 2013 2012 2011
Engie 19,024 21,222 20,697 30,035 31,362
Enel 13,824 14,027 15,015 15,963 18,342
RWE 11,979 11,507 11,374 13,545 13,593
EDF 10,236 9,694 9,206 10,412 11,648
Iberdrola 9,353 8,354 7,804 8,309 8,273
E.ON 6,441 11,812 12,797 13,440 14,083
Gas Natural 4,962 4,959 5,756 5,837 5,876
Veolia 4,620 4,494 3,486 4,795 5,796
Suez Environnement 3,480 3,261 3,184 3,257 3,245
Energias De Portugal 3,388 3,321 3,296 3,318 3,330
Centrica 2,643 3,235 3,381 3,116 3,014
Vattenfall 1,411 1,410 2,792 3,437 3,849
SSE 822 708 763 769 820
Verbund 742 742 742 606 606
CEZ 343 339 350 387 390
Fortum 153 170 275 309 294
Total 93,421 99,255 100,918 117,535 124,521
One implication of the record level of write-downs booked in 2015 by European power and utilities businesses is the likelihood of greater M&A activity taking place over the next one to two years.
Future M&A likely to increase
At year-end 2015, the net carrying value of goodwill on the balance sheets of European utilities amounted to €93b (down from €99b a year previously).
• The year-end 2015 figure represented 33% of their market capitalization at 31 December 2015 and 35% of their market capitalization at 30 June 2016.*
• In the case of one utility, the 2015 net carrying value of goodwill on its balance sheet represented 138% of its market capitalization at 30 June 2016 and 55% of its enterprise value at the same date.
€30b–€35bPotential value of projected asset sales by European utilities by 2020
We believe that the price at which utilities will be prepared to transact has fallen, now that impairments have been realized. In particular, power and utilities companies will be more willing to sell thermal generation assets at a steep discount to whatever their original purchase or development costs may have been.
European utilities are looking to sell €30b–€35b of assets by 2020 as they respond to balance sheet constraints and implement new strategies to deal with their rapidly evolving marketplace.
4 | Benchmarking European power and utility asset impairments
Pricing evolution
Record impairments driven by pricing
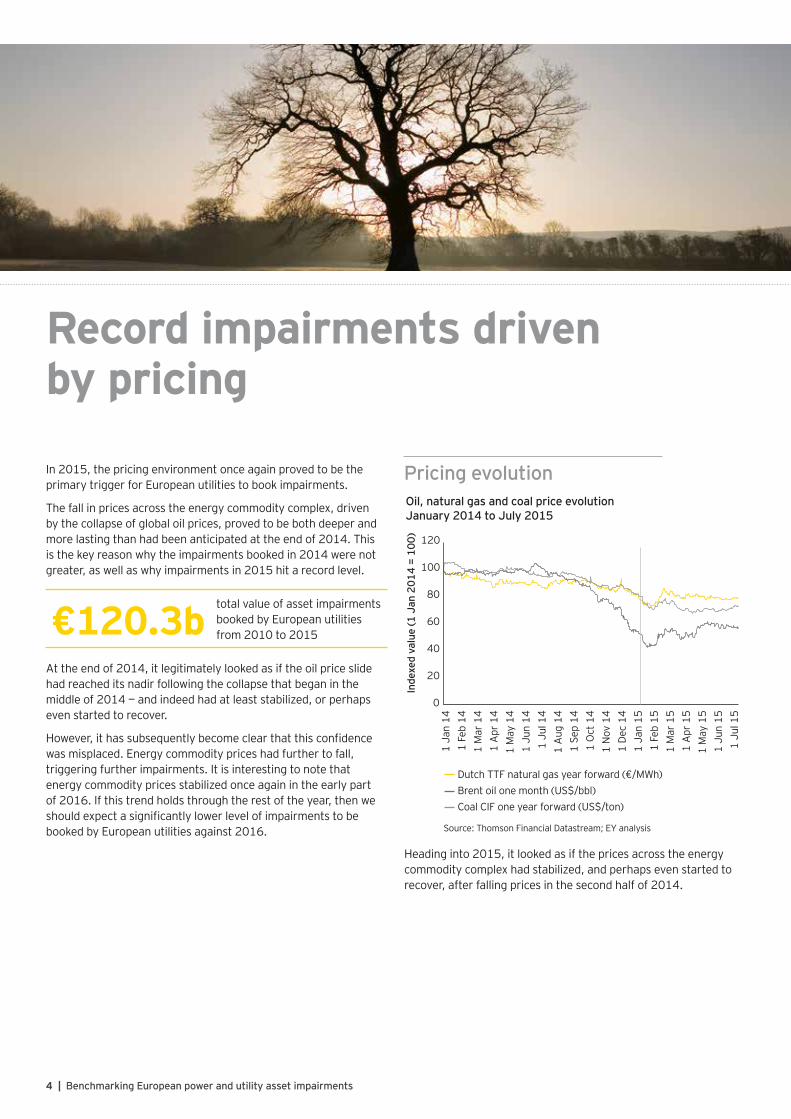
In 2015, the pricing environment once again proved to be the primary trigger for European utilities to book impairments.
The fall in prices across the energy commodity complex, driven by the collapse of global oil prices, proved to be both deeper and more lasting than had been anticipated at the end of 2014. This is the key reason why the impairments booked in 2014 were not greater, as well as why impairments in 2015 hit a record level.
Heading into 2015, it looked as if the prices across the energy commodity complex had stabilized, and perhaps even started to recover, after falling prices in the second half of 2014.
At the end of 2014, it legitimately looked as if the oil price slide had reached its nadir following the collapse that began in the middle of 2014 — and indeed had at least stabilized, or perhaps even started to recover.
However, it has subsequently become clear that this confidence was misplaced. Energy commodity prices had further to fall, triggering further impairments. It is interesting to note that energy commodity prices stabilized once again in the early part of 2016. If this trend holds through the rest of the year, then we should expect a significantly lower level of impairments to be booked by European utilities against 2016.
€120.3btotal value of asset impairments booked by European utilities from 2010 to 2015
0
20
1 Ja
n 14
1 Fe
b 14
1 M
ar 1
41
Apr
14
1 M
ay 1
41
Jun
141
Jul 1
41
Aug
14
1 Se
p 14
1 O
ct 1
41
Nov
14
1 De
c 14
1 Ja
n 15
1 Fe
b 15
1 M
ar 1
51
Apr
15
1 M
ay 1
51
Jun
151
Jul 1
5
40
60
80
100
120
Inde
xed
valu
e (1
Jan
201
4 =
100)
Oil, natural gas and coal price evolutionJanuary 2014 to July 2015
Source: Thomson Financial Datastream; EY analysis
Dutch TTF natural gas year forward (€/MWh)Brent oil one month (US$/bbl)Coal CIF one year forward (US$/ton)

Benchmarking European power and utility asset impairments | 5
0
20
40
60
80
100
120
Source: Thomson Financial Datastream; EY analysis
1 Ju
l 15
1 A
ug 1
5
1 Se
p 15
1 O
ct 1
5
1 N
ov 1
5
1 De
c 15
1 Ja
n 16
1 Fe
b 16
1 M
ar 1
6
1 A
pr 1
6
Inde
xed
valu
e (1
Jul
201
5 =
100)
Oil, natural gas and coal price evolutionJuly 2015 to April 2016
Dutch TTF natural gas year forward (€/MWh)Brent oil one month (US$/bbl)Coal CIF one year forward (US$/ton)
In fact, subsequent to the end of June 2015, energy commodity prices had further to fall, triggering further impairments.
Energy commodity prices appear to have stabilised once again in the early part of 2016.
If this trend holds through the rest of the year, then we should expect a significantly lower level of impairments to be booked by European utilities against 2016.
Impairments by Europe’s leading utilities hit a peak of €34.7b in 2015, surpassing the level they had reached in 2013 of €32b. In large part this appears to have been due to a belated acknowledgement of the fact that energy commodity prices would be “lower for longer” than anyone in the energy industry had initially predicted.
As a result, hard choices have had to be made by utilities’ management teams, with many utilities looking to retreat from merchant generation and thermal assets, in particular.
Across the industry, utilities are driving hard on cost reduction programs, but the leading players are also embracing significant
Impairments lead to hard choices
Impairment breakdown
Engie and E.ON accounted for 70% of the first quartile impairments in 2015 and also represented almost half of the year’s total. The 2015 impairments booked by the two companies were equivalent to 23% of their combined market capitalization at the end of 2014.
Since 2010, Engie, E.ON, Enel and Vattenfall have seen the biggest impairments on a cumulative basis and represent the first quartile.
Impairment breakdown 2015 (total = €34.7b)
Source: EY analysis of company financial statements
By company:
First quartile
Second quartile
Third quartile
Fourth quartile
€ €24.2b €9.1b €1.7b €-0.3b
% 70% 26% 5% -1%
Impairment breakdown 2010–15 (total = €120.3b)
Source: EY analysis of company financial statements
By company:
First quartile
Second quartile
Third quartile
Fourth quartile
€ €77.9b €32.9b €7.8b €1.7b
% 65% 27% 6% 1%
restructuring to face up to the challenges of this “new energy” world. This in turn appears to have accelerated the recognition of impairments to the traditional utility asset base.
• Most radically, the two German giants, E.ON and RWE, have each decided to split into two, with renewables, network, and customers in one part and merchant generation (primarily thermal) in the other.
• However, Enel, Engie and Centrica have all committed separately, and are now in the midst of, major reorganizations across their operations.

6 | Benchmarking European power and utility asset impairments
In 2015, there was a huge increase in the level of impairments recognized in Continental Western Europe and the Nordics, representing more than half of the total for the year and reflecting a trend also seen in 2013. These impairments included:
• E.ON’s write-down of goodwill within its Generation unit (€4.5b), as well as write-downs related to gas-fired plant in France and the UK (€0.4b and €0.2b) and to coal-fired plant in Germany and the Netherlands (€0.2b and €0.2b, respectively)
• Write-downs by Engie, RWE and Vattenfall as well as Centrica, which wrote down the value of North Sea oil and gas assets
There also was a significant rise in impairments that could not be allocated to a specific region based on publicly available information (Others/nonspecific). However, impairments that could be allocated to Southern Europe, the UK and Eastern Europe fell.
Much like in 2013, a sharp rise in the level of impairment of goodwill contributed to an overall increase in the level of overall impairment.
In 2015, impairment of goodwill represented 26% of the total write-down made, up from 15% the previous year and close to the 30% seen in 2012 and 2013.
26% of total asset write-down in 2015 attributed to impairment of goodwill
Unpacking the 2015 impairments
Impairment of assets and goodwillAssets, rather than goodwill, again account for the majority of impairments
Source: EY analysis of company financial statements
2015 2014 2013 2012 2011 2010 Total
Impairment of goodwill €9.0b €3.5b €9.6b €3.9b €1.8b €2.4b €30.2b
Impairment of assets €25.7b €19.4b €22.4b €8.9b €7.5b €6.2b €90.1b
Total impairment €34.7b €22.9b €32.0b €12.8b €9.3b €8.6b €120.3b
Goodwill impairment as percentage of total
26% 15% 30% 30% 19% 28% 25%

Asset breakdown
Similar to 2013, generation assets again represented the greatest share of assets that were impaired. Of the €17.2b of generation assets impaired in 2015:
• Approximately €12b related specifically to thermal generation assets (gas- or coal-fired).
• A further €3b related to nuclear assets, more than half of which corresponds to Vattenfall’s Ringhals 1 and 2 plants in Sweden. The balance represents impairments recognized by Fortum, RWE and Centrica.
• The rest of the generation impairments (approximately €2b) are split fairly evenly between hydro, wind, biomass and uncategorized assets.
Of the €8.5b in the “Other assets” category, €6b relates to upstream exploration and production, with Engie, Centrica, E.ON, EDF, Enel and SSE all having recorded impairments in this category.
Source: EY analysis of company financial statements
Generation asset impairment has risen in 2015, hitting a record high
2015 2014 2013 2012 2011 2010 Total
Generation assets €17.2b €14.6b €14.8b €6.0b €5.4b €3.3b €61.3b
Other assets €8.5b €4.8b €7.6b €2.9b €2.1b €2.9b €28.8b
Total impairment of assets €25.7b €19.4b €22.4b €8.9b €7.5b €6.2b €90.1b
Generation asset impairments as percentage of total asset impairments
67% 75% 66% 67% 72% 53% 68%
8 | Benchmarking European power and utility asset impairments
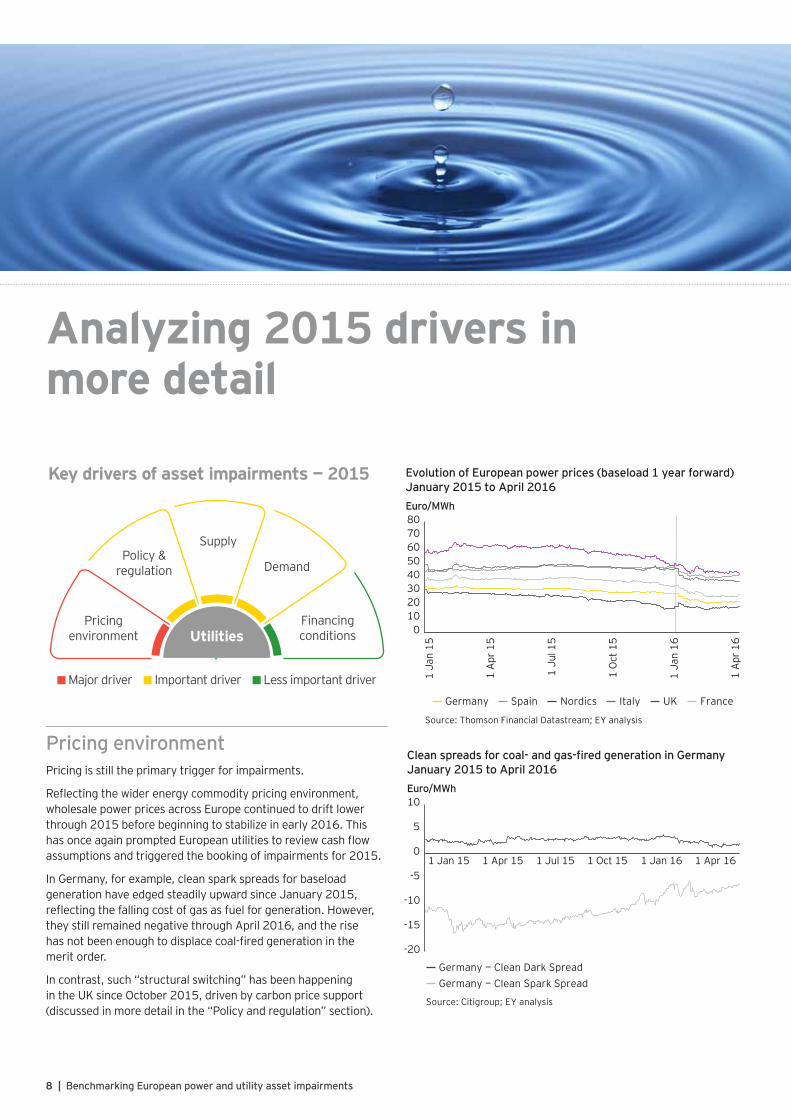
Pricing is still the primary trigger for impairments.
Reflecting the wider energy commodity pricing environment, wholesale power prices across Europe continued to drift lower through 2015 before beginning to stabilize in early 2016. This has once again prompted European utilities to review cash flow assumptions and triggered the booking of impairments for 2015.
In Germany, for example, clean spark spreads for baseload generation have edged steadily upward since January 2015, reflecting the falling cost of gas as fuel for generation. However, they still remained negative through April 2016, and the rise has not been enough to displace coal-fired generation in the merit order.
In contrast, such “structural switching” has been happening in the UK since October 2015, driven by carbon price support (discussed in more detail in the “Policy and regulation” section).
Pricing environment
Key drivers of asset impairments — 2015
Major driver Important driver Less important driver
Supply
DemandPolicy &
regulation
Financingconditions
Pricingenvironment Utilities
Evolution of European power prices (baseload 1 year forward)January 2015 to April 2016
Germany Spain Nordics Italy UK France
Source: Thomson Financial Datastream; EY analysis
Euro/MWh
01020304050607080
1 Ja
n 15
1 A
pr 1
5
1 Ju
l 15
1 O
ct 1
5
1 Ja
n 16
1 A
pr 1
6
Clean spreads for coal- and gas-fired generation in GermanyJanuary 2015 to April 2016
-20
-15
-10
-5
0
5
10
1 Jan 15 1 Apr 15 1 Jul 15 1 Oct 15 1 Jan 16 1 Apr 16
Euro/MWh
Germany — Clean Dark SpreadGermany — Clean Spark Spread
Source: Citigroup; EY analysis
Analyzing 2015 drivers in more detail

Benchmarking European power and utility asset impairments | 9
Policy and regulationCapacity mechanismsAcross Europe, capacity mechanisms are not being developed in a coordinated manner. National governments have been looking to safeguard security of supply at home by introducing measures designed to reward the provision of capacity, which might never be required, rather than the supply of energy.
In the future, much of the value for ex-baseload thermal assets will come from their operational flexibility as compared to intermittent renewables. Payments for the provision of firm capacity are likely to represent one such source of value.
Portugal: capacity payments for new units (reduced in 2013)
Spain: capacity payments for existing units (level of support reduced in 2012)
Ireland: capacity payments since 2007
Lithuania: capacity payments since 2011 until 2015 end
Netherlands Sweden: government proposes prolonging the strategic reserve until 2025
Finland: strategic reserve contracts for the2015–17 period
Denmark: possibly one-off tender strategic reserve for Eastern Denmark
Poland: operational and strategic reserves
Germany: improved energy-only market and strategic reserves
Belgium: strategic reserves
Hungary: considering reserve
Greece: centralized auction for flexible capacity under consideration
Great Britain: generalized capacity auction
France: decentralized capacity obligations
Italy: centralized capacity market with reliability options to be implemented
Capacity payments Energy-only market Capacity market Strategic reserve Under analysis
Source: Electric Power Special Report, Flexibility, optionality and the challenge facing Europe’s power utilities, Platts, July 2016 (based on Eurelectric 2016)

10 | Benchmarking European power and utility asset impairments
Carbon pricingEU Emissions Trading System (ETS) carbon prices are still not enough to change decision-making by utilities. EU ETS carbon prices actually rose during 2015 before suffering a sharp drop early in 2016. However, they still remain significantly below the levels seen five years ago, and far below the level that would prompt utilities to change their future investment choices around new generation capacity.
If the relationship between coal and gas prices remains similar to what it was in summer 2016, then, according to many commentators, a carbon price of €25 or more is needed to prompt coal to gas switching in Central Europe.
Carbon prices of €25 are still significantly higher than the level being created by the EU ETS as it is currently structured. This is the reason behind the plans for an EU-wide reform of the EU ETS. The establishment of a market stability reserve (MSR) in January 2019 will undoubtedly lead to a rise in carbon prices, but when and by how much remains hotly debated.
EU ETS carbon allowances prices (January 2009 to April 2016)
Carbon 1yr FWD
1 Ja
n 09
1 Ju
l 09
1 Ja
n 10
1 Ju
l 10
1 Ja
n 11
1 Ju
l 11
1 Ja
n 12
1 Ju
l 12
1 Ja
n 13
1 Ju
l 13
1 Ja
n 14
1 Ju
l 14
1 Ja
n 15
1 Ju
l 15
1 Ja
n 16
02468
101214161820Euro/tonne
Source: Thomson Financial Datastream; EY analysis
However, the chart also shows the impact of the UK’s carbon price support policy. As we suggested was likely to be case (see section 4 of last year’s paper, Benchmarking European power and utility asset impairments: testing times ahead), baseload generation from gas — after taking into account the price support for carbon — became more profitable than from coal, from October 2015 onward.
This shift in comparative profitability was reflected in the UK’s Q1 2016 generation output figures, with coal’s share of output halving on a year-on-year basis, falling to a record low of 15.8%. In comparison, gas increased its share from 25% to 38%.*
The chart below shows that there is still a premium for coal-fired generation when considering baseload clean generation spreads (i.e., the gap between dark and spark spreads, after taking account of the cost of emissions allowances, shown by the red arrow).
Baseload clean spreads for coal- and natural gas-firedgeneration in the UK since 2012, showing the impactof carbon price support
1 J
an 1
2
1 A
pr 1
2
1 J
ul 1
2
1 O
ct 1
2
1 J
an 1
3
1 A
pr 1
3
1 J
ul 1
3
1 O
ct 1
3
1 J
an 1
4
1 A
pr 1
4
1 J
ul 1
4
1 O
ct 1
4
1 J
an 1
5
1 A
pr 1
5
1 J
an 1
6
1 A
pr 1
6
1 J
ul 1
5
1 O
ct 1
5
–505
1015202530354045Euro/MWh
UK — Clean Dark SpreadUK Clean Dark Spread (incl. carbon price floor)UK — Clean Spark SpreadUK — Clean Spark Spread (incl. carbon price floor)
Premiumfor coal-firedgeneration
Source: Citigroup; EY analysis
In the meantime, France has been trying to move forward with plans to implement a carbon price floor in 2017. On its own, this move is unlikely to have much impact on the wider EU ETS carbon price, but it is an example of another European country following the example set by the UK in introducing a carbon price floor unilaterally.
The impact of the UK’s carbon price floor has been to create a major drag on the economics of coal-fired generation, tilting the balance in favor of gas-fired generation in its place.
* Source: “Coal’s share of generation hits record low in first quarter,” Energy Spectrum, Issue 530, Cornwall Energy, 18 July 2016.
Contrast this to the situation in Germany, highlighted earlier, where clean spark spreads have remained negative and below the level of clean dark spreads.
The result is a patchwork of differing regulatory regimes, which tends to be at odds with the EU’s ambition of a single European energy market.
Key features of well-designed capacity mechanisms
• Market-based
• Technology-neutral
• Open to new and existing assets
• Cross-border participation
• Open to generation, demand-response and storage
• Contract-based

Benchmarking European power and utility asset impairments | 11
SupplyRenewables capacity was installed at a record rate around the world in 2015, according to the Global Status Report published by REN21. This trend was reflected across Europe, where 12.5GW of wind and 8.5GW of solar photovoltaic (PV) capacity was added to the installed base in the year, net of retirements.
Over the past 20 years, wind has been the biggest addition to the installed capacity base, followed by gas and solar PV. This amounts to a significant greening of power generation, as coal- and oil-fired capacity has been closed.
Onshore wind and solar PV are likely to be the key technologies facilitating the ongoing expansion of distributed generation. This is already beginning to have a significant effect on the supply-side, disrupting existing market dynamics and thereby having an impact on impairments.
Net power generation capacity changes in Europe, 2015
12.5
8.5
0.4 0.2 0.1
–0.3–1.7 –2.4
–3.3 –3.3–5
0
5
10
15
Wind SolarPV
CSP Hydro Other
Biomass Nuclear GasFueloil Coal
GW
Source: 'Wind in Power: 2015 European Statistics',European Wind Energy Association, February 2016
Net power generation capacity changes in Europe, 1995–2015
Source: 'Wind in Power: 2015 European Statistics', European Wind EnergyAssociation, February 2016
–50
0
50
100
150
Wind
GW137.5
120.5
95.4
8.9 8.2 4.6 3.0 0.7
Gas SolarPV
Hydro Biomass
CSP Waste Other
Nuclear CoalFueloil
–11.8
–32.6–39.6
Onshore wind — US$/MWh real 2015
Source: Bloomberg New Energy Finance
0
20
40
60
80
100
120
2016 2020 2025 2030 2035 2040
Europe China US Mexico
Solar PV — US$/MWh real 2015
Source: Bloomberg New Energy Finance
0
20
40
60
80
100
120
2016 2020 2025 2030 2035 2040
Europe China US India
The result is that wind now contributes approximately 11.5% of Europe’s electricity generation, and all renewables contribute almost 30%. More will have to come to meet the EU’s target of 50% renewable electricity production by 2030.*
* Source: “PiE’s New Plant Tracker, June 2016,” Power in Europe, Issue 728, Platts, 20 June 2016.
Medium-term prospects for renewable generation still appear to be positive, despite rising short-term policy uncertainty in relation to subsidies. Cost differences between fossil-fuel and renewable generation technologies are quickly being eroded, and it seems reasonable to assume that the next decade will see “grid parity” reached in much of Europe for multiple renewable technologies. According to Bloomberg New Energy Finance:
• Onshore wind costs are expected to fall about 40% over the next 25 years. For every doubling of capacity, the levelized cost of onshore wind has lowered 19% historically (the learning rate).
• Similarly, the costs of solar PV are expected to fall about 60% over the next 25 years, with an observed learning to date of 26%.

12 | Benchmarking European power and utility asset impairments
Annual demand for power (not weather-corrected)
200
300
400
vs. 2008
500
600
2008
2009
2010
2011
2012
2013
2014
2015
TWh
Germany
200
300
400vs. 2008
500
60020
08
2009
2010
2011
2012
2013
2014
2015
TWh
France
200
300
400vs. 2008
500
600
2008
2009
2010
2011
2012
2013
2014
2015
TWh
UK
200
300
400
500
600
2008
2009
2010
2011
2012
2013
2014
2015
TWh
Italy
vs. 2008
200
300
400
500
600
2008
2009
2010
2011
2012
2013
2014
2015
TWh
Spain
vs. 2008
Source: Power in Europe (Issues 684, 15 September 2014 and 730, 18 July 2016), Platts; EY analysis
The short- to medium-term outlook for power demand remains weak across all the major European economies and is 10% below the level of 10 years ago across the continent.
Typically demand has yet to return to the levels seen in 2008, before the global financial crisis hit. Germany is the exception across the five largest European economies.
It seems highly likely that energy efficiency is helping to dampen demand for electricity, coupled with sluggish growth in the wider economy.
Demand
Financing conditionsDiscount rates used by utilities in our sample have shown a reasonable degree of consistency from year to year.
Source: EY analysis of company annual report and accounts
Selected examples comparing discount rates used in 2014 and 2015
Company Change in discount rate parameters from 2014 to 2015
Centrica Pre-tax rates used in 2015 range from 7.2% to 8.5% (range of 7.4% to 8.4% in 2014).
E.ON Post-tax rates used in 2015 range from 4.0% to 10.8% (range of 4.8% to 8.3% in 2014).
Iberdrola Pre-tax rates used in 2015 range from 4.91% to 13.19% (range of 5.26% to 10.64% in 2014).
SSE Pre-tax real rates used in 2015 range from 7% to 10% (unchanged from 2014).
Vattenfall Post-tax rates used in 2015 ranged from 5.5% to 9.4% (range of 5.4% to 7.0% in 2014).
Engie Post-tax rates used in 2015 ranged from 4.7% to 13.5% (range of 4.9% to 15.0% in 2014).

Benchmarking European power and utility asset impairments | 13
Impact of 2015 write-downs: future M&A activity likely to increase
What will influence 2016 impairments?
One implication of the record level of write-downs booked in 2015 by European power and utilities businesses is the likelihood of greater M&A in the next one to two years.
Europe’s players, led by the French and Italian utilities, are looking to sell €30b–€35b of assets by 2020 as they respond to existing balance sheet constraints and implement new strategies to deal with their rapidly evolving marketplace. In fact, there is a lengthy list of conventional generation assets already on the market.
The price at which utilities are prepared to sell has fallen as impairments have been realized and the imperative to repair balance sheets remains in place. We believe that power and utilities companies will therefore be more willing to sell thermal generation assets, in particular, at a steep discount to their original purchase or development costs.
• Pricing: The pricing environment appears to have stabilized. Structural switching from coal- to gas-fired generation may lead to increased impairment of coal-fired capacity, and there may be some potential for reversing impairments in relation to gas-fired capacity.
• Supply: Falling costs for renewable technologies will continue to pressurize thermal generation, with grid parity in multiple European countries across multiple technologies coming ever closer. The renewables build-out will continue, as auctions offer the delivery of capacity at rates significantly cheaper than previous subsidy levels.
• Policy: Reform of the EU ETS will not be a “quick fix.” In the short to medium term, capacity remuneration mechanisms offer more prospect of meaningful support for thermal generation assets. Flexibility will need to receive more explicit recognition under future remuneration structures.
• Demand: Energy efficiency and energy saving measures will continue to dampen demand. The electrification of transport may result in increased demand, but not at any meaningful level until the middle of the next decade.
• Financing: Given the determination of Europe’s central bankers to support economic recovery by holding interest rates at historically low levels, it seems unlikely that financing will become a greater driver for impairments in the short to medium term.
Brexit may yet prove to be something of a wild-card for 2016. The true extent of the consequences of the UK’s leave vote on the wider European power and utilities sector is unlikely to be known for several years. However, one repercussion of Brexit may have immediate implications for year-end impairment testing, relating to the UK specifically.
Any fall in the value of sterling will make generation technology acquisition and input fuel costs more expensive. Both factors will tend to put upward pressure on UK power prices, in turn enhancing the value of existing assets, and potentially avoiding the need for impairments that might otherwise have had to be recognised.
Implications and outlook for 2016 impairments

ContactsCharles-Emmanuel Chosson Global Assurance Leader — Power & Utilities +44 20 7951 7869
Duncan Coneybeare Sector Analyst, Global Markets — Power & Utilities +44 20 7951 5628
About EYEY is a global leader in assurance, tax, transaction and advisory services. The insights and quality services we deliver help build trust and confidence in the capital markets and in economies the world over. We develop outstanding leaders who team to deliver on our promises to all of our stakeholders. In so doing, we play a critical role in building a better working world for our people, for our clients and for our communities.
EY refers to the global organization, and may refer to one or more, of the member firms of Ernst & Young Global Limited, each of which is a separate legal entity. Ernst & Young Global Limited, a UK company limited by guarantee, does not provide services to clients. For more information about our organization, please visit ey.com.
About EY’s Global Power & Utilities SectorIn a world of uncertainty, changing regulatory frameworks and environmental challenges, utility companies need to maintain a secure and reliable supply, while anticipating change and reacting to it quickly. EY’s Global Power & Utilities Sector brings together a worldwide team of professionals to help you succeed — a team with deep technical experience in providing assurance, tax, transaction and advisory services. The Sector team works to anticipate market trends, identify their implications and develop points of view on relevant sector issues. Ultimately, this team enables us to help you meet your goals and compete more effectively.
© 2016 EYGM Limited.All Rights Reserved.
EYG no. 03494-164Gbl
BMC AgencyGA 0677_07779
ED None.
This material has been prepared for general informational purposes only and is not intended to be relied upon as accounting, tax or other professional advice. Please refer to your advisors for specific advice.
ey.com
EY | Assurance | Tax | Transactions | Advisory