Utilities’ Guide to Data Access for Building Benchmarking · Utilities’ Guide to Data Access...
32
Transcript of Utilities’ Guide to Data Access for Building Benchmarking · Utilities’ Guide to Data Access...
Utilities’ Guide to Data Access for Building Benchmarking
Introduction | IMT | 1
Table of Contents
Definitions ....................................................................................................................................... 2
Executive Summary ......................................................................................................................... 3
1. Introduction ............................................................................................................................. 5
1.1 Purpose ................................................................................................................................. 5
1.2 Context ............................................................................................................................. 5
2. Benefits of Benchmarking ....................................................................................................... 7
2.1 Benefits for Building Owners and Facility Managers ............................................................ 7
2.2 Benefits for Utilities.......................................................................................................... 8
2.3 Benefits of Water Benchmarking ................................................................................... 10
3. Need for Improved Data Access ............................................................................................ 10
3.1 Challenges of Obtaining Building Data ............................................................................... 10
3.2 Elements of Enhanced Data Access Programs ............................................................... 11
4. Challenges of Implementing Automated Data Services ........................................................ 13
4.1 Privacy ................................................................................................................................. 13
4.2 Cost Recovery...................................................................................................................... 15
4.3 Interfacing with Existing Customer Information Systems (CIS) .......................................... 16
5. Recommendations ................................................................................................................. 17
5.1 Privacy ................................................................................................................................. 17
5.2 Stakeholders ....................................................................................................................... 18
5.3 Integration and Coordination with Existing Policies and Systems ..................................... 19
5.4 Data for Impact-Tracking .................................................................................................... 20
5.5 Functionality Overview ....................................................................................................... 21
6. Ongoing Work ........................................................................................................................ 23
6.1 Green Button ...................................................................................................................... 23
6.2 Other Federal Efforts .......................................................................................................... 25
Appendix 1. Case Studies .............................................................................................................. 26
Appendix 2. Data to be Collected for Impact Tracking ................................................................. 28
Acknowledgements ....................................................................................................................... 30
About the Institute for Market Transformation (IMT) ................................................................. 31

Utilities’ Guide to Data Access for Building Benchmarking
Introduction | IMT | 2
Definitions
Benchmarking: in the context of buildings, benchmarking is the act of measuring the energy performance (or
water consumption) of a building, so that its energy performance can be compared over time, to a norm, or
to a group of peers.
ENERGY STAR Portfolio Manager: interactive energy management tool that allows a user to track energy and
water consumption for a building. After entering a building’s total energy usage for 12 consecutive months,
the tool generates the building’s energy intensity. Many types of facilities can also receive a score on a scale
of 1 to 100 that rates the energy performance of the building compared to similar buildings nationwide.
Portfolio Manager Data Exchange: A free web service designed so third-party energy service companies, like
utilities, can securely provide energy and building data from their systems to Portfolio Manager. Portfolio
Manager Data Exchange was previously known as Automated Benchmarking System (ABS).
Whole-building, aggregated data: total energy consumption data for an entire building obtained by summing
up the energy usage data measured by tenant meters.

Utilities’ Guide to Data Access for Building Benchmarking
Introduction | IMT | 3
Executive Summary
In July 2012, the Energy Efficient Buildings Hub and the Pennsylvania Public Utilities Commission jointly convened the Regional Data Management Working Group to examine utility efforts to provide building operators with better access to energy consumption data for their buildings. The Working Group held a series of meetings in 2012 and 2013 to explore the benefits and challenges of implementing data accessibility programs, with a focus on Pennsylvania and the surrounding region. The Working Group was comprised of local utilities, utility regulators, building owners and experts from the real estate, academic, and energy efficiency fields. A product of the Working Group, this report identifies best practices for utilities to provide building operators with automated access to whole-building energy consumption data, while maintaining appropriate confidentiality protections on customer data. The report provides an introduction to data accessibility issues and an assessment of the challenges and opportunities for utilities, regulators, and real estate practitioners in implementing data accessibility practices. It also presents case studies of utilities that have implemented such practices. The Working Group examined the role of utilities in two related data accessibility issues: the ability of building owners and operators to access tenant energy consumption data in order to measure and evaluate overall building energy performance (a process known as benchmarking), and the automated transfer of that data from the utility directly into benchmarking tools. Several data points are typically needed to conduct benchmarking, including energy consumption data for the entire building. Many building owners cannot access consumption data for all the utility meters within their building without the consent of individual tenants, preventing them from benchmarking and limiting their ability to evaluate energy efficiency opportunities and make energy improvements. Unfortunately, due to a mix of technical, institutional, and privacy issues, most utilities have not yet developed processes to assist building owners and operators in accessing this information. Over the past few years, several utilities have developed programs to overcome those issues and provide building owners and operators with convenient access to the energy consumption data they need to benchmark. Drawing from the experiences of these utilities and members of the Working Group, the key conclusions and recommendations in the report are described below:
Interest in data accessibility practices is likely to continue to increase among utilities, regulators, building owners, and the public. Several utilities have adopted data accessibility practices, and more are considering programs. This trend is being driven by benchmarking and disclosure laws, now on the books in seven cities in the U.S., as well as by sharply increasing rates of voluntary benchmarking by building owners.
Data access programs have significant potential to deliver benefits to utilities. Recent studies
and experiences of utilities have shown that data access programs engage utility customers and drive them to other energy efficiency initiatives, improving utilities’ ability to achieve mandated energy efficiency goals, enhance reliability, and hold down costs for ratepayers. They also help utilities evaluate and target energy efficiency programs and provide exceptional customer service.
Utilities’ Guide to Data Access for Building Benchmarking
Introduction | IMT | 4
Utilities can provide tenant data to building owners by aggregating and anonymizing the data. Building owners of separately metered buildings often do not have access to tenant or whole-building energy data in part due to privacy concerns. To overcome this barrier, utilities can provide monthly aggregated data, a lump sum of the energy consumption data for all accounts in a building. To safeguard tenant privacy, utilities provide aggregated data for buildings in which there are more than a set number of utility accounts. There is no consistency among utilities on an appropriate account threshold that guarantees privacy, and utilities are still grappling with how best to ensure privacy and data security. It is critical for utilities and regulators to work together on these privacy issues, and for public utility commissions to offer guidance.
Automating the data transfer will ease the process for utilities and customers. A system that inputs energy consumption data into a benchmarking tool in an automated fashion is user-friendly, reduces utility labor in the long-term, and decreases benchmarking errors. Utilities should aim to automate as much of the data retrieval, entry, and request process as possible to ensure a customer-friendly “set it and forget it” system.
Still challenges to overcome. Though utilities around the country have successfully implemented automated data access programs, challenges still need to be addressed. Utilities and regulators have not yet devised a method to attribute savings to benchmarking and, though recent studies indicate the benefits of these programs for utilities, the value proposition and verification methods need to be clarified. Utilities and regulators are still contending with privacy issues. Data aggregation and sharing systems also present technical issues: utilities typically do not have meters reliably mapped to buildings, and it can be difficult to extract information from legacy billing and customer information systems.
Innovative solutions should be explored. Improving data access has great potential for energy savings. Collaboration among utilities, stakeholders, and regulators is critical to design a customer-friendly system that allows a user to benchmark easily and then get further engaged in utility energy efficiency programs to capture greater energy savings. Utilities should investigate working with regional peer utilities to offer users one portal for all types of energy and water used in a building. Utilities should also consider how data from an automated data system could be used internally to better target and focus other energy efficiency initiatives.
Utilities’ Guide to Data Access for Building Benchmarking
Report | IMT | 5
1. Introduction
1.1 Purpose
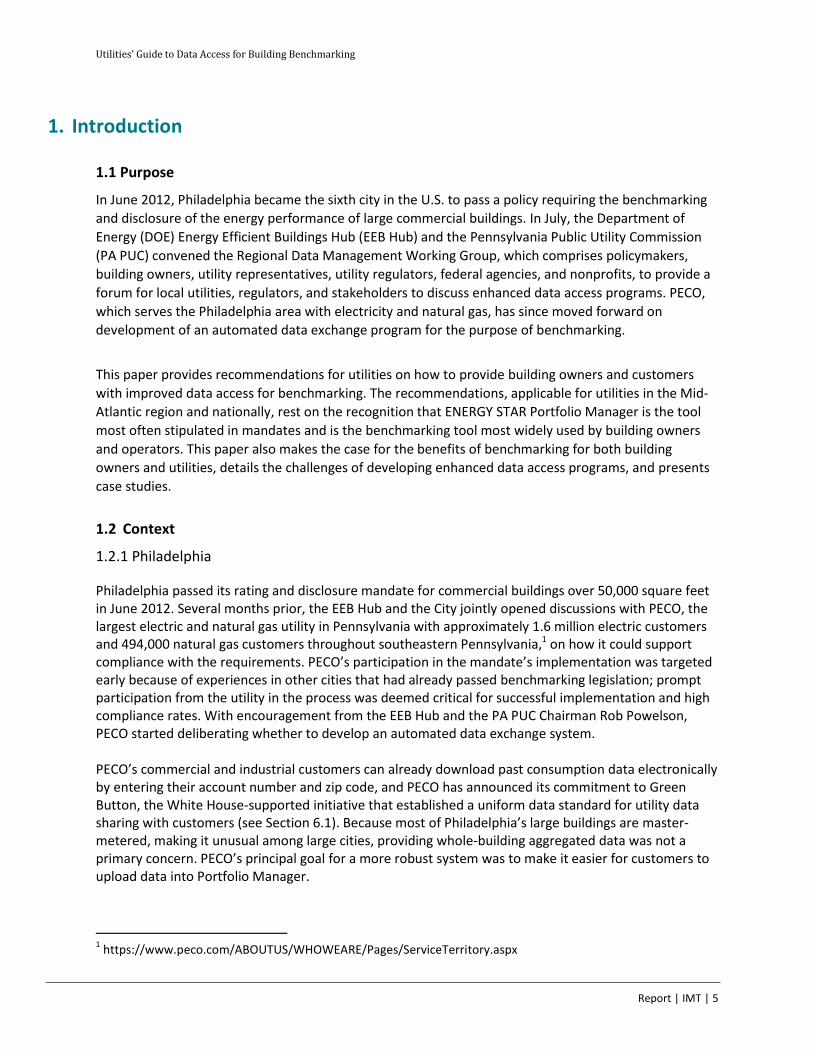
In June 2012, Philadelphia became the sixth city in the U.S. to pass a policy requiring the benchmarking
and disclosure of the energy performance of large commercial buildings. In July, the Department of
Energy (DOE) Energy Efficient Buildings Hub (EEB Hub) and the Pennsylvania Public Utility Commission
(PA PUC) convened the Regional Data Management Working Group, which comprises policymakers,
building owners, utility representatives, utility regulators, federal agencies, and nonprofits, to provide a
forum for local utilities, regulators, and stakeholders to discuss enhanced data access programs. PECO,
which serves the Philadelphia area with electricity and natural gas, has since moved forward on
development of an automated data exchange program for the purpose of benchmarking.
This paper provides recommendations for utilities on how to provide building owners and customers
with improved data access for benchmarking. The recommendations, applicable for utilities in the Mid-
Atlantic region and nationally, rest on the recognition that ENERGY STAR Portfolio Manager is the tool
most often stipulated in mandates and is the benchmarking tool most widely used by building owners
and operators. This paper also makes the case for the benefits of benchmarking for both building
owners and utilities, details the challenges of developing enhanced data access programs, and presents
case studies.
1.2 Context
1.2.1 Philadelphia
Philadelphia passed its rating and disclosure mandate for commercial buildings over 50,000 square feet in June 2012. Several months prior, the EEB Hub and the City jointly opened discussions with PECO, the largest electric and natural gas utility in Pennsylvania with approximately 1.6 million electric customers and 494,000 natural gas customers throughout southeastern Pennsylvania,1 on how it could support compliance with the requirements. PECO’s participation in the mandate’s implementation was targeted early because of experiences in other cities that had already passed benchmarking legislation; prompt participation from the utility in the process was deemed critical for successful implementation and high compliance rates. With encouragement from the EEB Hub and the PA PUC Chairman Rob Powelson, PECO started deliberating whether to develop an automated data exchange system. PECO’s commercial and industrial customers can already download past consumption data electronically by entering their account number and zip code, and PECO has announced its commitment to Green Button, the White House-supported initiative that established a uniform data standard for utility data sharing with customers (see Section 6.1). Because most of Philadelphia’s large buildings are master-metered, making it unusual among large cities, providing whole-building aggregated data was not a primary concern. PECO’s principal goal for a more robust system was to make it easier for customers to upload data into Portfolio Manager.
1 https://www.peco.com/ABOUTUS/WHOWEARE/Pages/ServiceTerritory.aspx
Utilities’ Guide to Data Access for Building Benchmarking
Report | IMT | 6
After receiving technical analysis and support from the EEB Hub and the Institute from Market Transformation, PECO stated its intent to investigate developing an automated data upload system at the second Regional Utility Data Access meeting convened by the EEB Hub in October 2012 and included it within its ratepayer funded, energy efficiency portfolio, submitted to the PA PUC in November 2012. According to Pennsylvania Act 129, passed in 2008, a utility must ensure that an approved program is “financed by the same customer class that will receive the direct energy and conservation benefits.”2 During its consideration of the program and its funding, PECO highlighted three critical questions that stemmed from this requirement:
Would the service benefit customers outside of Philadelphia? Would voluntary participation
levels of benchmarking increase?
What are the average energy savings a building owner sees after benchmarking?
What is the average investment a building owner makes after benchmarking?
While hard data to answer these questions is not available, this paper discusses these questions, as well as other considerations highlighted by PECO.
1.2.2 Utility Programs Leveraging Benchmarking in the Mid-Atlantic Region
Utilities and state programs in the Mid-Atlantic Region have already incorporated benchmarking into their energy efficiency programs. Below are three examples:
Baltimore Gas and Electric‘s (BGE) Retro-commissioning Program. To apply for the program,
customers must benchmark their commercial building using either Portfolio Manager or an
equivalent tool. If the project is accepted, BGE will provide incentives to cover up to 75% of the
cost of the retro-commissioning project, with a cap of $15,000.3
PPL Electric Corp’s PPL Electric Utilities School Energy Achievement Program. PPL Electric
Utilities, which serves eastern and central Pennsylvania, benchmarks school buildings and
evaluates them for ENERGY STAR School award eligibility. Additionally, it offers educational
support on best practices for energy management and identifies areas for energy efficiency
improvements.4
New Jersey Clean Energy’s Pay 4 Performance (P4P) Program. P4P requires projects to
benchmark in the project application phase and again 12 months after energy efficiency
upgrades are implemented. The final incentive, which may be up to 25 percent of the total
project cost, is not paid out unless the final benchmark verifies that the project achieved the
minimum 15 percent energy reduction required to qualify for the program.5
2 Pennsylvania Act 129 of 2008.
3https://www.bgesmartenergy.com/business/retrocommissioning.
4http://www.energystar.gov/ia/business/downloads/Directory_of_Energy_Efficiency_Programs_Leveraging_ENER
GY_STAR.pdf. 5 http://www.njcleanenergy.com/commercial-industrial/programs/pay-performance/existing-buildings/building-
performance-energy-star.
Utilities’ Guide to Data Access for Building Benchmarking
Report | IMT | 7
These utilities have not gone so far as to develop automated data exchange services. However, these programs set a regional precedent for the value of benchmarking, and the gap between existing programs and facilitating benchmarking with automated services is not a monumental leap forward.
2. Benefits of Benchmarking
2.1 Benefits for Building Owners and Facility Managers
Benchmarking is a critical step toward increasing awareness of the energy performance of a building and motivating energy efficiency improvements. A number of recent studies have indicated that the practice of benchmarking leads to energy savings:
EPA has analyzed the energy performance of more than 36,000 buildings that input their
complete energy performance data into Portfolio Manager and received ENERGY STAR
performance scores (any score on the 1 to 100 point scale) in all four of the years 2008 through
2011. Over this period, the buildings in the study attained average annual energy savings of 2.4
percent.6
A Building Operating Management survey of hundreds of facility managers who used Portfolio
Manager found that 70 percent have used ENERGY STAR to guide energy efficiency upgrade
plans and 67 percent have used ENERGY STAR to help justify an energy efficiency project.7
In Australia, many buildings monitor their performance using NABERS Energy, a rating tool that
is similar in scope to Portfolio Manager, and can be used to measure the energy performance of
a tenancy, a base building, or a whole building. Buildings that regularly track their energy
performance using NABERS have reported an average improvement in energy efficiency of 9
percent, or 2 kWh/ft2, as of 2011.8
A 2011 Lawrence Berkeley National Laboratory analysis of existing commercial buildings that underwent
retro-commissioning, a process whereby base building systems are thoroughly evaluated and optimized
to save energy, determined that commissioning revealed energy-related deficiencies that, when
corrected, resulted in 16 percent median whole-building savings with payback times of 1.1 years.9 A
FirstFuel analysis of medium- and large-scale commercial buildings concluded that half of all energy
efficiency savings can be achieved through operational improvements at little or no cost to building
owners.10 While benchmarking on its own does not identify specific energy efficiency improvements or
system or equipment upgrades that could be implemented in a property, it can justify and measure
6 Environmental Protection Agency. “Benchmarking and Energy Savings.”
http://www.energystar.gov/ia/business/downloads/datatrends/DataTrends_Savings_20121002.pdf?3d9b-91a5. 7 Lindsay Audin. “Careful Assessment of Energy Options Can Show What Steps to Take.” Building Operations
Management, December 2011. http://www.facilitiesnet.com/powercommunication/article/Careful-Assessment-of-Energy-Options-Can-Show-What-Steps-to-Take--12849. 8 NABERS. “Research and Statistics.”
http://www.nabers.gov.au/public/WebPages/ContentStandard.aspx?module=10&template=3&include=ResearchStats.htm&side=factsheets.htm. 9 Evan Mills. “Building Commissioning: a golden opportunity for reducing energy costs and greenhouse gas
emissions in the United States.” In Energy Efficiency Volume 4, Number 2, May 2011. 10
FirstFuel. “The Hidden Opportunity in Commercial Energy Efficiency.” February 6, 2013. http://firstfuel.com/.
Utilities’ Guide to Data Access for Building Benchmarking
Report | IMT | 8
savings from improvements and is the foundation for a comprehensive and strategic energy
management plan.
Benchmarking can allow building owners with large portfolios to prioritize energy efficiency upgrade
projects. By benchmarking all of its properties, a building owner or manager can identify and pursue
energy efficiency improvement projects in the worst energy performers to maximize cost-effective
energy savings. High-performing buildings are often applauded and receive the most attention for
benchmarking, but the greatest benefits arise when building owners benchmark and identify their worst
performing buildings. The aforementioned EPA study of ENERGY STAR found that buildings that started
with lower ENERGY STAR scores and higher energy use made the largest gains, with those scoring below
50 in 2008 making improvements that saved them twice as much energy as buildings that started with
above average scores.11
As of February 2013, seven cities—the latest being Philadelphia and Minneapolis—and two states have adopted energy benchmarking and disclosure laws for large privately-owned commercial buildings.12 Benchmarking and disclosure laws aim to drive market-based demand for energy-efficient buildings by putting energy performance information in the hands of consumers, building owners, tenants, investors, appraisers, brokers, and other stakeholders.
2.2 Benefits for Utilities
Benchmarking has also been shown to be effective in helping utilities maximize the value of their energy efficiency programs. Listed below are the benefits of benchmarking for utilities:
Benchmarking as a gateway to other energy efficiency programs. Research indicates that
benchmarking spurs investments in energy management and equipment upgrades. A 2012
report by the NMR Group for the California Public Utilities Commission (CPUC) concluded that
utility-led benchmarking programs, which included Automated Benchmarking Services (ABS) and
providing support for ABS as well as benchmarking workshops, yielded substantial and
measurable energy savings. A survey of participants and non-participants of the California
investor-owned utilities’ (IOUs) benchmarking workshops found that, of those who
benchmarked their buildings, 62 percent took energy management actions, such as monitoring
of controls and thermostats; 84 percent planned or implemented improvements to
benchmarked buildings; and 81 percent link improvements to utility energy efficiency programs.
Survey responses also indicated that benchmarking motivates more comprehensive retrofits: 90
percent of participants agreed with the statement “you implement more comprehensive energy
efficiency measures in the buildings you benchmark.”13 Benchmarking can thus be a gateway to
other energy efficiency programs—it engages building owners and customers and drives them
to take part in incentive or rebate initiatives, aiding utilities in meeting peak load and demand
reductions and increasing cost-effectiveness of the overall program portfolio.
11
Environmental Protection Agency. “Benchmarking and Energy Savings.” http://www.energystar.gov/ia/business/downloads/datatrends/DataTrends_Savings_20121002.pdf?3d9b-91a5. 12
See http://www.buildingrating.org/content/us-policy-briefs for policy briefs. 13
NMR Group. Statewide Benchmarking Process Report. Submitted to California Public Utilities Commission. April 2012.

Utilities’ Guide to Data Access for Building Benchmarking
Report | IMT | 9
Benchmarking as a tool to target and maximize savings. As meters are typically not mapped to
buildings, utilities often do not have visibility into the efficiency of the buildings they serve.
Collecting benchmarking data can give utilities a more building-centric view of their loads. Such
a view affords utilities the ability to identify lower-performing buildings or sectors to maximize
energy savings and to develop targeted programs for underserved sectors of the market or to
employ efficiency or demand response as a strategy to micro-target bottlenecks. For example,
utilities in New England, including National Grid, New England Gas Company, and NSTAR Electric
and Gas, collaborated with the Low Income Energy Affordability Network to benchmark low-
income multifamily buildings across Massachusetts to pursue energy efficiency improvements in
the worst energy performers.14 Additionally, several utilities, including Pepco, Pacific Gas and
Electric Company (PG&E), Commonwealth Edison (ComEd), and Connecticut Light and Power,
require commercial buildings to benchmark to qualify for incentives and rebates through energy
efficiency programs; some only provide incentives if buildings have higher than average energy
intensities.15 Southern California Edison also hopes to use benchmarking data internally to
inform marketing of energy efficiency programs and target low performers.16
Benchmarking as a method to analyze energy efficiency programs and validate savings. EPA’s
National Action Plan for Energy Efficiency report, “Utility Best Practices Guidance for Providing
Business Customers with Energy Use and Cost Data,” asserts that benchmarking scores can be
used as a “simplified, lower-cost basis for evaluation, measurement, and verification.” 17
Benchmarking scores also provide a better baseline data source for demand response programs.
For example, PG&E plans to analyze scores of customers who have both benchmarked using its
ABS and participated in energy efficiency programs to measure savings of other PG&E DSM
initiatives.18
Benchmarking to improve customer service. Many commercial customers desire whole-building
data.19 Demand for this data is expected to rise as benchmarking is increasingly seen as an
important strategy for energy management and as more jurisdictions pass mandatory
benchmarking and disclosure requirements. By helping customers save time and money by
providing improved data access programs, utilities can improve their customer service rates and
engage the customer.
With mounting evidence that benchmarking provides benefits for customers who benchmark, utilities, and ratepayers, regulators have expressed support for utility-sponsored benchmarking programs. In 2011, the National Association of Regulatory Utility Commissioners (NARUC) adopted a resolution that affirmed the need for better access to whole-building energy consumption data to support energy-
14
Berkshire Gas Company; Columbia Gas of Massachusetts; National Grid; New England Gas Company; NSTAR Electric & Gas; Unitil Service Corporation; and Western Massachusetts Electric Company. Low-Income Metric Three. Submitted to the Low Income Energy Affordability Network. 2011. 15
http://www.energystar.gov/ia/business/downloads/Directory_of_Energy_Efficiency_Programs_Leveraging_ENERGY_STAR.pd
f. 16
Interview with Gary Suzuki, Southern California Edison, December 5, 2012. 17
National Action Plan for Energy Efficiency (2008). Utility Best Practices Guidance for Providing Business Customers with Energy Use and Cost Data. ICF International. 2008. www.epa.gov/eeactionplan. 18
Interview with Jaclyn Hood, Pacific Gas and Electric, November 19, 2012. 19
www.energydataalliance.org
Utilities’ Guide to Data Access for Building Benchmarking
Report | IMT | 10
efficient operations and encouraged state public utility commissions to consider benchmarking and data access programs. The resolution stated: “demand reductions motivated by benchmarking can result in direct cost savings to customers and peak load reductions that benefit all ratepayers.”20
2.3 Benefits of Water Benchmarking
Tracking and benchmarking water consumption is also crucial. Examining water usage data regularly
allows a building manager to identify leaks, better manage water usage, and save water and energy.
Benchmarking water usage, though it has garnered less attention, is and, with projected water
shortages, will become an even more important tool for utilities and property owners. New York City’s
Department of Environmental Protection (DEP) was the first water utility in the country to provide
automated benchmarking services for its customers. Its service has the capability for building owners to
set alarms once water usage exceeds a user-set threshold, assisting owners in identifying leaks. DEP also
uses the system to track customers’ usage, which has allowed DEP to proactively reaching out to
customers about leaks, saving customers $26 million as of February 2013.21 DEP’s service demonstrates
how automated benchmarking services can be used as demand management tools and save a utility and
its customers water—and energy.
3. Need for Improved Data Access
3.1 Challenges of Obtaining Building Data
Benchmarking in Portfolio Manager requires 12 consecutive months of consumption data for all types of fuel used for an entire building. Acquiring and entering this data, either as individual meter readings or a total building aggregate, is often the most onerous part of benchmarking for a building owner. The barriers that a building owner faces when collecting and inputting this data include:
Access to building data and privacy concerns. In separately metered buildings where each
tenant is a utility customer, the building owner often needs to seek authorization or meter data
from each tenant to satisfy privacy laws or utility confidentiality policies. Manually collecting
these authorizations or data on a monthly or annual basis is time-consuming and, furthermore,
may be fruitless. Tenants may be reluctant to share their data or fail to understand the benefits
of benchmarking, and large corporate or government tenants may not know who is empowered
to approve authorizations or may not even have access to their account numbers or utility bills
as bills are often sent to national headquarters.
Format of utility data. Many utilities only provide consumption data in formats that necessitate
the customer manually reentering data into Portfolio Manager. This situation creates a
possibility of manual errors and makes the customer less likely to benchmark. Moreover, this
hinders the possibility of a building owner or operating regularly tracking improvements and
energy performance.
20
NARUC. Resolution on Access to Whole-Building Energy Data and Automated Benchmarking. 2011. http://www.naruc.org/Resolutions/Resolution%20on%20Access%20to%20Whole-Building%20Energy%20Data%20and%20automated%20benchmarking.pdf . 21
Personal communication with Albert Kramer, Department of Environmental Protection, February 1, 2013.
Utilities’ Guide to Data Access for Building Benchmarking
Report | IMT | 11
Lack of standardization across the country in data acquisition processes. The lack of
standardization across utilities affects large real estate and management companies that have
properties in different regions. Having to learn city-specific data processes makes organization-
wide benchmarking more taxing and less likely.
The need for improved data access for building owners is acute. According to EPA, 40 percent of the US commercial building square footage has been benchmarked using Portfolio Manager. The number of buildings and total square footage benchmarked has increased by more than a factor of ten in the last decade.22 More building owners are facing the challenges of acquiring data than ever before, and this number is expected to keep rising as more jurisdictions pass mandatory benchmarking requirements for their commercial and multifamily sectors and as benchmarking increasingly becomes a critical component of energy management.
3.2 Elements of Enhanced Data Access Programs
Utilities can minimize the challenges to benchmarking by developing an automated data system that provides aggregated data. Many utilities do not have set procedures for providing building owners with energy consumption values. They handle requests for data on a one-off basis, perhaps by different departments. Enhanced data access programs for benchmarking are not yet widespread, but a
successful program will have the following two elements:
1. Aggregated Data. Typically, utilities will not provide tenants’ metered consumption data to third
parties, like building owners or management companies, without explicit permission from the
customer. To lessen the challenge for owners with separately-metered buildings while
protecting the privacy of the tenants, a utility can provide aggregated whole-building data. Most
utilities with existing programs have set a minimum number of meters for aggregation; if a
building has fewer than that number, the building owner must get permission from all of the
building’s tenants. These meter thresholds are discussed in more detail in Section 4.1.
Some utilities, including ConEdison23 (ConEd) and Pepco,24 provide aggregated data without offering the capability of automatic upload.
2. Automated Upload to Portfolio Manager. The second element of a successful data access
program should remove the necessity of building owners manually rekeying information into
Portfolio Manager. Portfolio Manager Data Exchange, previously known as ABS, allows utilities
or other energy service providers to transfer energy consumption data directly into Portfolio
Manager. The service is integrated into Portfolio Manager, though each utility has its own terms
and conditions, data fields, and requirements for supplemental information. Data Exchange
itself does not aggregate meter data, but a utility can use it to upload data which the utility has
already aggregated.
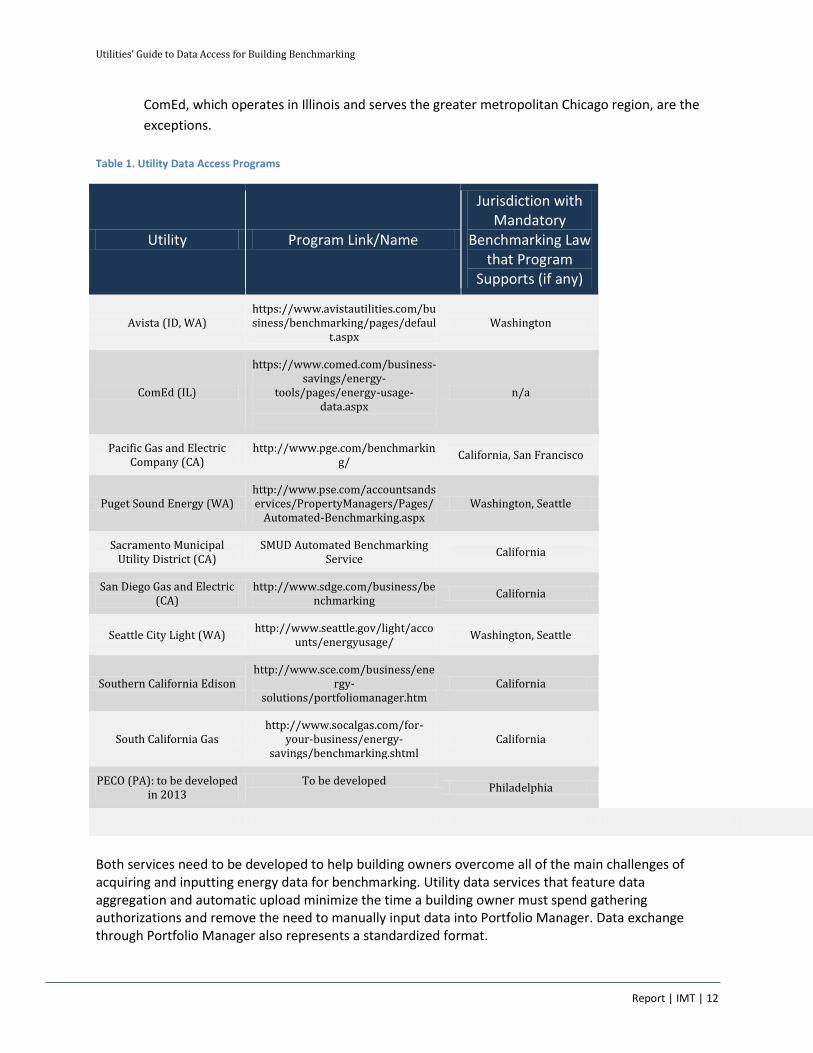
See Table 1 for a list of utilities that offer this service. Most developed services to
support compliance of mandatory benchmarking and disclosure laws at the state or local level.
PG&E, which offered a data upload service prior to California adopted a benchmarking law, and
22
http://www.energystar.gov/ia/business/downloads/datatrends/DataTrends_Energy_20121002.pdf?4003-9013 23
http://www.coned.com/energyefficiency/city_benchmarking.asp 24
http://www.pepco.com/business/services/consumptionrequestform/
Utilities’ Guide to Data Access for Building Benchmarking
Report | IMT | 12
ComEd, which operates in Illinois and serves the greater metropolitan Chicago region, are the
exceptions.
Table 1. Utility Data Access Programs
Utility Program Link/Name
Jurisdiction with Mandatory
Benchmarking Law that Program
Supports (if any)
Avista (ID, WA) https://www.avistautilities.com/business/benchmarking/pages/defaul
t.aspx Washington
ComEd (IL)
https://www.comed.com/business-savings/energy-
tools/pages/energy-usage-data.aspx
n/a
Pacific Gas and Electric Company (CA)
http://www.pge.com/benchmarking/
California, San Francisco
Puget Sound Energy (WA) http://www.pse.com/accountsandservices/PropertyManagers/Pages/
Automated-Benchmarking.aspx Washington, Seattle
Sacramento Municipal Utility District (CA)
SMUD Automated Benchmarking Service
California
San Diego Gas and Electric (CA)
http://www.sdge.com/business/benchmarking
California
Seattle City Light (WA) http://www.seattle.gov/light/acco
unts/energyusage/ Washington, Seattle
Southern California Edison http://www.sce.com/business/ene
rgy-solutions/portfoliomanager.htm
California
South California Gas http://www.socalgas.com/for-
your-business/energy-savings/benchmarking.shtml
California
PECO (PA): to be developed in 2013
To be developed Philadelphia
Both services need to be developed to help building owners overcome all of the main challenges of acquiring and inputting energy data for benchmarking. Utility data services that feature data aggregation and automatic upload minimize the time a building owner must spend gathering authorizations and remove the need to manually input data into Portfolio Manager. Data exchange through Portfolio Manager also represents a standardized format.
Utilities’ Guide to Data Access for Building Benchmarking
Report | IMT | 13
The role of the utility does not include quality assurance, keeping an account list by building, or verifying that a building owner has inputted into Portfolio Manager all of the building’s meters or any other data for a building.
4. Challenges of Implementing Automated Data Services
Early experiences of utilities that have built automated data services have shown that implementing these programs, though beneficial, raises both technical and non-technical issues.
4.1 Privacy
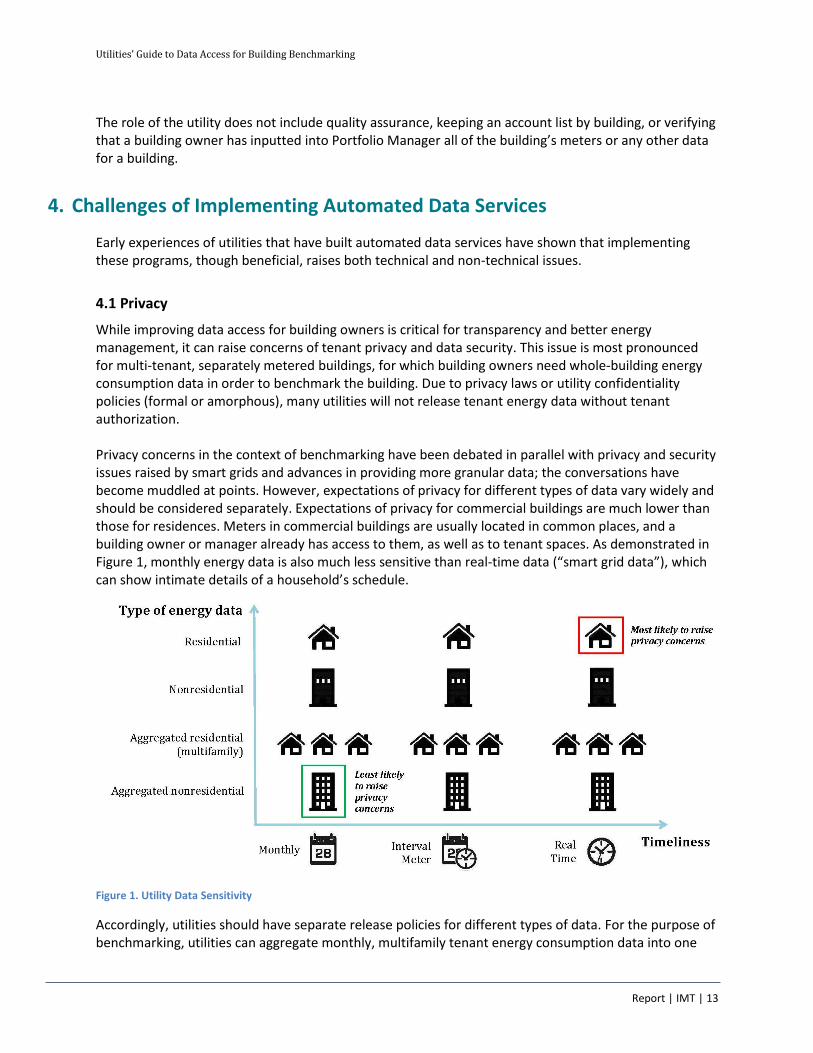
While improving data access for building owners is critical for transparency and better energy management, it can raise concerns of tenant privacy and data security. This issue is most pronounced for multi-tenant, separately metered buildings, for which building owners need whole-building energy consumption data in order to benchmark the building. Due to privacy laws or utility confidentiality policies (formal or amorphous), many utilities will not release tenant energy data without tenant authorization. Privacy concerns in the context of benchmarking have been debated in parallel with privacy and security issues raised by smart grids and advances in providing more granular data; the conversations have become muddled at points. However, expectations of privacy for different types of data vary widely and should be considered separately. Expectations of privacy for commercial buildings are much lower than those for residences. Meters in commercial buildings are usually located in common places, and a building owner or manager already has access to them, as well as to tenant spaces. As demonstrated in Figure 1, monthly energy data is also much less sensitive than real-time data (“smart grid data”), which can show intimate details of a household’s schedule.
Figure 1. Utility Data Sensitivity
Accordingly, utilities should have separate release policies for different types of data. For the purpose of benchmarking, utilities can aggregate monthly, multifamily tenant energy consumption data into one
Utilities’ Guide to Data Access for Building Benchmarking
Report | IMT | 14
sum to mask individual consumption behaviors. As commercial monthly energy data is not as sensitive, utilities should consider sharing nonresidential monthly energy consumption data for each tenant account with building owners while giving every tenant the opportunity to opt out from having their data shared separately, in which case none of that building’s tenants’ data would be shared separately and only aggregate data would be shared. If utilities and regulators aim to treat commercial data more cautiously, they can aggregate all meter data for commercial buildings as well as residential ones. In cases where there are only a few tenants in the building or one tenant occupies the majority of the building space, utilities, regulators, and affected stakeholders may be concerned that a third party may be able to discern tenant consumption data from an aggregated sum. Many utilities have no set policies addressing this situation. Utilities generally require authorization from each tenant if there are less than a set level of utility accounts in the building. In addition, utilities in California, Colorado, and Austin require authorization if one tenant uses more than a minimum percentage of the building’s total energy. There are inconsistencies across jurisdictions on an appropriate account threshold that guarantees privacy, and utilities are still grappling with how best to ensure privacy and data security.
Though utilities often receive little guidance from regulators on appropriate thresholds, they do have to consider a patchwork of state privacy laws, their own confidentiality policies, and public utility commission rulings, as well as federal guidelines like the Federal Trade Commission’s Fair Information Practice Principles (FIPP), when determining their aggregation policies. While FIPP are not specifically designated for utilities, utility activities should follow these guidelines, which affirm the core principles of privacy protection: transparency, individual participation, purpose specification, data minimization, use limitation, data quality and integrity, security, and accountability and auditing.25
Without a standard for data aggregation and more guidance from regulators or law, some utilities have erred on the side of setting more conservative account thresholds. For example, California utilities were mandated by state law to provide aggregated data in a manner that protected the confidentiality of the customer to support compliance with AB 1103, the statewide rating and disclosure law.26 However, none of AB 1103, its regulations, or the rulings of the CPUC stipulated a meter threshold that would ensure customer privacy. Without further guidance, the utilities have been using the “15/15” calculation as a tool to achieve a safe level of aggregation to ensure anonymity of the customer. The “15/15” tool specifies that aggregated data must comprise data of 15 customers at minimum and no single customer’s load may exceed 15 percent of the building’s total energy consumption. This guideline was first adopted by the CPUC in 1997 in the context of data access for California’s Community Choice Aggregation programs and energy service providers—it continues to be relevant in this context only and was not intended as a standard for aggregated generic data access. 27 The CPUC does not condone its use for data aggregation for benchmarking.28 The CPUC is currently working with the utilities to come up with a consistent implementation of the privacy rules for aggregated and anonymized data.
25
Department of Homeland Security. DHS Privacy Policy Guidance Memorandum Number 2008-01: The Fair Information Practice Principles: Framework for Privacy Policy at the Department of Homeland Security. December 29, 2008. http://www.dhs.gov/xlibrary/assets/privacy/privacy_policyguide_2008-01.pdf. 26
Nonresidential Building Energy Use Disclosure Program. California Code of Regulations, Title 20, Division 2, Chapter 4, Article 9, Sections 1680 ‐ 1685. 27
E-mail from Christopher Villarreal, California Public Utility Commission, November 26, 2012. 28
Footnote 38 states: “8 SCE’s proposed Rule 25 relies on the “15/15 Rule” which was adopted in the context of availability of data for Direct Access; SCE has made no showing as to why a standard

Utilities’ Guide to Data Access for Building Benchmarking
Report | IMT | 15
On the other end of the spectrum, some utilities provide public access to monthly residential energy data. For example, residents of Gainesville (as well as the general public), which is served by a municipally-owned utility, can compare a home’s energy usage to other homes in the region.29 Madison Gas and Electric operates a website that allows users to view the average monthly energy consumption of any apartment or home in its territory.30
Several utilities, including Austin Energy, ComEd, and PSE, have independently landed on a threshold of three to five accounts for data aggregation and have not received any complaints from account holders. ComEd will release aggregated data if there are more than three meters in the building.31 PSE will release whole-building data without tenant authorizations if five or more accounts have been aggregated together. PSE’s benchmarking team reports that building owners are frustrated with the work this policy entails; some have found it extremely difficult and time-consuming to collect authorizations from as many as four tenants and the benchmarking team is speculating that five accounts may be too conservative of a meter threshold. 32
Austin Energy created its aggregation policy in 2012 to support the implementation of Austin’s Energy Conservation Audit and Disclosure Ordinance. The policy states that data can be aggregated for commercial tenant-occupied buildings with four or more separate utility customers; for buildings with three or fewer customers, individual data release forms will be required. Tenant authorization is also required if any single customer in the building uses 80 percent or more of the building’s total energy usage per annum. Forming this policy, Austin Energy’s legal team was constrained by a Texas state law that required them to protect customer information but did not specify at what level.33 By balancing practical implementation issues with privacy and competitiveness concerns, the legal team landed on the number of four meters for aggregation—according to a representative of the legal team, “four felt comfortable.”34 The Austin Energy team reports no problems regarding the aggregation policy; building owners understand the level of work and need for authorizations below the set level, and customers feel like their concerns have been heard. With the two elements of the aggregation policy, personal customer usage information cannot be de-anonymized from one data point per month.35
4.2 Cost Recovery
Developing automated benchmarking services has not been an exorbitant cost for utilities with existing programs, ranging from $50,000 to approximately $400,000 for the initial set-up, and utilities have
used in the context of retail choice should be a requirement in making aggregated data available to third parties that will use the data “for analysis, reporting or program management….” CPUC Resolution E-4535. September, 27, 2012. p4. http://docs.cpuc.ca.gov/PublishedDocs/Published/G000/M028/K609/28609033.PDF. 29
http://gainesville-green.com. 30
https://www.mge.com/myaccount/averagecost/. 31
Presentation by Kevin Bricknell. “Energy Usage Data System.” Energy Efficient Buildings Hub Regional Data Management Working Group Meeting, October 25, 2012. 32
Personal communication with Chris Thompson, Puget Sound Energy, December 6, 2012. 33
Texas Utilities Code Sec. 17.004 states: “all buyers of telecommunications and retail electric services are entitled to…privacy of customer consumption and credit information.” Sec. 17.005 makes this requirement apply to municipally owned utilities, like Austin Energy. 34
Interview with Stuart Reilly, Austin Energy, December 4, 2012. 35
For additional safeguards, utilities can specify that building owners may not request multiple, overlapping datasets for one month that only differ by one meter.
Utilities’ Guide to Data Access for Building Benchmarking
Report | IMT | 16
funded programs in a variety of ways. The underlying questions for utilities to consider as they are deciding upon a funding mechanism are: a) who benefits from a benchmarking program, and b) how that value can be measured. Examples of funding mechanisms are outlined below:
Ratepayer-funded as a part of the energy efficiency plan. This approach acknowledges the
benefits of benchmarking for ratepayers and its role in influencing energy savings. However, no
utility has considered benchmarking services as a stand-alone program because it is difficult to
directly attribute savings or justify the service with a cost-benefit analysis. Utilities have included
benchmarking services as cross-program delivery costs or market transformation, innovative, or
social behavior programs. Because benchmarking can drive customers to other energy efficiency
programs, utilities may also consider funding it as a marketing cost for rebate or incentive
programs.
Absorbing costs into general or information technology funds.
Charging customers on a one-off or subscription basis. Discrete data showing that
benchmarking causes energy savings and has benefits for ratepayers that do not benchmark
their buildings is lacking. Therefore, many utilities believe they cannot justify the program as a
ratepayer-funded, energy efficiency program. In this approach, the building owner or manager
must pay for the automated service, either on a subscription or one-off basis.
There is a nascent trend showing more utilities are considering benchmarking services as part of their energy efficiency plans.36 As more data is collected, justifying these programs as ratepayer funded programs may become more feasible.
4.3 Interfacing with Existing Customer Information Systems (CIS)
According to a 2009 report studying the implementation of ABS by select California utilities, “one of the largest technical hurdles is determining how to access the data from the utility Customer Information System (CIS).”37 Existing CIS and billing systems, which together house utility customer account data and billing functions, may not support pulling data and storing values returned from data exchange programs. Building automated data exchange services may require a new infrastructure or adding new requirements to CIS functionality. Providing aggregated data poses several other technical challenges. Utilities identify customers and data with account numbers, which are linked to meter numbers, and meters are not usually mapped to their corresponding buildings. However, to provide aggregated data, a utility’s system needs to be able to connect meters with buildings. Depending on the existing capabilities of a utility’s infrastructure, this task may require complex and expensive programming or result in a system that is not user-friendly. For example, Seattle City Light’s existing system required a clean alignment between building boundaries, physical meters, and account number to successfully aggregate and upload data. Because of the messy web of existing connections in some multi-tenanted buildings, such as office parks, the utility had to
36
For example, ComEd funds the program as a part of its energy efficiency plan. Though PSE’s original system was funded by general funds, PSE will most likely fund the next version of its system as a part of its energy efficiency portfolio. 37
Heschong Mahone Group. California’s Automated Benchmarking System Cost Summary. July 7, 2009. http://www.h-m-g.com/downloads/energybenchmarking/For%20Utilities/CA%20ABS%20Cost%20Summary%207-7-09.pdf.
Utilities’ Guide to Data Access for Building Benchmarking
Report | IMT | 17
reassign account numbers or even install new meters before the program could aggregate data. Cleaning up its metering and billing configurations for the benchmarking system, a complex task, had the added benefit of reducing building owner confusion surrounding these relationships. Also, without having meters mapped to a building, it is more difficult to verify that all meters have been accounted for in a building’s energy usage.
To provide aggregated data, historical data must be retained for tenants that have recently moved out, and existing technical infrastructure may not store energy usage data for accounts that have been closed. Moreover, an automated data exchange service will fetch raw data from the utility’s billing system, but this data must be adjusted to match the calendar months used when entering data into Portfolio Manager, posing another difficulty. Customer billing cycles rarely align with the calendar month, and the utility may be serving multiple accounts at a single building, each on its own unique cycle.
Utilities have found solutions for these issues, as discussed in Section 5. However, the existing infrastructure will be a principal factor in the system’s costs.
5. Recommendations
Utilities with existing programs have overcome the challenges of developing and implementing automated data exchange systems independently and with varying results. Because these services are still new and innovative, few concrete best practices have emerged. However, the experiences of utilities that have already built benchmarking programs provide valuable insight. Below are recommendations for utilities developing automated data exchange systems that will provide whole-building utility data.
5.1 Privacy
Recommendation 1: If aggregating data from multiple accounts, aim to aggregate in the range of three to five customer accounts without tenant authorization. If a building has fewer accounts or if one customer uses more than 80 percent of the total energy usage per annum,38 a building owner should obtain tenant authorizations for the utility to release the data.39 In such cases, utilities should allow electronic authorizations, make available the time-saving features described below, and otherwise endeavor to make the process as easy as possible for owners and tenants.
Utilities have aggregated meter data and individually set minimum account thresholds to balance protecting customer privacy with minimizing the burden of benchmarking for building owners. Utilities are still struggling to determine a suitable balance and more research needs to be done to determine appropriate customer account thresholds, but Austin Energy, PSE, and ComEd, described in Section 4.1, provide good examples of working policies.
38
Utilities may consider setting a maximum customer usage per building usage threshold only if there are fewer than 10 accounts in one building. 39
Utilities should also set safeguards to ensure building owners will not be able to de-anonymize data. For example, building owners should not be able to request multiple, overlapping datasets for one month that only differ by one meter.
Utilities’ Guide to Data Access for Building Benchmarking
Report | IMT | 18
A model commercial meter aggregation policy that would best advance energy efficiency goals by empowering building owners to better manage a building’s energy usage would be for a utility to provide a building owner with each tenant’s energy usage while giving every tenant the opportunity to opt out of sharing this data. If any tenant in the building would opt out, a building owner would only receive aggregated data—unless that one tenant’s energy use represents the majority of the energy use of the building, in which case the utilities should require an authorization from that tenant.
If commercial building tenants are directed by law to provide energy usage data, like stipulated by the benchmarking law of Washington, DC, jurisdictions should have an appeals process so that tenants can be exempted from having their data disclosed or their buildings benchmarked in exceptional circumstances when doing so would compromise security or trade secrets.
Even if a building owner needs to get tenant authorizations, utilities should provide data for these buildings in an automated fashion and otherwise endeavor to make the process as easy as possible for owners and tenants.
Recommendation 2: Utilities should offer building owners a variety of ways of providing tenant authorization: wet signature, electronic authorization, or tenant lease.
Many utilities with existing programs do not have the technical capability to validate electronic authorizations. However, this approach would be less cumbersome for most building owners. If utilities have the technical capabilities, they should accept electronic authorizations.
Some utilities have asserted that a tenant lease with a clause stating the tenant will provide monthly energy consumption to the building owner is a sufficient form of authorization. For both PSE and Austin Energy, leases are a suitable form of documentation.40
5.2 Stakeholders
Recommendation 1: Involve the PUC from the beginning of the development process.
Implementation of benchmarking programs will be smoother, and more parties will be able to benefit from the service, when regulators provide guidance on privacy concerns, impact-tracking, and cost recovery.
Utilities should work with their PUC to garner support for cost-recovery mechanisms. While energy savings and benchmarking have been linked in recent studies, as discussed in Section 1.2, we have limited knowledge of benchmarking’s role in causing savings, hindering the attribution of savings. The lack of a method for attributing savings and cost recovery may dissuade utilities from pursuing a program.
Services facilitating benchmarking also have the potential to be linked to other energy efficiency programs—for example, benchmarking can engage customers and drive them to incentive or rebate programs. Benchmarking scores can also be a requirement for customers to participate in efficiency initiatives as a means to validate energy savings. These opportunities should be discussed accordingly.
40
Interview with Stuart Reilly, Austin Energy, December 4, 2012.

Utilities’ Guide to Data Access for Building Benchmarking
Report | IMT | 19
The Department of Energy’s State Energy Efficiency Action Network (SEE Action) will release a “A Utility Regulator’s Guide to Data Access for Commercial Building Benchmarking” that supports the increased role by regulators in supporting data access and reviews key decisions points and recommendations for the development of automated data exchange systems for regulators.41
Recommendation 2: Include all relevant stakeholders in design and implementation discussions to ensure a functional and user-friendly system.
It is critical for the utility to involve all relevant stakeholders when developing an automated data exchange system. When ComEd designed EUDS, it consulted account managers, the marketing and IT departments, EPA, customers, customer service representatives, billing system, legal team, building owners, and third party service providers. Software firms, like Calico Energy Services or UtilityStudio may also be key players or technical resources.
In contrast, when creating its automatic benchmarking service, PSE was moved hastily to comply with the Washington state benchmarking mandate. It did not have an understanding of customer demand for the service, so the initial result was a compliance tool that was not user-friendly.
5.3 Integration and Coordination with Existing Policies and Systems
Recommendation 1: Weigh the pros and cons of hiring outside software consultants and consider the timing of upgrades to other IT services.
One important decision utilities will have to make is whether or not to hire outside consultants to build the system. For example, ComEd and PECO both decided to use a third party, Calico Energy Services, to build their tools, citing lack of available internal resources.
Many utilities are in the process of updating or planning upgrades to their technical infrastructures, in some cases to accommodate new technologies like Smart Grid. Utilities may want to consider coordinating initiatives and possibly delay the release of automated data exchange services to incorporate the functionality into a new system, rather than adding onto a legacy system.
Recommendation 2: Compare the costs and ease of adding onto the functionality of existing CIS compared to building a separate infrastructure for the automated data exchange services.
As described in Section 4.3, one of the largest technical hurdles that a utility faces when developing automated data exchange services is integrating with existing technical infrastructure. For example, collecting consistent data for a building that may have gaps in tenancies or turnover may not be feasible if existing systems cannot store data for accounts that have been closed. ConEd ran into this obstacle during its first year of providing aggregated data to building owners. To solve this problem, in 2012, ConEd began using a newly created software program to generate electric aggregated consumption reports. This program accesses information from a data warehouse and aggregates the data based on meter reading cycles using a special algorithm to identify areas where data is incomplete and fill in the information prior to generating an energy usage report. This process eliminates the need for end users to identify abnormal billing cycles and extrapolate for missing data, as they had to do previously.
41
SEE Action Network. www1.eere.energy.gov/seeaction/.
Utilities’ Guide to Data Access for Building Benchmarking
Report | IMT | 20
A 2009 study of the programs set up by the California utilities also determined that, instead of drawing data from existing CIS,
a better setup is for utilities to have a separate data warehouse where usage data is replicated on a daily basis to support utility programs including demand side management efforts. This infrastructure allows a utility to build ABS without adding additional requirements to the enterprise CIS. To effectively address this issue, a utility will want to make a thorough upfront comparison of its specific infrastructure and the ABS web services to plan the data access approach.
42
PG&E is one utility that followed this approach.
Recommendation 3: Building owners should be able to provide either meter or account numbers to define their buildings.
A utility’s existing infrastructure will constrain how a building owner will be able to define a building in an automated data exchange service. One key feature that makes ComEd’s EUDS user-friendly is that users only need to input a building’s service addresses to pull up an active tenants list. ComEd was able to offer this service because it had already mapped meters to building services addresses. However, accurately mapping meters to building addresses is a huge undertaking and most utilities will not have this ability. If that is the case, building owners should be able to provide either meter or account numbers (if technically feasible). Meter numbers, which are usually in building common spaces, are easier for building owners to acquire than account numbers and are linked to less sensitive information. Moreover, meter numbers for a building usually stay constant (unless a utility renumbers its meters), while account numbers will change whenever there is turnover in the space. Utilities should retain customer-inputted data mapping meters to each building address from year to year and make the information available to future buyers or operators of the building.
5.4 Data for Impact-Tracking
Recommendation 1: Collect data for impact tracking, and identify data points that need to be gathered at the beginning of the system design process.
Because there is no foolproof method to measure the benefits of benchmarking and because there has been little pressure to justify costs, data collection for impact tracking has not been a primary focus for utilities with existing programs. Moreover, many utilities built their systems in haste to comply with mandates, so they did not devote the resources necessary for data collection. However, to get full value from a benchmarking program, a utility needs to track a minimum set of values.
Utility programs that leverage benchmarking provide examples of how data from benchmarking services can be used internally to get the maximum benefit from resources. Benchmarking is already being used to validate savings, as described in Section 2.2. Automated data exchange services would allow utilities to collect data on such a scale that benchmarking scores could also be used to verify the impact of other energy efficiency programs or as baselines for demand response programs, as suggested by the National
42
Heschong Mahone Group. California’s Automated Benchmarking System Cost Summary. July 7, 2009. http://www.h-m-g.com/downloads/energybenchmarking/For%20Utilities/CA%20ABS%20Cost%20Summary%207-7-09.pdf.

Utilities’ Guide to Data Access for Building Benchmarking
Report | IMT | 21
Action Plan for Energy Efficiency,43 as well as to better target and focus other energy efficiency initiatives.
Data tracking the impact of benchmarking programs would also be useful on a larger scale to link energy savings to these programs.
A utility needs to identify the variables to track at the beginning of the design process to be able to devote sufficient IT resources, build out technical infrastructure, and ensure that the utility’s online Terms and Conditions of Use allow utilities to capture the data that flows through the exchange service for measurement and evaluation purposes. For example, the CPUC 2012 evaluation team of California utilities’ benchmarking programs could not complete its planned analysis because there was not as much benchmarking data available for analysis as the team originally anticipated. One reason for this was because “the utilities were not readily able—or not able to at all—to connect building-level utility ABS data to customer data at the meter level.”44 Nevertheless, the team pinpointed several variables that were technically feasible for the utilities to collect, as long as they addressed the three aforementioned barriers. The list of variables can be found in Table 2 in the Appendix.
5.5 Functionality Overview
These recommendations advise utilities on creating a user-friendly and scalable system.
Recommendation 1: Create a “one-stop shop” that incorporates data from all utilities in the region, so users do not have to go to separate services for gas, electric, water, steam, etc.
Portfolio Manager requires inputting all types of energy used in a building to get a complete benchmarking score. However, as of yet, no one automated data exchange service that requests data from multiple utilities in a region exists to cover all types of utilities. One of Seattle building owners’ principal complaints about the benchmarking requirement is that, because separate utilities provide electric, gas, and steam services, they have to go to three different automated data exchange interfaces to get all of the required data for a building.45 ComEd agrees that, in hindsight, collaborating with the region’s gas utility would have improved EUDS and made it even more customer-friendly.46
At minimum, utilities should work with other utilities in the region to standardize aggregation policies and authorization forms, so that building owners will only have to learn one process and collect one form from each tenant.
Recommendation 2: Build system in a modular fashion, so that it is easy to integrate extra functions into the system.
43
National Action Plan for Energy Efficiency (2008). Utility Best Practices Guidance for Providing Business Customers with Energy Use and Cost Data. ICF International. 2008. www.epa.gov/eeactionplan. 44
NMR Group. Statewide Benchmarking Process Report. Submitted to California Public Utilities Commission. April 2012. 45
Presentation by Chris Thompson. “Energy Data and Benchmarking.” Energy Efficient Buildings Hub Regional Data Management Working Group Meeting, October 25, 2012. 46
Personal communication with Kevin Bricknell, Commonwealth Edison, October 25, 2012.

Utilities’ Guide to Data Access for Building Benchmarking
Report | IMT | 22
If it is not feasible for regional utilities to coordinate, utilities should design a system that can be easily integrated with other systems in the future. Generally, developing a modular system that can be easily changed or added onto is crucial for scalability, enhancements, and easy maintenance.
Recommendation 3: Make the data collection and data entry processes as automated as possible.
Some utilities, including ConEd in New York City, deliver aggregated data at the request of customers by manually collecting and sending data in a spreadsheet. However, if demand for these services increases as expected, manual services are too labor-intensive to be sustainable. For example, Kevin Bricknell of ComEd estimates that it would take a staff of 40 or 50 people to keep up with ComEd’s aggregated data requests.47 To create a scalable and user-friendly solution, utilities should aim to automate as much of their service as possible.
An automated solution is also more user-friendly. Ideally, data will be uploaded automatically into Portfolio Manager (possibly in Green Button format – see below) and will not need to be input by the user into the service. Utilities can offer to also provide other formats of data, like Green Button and Excel spreadsheets, that customers can use for energy management purposes. The top priority should be automatic upload to Portfolio Manager.
Recommendation 4: Build an automated system that includes a subscription service—customers should be able to “set it and forget it.”
A system should also feature an automated subscription service. Once a user sets up an account, he should not have to keep going back into the system to have monthly data repopulated into Portfolio Manager. A chief criticism of PSE’s current service is that it does not have a subscription feature. PSE will likely add a subscription service into the next version of its system.48 On the other hand, once the initial authorization has been completed, the system developed by Seattle City Light will continue to upload aggregate building data every three months, almost completely eliminating the need for any intervention on the part of the building owner other than confirming any changes to the meters serving the building.49
The utility should also update data links if meter numbers change—a building owner should not need to re-submit the parameters that define the building.
Recommendation 5: Build quality assurance measures into the system.
The responsibility of entering all building meters lies with the building owner. Utilities can, however, provide quality assurance to minimize errors and missed building meters. For example, ComEd has meter verification built into EUDS. Once a customer enters all service addresses for a building, the tool pulls up a list of tenants for the user to verify.
Advanced systems with built-in meter verification can also integrate a function to flag users who delete meters or alter tenant lists. In jurisdictions with mandatory benchmarking requirements, such features can be used to support compliance and improve data quality.
47
Personal communication with Kevin Bricknell, Commonwealth Edison, September 20, 2012. 48
Presentation by Chris Thompson. “Energy Data and Benchmarking.” Energy Efficient Buildings Hub Regional Data Management Working Group Meeting, October 25, 2012. 49
Personal communication with Jayson Antonoff, Global Buildings Performance Network, January 11, 2013.
Utilities’ Guide to Data Access for Building Benchmarking
Report | IMT | 23
The authors of the 2012 CPUC report questioned the validity of a substantial portion of the dataset that the utilities provided for analysis of their benchmarking programs and deemed it was unsuitable for evaluation purposes—the dataset contained a much higher portion of very low and very high scores than would be expected. One proposal to mitigate this issue is for EPA to incorporate a checkbox into Portfolio Manager that a user could mark to indicate all the meters known to be associated with the building and all of the facility’s attributes had been successfully entered.50
Recommendation 6: Create resources for customers to walk them through the process.
How-to guides and step-by-step documents with pictures and diagrams are instrumental in creating a user-friendly system.
Recommendation 7: Consider how the tool can be used beyond benchmarking and facilitate better energy management.
An automated data exchange system’s benefits extend beyond a benchmarking score. To realize its potential as a gateway to other energy efficiency programs, a utility should also develop resources that lead customers to other energy efficiency programs.
PSE has found that demand for their tool is high—but users want and expect even more from the service. Specifically, customers ask for cost data and interval data. While cost data does not facilitate benchmarking, it would help building owners make the case to tenants for energy efficiency improvements and overcome the split incentive barrier. PSE is looking at various options for providing cost data through its benchmarking tool.51
Nevertheless, utilities should explore what level of data they can technically and legally provide and how the tool’s benefits can be expanded to go beyond benchmarking. Providing cost or more granular meter data are just two examples of what building owners would find helpful as they make energy efficiency improvements.
6. Ongoing Work
6.1 Green Button
Inspired by the idea that if consumers are armed with their energy usage information, they will make more informed energy decisions and save energy, Green Button is an industry-led effort responding to a White House-issued challenge to provide utility customers with convenient access to their energy usage data via a portal on a utility’s website. The Green Button “Download My Data” function allows users to download their monthly, daily, hourly, or 15-minute interval energy usage data, depending on what the utility can make available, as an XML file. Green Button “Connect My Data” is a mechanism for a customer to authorize a third-party service provider to automate access to their utility data.52
50
NMR Group. Statewide Benchmarking Process Report. Submitted to California Public Utilities Commission. April 2012. 51
Personal communication with Chris Thompson, Puget Sound Energy, February 5, 2013. 52
http://www.greenbuttondata.org/greenabout.html
Utilities’ Guide to Data Access for Building Benchmarking
Report | IMT | 24
The initiative establishes a standard data format for consumer-accessed utility data that maintains privacy and security. Standardizing the format creates a large-scale market for software developers and energy service providers to develop applications that empower the consumer to better use and understand their energy usage data. It also makes it easier for property owners with buildings in multiple regions to set a portfolio-wide data access and energy management goal.
Since Green Button launched in January of 2011, 35 utilities, serving 36 million households, have committed to or have already implemented Green Button.53 As a robust, open industry-embraced standard, Green Button facilitates the creation and utilization of applications (“apps”) that use utility consumption data as an input or output. In the last two years, a host of businesses large and small have created Green Button apps. Most apps are focused on the single-family market, but some serve the commercial market. Companies that serve the commercial buildings market have also committed to make their platforms Green Button-enabled. Some observers, including electric utility representatives, believe that there is much greater demand for utility consumption data for commercial and multifamily buildings than for single-family residential and that with Federal encouragement, the use of Green Button for commercial buildings and applications could dwarf its single-family use.
6.1.1 Integration with Portfolio Manager
Currently, most utilities provide electricity use data in the Green Button format for single-family homes or facilities that have a single meter. Green Button backers envision expanding Green Button to serve all American households and businesses and to facilitate benchmarking for commercial and multifamily buildings served by Portfolio Manager. In its present state, Green Button is not the ideal solution for data access for benchmarking: customers have to use a third-party conversion tool or manually enter their energy consumption data into Portfolio Manager, and it is focused on providing electricity data though there are a few utilities providing natural gas use data in the Green Button format. Furthermore, while it allows for data from an unlimited number of meters in a single record, it has only been used for single meters to date.
EPA and White House Council on Environmental Quality (WH CEQ) are considering providing a built-in tool to seamlessly import Green Button-formatted data into Portfolio Manager. EPA, WH CEQ, DOE, National Institute of Standards and Technology, and other Federal agencies should continue collaboration and quickly move forward on this incorporation. The White House should move as quickly as practical to help expand the use of Green Button to support gas, water and other utility data.
Integrating Green Button into Portfolio Manager provides many advantages as a solution to facilitating benchmarking. For utilities that have committed to Green Button, many are hesitant to pursue two types of data access program and see integration as more cost-effective. A standard format would make it easier for large property owners with buildings in areas served by different utilities to benchmark, as discussed in Section 3.1. A Green Button initiative would accelerate national momentum pushing enhanced data access and benchmarking.
There are other applications available that transfer Green Button data to Portfolio Manager. For example, Melon, an energy efficiency company, has developed a web-based tool for owners and managers of commercial properties.54 Third-party service providers who benchmark buildings on behalf
53
Ibid. 54
http://www.melonpower.com/product.html

Utilities’ Guide to Data Access for Building Benchmarking
Report | IMT | 25
of building owners could also enable their platforms to absorb energy consumption data in the Green Button format as well as convert data into the Green Button format.
6.2 Other Federal Efforts
6.2.1 DOE SEE Action Network’s “A Regulator’s Guide to Data Access for Commercial Building Energy Performance Benchmarking”
SEE Action Network, an effort led by DOE and EPA, will publish a resource titled “A Utility Regulator’s Guide to Data Access for Commercial Building Energy Performance Benchmarking.” It will be available in March 2013.
The paper makes the case for benchmarking for utilities and regulators and provides recommendations and key considerations and decision points for implementation of improved data access programs for the purpose of benchmarking for regulators and policymakers.
6.2.2 Code of Conduct
DOE Office of Electricity Delivery and Energy Reliability, along with the Federal Smart Grid Task Force, has assembled a multi-stakeholder group to produce a Voluntary Code of Conduct with a focus on customer data privacy practices for utilities and third party providers.
Utilities’ Guide to Data Access for Building Benchmarking
Appendix | IMT | 26
Appendix 1. Case Studies
ComEd’s Energy Usage Data System, Illinois
ComEd, an investor-owned electric utility serving 3.8 million electric customers in the greater Chicago and northern Illinois regions,55 rolled out its Energy Usage Data System (EUDS) in 2008. Prior to that date, ComEd handled energy data requests from building owners and management companies by providing the requested data in a spreadsheet on a one-off basis for a fee of about $600. About 70 owners or management companies in total received whole-building data, and it took ComEd about 10 to 12 days to respond to each request. In the fall of 2007, ComEd agreed to automate this process and selected Calico Energy Services to develop its EUDS. The program was funded by all commercial customers as a part of the “Market Transformation and Education” section in ComEd’s energy efficiency plan; the system cost about $300,000 to set up with an ongoing annual licensing and maintenance fee of $75,000.56 As a Market Transformation program for the commercial sector, ComEd does not have to attribute energy savings to or perform a cost-benefit analysis for the individual program.
Calico began work on the software in March 2008, and the system was complete by that summer and fully rolled out by October 2008. ComEd realized that a majority of the buildings in the Chicago area were separately metered and many had hundreds of tenants, so it was critical for the system to provide aggregated data. Building owners can use the system to receive aggregated data for buildings with at least 4 meters; for buildings with fewer meters, building owners must contact the benchmarking team.
A building owner or manager must contact their account manager (if they are a large commercial user) or ComEd to set up an account. They receive a unique user login; ComEd does not provide access for third-party service providers hired by building owners. The building owner needs to relay the user information if desired. The system automatically uploads whole-building data to Portfolio Manager (though users have the option to manually input data) within 24 hours of a request, and users can set either one-time or recurring data requests. Customers define buildings by inputting all of its service addresses. EUDS will then pull up a list of all of the open accountholders in the building, and the user must verify that the list includes all active tenants. A recent upgrade of the system has extended the service to single-tenant buildings, like stand-alone stores or restaurants.
As of October 2012, 582 building managers or owners have used EUDS for 3,283 individual buildings—an increase in demand of almost 4,600% since 2008.57 This surge cannot be attributed solely to the new data system. ComEd advertises the service and encourages customers to benchmark as a gateway to its other incentive programs.58 According to Kevin Bricknell, ComEd’s Program Manager of Marketing and Environmental Programs, ComEd is pleased with the benefits the service provides. EUDS is user-friendly and empowers customers—it saves building owners time and gives customers benchmarking scores,
55
https://www.comed.com/about-us/company-information/Pages/profile.aspx. 56
Presentation by Kevin Bricknell. “Energy Usage Data System.” Energy Efficient Buildings Hub Regional Data Management Working Group Meeting, October 25, 2012. 57
Ibid. 58
See https://www.comed.com/Documents/business-savings/fact-sheets/EUDS_FS.pdf for example marketing materials.
Utilities’ Guide to Data Access for Building Benchmarking
Appendix | IMT | 27
graphs, and reports to help building owners plan for, justify, and implement energy efficiency upgrades. ENERGY STAR even awarded ComEd its Special Recognition Award for Innovation in Customer Service in 2009 for its initiative. Without the automated service, ComEd would not be able to support all of the data requests it is currently receiving; the utility would need a staff of 40 or 50 people to manually respond to all of the requests.59
Puget Sound Energy’s Automated Benchmarking Service, Washington
Puget Sound Energy (PSE), a natural gas and electric utility located in Washington State, released its ABS in 2010 in response to mandatory benchmarking laws passed at the state level and in Seattle (PSE serves Seattle with electricity). The system, built as a compliance tool, was funded by the general budget,60 and was initially developed by an IT consulting firm.
To request whole-building data, a building owner must provide all of the meters and the last four digits of every account number in the building. If there are fewer than five accountholders in the building, users must provide tenant authorizations. Otherwise, building tenant data can be automatically uploaded. The interface is contained within Portfolio Manager and, after submitting identification and authorization forms, a building owner receives a one-time 24-month upload of aggregate consumption data within one or two days. A PSE employee must check that a building owner has submitted all of the necessary forms before verifying that the consumption data may be uploaded. PSE has pictures and how-to guides online to guide users through the process.61
Demand for the service is high, with over 6,000 participants since the service’s inception. However, customer satisfaction is mixed. The system requires a lot of data collection on the part of the building owner. Moreover, users in Seattle also need to access portals by the two other city utilities (Seattle City Light and Seattle Steam) to get all of their fuel consumption data to comply with Seattle’s benchmarking law, a process that users find difficult to navigate. Building owners also ask for more automation, a subscription service, and more granular data, including individual meter consumption and cost data. The process was built without much knowledge about customer demand or input from stakeholders or Washington Utilities and Transportation Commission (WUTC).
PSE is working on a new system to be released with the Portfolio Manager in 2013 that will likely be more customer-friendly, require users to collect less data, and feature a subscription service. Its goal for the new system is to look beyond benchmarking and create a link to other energy efficiency programs. To reflect this objective and the benefits inherent in the system, PSE will most likely fund the program as part of its energy efficiency portfolio.
The utility still has to determine how to overcome legal and technical challenges. It has identified the three greatest hurdles as: 1. How to respond to requests that are not necessarily from PSE customers, 2. privacy laws that are out-of-date or conflicting, and 3. The fact that the current utility infrastructure does not define a building (i.e., meters are not linked to addresses).
Department of Environmental Protection, New York
59
Interview of Kevin Bricknell, ComEd, September 20, 2012. 60
Presentation by Chris Thompson. “Energy Data and Benchmarking.” Energy Efficient Buildings Hub Regional Data Management Working Group Meeting, October 25, 2012. 61
See http://www.pse.com/accountsandservices/PropertyManagers/Pages/Automated-Benchmarking.aspx.
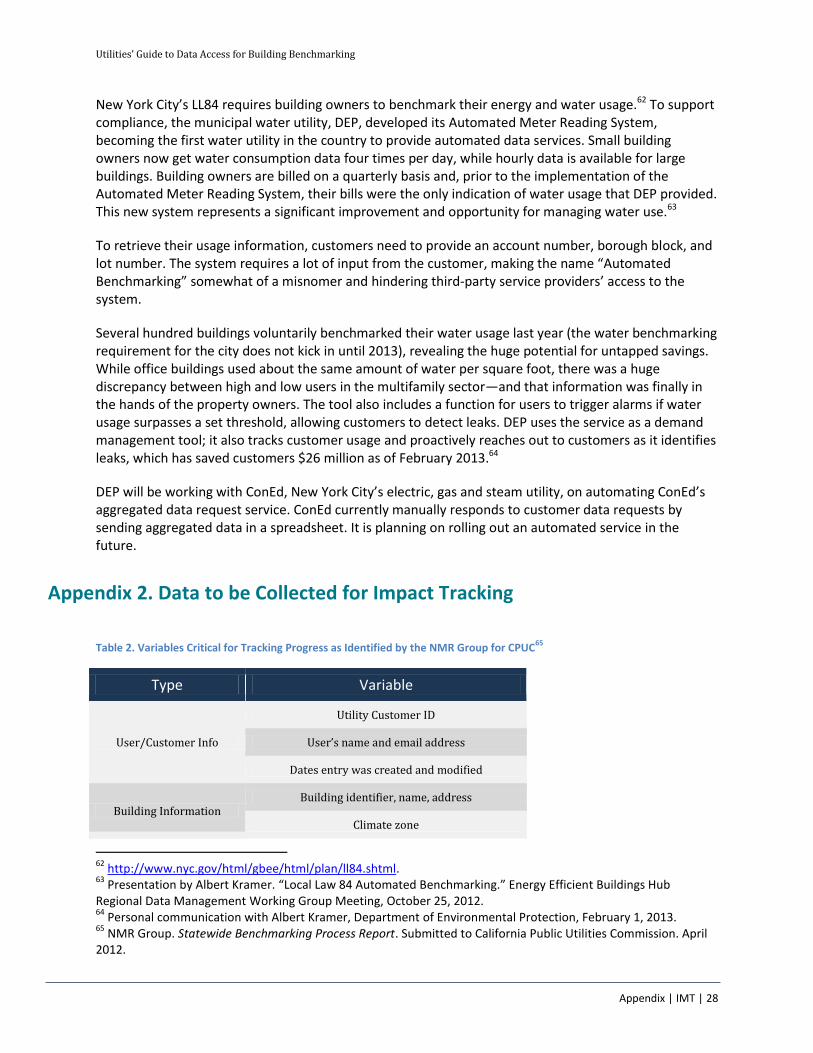
Utilities’ Guide to Data Access for Building Benchmarking
Appendix | IMT | 28
New York City’s LL84 requires building owners to benchmark their energy and water usage.62 To support compliance, the municipal water utility, DEP, developed its Automated Meter Reading System, becoming the first water utility in the country to provide automated data services. Small building owners now get water consumption data four times per day, while hourly data is available for large buildings. Building owners are billed on a quarterly basis and, prior to the implementation of the Automated Meter Reading System, their bills were the only indication of water usage that DEP provided. This new system represents a significant improvement and opportunity for managing water use.63
To retrieve their usage information, customers need to provide an account number, borough block, and lot number. The system requires a lot of input from the customer, making the name “Automated Benchmarking” somewhat of a misnomer and hindering third-party service providers’ access to the system.
Several hundred buildings voluntarily benchmarked their water usage last year (the water benchmarking requirement for the city does not kick in until 2013), revealing the huge potential for untapped savings. While office buildings used about the same amount of water per square foot, there was a huge discrepancy between high and low users in the multifamily sector—and that information was finally in the hands of the property owners. The tool also includes a function for users to trigger alarms if water usage surpasses a set threshold, allowing customers to detect leaks. DEP uses the service as a demand management tool; it also tracks customer usage and proactively reaches out to customers as it identifies leaks, which has saved customers $26 million as of February 2013.64
DEP will be working with ConEd, New York City’s electric, gas and steam utility, on automating ConEd’s aggregated data request service. ConEd currently manually responds to customer data requests by sending aggregated data in a spreadsheet. It is planning on rolling out an automated service in the future.
Appendix 2. Data to be Collected for Impact Tracking
Table 2. Variables Critical for Tracking Progress as Identified by the NMR Group for CPUC
65
Type Variable
User/Customer Info
Utility Customer ID
User’s name and email address
Dates entry was created and modified
Building Information Building identifier, name, address
Climate zone
62
http://www.nyc.gov/html/gbee/html/plan/ll84.shtml. 63
Presentation by Albert Kramer. “Local Law 84 Automated Benchmarking.” Energy Efficient Buildings Hub Regional Data Management Working Group Meeting, October 25, 2012. 64
Personal communication with Albert Kramer, Department of Environmental Protection, February 1, 2013. 65
NMR Group. Statewide Benchmarking Process Report. Submitted to California Public Utilities Commission. April 2012.
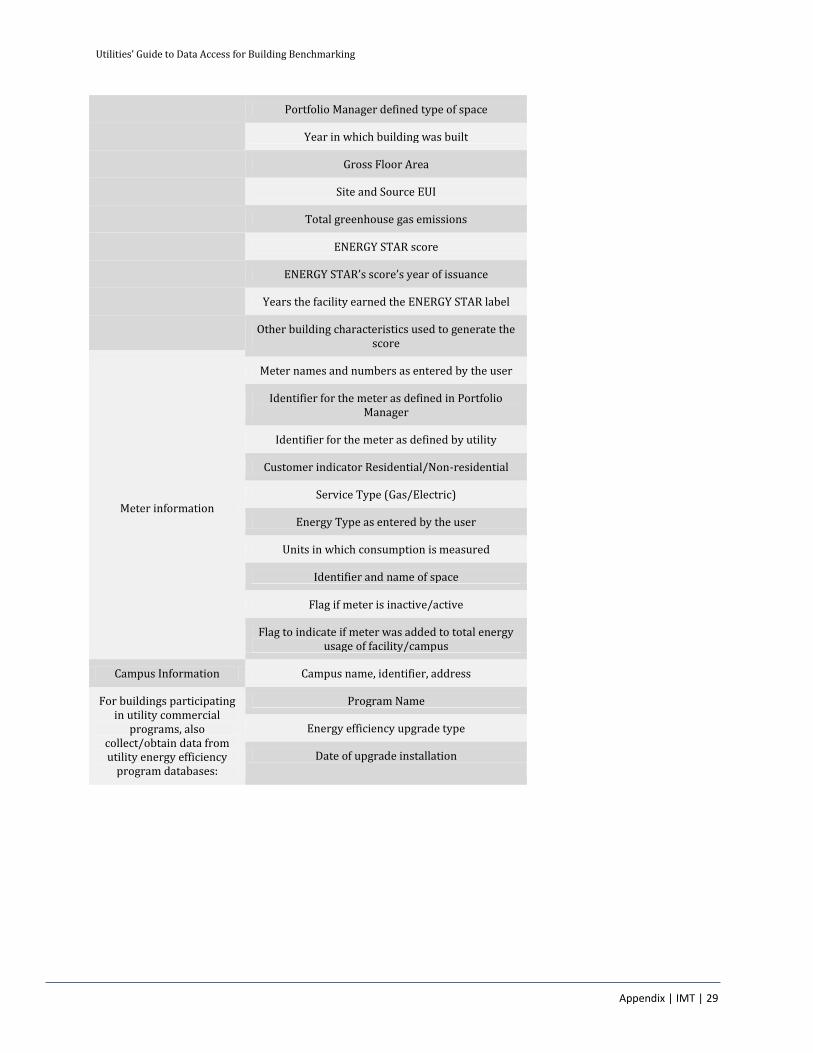
Utilities’ Guide to Data Access for Building Benchmarking
Appendix | IMT | 29
Portfolio Manager defined type of space
Year in which building was built
Gross Floor Area
Site and Source EUI
Total greenhouse gas emissions
ENERGY STAR score
ENERGY STAR’s score’s year of issuance
Years the facility earned the ENERGY STAR label
Other building characteristics used to generate the score
Meter information
Meter names and numbers as entered by the user
Identifier for the meter as defined in Portfolio Manager
Identifier for the meter as defined by utility
Customer indicator Residential/Non-residential
Service Type (Gas/Electric)
Energy Type as entered by the user
Units in which consumption is measured
Identifier and name of space
Flag if meter is inactive/active
Flag to indicate if meter was added to total energy usage of facility/campus
Campus Information Campus name, identifier, address
For buildings participating in utility commercial
programs, also collect/obtain data from utility energy efficiency
program databases:
Program Name
Energy efficiency upgrade type
Date of upgrade installation

Utilities’ Guide to Data Access for Building Benchmarking
Appendix | IMT | 30
Acknowledgements
IMT and the EEB Hub wish to acknowledge the following individuals for contributing their time and
expertise:
Laurie Actman, Energy Efficient Buildings Hub
Jayson Antonoff, Global Buildings Performance Network
Tom Bonner, PECO
Kevin Bricknell, ComEd
Jordana Cammarata, California Public Utility Commission
Leslie Cook, Environmental Protection Agency
Alex Dews, Philadelphia Mayor’s Office of Sustainability
David Farnsworth, Regulatory Assistance Project
Jaclyn Hood, Pacific Gas and Electric
Amanda Hurley, Institute for Market Transformation
Albert Kramer, Department of Environmental Protection
Tom Lyle, Opt Energy
Tracy Narel, Environmental Protection Agency
Monica Nevius, NMR Group
Chairman Rob Powelson, Pennsylvania Public Utility Commission
Curt Prudden, Southern California Edison
Stuart Reilly, Austin Energy
Paul Romano, Center for Building Knowledge, New Jersey Institute of Technology
Jennifer Senick, Rutgers Center for Green Buildings
Monisha Shaw, White House Council of Environmental Quality
Gary Suzuki, Southern California Edison
Cody Taylor, Department of Energy
Marla Thalheimer, Liberty Property Trust
Chris Thompson, Puget Sound Energy
Utilities’ Guide to Data Access for Building Benchmarking
Appendix | IMT | 31
About the Institute for Market Transformation (IMT)
The Institute for Market Transformation (IMT) is a Washington, DC-based nonprofit organization
promoting energy efficiency, green building, and environmental protection in the United States
and abroad. IMT’s work addresses market failures that inhibit investment in energy efficiency
and sustainability in the building sector. For more information, visit imt.org.
Report prepared by the Institute for Market Transformation,
March 2013