Dashboards: Interventions by Campus. Dashboards: Key Indicators.

Benchmarking and Dashboards for Boards
Liz Sipes, Western Washington University
Merrill P. Schwartz, AGB
Workshop for Board Professionals
March 2010

• How well are we using resources and performing
over time?
• How well are we using resources and performing relative
to peers?
• Are we performing at an acceptable level on this criterion?
• Which institutions are performing best on this criterion?
• Are practices of better performing institutions appropriate
for our institution?
• Can we perform better?
(Adapted from Bender and Schuh, 2002, p.1)
Benchmarking addresses questions such as:

Characteristics of Good Comparative Data
Provide a balanced view of the situation.
Identify issues and establish progress.
Relevant to strategically managed activities.
Sufficient and relevant to key issues.
Motivate the proper actions.
Reliable, timely, available and inexpensive.
Context provides interpretation
• Trends over time
• External Comparisons
• Internal comparisons
• Ideal standard or goal

What Are the Different Uses of
Comparative Data?
Accountability
• Accreditation
• Public reports
• Institution’s website
Fulfill Fiduciary Responsibilities
• Look at competitive situation
• Develop and Monitor Key Performance Indicators
• Monitor Red Flags
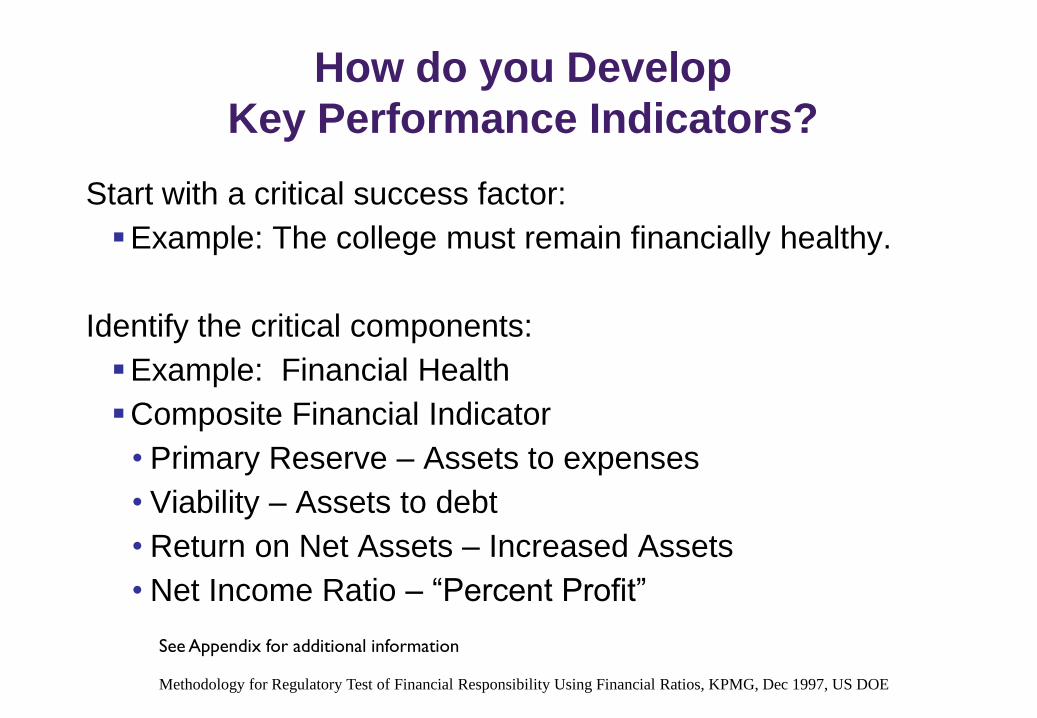
How do you Develop
Key Performance Indicators?
Start with a critical success factor:
Example: The college must remain financially healthy.
Identify the critical components:
Example: Financial Health
Composite Financial Indicator
• Primary Reserve – Assets to expenses
• Viability – Assets to debt
• Return on Net Assets – Increased Assets
• Net Income Ratio – “Percent Profit”
Methodology for Regulatory Test of Financial Responsibility Using Financial Ratios, KPMG, Dec 1997, US DOE
See Appendix for additional information

Where Can Publicly-Available Data Be Found?
General Data
IPEDS Peer Analysis System, http://www.nces.ed.gov/ipedspas/
AGB Benchmarking Service, data.agb.org
NSF WebCASPAR, http://www.nsf.gov/
U-CAN, NAICU, http://www.ucan-network.org/
VSA, AASCU & NASCLGC, http://www.collegeportraits.org/
Where Can Publicly-Available Data Be Found? (continued)
Endowment and Finance Data
NACUBO Endowment Study
CAE Voluntary Support of Education Data Miner
IPEDS Finance Survey
AGB Benchmarking Service
Delaware Study of Costs and Productivity
Moody's Municipal Financial Ratio Analysis

Where Can Publicly-Available Data Be Found? (continued)
Facilities
APPA Facilities Core Data Survey
SCUP Campus Facility Inventory
Salary and Benefits
AAUP Salary Survey
CUPA-HR DataOnDemand
IPEDS HR Survey
AGB Benchmarking Service
IRS 990, Guidestar
Tuition and Discounting
NACUBO Tuition Discounting Survey
See Appendix for additional information

Western Washington U KPIs

Enrollment KPIs

Strategic Indicators and
Comparative Data
Generated with the
AGB Benchmarking Service

Definition: Net Income Ratio

Net Income Ratio
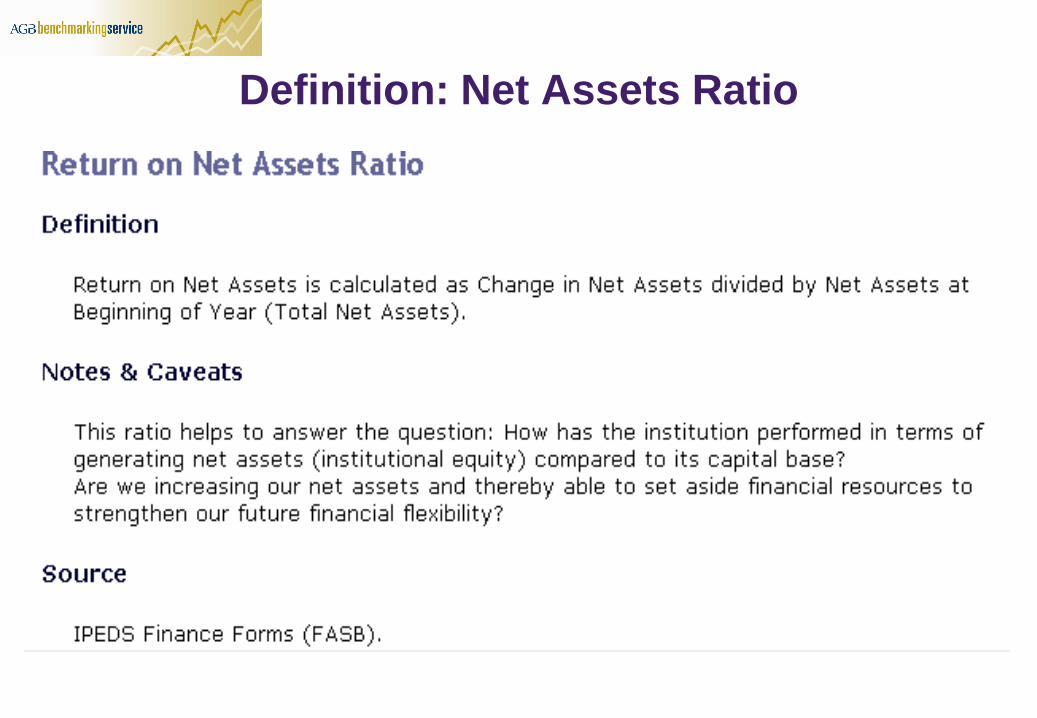
Definition: Net Assets Ratio

Return on Net Assets

Major Expenditures, Salaries & Wages IPEDS FASB AY2006-07
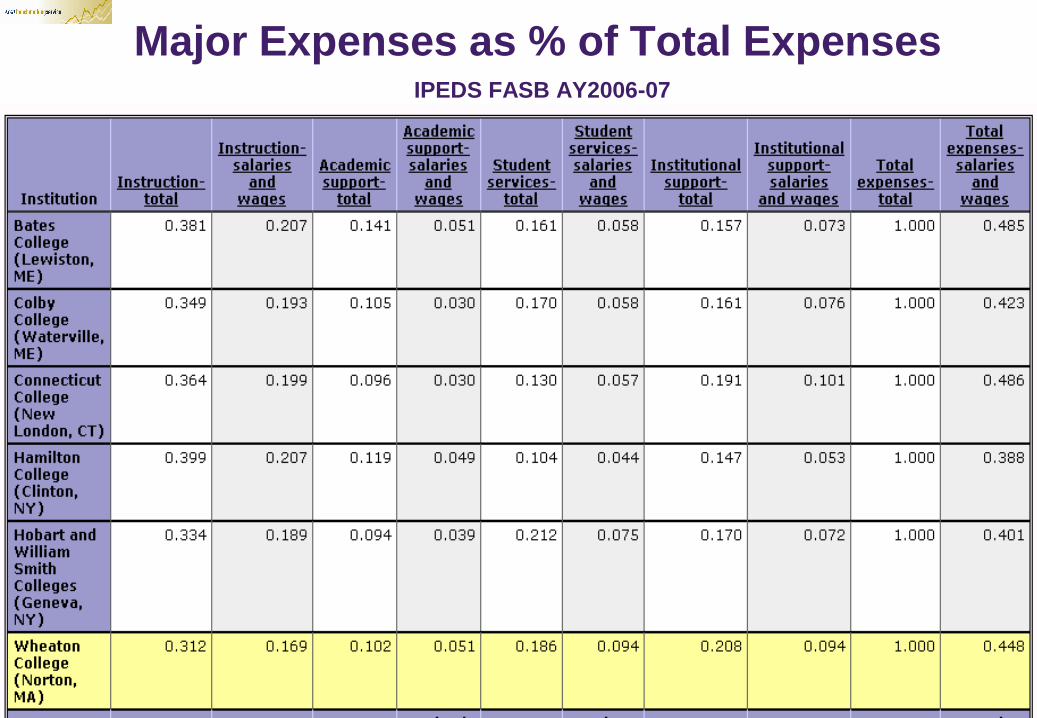
Major Expenses as % of Total ExpensesIPEDS FASB AY2006-07

IPEDS FASB
Two Examples of
College and University
Dashboards

Sample Comparative Peer Data for Enrollment and Aid
From “A Dashboard Report: Value Added Through Drill-Downs, Peer Comparisons, and Significance
Tests,” Mary M. Sapp, AVP, OPIR, Univ.ersity of Miami, SAIR 2005

Sample Trend Data on Key Performance Indicators
Adapted from Vital Signs, Wheaton College (MA) 2006.

Three Examples of Common
Key Performance Indicators (KPIs)

Core Performance Indicators
Burke and Minassians’s Suggested Core Performance Indicators:
Funding: State appropriations per FTE student
Affordability: Tuition minus financial aid as % median income
Participation: % HS graduates going to higher education
Degree attainment: Degrees awarded
Job placements: Jobs obtained by college graduates
College-school collaboration: % Fresh with college prep
Articulation: Transfers between 2- and 4-year institutions
Completion: 3 and 6 year graduation rates
Sponsored research: $ of external funding
Student development: Alumni survey on college value added
Burke and Minassians, NDIR, 116, 2002

Top Indicators In U.S. Higher Education
• Revenue Structure
– Source, Stability, Change
• Expenditure Structure
– Costs, Trends, Stability
• Current Fund Revenues/Current Fund Expenditures
• Institutional Selectivity vs. Institutional Yield
– % Applicants Accepted, % Accepted
Matriculated
• Faculty Workload (Academic Staff)
– FTE Students/FTE Faculty
Source: B. E. Taylor & W. F. Massey (1996). Strategic Indicators for Higher Education. Princeton, New Jersey: Peterson’s

North Central Association Operational Indicators
DemographicsStudent enrollment by level by FT/PT status.Faculty and staff counts.
Educational Programs Instructional spending per FTE Student. Credit hours by type of faculty.
Financial StrengthBond ratings.Financial Ratios.
Scope of ActivitiesList of distance education degrees.Collaborative Education.

Red flags are KPI outcomes or trends that indicate that
a problem might be developing or already has
developed!
Areas of Concern:
•Financial Assets
•Student Assets
•Learning Assets
•Staff Assets
Watch Out for Red Flags

Perhaps you should be concerned if:
Increasing cost of debt service
Current expenditures > Current revenues
Decreasing key revenue streams while expenditures
increase
Increasing student aid as proportion of tuition
Decreasing reserves to operating expenses
Increasing tuition discount rate
Decreasing major secondary revenue streams
Cost per FTE much greater than competitor
Decreasing business support of grad programs
Warning Signs - Financial Assets
Perhaps you should be concerned if:
Decreasing applicants or yield
Increasing difference in qualifications of accepted
not-enrolled & enrolled
Decreasing graduation/retention rates
Increasing number of students not returning
Decreasing % of students in top 10% of HS
Decreasing % of graduate students from top schools
Increasing enrollment losses to a competitor
Warning Signs – Student Assets
Warning Signs - Learning Assets
Perhaps you should be concerned if:
Increasing instruction costs compared to price
Increasing costs per credit hour
Increasing faculty salaries and benefits relative to
tuition revenue
Decreasing academic support $ per FTE student
Stagnating academic programs
Increasing faculty turn-over

Perhaps you should be concerned if:
Increasing staff to faculty ratio
Increasing ratio of Part-time to Full-time
Increasing staff turnover/terminations
Decreasing gender and ethnic diversity of senior staff
Increasing number of key employees > 60 yrs old
Increasing benefits cost relative to salary
Warning Signs - Staff Assets