Report: Risk management attitudes and behaviours in European public entities

Behaviours and Attitudes in the Management of Nonpoint Source Pollution:
Ping River Basin, Thailand
Wimolpat Bumbudsanpharoke
Doctor of Philosophy
The University of Edinburgh
2010

In memory of my father

DECLARATION
I hereby declare that this thesis is my own composition, that the work contained herein is my
own except where explicitly stated otherwise in the text, and that this work has not been
submitted for any other degree or professional qualification except as specified.
Parts of this work have been published as:
W. Bumbudsanpharoke, Moran, D., and Hall, C. (2009) Exploring perspectives of
environmental best management practices in Thai agriculture: an application of Q-
methodology. Environmental Conservation. 36(3), pp. 225-234.
W. Bumbudsanpharoke and C. Hall (2009) Identifying farmer attitudes towards best
Management Practices in Thailand. In: P. Sauer, and J. Sauerova (eds.) Environmental
Economics and Management: Young Scholars’ Perspective. Prague: Litomysl Seminar
Publishing, pp. 138-150.
W. Bumbudsanpharoke (2010) Perceptions of Best Management Practices on Thai Citrus
Farms and the Development of an Agri-Environmental Policy: A Case Study in the Ping
River Basin, Thailand. EEPSEA Technical report, Singapore: Economy and Environment
Program for Southeast Asia. 112 pp. Available at: http://www.idrc.ca/uploads/user-
S/12693989831Wimolphat_(TR)_-_Perceptions_on_Best_Management_Practices.pdf
Wimolpat Bumbudsanpharoke October 2010

i
ACKNOWLEDGEMENTS
This research is funded by the Agricultural Research Development Agency (public
organisation), Ministry of Agriculture and Cooperatives, Thailand. I would like to thank the
Economy and Environment Program for Southeast Asia for the award of doctoral fieldwork
in environmental and resource economics. I also wish to thank my current employer, the
Royal Irrigation Department, providing me with an opportunity to develop my professional
skills over the past four years.
Above all, I see myself very fortunate to have been under the supervision of Professor
Dominic Moran whom I met ten years ago, whilst studying my master’s degree. I would like
to express my sincere gratitude to my Professor Moran, whose encouragement, guidance and
support from the initial stages to the final level for enabling my broad development and in-
depth understanding of the subject. I would like to thank my second supervisor, Dr Alan
Renwick; my third supervisor, Dr Kate Heal; and the panels who gave me many helpful
suggestions during the development of the thesis.
I greatly acknowledge guidance and comments provided by Professor Dale Whittington,
University of North Carolina at Chapel Hill; Professor Vic Adamowicz, University of
Alberta; Dr Ted Horbulyk, University of Calgary; Dr Robert Hearne, North Dakota State
University; and Dr Herminia Francisco, Director of the Economy and Environment Program
for Southeast Asia. Their detailed and constructive comments provided me with a strong
basis for the thesis.
I give my special thanks to the citrus growers for their patience and willingness to join in the
survey. I would also express my gratitude to the staff at Department of Agricultural
Extension’s regional offices and Tambon Administrative Organisations for their varied
supports. My data collection, moreover, would have not been possible without the field
assistances from my colleagues, Thanakorn Jatawong, Sukhontharat Khamcheen, Arunee
Thongsakul, and Thomya Suwanpratum. The participation of the student enumerators from
Chiang Mai University, Payap University, and Nakhon Sawan Rajabhat University is also
appreciated.

ii
I would like to thank the librarians at Scottish Agricultural College, who responded promptly
to all the urgent requests I made. Thanks are also given to Clare Hall for her comments on
chapter six, to Dr Cesar Revoredo-Giha, Dr Andrew Barnes, and Alistair McVittie for their
advice and vast knowledge of statistical analysis, and to Donald Rutherford for his proof-
reading. I also wish to thank Donna Ewen for her secretarial help at various points in the last
four years.
I would like to thank the Khamkanya family for their support and hospitality during my
enduring journey over the last four years. I dedicate this thesis to my mother, my sisters, and
aunties, whom I love most. Without their wholehearted support throughout all my studies,
this thesis would have never been achieved.

iii
ABSTRACT
Agricultural nonpoint source pollution is recognised as a major cause of water pollution. The
characteristics of nonpoint source pollution suggest that an efficient approach should focus
on a source control and hence land-use management. Recently, the concept of Payments for
Ecosystem Services (PES) has been advanced as an efficient market-based approach to
protect in-stream water quality, while simultaneously supporting agriculture. Farmers can be
rewarded for the adoption of certain ‘Best Management Practices’ (BMPs) in farming
systems. But little is known about the adoption of BMPs in the context of Thai agriculture.
This thesis examines the adoption of twelve BMPs on citrus farms in the Ping river basin in
northern Thailand. In the context of potential PES development, three studies were
undertaken using frameworks from economics and psychology. The first study used
a bottom-up engineering approach to estimate economic costs of twelve BMPs at the farm-
scale. The total annualised costs, including installation, maintenance, and land opportunity
costs of each BMP were compared. The results indicated that land opportunity cost was the
largest proportion of total costs. These estimates provided a basis for discussion on how the
farmers’ perception of cost may influence their stated adoption intention.
The second study used the Theory of Planned Behaviour (TPB), to investigate farmers’
intentions on adoption of twelve BMPs. A survey of 218 citrus farmers was undertaken in
the application. Descriptive statistics and frequency of BMP selection were presented. The
results showed that soil analysis was the most preferred BMP. A graphical analysis of other
preferred measures suggested that these were not always consistent with the known cost
information derived (above) and thus farmers’ perceived costs might not be the most
important factor influencing adoption decisions.
Further analysis based on TPB investigated other factors thought to be significant in farmers’
decision-making. Other potential external and psychological factors influencing adoption
were investigated using a multinomial logistic model. The results indicated that the
probability of adopting BMPs was associated with other psychological factors and external
factors, rather than perceived costs. The significant psychological factors were farmers’

iv
attitudes towards consumers and perception about farm returns, while the significant external
factors were, for example, access to information and contribution of family labour to farm
workload.
The third study was based on the application of Q-Methodology, and aimed to obtain a
deeper understanding of farmers’ perception towards BMPs. Seventy two participants were
purposively selected from the 218 TPB observations. The results revealed four distinctive
farmer groups holding different perceptions towards BMPs. The four groups were
conservationist, traditionalist, disinterested, and risk-averse. These provided a specific
segmentation to guide policy towards influencing attitudes and behaviours. The results
suggested that farmers were not motivated solely by a profit maximisation goal.
Overall, key findings from these three studies revealed some fundamental requirements for
developing a water-related PES programme. These were: i) factors affecting eligibility to
participate; ii) factors affecting desire to participate; and iii) factors affecting ability to
participate. This information provided the basis for a set of recommendations addressing the
development of the water-related PES programme in the Ping river basin.

v
ABBREVIATIONS BAAC Bank of Agriculture and Agricultural Cooperatives
BIBOR Bangkok interbank offered rate
BMPs Best Management Practices
BOD Biochemical oxygen demand
BPP Beneficiary pays principle
BT Benefit transfer
CAC Command and control approach
CBA Cost Benefit Analysis
CEA Cost Effectiveness Analysis
CPR Common pool resource
Defra Department for Environment, Food and Rural Affairs
DOAE Department of Agricultural Extension
FAO The Food and Agriculture Organisation of the United Nations
GDP Gross domestic product
GBP Pound sterling
IIED International Institute for Environment and Development
MBIs Market-based instruments
MC Marginal cost
MFA Material Flow Analysis
MSC Marginal social cost
N Nitrogen
NEB National Environmental Board
NGO Non-governmental organisation
OAE Office of Agricultural Economics
OECD Organisation for Economic Cooperation and Development
ONEP Office of Natural Resources and Environmental Policy and Planning
P Phosphorous
PCD Pollution Control Department
PES Payment for ecosystem services
PPP Polluter pays principle
PWS Payment for watershed services
RID Royal Irrigation Department
SA Sensitivity Analysis

vi
SE Standard error
TACT Target, Action, Context and Time
TAOs Tambon (sub-district) Administrative Organisations
TDS Total dissolved solid
TEV Total economic value
THB Thai Baht
TPB Theory of Planned Behaviour
TRA Theory of Reasoned Action
US EPA United State Environmental Protection Agency
VIF Variance inflation factor
WTA Willingness to accept
WTP Willingness to pay

vii
CONTENTS
Acknowledgements i
Abstract iii
Abbreviations V
1 INTRODUCTION .......................................................................................................... 1
1.1 Background of the Study ........................................................................................................ 1 1.1.1 Overview of water pollution problems in Thailand ............................................... 1 1.1.2 Citrus production in the Ping River Basin ............................................................. 4 1.1.3 Best Management Practices (BMPs) on citrus farms............................................. 6
1.2 Research Objectives .............................................................................................................. 10 1.2.1 General statement ................................................................................................ 10 1.2.2 Objectives of the study ........................................................................................ 11
1.3 Research Methods .................................................................................................................. 11
1.4 Thesis Structure ...................................................................................................................... 13
2 RESEARCH RATIONALE AND METHODOLOGY REVIEW ............................ 16
2.1 A Global Perspective of Agricultural Nonpoint Source Pollution .................................. 17 2.1.1 An overview of water quality degradation ........................................................... 18 2.1.2 Water pollution: an economic perspective ........................................................... 20 2.1.3 Pollution control approaches ............................................................................... 26 2.1.4 Payments for watershed services ......................................................................... 33 2.1.5 A review of payment for watershed service studies ............................................ 40 2.1.6 A review of best management practices .............................................................. 43
2.2 Review of Methodologies ..................................................................................................... 47 2.2.1 Factors influencing farmer’s decision-making .................................................... 47 2.2.2 Roles of social psychological theories ................................................................. 51
2.3 Summary ................................................................................................................................. 54
3 FARM-LEVEL COST ANALYSIS ............................................................................ 55
3.1 Farm Budget of Citrus Production ....................................................................................... 56
3.2 Functions of BMPs ................................................................................................................ 58
3.3 Cost Statement of BMPs for Citrus Production in the Ping River Basin ....................... 63 3.3.1 Installation and Annual Maintenance Costs ........................................................ 64 3.3.2 Land Opportunity Costs ....................................................................................... 68
3.4 Annualised Costs .................................................................................................................... 69

viii
3.5 Discussion ............................................................................................................................... 73
3.6 Summary ................................................................................................................................. 73
4 A MODIFICATION OF THE THEORY OF PLANNED BEHAVIOUR ............... 75
4.1 Theory of Planned Behaviour .............................................................................................. 76 4.1.1 Basic TPB constructs and the concept of behavioural intention .......................... 76 4.1.2 Rank-ordering of the options ............................................................................... 78 4.1.3 Construction of psychological variables .............................................................. 81 4.1.4 Additional variables ............................................................................................. 83 4.1.5 Questionnaire development ................................................................................. 92 4.1.6 Fieldwork administration ..................................................................................... 92
4.2 Descriptive Results ................................................................................................................ 98 4.2.1 Descriptive statistics ............................................................................................ 99 4.2.2 Comparative differences .................................................................................... 108
4.3 Summary ............................................................................................................................... 113
5 OBSERVATION OF STATED ADOPTION INTENTIONS ................................. 115
5.1 Perceived Costs vs. Stated Intention ................................................................................. 116 5.1.1 Graphical interpretation ..................................................................................... 116 5.1.2 How perceived costs may affect stated intentions ............................................. 118
5.2 Multinomial Logistic Regression Analysis ...................................................................... 121 5.2.1 Logistic regression analysis for adoption intentions .......................................... 122
5.3 Discussion ............................................................................................................................. 131 5.3.1 Influence of perceived cost on stated adoption intentions ................................. 131 5.3.2 Influences of psychological determinants on stated adoption intentions ........... 132 5.3.3 Influences of external determinants on adoption intentions .............................. 133
5.4 Summary ............................................................................................................................... 136
6 SUBJECTIVE POSITION ......................................................................................... 138
6.1 Attitudinal segmentation ..................................................................................................... 139
6.2 Concourse Development and Establishing the Q-sample .............................................. 142
6.3 Administering the Q-sort .................................................................................................... 144
6.4 Data Analysis ........................................................................................................................ 145
6.5 Results ................................................................................................................................... 145 6.5.1 Interpreting factor arrays ................................................................................... 145 6.5.2 Consensus statement .......................................................................................... 152
6.6 Discussion ............................................................................................................................. 152

ix
6.7 Summary ............................................................................................................................... 153
7 KEY FINDINGS AND POLICY IMPLICATIONS ................................................ 155
7.1 Summary of Findings .......................................................................................................... 156 7.1.1 Key findings from the independent studies ....................................................... 156 7.1.2 Methodological findings .................................................................................... 166
7.2 Widening the PES Perspective and Contributions to Policy .......................................... 168 7.2.1 Commodity ........................................................................................................ 168 7.2.2 Institutional arrangements .................................................................................. 169 7.2.3 Payment mechanism .......................................................................................... 175
7.3 Policy Implications .............................................................................................................. 177 7.3.1 Prerequisite conditions for PES programmes .................................................... 177 7.3.2 Conditioning supply responses .......................................................................... 179
7.4 Nonpoint Source Pollution Management: What can be learned from the Ping river basin case? ............................................................................................................................ 181
7.5 Limitations and Recommendations for Methodological Improvement ........................ 184 7.5.1 Endogenous determinants in a psychology model ............................................. 184 7.5.2 Generalisation of the adoption model ................................................................ 185 7.5.3 The incorporation of cost in the model .............................................................. 185 7.5.4 The applicability of Q results ............................................................................. 186
7.6 Recommendations for Future Research: BMP Uptake within a Cost-Benefit Framework ............................................................................................................................ 188
References 197 Annexes
Annex 1: Current payment for watershed services programmes 221 Annex 2: Cost worksheet 225 Annex 3: Cost estimates of a mix-load and wash-down site 230 Annex 4: Questions for elicitation study 233 Annex 5: Final questionnaire 236 Annex 6: Illustrations for presentation 244 Annex 7: Forward stepwise method to select psychological variables (SPSS 16.0) 250 Annex 8: Forced entry method (SPSS 16.0) 252 Annex 9: Q-Sample 258 Annex 10: Results from PQMETHOD 259 Annex references 266

x
LIST OF FIGURES Figure 1-1: Ping river (left) and density of citrus cultivation (rai) (right) ............................... 4Figure 1-2: Cultivation system in upstream area (left) and downstream area (right) .............. 5Figure 1-3: Data matrix to categorise BMPs ........................................................................... 8Figure 1-4: Stand-alone objectives and contribution values for policy implications ............. 12Figure 1-5: Thesis structure ................................................................................................... 14Figure 2-1: Thesis structure ................................................................................................... 17Figure 2-2: Natures of goods and services ............................................................................. 20Figure 2-3: Negative externality (left); Positive externality (right) ....................................... 22Figure 2-4: Property rights and market failure ....................................................................... 23Figure 2-5: Logic of payment for ecosystem services: i) decreased returns (left); and ii)
increased costs (right) .......................................................................................... 31Figure 2-6: Types of intermediary-based transaction in developing countries (left) and
developed countries (right) (%) .......................................................................... 43Figure 3-1: Thesis structure ................................................................................................... 55Figure 3-2: Irrigation system in the downstream area of the Ping river basin ....................... 59Figure 3-3: Proportion of installation cost and annual maintenance cost (%) ....................... 68Figure 3-4: Economic cost of BMPs (at 13% discount rate) ................................................. 72Figure 4-1: Thesis structure ................................................................................................... 75Figure 4-2: Basic TPB model ................................................................................................ 76Figure 4-3: The TPB model ................................................................................................... 84Figure 4-4: Distribution of sample by area ............................................................................ 96Figure 4-5: Mean of attitude direct measures by location; scores are ranged from 1 to 7 ... 104Figure 4-6: Mean of subjective norm direct measures by location; scores are ranged from 1
to 7 ..................................................................................................................... 104Figure 4-7: Mean of perceived behavioural control direct measures by location; scores are
ranged from 1 to 7 .............................................................................................. 104Figure 4-8: Mean of indirect measures ................................................................................ 105Figure 5-1: Thesis structure ................................................................................................. 115Figure 6-1: Thesis structure ................................................................................................. 138Figure 6-2: Survey tools ....................................................................................................... 144Figure 7-1: Thesis structure ................................................................................................. 155Figure 7-2: Marketing channels ........................................................................................... 160Figure 7-3: Main characteristics of each group and consensus area .................................... 162Figure 7-4: Key findings, contributions to methodology and policy implications .............. 167Figure 7-5: Criteria to define prospective buyers, sellers and an intermediary ................... 171Figure 7-6: Impact pathway of policy change ..................................................................... 188Figure 7-7: Continuum of accuracy for BT analysis ............................................................ 192Figure 7-8: From ecosystem processes and final services to economic goods .................... 193

xi
LIST OF TABLES
Table 1-1: Surface water quality standard ............................................................................... 2Table 1-2: Experience with economic incentive measures in Thailand ................................... 3Table 1-3: Planted area of crops with significant level of hazard pollution ............................ 3Table 1-4: Major BMP groups and objectives ......................................................................... 7Table 1-5: Descriptions of selected BMPs ............................................................................... 9Table 2-1: Comparisons between point and nonpoint source pollution ................................. 18Table 2-2: Relative importance of pollutant concentrations .................................................. 19Table 2-3: Bundles of rights associated with right holders .................................................... 24Table 2-4: Scale of influences of four ecosystem services .................................................... 34Table 2-5: Converting watershed services into commodities ................................................ 36Table 2-6: Current traded commodities ................................................................................. 40Table 2-7: Market drivers for PWS programme .................................................................... 41Table 2-8: Potential payment mechanisms ............................................................................ 42Table 2-9: Differences in assumptions between the economic model and psychological
model ................................................................................................................... 50Table 3-1: Cost structure in citrus production ....................................................................... 57Table 3-2: Cost components of BMPs (Year 2007) ............................................................... 64Table 3-3: Expected lifespan for Vegetative and Structural Practices ................................... 70Table 3-4: Annualised cost estimates for twelve BMPs ........................................................ 71Table 4-1: Psychological variables ........................................................................................ 82Table 4-2: Types of statement and corresponding question numbers .................................... 83Table 4-3: Additional variables ............................................................................................. 85Table 4-4: Sampling frame .................................................................................................... 94Table 4-5: Sample distributions and interviews achieved by area ......................................... 95Table 4-6: Characteristics of citrus farmers ........................................................................... 99Table 4-7: Psychological characteristics of citrus farmers .................................................. 102Table 4-8: Selection of BMPs .............................................................................................. 107Table 4-9: Mann-Whitney test of external variables ............................................................ 109Table 4-10: Mann-Whitney test of psychological variables ................................................ 111Table 5-1: Descriptions of DUMMY variables ................................................................... 124Table 5-2: Summary of forward stepwise procedure ........................................................... 128Table 5-3: Final model selected by forward stepwise method ............................................. 129Table 5-4: Combined model with psychological variables and external variables .............. 129Table 6-1: A two-dimensional matrix for statement categorisation ..................................... 143Table 6-2: Factor Q-sort value (-4 to 4) for each statement ................................................. 146Table 7-1: Summarisation of characteristics and concerns from BMP adoption for each
farmer group ....................................................................................................... 163Table 7-2: Design of PES programme ................................................................................. 178

1
1 INTRODUCTION
1.1 Background of the Study
1.1.1 Overview of water pollution problems in Thailand
A decade of economic expansion in Thailand has changed the country from being one of the
most resource-abundant countries to being one of the most resource-constrained. A variety of
environmental problems are increasing pressures on natural resources. As a result, the
Pollution Control Department (PCD) was established in 1992 under the Royal Decree on
Organisational Division of Pollution Control Department, Ministry of Science, Technology
and Environment B.E. 2535 (1992) (Enhancement and Conservation of the National
Environment Quality Act B.E. 1992). PCD’s mission is to protect human health, and to
safeguard the natural environment upon which life depends. The Enhancement and
Conservation of the National Environment Quality Act B.E. 1992 is the cornerstone of
environmental protection in Thailand. The World Bank (2000) revealed severe cases of
water quality degradation. A report by the World Bank in 2000 showed that 37% of surface
water bodies in Thailand were classified as low quality. The Bank estimated that water and
air pollution costs amounted to between 1.6% and 2.6% of Thailand’s GDP (The World
Bank 2004). Accordingly, the government has been heavily investing on water pollution
abatement and control, and more than 40% of environmental budget have been spent to
water pollution management (PCD 2005).
The major sources of water pollution in Thailand are domestic sewage, industrial effluents
and agricultural runoff. Agricultural activity is the third largest source of water pollution,
behind urban pollution and industry (FAO 2006). PCD (2005) has identified three main
agricultural activities generating nonpoint source pollution to watercourses. These are
livestock, coastal aquaculture, and plantations. To protect water bodies from pollutants, the
government has established the ambient water quality standards mandated by the
Enhancement and Conservation of the National Environment Quality Act B.E. (1992).
Surface water quality standards are divided into five classes according to the major
beneficial uses (The Royal Government Gazette 1994) (Table 1-1).

2
Table 1-1: Surface water quality standard
Classification Objectives/ Conditions and beneficial use Class I Extra clean water used for conservation purposes Class II Very clean water used for: - Consumption which requires ordinary water treatment process before use - Aquatic organism of conservation - Fisheries - Recreation Class III Medium clean water used for: - Consumption, but passing through an ordinary treatment process before
using - Agriculture Class IV Fairly clean water used for: - Consumption, but requires special water treatment process before using - Industry Class V The sources which are not classified in the above mentioned classes and can be
used only for navigation Source: The Royal Government Gazette (1994)
Influenced by the polluter pays principle (PPP), the government has put in place policies,
plans, and water quality standards in an effort to combat water pollution. The emergence of
pollution management policies in Thailand has increased in response to environmental
conditionality linked to low interest loans from interested development agencies. The
Enhancement and Conservation of the National Environment Quality Act B.E. (1992)
applies laws and regulations for utilising environmental technologies, and mainly focuses on
point source pollution control (Akihisa 2008).
Concern over nonpoint source pollution was publicly aired in the late 1990s (Tonmanee and
Kanchanakool 1999). Current measures to manage nonpoint source pollution from
agricultural sectors are effluent charges, an environment fund1, subsidies, and a certification
scheme (Table 1-2). Recently, PCD is considering the role of Best Management Practices
(BMPs) as tools to control agricultural nonpoint source pollution at the watershed level
(Water Quality Management Bureau 2006). PCD (2006) conducted a study investigating
threats to water quality presented by farming activities in Thailand with a particular
reference to surface water2
.
1 The environmental fund was established under the Enhancement and Conservation of National
Environmental Quality Act of 1992. It functions as a financial measure supporting grants and loans to environmental polluters. Major sources of funding are from state governments through the fuel oil fund, and international loans.
2 The threats to water quality are evaluated by the significance of planted area, and application rate of
chemicals.
3
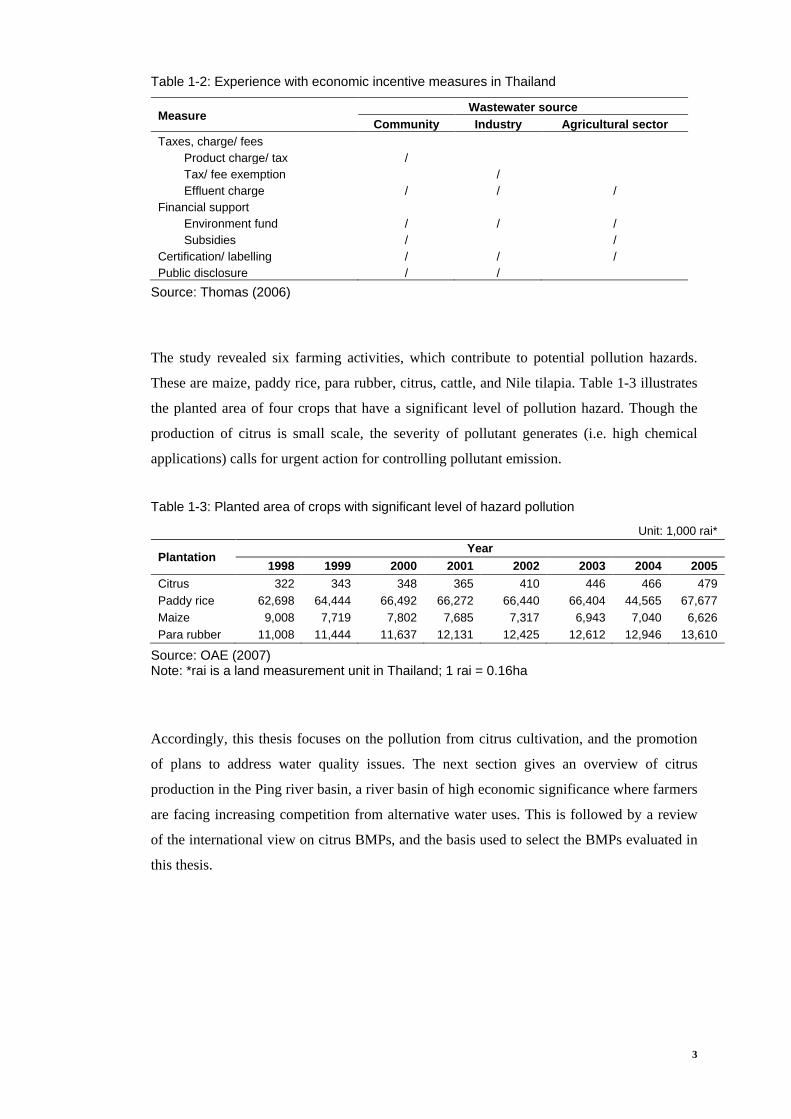
Table 1-2: Experience with economic incentive measures in Thailand
Measure Wastewater source
Community Industry Agricultural sector Taxes, charge/ fees Product charge/ tax / Tax/ fee exemption / Effluent charge / / / Financial support Environment fund / / / Subsidies / / Certification/ labelling / / / Public disclosure / /
Source: Thomas (2006)
The study revealed six farming activities, which contribute to potential pollution hazards.
These are maize, paddy rice, para rubber, citrus, cattle, and Nile tilapia. Table 1-3 illustrates
the planted area of four crops that have a significant level of pollution hazard. Though the
production of citrus is small scale, the severity of pollutant generates (i.e. high chemical
applications) calls for urgent action for controlling pollutant emission.
Table 1-3: Planted area of crops with significant level of hazard pollution
Unit: 1,000 rai*
Plantation Year
1998 1999 2000 2001 2002 2003 2004 2005 Citrus 322 343 348 365 410 446 466 479 Paddy rice 62,698 64,444 66,492 66,272 66,440 66,404 44,565 67,677 Maize 9,008 7,719 7,802 7,685 7,317 6,943 7,040 6,626 Para rubber 11,008 11,444 11,637 12,131 12,425 12,612 12,946 13,610
Source: OAE (2007) Note: *rai is a land measurement unit in Thailand; 1 rai = 0.16ha
Accordingly, this thesis focuses on the pollution from citrus cultivation, and the promotion
of plans to address water quality issues. The next section gives an overview of citrus
production in the Ping river basin, a river basin of high economic significance where farmers
are facing increasing competition from alternative water uses. This is followed by a review
of the international view on citrus BMPs, and the basis used to select the BMPs evaluated in
this thesis.

4
1.1.2 Citrus production in the Ping River Basin
The Ping river basin is the major watershed in northern Thailand (Figure 1-1; left). The basin
is strategically important in terms of its upstream location, population density, economic
integration, and as a cultural centre (Thomas 2006). The headwaters of the Ping river are in
Chiang Dao district, Chiang Mai province, and it stretches to Nakorn Sawan province in the
central area of Thailand. The Ping river basin covers an area of 33,898 km2. It is divided into
upper and lower portions at the Bhumibol Dam in Tak province. The upper Ping contains 15
sub-basins, while the lower portion comprises eight sub-basins. According to the surface
water quality standard, the Ping river is classified as class III (PCD 2005). The Ping river
basin is one of the four upper tributary basins forming the Chao Phraya river system, the
most important river basin in Thailand. Functioning as the upstream of the Chao Phraya river
basin, the Ping river is viewed as an area to be protected from any activity that would
threaten water consumption downstream.
Figure 1-1: Ping river (left) and density of citrus cultivation (rai) (right)
5
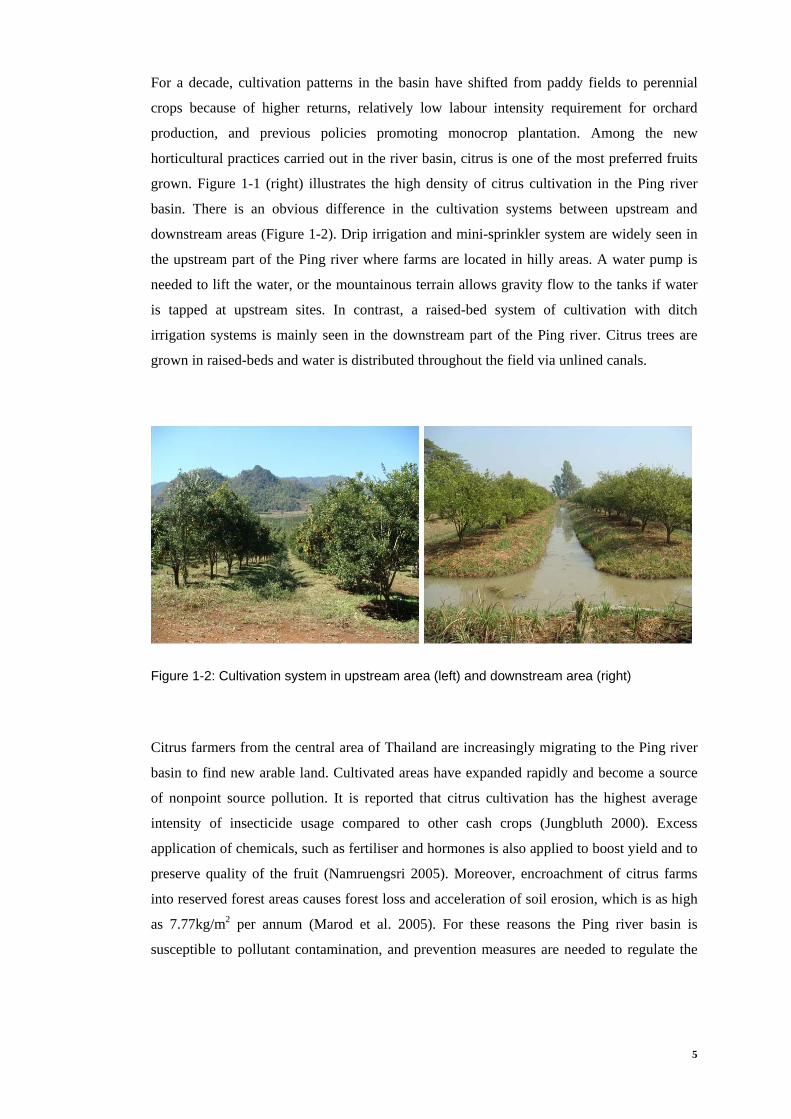
For a decade, cultivation patterns in the basin have shifted from paddy fields to perennial
crops because of higher returns, relatively low labour intensity requirement for orchard
production, and previous policies promoting monocrop plantation. Among the new
horticultural practices carried out in the river basin, citrus is one of the most preferred fruits
grown. Figure 1-1 (right) illustrates the high density of citrus cultivation in the Ping river
basin. There is an obvious difference in the cultivation systems between upstream and
downstream areas (Figure 1-2). Drip irrigation and mini-sprinkler system are widely seen in
the upstream part of the Ping river where farms are located in hilly areas. A water pump is
needed to lift the water, or the mountainous terrain allows gravity flow to the tanks if water
is tapped at upstream sites. In contrast, a raised-bed system of cultivation with ditch
irrigation systems is mainly seen in the downstream part of the Ping river. Citrus trees are
grown in raised-beds and water is distributed throughout the field via unlined canals.
Figure 1-2: Cultivation system in upstream area (left) and downstream area (right)
Citrus farmers from the central area of Thailand are increasingly migrating to the Ping river
basin to find new arable land. Cultivated areas have expanded rapidly and become a source
of nonpoint source pollution. It is reported that citrus cultivation has the highest average
intensity of insecticide usage compared to other cash crops (Jungbluth 2000). Excess
application of chemicals, such as fertiliser and hormones is also applied to boost yield and to
preserve quality of the fruit (Namruengsri 2005). Moreover, encroachment of citrus farms
into reserved forest areas causes forest loss and acceleration of soil erosion, which is as high
as 7.77kg/m2 per annum (Marod et al. 2005). For these reasons the Ping river basin is
susceptible to pollutant contamination, and prevention measures are needed to regulate the

6
discharge of pollutants into waterways. Recently, PCD has initiated the use of BMPs to
control pollution at the farm level (Water Quality Management Bureau 2006). The next
section gives an overview of citrus BMPs, and discusses the criteria to select BMPs for this
thesis.
1.1.3 Best Management Practices (BMPs) on citrus farms
Improperly managed agricultural activities in citrus farms such as overuse of pesticides and
nutrients, insufficient soil erosion control and inappropriate water resource management
have substantially affected water quality (PCD 2005; US EPA 2000; Tonmanee and
Kanchanakool 1999). The discharge of nonpoint source pollution is unobservable due to its
characteristics. Therefore, the best alternative to control this pollution is to manage the
source and delivery of pollutants by restricting them from contacting watercourses, or a
source management approach (Loehr 1984). Global experience suggests that there is a
general regulatory preference for voluntary behavioural changes rather than more punitive
measures or more administratively complex economic incentive measures (Yeager 2007;
Segerson and Wu 2006; Woodhead et al. 2004). One of the solutions to the pollution
problem lies in finding adequate management techniques often called Best Management
Practices (BMPs).
BMPs are farm-scale management practices to control the generation and delivery of
pollutants into water resources. BMPs are widely introduced in order to intercept pollutants
before entering watercourses. Concerns over nonpoint source pollution abatement to improve
water quality have been gradually changed from programme-by-programme, source-by-
source, and pollutant-by-pollutant methods, to more holistic watershed-based strategies (Ioris
2004; Helmer and Hespanhol 1997). The history of BMPs development includes recognition
of a potential water quality problem, identification of alternative management solutions,
adoption of practical BMPs, implementation of the BMPs and monitoring the success of the
adoption (Ice 2004). The United States has recognised the problem of diffuse pollution from
citrus cultivation for many years, and established a regional programme of action to address
the issue (Parsons and Boman 2006; Florida Department of Consumer Services 2005; 2004;
US EPA 2000). The BMP concept, as developed in the United States, therefore provides a
list of measures for citrus farming.

7
Recent concerns with environmental health in a watershed have highlighted the need for
citrus farmers to minimise the adverse effects of their farm operations. In general, the most
pressing concerns identified as injurious to watershed are sufficient amount of water supply,
sediment transport, pesticides, nutrients and aquatic plants. The major groups of BMPs and
their main objectives are presented in Table 1-4. BMPs are operational procedures that are
normally introduced to farmers as a total package. However, not all BMPs are applicable to
any particular citrus operation. Therefore, prior to adoption of any BMP the issue of BMP
applicability should be considered.
Table 1-4: Major BMP groups and objectives
BMP groups Objectives
Water supply Minimise off-site discharges after excessive rainfall
Sediment transport Minimise the movement of sediment off-site
Pesticides Minimise the off-site transport of pesticides and metals
Nutrients Minimise the movement of nutrients off-site Source: adapted from US EPA (2000)
The question is how to define and select BMPs for the evaluation in this thesis, and to what
extent the selected BMPs might be applicable in the Ping river basin. In order to set standard
on the selection of BMPs, the author assembled a set of what might be termed as
‘benchmark’ reference documents. Literature search was conducted, and sources of
information were from the US EPA (2000), Florida Department of Agriculture and
Consumer Services (2004; 2005), and Parsons and Boman (2006). The complexity in BMP
selection dealt with the breadth of practices and their effectivenesses. These issues are
beyond the personal judgement of the authors, and the selection was undertaken in
consultation with academics and representatives from government agencies.
To do this, BMPs from the benchmark studies were listed and presented to the experts3
3 The expert panels included i) Dr Sanchai Tantayaporn, former Deputy Secretary-General,
Deparment of Agriculture; ii) Assoc Prof Dr Charlie Navanugraha, Faculty of Environment and Resource Studies, Mahidol Univeristy; iii) Wit Namruengsri, Horticultural Research Institute, Department of Agriculture; iv) Pornsiri Kanayai, Royal Irrigation Department; and v) two anonymous government officials.
. A
data matrix (Figure 1-3) was used to categorise BMPs. The matrix consisted of two
dimensions, which were purposes of BMPs adoption and functional categories of BMPs. The

8
purposes of adoption were classified into four groups, and were: water resource
management; erosion control and sediment management; pest management; and nutrient
management. The functional categories represented BMP management approach, and were:
Good Husbandry; Vegetative Practice; and Structural Practice.
Purposes of BMP adoption Functional categories of BMPs
Good Husbandry Vegetative Practice Structural Practice Water resource management Erosion control & sediment
management
Pest management Nutrient management
Figure 1-3: Data matrix to categorise BMPs
The next step was a BMP selection. In general, effectiveness is an important criteria in the
selection of BMP. However, in this thesis neither field experiment nor simulation model was
done to examine BMP efficiency. As such, information of the effectiveness of all BMPs in
terms of key pollution variables (e.g. BOD, N and P) is not available. Rather, a broader array
of BMPs from literature was identified as appropriate for managing citrus farm pollultion.
The experts then evaluated and selected BMPs based on other four criteria.
First, to gain farmers’ acceptance the selected BMPs should have a low cost especially
installation costs such as materias and labours. Second, the selected BMPs should be easy to
implement. This means that the technology is not complex and does not dramatically change
farmers’ routine practices. Third, the selected BMPs should be feasible and practical. There
should not be any physical constraints at the site that may restrict or preclude the use of
BMPs. Forth, a regular maintenance for selected BMPs should not be costly regarding who
should responsible for the maintenance and what equipment is required to perform the
maintenance. Additionally, it should be noted that most of the experts are policymakers who
are apt to know applicable national policies regarding the implementation of BMPs.
Accordingly, to a degree, the selection of BMPs is based on the likeliness that they will be
promoted in the Ping river basin.
Based on the expert judgement, the short list in each of the categories was decided, and
twelve measures were selected for the analysis. Table 1-5 outlines the final twelve BMPs.
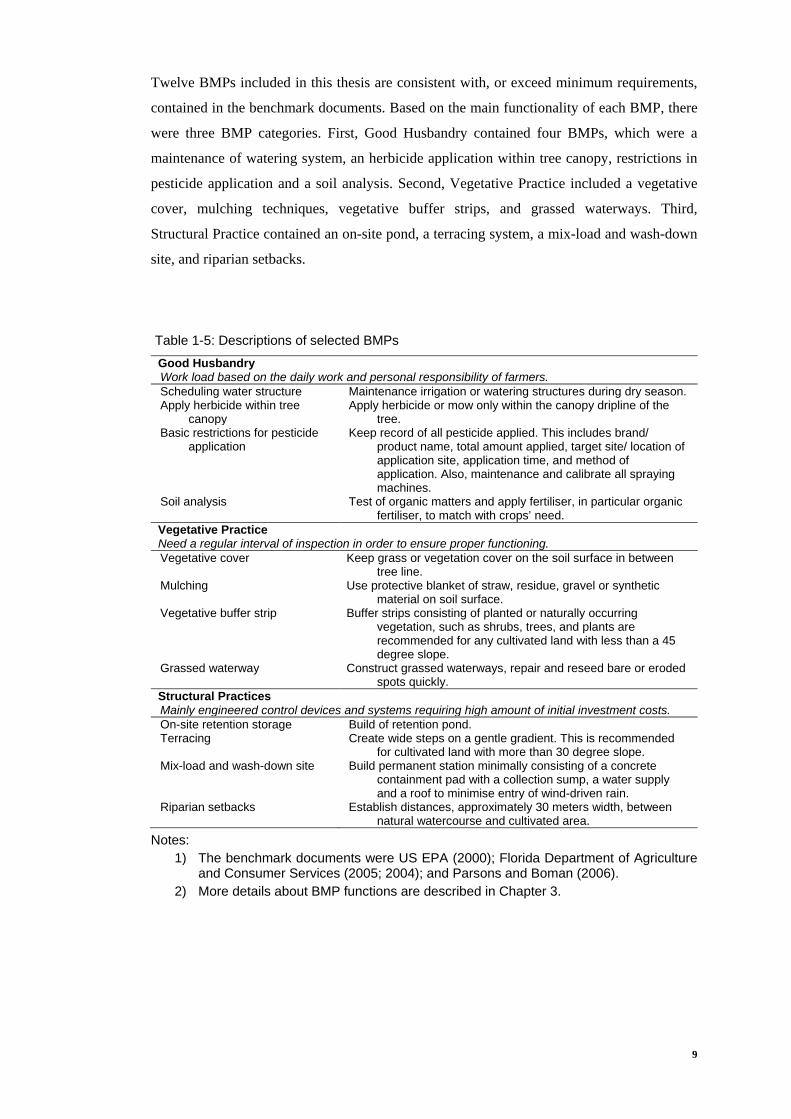
9
Twelve BMPs included in this thesis are consistent with, or exceed minimum requirements,
contained in the benchmark documents. Based on the main functionality of each BMP, there
were three BMP categories. First, Good Husbandry contained four BMPs, which were a
maintenance of watering system, an herbicide application within tree canopy, restrictions in
pesticide application and a soil analysis. Second, Vegetative Practice included a vegetative
cover, mulching techniques, vegetative buffer strips, and grassed waterways. Third,
Structural Practice contained an on-site pond, a terracing system, a mix-load and wash-down
site, and riparian setbacks.
Table 1-5: Descriptions of selected BMPs
Good Husbandry Work load based on the daily work and personal responsibility of farmers. Scheduling water structure Maintenance irrigation or watering structures during dry season. Apply herbicide within tree
canopy Apply herbicide or mow only within the canopy dripline of the
tree. Basic restrictions for pesticide
application Keep record of all pesticide applied. This includes brand/
product name, total amount applied, target site/ location of application site, application time, and method of application. Also, maintenance and calibrate all spraying machines.
Soil analysis Test of organic matters and apply fertiliser, in particular organic fertiliser, to match with crops’ need.
Vegetative Practice Need a regular interval of inspection in order to ensure proper functioning. Vegetative cover Keep grass or vegetation cover on the soil surface in between
tree line. Mulching Use protective blanket of straw, residue, gravel or synthetic
material on soil surface. Vegetative buffer strip Buffer strips consisting of planted or naturally occurring
vegetation, such as shrubs, trees, and plants are recommended for any cultivated land with less than a 45 degree slope.
Grassed waterway Construct grassed waterways, repair and reseed bare or eroded spots quickly.
Structural Practices Mainly engineered control devices and systems requiring high amount of initial investment costs. On-site retention storage Build of retention pond. Terracing Create wide steps on a gentle gradient. This is recommended
for cultivated land with more than 30 degree slope. Mix-load and wash-down site Build permanent station minimally consisting of a concrete
containment pad with a collection sump, a water supply and a roof to minimise entry of wind-driven rain.
Riparian setbacks Establish distances, approximately 30 meters width, between natural watercourse and cultivated area.
Notes: 1) The benchmark documents were US EPA (2000); Florida Department of Agriculture
and Consumer Services (2005; 2004); and Parsons and Boman (2006). 2) More details about BMP functions are described in Chapter 3.

10
On the other hand, four BMP groups were identified based on the purpose of, and the major
consequences from, the adoption. First, a maintenance of watering system, vegetative cover
and on-site pond were recommended in order to secure water resource. Second, herbicide
applications, mulching, and terracing farming aimed to reduce the rate of soil erosion. Third,
safe applications of pesticide, vegetative buffer strips, and a mix-load and wash-down site
were to reduce the impacts from pesticide application. Fourth, a soil analysis, grassed
waterways, and riparian setbacks were to manage the amount and timing of nutrients
application.
1.2 Research Objectives
1.2.1 General statement
The nature of nonpoint source pollution suggests that direct effluent discharge regulation is
unfeasible and managing pollutants at source might be more cost-effective. BMPs, from an
economic perspective, are a preferable solution for nonpoint source pollution management
with the side-effect of broader environmental benefits (Stanley 2000). Considering BMP
adoption as a common voluntary approach to tackle farm pollution, many studies have
attempted to investigate factors that determine farmers’ willingness to adopt BMPs
(Campbell et al. 2004). However, in the promotion and marketing of voluntary approaches,
there is often an implicit assumption that farmer behaviour towards adoption are
homogenous, suggesting a surprising lack of research around behavioural responses to
environmental policy instruments (Shogren and Taylor 2008). This suggests that more
research needs to be focussed on identifying underlying attitudinal positions that may then
explain alternative behavioural responses.
Further, the study of BMP adoption entails a challenging problem in cooperation because
BMPs often involve short-term costs for a producer, while the benefits are often long-term
and uncertain (Lubell and Fulton 2008). The ensuing debate is not helped by an absence of a
scientific evidence-base specifically linking the emerging agricultural causes and impacts of
nonpoint source pollution. As the adoption of BMPs imposes costs on farmers, government
might consider an intervention to provide incentives for farmers to participate. A study to
understand farm level costs and to assess the costs and benefits involved across the whole
life of the BMP programme is needed to inform policy decisions.
11
1.2.2 Objectives of the study
The general objectives of this thesis are: i) to understand the behaviours and attitudes of
citrus farmers in their decision on BMP adoption; and ii) to consider policy implications in
the context of potential payment for ecosystem services (PES) programmes in Thailand. The
more specific objectives of this thesis are outlined as follows:
A) Cost investigation
A1) To investigate the cost components of each BMP;
A2) To explore the extent to which farmers’ perceived costs can affect stated
adoption intention
B) Behavioural intentions
B1) To understand farmers’ conservation behaviours and underlying determinants
of behaviour;
B2) To identify the most preferred BMP amongst farmers;
C) Attitudes study
C1) To address differences and similarities in farmers’ beliefs and attitudes
towards BMPs
D) Policy implications
D1) To make policy recommendations regarding the development of PES
programme to protect water quality from farm pollution
1.3 Research Methods
The ultimate aim of this thesis is to make policy implications. Typically, policymakers are
faced with at least three challenges. The first is how to investigate real information from
stakeholders, and to understand the underlying logic that could result in adoption behaviour.
The second are the factors that potentially affect willingness to adopt such policies. The third
is how to translate the needs of stakeholder to development agencies. The array of objectives
addressed in this thesis requires multiple approaches for collecting and verifying
information, which then will offer insights for policy implications. As such, three
independent studies are proposed and are: i) a farm cost analysis; ii) an application of the

12
Theory of Planned Behaviour (TPB) and associated statistical analysis; and iii) an
application of Q-Methodology and Q factor analysis.
Figure 1-4 illustrates stand-alone objectives of each study and its contribution value for
policy implication addressing a water-related PES programme. First, the farm cost analysis is
proposed to investigate the cost component of each BMP. It is expected that information on
economic costs can be used to further explore the extent to which farmers’ perceived cost
may affect their stated intention to adopt a variety of BMPs. Overall, results offer an
understanding of the total costs incurred by farmers and to provide information on incentive
levels for policymakers, given that financial assistance is needed to induce farmers’
participation.
Figure 1-4: Stand-alone objectives and contribution values for policy implications

13
Second, the application of TPB and statistical analysis are expected to give insights into
dominant factors influencing the adoption, and to identify the most preferred BMPs amongst
farmers. These findings will provide basic information for the design of more responsive
environmental policy according to differences in psychological and socio-economic
variables between farmers. Third, the Q application is used to investigate farmers’ latent
attitudes and to identify the ways environmental issues are perceived. The technique of
factor analysis can segment farmers based on their perceptions towards BMPs. This
information is useful for an in-depth analysis to discover farmers’ concerns, which could
deter BMP adoption.
1.4 Thesis Structure
This thesis contains seven chapters (Figure 1-5). Chapter 1 presents the background to water
pollution in Thailand, and highlights farm nonpoint source pollution as one of the major
causes. It reviews the current state of citrus production in the Ping river basin, which is the
case study in this thesis. A risk of water contamination from intensive farming has suggested
a need for preventive measures. In this chapter, twelve BMPs have been proposed as tools to
control and manage farm pollution at the point of origin. This is followed by research
objectives and research method.
Chapter 2 reviews the research rationale and methodologies. It presents a general overview
of water pollution, and its negative impacts. The economic perspective on the causes of
water pollution is reviewed. This is followed by a series of pollution control approaches,
which highlight the command and control approach and market-based instruments. Particular
attention is paid to payment for watershed service (PWS) as a forming market-based
transaction. This chapter also reviews the methodologies proposed in this thesis. It discusses
the weaknesses of the rationality assumption inherent in traditional economic theory, and
suggests that alternative approaches are needed to investigate underlying factors in adoption
decisions making.
With the notion that cost is the main barrier for adoption new practices, chapter 3 offers the
analysis of costs incurred by farmers. Total costs of twelve BMPs, including first year
installation costs, annual maintenance costs, and opportunity costs of land are estimated. For

14
the comparison purpose, these costs are subjected to annualisation. The cost estimates also
provide information for the investigation of how perceived costs may affect farmers’
adoption decision, which is proposed in chapter 5.
Figure 1-5: Thesis structure
Following the theme discussed in chapter 2, chapter 4 offers a study based on TPB. It
outlines the main constructs of TPB, and discusses psychological variables and other
external variables to the theory. This chapter also sheds light on elicitation study and content
analysis, which are needed in the early stage for questionnaire development. It then
introduces the fieldwork which focused on the household survey, explaining the sampling
method, sample size calculation, and data collection. The personal interviews are conducted
with 218 farmers. Of these, 126 are upstream farmers and 92 are downstream farmers.
Moreover, this chapter provides a descriptive characterisation of farmers, explores the most
preferred BMPs amongst farmers, and illustrates the differences between farmers in the
15
upstream and downstream of the Ping river basin. These findings offer basic information for
the analysis in chapter 5 and chapter 6.
Chapter 5 takes up the issue of the factors influencing BMP adoption in greater detail.
Drawing information from chapter 3 and chapter 4, it first explores the way perceived cost,
occurring at the time decision is made, may influence farmers’ stated adoption intention. To
illustrate a relationship between these two variables, data are presented in a graphical form.
This interpretation is supported by the results from farmer interviews. Moreover, adopting
information from the descriptive statistics in chapter 4, this chapter then proceeds to examine
the influence of psychological and external factors that influence farmers’ adoption
intention, through a logistic model. The results from the best fit model are presented and
discussed.
Chapter 6 adopts Q-Methodology and focuses on the study of subjective positions based on
farmers’ perception of BMPs. A TPB sample of 218 farmers is used as a sampling frame for
this study. To get a representative samples of farmers based on farm size, education level and
age, 72 farmers are selected for the Q analysis. This chapter discusses the development of
concourse and criteria to select statements for a sorting process. In the survey, farmers are
asked to sort these statements and are followed-up with the interviews. Factor analysis is
used to segment farmers according to their preferences towards each statement.
Characteristics of each farmer group are explained based on salient statements and
supporting information from the interviews.
Chapter 7 concludes the key findings from the empirical works in each chapter. These
findings then contribute to a discussion about the possibility to development a water-related
PES programme, and offer insights for policy implications. This chapter then outlines the
limitations of methodologies employed in this thesis and recommends directions for future
improvement. Finally, the recommendations for future work in the context of knowledge
integration between economics and ecology are discussed.

16
2 RESEARCH RATIONALE AND METHODOLOGY REVIEW
Nonpoint source pollution generated by farm activities can spread throughout the watershed
and discharge into water bodies. In Thailand, the problem of water pollution is one of the
greatest national concerns. Thailand has witnessed an increase of organic water pollution
since 1980s (The World Bank 2001). Recently, the government has initiated a BMP
programme to control farm nonpoint source pollution at the watershed level. In this thesis,
citrus farming in the Ping river basin is used as a case study because traditional farm
management, such as intensive use of chemicals and fertiliser, and forest encroachment
(which induces soil erosion), have contributed to water contamination. As applied in
developed countries, such as the United States, BMPs are accepted as a potential tool for
coping with nonpoint source pollution (US EPA 2003). However, the extent to which these
practices will be voluntarily adopted by Thai citrus farmers is questioned.
Accordingly, this thesis aims to investigate farmers’ behaviour and attitudes towards the
adoption of BMPs in the management of farm pollution, targeting the improvement of water
quality. This chapter presents a general overview of water pollution as a consequence of
farm nonpoint source pollution, and reviews methodologies proposed in this thesis (Figure 2-
1). The first section (section 2.1) offers an overview of water quality degradation and is
followed by a discussion of water pollution problems from an economic perspective. It then
proceeds to highlight the command and control approach (CAC), and market-based
instruments (MBIs), mainly focusing on payment for ecosystem services (PES) and the
development of BMPs in developed countries.

17
Figure 2-1: Thesis structure
The second section (section 2.2) presents methodologies used in this thesis. Specifically, an
analysis of the limitations of neoclassical economic assumptions in relation to adoption
behaviours, calls for an alternative analytical approach to guide effective policy intervention.
Alternative decision theory, the Theory of Planned Behaviour (TPB), and Q-Methodology
are reviewed. This chapter closes with a summary (section 2.3) of key issues.
2.1 A Global Perspective of Agricultural Nonpoint Source Pollution
This section reviews the problem of water quality deterioration as a result of farm pollutants,
often known as nonpoint source pollution. It begins with a definition of nonpoint source
pollution, and the impacts of farm discharges on the water quality of the receiving water.
Causes of water pollution are discussed in an economic context. Further, the roles of a
18
traditional CAC and MBIs, which are inspired by the polluter pays principle (PPP), are also
discussed. This leads to a review of the concept of PES as an economic incentive approach
for any individual providing flows of ecosystem services. The review in the following
section further focuses on a typical characteristic of payment for watershed service (PWS) at
a global scale. This section is closed by a review of the establishment of designed contracts,
known as BMPs, in developed countries.
2.1.1 An overview of water quality degradation
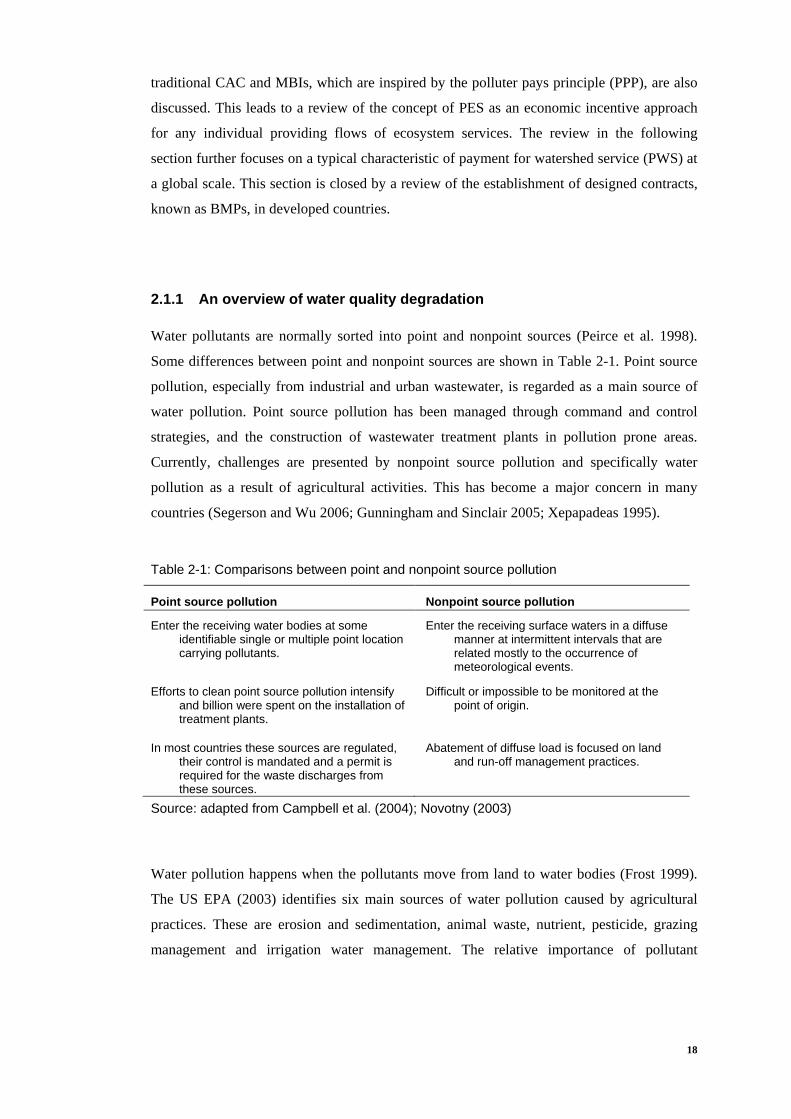
Water pollutants are normally sorted into point and nonpoint sources (Peirce et al. 1998).
Some differences between point and nonpoint sources are shown in Table 2-1. Point source
pollution, especially from industrial and urban wastewater, is regarded as a main source of
water pollution. Point source pollution has been managed through command and control
strategies, and the construction of wastewater treatment plants in pollution prone areas.
Currently, challenges are presented by nonpoint source pollution and specifically water
pollution as a result of agricultural activities. This has become a major concern in many
countries (Segerson and Wu 2006; Gunningham and Sinclair 2005; Xepapadeas 1995).
Table 2-1: Comparisons between point and nonpoint source pollution
Point source pollution Nonpoint source pollution
Enter the receiving water bodies at some identifiable single or multiple point location carrying pollutants.
Enter the receiving surface waters in a diffuse manner at intermittent intervals that are related mostly to the occurrence of meteorological events.
Efforts to clean point source pollution intensify and billion were spent on the installation of treatment plants.
Difficult or impossible to be monitored at the point of origin.
In most countries these sources are regulated, their control is mandated and a permit is required for the waste discharges from these sources.
Abatement of diffuse load is focused on land and run-off management practices.
Source: adapted from Campbell et al. (2004); Novotny (2003)
Water pollution happens when the pollutants move from land to water bodies (Frost 1999).
The US EPA (2003) identifies six main sources of water pollution caused by agricultural
practices. These are erosion and sedimentation, animal waste, nutrient, pesticide, grazing
management and irrigation water management. The relative importance of pollutant

19
concentration for each agricultural activity is different (Table 2-2). For example, crop
production in non-irrigated farms contributes to high concentrations of suspended
solid/sediment, nutrient, and pesticide in water, but it might have negligible acidity effect on
overall water quality.
Table 2-2: Relative importance of pollutant concentrations
Category Suspended
solids/ sediment
BOD Nutrients Toxic metals Pesticides Pathogens Salinity
/ TDS Acids Heat
Non-irrigated crop production
H M H N-L H N-L N N N
Irrigated crop production
L L-M H N-L M-H N H N N
Pasture and rangeland
L-M L-M H N N N-L N-L N N
Animal production
M H M N-L N-L L-H N-L N N
Notes: 1) TDS = Total Dissolved Solid; BOD = Biochemical Oxygen Demand 2) N = Negligible; L = Low; M = Moderate; H = High Source: Peirce et al. (1998)
Consequences of nonpoint source pollution on water quality are typically different from
place to place and from time to time (examples of studies are Wang 2006; Ichiki et al. 2003;
Nakasone and Yamamoto 2003; Agrawal 1999; Bendoricchio et al. 1999). In general,
nonpoint source pollution from agricultural activities contributes to poor water quality by
means of, for example, deterioration of aquatic habitats, eutrophication, in-stream
photosynthesis reduction, and turbidity (Campbell et al. 2004). The negative environmental
impacts from poor water quality represent a market failure, in that these negative
externalities impose unwanted costs on society (Bromley 2007). As water quality is not
always traded in the market, this results in a socially inefficient level of output and/ or
consumption. The term market failure is used to describe the condition in which equilibrium
in markets fails to achieve an efficient allocation of goods and services, or the condition in
which social marginal benefit is not equal to social marginal cost (Zerbe and McCurdy
2000). Economists have defined causes of market failures, and these are discussed as
follows.

20
2.1.2 Water pollution: an economic perspective
In terms of economics, a market refers to any set-up that enables an interaction between
consumer and producer to exchange a well-defined commodity. By ‘set-up’ a market needs
not require a location where exchanges are operated, for example an online market (Aldridge
2005). In microeconomic theory a buyer’s behaviour is illustrated by demand, while a
seller’s behaviour is presented by supply. Demand is defined by the quantity of goods and
services that consumers will buy at each and every price charged, whereas supply is the
quantity of goods and services offered by producers at each and every possible price. A
transaction may happen at a dictated price, but an equilibrium price can be established by the
interaction of demand with the quantity available of supply (Begg et al 2003). However,
sometimes the market is unable to perform its function effectively. In the context of water
pollution, it does not reflect all costs of products or where demand is not clear. Three main
causes of market failure are appeared: the characteristics of common pool resources (CPR),
externality, and lack of property rights.
2.1.2.1 Characteristics of common pool resources (CPR)
Goods and services are defined by two important attributes, which are excludability and
subtractability (Figure 2-2). Excludability refers to a prevention of an individual who does
not pay for that thing from enjoying the benefit of it. Subtractability deals with the situation
whenever consumption of someone diminishes the availability to consume by another. Water
quantity and water quality are examples for a typical CPR (Sarker et al. 2008a). It is difficult
to exclude others from consumption and the water body is easily depleted. For example,
access to watershed services such as flow regulation and water quality control are not easily
limited, and the amount of water consumed or polluted by people living upstream is
unavailable for those living downstream.
Subtractability Low High
Excludability Difficult Public goods or
free goods Common pool
resources
Easy Toll or club goods Private goods
Figure 2-2: Natures of goods and services Source: adapted from Carpenter (1998); Ostrom et al. (1994)
21
Regarding the characteristics of CPR in which all users have equal access to the resources,
degradation of resource systems is likely to continue as long as individuals enjoy the value
derived from resource units (Dietz et al. 2002). Difficulty in exclusion of consumption and a
high degree of subtractability can cause excessive resource exploitation. This is a rationale of
the so-called ‘Tragedy of the Commons’ (Hardin 1968). Hardin explained that since private
costs of consumption do not reflect total social costs and users logically act to maximise their
benefits, whereas the costs of use are generally shared amongst all users. This leads to the
destruction and the collapse of the resource.
2.1.2.2 Theory of externalities
Water pollution can also be viewed as an externality issue. Externality exists whenever the
activities of an acting party affect the welfare of another party, and the acting party is not
faced with the cost of the impact (Prato 1998). In the case of CPR, externalities can be
classified into two types, and are within-boundary and cross-boundary externalities (Sarker
et al. 2008b). Within-boundary externality occurs when contaminated water reduces the
quality of water available to other uses of the same system. Cross-boundary externality
occurs when contaminated water affects water quality in downstream catchments. Problems
of water pollution also involve unidirectional externalities in that impacts flow downstream
(Sarker et al. 2008a).
With pure externalities, people can take no account of costs and benefits that their action
imposes on others, and a market failure arises because there is neither a market nor a market
price for externality (Begg et al. 2003). An existence of externalities brings about economic
inefficiency leading to private equilibrium, and undersupply or oversupply of externalities is
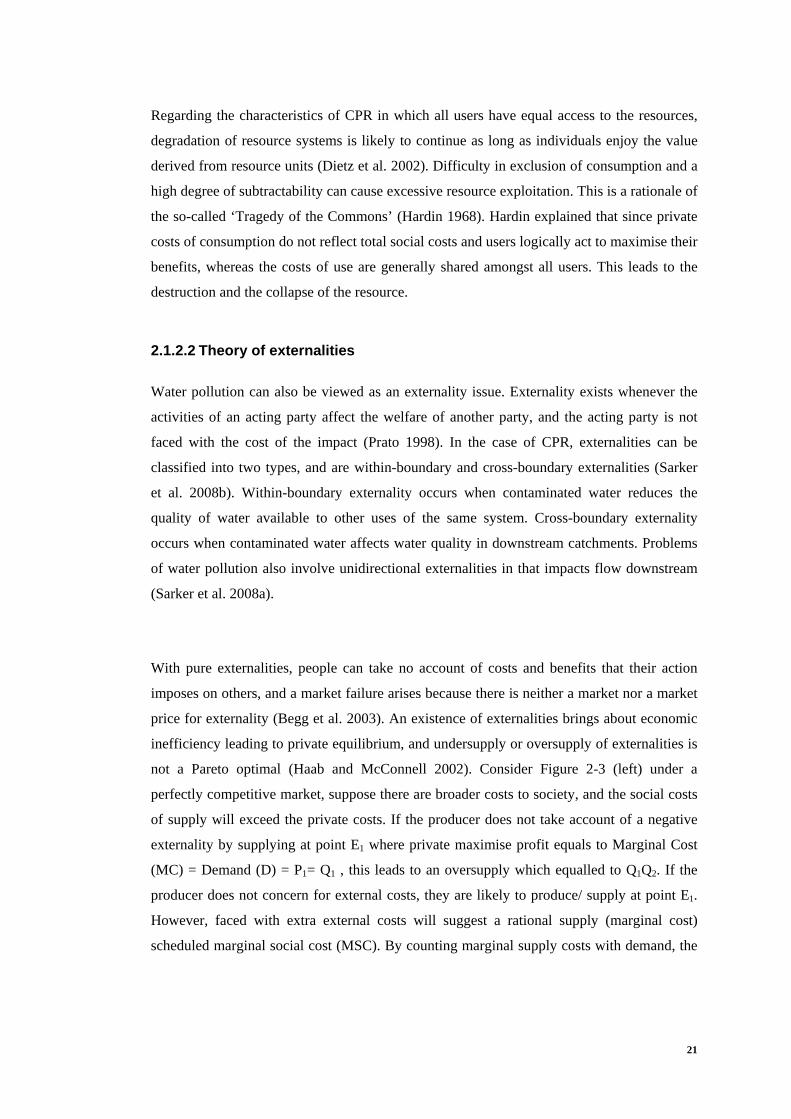
not a Pareto optimal (Haab and McConnell 2002). Consider Figure 2-3 (left) under a
perfectly competitive market, suppose there are broader costs to society, and the social costs
of supply will exceed the private costs. If the producer does not take account of a negative
externality by supplying at point E1 where private maximise profit equals to Marginal Cost
(MC) = Demand (D) = P1= Q1 , this leads to an oversupply which equalled to Q1Q2. If the
producer does not concern for external costs, they are likely to produce/ supply at point E1.
However, faced with extra external costs will suggest a rational supply (marginal cost)
scheduled marginal social cost (MSC). By counting marginal supply costs with demand, the

22
new MSC will suggest that point E2 is the optimal level of supply. Hence, by faced with the
external cost suggested, the producer reduces their supply of Q2Q1.
Figure 2-3: Negative externality (left); Positive externality (right)
The negative external costs are oversupplied. In contrast, positive externalities are
undersupplied. Consider Figure 2-3 (right), for example, D presents private marginal benefit
while D′ presents social marginal benefit. The private marginal benefit includes only benefits
received by producers. Suppose that a new technology for pollution abatement is introduced,
it will have a social marginal benefit that is higher. If the producer takes only his/ her private
benefit into account, the producer will operate at E1 using less technology rather than at E′.
In this case; therefore, total undersupply equals to Q′Q1.
2.1.2.3 Lack of property rights
Market failure can be viewed in terms of an absence of, or weak, property rights (Prato 1998;
Papandreou 1994; Boadway and Bruce 1984). Property rights are social arrangements that
permit the use and disposal, govern the ownership, and transfer of the ownership of goods
and services (Callan and Thomas 2000; Parkin et al. 1997; Bromley 1992). The Coase
Theorem (Coase 1960) shows that when property rights are not clearly defined, producers or
consumers freely impose costs on others, thus resulting in an economically inefficient
outcome.

23
Consider Figure 2-4 with an assumption of perfect competition in which a market will
perform effectively, D presents the market demand curve, and MC presents the market
supply curve. MC is the sum of the marginal cost curves above average variable costs for all
producers. The market equilibrium is point E1 where the profit maximising production is Q1,
where P1 = MC is the privately efficient level of production. At this point, private producers
typically do not consider environmental damage caused by their production. For example,
runoff from farms carrying inorganic chemicals is released directly into adjacent streams and
leads to water quality deterioration.
Figure 2-4: Property rights and market failure
Suppose that environmental damages are included in the marginal costs of production, it
gives the marginal social costs, MSC, of production. Therefore, the socially efficient level of
production is Q2 where P2 = MSC. Considering the definition of property rights if farmers are
granted a right to pollute water, they discard the environmental damage and select to produce
at Q1, which is their privately profit maximisation quantity. In contrast, if farmers do not
have right to pollute water, they must accept to produce at Q2 which represents a socially
optimal quantity. The example clearly shows that with an absence of well-defined property
rights, individuals will take advantage of the common resource, bringing about resource
degradation.
24
In the context of CPR, resource degradation occurs because well-defined and enforceable
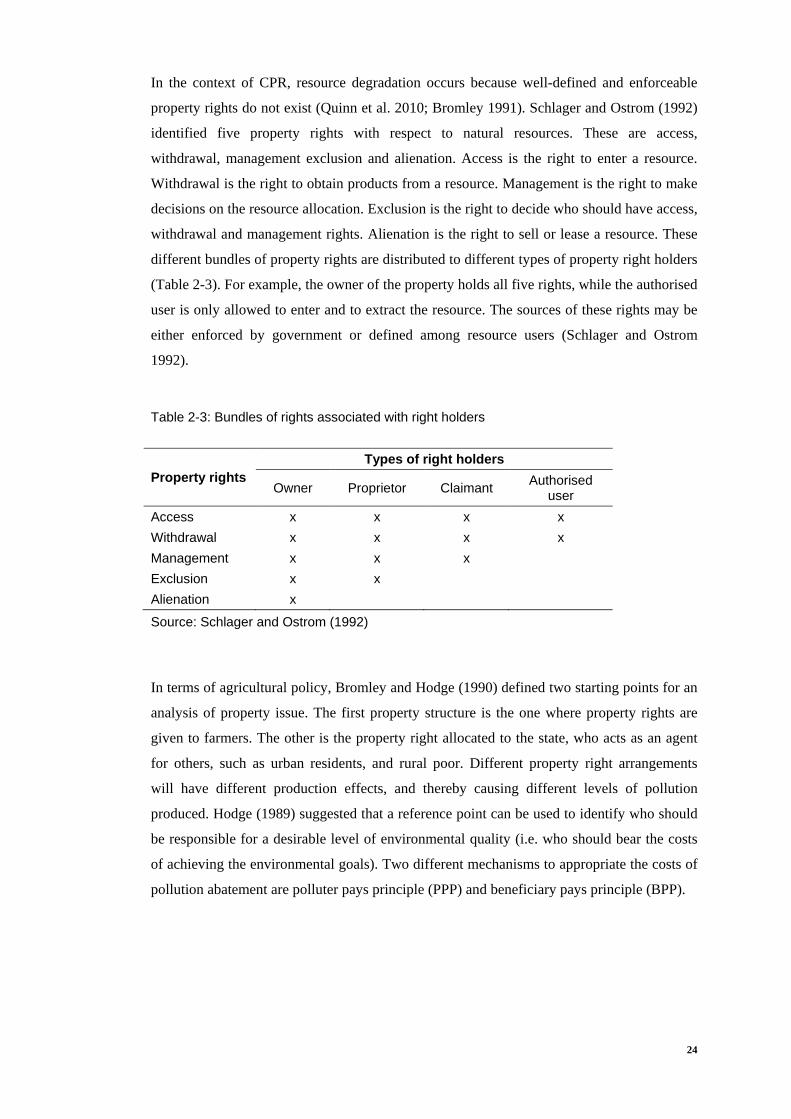
property rights do not exist (Quinn et al. 2010; Bromley 1991). Schlager and Ostrom (1992)
identified five property rights with respect to natural resources. These are access,
withdrawal, management exclusion and alienation. Access is the right to enter a resource.
Withdrawal is the right to obtain products from a resource. Management is the right to make
decisions on the resource allocation. Exclusion is the right to decide who should have access,
withdrawal and management rights. Alienation is the right to sell or lease a resource. These
different bundles of property rights are distributed to different types of property right holders
(Table 2-3). For example, the owner of the property holds all five rights, while the authorised
user is only allowed to enter and to extract the resource. The sources of these rights may be
either enforced by government or defined among resource users (Schlager and Ostrom
1992).
Table 2-3: Bundles of rights associated with right holders
Property rights Types of right holders
Owner Proprietor Claimant Authorised user
Access x x x x Withdrawal x x x x Management x x x Exclusion x x Alienation x
Source: Schlager and Ostrom (1992)
In terms of agricultural policy, Bromley and Hodge (1990) defined two starting points for an
analysis of property issue. The first property structure is the one where property rights are
given to farmers. The other is the property right allocated to the state, who acts as an agent
for others, such as urban residents, and rural poor. Different property right arrangements
will have different production effects, and thereby causing different levels of pollution
produced. Hodge (1989) suggested that a reference point can be used to identify who should
be responsible for a desirable level of environmental quality (i.e. who should bear the costs
of achieving the environmental goals). Two different mechanisms to appropriate the costs of
pollution abatement are polluter pays principle (PPP) and beneficiary pays principle (BPP).

25
Under the PPP, government sets mandatory standards to control and manage farm pollution,
and farmers must conform to these regulations. In this circumstance, farmers bear the costs
such as forgone production income, and investment in new technologies. On the other hand,
the BPP proposes that desired environmental goals could be achieved through government
incentives and a voluntary adoption of conservation practices. Farmers adopt innovations for
the available funds, which are normally collected from taxpayers.
Overall, the issue of market failure in relation to water pollution is characterised by the
problem of externality, ill-defined property rights, and the characteristics of CPR. The
existence of externalities leads to a private equilibrium which is not optimal. Externalities
can be solved if an affected party is compensated for a loss of welfare (Aldridge 2005).
Coase (1960) proposes two stringent approaches: an institution of legal property rights and
direct government regulations to specify rights and lessen the externality problem. Coase
(1960) proposes that the establishment of defined legal property rights in a perfectly
competitive market, with zero transaction costs, can remove existing externalities. If
externality is internalised, economic efficiency where the marginal social costs equal to the
marginal benefit costs is achieved.
However, the establishment of property rights is sometimes practically ineffective in the
political process (Rose 2002). Government has power to establish property rights, but
different political goals could bend the assignment of property rights. For example,
policymakers may be faced with different types of incentive in enforcing claims to
properties. Land allocation could be viewed as an additional instrument to favour and gain
supporters. Moreover, in the real world, transaction costs are always greater than zero (Zerbe
and McCurdy 2000). Accordingly, direct government regulation is often preferable in
dealing with externality problems.
The nature of agricultural nonpoint source pollution is that pollutants are normally
discharged into surface water by land-based agricultural activities (Frost 1999), which then
will be spread throughout a watershed. An incident is an intermittent interval related to
climatic conditions, in particular, rainfall, and it is unlikely to be monitored or controlled at
the point of origin (Novotny 2003). In an attempt to correct market mechanisms, government

26
agencies have intervened and chosen a number of different policy instruments. A summary
of pollution control approaches is discussed as follows.
2.1.3 Pollution control approaches
The nature of nonpoint source pollution requires that efficient regulation should focus on
land-use activity, rather than end-of-pipe control. Farm nonpoint source pollution is an
externality that can be addressed using various forms of government regulation (Novotny
1998). Policies focusing on pollution control have been inspired by the polluter pays
principle (PPP), which is influenced by Pigou’s (1920) writings. PPP was first defined and
recognized as an internationally agreed principle by the Organisation for Economic
Cooperation and Development (OECD) in 1972 (OECD 1972). The PPP expresses that
agents generating pollution should be faced with its full costs. In order to enact the PPP,
definitions of pollution and polluter must be clearly defined. According to the OECD (2002),
pollution has been identified as direct and indirect substances or energy introduced by
humans into the environment causing harmful effects on nature as to threaten human
welfare, while the polluter is the party responsible for the polluting activities.
By adopting the PPP, externalities can be internalised because the costs of environmental
destruction are distributed between producers and consumers who are engaged in the
activity. The costs may be shifted downward or upward in the market, and the costs of
pollution are internalised into the costs of the product (Rogers 1996). To date, the PPP is
being implemented through two different policy approaches. These include a command and
control approach, and the use of market-based instruments. The mechanism, advantages and
disadvantages of each approach are outlined as follows.
2.1.3.1 Command and control approach
A command and control (CAC) approach is established to discourage environmentally
harmful activities. Stavins and Whitehead (1992) state two broad types of CAC approach.
These are technology-based and performance-based CAC approach. The technology-based
CAC approach specifies the methods and equipment that producers must adopt to reach a
target, while the performance-based CAC approach implies setting an overall target for every
producer, and giving freedom to producers on how to manage to achieve the standard.
27
Asafu-Adjaye (2005) presents three types of standard relating to the CAC approach. Firstly,
the ambient standard limits the maximum level of pollutants in a given environment. It is
typically represented as an average concentration level over some period of time. Secondly,
the emission standard allows a maximum level of permitted discharge. Lastly, a technology
standard indicates the specific technologies, techniques or practices that producers must
adopt or install. Examples of CAC are guidelines and permits, federal regulation, uniform
pollution standards, and technology mandates.
CAC approach offers numerous potential advantages (Harrington and Morgenstern 2004;
Barde 1994), for example:
1. There is a longstanding experience with the application of CAC approach in other
fields, such as health and safety.
2. CAC approach is the most efficient measure if, for every polluter, the marginal
cost of abatement equals to the marginal cost of pollutant damage.
3. Since the standard is precisely set, the objectives can be attained quicker with
greater certainty.
4. The polluter prefers CAC approaches to other instruments because of lower
implementation costs. That is, the polluter is responsible for only expenses relating to
pollution abatement.
Despite these strengths, there are some concerns about the shortcomings of the CAC
approach. Harrington and Morgenstern (2004) explain a rationale of high administrative cost
caused by the huge amount of interaction between the regulator and regulated source and the
complexity of arranging and applying obligations. Portney (2003) argues that under the
CAC approach there is no incentive to invent new technology or modify present processes,
and a pollution control technique will be fossilised. Pagiola and Platais (2002) state that
polluters will be penalised if they do not follow the regulations, so polluters may have an
incentive to conceal their actions. Moreover, Tomich et al. (2004) believe that the CAC
approach is not suitable to apply with environmental policy because of its nature that
possibly leads to counterproductive behaviour and excludes the poor from the source of
living.

28
2.1.3.2 Market-based instruments
Another approach to control pollution is known as market-based instruments (MBIs). MBIs
are generally defined as mechanisms within which property rights are voluntarily exchanged
through pecuniary compensation (Whitten et al. 2003). According to Portney (2003), MBIs
is a maneuver of government intervention to protect resources by fostering and pushing a
market to work in the service of the environment. The use of MBIs is becoming more
widespread, and it is obvious that MBIs are used as complementarities with CAC approach
in mixed systems other than being used as substitutes for regulations (Nicolaisen et al. 1991).
OECD has identified seven types of MBIs (Barde 1994). These are emission charges or
taxes, user charges, product charges or taxes, administrative charges or fees, marketable
permits, deposit-refund systems, and subsidies.
The implementation of MBIs offers numerous advantages (Bishop et al. 2006; Harrington
and Morgenstern 2004; Gouyon 2003; Pagiola 2002; Austin 1999) as follows:
1. Compared with a traditional direct government regulation, MBIs are more cost
effective and more flexible in promoting innovation over times.
2. By employing the measure, enforcement costs are reduced due to better alliance
between private and public interests.
3. MBIs, such as tax, can be a source of revenue for government because rights to
pollute can be formally traded in arranged markets.
4. MBIs, such as payment for ecosystem services, can be an additional source of
income for the rural poor if the poor families are providers of natural resources.
5. MBIs offer greater capacity in dealing with smaller and nonpoint source pollution
such as agriculture runoff. Moreover, they allow for hands-off regulation and decentralised
decision-making as well as allowing polluters to act freely provided that all requirements are
met.
Though MBIs are superior to CAC regulation mechanisms in terms of efficiency of
implementation and effectiveness of outcomes (Harrington and Morgenstern 2004; Austin
1999), the approach suffers some drawbacks. Harrington and Morgenstern (2004) claim that
polluters under MBIs are charged higher costs than those directed by the CAC approach
because they are asked to pay a fee for the remaining pollution. Moreover, the application of

29
MBIs can cause unpredicted amounts of pollution especially in cases of taxation where
polluters are allowed to release waste as much as they want as long as they can pay for the
tax. Tomich et al. (2004) argue that the development of MBIs in the real world is difficult
since each polluter faces different cost structures and the optimal reward is not easily
determined. Finally, the implementation of MBIs possibly leads to undesirable outcomes if
they are designed to promote political or ideological agendas instead of compensating an
affected party.
It is obvious that most MBIs have been initiated through public policies despite the fact that
privately negotiated incentive-based solutions are possible. Recently, interest in payments
for more direct transactions (e.g., private-public, private-private) has led to a focus on PES.
PES has been introduced as a policy solution for realigning the private and social benefits
resulting from decisions relating to the environment (Jack et al. 2008). PES has a
characteristic of MBIs, and it is different from CAC in that it lets the price mechanism works
to allocate resources. Though CAC may also affect the market, it does not have a direct
impact on either cost or price. Level of farm pollution is fixed by mandatory regulations, but
not by individual’s economic preferences.
2.1.3.3 Payment for ecosystem services
An ecosystem service is a benefit of nature, directly or indirectly enjoyed and/or consumed
to sustain and raise human wellbeing (Costanza et al. 1997; Daily 1997). The Millennium
Ecosystem Assessment (2005; 2003) identified four categories of ecosystem functions as
provisioning, regulating, supporting and cultural services4
4 Provisioning services are products obtained from ecosystems such as food and fibre and fresh
water. Regulating services are benefits from the regulation of ecosystem processes such as the regulation of climate and water. Supporting services refer to natural processes that are necessary for the production of other ecosystem services. These are, for example, soil formation and retention, nutrient cycling and water cycling. Cultural services are benefits humans obtain from ecosystems through spiritual enrichment, recreation such as aesthetic values.
. The PES programmes have been
adopted by several institutions, such as the World Bank, the International for Environment
and Development, the International Union for Conservation of Nature, and the Centre for
International Forestry Research. Though there is no global definition of PES programme,
PES is commonly classified by five criteria, which are: 1) a voluntary transaction, with 2) a
well-defined ecosystem services that is being 3) brought by an environmental service buyer

30
4) from an environmental service provider 5) given the service is continuously delivered
only when payments are made (Wunder 2005; Wunder et al. 2005).
The rationale of PES is that since landholders do not receive compensation for the services
their land generates for the others, they have little economic incentive to take these services
into account in the management of their land. Basically, PES is a reward mechanism to
support positive environmental externalities. Rewards, or payments, in terms of money or in-
kind incomes are transferred from beneficiaries to landholders who provide certain
ecosystem services (Figure 2-5) (Wunder 2005; Mayrand and Paquin 2004). The maximum
payment from beneficiaries should at least be equal to or greater than the minimum cost
incurred by the landholders (Sierra and Russman 2006).
Two extreme cases of cost incured by farmers could happen in the BMP adoption, decreased
returns and increased costs. Considering figure 2-5 (left), upstream farmers receive less
benefit from BMP adoption (�B) than the benefits they receive from the current farming
practices (�A) (i.e. the reduction in fruit quality results in the lower selling price). A transfer
payment from downstream beneficiaries (�C) can make the BMP adoption more attractive
for the upstream farmers. Figure 2-5 (right) presents the case when cost is increased from the
BMP adoption. Operation and maintenance costs, for example, are additional costs (�X) to
the current farming practices (�W). A transfer payment from downstream beneficiaries
should at least be equal to (�Y) or greater than (�Y + �Z) the total costs incurred by
landholders. The ultimate aim of PES is to reconcile conflicting interests through
compensation and to find solutions for preserving ecosystem services that are vulnerable
because of mismanagement by establishing a missing market and promoting the protection
of ecosystem services (Pagiola and Platais 2007).
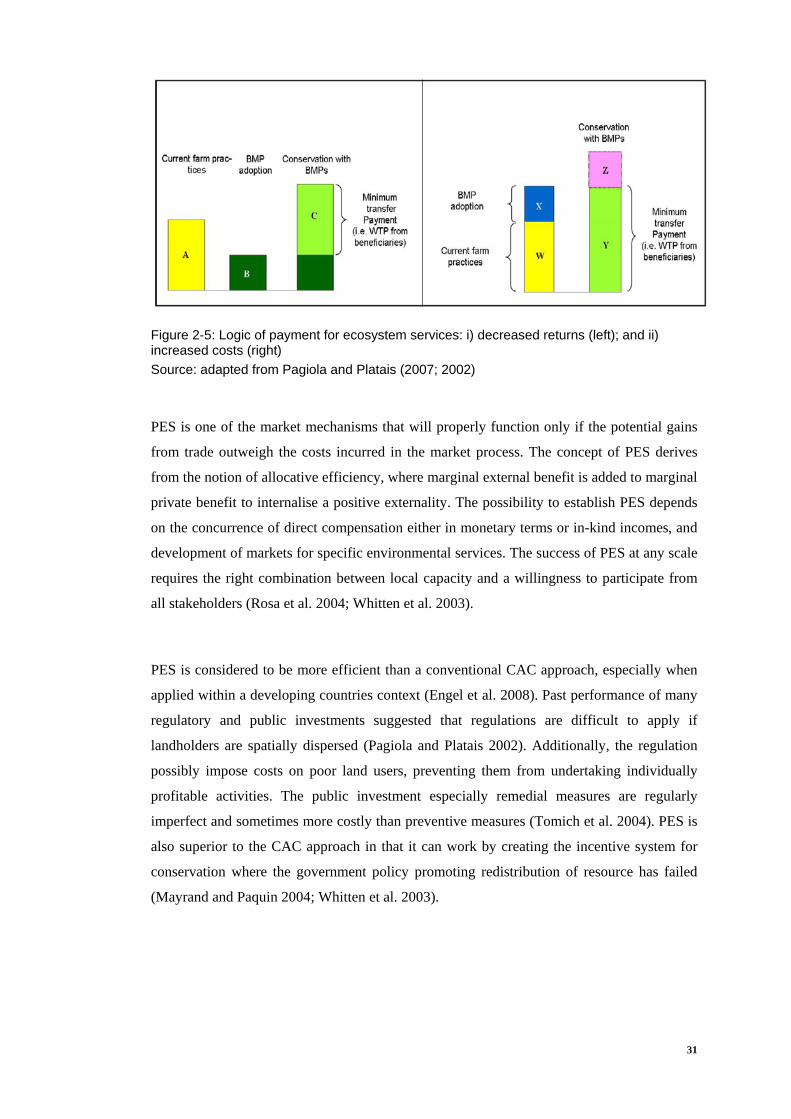
31
Figure 2-5: Logic of payment for ecosystem services: i) decreased returns (left); and ii) increased costs (right) Source: adapted from Pagiola and Platais (2007; 2002)
PES is one of the market mechanisms that will properly function only if the potential gains
from trade outweigh the costs incurred in the market process. The concept of PES derives
from the notion of allocative efficiency, where marginal external benefit is added to marginal
private benefit to internalise a positive externality. The possibility to establish PES depends
on the concurrence of direct compensation either in monetary terms or in-kind incomes, and
development of markets for specific environmental services. The success of PES at any scale
requires the right combination between local capacity and a willingness to participate from
all stakeholders (Rosa et al. 2004; Whitten et al. 2003).
PES is considered to be more efficient than a conventional CAC approach, especially when
applied within a developing countries context (Engel et al. 2008). Past performance of many
regulatory and public investments suggested that regulations are difficult to apply if
landholders are spatially dispersed (Pagiola and Platais 2002). Additionally, the regulation
possibly impose costs on poor land users, preventing them from undertaking individually
profitable activities. The public investment especially remedial measures are regularly
imperfect and sometimes more costly than preventive measures (Tomich et al. 2004). PES is
also superior to the CAC approach in that it can work by creating the incentive system for
conservation where the government policy promoting redistribution of resource has failed
(Mayrand and Paquin 2004; Whitten et al. 2003).

32
Furthermore, a PES programme can be adopted as a business-type approach for
conservation, which certainly leads to a more sustainable outcome. This is because it offers
continuous flows of payments and a viable business in the long run (Bishop et al. 2006;
Wunder 2006; Mayrand and Paquin, 2004). PES, in principle, can complete the goal of both
environmental protection and poverty reduction. Duncan (2006) defined an ‘equitable PES’
as any PES that aimed to conserve nature as well as to bring substantial benefits to the poor
in a just and equitable way. She argued that the rural poor, including indigenous people,
were the key active players in conservation programmes thus they should not be excluded
from the beginning of the plan. Rosa et al. (2004) believed that the rural poor had an ability
to turn degraded natural resources into an environmentally rich system, producing ecosystem
services which could then be sold to outsiders. It is expected that PES as a multipurpose tool
will ultimately lead to equitable wealth distribution, increased awareness on the economic
value of ecosystems, and economic development as a whole (Kosoy et al. 2007; Pagiola
2005; Landell-Mills 2002).
Though a PES programme offers several advantages, there are some criticisms about its
efficiency and payment scheme. The criticisms to programme efficiency are relevant to the
lack of permanence and the tangible of additional services. Engel et al. (2008) argued that a
permenance of PES programme could be hindered by changes in external conditions such as
changes in market prices of agricultural crops competing with natural resource conservation.
Further question is whether there is any difference in the provision of ecosystem services
between the with- and without-PES programmes (Wunder 2007). Policymakers should
aware of these limitations when making policy implications; otherwise a PES programme
may put tensions between service sellers and buyers. For example, to address the criticism
on PES efficiency, PES contracts should be flexible and provide enough rooms for further
amendments such as when new conditions are needed (Engel et al. 2008). It is also necessary
that a baseline should be established so that additionality as an incremental service delivered
from a PES programme can be determined (Wunder 2007).
Another criticism focuses on the payment scheme leading to the questions of equity and
fairness. The PES approach contrasts with PPP in that PES compensates those who provide
positive externalities other than imposing additional costs to those who create negative
externalities. That is, PES payment mechanism relies on the BPP, and leads to the questions
regarding policy implications: Do we pay the right people? Do we pay for the rights that
33
farmers never had? From a pure efficiency perspective, there is no difference either the PPP
or BPP is applied (Pagiola et al. 2005). Both PPP and BPP will bring about the same results
provided that markets are competitive, property rights are well-defined, and transaction cost
is zero (Coase 1960). However, these conditions are unlikely to happen in the real world. As
such, a key challenge is to determine the appropriate reference level, or an analysis of
property issue raised by Bromley and Hodge (1990).
Most PES programmes are driven by beneficiaries’ demand (Landell-Mill and Porras 2002),
and this implicitly arranges a demand-driven de facto property rights to farmers or
landowners. Accordingly, a payment mechanism based on BPP sounds reasonable since
farmers have the rights over agricultural land. Salzman (2005) asserted that this situation is
different from the case when pollution regulations are set to limit emissions from point
sources, such as factory. This is because PPP is inefficient to enforce dispersed nonpoint
sources, and we are asking the poors to adopt activities above and beyond what they would
have done. Therefore, if beneficiaries want an improvement beyond the current standards,
they should pay. This discussion is in favour of conservation of ecosystem services in
developing countries, and where the adoption of PPP would impose costs on poorer
landowners rather than on better-of beneficiaries (Wertz-Kanounnikoff 2006; Pagiola et al.
2005).
2.1.4 Payments for watershed services
As discussed above, PES is comparatively an effective, flexible and cost efficient
mechanism than any other conservation approaches. It can be implemented where the
application of other government policies would be impossible due to socioeconomic or
political aspects. Furthermore, PES mechanism fulfills ecosystem conservation and poverty
reduction goals. Among the vast services ecosystems provide, four most common services
with ongoing payment programmes are carbon sequestration and storage, biodiversity
protection, watershed protection, and landscape beauty (Wunder 2005; Wunder et al. 2005).
The scale on which the four sorts of ecosystem services are perceived differs (Table 2-4).
Carbon sequestration and storage and biodiversity protection are the greatest concern at
global level, while landscape beauty and watershed protection are primarily local to national
concerns.

34
Table 2-4: Scale of influences of four ecosystem services
Scale Carbon
sequestration and storage
Biodiversity protection
Landscape beauty
Watershed protection
Local rural community 0 ++ ++ +++ Provincial/ district public &
policymakers + + ++ +++
National public & policymakers + + + +++ Global public & policymakers +++ +++ 0 ++
Notes: +++ Very important; ++ Important; + Some significance; 0 Not a direct concern
Source: Jeanes et al. (2006)
In this thesis, particular attention is given to watershed protection. Watersheds provide
several services, which are products of ecosystem processes. Landell-Mills and Porras
(2002), and Mayrand and Paquin (2004) defined five services delivered at the watershed
level. These were water flow regulation, water quality maintenance, erosion and
sedimentation control, land salinisation reduction, and maintenance of aquatic habitats.
Tomich et al. (2004) remarked that a peak in public interest regarding watershed always
happened on five controversial issues, which were on-site effects of soil erosion, off-site
effects of soil transfer, flooding, seasonal drought, and water pollution. Of the five points,
pollution from land use was the greatest concern on every scale. In short, watershed services
are ecosystem services provided by a watershed. These services provide benefits
downstream, typically in the form of water quantity and water quality, which are obviously
influenced by upstream land use and farming practices.
A growth of payment for watershed service (PWS) is necessary due to the fact that demand
for clean water is rising and conventional policies may not be compatible with privately
owned land. Landell-Mills and Porras (2002) identified 287 PES initiatives, of which 61
cases were for watershed services, applied in 22 countries. Hope et al. (2007) revealed that
global interest in the arrangement of PWS was growing as demonstrated by the number of
projects jumping to over 100 by 2005. The success for applying PES approaches depends on
many factors. Past experiences revealed that the overall chances of negotiated reward
mechanisms have relied on (Engel et al. 2008; Jeanes et al. 2006):
• how shared perception regarding ecosystem functions shapes the interests of
stakeholders;
• the extent the trade-offs between providers and buyers affect ecosystem functions;

35
• in what way the existing local institutions restrict decision-making of individuals; and
• by what method confidence among stakeholders works to reach agreement.
In the following sections, there is a review of the dimensions and general characteristics of
PWS programmes.
2.1.4.1 Commodities in the context of payment for watershed services
The transformation of ecosystem services into commodities that can be sold in the market is
one of the challenges in establishing PES programmes (Mayrand and Paquin 2004; Landell-
Mills and Porras 2002). A precise service is a prerequisite in defining a commodity since
each potential beneficiary has a different perception and views regarding needs and values of
service. Demand for watershed services should be clearly defined and understood in the
same way. The question of ‘who demands what?’ must be thoroughly answered. For
example, local residents always request standardised water quality, while downstream
ecosystems requires enough water to maintain their functions.
Watershed services can be translated into tradable commodities as shown in Table 2-5. IIED
(2004) suggests a tradable commodity should have at least three features. Firstly, it must be
tangible. Secondly, it must be included in making any judgment, and finally it is preferably
based on sound science5
5 Tomich et al. (2004) reveal that most of economic valuation of watershed functions depends on the
studies of soil scientists, hydrologists or physical geographers
. Watershed services typically fall into five categories which are
water quality, water table regulation, water quality and regulation, soil contaminant control,
and aquatic habitat protection. Each service can be translated into several types of
commodity. Water quality, for example, can be transformed into four commodities that are
best management practice contracts, water quality credits, land acquisition, and conservation
easements.
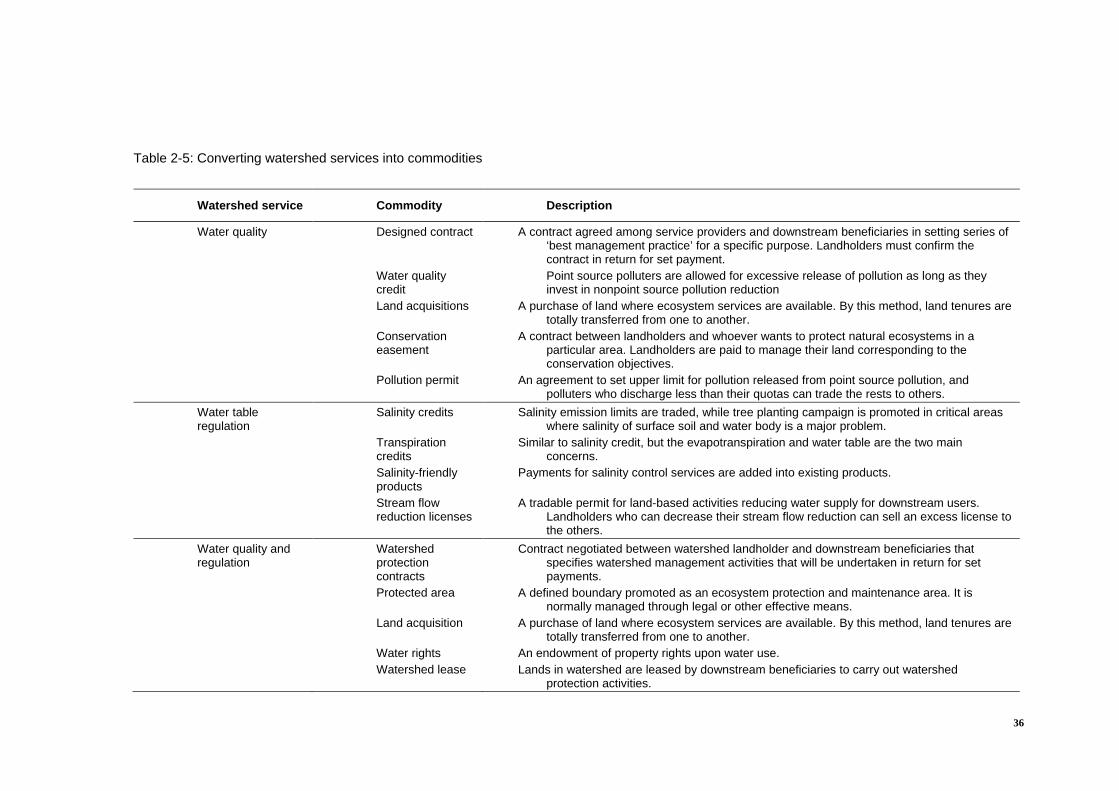
36
Table 2-5: Converting watershed services into commodities
Watershed service Commodity Description
Water quality Designed contract A contract agreed among service providers and downstream beneficiaries in setting series of ‘best management practice’ for a specific purpose. Landholders must confirm the contract in return for set payment.
Water quality credit
Point source polluters are allowed for excessive release of pollution as long as they invest in nonpoint source pollution reduction
Land acquisitions A purchase of land where ecosystem services are available. By this method, land tenures are totally transferred from one to another.
Conservation easement
A contract between landholders and whoever wants to protect natural ecosystems in a particular area. Landholders are paid to manage their land corresponding to the conservation objectives.
Pollution permit An agreement to set upper limit for pollution released from point source pollution, and polluters who discharge less than their quotas can trade the rests to others.
Water table regulation
Salinity credits Salinity emission limits are traded, while tree planting campaign is promoted in critical areas where salinity of surface soil and water body is a major problem.
Transpiration credits
Similar to salinity credit, but the evapotranspiration and water table are the two main concerns.
Salinity-friendly products
Payments for salinity control services are added into existing products.
Stream flow reduction licenses
A tradable permit for land-based activities reducing water supply for downstream users. Landholders who can decrease their stream flow reduction can sell an excess license to the others.
Water quality and regulation
Watershed protection contracts
Contract negotiated between watershed landholder and downstream beneficiaries that specifies watershed management activities that will be undertaken in return for set payments.
Protected area A defined boundary promoted as an ecosystem protection and maintenance area. It is normally managed through legal or other effective means.
Land acquisition A purchase of land where ecosystem services are available. By this method, land tenures are totally transferred from one to another.
Water rights An endowment of property rights upon water use. Watershed lease Lands in watershed are leased by downstream beneficiaries to carry out watershed
protection activities.

37
Watershed service Commodity Description
Soil contamination control Ecolotree planting Plantation and vegetation systems that filter and absorb contaminated water from soil.
Aquatic habitat protection
Designed contract A contract agreed among service providers and downstream beneficiaries in setting series of ‘best management practice’ for a specific purpose. Landholders must confirm the contract in return for set payment.
Land leases The rights to protect and conserve the resources are transferred from government to whoever devotes for natural ecosystem protections. Government will receive an up-front payment and annual fees in return.
Salmon safe products
Landholders who comply with arranged management practices regarding salmon sensitive land management obtain a financial reward in terms of cap on existing products.
Salmon habitat restoration contracts
A designed contract aims to protect salmon habitats. Those who provide a service get set payments in return.
Salmon habitat credits
A system requires that landholders in salmon sensitive-prone area, such as riparian buffer, must develop the habitat as long as they balance this by purchasing habitat credits in more valuable habitat zones.
Water rights An endowment of property rights upon water use.
Source: adapted from IIED (2004); Landell-Mills and Porras (2002)

38
2.1.4.2 Market for watershed services
Watershed services, like other ecosystem services, are not explicitly traded in markets.
Therefore, their quantity and quality are neither regulated by the price mechanism, nor by
demand and supply relationships. In order to set up a market for a watershed service, it is
necessary as a first step to identify the service that will be in exchange, i.e. a clearly defined
commodity. Plenty of services provided by water-related ecosystems are available; therefore,
it is a vital process to match a particular service from ecosystems with a direct and
demonstrable benefit to consumers (Powell and White 2001). In case of the market for
watershed services, landholders or suppliers of the services will receive rewards and are
encouraged to conserve, and protect watershed for producing valuable watershed services to
beneficiaries or buyers of the services. Supplies of watershed service are quantity, quality
and timing of water flows generated by upstream landholders, while demands for services
are normally from downstream beneficiaries for a specific use, such as domestic use,
hydropower plant, fisheries, and irrigation.
Landell – Mills and Porras (2002) report that demand, illustrated by the growing willingness
to pay from both government and private authorities, is the main driver for establishing a
market for watershed service. Supply-side driver, on the other hand, is typically not a major
force because the characteristic of watershed that is not possible to exclude beneficiaries.
However, it is the case if all beneficiaries are convinced of the threats to supply. The key for
success in establishing markets is that the creation of market guarantees for the lowest
transaction cost associated with that market. This is due to the fact that a market will work
effectively when no other institutional arrangements exists with lower transaction costs
(Whitten et al. 2003; Davidson and Weersink 1998).
2.1.4.3 Payment mechanism
In the market for watershed services, a service providing a positive externality from
providers will happen only if there is reasonable compensation from potential beneficiaries.
Payment mechanisms in the market for watershed services have various forms. Eight
categories of payment mechanisms are identified for watershed services (IIED 2004;
Landell-Mills and Porras 2002):

39
1. Direct negotiation: this is probably the most direct payment method arranged
between service providers and beneficiaries. The method is popularly applied with best
management practice contracts.
2. Intermediary-based transaction: mediator such as trust fund, local or
international NGOs, or government is involved to control transaction costs and risks.
3. Pooled transaction: this payment method is suitable when investors are
interested in different commodities. The mechanism will spread risks amongst several
buyers.
4. Retail based trade: certifications or labelling schemes are required for putting
additional price onto existing consumer purchase. This mechanism is mostly applied with
salinity-friendly product and salmon safe product.
5. Over-the-counter trade and user fee: this mechanism is available with
commodity pre-packaged for sale such as water quality credit. Watershed services are
offered at a standard rate for different users through user fees.
6. Clearing-house transaction: this is rather a new mechanism deployed greatly in
developed countries, and still in its introduction stage. An intermediary proposes a central
trading platform for both buyers and seller. By this method, government must enact and
enforce regulations to smooth the transactions.
7. Internal trading: transactions are taken within an organisation. By this way,
organisations will internally perceive their willingness to pay before making decision for
further external trading.
8. Auction: this method is like clearing-house and over-the-counter trading
mechanisms. The method allows for an establishing of competitive market where supply of
and demand for watershed services are played on the same ground.
Global experience suggests that PWS as a market-based instrument can be introduced to
tackle water pollution. A mutual commitment between upstream service providers and
downstream users is a key factor driving a sustainable programme. So far, the practice of the
payment programmes varies from place to place with controversial issues regarding degrees
of government involvement. The next section presents a review of PWS by investigating
current commodities, potential market drivers, and payment mechanisms, and comparing the

40
differences of programmes between developed and developing countries in a quantitative
review.
2.1.5 A review of payment for watershed service studies
A review in this section is based on the concept of meta-analysis, which is a statistical
procedure that integrates the results of several independent studies considered to be
combinable. The advantage of meta-analysis is that it allows a more objective appraisal of
the evidence than narrative reviews (Egger et al. 1997). This section aims to integrate data
and understand common characteristics of PWS prevailing in developed and developing
countries. To do this, literature searches were conducted during January 2007 on numerous
databases, such as bibliographic databases, subject gateways and other internet resources. 70
PWS programmes, representing 47 cases in developing countries and 23 cases in developed
countries, were selected (Annex 1). Results from the analysis are presented as follows.
2.1.5.1 Current commodities in exchange
In developing countries, the most popular traded commodity was a re-allocation of the right
to regulate natural resources (i.e. water quality), which was as high as 40% of all transactions
(Table 2-6). Right re-allocation was typically taken the form of a claim on water-related
resources from a government authority charging a direct fee from users, such as hydropower
plants, industries, or domestic water users. Table 2-6: Current traded commodities
Commodities Developing countries Developed countries Frequency % Frequency %
Designed contract 15 22.7 12 18.2 Credit scheme - - 5 7.6 Ecolabel product 3 4.5 1 1.5 Transfer of land tenure 2 3.0 2 3.0 Emission trade 1 1.5 6 9.1 Re-allocation of the right to regulate resources 26 39.4 - - Scientific proof - - 2 3.0 Trade of water rights 3 4.5 - - Voluntarily extra payment 2 3.0 - -
Note: more than one type of commodity can be traded within a programme

41
Designed contracts, such as BMPs and a restoration contract, were prevalent in both
developing and developed countries. More complicated products, such as credit schemes,
emission trades, and scientific proof6
were apparently seen in developed countries.
2.1.5.2 Market drivers
Generally, a government authority was the key driver for establishing a market for watershed
services. In developing countries, the frequency of solely a government authority acting as
the market driver was as high as 55% (Table 2-7). A few cases showed that a market was
established by cooperation between a government authority and other agencies, such as
NGOs, multilateral organizations, and local communities. In developed countries, besides
government enforcement, pressures from private agencies also activated the market.
Examples were Vittel mineral bottled water company in France, Stadtwerke München in
Germany, and Ecolotree in the United States. Driving forces from communities were
seemingly rare, and mostly arose in developing countries mainly in the form of a
beneficiary-collective group, such as farmer associations.
Table 2-7: Market drivers for PWS programme
Market drivers Developing countries
Developed countries
Frequency % Frequency % Government authority 36 54.5 15 22.7 Government authority and NGOs 1 1.5 1 1.5 Government authority and multilateral organisation 1 1.5 - - Government authority and community 1 1.5 2 3.0 Community 3 4.5 - - Community and NGO 2 3.0 - - Private concerned agency 2 3.0 5 7.6 Government authority and NGOs and Private agency 1 1.5 - -
Note: more than one type of market driver can be seen within a programme
6 This type of commodity is supported by sound science evidences to illustrate how ecosystem
services could be improved by the adoption of such commodity. An example is Ecolotree planting providing a soil contaminant control. The research showed that the adoption of Ecolotree planting can minimise contaminant in soil with the technique of photoremediation.

42
2.1.5.3 Payment mechanism
The PWS programme can have several possible payment methods depending on the
characteristics of buyers and sellers, commodity attributes, and roles of stakeholders within a
specific watershed. In both developing and developed countries, intermediary-based
transactions were a dominant mechanism (Table 2-8). Mediators were introduced to the
programme so as to manage and eliminate risks, uncertainties, and transaction costs.
Intermediary-based transactions can be taken by a government authority, trust funds, NGOs,
communities or even private companies.
Table 2-8: Potential payment mechanisms
Payment mechanisms Developing countries Developed countries
Frequency % Frequency % Direct negotiation 6 9.1 3 4.5 Intermediaries-based 43 65.2 15 22.7 Pooled-transaction 9 13.6 1 1.5 Retail-based - - 1 1.5 Over the counter/ user fee 11 16.7 2 3.0 Clearing house - - 4 6.1 Internal trading 2 3.0 - - Auction - - 3 4.5 Ecological ICMS 1 1.5 - -
Note: more than one type of payment mechanism can be available within a programme
The most popular form was the government-intermediary based transaction, which was as
high as 70% in developing countries and 87% in developed countries (Figure 2-6). This was
followed by NGOs-based and trust fund-based transactions. A trust fund-based transaction is
a trust fund to finance payment by establishing pooled-demands for watershed service
amongst various beneficiaries (Postel and Thompson 2005). The occurrences of community-
based transactions were rare in developed countries.
Besides the aforementioned mechanisms, a case in the State of Paraná, Brazil offers an
example of payment mechanism which is explicitly different from other PWS programmes.
The state government allocated transfer payments to municipalities with more water
reserves, conservation units or protected areas. The financial payment was funded by
‘Ecological ICMS’ (an indirect tax charged on consumption of goods and services) to
encourage and promote watershed and biodiversity rehabilitation. The system has been
called a ‘redistribution mechanism’.

43
Figure 2-6: Types of intermediary-based transaction in developing countries (left) and developed countries (right) (%)
Overall, the concept of PWS can be used to control agricultural nonpoint source pollution as
it offers a shared benefit between stakeholders in a specific watershed, and ensures
acceptable standards in water bodies by source control techniques. PWS also has a superior
characteristic compared to other pollution control approaches in that it is a tailored-contract
matching local conditions. It has a characteristic of decentralised policy which contributes to
an improvement of service provision by making it more responsive to the people being
served. Accordingly, the market for PWS is growing and there is increasing interest as water
becomes scarce and the effects of water pollution are impacting human health and
environment.
2.1.6 A review of best management practices
Land is an important input in agriculture, and private property right, either de facto or de jure
right, is normally granted to farmers. Agricultural land provides food and fibre, and supplies
ecosystem services (i.e. changes in agricultural practices, such as BMP adoption, can
contribute to improved water quality) (Millennium Ecosystem Assessment 2005). As an
improvement in an ecosystem services is often produced as a by-product of private
productions, users and beneficiaries who consume and enjoy this benefit stream do not pay
for it. If a government promulgates policies requiring BMPs to control farm pollution, this
adds external costs in farm production. Based on private decisions, farmers may not want to
adopt BMPs because of low profits, uncertain returns, or length of time to realise the
benefits. However, a growing awareness of agricultural nonpoint source pollution in
developed countries, such as the United States and the United Kingdom, has led to the

44
establishment of ‘designed contracts’ to compensate farmers for the generation of positive
externalities.
The United States enacted the Clean Water Act of 1972, which is the national policy for the
control of nonpoint source pollution. The Act introduced BMPs as a measure to manage
water pollution at watershed level (US EPA 2003). The US EPA (2010) classifies
agricultural BMPs as the most effective and practicable (including technological, economic,
and institutional considerations) means of controlling agricultural nonpoint pollutants at
levels compatible with environmental objectives. BMPs are defined as management practices
controlling the generation and pollutants into water resources or remediating or intercepting
pollutants before they enter watercourses (US EPA 2003). The implementation of BMPs is
undertaken by the US EPA.
Recognising that agricultural nonpoint source pollution is mainly from mismanagement and
misuse of land inducing erosion, nutrient and pesticide, US EPA encourages farmers to adopt
a series of good practices and to reduce or eliminate poor practices. BMPs can be
implemented in the form of both management incentives and management practices (Centner
et al. 1999). The management incentives are procedural practices, which conform to good
husbandry. Examples are the use of optimal rate of fertiliser at the right time, and the
adoption of pesticide spraying techniques that prevent spray drift into watercourse. The
management practices are divided into vegetative and structural practices. Vegetative
practices are measures controlling erosion and run-off from the field, while structural
practices are permanent barriers or buffers generated through construction or site
modification. All measurements can be applied before, during, and after pollution-producing
activities (Brown et al. 2007).
Similarly, the Water Framework Directive established in 2000 sets a timetable for the next
27 years to protect, improve, and sustain water use in EU countries (Collins 2004). The
Directive has been transposed into the UK law, where the Department for Environment,
Food and Rural Affairs (Defra) acts as a leader for the implementation in England and
Wales. The Scottish Environment Protection Agency is responsible for that in Scotland.
Codes of Good Agricultural Practice are set out to provide an important point of reference
for farm operations. Under the Codes, good agricultural practice means a practice that

45
minimises the risk of causing pollution while protecting natural resources and allowing
economic agriculture to continue (Defra 2003: 3). The Codes advise that farmers should
acknowledge causes and effects of pollution as a result of poor agricultural practices, and
they should know how to operate in sustainable ways, and what to do in an emergency.
With an increase in awareness over water pollution, one particular concern is that the UK
might need to learn from the United States and elsewhere on developing best management
agricultural practices (D'Arcy and Frost 2001; D'Arcy et al. 1998). Accordingly, Defra
introduced a user manual called ‘An Inventory of Measures to Control Diffuse Water
Pollution from Agriculture’ (Cuttle et al. 2007). The manual lists forty four measures for
controlling nonpoint source pollution, especially nitrate, phosphorous, and faecal indicator
organisms as a consequence of agricultural activities, such as land use, soil management,
livestock management, and fertiliser management. It also identifies the effectiveness of each
of the measures. In general, the UK Codes aim to elevate pollution prevention activity for
each type of land use by the adoption of good practices and mutual agreements between
farmers and government.
A considerable amount of public budgets spent on agri-environmetnal programmes raises
concerns about the environmental benefits and effectiveness of the proposed good practices
(Schönhart et al. 2010). As such, an integrated model determining the links between ecology
(i.e. characteristics, process and functioning) and economics (i.e. demand for goods and
services supplied by ecosystem) is required. The challenge for policymakers is to bring
economists to work closely with natural scientists to build understanding of ecological
production functions from farms and to apply appropriate valuation exercises (Polasky
2008).
To simulate major processes in agricultural land use management, bio-physical model is a
tool to understand and predict the environmental performance of alternative farming
practices (Daily and Matson 2008). A variety of models can be used to simulate the
effectiveness of BMPs at numerous scales, such as field- and watershed- levels. For
example, Vinten et al. (2004) adopted three alternative approaches (i.e. a soil transport
model, a regression using observed E. coli concentrations in surface water, and PAMIMO
model) to predict delivery of faecal indicators from dairy farms to surface water in river
46
Irvine catchment. McGechan et al. (2008) used the combined model (i.e. MACRO
hydrological model and a channel network model) to define transport of ammonium and
E.coli form dairy farms and simulate contaminant delivery to rivers. Rao et al. (2009)
employed a variable source loading function to simulate the impact of BMPs in P load
reduction from the watershed. Nendel (2009) adopted an EU-Rotate_N model to compare a
traditional fertiliser strategy with the recommended practices and found that the BMP
adoption resulted in lower N leaching.
Iovanna and Newbold (2007) argued that an assessment that could reflect ecological
complexity, such as ecological process and ecological-economic interactions, can lead to
better policy outcomes by increasing resilience. The outputs from bio-physical models
generate inputs for economic valuations, such as Cost Benefit Analysis (CBA) and Cost
Effectiveness Analysis (CEA) (Zhou et al. 2009). CBA is an approach to compare the
desirability of alternative investments by representing all values (i.e. costs and benefits from
BMP adoption) in monetary term. For CBA, the results from a bio-physical model could
benefit an economic valuation in that ecological dynamics, uncertainties and irreversibilities
are accounted for in a policy evaluation. In other words, a model predicts a potential
environmental improvement which affects human well-being. This environmental
improvement has its own economic values, which can then be measured under the concept of
Total Economic Value (TEV). On the other hand, CEA is an approach to compare the
relative costs and outcomes of options. The least cost method, given an environmental target,
is chosen. A bio-physical model benefits a CEA in that it estimates the impacts from new
farming practices; thereby determining environmental benefits which in turn are
effectiveness sides of BMP. Overall, a bio-physical model provides scientific information
about the usefulness of BMPs, and when integrated with an economic valuation it could be
used to address ecological sustainability in an agri-environmental policy assessment.
As the discussion above attests, the impacts of water pollution caused by agricultural
pollutants are immense and result in the steady degradation of watershed ecosystems. Global
experience suggests that on-farm BMPs, as a PWS programme, could control nonpoint
source pollution. Tackling nonpoint source water pollution requires a good understanding of
its nature and characteristics, and the effectiveness of BMPs. In the promotion and marketing
of BMPs, a crucial assumption is that behaviours are rational as understood early in a
rationality context, particularly the neoclassical theory of profit maximisation. However,

47
behaviours are not homogeneous, and needed to be explored further (Leiser and Azar 2008;
Spash and Biel 2002; van den Bergh et al. 2000). Accordingly, this thesis deals with this
challenge by employing a supplementary of social psychology theory to capture more
complex behaviours of human.
2.2 Review of Methodologies
This section aims to review the methodologies and rationale of applications that are
employed in this thesis. The review begins with a discussion of the notion that cost is the
main barrier to the adoption of new conservation practices. It then proceeds to a discussion
regarding farmers’ decision-making, which is typically assumed to be rational, and points to
a gap in underlying assumptions between neoclassical economics and psychology in relation
to behavioural responses. This suggests a need to incorporate a social psychology theory into
the study of adoption behaviour, so as to capture complex aspects of farmers.
2.2.1 Factors influencing farmer’s decision-making
Traditional neoclassical economics assumes that farmers are profit maximisers, who are
rational and behave in a way to maximise their utilities. Adoption behaviours are normally
explained by the complexity of the social aspects of farm households, such as economic
variables, and biological and physical variables within one objective function. In the
traditional view, previous work suggests that many factors constrain the adoption of
conservation practices, but the most frequently mentioned barrier to adoption is cost
(Rodriguez et al. 2009).
In the context of water pollution from agricultural land, the introduction of conservation
practices, such as BMPs is expected to reduce negative externalities by controlling pollutant
discharge. Wieland et al. (2009) argued that the true cost of reducing farm pollution from
surface water is the payment for implementing qualified BMPs, not for directly reducing
nonpoint source pollutant. At farm level, farmers are decision makers who bear substantial
financial responsibility for any conservation practice being implemented on their land. The
adoption of conservation practices is often characterised by high up-front costs, which could
deter farmers’ adoption (Pannell et al. 2006). Thus, knowledge about costs is critical given
the limited resources available on farm.

48
A few studies investigated the cost of BMP implementation. For example, Sample et al.
(2003) studied costs in the adoption of stormwater BMPs. The major costs considered
included the initial capital costs and the present value of annual operation and maintenance
costs that were incurred over time. Cubbage (2004) estimated the cost to comply with
forestry BMPs and found that BMP costs per area were often highest on steep terrain. He
further concluded that BMP costs increased over time as the standards and requirements
become higher. Afari-Sefa et al. (2008) conducted a cost estimate for structural BMPs in
farms. Their study provided insights into the magnitude and structure of on-farm costs to
establish and maintain particular BMPs.
Overall, the ultimate aim of BMP cost analysis is to guide regulators about how to allocate
public resources in order to encourage BMP adoption (Afari-Sefa et al. 2008; Wossink and
Osmond 2002). Given the importance of cost analysis in agriculture, and the increasing
importance of, and interest in, agricultural BMPs, a good understanding of cost can provide
basic parameters for potential agri-environmental policy. This is the case in Thailand where
there is limited empirical data relating to the cost of conservation practices, particularly
BMPs recommended for citrus farms.
Apart from the cost of adoption, farmers’ behaviour is thought to be the consequence of a
complex integration between socio-economic and psychological variables. Accordingly, the
decision-making process of farmers could not be merely modelled by mathematical methods
traditionally used by agricultural economists (Willock et al. 1999), and the rational man
assumption for environmental policy may not be pertinent (Shogren and Taylor 2008). To a
degree, several analytical approaches have been applied to agricultural economics to
investigate farmers’ responses to policy initiatives (Burton 2004). A considerable amount of
research has been conducted to understand the process of farmers’ decision-making and the
question of which factors influence adoption of agri-environmental policy. Kaiser et al.
(1999) suggested that two-thirds of all environmental-psychology publications include the
notion of environmental attitudes in one form or another. Previous studies revealed that an
inclusion of psychological variables into the adoption model of agri-environment schemes
enables more predictive power (Edwards-Jones et al. 1998). Further, farmers’ segmentation
based on their attitudes allows introducing the right policy to the right farmers (Sutton 1998).

49
In principle, neoclassical economics and psychology theory of attitude formation rest on
relatively different assumptions regarding adoption decisions. Table 2-9 shows some major
differences between economics and psychology. In the neoclassical paradigm, one common
interpretation is that people have well-defined preference rankings, which can be discovered
by examining evidence on choices and the principle of revealed preference. These rankings
are then taken as the basis for welfare evaluations. In other words, neoclassical economics
assumes rational human behaviour. The individual thinks logically about choices by using all
available information and allowing for the effects that current choices will have on future
choices and future outcomes. In contrast, the alternative theory of non-rational behaviour is
based on psychological hypotheses, which postulate that behaviour is determined by many
factors besides the simple economic contingencies.
The literature on farm decision-making has increasingly recognised the diversity and
complexity of farmers’ values, goals and objectives (Garforth and Rehman 2005). Smith
(2005) argued that when people make choices that contradict with formal theory of
rationality, this gives an opportunity to investigate: i) why they perform those decisions; and
ii) how decision-making is processed and implemented. In practice, the economic model and
cognitive model are complementary. A good understanding of pertinent psychological and
neural processes is helpful in behaviour observation and can produce a more reliably
predicted behaviour (Smith 2005). Studies to understand individual behaviour towards
environmental concerns should equally combine cognitive variables and socio-economic
determinants (van Liere and Dunlap 1980). According to van Raaij (1981: 6), ‘a better
integration of psychological variables in economic science will be reached when both
economic and psychological variables are entered into a model, hypothesis, or theory’. The
following section offers a discussion of the roles of social psychological theory in the study
of adoption behaviour.

50
Table 2-9: Differences in assumptions between the economic model and psychological model
Assumptions Economics Psychology
Reference level
Each individual has stable and coherent preferences. Given a set of options and probabilistic beliefs, a person is assumed to maximise the expected utility of a chance.
A person’s preferences are often determined by changes in outcome relative to his reference level, known as the status quo. For example, people dislike losses significantly more than gains.
Social preference
People deem to base on maximal-benefits criterion when making allocation.
Many people feel that goods should be allocated according to the maximin criterion. That is, social preferences over other people’s consumption depend on the behaviour, motivations, and intentions of those other people.
Biases in judgement
When faced with uncertainty, people form their subjective probabilistic assessments according to the laws of probability.
People rely on heuristic principles which reduce the complex tasks of assessing probabilities and predicting values to simpler judgement operations.
Reciprocity and attribution
People’s propensity to engage in any behaviour is primarily determined by whether or not it is in their financial interest.
People determine their personality/ behaviour toward others according to motives attributed to these others, not solely according to actions taken.
Misperceived utilities
Each individual always selects the most preferred option from the feasible set.
People do not always accurately predict their own future preference, nor even accurately assess their experienced well-being from past choices.
Preference reversal
People occupy the same preference, though there might be difference in the elicitation procedure.
People prefer different choices in different circumstances. That is, the presentation of a choice may draw our attention to different aspects of a problem.
Time-variant preference
Economists model people’s tastes by assuming the people discount stream of utility over time exponentially. In other words, an individual’s intertemporal preferences are time-consistent.
Psychologists believe that an individual’s short term tendency to pursue immediate gratification is inconsistent with the long term preference.
Sources: Smith (2005); Kurz (2002); Rabin (1998); Tversky and Kahenman (1986)

51
2.2.2 Roles of social psychological theories
This thesis introduces the Theory of Planned Behaviour (TPB) and Q-Methodology to
understand human behaviours. As discussed above, the inclusion of social psychological
theories is useful to look beyond the rational economic assumption. It is expected that the
integration of social psychological concepts can better explain human behaviours by
informing and improving the understanding of farmers’ decision process and attitudes
towards BMP adoption. The following sections offer a discussion regarding the development
of social psychology theory in the context of environmental behaviour.
2.2.2.1 Theory of Planned Behaviour
In agricultural economics, the most common feature to elicit farmers’ objectives is the use of
self-report questionnaires (Garforth and Rehman 2005). In the mid 1970s, the Theory of
Reasoned Action (TRA) is a first model reliably demonstrating a link between attitudes and
behaviour. TRA assumed that the most important determinant to predict actual behaviours is
behavioural intention. The intention to perform is a combination of attitudes towards such
behaviour, and subjective norms. The TRA assumption is limited when an individual
perceives their ability to successfully carry out a behaviour to be low, and when a behaviour
is not under full volitional control (Burton 2004). As a consequence, the Theory of Planned
Behaviour (TPB) was added to the TRA model to address this inadequacy by adding a third
element, known as perceived behavioural controls. The principle of TPB is incorporated into
the economic framework of decisions and behaviour in order to explain and predict
complexity of farm decision-making. TPB is applicable when studied behaviour is voluntary
and not bounded by prior commitment, and where deliberated thought about performing
choice is involved (East 1993).
Beedell and Rehman (2000) highlighted that research work in the domain of adoption
behaviour has moved from descriptive to predictive models in order to response to policy
implementation. A number of studies have applied TPB to assess significant psychological
factors in farmers’ decision-making processes. For example, Rehman et al. (2007) developed
questionnaires with psychological constructs to predict farmers’ intentions to adopt new
technologies on dairy farms. Hattam (2006) applied TPB to investigate psychological
barriers to the adoption of organic production in Mexico. Fielding et al. (2005) used TPB as

52
a framework to understand the extent to which beliefs influenced decisions to develop
riparian zone management on farm, and van Gossum et al. (2005) applied TPB to identify
who encouraged farmers to adopt government policy of multifunctional forest management.
In Thailand, TPB has been applied in information technology adoption (Kripanont 2007;
Tetiwat and Huff 2003), clinical research (Saengcharoen et al. 2008), and recycling
behaviour (Chaisamrej and Zimmerman 2007). This suggests that the application of TPB in
the context of agricultural policies in Thailand is relatively new, and the behavioural study
based on TPB could provide insights into psychological factors facilitating BMP adoption.
TPB provides predictive advantages when modelling farmers’ behaviour in responding to
policy change. Firstly, TPB provides an understanding between attitudes and behaviour
through the incorporation of additional variables from social psychology. This allows an
analysis based on individual perspectives. Secondly, TPB suggests beliefs and attitudes
influencing behaviour, and at the same time it determines the relative importance of those
factors. Thirdly, it combines both qualitative and quantitative analyses to understand, and
predict potential behaviour (Ajzen 1991). Lastly, TPB can offer policymakers the potential
to design a more targeted intervention to induce a desirable behaviour. This combination of
approaches lends depth and clarity to address decision-making related issues.
2.2.2.2 Q-Methodology
An application of social-psychology methods to improve understanding of farmers’ decision-
making is widespread (Garforth and Rehman 2005). Of many methods, Q-Methodology is
applied to uncover different patterns of thought, and better understand the concerns of
farmers in relation to an adoption of conservation practices. Q-Methodology is a technique
for studying human subjectivity (Stephenson 1953). Originating in psychology research, the
method has now been used in other disciplines including the fields of communication,
political sciences, health sciences, and more recently, in ecological and environmental
studies. Empirical studies show that there are no universally significant factors affecting
adoption of conservation agriculture, and a targeted policy approach should be designed to
the particulars of a locale, or preferably, to individual farmers and their farm operations
(Knowler and Bradshaw 2007). Q-Methodology is applied in this thesis to segment farmers
based on their salient attitudes towards BMP adoption, and to investigate different attitudinal
variables influencing different groups, or subgroups, of farmers.

53
Evidence from Q-Methodology is increasingly being used to inform policy decisions. Hall
(2008) investigated farmers’ attitude towards Genetically Modified crops cultivation in
Scotland. Davies and Hodge (2007) employed Q-Methodology to investigate the perceptual
frameworks of a sample of UK arable and mixed lowland farmers regarding the appropriate
way in which to approach the environmental management of agricultural land. Further
applications have been undertaken by Barnes et al. (2007) who investigated farmer attitudes
to Nitrate Vulnerable Zone regulation. Brodt et al. (2004) considered the adoption of
biologically integrated agricultural practices from the perspective of almond and wine grape
farmers. Ellis et al. (2007) explored the nature of public acceptance of wind farms in
Northern Ireland, and Kramer et al. (2003) focused on the reasons why some dairy producers
in Uruguay had not participated in a registry system. In Thailand, the application of Q-
Methodology has been recently introduced in relation to policy perspectives of an epidemic
disease (Brown and Wattanakul 2008).
Q-Methodology offers several methodological advantages over other predictive multivariate
analysis of behaviour or adoption. The first is that Q-Methodology is self-referent, and does
not require pre-defined attitudinal variables. Rather it draws directly on discourses from the
population studied, hence it lessens the extent of researchers’ bias (Barnes et al. 2007).
Secondly, the use of factor analysis in Q-Methodology relies on different approaches to the
typical R-Methodology use of factor analysis7
. In Q-Methodology participants are the
variables. They are correlated with each other to produce factors linking those who have
similar attitudinal perspectives. In contrast, R-Methodology provides analysis based on
differences amongst all participants for each variable, such as age and gender, and there is no
interaction between participants (Steelman and Maguire 1999; Fairweather et al. 1998). The
different philosophy in Q-Methodology provides an alternative lens through which to reveal
preferences, values, and interests underlying the participants’ understanding of the research
topic (Brown et al. 2008; Durning and Brown 2006). Lastly, a series of Q methodological
steps comprise both quantitative and qualitative approaches. The combination of numerical
analysis and qualitative interpretation combines statistical significance to clarity of attitudes
(Barry and Proops 2000), and thereby increasing the level of research reliability and validity
(Silverman 2006; Furlong et al. 2000).
7 R-Methodology is a typical factor analysis method, where researchers look for correlations amongst
variables (i.e. personal traits such as age, gender, education, etc.) across a set of people.

54
2.3 Summary
The above discussion highlights a number of salient issues that need to be kept in mind as
this thesis evolves. At a global scale, nonpoint source pollution from agricultural activities
stands as the primary cause of water quality problems. It is one of the most complex
environmental problems and its impacts are extensive. The pollutant discharge results in
degraded water quality, and preventive measures are needed to intercept pollutants before
reaching water bodies. As sources of agricultural pollution are difficult to identify, it cannot
be easily controlled by government regulation and monitoring. Experience in developed
countries showed that control of pollution at its source is considered the best strategy for
managing nonpoint source pollution. One option is to introduce BMPs for controlling
agricultural pollution at a watershed level.
However, in the development and promotion of BMPs it is assumed that farmers are
homogeneous in goals and preferences, and it is suggested that behavioural theory may offer
an alternative approach to investigate adoption reasons and behaviours. It is, therefore,
essential to understand the adoption process beyond the purely economic-based model of
farmer decision-making. Instead, BMP uptake should be perceived as a human behavioural
issue, and the TPB and Q-Methodology are suggested by this thesis to supplement the
economic model of adoption behaviour. The TPB is useful to explain adoption intentions,
and to identify factors that will influence farmers to implement BMPs. Q-Methodology
identifies different attitudes towards BMP adoption, segments farmers, and indicates which
farmers are willing to adopt BMPs.
The next chapter presents the costs of twelve BMPs that are proposed for citrus farms in the
Ping river basin. Given the fact that cost is one barrier in the adoption of new technology,
information about these costs gives a basic overview of compliance costs incurred by
farmers. This information would then be useful in the design of water-related PES
programme, i.e. levels of incentive to induce farmers’ participation.

55
3 FARM-LEVEL COST ANALYSIS
Cost is usually thought to be the main barrier to the adoption of new conservation practices.
This chapter aims to investigate cost structures in citrus production, cost components in
BMP installation and maintenance, and the magnitude of costs incurred by farmers. Its
context is set out in Figure 3-1. Section 3.1 begins with a farm budget presenting fixed and
variable costs in citrus production. Section 3.2 presents a description of BMP functionings,
potential benefits from adoption and the effectiveness of BMPs. Section 3.3 presents the
assumptions of costs categorisation and cost estimation for BMPs.
Figure 3-1: Thesis structure

56
In this section, the assessment represents an approximation of the costs that would be
expected if BMPs were fully implemented. Calculated on the assumption that all practices
are optimally sized and designed from an engineering point of view, BMP costs are divided
into two components, which are installation and annual maintenance costs, and land
opportunity cost. In section 3.4, to compare investment projects of unequal lifespans,
annualised costs of all twelve BMPs are presented. Section 3.5 discusses the generalisation
of these cost estimates and addresses the necessity of the cost study. This chapter closes with
a summary of key findings in section 3.6.
3.1 Farm Budget of Citrus Production
Cost structure of citrus cultivation involves initial and annual costs. Initial costs are
investment costs needed to set up the plantation, such as land preparation, furrow
ploughings, irrigation system installation, seedlings, and labour hired for planting. These
costs are unique to each farm. The most common classifications of annual costs are variable
and fixed costs (Peris Moll and Julia Igual 2006; Julia Igual and Server Izquierdo 2000). In
this thesis, the focus is on the annual cost of citrus production as this can provide basic
information for an analysis of farm-level costs and the estimation of opportunity costs in
relation to the BMP adoptions.
Variable costs are the costs that vary with yield within a production period, while fixed costs
are those remaining the same within a production period and do not vary with the level of
yield. In this study, annual budgets of costs and revenues for mature trees (i.e. the pay back
period is after the third year) are estimated. Estimated costs are average costs from year 2002
to 2007, while estimated revenues are based on the average selling price from year 1984 to
2008 (Table 3-1). Variable costs include labour cost, input cost, and interest on working
capital8
, while fixed costs include land rent, equipment ownership costs and interst expense.
8 Julia Igual and Server Izquierdo (2000) argued that interest on working capital is an opportunity cost
comprising the combined costs generated by factors of production invested during the production period, and which are used up in a single process. As it is a capital, it generates costs in the form of interest.

57
Table 3-1: Cost structure in citrus production
Descriptions THB/ rai % Variable costs1 1 Labour costs 1.1 Weeding, pruning and spraying 5,157.4 31.8 1.2 Harvesting 2,848.8 17.5 2 Inputs 2.1 Fertiliser and manure 2,863.0 17.6 2.2 Pesticide, herbicide and fungicide 1,784.0 11.0 2.3 Equipment operating costs (i.e. fuel and lubricants) 649.8 4.0 2.4 Machinery rental 526.3 3.2 2.5 Repairs and maintenance 112.0 0.7 3 Interest on working capital 1,045.6 6.4 Total variable costs (A) 14,986.7 92.3 Fixed costs2 4 Land rent 510.1 3.1 5 Equipment ownership costs (i.e. irrigation system depreciation) 677.9 4.2 6 Interest expenses 61.1 0.4 Total fixed costs (B) 1,249.0 7.7 Total (C) = (A) + (B) 16,235.7 100.0 Average yields (kg/ rai)3 (D) 6,500.0 Selling price (THB/ kg)4 (E) 15.1 Revenue (F) = (D) x (E) 98,215.0 Returns over variable costs (G) = (F) – (A) 83,228.3 Net returns (H) = (F) - (C) 81,979.3 Given there are 65 trees/ rai, then Returns/ tree = THB1,280.4 Return/ sq.m. = THB53.0
Sources: (1) OAE (2007) (2) OAE (2007) (3) Farmers’s interview: 100kg/ tree; 65 trees/ rai (4) DOAE (2007b)
Note: The costs and revenues from citrus production are calculated for the pay-back period after the third year.
Variable cost is the most important cost in the production, and it is as high as 92.3% of the
total costs. Within the variable cost category, labour cost on weeding, pruning and spraying
has the highest share. This is followed by fertiliser and manure (17.6%), and labour cost for
harvesting (17.5%). Fertiliser and manure represents the highest expenses within all the
inputs used in the production. This information is similar to Namruengsri’s study (2005)
which revealed that approximately 20% of farm expenses are for fertiliser. The total variable
cost is estimated at THB14,986.7/ rai. The fixed cost is related to fixed factors in citrus

58
production, and it is estimated at THB1,249/ rai. The farm revenue is calculated by
multiplying average yield per rai with average selling price, and this is equal to THB 98,215/
rai. The returns over variable costs remain THB 83,228.3/ rai, and the net return is THB
81,979.3/ rai.
3.2 Functions of BMPs
The Ping river is close to or passes through many of the major cities, including Chiang mai
and Nakorn Sawan. Moreover, the Ping river is one of the four upstream tributaries flowing
southwards to form the Chao Phraya river, located the largest alluvial plain. Accordingly,
water management in the Ping river basin needs to address both freshwater quantity and
quality. Twelve BMPs, providing flexibility to accommodate local needs and site specific
conditions, were selected from expert judgement. The functions, environmental benefits and
effectiveness of each BMP based on literature are presented. In some cases, there is no
available research predicting the BMP effectiveness, and it is fully recognised that additional
research is required to establish this study.
Scheduling water structure
The traditional method of flood irrigation is widely seen in the lowland of the Ping river
basin. Farmers rely on the techniques including diking, polderisation and the use of raised-
bed plots (Figure 3-2). Water flows between the main irrigation canal or river and the plots.
Water intake and drainage can be done by gravity (i.e. through intake), or by pumping.
Inside each polder, raised-bed plots lie in parallel with unlined ditches, in which water
stagnates permanenetly. The raised-bed plots are normally 6m wide. The width of ditches is
usually 1.5m, and the depth is approximately 1m. Irrigation sprayed from a small boat is
commonly used in the raised-bed plantation.

59
Figure 3-2: Irrigation system in the downstream area of the Ping river basin
This BMP requires farmers to check on the conditions of on-farm irrigation structure (i.e.
intake, drain) and to maintain the farm ditches (i.e. bottom slope, ditch cleaning). The
objective of this BMP is to ensure that the irrigation structure can properly function, and the
ditches can provide additional storage and reduce the impacts associated with heavy rainfall
(i.e. reduce sudden discharge) (Florida Department of Agricultre and Consumer 2004; US
EPA 2000) . This BMP also provides habitats for a range of species if properly managed.
The effectiveness of this BMP is site dependent (SEPA 2010).
Apply herbicide within tree canopy
According to the Florida Department of Agriculture and Consumer Services (2005), grassed
soil beyond the canopy line can serve as filters and prevent sediment movement from the
fields into the drainage systems. Excessive herbicide band width may result in considerable
erosion of soil particles in particular during rainfall. The effectiveness of this BMP is site
dependent (Florida Department of Agriculture and Consumer Services 2005).
Basic restrictions for pesticide application
BMP in the context of this discussion is to i) promote the proper handling of pesticides,
fungicides and herbicides (i.e. storage); ii) improve application techniques (i.e. maintenance
and calibration and protective clothing); and iii) record the use of chemicals (i.e. time and
amount of application, type of chemicals used). The ultimate aims of this BMP are to

60
gradually educate farmers on the danger of excessive/ improper use of chemicals, and raise
awareness of responsibility in chemical application. The effectiveness of this BMP is site
dependent (SEPA 2010).
Soil analysis
Namruengsri’s study (2005) reveals that more than 20% of farm expenses are for chemical
fertiliser and hormone, and approximately 50% of these expenses are unnecessary. The study
shows that Thai farmers apply chemicals at the unnecessarily high rates only to maintain
fruit appearance. The Florida Department of Agriculture and Consumer Services (2004)
recommends a basic nutrient management with a consideration on soil, water, organic matter
sample analysis and expected crop yields. Thus, this BMP mainly aims to manage the
amount, source and timing of nutrient application, and then apply organic fertilisers to match
with crops’ needs. According to SEPA (2010), the effectiveness of this BMP is site
dependent but it is remarkably effective in the management of dissolved N and P.
Vegetative cover
Both a row crop with drip irrigation and a row crop with mini-sprinkler system are widely
seen in the upstream of the Ping river basin. The drip irrigation is done through drip tape or
tube buried below the soil surface, and a pump is needed to provide the right pressure for
water delivery into the pipe system. Similarly, with mini-sprinklers water is applied
throughout the field by mini-sprinklers connected to a pressurised pipe system. Furrows
between tree rows serve as both farm road and drainage during flash flood. The width of the
furrows is approximately 6m.
This BMP requires a consistent bottom slope on furrows in order that a uniform vegetative
cover can slow the overland flow, thus minimising the velocity of runoff and level of
devastation of flash flood in hilly area especially during heavy rainfall. The primary aim of
this BMP is to manage water discharge during rainfall events, but it also benefits in erosion
control (Florida Department of Agriculture and Consumer Services 2004). Moreover, when
the vegetative cover is densely planted this practice can control the growth of noxious weeds
(USDA and Mississippi State University 1999). According to Schuster (1996), the amount of
cover and the rate of infiltration are greatest under trees and shrubs. This is followed by, in
decreasing order, bunchgrasses, shortgresses and bare ground.

61
Mulching
This BMP requires materials such as straw and grass to cover soil surface. The main
objective of this BMP is to stabilise soil and control erosion by slowing the runoff and
trapping sediment. Other benefits are to retain nutrients and moisture, slowly release
nutrition, and assist germination (Florida Department of Agriculture and Consumer Services
2004). Sediment reduction by straw mulch without vegetation is 90-95% for a few months,
and this gradually drops to 70% in six months. Nutrient reductions are estimated to be 60-
80% for a very first month and reduce to 50% in six months (IDEQ 2005).
Vegetative buffer strip
Vegetative buffer strip is a sloping area of vegetative cover that filters pollutants before they
reach the water body. In Thailand, a tropical plant known as Vetiver grass is extensively
used to serve this purpose. Krutz et al. (2004) state that this practice potentially reduce
herbicide transport from agricultural fields by increasing mass infiltration and adsorption,
compared with bare soil. Other benefits from this BMP are to intercept sediments and reduce
runoff velocity (Florida Department of Agriculture and Consumer Services 2004).
To function a water quality protection, the general recommended widths of buffer zone are 5
to 30 metres (Hawes and Smith 2005). The grass filter strip works best for sediment removal.
According to Krumrine (2004), an estimated reduction of sediment from the adoption of
vegetative filter strip is approximately 53-97%, while the reductions of N and P are also
estimated at 4-70% and 24-85%, respectively.
Grassed waterway
This practice is either natural or constructed channels for transporting of concentrated
runoffs. Green and Haney (2005) explain that the vegetation improves water quality as it
removes nutrients through plant uptake and soil absorption. Florida Department of
Agriculture and Consumer Services (2004) suggests that the treatment areas are more
effective in removing phosphorous attached to soil particles rather than dissolved N. Other
advantages from this BMP are to decrease flow velocity thereby minimising soil erosion, and
to provide habitats for widelife. The effectivenss of this BMP depends on soil characteristics,
land slope, vegetation, construction area, and the width of the grassed waterway (Green and
Haney 2005).

62
On-site retention storage
This BMP provides additional water storage; thereby assisting a long-term plan regarding
water management and minimising off-site discharge during heavy rainfall (Florida
Department of Agriculture and Consumer Services 2005). Moreover, this BMP also benefits
in sediment reduction in that it allows settlement of particles and biological treatment of
dissolved pollutants (SEPA 2010). In terms of water management, a sufficient size of pond
to retain water for up to 120 days requires an area of 10% of cultivated land (DOAE 2002).
The effectiveness of this BMP to reduce N and P particles are remarkably high, while its
effectiveness to reduce dissolved N and P is considered medium to low (SEPA 2010).
Terracing
This BMP recommends a construction of wide steps on a gentle gradient for cultivated land
with more than 30 degree slope. Wheaton and Monke (2001) argue that the major benefit
from terracing is to reduce soil erosion. This is because terraces breake up one long slope
and intercept rainfall runoff as it starts down a slope. Therefore, runoff is temporarily stored
and the amount and velocity of the spilling water is minimised. Moreover, terraces keep
eroded soil particles behind the terrace ridge; thereby reducing the potential of soil loss.
Carman (2005) states that the potential reduction of soil erosion by this BMP ranges from
10-50%. This BMP is most effective when used in combination with other BMPs, such as
conservation tillage and field borders.
Mix-load and wash-down site
Chemical spills results in expensively hazardous waste-cleanup and environmental
contamination. This BMP aims to reduce the impacts from the spills. The construction of
permanent mix-load and wash-down site provides a place where spills can be collected and
cleaned (Florida Department of Agriculture and Consumer Services 2005). Furthermore,
most farmers can receive the delivery of pestcides at sites where mixing and loading occurs.
Stover et al. (2002) suggest that pesticide storage should be built within a permanent mix-
load and wash-down site to avoid exposure to rain and wind. The suitable site for this BMP
should have no direct linkages to yard drains or ditches. The site should be 10 m away from
watercourses or 50 m from groundwater sources. The effectiveness of this BMP is site
dependent (SEPA 2010).
63
Riparian setbacks
This practice requires an established distances between natural watercourse and cultivated
land where soil disturbing activities are prohibited. In the context of citrus plantation,
setbacks could contribute to manage the offsite nutrient impacts. The setbacks also protect
and preserve native riparian and wildlife habitat (Florida Department of Agriculture and
Consumer Services 2005). The effectiveness of this BMP at removing sediments is site
dependent and related to many factors. The study of Chagrin River Watershed Partners
(2006) showed that the effectiveness of riparian buffer is directly related to its width and
land slope. For example, a 46 m riparian setback is needed on a 3% slope to reduce sediment
transport by 90%. Mayer et al. (2006)’s study revealed that the effectiveness of this BMP
depends on types of vegetative cover and buffer width. For example, N removal is predicted
at 50% with the 16 m width grass cover, and increases to 75% with the 47 m width grass
cover. With a combination of grass and forest cover, N removal is predicted to be 50% with
only the 5 m width, and increases to 75% with the 20 m width of buffer strip.
3.3 Cost Statement of BMPs for Citrus Production in the Ping River Basin
In terms of BMP adoption there are at least two components of cost facing farmers. These
are the installation and annual maintenance of BMPs, and the opportunity cost due to the lost
production of the land used for BMP installation (Field et al. 2006; Wossink and Osmond
2002). The installation costs will occur in the first year when the BMP is installed, whist
other costs such as maintenance, and opportunity costs may occur yearly through the life of
BMP implementation.
The bottom-up engineering approach is used to estimate BMP cost. In doing so, all elements
of work are listed, and the costs associated with each work item are assigned and summed to
obtain the total cost (Afari-Sefa et al. 2008). Cost components are derived from US EPA
(2008; 2000). Based on the worksheet calculated by engineer and agronomist (Khamkanya
2009; Namruengsri 2008), cost figures are estimated item-by-item (see Annex 2). Costs of
materials employed in BMP construction and establishment is estimated using 2007 prices
obtained from local retailers, and machinery and equipment is assumed to be rented at 2007

64
retail rates. The cost components of each BMP are illustrated in Table 3-2. The unit
measurement is illustrated in terms of THB/ rai9
.
Table 3-2: Cost components of BMPs (Year 2007) unit: THB1/ rai
BMPs Installation costs2
Annual maintenance
costs3 Land opportunity
costs4,5
Good Husbandry 1 Scheduling water structure 2,250 300 - 2 Apply herbicide within tree
canopy - 882 -
3 Basic restrictions for pesticide application
1,360 30 -
4 Soil analysis 3,300 1,650 - Vegetative Practices
5 Vegetative cover 1,200 400 - 6 Mulching 882 294 - 7 Vegetative buffer strip 1,125 90 Approx. 3,842– 6,4026 8 Grassed waterway 1,365 120 Approx. 6,402 – 8,9637
Structural Practices 9 On-site retention storage 15,155 765 Approx. 10,244–12,8058
10 Terracing 1,847 935 - 11 Mix-load and wash-down
site9 5,181 259 Approx. 3,841
12 Riparian setbacks 163 20 Approx. 2,561 – 3,84210 Notes:
(1) An average exchange rate Year 2007; GBP1 = THB69.53 (Bank of Thailand 2010b) (2) Instalment costs occur in the first year when BMP is installed (3) Annual maintenance cost such as machinery and labour cost is to ensure the effectiveness of
BMPs (4) Annual opportunity cost of land recognises the forgone opportunity of continuity the production
of crops on the land used for BMPs. It is calculated as gross margins of the crops, which is a value of output minus variable costs.
(5) The calculation is based on the assumption that each tree yields THB1280.4 per annum as shown in Table 3-1. This calculation also acknowledged that one rai accommodates 65 trees.
(6) This BMP requires at least 6m x 15m for critical zone in the field, thus it could cause a loss of 3-5 trees
(7) This BMP requires an area of 2.5m x 40m, thus it could cause a loss of 5-7 trees (8) This BMP requires an area of 160m2/ rai, thus it could cause a loss of 8-10 tress (9) Cost estimate of this practice varies by farm size. The calculation is presented in Annex 3 (10) This BMP requires an area of 40m2/ rai, thus it could cause a loss of 2-3 trees
3.3.1 Installation and Annual Maintenance Costs
Scheduling water structure
The construction of water structures (i.e. irrigation ditches) requires earthwork such as
excavation and planning of irrigation routes. There is further work removing unwanted tress
from the ditch lines. This costs approximately THB2,250/ rai. In the following years to
9 A land measurement unit in Thailand; 1 rai = 0.16 ha

65
maintain the ditch cross-sectional area, costs include ditch maintenance such as weed control
and sediment removal. This could cost THB300/ rai/ year.
Herbicide application within tree canopy
No installation cost is required for this practice. The cost of applying herbicide within the
tree canopy depends on several factors such as weed species, number and size of weeds,
weather condition, soil moisture and selective herbicide. To maintain the effectiveness of
this practice, the use of herbicide should be structured to maintain desired vegetation. For
example, applications should remove broadleaf vegetation while maintain grasses. The
estimated maintenance costs should not exceed THB882/ rai/ year including labour and
equipment.
Basic restrictions on pesticide application
The first year costs include spraying equipment and its accessories. This could cost
approximately THB1,360/ rai. Yearly maintenance includes labour and equipment
replacement, which are as low as THB30/ rai.
Soil analysis
The first year costs include soil collection equipment and soil collection training, analysis
services, interpretation manual, and use of appropriate organic fertiliser to target area. This
could cost THB3,300/ rai. Effective nutrient management in the following year requires
analysis services and use of appropriate organic fertiliser. This should not exceed THB1,650/
rai/ year.
Vegetative cover
The establishment costs of this BMP are based on seedling and types of grass matching with
the climatic conditions in the Ping river basin. Types of grass and seeding method affect the
cost of seeds and tillage. However, it is estimated that overall installation costs should not
exceed THB1,200/ rai. Yearly maintenance costs are THB400/ rai including reseeding in
destroyed areas and vegetative maintenance.

66
Mulching
The installation costs include materials such as straw or plastic sheeting. Labour costs are
incurred during the processes of mulching. Overall costs should not exceed THB882/ rai.
Proper maintenance includes re-mulching and re-layering and these can cost THB294/ rai/
year.
Vegetative buffer strip
If land is cleared and graded, installation of buffer strip could cost THB1,125/ rai. To
maintain the effectiveness of this practice, any excessive sediment on the buffer strip should
be removed periodically and the strip should be reseeded as necessary. Furthermore, the strip
should be mowed regularly. This yearly maintenance could cost THB90/ rai.
Grassed waterway
The establishing costs of this BMP vary depending on the equipment and labour costs,
grading, seed and fertiliser selected. Overall costs, however, should not exceed THB1,356/
rai. Once the vegetation is established its maintenance costs are minimal. These costs include
repairing rills and gullies and removing accumulation of deposited sediment, which can be
low as THB120/ rai.
On-site retention pond
Site selection is important in terms of topography, water supply and soil type. Installation
costs are varied and largely cover earthworks. The pond size of 10% of total planted area can
store water for up to 120 days. Therefore, the construction costs are expected to be
approximately THB15,155/ rai (for a pond sized 12.65m x 12.65m x 3m). Maintenance
costs are low but care may be needed for removal of excessive sediments. Trimming and
replanting vetiver grass is sometimes needed, if plant around the edges of a pond to prevent
sediment eroded from the pond’s edges. These annual maintenance costs should not exceed
THB765/ pond.

67
Terracing
Construction costs of terracing include earthwork to build terraces and outlet facilities.
Additional costs cover the vegetation establishment. Construction costs vary greatly
depending on the size of terrace and outlet. Typically, construction costs should not exceed
THB1,847/ rai. Periodic and post-run-off inspections are required with prompt repair of
damaged components. Moreover, maintenance of ridge height and outlet elevations, removal
of excessive sediment, and maintenance of the vegetated area that may require replanting are
also needed. These yearly maintenance costs are approximately THB935/ rai.
Mix-load and wash-down site
This practice requires an installation of chemical storage, and mix-load and wash-down
areas. Literature suggests that the size of functional areas of an operation depends on the
amount of pesticides stored at the facility (US Army Center for Public Works 1997; Kammel
and O’Neil 1990), and storage area should able to hold at least 10% more than chemicals
applied in latest season (Sumner and Bader 2009; Dean 2004). Accordingly, cost estimates
for this practice are based on the concept of mixed costs. That is, costs contain both fixed
and variable costs, and are partly affected by change in the level of activity (i.e. farm size
and chemicals application). Assumptions for cost estimates are presented in Annex 3.
Average installation cost is as high as THB 5,181/rai, while the annual maintenance cost is
estimated at THB259/rai.
Riparian setback
The setback distances are established from the edge of stream where riparian areas are left as
natural as possible. Typically, setback widths of 9.15m can serve an area of approximately
80.95rai (Geauga Soil and Water Conservation District 2006). With the assumption that a
farm has a square shape, an area of around 40.65m2/ rai is thus required for setback areas.
Though existing natural vegetation is usually preferred, planted stock may be used. The
overall installation costs are estimated at THB163/ rai. Annual maintenance costs include
subsequent cutting/ trimming, selective herbicide application, and replanting or reseeding
some damaged areas. These costs should not exceed THB20/ rai.

68
Figure 3-3 illustrates the proportion of installation and annual maintenance costs. The results
show that the construction costs occurred in the first year is very important for every BMP
adoption, excluding practice 2 (applying herbicide within tree canopy) from Good
Husbandry category.
Figure 3-3: Proportion of installation cost and annual maintenance cost (%)
Notes: The horizontal axis represents twelve BMPs. From left to right, Good Husbandry category includes practice number 1-4: 1) scheduling water structure; 2) apply herbicide within tree canopy; 3) basic restrictions for pesticide application; and 4) soil analysis. Vegetative Practice category includes practice number 5-8: 5) vegetative cover; 6) mulching; 7) vegetative buffer strip; and 8) grassed waterway. Structural Practice category includes practice number 9-12: 9) on-site retention storage; 10) terracing; 11) mix-load and wash-down site; and 12) riparian setbacks.
3.3.2 Land Opportunity Costs
Land opportunity cost occurs from taking land out of production. In this study, it is based on
related square meter of land necessary to build the appropriately sized BMP as recommended
by US EPA (2008). Annual opportunity cost of land is calculated as gross margins of the

69
crops (Wossink and Osmond 2002). The calculation is based on the assumption that each rai
can accommodate 65 trees, and each tree yields THB1280.4/ year (i.e. this is a return over
variable costs).
In this study, five BMPs incur land opportunity costs. These are vegetative buffer strips,
grassed waterways, an on-site retention pond, a mix-load and wash-down site, and riparian
setbacks. The opportunity costs of the remaining practices are considered zero (Table 3-2).
The installation of vegetative buffer strip is recommended only in critical zone in the field,
and the land opportunity cost is approximately estimated as THB3,842 – THB6,402/ rai.
Land opportunity cost for grassed waterway can be estimated to range from THB6,402 –
THB8,963/ rai. The construction of on-site retention pond causes a land opportunity cost of
as high as THB10,244 – THB 12,805/ rai. The opportunity cost for installation of permanent
station for mix-load and wash-down is estimated at THB3,841/rai. Finally, the opportunity
cost for the establishment of riparian setback is estimated as around THB2,561 – THB3,842/
rai.
3.4 Annualised Costs
The expected lifetime of each BMP varies. For cost comparison, installation costs are
reduced to annual values using the relationship (Gitau et al. 2004) in equation 1:
nBMPr
rZA −
+−
=
10011
100
(Equation 1)
where
ABMP Annualised cost for BMP (THB)
Z Capital cost of a BMP (THB)
r Time value of money or the private discount rate (%)
n Expected lifetime of the BMP (years)
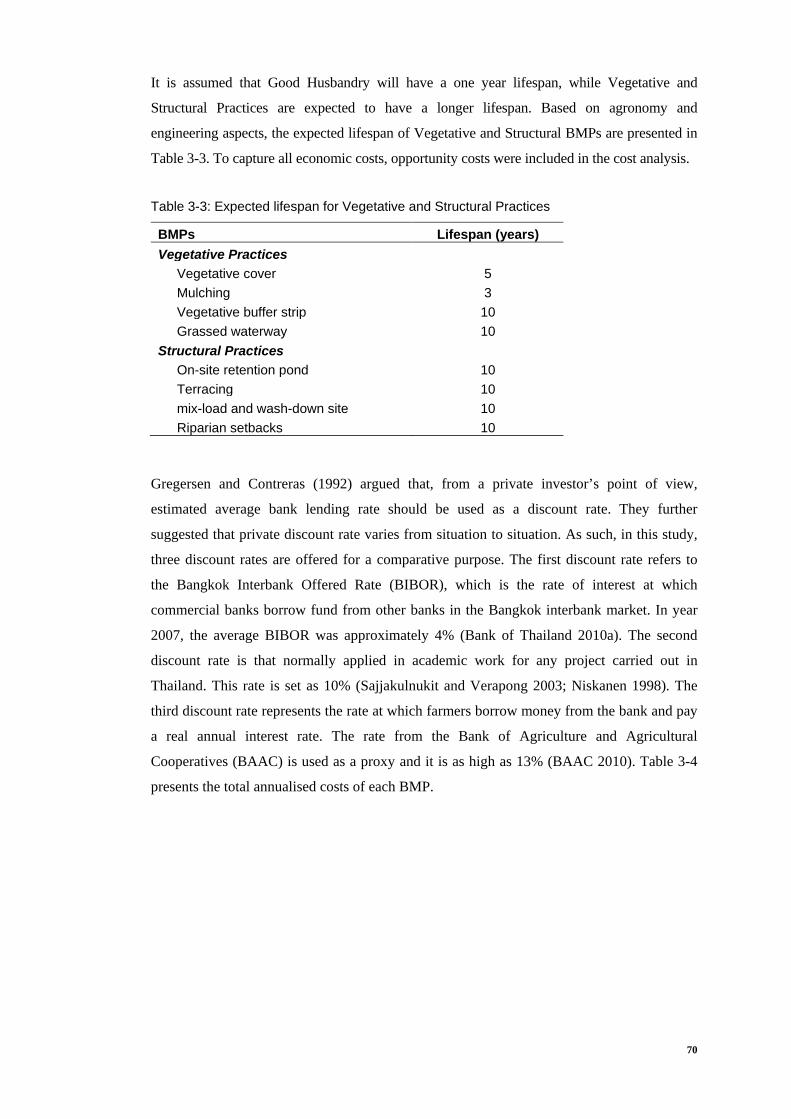
70
It is assumed that Good Husbandry will have a one year lifespan, while Vegetative and
Structural Practices are expected to have a longer lifespan. Based on agronomy and
engineering aspects, the expected lifespan of Vegetative and Structural BMPs are presented in
Table 3-3. To capture all economic costs, opportunity costs were included in the cost analysis.
Table 3-3: Expected lifespan for Vegetative and Structural Practices
BMPs Lifespan (years) Vegetative Practices
Vegetative cover 5 Mulching 3 Vegetative buffer strip 10 Grassed waterway 10
Structural Practices On-site retention pond 10 Terracing 10 mix-load and wash-down site 10 Riparian setbacks 10
Gregersen and Contreras (1992) argued that, from a private investor’s point of view,
estimated average bank lending rate should be used as a discount rate. They further
suggested that private discount rate varies from situation to situation. As such, in this study,
three discount rates are offered for a comparative purpose. The first discount rate refers to
the Bangkok Interbank Offered Rate (BIBOR), which is the rate of interest at which
commercial banks borrow fund from other banks in the Bangkok interbank market. In year
2007, the average BIBOR was approximately 4% (Bank of Thailand 2010a). The second
discount rate is that normally applied in academic work for any project carried out in
Thailand. This rate is set as 10% (Sajjakulnukit and Verapong 2003; Niskanen 1998). The
third discount rate represents the rate at which farmers borrow money from the bank and pay
a real annual interest rate. The rate from the Bank of Agriculture and Agricultural
Cooperatives (BAAC) is used as a proxy and it is as high as 13% (BAAC 2010). Table 3-4
presents the total annualised costs of each BMP.

71
Table 3-4: Annualised cost estimates for twelve BMPs
unit: THB/ rai
BMPs Installation costs
Annual maintenance
costs
Average land opportunity
costs1
Annualised installation cost Total annualised costs
4% 10% 13% 4% 10% 13% Good Husbandry 1. Scheduling water
structure 2,250 300 - 2,340 2,475 2,543 2,640 2,775 2,843
2. Herbicide application within tree canopy
- 882 - - - - 882 882 882
3. Basic restrictions for pesticide application
1,360 30 - 1,414 1,496 1,537 1,444 1,526 1,567
4. Soil analysis 3,300 1,650 - 3,432 3,630 3,729 5,082 5,280 5,379 Vegetative Practice 5. Vegetative cover 1,200 400 - 270 317 341 670 717 741 6. Mulching 882 294 - 318 355 374 612 649 668 7. Vegetative buffer
strip 1,125 90 5,122 139 183 207 5,351 5,395 5,419
8. Grassed waterway 1,365 120 7,683 169 222 252 7,971 8,025 8,054 Structural Practice 9. On-site retention
storage 15,155 765 11,525 1,869 2,466 2,793 14,158 14,756 15,082
10. Terracing 1,847 935 - 228 301 340 1,163 1,236 1,275 11. Mix-load and wash-
down site 5,181 259 3,841 639 843 955 4,739 4,943 5,055
12. Riparian setbacks 163 20 3,202 20 27 30 3,242 3,248 3,252 Notes: 1) Average value is used as a proxy of land opportunity costs
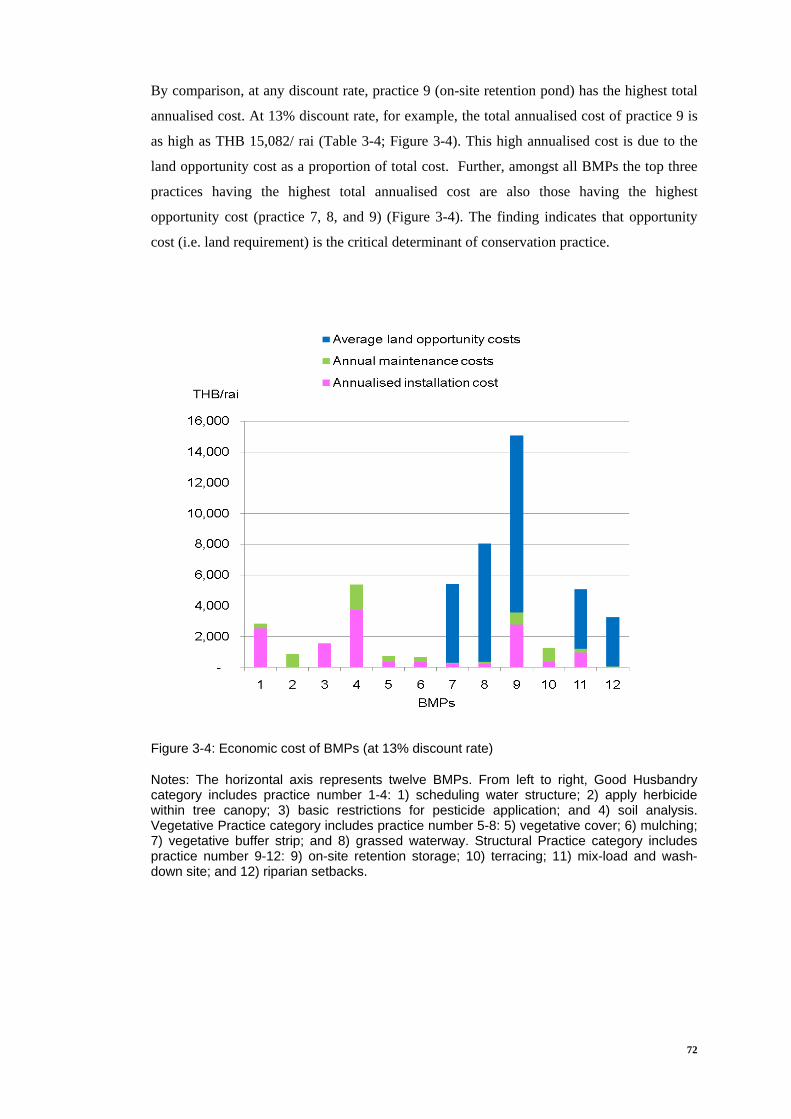
72
By comparison, at any discount rate, practice 9 (on-site retention pond) has the highest total
annualised cost. At 13% discount rate, for example, the total annualised cost of practice 9 is
as high as THB 15,082/ rai (Table 3-4; Figure 3-4). This high annualised cost is due to the
land opportunity cost as a proportion of total cost. Further, amongst all BMPs the top three
practices having the highest total annualised cost are also those having the highest
opportunity cost (practice 7, 8, and 9) (Figure 3-4). The finding indicates that opportunity
cost (i.e. land requirement) is the critical determinant of conservation practice.
Figure 3-4: Economic cost of BMPs (at 13% discount rate)
Notes: The horizontal axis represents twelve BMPs. From left to right, Good Husbandry category includes practice number 1-4: 1) scheduling water structure; 2) apply herbicide within tree canopy; 3) basic restrictions for pesticide application; and 4) soil analysis. Vegetative Practice category includes practice number 5-8: 5) vegetative cover; 6) mulching; 7) vegetative buffer strip; and 8) grassed waterway. Structural Practice category includes practice number 9-12: 9) on-site retention storage; 10) terracing; 11) mix-load and wash-down site; and 12) riparian setbacks.

73
3.5 Discussion
Cost analysis in this chapter offers a better understanding of the key financial factors that
might influence farmers’ adoption intention. The value transfer of these estimated costs to
other studies must be done with care because the cost estimates related to the implementation
of BMPs in citrus farms are site-specific. For example, the installation cost of practice 10
(terracing) was calculated for the terrace system that is suitable for citrus farms. The
opportunity cost was calculated based on yield reduction. The use of these cost figures for
other crops or other areas in the country may not appropriate. However, the lists of cost
elements represent diverse conditions over the entire country, and policymakers can adopt
these cost elements as guidelines for a cost estimate of BMPs in other studies.
Overall, this study provides basic information about the total amount of money required for
establishing a particular BMP at farm level. It also offers a comparison of annualised costs
between various BMPs. This information is critical to guide policymakers about how to
allocate public resources in order to encourage BMP adoption (Afari-Sefa et al. 2008;
Wossink and Osmond 2002). Though cost estimates cannot provide conclusive evidence for
predicting any desired water quality level, cost information can provide some insights about
whether farmers make decisions based on costs. This can be further investigated in
comparison with frequency of adoption intention (i.e. stated intention which will be derived
from the application of TPB in chapter 4). In sum, economic cost estimates can offer insights
into economic clarity around implementation costs of BMPs, allow a comparison of various
BMPs, and provide understanding about whether farmers make decisions based on costs.
3.6 Summary
The analysis in this chapter stems from the notion that cost is one barrier in the adoption of
new technologies. The objectives of this chapter are to i) illustrate the farm budget in citrus
production; ii) present BMP functions and its potential benefits and effectiveness; and iii)
estimate the cost of BMP adoption and understand cost structure of BMPs recommended for
citrus farms in the Ping river basin. BMP costs are separated into installation cost, annual
maintenance cost, and land opportunity cost. BMP costs were based on the bottom-up
approach. By doing so, labour-hours and materials of each element of work are estimated,
priced and accumulated into a total cost. For comparison, annualised cost was calculated for

74
capital cost of BMPs which have different lifespans. The analysis revealed that installation
cost is very important in BMP adoption, but for some BMPs, particularly those in Vegetative
Practice and Structural Practice categories, land opportunity cost outweighs the installation
and annual maintenance costs. The cost information is useful in the design of PES
programme. Provided that costs influence farmers’ adoption, these costs could indicate the
level of incentive payments to induce farmers’ participation. The main conclusion derived
from this analysis is that in terms of actual cost, land opportunity cost is a large proportion of
total costs. This is followed by first-year installation cost and annual maintenance cost.

75
4 A MODIFICATION OF THE THEORY OF PLANNED
BEHAVIOUR
The literature review in chapter 2 shows that there are differences in underlying assumptions
between economics and psychology. To a degree, adoption models provide little attention to
psychological variables influencing behaviours and adoption intentions (Shogren and Taylor
2008). Hence, an alternative approach is needed to understand human behaviour better. This
chapter introduces a psychological theory, the Theory of Planned Behaviour (TPB), to
supplement the economic model of BMP adoption. The scope of analysis is based on the
integration of the TPB and statistical analysis (Figure 4-1).
Figure 4-1: Thesis structure

76
Section 4.1 reviews the application of TPB in the domain of environmental policy, followed
by a transitivity concept in relation to farmers’ preferences towards BMPs. Then, it presents
how to obtain psychological variables through an elicitation study and content analysis, and
further discusses external variables to be considered in this adoption intention study. These
variables will be included in a questionnaire, and treated as independent variables. Next, the
processes of questionnaire development and fieldwork administration are then outlined.
Section 4.2 presents descriptive statistics of farmers. This chapter closes with a summary of
the main findings (section 4.3).
4.1 Theory of Planned Behaviour
4.1.1 Basic TPB constructs and the concept of behavioural intention
TPB attempts to explain human behaviour. It postulates that a particular behaviour can be
predicted from the behavioural intention to perform such behaviour. This intention can be
predicted from three psychological constructs: attitude towards the behaviour; subjective
norm about the behaviour; and perceived behavioural control of the behaviour (Ajzen 2006;
Ajzen 1991) (Figure 4-2). The common method to measure these three variables is a survey
using a TPB-constructed questionnaire. In this section are the three basic constructs of the
TPB and evaluation of behaviour.
Figure 4-2: Basic TPB model
Sources: adapted from Ajzen (2006), and Ajzen (1991)

77
4.1.1.1 Attitude
Attitude is the overall positive and negative evaluation of performing the behaviour. It is a
product of personal evaluation of the outcome associated with the behaviour (or outcome
evaluation) indexed by personal perception about the consequence of the behaviour (or
behavioural belief). It is hypothesised that the more favourable the attitude, the more likely
the adoption.
4.1.1.2 Subjective norm
Subjective norm is the perceived social pressure whether to perform. It is the product of
belief about how referent group would like an individual to behave (or normative belief)
indexed by likelihood of compliance (or motivation to comply). It is hypothesised that the
more favourable the subjective norm, the stronger an individual’s intention to have that
behaviour.
4.1.1.3 Perceived behavioural control
This is the degree in which an individual feels able to perform. It is assumed to reflect past
experiences and anticipated impediments. Perceived behavioural control is a product of
belief about both situational and internal factors controlling the behaviour (or control belief
strength) indexed by perceived power of these factors (or control belief power). It is
hypothesised that the greater the perceived behavioural control, the more likely the adoption.
4.1.1.4 Behavioural intention
According to the TPB, intention is assumed to be an approximate measure of actual
behaviour. Behaviour is determined based on an individual’s intention to perform or not
perform an action (Ajzen 1991). Most TPB studies apply a multipoint scale (i.e. 7-point
scale) to measure a common dimension of intention (e.g. from scale of 1 to 7, how likely do
you think you will perform n activity?). Intention is conceptualised as a probability
continuum, and further transformed into a dichotomous behaviour representing a YES/NO
response. Intention and actual behaviour are assumed to have a linear relationship (i.e. the
greater the intention, the greater the probability of actual behaviour performing) (Sutton
1998). This could cause a lack of correspondence because there are seven points on the

78
intention scale but only two for behaviour (Luzzi and Spencer 2008). Further, this could
raise the argument of how well intention can predict the actual behaviour with considerable
accuracy. According to Sutton (1998), intention can be treated as a dichotomous outcome
variable which could allow the possibility of a better prediction for behaviour. A few TPB
studies attempt to assess the link between intention and actual behaviour by defining
intention in terms of a dichotomous dependent variable (Wauters et al. 2010; Mayet and
Niess 2008; Fagan et al. 2008; Gabler and Jones 2000).
On a related point, actual behaviour is the result of competition amongst options (Laroche
and Sadokierski 1994), and behavioural intention can be better predicted when people are
asked to consider relative distinctiveness amongst options (Axelrod 1968). As such, a
construction of more specific questions, such as those giving choices and asking for
selection, and situation-based questions are superior and can increase the probability of
getting accurate responses (Ovans 1998). Similarly, a set of intention simulations imitating
real situations could be a more valid proxy measure for actual behaviour, because it more
closely approximates the condition that requires complex decisions (Francis et al. 2004).
Taking into account the debate over the nature of behavioural intention and previous works
relating to BMP adoption, 12 specific BMPs (see Table 1-5, Chapter 1) became the basis of
both the belief and behavioural sections of the questionnaire to study farmers’ adoption
decision as a dichotomous choice. Each measure was encouraged by agronomists for reasons
of practicality and suitability to the study area. The next section describes a ranking process
relating to adoption intention.
4.1.2 Rank-ordering of the options
According to Greiner et al. (2009), farmers will adopt an innovation if they expect that the
practice helps them achieve social, economic, environmental and other goals. In other words,
farmers decide which BMP according to its anticipated consequences. Throughout, this study
assumes that each BMP possesses an inherent desirability and farmers determine how likely
a particular BMP is to be preferred to another. This implication is based on the concept of
transitivity of an individual’s preferences (Wu and Annis 2007), and this type of response is

79
classified as sentiment where there is no veridical comparison10
(Nunnally 1978). The
transitivity concept could be defined as: if A is preferred to B; and B is preferred to C; then
A is preferred to C.
In this study, twelve intention simulations representing corresponding BMPs were presented
to participants. The BMPs were presented as a proxy service in a PES programme. The main
messages sent to farmers were that the adoption will lead to an improvement in water quality
and those who adopt BMPs will be compensated by the beneficiaries downstream. Each
simulation comprised basic information, including implementation methods, relevant
environmental benefits from adoption, and cost components of each BMP. Both benefit and
cost figures were not presented to farmers. This is because in terms of benefits there is a
limited reliable estimation related to science-based water quality improvement (Stanley
2000), while costs of BMP adoption tend to vary substantially by farm and even across farm
fields within a single farm depending on many factors such as geography, climate, and
farming practices. Further, for some BMPs the costs are difficult to quantify because of their
indirect and highly variable implementation level (US EPA 2004). Another issue why an
objective cost is not presented to participants is that this thesis considers BMPs in the context
of PES. Under the PES programme, costs incurred by farmers will be covered by transfer
payments from beneficiaries. Hence, objective costs are not pertinent to the subject under
consideration.
Further question may arise as to what extent farmers consider the effectiveness of BMPs in
their decision makings. At the individual farm scale farmers know best the most vulnerable
location of their farms, and thus they tend to choose BMPs that could potentially solve a
relevant environmental problem (Ellen et al. 1991; Cary and Wilkinson 1997). However, the
actual BMP effectiveness and the effectiveness perceived by farmers are different. Farmers’
perceptions about BMP effectiveness are formed by familiarity with the practices (Matthew
et al. 1993), environmental awareness, adaptability with new practices and acquired
knowledge (Sattler and Nagel 2010). On the contrary, the actual effectiveness of BMPs is
monitored in an experiment site (Otto et al. 2008; Borin et al. 2005). Factors affecting the
10 Two types of response are judgment and sentiment. Judgment is used to cover all responses where
there is some veridical comparison for the subject’s response, and it is possible to determine whether each response is correct (i.e. which of two is heavier?). On the other hand, sentiment is used to cover all responses concerning personal reaction, preferences, interests, attitudes, values, likes and dislikes, and there is no physical scale for sentiment.

80
actual effectiveness of BMPs are, for example, climatic conditions, sources of pollution, and
runoff volume.
Overall, farmers’ perceived effectiveness covers a range of aspects related to production
goals. Their understanding focuses on ‘know how’ or practical knowledge at the farm level
in the interactions between the factors influencing crop production other than ‘know why’ in
the ecological function (Ingram et al. 2010). Pannell et al. (2006) argued that, for an
individual farmer, adoption is based on subjective perceptions rather than on scientific
information because environmental advantage is not always clearly observable. This
argument is reinforced in particular when positive perception in benefits and effectiveness of
BMPs is important for an ex-ante decision in the evaluation of voluntary adoption (Husak et
al. 2004). Accordingly, throughout the thesis farmers were asked to self-evaluate between
‘perceived benefits’ (refer to environmental benefits of BMP, section 3.2) from, and
‘perceived costs’ (refer to cost structure of BMP, section 3.3) of, BMP adoption. This
process is in line with the discussion made by Lutz et al. (1994) that farmers’ decisions to
invest in new technology are often based on estimated net benefits and personal interest.
At this point adoption intention was designed as a dichotomous choice, adopt or not, leading
to discretionary behaviour. Empirical studies have shown that more choices and more
information could be overwhelming and led to a feeling of helplessness or reduced self-
efficiency (Dawnay and Shah 2005). Thus, after being presented with twelve scenarios
participants were asked to select only three BMPs that they wanted to adopt at their farm.
The selection criteria were based on personal preferences, personal need, the possibility of
that practice being implemented on their farms (i.e. practicality, adaptability, and labour
requirement), necessity, and achievement or goal of farm management. These criteria were
set to reflect constraints relating to the adoption process. That is, farmers were asked to take
account of possible outcomes, to compare the new alternative with the old technology, and to
evaluate whether to adopt a new alternative (Guerin 1999).
The participants were then asked to interpret their three selected BMPs according to their
individual preference ranking (i.e. 1st, 2nd, and 3rd orders). Though the preference ranking
amongst several discrete BMPs may not be the absolute test for behavioural intention, it
could be an initial predictor of some level of commitment. On a related point, arguments

81
could arise when a multi-attribute measure granting a comparative judgment is applied.
Participants were confronted with n possible solutions, but they were asked to choose only
some BMPs. This could be a case if participants were forced to respond. However, in this
study participants had the right to refuse selection if they were not sure. Farmers were
allowed to select ‘no adoption’ if they desired as long as it was reasonable and followed the
selection criteria. This is in line with the foundation of TPB in that choices are voluntary and
individual is conscious of the consequences of adoption (East 1993).
In order that all participants in the TPB study consider the studied behaviour, i.e. BMP
adoption, under the same situational condition, the behavioural intention must be defined in
terms of its Target, Action, Context, and Time (TACT) (Ajzen 2006; Francis et al. 2004).
The TACT was stated directly at the beginning of the interview and it was defined as:
If the government asks for voluntary adoption, consider the case of
adopting activities that could reduce amount of pollutants discharged
into watercourses in the next three years. (Carefully think about what
you have just chosen as your preferred choices)
4.1.3 Construction of psychological variables 4.1.3.1 Elicitation study
To establish a cognitive foundation for farmers’ salient beliefs, an elicitation study is
required. Face-to-face interviews were conducted in June 2007 with 17 citrus farmers in the
Ping river basin. These farmers were randomly selected from the list of registered farmers
with the Department of Agricultural Extension. Participants were presented with pictures
illustrating impacts from citrus production on water quality, and then introduced to BMPs.
They were interviewed with thirteen open-ended questions (Annex 4). Interviews were
conducted in the local native language, and answers were written down verbatim.
4.1.3.2 Content analysis
Content analysis was conducted to determine ideas and themes from the responses (Fink
2003; Gillham 2000). Words and phrases were first defined and categorised into themes and
sub-themes. Then, to be more specific, words and phases in each sub-theme were counted for

82
frequency of occurrence. Those with high frequency and containing meaningful information
were retained and assigned as items in the questionnaire. The content analysis yielded 13
psychological variables, which were four attitude variables, four subjective norm variables,
and five perceived behavioural control variables (Table 4-1). A hypothesis relationship
between these psychological variables and behavioural intention is also presented.
Table 4-1: Psychological variables
Variables Study Hypotheses Attitude variables Reduced production cost + Environmental protection + Benefits gained from watershed services + Greater commitment to farm management -1 Subjective norm variables Consumers + Government + Agricultural input retailer + Neighbours + Perceived behavioural control variables Affordable + Return + Knowledge + Farmer’s association + Potential market +
Note: 1) The study hypothesises negative association with adoption intention. However, for ease of score computation and interpretation, scores of the negative item were reversed.
4.1.3.3 Psychological statements
Thirteen variables were used to create a set of indirect measures to reflect both personal
beliefs and personal evaluations of farmers. Further, a set of direct measures was added to
the questionnaire. An indirect measure is a belief-based measure asking participants about
specific beliefs and outcome evaluation, while a direct measure is an evaluative measure
asking participants about their overall attitudes towards behaviour (Francis et al. 2004). A
seven point bipolar adjective scale was used to elicit farmer’s adoption intentions regarding
attitude, subjective norm and perceived behavioural control. For indirect measures, personal
belief was scaled from 1 to 7, while personal evaluation was scaled from -3 to +3. For the
direct measure, it was scaled from 1 to 7. Table 4-2 presents types of measure and numbers
of corresponding questions as illustrated in section 2, Annex 5.

83
Table 4-2: Types of statement and corresponding question numbers
Types of statement Question number1
Statements presenting direct measure Attitude 1 Subjective norm 3-5, 25 Perceived behavioural control 2, 6-8 Statements presenting indirect measure Attitude
Personal belief: behavioural belief 9-12 Personal evaluation: outcome evaluation 18-21
Subjective norm Personal belief: motivation to comply 22-26 Personal evaluation: normative belief 27-30
Perceived behavioural control Personal belief: control belief strength 13-17 Personal evaluation: control belief power 31-35
Note: 1) as appeared in section 2, Annex 5
4.1.4 Additional variables
The TPB originally postulates three elements (attitude, subjective norm and perceived
behavioural control) explaining behavioural intention. However, the model allows for the
inclusion of other variables (Ajzen 1991: 199). Inclusion of additional variables in the model
could increase the predictive power of actual behaviour (Fielding et al. 2008), and provide a
theoretical coherence to results (Conner and Armitage 1998). Some research has shown that
intention is better predicted when other factors are included alongside the traditional three
variables (de Bruijn et al. 2005; Karppinen 2005; Cook et al. 2002). In the context of
farmers’ decision-making towards adoption of new agricultural technologies and policies,
Edwards-Jones (2006) suggested that farmers’ decisions are influenced by a range of factors
which are integrally formed of psychological and other socio-economic variables.
Accordingly, the TPB model is extended inclusion of four additional variable sets (Figure 4-
3). These four variable sets are socio-demographics of farmer, characteristics of the farm
household, structure of the farm business and social milieu. Their hypothesised relationship
with adoption intention is presented in Table 4-3.
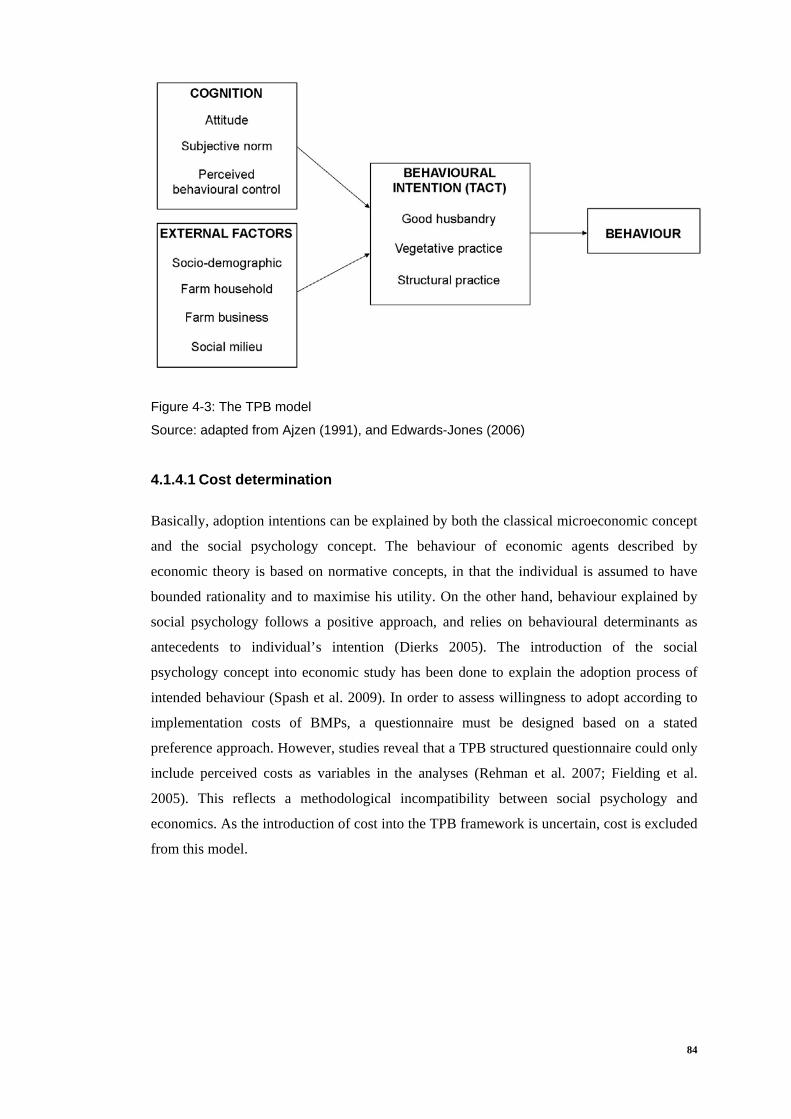
84
Figure 4-3: The TPB model
Source: adapted from Ajzen (1991), and Edwards-Jones (2006)
4.1.4.1 Cost determination
Basically, adoption intentions can be explained by both the classical microeconomic concept
and the social psychology concept. The behaviour of economic agents described by
economic theory is based on normative concepts, in that the individual is assumed to have
bounded rationality and to maximise his utility. On the other hand, behaviour explained by
social psychology follows a positive approach, and relies on behavioural determinants as
antecedents to individual’s intention (Dierks 2005). The introduction of the social
psychology concept into economic study has been done to explain the adoption process of
intended behaviour (Spash et al. 2009). In order to assess willingness to adopt according to
implementation costs of BMPs, a questionnaire must be designed based on a stated
preference approach. However, studies reveal that a TPB structured questionnaire could only
include perceived costs as variables in the analyses (Rehman et al. 2007; Fielding et al.
2005). This reflects a methodological incompatibility between social psychology and
economics. As the introduction of cost into the TPB framework is uncertain, cost is excluded
from this model.

85
Table 4-3: Additional variables
Variables References Modes of Technology Adoption Findings Study
Hypotheses Socio-demographic of the farmers Age Rodriguez et al. (2009)
Sriwichailamphan et al. (2008) Sheikh et al. (2003) Zubair and Garforth (2006)
Sustainable agricultural practices Good Agricultural Practices No-tillage practices Agroforestry
- - - -
-
Education level
Rodriguez et al. (2009) Zubair and Garforth (2006) Sheikh et al. (2003) Doss and Morris (2001) Fulgie (1999) Traore et al. (1998) Feather and Cooper (1995) Kerns and Kramer (1985) Ervin and Ervin (1982)
Sustainable agricultural practices Agroforestry No-tillage practices Modern varieties and fertiliser Conservation tillage and pesticide BMPs Nonpoint source pollution control Nonpoint source pollution control Soil conservation practices
+ + + + + + + + +
+
Gender
Gillespie et al. (2007) Tenge et al. (2004) Adesina and Chianu (2002)
BMPs Soil and water conservation Alley farming technology
+ (male) + (female) - (female)
n/a
Characteristics of the farm household Dependence on other crops Gillespie et al. (2007)
Fernandez-Cornejo et al. (1994) BMPs Integrated Pest Management
+ +
+
Past experiences in farming Nyaupane and Gillespie (2009) Ribaudo et al. (1999) Traore et al. (1998)
BMPs Nonpoint source pollution control BMPs
+ - -
n/a
Health condition Traore et al. (1998) Rahm and Huffman (1984)
BMPs Reduced tillage
+ +
+
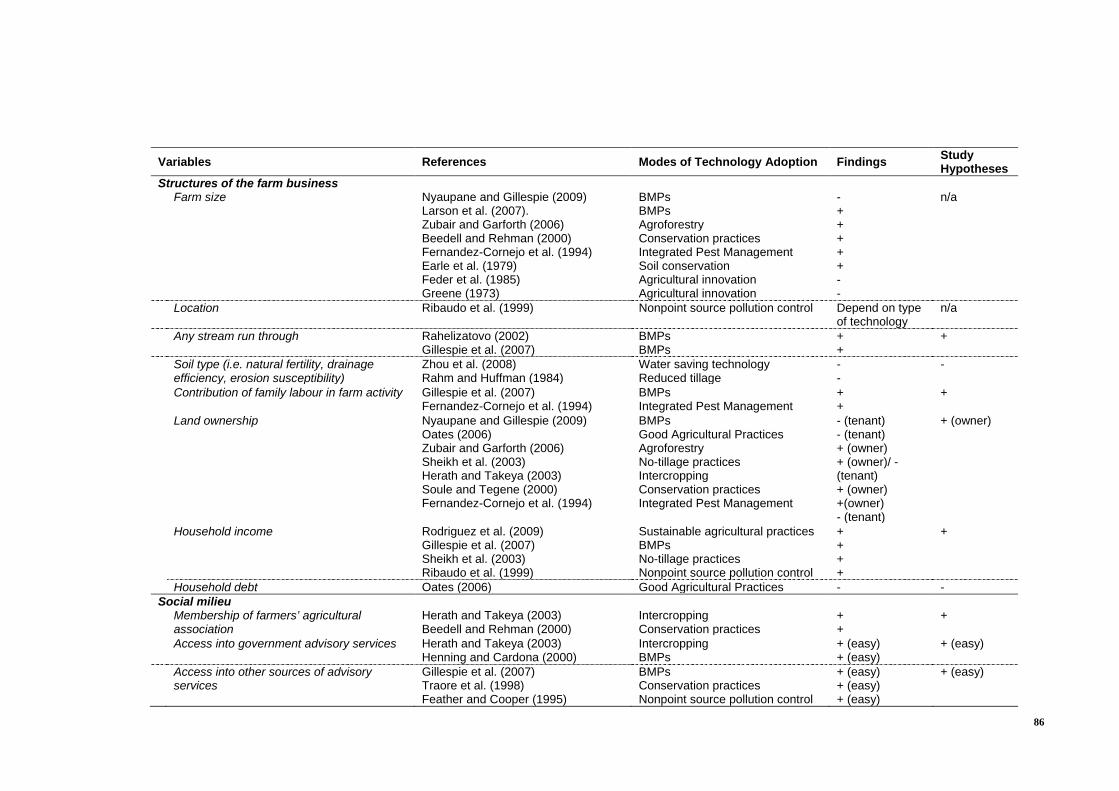
86
Variables References Modes of Technology Adoption Findings Study Hypotheses
Structures of the farm business Farm size Nyaupane and Gillespie (2009)
Larson et al. (2007). Zubair and Garforth (2006) Beedell and Rehman (2000) Fernandez-Cornejo et al. (1994) Earle et al. (1979) Feder et al. (1985) Greene (1973)
BMPs BMPs Agroforestry Conservation practices Integrated Pest Management Soil conservation Agricultural innovation Agricultural innovation
- + + + + + - -
n/a
Location Ribaudo et al. (1999) Nonpoint source pollution control Depend on type of technology
n/a
Any stream run through Rahelizatovo (2002) Gillespie et al. (2007)
BMPs BMPs
+ +
+
Soil type (i.e. natural fertility, drainage efficiency, erosion susceptibility)
Zhou et al. (2008) Rahm and Huffman (1984)
Water saving technology Reduced tillage
- -
-
Contribution of family labour in farm activity Gillespie et al. (2007) Fernandez-Cornejo et al. (1994)
BMPs Integrated Pest Management
+ +
+
Land ownership
Nyaupane and Gillespie (2009) Oates (2006) Zubair and Garforth (2006) Sheikh et al. (2003) Herath and Takeya (2003) Soule and Tegene (2000) Fernandez-Cornejo et al. (1994)
BMPs Good Agricultural Practices Agroforestry No-tillage practices Intercropping Conservation practices Integrated Pest Management
- (tenant) - (tenant) + (owner) + (owner)/ -(tenant) + (owner) +(owner) - (tenant)
+ (owner)
Household income Rodriguez et al. (2009) Gillespie et al. (2007) Sheikh et al. (2003) Ribaudo et al. (1999)
Sustainable agricultural practices BMPs No-tillage practices Nonpoint source pollution control
+ + + +
+
Household debt Oates (2006) Good Agricultural Practices - - Social milieu Membership of farmers’ agricultural
association Herath and Takeya (2003) Beedell and Rehman (2000)
Intercropping Conservation practices
+ +
+
Access into government advisory services
Herath and Takeya (2003) Henning and Cardona (2000)
Intercropping BMPs
+ (easy) + (easy)
+ (easy)
Access into other sources of advisory services
Gillespie et al. (2007) Traore et al. (1998) Feather and Cooper (1995)
BMPs Conservation practices Nonpoint source pollution control
+ (easy) + (easy) + (easy)
+ (easy)

87
4.1.4.2 Socio-demographics of the farmers
Age
According to Rodriguez et al. (2009), older farmers are less likely to consider new
production practices because they may be ‘ready to retire’ and ‘do not have the years to see
more benefits’. Previous research has also shown that younger farmers were more likely to
adopt conservative practices on their farms (Sriwichailanphan et al. 2008; Zubair and
Garforth 2006; Sheikh et al. 2003). Thus, a negative impact of age on an adoption of BMPs
is expected.
Education level
It is hypothesised that more educated farmers are able to understand and obtain information
about environmental problems, such as water quality degradation, which not only affects
their own farms but also the watershed system. Kerns and Kramer (1985) explained that
highly educated farmers may have better access to information, and better managerial skills.
These could potentially increase the effort to adopt conservation practices. Lack of
knowledge deters farmers from adopting new technology as this increases the uncertainty in
changing to something unknown (Rodriguez et al. 2009). Plenty of empirical studies show
that education level is positively related to the adoption rate of more eco-friendly practices
(Zubair and Garforth 2006; Sheikh et al. 2003; Doss and Morris 2001; Fulgie 1999; Traore et
al. 1998; Feather and Cooper 1995; Ervin and Ervin 1982). Hence, a positive impact of
education level on a BMPs uptake is expected.
Gender
Gender relates to the issue of adoption because male and female farmers may hold different
preferences when considering new practices. Other things being equal, they may face
different constraints when it comes to new technology uptake (Doss and Morris 2001). The
role of gender on the uptake of more eco-friendly practices is not very clear (Gillespie et al.
2007; Tenge et al. 2004). Gender bias could occur in land allocation, inheritance systems, or
even in testing and demonstration process of new practices (Adesina and Chianu 2002).
Accordingly, the sign of this variable is not clear a prior.

88
4.1.4.3 Characteristics of the farm household
Dependence on other crops
Dependence on other crops indicates the number of activities other than citrus cultivation on
the farm, and simply indicates farm diversification. Gillespie et al. (2007) and Fernandez-
Cornejo et al. (1994) found that more diversified producers are likely to adopt BMPs as the
adoption could potentially offer benefits to other farm business sections. This study thus
hypothesises that dependence on other crops is positively associated with BMP uptake.
Level of farming experience
The association between experience and BMP adoption is not clear. Nyaupane and Gillespie
(2009) found that farming experience is positively associated with adoption rate. Greater
experience could simply mean a better knowledge in farm management, and more accurate
assessment of benefits from BMP uptake (Herath and Takeya 2003). On the other hand,
more experienced farmers, also older farmers, have shorter planning horizons, and thus are
less likely to adopt new conservation practices (Ribaudo et al. 1999; Traore et al. 1998).
Further, a belief in traditional farming practices could possibly outweigh new technology as
experience increases (Herath and Takeya 2003). Accordingly, the expected sign for this
variable is uncertain a priori.
Health state
Provided economic factors are not a driving force in BMP adoption, human capital variables
such as health increase the adoption likelihood of conservation practices (Traore et al. 1998).
Poor health could shorten planning horizons and deter normal decision-making (Rahm and
Huffman 1984). Thus, it is hypothesised that a healthy farmer is more likely to adopt BMPs.
4.1.4.4 Farm business structure
Farm size
Farm size is positively associated with the adoption of new conservation practices. Smaller
farmers face large fixed costs, transaction costs, and information costs, and thus these reduce
the tendency to adopt new practices (Larson et al. 2007; Zubair and Garforth 2006; Beedell
and Rehman 2000; Fernandez-Cornejo et al. 1994; Earle et al. 1979). On the other hand,

89
smaller farmers may be able to adapt faster to new practices (Feder et al. 1985; Greene
1973). According to Nyaupane and Gillespie (2009), farm size has different effects on the
adoption rate, depending on the characteristics of BMPs. Accordingly, a priori may not be
suitable.
Location
BMP that is developed for one particular setting may not suitable or may cause damage if
applied in another setting. Farmers will be unwilling to adopt a practice that is inappropriate
for their land (Ribaudo et al. 1999). As they are twelve BMPs proposed in this study, a priori
may not be suitable.
Proximity to a water course
As BMPs are initially introduced to capture the problem of water quality degradation caused
by traditional farming practices, farms having a stream or drainage running through are more
likely to adopt BMPs (Gillespie et al. 2007; Rahelizatovo 2002).
Soil type
Soil characteristics, such as natural fertility, drainage efficiency, and erosion susceptibility
potentially influence BMP adoption. Farms with good soil quality would achieve better
effects through an adoption of new conservation practices (Zhou et al. 2008; Rahm and
Huffman 1984), thus it is hypothesised that a farm with poorer soil condition is less likely to
adopt BMPs
Family labour
Family members provide unpaid farm labour to the enterprise. Gillespie et al. (2007) and
Fernandez-Cornejo et al. (1994) found that family labour supply is positively associated with
the adoption of labour-intensive practices.

90
Land ownership
Land ownership reflects planning horizons and risk aversion. It increases incentives to adopt
more eco-friendly practices by lengthening time horizons and the share of benefits accruing
to the adopter (Herath and Takeya 2003). An association between land tenure and adoption
varies by types of landholding and the nature of the innovation. The land owner is likely to
adopt new practices if the innovations require investment tied to the land (Zubair and
Garforth 2006; Sheikh et al. 2003; Soule and Tegene 2000). Conversely, given the same
condition, the tenant is less likely to adopt new practices because the perceived benefits from
adoption may not accrue to them (Nyaupane and Gillespie 2009; Fernandez-Cornejo et al.
1994). Oates (2006) found that short term rental contracts in Thailand discouraged farmers
from an investment in new technology because they cannot apply for bank credit11
.
Household income
Information about new technology is not costless. Further, adoption costs such as initial
investment cost, and conversion costs may be high. As such, households with greater income
are more likely to adopt new conservation practices (Rodriguez et al. 2009; Gillespie et al.
2007; Sheikh et al. 2003; Ribaudo et al. 1999). Thus, it is expected that household income is
positively associated with BMP adoption.
Household debt
Previous investment, such as initial investment and supporting materials is directly linked to
household debt. Normally, farmers are able to repay their loans after the first harvest. This
kind of commitment limits farmers’ choice (Oates 2006). Thus, it is hypothesised that
household debt is negatively associated with BMP adoption.
Two other variables further included in this study are the contribution of full-time workers
and the contribution of part-time workers in farm activity.
11 Land title is needed to guarantee bank credit

91
Full time workers
It is hypothesised that the number of full time workers could influence the adoption of a
particular practice. With high rates of full time working in the field, it is expected that the
adoption of time- and management- intensive technology increases.
Part time workers
It is hypothesised that farms which rely on a high rate of part time workers are unlikely to
adopt high-commitment practices, such as BMPs in Good Husbandry category.
4.1.4.5 Social milieu
Membership of farmers’ conservative group
Being a member of a farmer association can ensure access to timely and accurate
information (Herath and Takeya 2003). Member of a conservative group is also likely to take
conservation advice and tends to think of the long-term productivity of their farm (Beedell
and Rehman 2000). Accordingly, it is expected that membership status is positively
associated with BMP adoption.
Access into government advisory services
State agencies are responsible for transferring agricultural knowledge and information to
farmers. A local extension service office is located in each district. A mobile unit providing
prompt technical service to farmers is also available. Literature shows that the number of
times producers meet with state extension service personnel enhances the rate of BMP
adoption (Herath and Takeya 2003; Henning and Cardona 2000). Thus, it is hypothesised
that the accessibility level, from easy to difficult, is negatively associated with BMP
adoption.
Access into other sources of advisory services
Besides information from the state agency, farmers also rely on information from a network
of providers such as chemical dealers, and input supply retailers. Provided technical
assistance is easily received from this network, farmers are likely to adopt new conservation
practices (Feather and Cooper 1995). Empirical studies present a positive relationship

92
between the availability of information and the uptake of conservation practices (Gillespie et
al. 2007; Traore et al. 1998). Thus, it is hypothesised that the accessibility level, from easy to
difficult, is negatively associated with BMP adoption.
4.1.5 Questionnaire development 4.1.5.1 First draft questionnaire
The first draft questionnaire was constructed and included: 1) an open space for filling the
most three preferable BMPs in priority order; 2) a set of multipoint-scale questions including
direct measures and indirect measures reflecting thirteen psychological variables; and 3) a
set of additional variables.
4.1.5.2 Feedback from experts
The first draft questionnaire was presented at international conferences12
. Feedback from
conference participants was taken into account. The questionnaire was redrafted to make its
layout clearer, and question items were rephrased to make it more concise.
4.1.5.3 Piloting the questionnaire
Five participants were asked to complete the questionnaire and comment on the difficulty and
clarity of the questions. A second draft was also written in consultation with a research team
experienced in interviews with local people. Responses led to minor changes in wording and
formatting (i.e. sequence and layout), and thus a final questionnaire was constructed (Annex
5).
4.1.6 Fieldwork administration 4.1.6.1 Sampling method and sample size calculation
A simple random sampling scheme was applied for small- to medium- scale farm households
in the Ping river basin. This procedure gives each member of the population an equal chance
of being chosen. The procedure is a sampling without replacement (Newbold 1995). The
12 Two international conferences are 1) ‘Integrating Conservation in the Upland Agriculture in
Southeast Asia’, International Agroforestry Education Conference, 24-26 October 2007, Chiang

93
question is how many sample observations are needed. According to Bartlett et al. (2001),
the determination of sample size depends on which type of variables play a primary role in
data analysis. The construction of TPB questionnaire requires a multipoint scale
measurement, which is classed as continuous data. Therefore, the continuous sample size
formula (equation 2) was used as follows:
( ) ( )( )2
22
0 dstn ×
= (Equation 2)
where;
t = value for selected alpha level of .025 in each tail = 1.96 (the alpha level of .05
indicates the level of risk the researcher is willing to take that true margin of
error may exceed the acceptable margin of error)
s = estimate of standard deviation in the population = 1.167 (estimate of variance
deviation for seven point scale calculated by using 7 [inclusive range of scale]
divided by 6 [number of standard deviations that include almost all
(approximately 98%) of the possible values in the range])
d = acceptable margin of error for mean being estimated = .21 (number of points on
primary scale times acceptable margin of error; seven-point scale times
acceptable margin of error of .03)
There is a population of 439 households in upstream area and that of 1,163 households in
downstream area (Table 4-4).
Mai, Thailand; and 2) ‘The 28th Biannual Workshop’, held by the Economy and Environment Program for Southeast Asia, 13-16 November 2007, Kuala Lumpur, Malaysia.

94
Table 4-4: Sampling frame
Provinces1 Reported of cultivated district2
No. of Households2 Cultivation area (rai)2
Upstream
Chiang Mai 17 345 4,340
Mae Hong Son 4 45 229
Tak - - -
Lam Pang 4 45 104
Lam Phun 1 4 24
Sub-total 26 439 4,697
Downstream
Kampangpeth 7 795 13,813
Nakorn Sawan 3 368 5,122
Sub-total 10 1,163 18,935
Total 36 1,602 23,632
Sources: (1) derived from GIS data, Office of Project Management, Royal Irrigation Department (RID 2007) (2) DOAE Information Centre, Department of Agricultural Extension (DOAE 2007a)
The required sample size for each area is:
( ) ( )( )
11803.7
167.196.12
22
0 =××
=n
However, since this sample size exceeds 5% of the population (439 × .05 = 21.95, and 1,163
x .05 = 58.15), Cochran (1977)’s correction formula (equation 3) is used to calculate the
final sample size.
( )( )[ ]populationn
nn/1 0
01 +=
(Equation 3)
where;
Population size = 439 for upstream area and 1,163 for downstream area
0n = required return sample size according to Cochran’s formula = 118
1n = required return sample size because sample > 5% of population
Un1 = the minimum returned sample size for the upstream area = 93
Dn1 = the minimum returned sample size for the downstream area = 107

95
4.1.6.2 Data collection
Sample size
The survey administration was split into two periods. The first survey was conducted from
December 2007 to January 2008. The second survey was from June to August 2008. The
total sample size was 218 (13.61% of population). Of those, 126 are from the upstream area
and 92 are from the downstream area. The numbers of interviews are shown in Table 4-5,
and the distribution of sample is illustrated in Figure 4-4.
Table 4-5: Sample distributions and interviews achieved by area
Provinces Target
number of interviews
Participants showing at
the interview venue
Unusable responses Interviews achieved Refuse to
participate Incomplete
answer Inconsistence in Psychological
test* Upstream Chiang Mai 70 87 1 1 2 83 Mae Hong Son 10 12 - - 1 11 Lam Pang 20 34 - 1 1 32 Sub-total 100 133 1 2 4 126 Downstream Kampangpeth 95 84 1 5 1 77 Nakorn Sawan 20 17 2 - - 15 Sub-total 115 101 3 5 1 92 Total 215 234 4 7 5 218
Note: * consistency in psychology tests refers to reliability whether a researcher gets the same result across a range of measurement. To assess the responses, the TPB-based questionnaire was designed to have two different questions that tested the same construct. For example, two questions (questions 10 and 19: see Annex 5) were used to measure an attitude towards the notion that BMP adoption could protect environment. A response containing inconsistent results was rejected as this showed that a participant may not carefully answer, thus leading to bias and inaccuracy of data interpretation.
The target for the upstream area was 100 households. The appointments with farmers were
made through the Tambon (sub-district) Administrative Organisations (TAOs) and
agricultural extension agencies at district level. A total of 133 participants came for
interview but one refused to participate in the interview. Two participants gave incomplete
answers about household income, and four participants gave inconsistent answers in the
psychological section. Therefore, there were 216 interviews with upstream farmers.

96
Figure 4-4: Distribution of sample by area
The target for the downstream area was 115 households. The appointments with citrus
farmers were also made through the TAOs and agricultural extension agencies at district
level. Only 101 participants came for interview, and this number was less than targeted.
Further, three participants refused to complete the interviews. Five participants gave
incomplete answers and one participant gave inconsistent answers in the psychological
section. In total, there were 92 interviews with downstream households.
Flow of information and tasks for participants
A team leader started the interviews by describing the role of the watershed and its natural
services. This was followed by a description of the impacts from nonpoint source pollution,
97
possibly generated by citrus production. The scientific information regarding water quality in
the Ping river basin, compared to other river basins nationwide, was also demonstrated to
participants through a water quality map. Then, twelve BMPs were demonstrated to
participants (see illustrations in Annex 6). Participants were informed that they were free to
ask the research team any questions before, during and after the survey.
Task 1: Adoption intention and rank-ordering
Participants were presented with pictures of twelve BMPs together with implementation
details, expected environmental benefits from adoption, and cost components of each BMP.
Then, they were asked to make a decision on whether to adopt that technique on their farm.
Provided behaviour is voluntary and conscious, BMP is selected based on the anticipated
consequences (i.e. need satisfaction, goal achievement) that provide positive consequences,
and avoid negative outcomes (Olson and Reynolds 2001). It is at this stage that participants
were asked to select only three BMPs that they wanted to use at their farms. Next,
participants were asked to rank these three BMPs in priority order.
Task 2: Personal interview
Participants who had already selected their three practices were interviewed personally by an
enumerator. First, they were asked about their background, such as demographic data. Then,
they were asked to complete a set of multipoint-scale questions reflecting psychological
variables. Participants with literacy were asked to complete this section by themselves.
However, an enumerator was provided to respond promptly if difficulties arose. Participants
who were unable to read were assisted by an enumerator.
Communication management
Misunderstanding could happen during the flow of information. On one hand, a message
from the research team could confuse and mislead participants, and may cause them to act in
unintended ways (Whittington 2004). Moreover, a warm-glow effect (Andreoni 1990)13
13 When people make donations to privately provided public goods, there may be other factors (i.e. to
win prestige, respect, friendship, to avoid scorn, to receive social acclaim) influencing their decision other than altruism.
could be inspired because citrus farmers were asked about hypothetical outcomes. One
98
attempt to reduce the bias in hypothetical commitment is a cheap talk script (Carlsson et al.
2005; Cummings and Taylor 1999). Participants were informed that the study will be used
solely for the purpose of research, that it is important that participants should carefully
consider when answering, and that their answers will be confidentially treated. A serious
response is likely when participants are reminded of the consequences of their actions (Bulte
et al. 2005).
On the other hand, information from the participants to the research team was filtered
through the enumerators. Thus, prior to the fieldwork, enumerators were trained to ensure
that they understood the object of the survey and basic technical aspects contained in the
twelve intention simulations. As suggested by Whittington (2002), pairs of enumerators role-
played an entire questionnaire in front of the group of the survey team. They then discussed
the mock interview and any problems that arose. The team leader stepped in to assist and
guide on how to handle particular problems. It is expected that during the survey all
enumerators are able to respond in a knowledgeable and informed manner.
Ethical considerations
During the fieldwork, participants were notified of aims, methods, anticipated benefits and
potential hazards of the research. They were informed of the voluntary nature of the
interview and their right to refuse to be interviewed or to terminate interviews in progress.
4.2 Descriptive Results
This section provides summarised information and comprises two sub-sections. First,
descriptive data are presented based on characteristics of farmers in terms of both socio-
economic and psychological constructs. This sub-section also presents the frequency of BMP
selected as 1st, 2nd, and 3rd option according to farm location. The following sub-section
offers insights into the differences in the sample means of upstream and downstream
farmers. A Mann-Whitney test is also employed to compare differences in farm and farmer
characteristics. Prior to the analysis, it should be noted here that farm location is considered
as an importantly distinctive difference amongst Thai citrus farmers. Particularly, a spatial
difference contributes to a different style of farm management and land use, and thus could

99
possibly lead to a difference in farmers’ attitudes and preferences towards BMP adoption.
Accordingly, the further analysis will be done on the basis of farm location.
4.2.1 Descriptive statistics
4.2.1.1 Characteristics of citrus farmers
The statistical analysis includes 218 farmers of which 126 (58%) are from the upstream area
and 92 (42%) are from the downstream area. The characteristics of the sample are presented
in Table 4-6.
Table 4-6: Characteristics of citrus farmers
Variables Upstream Downstream Overall
(n=126) (%) (n=92) (%) (n=218) (%)
Socio-demographics of farmer Age (years)
Less than 30 19 15.1 3 3.3 22 10.1
30.1 - 40 23 18.3 25 27.2 48 22.0
40.1 - 50 32 25.4 28 30.4 60 27.5
50.1 - 60 30 23.8 26 28.3 56 25.7
More than 60 22 17.5 10 10.9 32 14.7
Mean (S.D.) 47.1(13.9) 47.2 (10.6) 41.2(12.6)
Education level
Less than high school 77 61.1 55 59.8 132 60.6
High school and over 49 38.9 37 40.2 86 39.5
Gender
Male 90 71.4 68 73.9 158 72.5
Female 36 28.6 24 26.1 60 27.5
Characteristics of the farm household Farm experiences (years)
Less than 15 91 72.2 83 90.2 174 79.8
15 or over 35 27.8 9 9.8 44 20.2
Mean (S.D.) 12.0(10.2) 8.4(8.9) 10.5(9.8)
Dependency of other crops
Yes 103 81.8 60 65.2 163 74.8
No 23 18.3 32 34.8 55 25.2
Health problem retarding farming activities
Yes 21 16.7 30 32.6 51 23.4
No 105 83.3 62 67.4 167 76.6

100
Variables Upstream Downstream Overall
(n=126) (%) (n=92) (%) (n=218) (%)
Structures of the farm business
Land ownership
Own land 103 81.8 79 85.9 182 83.5
Under others 23 18.3 13 14.1 36 16.5
Farm size (rais)
Less than or equal 5 42 33.3 4 4.4 46 21.1
5.01 - 10 39 31.0 28 30.4 67 30.7
10.01 - 20 24 19.1 27 29.4 51 23.4
20.01 - 50 13 10.3 18 19.6 31 14.2
More than 50 8 6.4 15 16.3 23 10.6
Mean (S.D.) 17.0(29.0) 39.4(97.5) 26.4(67.8)
Location of farm
Upstream 126 100.0 - - 126 57.8
Downstream - - 92 100.0 92 42.2
Farm resource endowments
- Stream
Yes 75 59.5 80 87.0 155 71.1
No 51 40.5 12 13.0 63 28.9
- Soil type
Clay 22 17.5 42 45.7 64 29.4
Loam 30 23.8 6 6.5 36 16.5
Sandy and others 74 58.7 44 47.8 118 54.1
Labour management in farm workload
- Contribution of family labour (%)
Less than or equal 50 83 65.9 79 85.9 162 74.3
More than 50 43 34.1 13 14.1 56 25.7
- Contribution of part time worker (%)
Less than or equal 50 58 46.0 29 31.5 87 39.9
More than 50 68 54.0 63 68.5 131 60.1
- Contribution of full time worker (%)
Less than or equal 50 126 100.0 91 98.9 217 99.5
More than 50 - - 1 1.1 1 0.5
Household income (THB/rai)
Less than median value 47 37.3 62 67.4 109 50.0
Equal or more than median value 79 62.7 30 32.6 109 50.0
Mean (S.D.) 33,046.7 (51,936.2) 16,614.5 (22,780.7) 26,112.0 (42,867.0)
Median value 13,166.7
Household debt (THB/rai)
Less than median value 82 65.1 26 28.3 108 49.5
Equal or more than median value 44 34.9 66 71.7 110 50.5
Mean (S.D.) 21,073.9 (41,555.0) 42,652.7 (79,785.9) 30,180.6 (61,468.2)
Median value 12,000.0

101
Variables Upstream Downstream Overall
(n=126) (%) (n=92) (%) (n=218) (%)
Social milieu
Membership of farmer association
Yes 66 52.4 70 76.1 136 62.4
No 60 47.6 22 23.9 82 37.6
Access to government advisory services
No need for services 40 31.8 45 48.9 85 39.0
Easy or not so difficult 50 39.7 34 37.0 84 38.5
Difficult or not so easy 36 28.6 13 14.1 49 22.5
Access to other advisory services
No need for services 26 20.6 1 1.1 27 12.4
Easy or not so difficult 97 77.0 86 93.5 183 83.9
Difficult or not so easy 3 2.4 5 5.4 8 3.7
Farmer socio-demographics
The average age of upstream farmers is 47.1 years and that of downstream farmers is 47.2 years.
Both have an education level less than high school and one-third are male.
Farm household characteristics
On average, farmers in the upstream area have longer experience in farming than those in the
downstream area. Most farmers depend on other cash crops, and indicate no health problems in
citrus farming.
Structure of the farm business
Most of farmers are land owners. The average farm size of upstream farms is 17.0 rais, and that
of downstream farms is 39.4 rais. It should be noted that the samples contain only small- to
medium-scale farmers. Therefore, a caution should be taken when interpreting this data and
making any further analysis. In this study, the survey could not carry out with large-scale
farmers because of a time limitation and a difficulty to arrange a meeting with either owners or
farm managers.
Most farms are situated by streams or have a stream running through. Soil type in upstream
areas is typically sandy, while in downstream areas soil is proportionately clay and sandy.
Overall, the farm workload mainly relies on part-time workers. The average income of upstream
farms is higher than downstream farms, while the average debt of upstream farms is lower than
downstream farms.

102
Social milieu
Overall, most farmers are members of farmer associations. There is little complaint about
difficulty accessing either government advisory services or other sources of information.
Descriptive statistics of farmers’ psychological characteristics are illustrated in Table 4-7. A
direct measure was scaled from 1 to 7, while an indirect measure was a summated scale and was
derived from the personal belief score (ranged from 1 to 7) weighted by the personal evaluation
score (ranged from -3 to +3). Thus, for the indirect measure the lowest summated score is -21
(i.e. 7 times -3), and the highest summated score is +21 (i.e. 7 times +3). For both measures the
higher the score, the more likely the adoption intention.
Table 4-7: Psychological characteristics of citrus farmers
Variables
Upstream (n = 126)
Downstream (n= 92)
Overall (n = 218)
Mean (S.D.) Mean (S.D.) Mean (S.D.)
Direct measures
Attitudes
Overall adopting BMPs is BAD(1a) vs. GOOD (7) 4.1 (2.6) 2.6 (2.2) 3.5 (2.5)
Overall adopting BMPs is WORTHLESS(1) vs. USEFUL(7) 6.1 (1.6) 6.3 (1.2) 6.2 (1.5)
Overall, adopting BMPs is the WRONG thing to do(1) vs. RIGHT thing to do(7) 4.2 (2.5) 2.7 (2.2) 3.6 (2.5)
Overall, adopting BMPs is UNPLEASANT(1) vs. PLEASANT(7) for me 4.2 (2.5) 2.8 (2.1) 3.6 (2.4)
Subjective norms
Important people think that I should NOT(1) vs. SHOULD(7) adopt BMPs 3.8 (2.5) 5.0 (2.3) 4.3 (2.4)
It is expected for me that I should adopt BMPs, DISAGREE(1) vs. AGREE(7) 5.5 (1.7) 5.7 (1.8) 5.6 (1.7)
I feel under social pressure to adopt BMPs, DISAGREE(1) vs. AGREE(7) 5.0 (2.1) 4.7 (2.2) 4.8 (2.1)
Important people want me to adopt BMPs, DISAGREE(1) vs. AGREE(7) 5.5 (1.8) 5.5 (1.8) 5.5 (1.8)
Perceived behavioural control
I am confident that I could adopt BMPs if I want to, DISAGREE(1) vs. AGREE(7) 5.8 (1.6) 6.0 (1.5) 5.9 (1.5)
For me, to adopt BMPs is DIFFICULT(1) vs. EASY(7) 4.4 (2.1) 3.9 (1.7) 4.2 (2.0)
The decision to adopt BMPs is beyond my controlb, AGREE(1) vs. DISAGREE(7) 4.5 (2.3) 4.2 (2.3) 4.3 (2.3)
Adopt BMPs or not is entirely up to me, DISAGREE(1) vs. AGREE(7) 4.4 (2.4) 5 (1.9) 4.8 (2.3)
Notes: (1) aNumber represents score (2) bThe negative item was reversed score (3) cIndirect measure score is ranged from -21.0 to +21.0

103
Variables
Upstream (n = 126)
Downstream (n= 92)
Overall (n = 218)
Mean (S.D.) Mean (S.D.) Mean (S.D.)
Indirect measuresc
Attitudes
Reduced production cost 12.6 (7.9) 13.1 (8.4) 12.8 (8.1)
Environmental protection 17.2 (6.0) 17.7 (5.8) 17.4 (5.9)
Watershed services gained 15.4 (7.3) 16.3 (6.5) 15.7 (7.0)
Greater commitmentb 4.4 (8.7) 0.9 (8.9) 2.9 (8.9)
Subjective norms
Consumers 13.2 (8.8) 13.3 (9.5) 13.3 (9.1)
Government 12.0 (8.3) 11.5 (9.7) 11.8 (8.9)
Agricultural supply retailer 4.4 (9.8) 4.7 (9.6) 4.5 (9.7)
Neighbours 5.8 (10.2) 4.6 (10.0) 5.3 (10.1)
Perceived behavioural control
Affordable 11.0 (7.9) 9.0 (10.2) 10.1 (9.0)
Return 7.2 (7.0) 5.4 (8.4) 6.4 (7.6)
Knowledge 10.2 (8.4) 9.0 (8.6) 9.7 (8.5)
Farmer association 9.5 (10.6) 7.5 (10.9) 8.6 (10.7)
Potential market 11.1 (9.8) 9.9 (9.7) 10.6 (9.7)
Note: (1) aNumber represents score (2) bThe negative item was reversed score (3) cIndirect measure score is ranged from -21.0 to +21.0
In general, upstream farmers hold more positive attitudes toward BMP uptake than downstream
farmers. Upstream farmers view the adoption as more ‘good’, ‘right’, and ‘pleasant’ than
downstream farmers (Figure 4-5). Upstream farmers appear to be less influenced by their social
pressures. They present relatively low agreement with the statement ‘important people think that
I should adopt BMPs’ (Figure 4-6). Downstream farmers are not confident in their abilities to
adopt BMPs, and they express difficulty in performing the BMP adoption (Figure 4-7).

104
Figure 4-5: Mean of attitude direct measures by location; scores are ranged from 1 to 7
Figure 4-6: Mean of subjective norm direct measures by location; scores are ranged from 1 to 7
Figure 4-7: Mean of perceived behavioural control direct measures by location; scores are ranged from 1 to 7

105
Means of indirect measures are illustrated in Figure 4-8. Overall, results suggest an attitude that
BMP adoption could enhance environmental protection. Farmers also perceive that BMP
adoption will result in improved watershed services, and reduced production costs. Further,
farmers perceive that BMP adoption will impose a greater commitment to farm management.
Figure 4-8: Mean of indirect measures
Notes: (1) The negative item (i.e. greater commitment) was reversed score (2) Scores are ranged from -21.0 to +21.0
Of all the social referents, consumers are the most important influences when farmers make
adoption decisions. This is followed by the state government, neighbours and agricultural
supply retailers. The strongest perceived facilitator to adopt BMPs is the existing of market for
eco-friendly products. This is followed by affordability, knowledge, farmer associations and
perceived returns.
106
4.2.1.2 BMP selection
Overall, Good Husbandry is the functional category most preferred by both upstream and
downstream farmers (72.0%). This is followed by Structural Practice (17.0%) and Vegetative
Practice (11.0%). Details are presented in Table 4-8. Of all the practices, the most selected
adoption choice is soil analysis for which more than one-third of farmers voted (35.3%).
Additionally, it is the adoption choice most highly voted by both farmer groups (35.7% for
upstream farmers and 34.8 8% for downstream farmers). Discussion with farmers after the
interviews revealed a few reasons for the preference. First, farmers are faced with an increase in
input prices especially fertiliser and chemicals. The adoption of this BMP results in a reduction
of fertiliser application and simply means a decreased production cost. Second, some farmers
perceived on-farm soil deterioration due to a continuous high rate of fertiliser application. They
are afraid that this may lead to a reduction in farm profit, and seek alternatives. Third, soil
analysis is the BMP that can be adopted in any farm terrain. That is, it is not a site-specific
BMP, and thus there is no topographic barrier.

107
Table 4-8: Selection of BMPs
Practices Upstream Downstream Overall
Frequency (n=126) % Order Frequency
(n=92) % Order Frequency (n=218) % Order
Good Husbandry
Scheduling water structure 10 7.9 4 25 27.2 2 35 16.1 2
Apply herbicide within tree canopy 20 15.9 2 6 6.5 6 26 11.9 3
Basic restrictions for pesticide application 16 12.7 3 3 3.3 8 19 8.7 5
Soil analysis 45 35.7 1 32 34.8 1 77 35.3 1
Total 91 72.2 66 71.7 157 72.0
Vegetative Practices
Vegetative cover 6 4.8 7 6 6.5 6 12 5.5 7
Mulching 4 3.2 8 7 7.6 4 11 5.1 8
Vegetative buffer strip - - 12 - - 12 - - 12
Grassed waterway 1 0.8 10 - - 12 1 0.5 10
Total 11 8.7 13 14.1 24 11.0
Structural Practices
On-site retention storage 11 8.7 6 3 3.3 8 14 6.4 6
Terracing 2 1.6 9 - - 12 2 0.9 9
Mix-load and wash-down site 11 8.7 6 10 10.9 3 21 9.6 4
Riparian setbacks - - 12 - - 12 - - 12
Total 24 19.1 13 14.1 37 17.0

108
4.2.2 Comparative differences
A further analysis of Mann-Whitney test (M-W test) is performed to understand the
differences between upstream and downstream farmers. The following comparisons employ
128 upstream farmers and 92 downstream farmers in the Ping river basin. Comparative
perspectives are presented as follows.
4.2.2.1 Comparisons of farm and farmer characteristics
Differences in farm and farmer characteristics in upstream and downstream areas are as
follows (Table 4-9):
1) More upstream farmers farm on their own land than downstream farmers who
generally farm on rented land
2) Upstream farm size is significantly smaller than downstream
3) The number of upstream farms that has stream running through or next to it is
less than that in downstream farm
4) Upstream farmers have more experience in citrus cultivation than downstream
farmers
5) Upstream farmers have fewer health problems than downstream farmers
6) Upstream farmers are more dependent on other cash crops rather than citrus
7) Membership of farmers’ associations in upstream area is significantly lower
than downstream
8) Upstream farmers face more difficulty in accessing sources of information other
than government advisory services than downstream farmers
9) Upstream farmers have lower debt than downstream farmers

109
Table 4-9: Mann-Whitney test of external variables
External Variables Farm location Mean Rank (Order) Mean Std.
Deviation
Gender Upstream 110.6 0.3 0.5 Downstream 107.9 0.3 0.4
Age Upstream 109.3 47.1 13.9 Downstream 109.8 47.2 10.6
Education level Upstream 105.9 1.8 1.4 Downstream 114.4 1.9 1.3
Land ownership*** Upstream 97.2 0.9 0.4 Downstream 126.4 1.1 0.4
Farm size (rai) *** Upstream 88.9 16.9 28.8 Downstream 137.7 39.4 97.5
Any stream run through farm*** Upstream 96.9 0.6 0.5 Downstream 126.8 0.9 0.3
Soil type Upstream 104.0 3.1 1.3 Downstream 117.1 3.4 1.7
Past experience (years) *** Upstream 122.2 12.0 10.2 Downstream 92.2 8.4 8.9
Health condition** Upstream 102.2 0.2 0.4 Downstream 119.5 0.3 0.4
Number of family members Upstream 102.9 2.3 1.5 Downstream 118.5 2.6 1.4
Number of full-time workers Upstream 109.5 1.8 7.2 Downstream 109.5 2.5 9.6
Number of part-time workers Upstream 103.5 8.3 14.7 Downstream 117.7 11.8 32.1
Crop dependency** Upstream 117.1 0.8 0.4 Downstream 99.1 0.7 0.5
Membership of farmers’ association*** Upstream 98.6 0.5 0.5 Downstream 124.4 0.8 0.4
Access to governmental advisory services
Upstream 103.5 3.1 1.6 Downstream 117.7 3.5 1.8
Access to other sources of information***
Upstream 119.7 2.1 1.6 Downstream 95.6 1.3 0.7
Annual Household Income (THB) Upstream 110.5 492,621.4 1,116,399.1 Downstream 108.1 748,783.8 2,358,996.1
Amount of Household's Debt (THB) *** Upstream 83.8 241,384.1 651,109.9 Downstream 144.7 2,713,630.4 9,068,169.9
Notes: ** significant at .01 level, *** significant at .001 level
Further points to add from Table 4-9 are as follows. A steeper slope and relatively hilly
terrain in the upstream area influences farm size and management style. The upstream area
consists of dispersed farms, which are relatively small and regularly on the valley floor,

110
whereas a number of large scale farms are apparent in the downstream area. The geography
of the upstream area and distant farm location cause difficulty for service delivery by
government agents, and thus advisory support from government is less frequent amongst
upstream farmers than downstream farmers. Further, as farms in the upstream area are
scattered on the valley floor, farmers do not have an incentive to rent more land. Rather,
upstream farmers rely more on semi-subsistence farming14
with crop diversification to
reduce risks in income. With this management style, farm household debt in upstream areas
is lower than downstream areas, and there is less incentive for farmer collaboration.
4.2.2.2 Comparisons of psychological variables
Differences in psychological characteristics of farmers in upstream and downstream areas
are described as follows (Table 4-10):
Direct measures
1) Upstream farmers significantly perceive BMP adoption as better, right and
pleasant thing to do than downstream farmers
2) Upstream farmers are less likely to be influenced by social pressures
3) Upstream farmers perceive BMP implementation is easier than downstream
farmers
4) Upstream farmers perceive less control over the consequences of BMP adoption
than downstream farmers
Indirect measures: Though both upstream and downstream farmers perceive that BMP
adoption will impose a greater commitment to farm management, by comparison, upstream
farmers see that more work is not a crucial barrier.
The significant statements from psychological measures can be jointly implied with the
interpretation of the external factors mentioned above. Semi-subsistence farming in the
upstream area represents more traditional farming practices, while farms in the downstream
area are business-oriented farming systems, which are currently dependent on chemical
application to maintain output. As such, it is clear that downstream farmers view BMP
14 Here, semi-subsistence farming refers to the cultivation that takes place on small farms and uses
simple techniques.

111
adoption as less good, not right, and unpleasant. Furthermore, as downstream farmers have
experienced greater debt than upstream farmers they are likely to refuse adoption of BMPs
that could reduce profit. On the other hand, upstream farmers perceive adopting BMPs as
easier because they hold smaller farm size. Commitment to implement BMPs in a small
piece of land is unlikely to deter adoption decision-making.
Differences in the importance of other people upon farmers’ adoption intentions can be
explained by farm location, farm goals and farmer attitudes. Evidence shows that upstream
farms, which are more subsistence-oriented and located further away from market and
information, are less influenced by others whereas business-oriented farms in a downstream
area are likely to be influenced by others, particularly consumers. Moreover, that upstream
farmers report less ability to control the consequences of BMP adoption is supported by the
fact that they farm in a distant area, and thus receive less assistance and up-to-date
information from government agencies.
Table 4-10: Mann-Whitney test of psychological variables
Direct Measurement Farm location Mean Rank (Order) Mean Std.
Deviation Overall, adopting BMPs is Bad vs. Good*** Upstream 124.7 4.1 2.6
Downstream 88.7 2.6 2.2 Overall, adopting BMPs is Worthless vs. Useful
Upstream 108.3 6.1 1.6 Downstream 111.1 6.3 1.2
Overall, adopting BMPs is The Wrong thing to do vs. The Right thing to do***
Upstream 124.6 4.2 2.5 Downstream 88.8 2.7 2.2
Overall, adopting BMPs is Unpleasant for me vs. Pleasant for me***
Upstream 125.2 4.2 2.5 Downstream 88.1 2.8 2.1
Important people think that I Should not vs. I Should adopt BMPs***
Upstream 96.2 3.8 2.5 Downstream 127.7 5.0 2.3
It is expected for me that I should adopt BMPs .. Disagree vs. Agree
Upstream 105.6 5.5 1.7 Downstream 114.9 5.7 1.8
I feel under social pressure to adopt BMPs .. Disagree vs. Agree
Upstream 112.6 4.9 2.1 Downstream 105.3 4.7 2.2
Important people want me to adopt BMPs ... Disagree vs. Agree
Upstream 110.6 5.5 1.8 Downstream 108.1 5.5 1.8
I'm confident that I could adopt if I wanted to ... Disagree vs. Agree
Upstream 107.0 5.8 1.6 Downstream 113.0 6.0 1.5
For me, to adopt BMPs is Difficult vs. Easy* Upstream 117.6 4.4 2.1 Downstream 98.4 3.9 1.7
The decision to adopt BMPs is beyond my control .. Disagree vs. Agree
Upstream 113.3 4.5 2.3 Downstream 104.3 4.2 2.3
Adopt BMPs or not is entirely up to me ... Disagree vs. Agree**
Upstream 98.1 4.4 2.4 Downstream 125.1 5.5 1.9

112
Indirect Measurement Farm location Mean Rank
(Order) Mean Std. Deviation
Reduced production cost Upstream 106.9 12.6 7.9 Downstream 113.0 13.1 8.4
Environmental protection Upstream 107.4 17.2 6.0 Downstream 112.3 17.7 5.8
Gain from watershed service Upstream 106.4 15.4 7.3 Downstream 113.7 16.3 6.5
Greater commitment** Upstream 120.4 4.4 8.7 Downstream 94.5 0.9 8.9
Consumers Upstream 108.2 13.2 8.8 Downstream 111.3 13.3 9.5
Government Upstream 109.5 12.0 8.3 Downstream 109.6 11.5 9.7
Agricultural supply shop Upstream 108.7 4.4 9.8 Downstream 110.6 4.7 9.6
Neighbours Upstream 111.6 5.8 10.2 Downstream 106.7 4.6 10.0
Affordability Upstream 114.2 10.9 7.9 Downstream 103.0 9.0 10.2
Return Upstream 115.8 7.2 7.0 Downstream 100.9 5.4 8.4
Knowledge Upstream 113.3 10.2 8.4 Downstream 104.4 9.0 8.6
Farmer association Upstream 114.5 9.5 10.6 Downstream 102.6 7.5 10.9
Potential market Upstream 113.4 11.1 9.8 Downstream 104.2 9.9 9.7
Note: * significant at .05 level, ** significant at .01 level, *** significant at .001 level
According to Guagnano et al. (1995), psychological factors such as attitude and external
conditions act jointly to influence behaviour. The M-W test could only highlight how
attitudes and characteristics of upstream and downstream farmers differ, but it could not
define what constitutes such differences. There might be a possibility that psychological and
external factors work together to induce adoption, or external factors may contribute to the
strength (or weakness) of attitude-induced behaviour. Nevertheless, this is not the main focus
of this thesis, and there is room for future study in the context of the relationship between
psychological and external factors influencing adoption decision. The next section presents
the summary of this chapter.
113
4.3 Summary
Farmers’ decision-making regarding adoption of new innovations and agri-environmental
policies has received considerable attentions over many years. Adoption of new innovation is
influenced by a variety of factors, and for this reason the study of significant variables
explaining the decision is of interest to government. Traditional agricultural economics
assumes that farmers make decisions to maximise their utility. However, behaviour is the
consequence of a complex integration between socio-economic and psychological factors.
As such, a utility approach to understand decision-making has been supplemented by an
increasing input from psychology.
This study is developed based on a theoretical framework rooted in social psychology
complemented with variables derived from economic theory. From a theoretical perspective,
these empirical findings emphasise the relevance of combining theoretical insights from
different disciplines in adoption studies. The TPB is employed to investigate factors that
influence farmers’ decisions to adopt twelve BMPs in citrus farms. TPB is an expectancy-
value model, which has an ability to predict and to explain human behaviour by postulating
that behaviour is predicted by intention to perform that behaviour. Through the use of
statistical methods, the TPB provides a distinct process to show the relative importance of
the proposed determinants of intention, and to investigate which attitudes influence
behaviour. Furthermore, external variables are allowed to be included in the model so as to
increase predictive power. Thus, the TPB can increase our understanding of farmers’ beliefs
for policy making.
This chapter mainly focuses on the presentation of descriptive data. Descriptive data is easily
understood and it is not too technical, compared to inferential statistics. With a validity and
reliability of information collected from the surveys, the results provide supporting data for
policymakers by describing patterns and general trends in a data set. For example, the
descriptive data illustrates the characteristics of farmers and their farm environment. Further,
the TPB application shows that farmers in upstream and downstream areas differ in their
evaluative measures of BMP adoption. Both are significantly different in their belief-based
measures relating to attitudes towards BMP adoption. Other than differences in their latent
psychological variables, both farmer groups also differ in their past experience, dependency

114
on other crops, health state, farm size, stream condition, land ownership, household debt,
membership of farmers’ associations and access to information sources. Furthermore, an
investigation of farmers’ preference towards BMP showed that the most preferred BMP is
soil analysis, which is a test of organic matters and application of organic fertiliser to match
with crops’ need.
Overall, the results in this chapter provide an understanding of the nature of citrus farmers in
the Ping river basin, and suggest which BMPs are in the farmers’ interests. This descriptive
data is useful in presenting quantitative data in a manageable form. However, its main
limitations are that the results could not be extrapolated to a general population, and the fact
that the results could not identify a cause-effect relationship in farmers’ behaviours. Rather,
this descriptive data will provide basic information for further investigations of variables
influencing BMP adoption, and this will be undertaken in the next chapter.

115
5 OBSERVATION OF STATED ADOPTION INTENTIONS
This chapter aims to investigate factors explaining farmers’ intentions to adopt BMPs
(Figure 5-1). The first section (section 5.1) discusses how perceived costs may influence
farmers’ stated adoption intention. The cost data, derived from the economic cost study in
chapter 3, were plotted against the frequency of farmers’ stated intentions for each BMP. To
explore how farmers’ perceived costs may influence their adoption decisions, the
interpretation is expressed based on graph illustration and the facts recorded during the
farmers’ interviews.
Figure 5-1: Thesis structure

116
Building on the previous analysis and drawing information from the descriptive statistics
presented in chapter 4, the second section (section 5.2) proposes a multivariate logistic
regression analysis to examine factors influencing farmers’ decisions to adopt different
BMPs. To perform the logistic regression, twelve BMPs are collapsed into three functional
categories, which are: Good Husbandry; Vegetative Practice; and Structural Practice.
Statistical diagnostic to determine independent variables and variable selection techniques
are discussed. This is followed by the results from the best fit model. Section 5.3 is a
discussion. This chapter is closed by a summary of main findings in section 5.4.
5.1 Perceived Costs vs. Stated Intention
In general, adoption of any environmental measure results in a number of costs to farmers
and this could hinder adoption. Nonetheless, cost variables could not be included in the TPB
questionnaire. Rather, during the interviews farmers were asked to self-evaluate between
perceived benefits from, and perceived costs of, BMP adoption. The aim of this section is to
explore how perceived cost may influence farmers’ stated intentions. This section uses the
economic costs data (in chapter 3) to compare with the frequency of stated intentions on
adoption of each BMP (in chapter 4). It is expected that this may offer some insights into the
relationships between farmers’ perceived costs and their stated adoption intentions.
5.1.1 Graphical interpretation
In this thesis, farmer decision-making is assumed to be based on the perceived cost of
adoption. This decision-making process is in line with Reed’s (1999) argument, in that the
perceived cost, rather than the absolute level of cost, is an important determinant in
investment judgment. Accordingly, the costs to be discussed in this section are the farmers’
perceived costs at the time the decision is made. These perceived costs include the one-time
payment of the installation cost, annual maintenance cost and annual opportunity cost. In
Figure 5-2 and Figure 5-3, the scatter plots present numbers of farmers selecting a particular
BMP as their first option (refer to Table 4-8, chapter 4), while the bar graphs present total
costs of each BMP (refer to Table 3-4, chapter 3). In general, the results show that the most
popular options lie in the Good Husbandry, followed by Structural Practice and Vegetative
Practice.

117
In Figure 5-2, the actual total costs excluding (land) opportunity costs show that Structural
Practices especially practice 9 (on-site retention storage) and practice 11 (mix-load and
wash-down site) are not financially attractive, but some farmers still prefer to adopt.
Similarly, practice 4 (soil analysis) in the Good Husbandry is the most preferred BMP
amongst farmers though it has the highest investment costs compared with other BMPs in
the same category (i.e. practice 1-4).
Figure 5-2: Actual installation and annual maintenance costs vs. Stated intention
Notes: The horizontal axis represents twelve BMPs. From left to right, Good Husbandry category includes practice number 1-4: 1) scheduling water structure; 2) apply herbicide within tree canopy; 3) basic restrictions for pesticide application; and 4) soil analysis. Vegetative Practice category includes practice number 5-8: 5) vegetative cover; 6) mulching; 7) vegetative buffer strip; and 8) grassed waterway. Structural Practice category includes practice number 9-12: 9) on-site retention storage; 10) terracing; 11) mix-load and wash-down site; and 12) riparian setbacks.
In Figure 5-3, the bar graph is plotted against the scatter plot to present the land opportunity
cost and farmers’ stated intention. Practice 7 (vegetative buffer strip) and practice 8 (grassed
waterway) from Vegetative Practice, and practice 9 (on-site retention storage), practice 11
(mix-load and wash-down site) and practice 12 (riparian setbacks) from Structural Practice

118
have relatively high actual land opportunity costs. The number of farmers who prefer to
adopt these measures is relatively low, especially compared to BMPs from Good Husbandry
where opportunity cost is nearer zero.
Figure 5-3: Actual land opportunity costs vs. Stated intention
Notes: The horizontal axis represents twelve BMPs. From left to right, Good Husbandry category includes practice number 1-4: 1) scheduling water structure; 2) apply herbicide within tree canopy; 3) basic restrictions for pesticide application; and 4) soil analysis. Vegetative Practice category includes practice number 5-8: 5) vegetative cover; 6) mulching; 7) vegetative buffer strip; and 8) grassed waterway. Structural Practice category includes practice number 9-12: 9) on-site retention storage; 10) terracing; 11) mix-load and wash-down site; and 12) riparian setbacks.
5.1.2 How perceived costs may affect stated intentions
In Figure 5-4 the bar graph presents the actual total costs, which include installation cost,
annual maintenance cost and land opportunity cost, while the line graphs show the number of
stated intentions form farmers in different locations. This graph illustrates some preliminary
information important to understand the influence of perceived costs on farmers’ stated
intentions. The interpretation is referred back to the assumption of preference ranking
mentioned in chapter 4, where farmers were assumed to make decision based on perceived
costs (and perceived benefits). It was assumed that farmers consider adoption at the prices

119
they actually face and with a consideration on characteristics of the environment in which
they operate.
Figure 5-4: Actual total costs VS. Stated intention
Notes: The horizontal axis represents twelve BMPs. From left to right, Good Husbandry category includes practice number 1-4: 1) scheduling water structure; 2) apply herbicide within tree canopy; 3) basic restrictions for pesticide application; and 4) soil analysis. Vegetative Practice category includes practice number 5-8: 5) vegetative cover; 6) mulching; 7) vegetative buffer strip; and 8) grassed waterway. Structural Practice category includes practice number 9-12: 9) on-site retention storage; 10) terracing; 11) mix-load and wash-down site; and 12) riparian setbacks.
In general, the number of farmers preferring to adopt BMPs in Good Husbandry category
(i.e. practice 1-4) is obviously higher than those preferring BMPs in Vegetative Practice and
Structural Practice categories (i.e. practice 5-8, and practice 9-12, respectively). Basically, all
other factors being equal, willingness to adopt BMPs decreases with a rise in cost and vice
versa. This is obvious in farmers’ preferences towards the adoption of Good Husbandry
BMPs, which have lower investment costs in terms of both actual and perceived costs.
Indeed discussions during farm interviews revealed that farmers wanted to adopt BMPs in

120
Vegetative Practice and Structural Practice categories, but they withdrew because they
perceived a large amount of initial investment costs.
However, personal perceptions are subject to error, and the actual cost and perceived cost
may differ (Ross and Stiles 1973). As illustrated in Figure 5-4, it is evident that some
farmers prefer to adopt practices 9 despite the fact that the actual cost is relatively high.
Further, there is no stated intention for practices 7 and 12 though the actual total cost is less
than practices 8 and 9. Moreover, considered by itself the Good Husbandry category (i.e.
practice 1-4), the graph illustrates that a number of farmers preferring practice 4 is the
highest in spite of its highest actual cost.
At this point, the preliminary findings suggest some key points in the relationship between
the stated intention and perceived costs of adoption. First, if the amount of perceived costs is
obviously different and farmers can easily note this difference, farmers are likely to select
the one with lower perceived cost. This is evident in farmers’ preferences towards Good
Husbandry category. Lui et al. (2002) explain that in the circumstance where neither net
profit from BMP nor effectiveness of the practice is known, comparative cost is used to
measure competitiveness among several options. The practice with the most competitive cost
is likely to be adopted.
Second, when the difference in perceived costs is not definite, farmers tend to select
technology that meets their own objectives, production possibilities and farm constraints. In
other words, farmers weigh the advantages and disadvantages between options, and consider
which BMP is the most acceptable (Franzel 1999). As BMP is a site specific practice (i.e.
practicality) and its effectiveness varies across locations (Sharpley et al. 2009), farm location
is taken into account in order to understand the influence of perceived costs towards the
selected BMP.
Considering Figure 5-4, the graph illustrates some differences in stated intentions between
farmers in upstream and downstream of the Ping river basin. For example, practice 1
(scheduling water structure) is more preferred by downstream farmers, while practice 2
(applying herbicide with tree canopy), practice 3 (basic restriction for pesticide application),
practice 9 (on-site retention storage) and practice 10 (terracing) are more preferred by

121
upstream farmers. As any BMP is site-specific, it is applicable to citrus farms if it can be
installed as a retrofit of existing farm condition. Development and implementation of
practice 1 is not suitable in the upstream area, where most farms are on hilly areas. Similarly,
an installation of practices 9 and 10 is not applicable to farms in the downstream areas
because farmers are farming in ditch irrigation systems.
On the related point, the explanation of preferences towards practice 2 and 3 is not
conclusive. However, during the farm interviews, a few farmers commented on the
complexity of implementation. Downstream farmers perceived that the adoption of practice
2 could impede current working conditions, and it is difficult to maintain a safe distance
between the herbicide boom and the tree because of a narrow ditch. On the other hand,
practice 3 was recognised as needed and worthwhile for investment as it reduces chemicals
and cost. However, farmers also stated that it is time-consuming, complicated, and thus
frustrating. This may in part explain why downstream farmers, holding larger average farm
size, have stated lower interests in the adoption of practice 3.
In this thesis, farmers were asked to consider perceived costs and benefits from the BMP
adoption. Cost perception varies across farmers, and this can influence their intentions to
adopt a certain practice (Huijps et al. 2009). Farmers may value costs and benefits at the
price they have experienced with, and make decision to meet their own objectives and farm
constraints (Lutz et al. 1994). Even if the perceived costs of conservation practice exceed the
benefits in the short run this may not discourage the adoption by some farmer groups. The
findings simply indicate that although cost is regarded as an important determinant in
adoption decisions, it may not be the most important factor. The findings are similar to the
work of Sattler and Nagel (2010) in that factors other than cost are equally or even more
important for adoption a new technology.
5.2 Multinomial Logistic Regression Analysis
The main finding from the preceding section is that cost may not be the most important
factor influencing BMP adoption. This section looks beyond traditional economic theory to
include aspects of social psychology. The descriptive statistics from chapter 4 provide the
basis for the following analysis. This section specifically deals with the question of what are

122
the factors influencing farmers to adopt a different type of BMP. It begins with a basic
principle of logistic regression analysis for adoption models. This is followed by data
screening and statistical diagnostics leading to a creation of group-specific DUMMY
independent variables, and the techniques to select independent variables (i.e. added or
deleted or forced-entry) in logistic regression analysis. Next, it proceeds with the use of
multinomial logistic model to model the relationships between nominal-scale dependent
variables and a set of independent variables. This present section is closed with the results
from a multinomial regression analysis.
5.2.1 Logistic regression analysis for adoption intentions
The binary decision (i.e. adopt vs. not adopt) of citrus farmers generates a non-linear
response, and thus violates the assumptions of the linear regression model (Sheikh et al.
2003). A logistic regression is more suitable to model a relationship between a dichotomous
outcome variable and a set of covariates (Hosmer and Lemeshow 1989). Logistic regression
analysis does not require either multivariate normality or equal variance-covariance matrices
across groups. It also has the ability to incorporate nonlinear effects, and defines an S-shape
relationship between the dependent and independent variables (Hair et al. 2009).
Consider a collection of k independent variables which are denoted by the vector
),...,,(' 21 kxxxx = (Equation 4)
The probability being modelled is denoted by the conditional probability statement
)(),...,1( 21 xPxxxDP k == (Equation 5)
Thus, the logistic model may be written as
)(11)(
ii xexP βα ∑+−+=
(Equation 6)
where;
α = intercept parameter
β = regression coefficient
An alternative way to write the logistic model is called the logit form. The logit is the natural
logarithm of the odds of the outcome. The odds of the outcome is the probability of having

123
the outcome divided by the probability of not having the outcome (Katz 1999). Let the logit
transformation be denoted as logit P(X),
logit
−
=)(1
)(ln)(xP
xPxP (Equation 7)
where )(xP = equation 6
Thus,
logit )(xP = ]ln[ )( ∑+ ii xe βα (Equation 8)
logit )(xP = )( ii xβα ∑+ (Equation 9)
5.2.1.1 Independent variables
As from the elicitation study and literature reviews, there were thirty two independent
variables included in the study. These were thirteen psychological variables and nineteen
additional variables. These independent variables were subjected to see if they fit with the
assumptions of multivariate model, and the statistical software used for analysing data was
SPSS 16.0.
The data were first screened for normality and homogeneity of variance. The missing data
were then replaced with a conditional mean substitution15
15 For cross-sectional data, a conditional mean gives more accurate estimates of missing values. It is
a mean derived from other participants in the sample who have very similar background, not a sample mean.
. Statistical diagnostics revealed
that: 1) only indirect measures created by a summated scale of psychological variables were
reliably constructed; 2) variables with multicollinearity problems were deleted; 3) outliers
and influential cases were not relevant; 4) DUMMY variables were required to solve the
problem of linearity; and 5) one variable (contribution of full-time workers) contained
incomplete information cells, and was excluded from the model. Thus, only thirty one
independent variables were eligible for inclusion in the model. Descriptions of DUMMY
variables are illustrated in Table 5-1.

124
Table 5-1: Descriptions of DUMMY variables
Variables Coding and Descriptions Socio-demographics of the farmers Age of farmer AGEg1
AGEg2 AGEg3 AGEg4 AGEg5
= = = = =
≤ 30 year old* 30.1 – 40 year old 40.1 – 50 year old 50.1 – 60 year old > 60 year old
Education level EDUr EDU1
= =
< high school* ≥ high school
Gender GENg1 GENg2
= =
Male* Otherwise
Characteristics of the farm household Dependence on other crops CROPg1
CROPg2 = =
Dependence on other crops* Otherwise
Past experiences in farming16 PASTr PAST1
= =
< 15 years* ≥ 15 years
Health condition after starting citrus cultivation
HEALTHg1 HEALTHg2
= =
Health problem retarding farm work* Otherwise
Structures of the farm business Farm size SIZEg1
SIZEg2 SIZEg3 SIZEg4 SIZEg5
= = = = =
≤ 5 rais* 5.01 – 10 rais 10.01 – 20 rais 20.01 – 50 rais > 50 rais
Location UT DT
= =
Upstream area* Downstream area
Stream runs/ passes through farm STREAMg1 STREAMg2
= =
Stream run pass/ through farm* Otherwise
Soil type SOILg1 SOILg2 SOILg3
= = =
Clay* Loam Sand and others
Contribution of family labours FWr FW1
= =
Contribution of family labour ≤ 50%* Contribution of family labour > 50%
Contribution of part-time workers PTr PT1
= =
Contribution of part-time worker ≤ 50%* Contribution of part-time worker > 50%
Contribution of full-time workers FTr FT1
= =
Contribution of full-time worker ≤ 50%* Contribution of full-time worker > 50%
Land ownership LANDg1 LANDg2
= =
Own land* Otherwise
Household income per rai INr IN1
= =
< median value* ≥ median value
Household debt per rai DTr DT1
= =
< median value* ≥ median value
Social milieu Membership of agricultural association MEMg1
MEMg2 = =
Member of agricultural association* Otherwise
Access into government advisory services nGOVg1 nGOVg2 nGOVg3
= = =
No need for services* Easy or Not so difficult Difficult or Not that easy
Access into other sources of advisory services
nPRIg1 nPRIg2 nPRIg3
= = =
No need for services* Easy or Not so difficult Difficult or Not that easy
16 Farmers’ experiences could be backed up by a national policy. The 6th National Economic and Social
Development Plan (1987-1991) focused on: 1) the concern over natural resource degradation; and 2) the promotion of fruit crop cultivation. The 7th National Economics and Social Development Plan (1992 – 1996) focused on the sustainable development considering a common outlook and common principles to inspire and guide the people of the country in the preservation and enhancement of human environment.

125
Variables Coding and Descriptions Psychological factors Reduced production cost ATT1g1
ATT1g2 ATT1g3
= = =
1st tercile* 2nd tercile 3rd tercile
Environmental protection ATT2g1 ATT2g2 ATT2g3
= = =
1st tercile* 2nd tercile 3rd tercile
Gain more benefits from watershed ATT3g1 ATT3g2 ATT3g3
= = =
1st tercile* 2nd tercile 3rd tercile
Greater commitment to farm management ATT4g1 ATT4g2 ATT4g3
= = =
1st tercile* 2nd tercile 3rd tercile
Consumer SN1g1 SN1g2 SN1g3
= = =
1st tercile* 2nd tercile 3rd tercile
Government SN2g1 SN2g2 SN2g3
= = =
1st tercile* 2nd tercile 3rd tercile
Output retailer SN3g1 SN3g2 SN3g3
= = =
1st tercile* 2nd tercile 3rd tercile
Neighbour SN4g1 SN4g2 SN4g3
= = =
1st tercile* 2nd tercile 3rd tercile
Affordable PBC1g1 PBC1g2 PBC1g3
= = =
1st tercile* 2nd tercile 3rd tercile
Return PBC2g1 PBC2g2 PBC2g3
= = =
1st tercile* 2nd tercile 3rd tercile
Knowledge PBC3g1 PBC3g2 PBC3g3
= = =
1st tercile* 2nd tercile 3rd tercile
Farm association PBC4g1 PBC4g2 PBC4g3
= = =
1st tercile* 2nd tercile 3rd tercile
Potential market PBC5g1 PBC5g2 PBC5g3
= = =
1st tercile* 2nd tercile 3rd tercile
Note: (1) * reference group
5.2.1.2 Variable selection technique
In this study, external variables such as socio-demographic variables were collected from the
literature, whereas psychology variables were derived from the elicitation survey. There is
often a lack of theoretical literature on BMP adoption relating to psychology variables
(Prokopy et al. 2008), and thus stepwise logistic regression is useful in situations where
‘important’ independent variables are poorly understood in terms of their influence on
intentions (Hosmer and Lemeshow 1989). Further, the forward stepwise selection is superior

126
to the backward method when sample size is small for the number of independent variables
in the analysis (Katz 1999). Accordingly, a forward stepwise selection method was used to
determine the number of independent variables to be included in the equation. After the
significant psychological variables were defined, the subsequent step is to forced entry
external variables into the model simultaneously.
5.2.1.3 Dependent variables
As the descriptive statistic in chapter 4 presented data based on farm locations (i.e. upstream
vs. downstream areas), in this logistic regression analysis there was an attempt to assess the
effects of the determinants on the outcomes by splitting cases between upstream and
downstream location. However, using the statistical analysis programme (SPSS16.0), the
preliminary analysis of downstream samples yielded a floating point overflow error. This
error can happen when: i) the sample size is not big enough, thereby causing scattering data;
or ii) the computing system does not support the specific operation on floating point
numbers. As such, an alternative to analyse data is required.
Alternatively, it is worth to understand the nature of adoption based on the types of
management practice, in particular when one practice may require more efforts (i.e. time,
money) to implement than another (i.e. Good Husbandry vs. Structural Practices). Here, a
criterion to select dependent variables is a majority rule strategy. The majority rule applies a
transitivity principle implying that participants compare all possible pairs of alternatives, and
decide which alternative is preferred to another (Kinoshita 1991). Suppose a farmer of size n
is asked to choose the best among m potential options, there are many ways to determine a
preference order for the group. With the nature of discrete rank-orderings of BMP techniques
and when a complete rank-ordering is more difficult to obtain than a top choice, a majority
rule can perform effectively. In other words, a potential choice is better revealed when many
participants state their top choices rather than a few participants give complete rank-
orderings (Wu and Annis 2007). For example, during the interviews, it is more practical to
ask all participants to select and rank only the first three options, rather than ask them to rank
all twelve options.
Based on the majority rule strategy, only the first ranked BMP (or the most preferred BMP)
is used as a dependent variable. As there are twelve BMPs, a multinomial logistic regression

127
is suitable for examining a relationship between nominal-scale dependent variables and
multiple independent variables. To do this, twelve BMPs were collapsed into three
functional categories (refer to Table 1-5) in order to create three dependent variables: Good
Husbandry; Vegetative Practice; and Structural Practice. These three categories are not
mutually exclusive, but the probability of farmers experiencing any single outcome is
between zero to one.
5.2.1.4 Multinomial logistic regression
Multinomial logistic regression enables a calculation of the proportion that farmers fall into
one outcome category relative to the other two (Unrau 1998). It is applied to determine the
combination of independent variables that most influence the probability of a farmer
selecting one of the three functional categories. Multinomial logistic regression requires a
reference group to generate a regression model for nominal dependent variables. Reference
group is the category omitted in the analysis and the odds ratio is to be compared with this
reference group (Katz 1999).
In this study, there are two reasons why Good Husbandry is selected as a reference group.
First, Good Husbandry is the largest group. Katz (1999) explained that if the logistic model
has the largest group as the reference group, the standard errors are smaller and the
confidence intervals are narrower; thereby increasing more precise estimates. Second, Good
Husbandry provides baseline information that may be useful to compare with Vegetative and
Structural Practices in terms of financial and technical requirements to facilitate the BMP
implementations. For example, the interpretation could demonstrate the variables influencing
intention to adopt practices with higher up-front investment (i.e. those within Structural
Practice).
The analysis is expressed as an (log) odds ratio. Odds is the ratio of the probability that event
occurs to the probability that it does not, and the odds ratio is used to compare the odds of
those two groups by dividing the odds in group one by the odds in group two (Westergren et
al. 2001). An interpretation of the odds ratio is superior to other indicators in that it provides
an estimate with confidence level for the relationship between two binary variables, and the
ratio remains the same no matter how data arrangement in a table is switched (Bland and
Altman 2000).

128
The odds ratio given in SPSS 16.0 is labelled ‘Exp (B)’. The odds ratio greater than 1 means
that an independent variable increases the logit and increases odds of event occurs. The odds
ratio less than 1 means that an independent variable decreases the logit and decreases odds of
event occurs. The odds ratio equal to 1 means that an independent variable has no effect. An
interpretation of odds ratio for any particular independent variables is explained when all
other independent variables in the model are held constant.
To do the analysis, the forward stepwise method was first used to select psychological
variables. Results of the step summary are presented in Table 5-2 (for more details, see
Annex 7).
Table 5-2: Summary of forward stepwise procedure
Step Action Effect(s) Model fitting criteria Effect selection tests
AIC BIC -2LL Chi-square df Sig.
0 Entered Intercept 340.065 346.834 336.065
1 Entered PBC1g3 335.615 349.153 327.615 8.451 2 .015
2 Entered PBC2g2 330.383 350.690 318.383 9.232 2 .010
3 Entered SN1g2 327.587 354.662 311.587 6.769 2 .033
4 Entered SN1g3 321.767 355.612 301.767 9.820 2 .007
5 Removed PBC1g3 322.111 349.187 306.111 4.344 2 .114
For this model, PBC1g3 (perception that affordability highly influences BMP adoption)
entered first in the stepwise procedure, followed by PBC2g2 (perception that the return is
neither important nor unimportant in BMP adoption), SN1g2 (perception that the consumer
is neither important nor unimportant in my decision to adopt BMPs), and SN1g3 (perception
that the consumer is very important in my decision to adopt BMPs). However, PBC1g3 was
removed from the model in the final step. It is likely that PBC1g3 may relate to other
independent variables, and thus the Variance Inflation Factor test (VIF) was used to scan for
any multicollinearity. The analysis revealed that no VIF value was greater than 10, thus
indicating no serious multicollinearity effect (Field 2005).
Table 5-3 presents the psychology variables selected by the forward stepwise method. Three
psychology variables remaining for the analysis are SN1g2, SN1g3, and PBC2g2.

129
Table 5-3: Final model selected by forward stepwise method
Category of the adoption choicea B Std. error Exp(B)
95% CI for Exp(B)
Lower Upper
Vegetative Practice Intercept .252 1.163
SN1g2 -2.106 1.091 .122 .014 1.033
SN1g3 -2.700* 1.052 .067 .009 .528
PBC2g2 .899 .488 2.457 .945 .6388
Structural Practice Intercept -3.435* .719
SN1g2 1.394* .592 4.031 1.263 12.862
SN1g3 .372 .408 1.451 .652 3.230
PBC2g2 .975* .422 2.652 1.161 6.060 Notes: (1) aThe reference category is: Good Husbandry (2) R2 = 0.13 (Cox & Snell), 0.16 (Nagelkerke), 0.09 (McFadden) (3) *significant at the 0.05 level (4) n = 218 observations (nGood Husbandry = 157, nVegetative Practice = 24, nStructural Practice = 37)
The next step is to enter these three psychology and external variables into the equation. The
combined model, of only the final regression results, is presented in Table 5-4 (for more
details, see Annex 8). This combined model is significant at .05 level and the R2 of Cox &
Snell, Nagelkerke, and McFadden is 0.43, 0.55, and 0.36, respectively.
Table 5-4: Combined model with psychological variables and external variables
Category of the adoption choicea B Std. error Exp(B)
95% CI for Exp(B)
Lower Upper
Vegetative Practice Intercept -23.172* 7.831
SN1g2 -2.774* 1.271 .062 .005 .753
SN1g3 -3.625* 1.239 .027 .002 .302
PBC2g2 1.651* .731 5.214 1.246 21.827
SIZEg2 1.998* .995 7.373 1.048 51.874
FW1 2.854* 1.421 17.363 1.071 281.476
nPRIg2 2.301* 1.005 9.980 1.391 71.605
Structural Practice Intercept -1.666 5.548
SN1g2 2.277* .782 9.752 2.104 45.190
PBC2g2 1.318* .584 3.736 1.190 11.724
CROPg2 2.308* .789 10.056 2.142 47.223
SIZEg4 -2.451* .942 .086 .014 .546
SIZEg5 -4.108* 1.164 .016 .002 .161 Notes: (1) aThe reference category is: Good Husbandry (2) R2 = 0.43 (Cox & Snell), 0.55 (Nagelkerke), 0.36(McFadden) (3) *significant at the 0.05 level (4) n = 218 observations (nGood Husbandry = 157, nVegetative Practice = 24, nStructural Practice = 37)

130
The logistic regression models can be written as follows:
Logit (VP) = -23.17 + (-2.77) SN1g2 + (-3.63) SN1g3 + (1.65) PBC2g2 +
(1.99) SIZEg2 +(2.85) FW1 + (2.30) nPRIg2 (Equation 10)
Logit (SP) = -1.67 + (2.28) SN1g2 + (1.32) PBC2g2 + (2.31) CROPg2 +
(-2.45) SIZEg4 + (-4.11) SIZEg5 (Equation 11)
Equation 10 represents the log of probability to adopt Vegetative Practice over Good
Husbandry. When all variables were entered into the equation the three psychology variables
remained significant. Holding all other variables constant, results show that farmers who are
indifferent to (SN1g2) or those who highly care about consumers (SN1g3 ) have 0.06 (= e-2.774,
Table 5-4) and 0.03 times lesser odds of adopting Vegetative Practice than those who are
less concerned about consumers. Furthermore, farmers who hold indifferent preference
towards perceived farm returns (PBC2g2) have 5.21 times greater odds of adopting
Vegetative Practice than those who hold negative or positive preference towards perceived
farm returns. Further, farmers with the farm size of 5.01-10 rais (SIZEg2) have 7.373 times
greater odds of adopting Vegetative Practices than other farmer groups. Citrus farms
depending on more than 50% of family labour (FW1) have 17.36 times greater odds of
adopting Vegetative Practices than farms with less than 50% contribution of family labour.
Lastly, farmers who have easy/ not so difficult access to information sources other than
government agents (nPRIg2) have 9.98 times greater odds of experiencing Vegetative
Practices than those who are faced with difficult/ not so easy access.
Equation 11 represents the probability of adopting Structural Practice over Good Husbandry.
When all variables were entered into the equation, only two psychology variables remained
significant. Holding all other variables constant, results show that farmers who hold
indifferent preference towards consumers (SN1g2) have 9.75 times greater odds of adopting
Structural Practice than those who hold a negative or a positive preference. Further, farmers
who hold an indifferent preference towards perceived farm returns (PBC2g2) have 3.74
times greater odds of adopting Structural Practice than farmers who hold a negative or a
positive preference towards perceived farm returns. Moreover, a few more external variables
are significant. Farmers who depend solely on citrus cultivation (CROPg2) have 10.06 times

131
greater odds of adopting Structural Practice than farmers with farm diversification. Farmers
who occupy farm land of 20.01-50 rais (SIZEg4) decrease the odds of adopting structural
practice in their farm by 0.09 times, and those who occupy farm land more than 50 rais
(SIZEg5) decrease the odds of adopting structural practice in their farm by 0.02 times.
5.3 Discussion
There has been much discussion about which factors determine the intention to adopt new
conservation practices. This study draws a conclusion that both psychological and external
variables contribute to BMP adoption. The summaries of the causal relationship between
stated adoption intention and significant determinants are described as follows.
5.3.1 Influence of perceived cost on stated adoption intentions
The analysis in the first section attempted to investigate the relationship between perceived
costs and farmers’ stated intentions. Because of the difference in the underlying assumptions
between traditional economics and psychology, objective cost could not been included in the
TPB model. Rather, an investigation was done on the assumption that farmers made
decisions upon perceived costs, rather than actual costs. The graph presenting the actual total
costs of BMP against the numbers of farmers selecting such BMP as their first option. The
interpretation based on the graph layout and results from farmers’ interviews has led to the
conclusion that there is no definite trend in the relationship between perceived costs and
stated intentions.
The importace of perceived costs on adoption decision could be explained by the stepwise
method to select psychological variables. The TPB works by allowing participants to
evaluate the belief-statements and indicate whether they agree or disagree with such
statements. Attention should be paid to the two perceived behavioural control variables,
affordability for BMP implementation (PBC1) and perceived returns from the BMP adoption
(PBC2). Based on the TPB, these two factors were derived from the elicitation study, thereby
indicating that both vairables are important. However, the statistical analysis showed that the
PBC1 did not provide a significant contribution to the model. Overall, the investigations into
perceived costs and stated intentions show that perceived cost varies across farmers and
132
could affect adoption intentions for a certain BMP. Farmers do not always select an option
with the lowest cost because they also consider other factors when making decisions.
5.3.2 Influences of psychological determinants on stated adoption intentions 5.3.2.1 Subjective norm: consumer referents
The empirical analyses reveal that farmers who are indifferent towards consumer referents or
those who are highly influenced by consumers are unlikely to adopt Vegetative Practice,
while those who are indifferent towards consumers tend to adopt Structural Practice. The
direction of relationship between attitudes towards consumer referents and BMP adoption is
not definite; rather it depends on the consumer’s preference and the specific characteristics
of BMPs.
The farmer’s perception of consumer preference could play a role in the adoption decision
(Guehlstorf 2008; Kaine and Bewsell 2008). In response to market signals sometimes
farmers have to adopt new technologies even if they have not been able to skill on them
(Stone 2007). On the other hand, farmers who want to adopt an eco-friendly production
process are faced with consumers’ existing demand for conventionally produced food. This
is because the adoption of safer production is critical for a drop in the external appearance of
fruit such as colour, size and shape, and it is these attributes that are most used to evaluate
the quality of fruit when a consumer makes the buying decision (Sule Alonso et al. 2002). In
Thailand, consumers typically buy fresh fruit with a good physical appearance (Oates 2006).
Considering only the effect of consumer preference on their decisions, farmers will always
supply what the consumers want (Poole and Baron 1996; East 1993). Because BMP adoption
could reduce the external quality of fruit, it is possible that farmers who are influenced by
consumers are unlikely to adopt the practices.
Although consumers’ preferences are important for investment decisions, another concern
emerged during farmers’ interviews. Farmers stated that while making decisions, they also
considered the potential benefits from technology adoption. Tangible benefits from adopting
Structural Practice are more prevalent and observable than Vegetative Practice. For example,
a retention pond can store water during a dry season, or a loading station can provide
equipment storage and reduce health risk. At this point, the results suggest that the adoption

133
decision of a certain BMP is associated with farmers’ attitudes to consumers’ values weighed
by expected gains from the adoption of such practice. Farmers who are indifferent towards
consumers are likely to adopt Structural Practice rather than Vegetative Practice, and farmers
who are highly influenced by consumers are unlikely to adopt Vegetative Practice.
5.3.2.2 Perceived behavioural control: perceived farm return
Farmers differ in the degree to which they accept risk. Farmers’ attitudes can be divided into
three categories that are risk taker, risk neutral and risk averse (FAO 2007a). Risk-related
attitudes are an important factor in investment planning and can result in different responses
to adoption of new technology (Setia and Johnson 1988). The empirical analyses show that
farmers who are indifferent towards a perceived farm return are likely to adopt Vegetative
and Structural Practices.
Many studies found that a primary reason for adoption of conservation practices was a
farmer’s perception about perceived benefits (Rolfe et al. 2008; Gillespie et al. 2007;
Valentin et al. 2004; Cary et al. 2001; Cary and Wilkinson 1997). There is a possibility that
farmers who hold more positive perceptions about the outcomes of conservation practices
are more likely to adopt new innovations (Bosch and Pease 2000). Furthermore, risk neutral
farmers are less sensitive to changes in net farm return than risk averse farmers (Fafchamps
2003; Setia and Johnson 1988). As the potential outcomes of adopting a new practice are
hardly predictable (Pannell et al. 2000), it is likely that farmers holding indifferent
preferences towards farm returns may adopt BMPs.
5.3.3 Influences of external determinants on adoption intentions 5.3.3.1 Contribution of family labour to farm workload
It is hypothesised in this study that the contribution of family labour to farm activity is
positively associated with BMP adoption. The findings reveal that farms relying on more
than 50% of family labour in farm workload are likely to adopt Vegetative Practice. The
Vegetative Practice demands much management time and labour, and family members could
provide unpaid farm labour to the enterprise. Thus, a farm that relies mainly on family
members is likely to adopt labour-intensive practices. The empirical findings are generally
consistent with Gillespie et al. (2007) and Fernandez-Cornejo et al. (1994) in that family
labour supply is positively associated with the adoption of labour-intensive practices.

134
5.3.3.2 Farm size
This study assumed that farm size has a significant effect on technology adoption behaviour
in the agricultural sector, but it did not assign the direction of relationship. Literature showed
that farm size had different effects on the adoption rate depending on the characteristics of
BMPs. Many studies found that larger sized farms have generally been associated with an
increased likelihood to adopt technology. This is because smaller farmers tend to be faced
with large fixed costs, transaction costs and information costs; thereby reducing the tendency
to adopt new innovation (Larson et al. 2007; Zubair and Garforth 2006; Beedell and Rehman
2000; Fernandez-Cornejo et al. 1994; Earle et al. 1979). However, a few studies revealed
that smaller farmers adapted faster to new technology and perceived less problems than
large-scale farmers (Feder et al. 1985; Greene 1973).
The empirical analyses reveal that small-scale farmers holding farm land of 5.01-10 rais are
likely to adopt Vegetative Practice. There are at least three factors explaining adoption of
Vegetative Practice by small farms. These factors are trialability, compatibility and
complexity, and they are termed as programme factors17
by Rolfe et al. (2008). First,
Vegetative Practice offered in this study can be applied on a small scale (i.e. the most
selected practices are vegetative cover and mulching). Thus, farmers are able to trial prior to
full implementation. Second, the selected Vegetative Practice might be compatible with
existing farming methods and cropping system. Third, the innovation is not complex and
materials such as straw, grass, and vetiver can be found locally with relatively cheap cost.
On the contrary, the empirical analyses reveal that farmers who hold farm land of either
20.01-50 rais or more than 50 rais are unlikely to adopt Structural Practice. The negative sign
between Structural Practice adoption and farm size can be described by the characteristics of
BMPs. In Thailand, for small- to medium- scale farmers land area of more than 20 rais is
considerably large. Structural Practice typically requires high initial investment and the
following maintenance costs. Moreover, farmers incur land opportunity cost because the
BMP instalment reduces the production area for farming and causes net production cost
17 Programme factors are characteristics of a programme that could influence participation rate.
There are complexity, congruence, risk and uncertainty, capital implementation cost, intellectual implementation cost, flexibility, financial incentives, duration and continuity of the programme, and institution.

135
(Rolfe et al. 2008; Thurston 2006; Hoppe and Wiebe 2002; Stanley 2000; Woznick 1987).
Farmers are likely to adopt a new innovation, if such innovation can provide a reasonable
financial viability for the business (Pannell et al. 2006). However, farmers often tend to
overestimate privately short-run loss and overlook important medium- and long-term
benefits especially those associated to society (Stanley 2000) since it is difficult to quantify
and value social benefits. Because the current perceived economic costs outweigh economic
benefits, farmers therefore do not prefer the adoption of Structural Practice.
5.3.3.3 Access to information sources other than government
Besides information from government agents, farmers also rely on information from a
network of providers such as chemical dealers, input supply retailers and community leaders.
Farmers are likely to adopt new innovation, if technical assistance can be easily received
from this network (Gillespie et al. 2007; Feather and Cooper 1995; Traore et al. 1998). This
study hypothesised that easy accessibility to information sources is positively associated with
BMP adoption. The results show that farmers who have easy or not so difficult access to
non-government extension services are likely to adopt Vegetative Practice.
These findings are consistent with arguments by Pannell et al. (2006). They describe
farmers’ tendency to adopt conservation practices, if they can seek technical assistances from
people who are seen to be experts. During the survey, farmers stated that a non-government
extension service is credible and the support of innovation is clearly suitable to local
circumstances. Further, a great number of private extension agents are available at local
level. This could enhance adoption rate because farmers receive high exposure to the
information (Pannell et al. 2006). Another reason why access to private extension service is
positively associated with adoption intention is the history of relationship between farmers
and agents. In the past few years the major role of government extension agents in Thailand
is to promote farming practices to provide public goods such as environmentally friendly
production, rather than to support farmers to achieve their personal goal such as financial
viability. This has created a complex social interaction that may be less comfortable for
farmers and government agents; as such this enhances the role of private extension agents.
136
5.3.3.4 Crop dependency
Dependence on other crops indicates the number of activities other than citrus cultivation run
in the farm, and simply signifies farm diversification. It is hypothesised that more diversified
farms are more likely to adopt conservation practices because such adoption can potentially
benefit other farm business sections (Gillespie et al. 2007; Fernandez-Cornejo et al. 1994).
Moreover, a variety of practices can be trialled in a diversified farm, thereby making it more
likely to adopt new innovations (Rahelizatovo and Gillespie 2004).
Contrary to the hypothesis, farmers who depend only on citrus cultivation are likely to adopt
Structural Practice. Zentner et al. (2002) stated that managers of diversified farms demand
more time on management, such as monitoring and obtaining marketing. Further, with more
crop varieties farmers go through a learning process which could increase risks. For
example, production costs might increase because of misjudgement or until new experiences
is mastered. Moreover, Prokopy et al. (2008) describe that farm diversity may have a
negative sign with conservation practice adoption because farmers face with too many
choices and are unable to make decision within limited time and information.
5.4 Summary
Cost estimates in chapter 3 and descriptive statisics in chapter 4 provide ground information
for the analysis in this chapter. The analysis in the first section aims to explore how farmers’
perceived costs can affect their adoption intentions. To do this, actual cost data were plotted
against the frequency of stated intentions. The graph showed no definite trend in the
relationship between actual costs and stated intention. However, the further discussion based
on the graphical illustration and farmer interviews has led to the conclusion that cost is
crucial in farmers’ decision-making, but it may not be the most important determinant. This
is because farmers may make decisions based on other farm’s goals, such as environmental
stewardship.
This chapter then proceeds to examine factors affecting the decision to adopt different BMP
types. The twelve BMPs were collapsed into three functional categories: Good Husbandry;
Vegetative Practice; and Structural Practice. Farmers’ decisions to adopt a specific
functional BMP category were investigated through a two step multinomial logistic analysis.

137
First, statistical assumptions underpinning logistic regression analysis were validated, and
thirty one independent variables were retained. Then, the forward selection method was
conducted to select psychological variables. During the stepwise analysis, four psychology
variables were entered into the equation, but one variable (i.e. affordability) was removed in
the final step. Therefore, only three psychology variables were kept for the next step. Next, a
combined model comprising of those three psychology variables and external variables were
entered into the equation at .05 level of significance.
Results from the multinomial logistic analysis show that farmers who are indifferent to or
highly influenced by consumers are unlikely to adopt Vegetative Practice. Further, farmers
who hold indifferent preferences towards perceived returns are likely to adopt Vegetative
Practice. Farmers who occupy the farm land of 5.01-10 rais, or a farm having a high
contribution of family labour to farm workload, or farmers who easily receive information
apart from government advisory services are likely to adopt Vegetative Practices. In terms of
the determinants of Structural Practice adoption, at the .05 level, farmers who are indifferent
towards consumer referent are likely to adopt Structural Practices. Further, farmers who hold
indifferent preferences towards perceived returns are likely to adopt Structural Practice.
Farmers who depend only on citrus production are likely to adopt Structural Practice.
However, farmers with large farm size are unlikely to adopt Structural Practice.
Overall, this study begins to examine in which way perceived cost can affect farmers’ stated
intention. It then draws on the TPB and econometric estimation model as a framework for
understanding decisions to engage in BMP uptake at a landscape level. The TPB combines
both qualitative and quantitative methods. It requires qualitative research in the elicitation
study of attitudes, subjective norms, and perceived behavioural controls; while the statistical
analysis developed to use with the TPB is quantitative in nature. Moreover, in the context of
agri-environmental policy where other factors may be more important than beliefs and
attitudes in determining behaviours, external variables can be added into the model. The
results suggest that participation varies across different types of BMP. Further, the
significant factors derived from the statistical analysis are useful for policymaking. These
factors could provide a frame for minimum eligibility requirements for farmers and technical
standards for farms to participate in a BMP programme. To design a more targeted policy
approach accommodating differences between farmers, the next chapter introduces Q-
Methodology.

138
6 SUBJECTIVE POSITION
This chapter is an extension of the previous chapter, which observes farmers’ adoption
intentions (Figure 6-1). Though behaviour can be predicted by personal intention, intentions
do not always lead to the final behaviour because people may not behave in line with their
intentions. Furthermore, salient beliefs may differ from individual to individual and from
population to population, and this proposition has not been addressed within the TPB
framework (Cook et al. 2005). Provided there is another procedure for assessing the
subjective importance of beliefs, this could improve an understanding underlying a decision
process of specific subgroups and could offer tailored policy interventions.
Figure 6-1: Thesis structure

139
This chapter begins with a discussion about current statistical techniques to segment people
based on their attitudes (section 6.1). Section 6.2 presents a development of concourse and a
strategy to select statements within the Q-Methodology. This section also provides the
criteria to select small-scale participants from a pool of TPB samples. In section 6.3, a field
survey and fieldwork tools are detailed. The justification of data analysis is further presented
in section 6.4, and followed by results based on citrus farmer’s subjectivity in section 6.5.
The discussion in section 6.6 points to cautions in the application of Q-Methodology. This
chapter closes with the summary in section 6.7.
6.1 Attitudinal segmentation
Practically, cluster analysis and Q-Methodology are widely applied to investigate attitudinal
similarities and differences between groups (Morf et al. 1976). Cluster analysis is a statistical
technique used to identify groups with heterogeneous inter-group and homogeneous intra-
group characteristics (Aldrich et al. 2007). In other words, it is a technique to segment
individuals into categories so that the individuals in the same category are more statistically
similar to each other than those who are in other categories. For example, attitudes were
measured by a series of statements presenting in the forms of Likert-scales ranging from
‘strongly agree’ to ‘strongly disagree’ (Gorton et al. 2008).
Several studies employed cluster analysis to investigate farmers’ attitudes to agri-
environment policy. For example, Lobley and Butler (2010) performed a cluster analysis
with 1,852 farmers in Southwest England to investigate their reaction to CAP reform. The
analysis yielded five distinct groups, and suggested that different farming situations (i.e.
farm structures) are associated with different types of reaction (i.e. slightly influenced by
CAP reform). Vanhonacker et al. (2007) conducted a cluster analysis with 459 meat
consumers to understand their attitudes towards farm animal welfare. The results revealed
six groups and also suggested information regarding markting opportunities for high welfare
products.
Gorton et al. (2008) conducted a cluster analysis with 1,192 farmers from five EU countries
in order to investigate differences in attitudes towards agricultural policy amongst the EU
Member States. The five-cluster solution was obtained. Each group is first described based

140
on its attitudinal perspectives, and it is then refined based on its demographic and farm
structure variables. Kuehne et al. (2008) performed a cluster analysis with 121 irrigators to
investigate attitudes influencing willingness to participate in a water reform. Three-cluster
solution was chosen as it has a strong conceptual support, and as such each cluster is
meaningful. Garforth (2010) conducted a cluster analysis with 683 farmers to investigate
whether farmers with different sets of attitudes respond differently to the introduction of the
Single Payment scheme. The results showed that profit maximisation is not important for all
farmers.
Q-Methodology, on the other hand, is an agency- or person-centred approach, which
provides insight into the structure of attitudes and indicates which aspect of behaviour is
important. Barry and Proops (2000) classify Q-Methodology as attitudinal research along
with as semi-structured interview and focus groups, but offers stronger qualitative methods
providing a distinctive approach to empirical analysis. Recently, Q-Methodology is used to
understand farming style in the context of a rapidly changing agri-environmental policy
(Davies and Hodge 2007). The concept of farming style is that, in any farming community,
there is a set of farming strategy of which farmers are aware and from which they choose to
guide their own practice (Vanclay et al. 2006). Accordingly, understanding what are
underlying these basic motivations and how farmer perceives a new practice can help to
design policy that may receive positive responses. Examples of study employing Q-
Methodology to investigate farmers’ responses to new practices are given as follows.
Hall (2008) studied farmers’ attitudes to GM crops in Scotland using Q-Methodology. She
argued that previous studies usually focused on attitudes of consumers and agency bodies,
such as industry and NGOs, and not much attention was paid to farmers. The study, thus,
aimed to add farmers’ views to the overall GM debate. The findings suggested that farmer is
a unique stakeholder group in the GM debate in that it is neither extremely pro- nor anti-GM.
Rather, farmers prefer to wait and see the consequences of GM cultivation (i.e. benefits of
the technology) from other stakeholders (i.e. biotechnology companies).
Brodt et al. (2006) conducted the Q study and found three groups of farmer holding unique
combinations of goals and values that result in different farm management strategies. This
simply suggested that farmers may not adopt new practice if its values are not consistent

141
with their personal values. Moreover, diversities of farming style were then used to inform
policy to promote alternative farming practices. Davies and Hodge (2007) used the Q-
Methodology to explore environmental perspectives of East Anglian farmers. Five groups
were revealed and different policy orientations were suggested to correspond with different
groups.
Fairweather and Klonsky (2009) discussed the usefulness of Q-Methodology in terms of the
extension to policy implications. They concluded that Q-Methodology is a suitable method
for documenting farming styles and this knowledge allows an effective policy intervention
targeting at salient motivations or attitudes. Stewardship positions revealed by the Q studies
suggest that farmers’ core values and motivations are not only influenced by profit
maximisation. To a degree, this is align with the hypothesis underlying in Ecological
Economics that farmer is unbounded rational.
Overall, cluster analysis offers two clear advantages. First, it can pinpoint the differences
between each group based on attitudes and other variables such as demographic and
geographic characteristics (ten Klooster et al. 2008), thus improving the profiling and
validation of each cluster. Second, it is a preferred method when groups are identified based
on a large number of variables (Aldrich et al. 2007). However, as criticised by Hair et al.
(2009) cluster analylsis also has some limitations. First, the sample size must be large
enough to provide sufficient representation of small groups within the population and to
represent the underlying structure. Second, the cluster solution could not be generalised since
it depends on the variables used as the basis for the similarity measure. Third, the variables
used in the analysis must have a strong conceptual support because they will form the
interpretation of a corresponding cluster.
Several advantages of Q-Methodology are prior highlighted in chapter two (see 2.2.2).
However, as a research methodology, Q study also has some limitations. First, the sorting
process is time-consuming (McKeown and Thomas 1988). For example, method and
instructions must be clearly explained to participants. Second, as paticipants in the Q study
are purposively selected, the generalisation of the results could not be made (Danielson
2009). Third, participants are segmented based on their attitudes toward studied subject. The

142
interpretation based on other variables, such as demographic variables, is not recommended
because of the small sample size of participants (Danielson 2009).
Cluster analysis and Q-Methodology have different strengths and weaknesses. Morf et al.
(1976) argued that Q-Methodology is a more promising method to classify groups than is
cluster anlaysis. In terms of mathematical basis factor analysis, an underlying method in the
Q analysis, provides less susceptible to sampling fluctuations. This is because it takes into
account the entire matrix of similarity indices between observations in forming groups. In
other words, the broad dimensional Q factor analysis allows for the possibility that
participants are moderately associated with a number of variables, while the categorical
cluster analysis assumes that participants are maximally associated with one category and
not with all others.
Apart from the discussion above, the desired method for capturing attitudinal heterogeneity
may depend on research goals and data availability. The Q-Methodology presents itself as an
attitudinal study that could support the extension of the TPB and can be implied for the
formulation and analysis of an agri-environmental policy (Barnes et al. 2007). Q-
Methodology aims to understand spectrum of views by using the process that is relatively
independent of the researcher (Fairweather and Klonsky 2009). Accordingly, this chapter
offers an application of Q-Methodology in order to understand how attitudes impact on the
achievement of goal (i.e. BMP adoption).
6.2 Concourse Development and Establishing the Q-sample
The flow of information surrounding any topic in a Q application is termed a ‘concourse’. It
is from this concourse that a sample of statements is subsequently drawn for administration
in a sorting process (Brown 1991). In this study, the concourse relating to BMP adoption was
collected from document review and personal interviews based on a set of thirteen open-
ended questions18
18 This was the same questionnaire used during the TPB elicitation study (see Annex 5), and the
interviewed farmers were the same. In other words, the interview records from the same sources (i.e. questions and interviewees) were used as inputs for both the TPB and Q study. However, different approaches were used to derive variables/ statements for the analysis. In the TPB study, variables were derived by the content analysis (see 4.1.3.2) while in the Q study statements were categorised by relevant issues (Table 6-1).
. Example questions are: ‘what do you believe are the advantages/

143
disadvantages of BMP uptake?’, and ‘are there any conservation practices done on your farm
and what are they?’. Seventeen citrus farmers were interviewed in June 2007. They were
firstly informed about possible effects of citrus production on water quality and briefly
introduced to twelve BMPs selected by Thai agronomists as being those most relevant to
citrus farming in the study area (Table 1-5, Chapter 1). The concourse was subsequently
broken down into 419 statements. These statements represented 91 statements from printed
materials and 328 statements from the personal interviews.
Next, a subset of statements must be drawn from the concourse. van Exel and de Graaf
(2005) argued that these statements can be selected based on either existing theory or
induction from a survey feedback. They further discussed that either selection approches
could lead to a logical contruct of Q-sample as it is the participants who eventually give a
meaning to these statements through a sorting process. In this study, to ensure that the Q-
samples represented the entire concourse, a strategic sampling was applied. A matrix was
used to categorise 419 statements (Table 6-1).
Table 6-1: A two-dimensional matrix for statement categorisation
Statement topic Social Ecological Economic
Water resource management (2) (2) (2) Soil conservation (2) (2) (2) Pest control (2) (2) (2) Fertiliser use (2) (2) (2) Overall views (4) (4) (4)
Note: The number in parentheses represents total statements chosen from each corresponding cell and thus yields a total set of 36 statements for the analysis.
The thematic categories on the horizontal axis were based on the concept of sustainable
agriculture, and were social, ecological and economic aspects, while those on the vertical
axis were based on the technical aspects of BMPs, and were water resource management,
soil conservation, pest control, fertiliser use and overall views towards BMP adoption. From
419 statements, there are a few criteria to decide which statements will be selected as Q-
samples. First, the statements should be short, stand-alone sentences that are easy to
understand. Second, the statements should accurately represent ‘what is said’ in the
concourse (Webler et al. 2009). Third, the Q-sample should include statements that provide
the fullest range of viewpoints in the concourse (Durning and Brown 2006). The matrix not
only allows a categorisation of statement, but also offers a stratified random sampling for

144
statements selected from each cell. Using this matrix, a total of 36 statements for the Q-
sample was derived for the analysis (Annex 9).
6.3 Administering the Q-sort
The statement sorting (ranking) exercise was undertaken in December 2007 and August
2008. Theoretically, the number of participants does not have to be large to ensure the
comprehensiveness of factors and the reliability of the factor arrays (Brown 1980: 92). In
this study, 72 out of 218 TPB participants were purposively selected for the Q analysis. The
selection criteria are based on farm size, education level and age, to represent farmers from
different areas in the Ping river basin (51% were upstream farmers and 49% were
downstream farmers).
During the survey, all participants were provided with: (1) 36 cards, each containing a
statement and its number, (2) a guide bar with a quasi-normal distribution (Figure 6-2), and
(3) an answer sheet to record the rank ordering. They were then instructed to read all
statements, sort the cards according to the extent to which they disagreed or agreed with
them (-4 to +4) and to place the cards on the guide bar. Participants were also interviewed
about their own experience of citrus farming, current problems and opinions about BMPs.
Figure 6-2: Survey tools Notes: 1) A guide bar for 36 statements, and examples of the sorted statements (i.e. white cards) 2) Images of smiley face were used instead of typed ratings (i.e. very agree through to very
disagree)

145
6.4 Data Analysis
Each participant’s Q-sort was entered into a database using PQMETHOD software
(Schmolck 2002). Initially, a correlation matrix of Q-sorts was analysed using principal
components analysis. The analysis provided eight unrotated factors with eigenvalues > 1.0.
Next, a Varimax rotation was used to rotate the factors, thereby investigating a two, three,
four, five, six, seven and eight factor solution. The four factor solution produced the most
statistically defensible model providing a uniquely satisfactory account of the data. Thus,
this study reveals four factor groups or discourses.
In order to assign Q-sorts to the most appropriate factor, the factor loading of each Q-sort
was considered. Loadings were considered statistically significant at the 0.01 level if they
were approximately 2.58 times the standard error (SE) (Brown 1991). The standard error for
a factor loading was derived from 1/√N, where N equals the number of statements (Brown
1991). In this case, with 36 statements, the SE = 1/√36 = 0.17. Thus, Q -sorts with either a
positive or negative loading on a single factor in excess of 2.58(SE) = 2.58(0.17) = 0.44 were
considered to load significantly on that relevant factor. Seven sorts did not load onto any of
the four factors and they are thus excluded from further analysis (see Annex 10, Loadings).
6.5 Results
6.5.1 Interpreting factor arrays
The interpretation of the factors is based on statement scores. The statement score was first
computed as a z-score, and then converted into the original Q-sort value format (score -4 to
+4) for ease of interpretation (Watts and Stenner 2005) (see Annex 10, Distinguishing
statements). Here, particular attention is given to statements that distinguish between factors
and those statements that were ranked at the extremes of the scale (+4, +3, -3 and -4; Table
6-2). Positive scores indicate that a farmer would agree with that particular statement, whilst
negative scores indicate disagreement. Participants’ comments from the post-sorting
interviews were also incorporated in the factor interpretation. The four factors are labelled as
conservationist, traditionalist, disinterested and risk-averse.

146
Table 6-2: Factor Q-sort value (-4 to 4) for each statement
No. Statements Factors A B C D
1 Our water here is as safe to drink as anywhere in the country -4 -4** 0* -4 2 I have never discharged waste into natural watercourses 1* 4 -1* 4 3 Good water quality is a social benefit 4 3 3* 3 4 I can no longer fish from river that used to be a food source for a
decade 0* -2* -1* -2*
5 Natural watercourses are contaminated with chemicals 0* -3 -3 -1* 6 If I adopt BMPs, the natural watercourse will be cleaner and water can
be re-used for planting other crops 3 3 3 3
7 Government agencies should provide advisory services on soil management
3 3 1 0
8 To control weeds and grass, I prefer to use a power lawnmower than herbicides
3 2 2 1*
9 Vetiver (local plant) can stabilise farm ditches, but I cannot afford to buy the plants
0** 2** 0* -2*
10 I do not know which tree could reduce soil erosion effects -1 0* -1 -3* 11 Soil on my farm is easily eroded -1* -3 -2 -3 12 I do not have enough land to allocate to BMP activities -1 -1 0** -2* 13 Chemically sprayed citrus from my farm is safe to eat -2* 1 2 2 14 We should use organic substances instead of chemical pesticides on
citrus farms 2 2 2 -1*
15 If I do not apply pesticide as I have been accustomed to do, the fruit quality may drop
-3* 2* 1 0
16 Applying the dosage of chemicals suggested on the label will not harm human health
-3* 1 0* 1
17 Chemicals do not always imply toxicity -1 -2 -1 0* 18 Chemical-free labels on food are important for consumer purchasing
decisions 2** 1 1 0
19 I tend to use fertilisers that are widely used by my neighbours -2 1 1 -1 20 An application of organic fertiliser rather than chemicals will reduce
pollution 2** 1 3** 1
21 The application of organic fertiliser will give better fruit quality 0** -1* 2** 0** 22 I am happy to use fertilisers introduced by agricultural input retailers -3 -1 -2 -3 23 Farmers should apply the right amount of fertiliser to match the trees’
need because over-application will harm the environment 1 -1* 1 2
24 Without an application of chemical fertiliser, trees do not provide good yield
-2* 0 0 1
25 BMPs are needed to stop fighting between citrus farmers and residents 1 0 -1 1 26 Man cause pollutant emission, therefore we should take some actions
to lessen pollution. 2* 0 0 0
27 Farmers can comply with BMPs if they get enough monetary support from government
1 1 4* 2*
28 My neighbours will support me if I adopt BMPs 0** 0* 1 1 29 We can gain more watershed benefits if we can restrict pollution from
our farm production 1** 0** 0* 3*
30 In the long run, BMPs help enhance competitiveness in terms of chemical-free product
1 -1* 0** 2
31 The BMPs will lead to more red-tape, but I can adopt them despite this 0 -3* -1 0 32 We should restrict citrus cultivation to designated areas 0 0 -3* -1 33 Labour requirement for BMPs is a big problem -1** -2** -3* 0* 34 We could not introduce BMPs correctly because we do not have
enough understanding -2 -2 -2 -1**
35 Most citrus farmers are not aware of water availability in the watershed -1** -1 -4* -2 36 I cannot adopt BMPs because I do not have enough funds 0 0 -2* -1 Note: Reading the table by column reveals the comparative ranking of statements which
characterize a particular factor, and reading the table by row reveals the comparative ranking of a corresponding statement across all the factors. *p < 0 .01, **p < 0.05

147
Factor A: conservationist
Fifteen participants, both upstream and downstream farmers, loaded on the conservationist
factor. This discourse represents a position that is pragmatic, moderately progressive and
environmentally favourable. The main aspect of this discourse is the belief that ‘good quality
of environment brings better quality of life’.
Those associated with the conservationist factor group explicitly expressed a preference for
the production of safe and good quality products through environmentally friendly practices
(statement 15, score -3; statement 24, -2). They also demonstrated an interest in minimizing
adverse impacts on health and the environment (statement 13, -2; statement 16, -3; statement
20, +2). Further, this discourse was the only group expressing a belief that chemical-free
labels on food items potentially affect consumers’ buying decisions (statement 18, +2).
In terms of water resource issues, this discourse represents a viewpoint that is indifferent in
terms of perceptions about the current water quality (statement 4, 0; statement 5, 0; Table 2),
but farmers in this group stated their awareness of water availability in the watershed
(statement 35, -1). Further, this group of farmers was relatively confident that more
watershed benefits will be gained from BMP adoption (statement 29, +1). Some of them also
commented during the interviews that government should promote the concept of watershed
services and benefits of BMP adoption to induce behavioural change amongst citrus farmers.
This farmer group also believed that everyone was responsible for taking care of water
resources (statement 26, +2). Moreover, farmers associated with this discourse not only
expressed strong environmental concern, but also presented themselves as environmental
protectors (statement 2, +1).
Those farmers associated with this discourse did not perceive there to be a problem with soil
erosion on their farms (statement 11, -1), neither were they concerned about labour
requirements being a limitation for BMP adoption (statement 33, -1). However, these
statements were ranked relatively less negatively than by other groups. Additionally, farmers
represented by this discourse expressed neutral viewpoints towards BMP adoption in many
aspects. For example, they did not have strong opinions about the consistency of the quality
provided by organic fertiliser (statement 21, 0), or the readiness of their fellow citizens to
participate in more eco-friendly practices (statement 28, 0). Further, farmers represented by

148
this factor group did not explicitly express whether they could afford to buy local plants to
control soil stability (statement 9, 0). However, the interviews suggested that farmers needed
advisory support from extension agents in order to achieve better outcomes in soil
management.
Conservationists favoured conservation-oriented farming methods because they perceived
the necessity of improving human and environmental health. Indeed discussions during farm
interviews revealed that farmers had learned through trial and error to use smaller amounts
of chemicals but still maintained fruit quality. Overall, the extent of awareness of eco-
friendly production of this farmer group was relatively high.
Factor B: traditionalist
Sixteen participants loaded on the traditionalist factor; almost all were from downstream
areas. This discourse featured farmers who felt comfortable in their current situation. The
views represented by this discourse were characterized by a resistance to change that was
underlined by a lack of open-mindedness to the wider world.
Those farmers in this group perceived that water quality was being threatened (statement 1, -
4), but believed that this situation was bearable as water was classed as fishable (statement 4,
-2). The resistance to change mainly came from a satisfaction with current agricultural
practice which relied on chemicals in order to maintain fruit quality (statement 15, +2;
statement 21, -1; statement 23, -1). Farmers commented during the interviews that size-
graded and good-looking fruit could command higher prices. In other words, chemical-
sprayed citrus simply meant guaranteed returns and secure family farming.
The traditionalists also defined other limitations that deterred BMP adoption. These were a
lack of faith in the market for eco-friendly products (statement 30, -1), and uncertainty over
external uncontrollable factors such as governmental procedure (statement 31, -3).
Interviews revealed that some of the farmers in this group did not feel comfortable with strict
government regulations such as enrolment procedures, and paperwork. However, it was
evident that finding workers for labour-intensive practices was not a problem for BMP
adoption (statement 33, -2).
149
As recorded during the interviews, farmers in this discourse had been informed about the use
of local plants to stop runoff and maintain soil stabilization (statement 9, +2). However, this
contradicts the neutral opinion expressed about the received wisdom and prevailing
perceptions of erosion control (statement 10, 0). Further, farmers in this group also expressed
neutral viewpoints about uncertainty of environmental gains from BMP adoption (statement
29, 0) and being socially excluded by non-adopters who were in mainstream agricultural
practices (statement 28, 0). However, post-sort interviews with farmers revealed that some of
them were afraid of being excluded from cultural and economic processes, and of losing
informal support networks.
Farmers in this group showed less interest in applying new techniques and preferred current
farming practice. As long as current practices provided the main source of livelihood for
their family and high uncertainty about adoption of BMPs still prevailed, new production
techniques that deviated from the current practice of farming and ways of life would not
easily be accepted.
Factor C: disinterested
Seventeen participants loaded on the disinterested factor; almost all participants were
downstream farmers. This perspective is characterized by a recognition of resource
degradation, self-regard and a distinctive demand for short-term returns. This group was
facing lower yields and poorer quality of fruit as a result of pest and disease epidemics.
The views of this group were strongly focused on water availability for crop production and
food sources (statement 35, -4; statement 4, -1), undoubtedly because citrus production
requires a huge amount of water. Though this group did not express strong opinions about
water quality degradation (statement 1, 0), farmers perceived good water quality as a social
benefit (statement 3, +3). However, statement 3 was statistically distinguished by having the
lowest z-score when compared to the z-scores from the other discourses (Q-sort value
format, z-score: +4, 1.98; +3, 1.90; +3, 1.26; +3, 1.77). In other words, those represented by
this discourse least agreed with this statement of all groups.

150
Farmers in this group agreed that sustainability could be promoted through the use of organic
substances (statement 20, +3; statement 21, 2), but were likely to prefer farming methods
that contributed to nonpoint source pollution (statement 2, -1). The interviews revealed that
chemical-sprayed fruit was produced in large quantities in order to keep up fruit appearances
to meet with consumer demand. Another important viewpoint was found in opinions of
citrus zoning, of which this group was not in favour (statement 32, -3). In Thailand, crop
zoning aims to delineate a suitable area for each important crop in each watershed boundary.
With zoning, appropriate technologies and management such as good agricultural practices
can be applied to the particular growing area. Disagreement with the practice of crop zoning
may imply an unwillingness to change current agricultural activities.
One key viewpoint of this group of farmers was the perception that funds from government
were essential for starting a BMP scheme (statement 27, +4). This was despite the fact that
this group possessed fundamental resources such as labour (statement 33, -3), and funds
(statement 36, -2). Additionally, there were a few statements with which this discourse had a
neutral viewpoint. These were related to the use of local plants to stabilize soil (statement 9,
0), the availability of land for allocation to BMPs (statement 12, 0), impacts of chemical
applications on human health (statement 16, 0), likely environmental gains from adoption of
BMPs (statement 29, 0) and the likelihood that BMPs will increase competitiveness by
supplying a market for eco-friendly products (statement 30, 0).
The farming of this farmer group was economically non-viable, presumably because of an
extensive use of chemicals. Moreover, this group strongly expressed the view that financial
support from the government was required to start BMPs. Interviews revealed that this
money was viewed as a viable tool to promote opportunities in family farming and to secure
farm income. In terms of government action, this requirement signals that this farmer group
was likely to create better watershed services if reasonable incentives were offered.
Factor D: risk-averse
Seventeen participants loaded on the risk-averse factor. This group featured farmers with the
largest average farm size and almost all participants were from upstream areas where the
arguments over air pollution and excessive water consumption were always at the top of the
agenda. The farmers in this group were market-sensitive, and well informed. However, they

151
had doubts about the net gains from adoption, and thus refrained from implementation due to
costs and fear of economic losses.
Those associated with this discourse acknowledged that there were social benefits from farm
pollution restrictions (statement 29, +3), and preferred to apply more eco-friendly practices
in farm management (statement 8, +1). The group was also equipped with environmental
management knowledge (statement 10, -3; statement 34, -1) and displayed a capacity to
allocate land to meet with BMPs criteria (statement 12, -2). However, during interviews,
some citrus farmers expressed a refusal to divide their own land for vegetative and structural
practices (i.e. buffer zones and onsite retention storage) because they felt that too much land
was required and investment costs were high.
Another viewpoint found within this discourse was related to the perception of the current
condition of water resources. Those represented by this discourse did not consider that water
quality was being threatened (statement 4, -2; statement 5, -1). Thus if they must comply
with the policy on BMPs, an amount of monetary support was requested from the
government (statement 27, +2). This was to secure income and to comply with the regulation
if particular materials, such as local plants to control soil erosion, were required (statement 9,
-2).
Further, farmers in this discourse were reluctant to change their current practices. This
resistance came from existing attitudes towards chemical use which were compounded by a
disagreement that chemicals could be effectively substituted by organic substances
(statement 14, -1). During the post-sort interviews some citrus farmers asserted that
consumers bought fruit depending on its product attributes such as physical appearance,
rather than production attributes. Thus, the farmers inevitably applied chemicals. They also
stated that the government should promote and launch a campaign to raise consumer
awareness of chemical-free fruit. Those farmers associated with this discourse displayed
neutral viewpoints towards several statements. The group neither agreed nor disagreed about
the role of organic fertiliser in boosting fruit quality (statement 21, 0), or about labour
requirement being a limitation to BMP uptake (statement 33, 0). Additionally, farmers
associated with this discourse expressed a neutral viewpoint about the toxicity of chemicals
(statement 17, 0).

152
This farmer group held a positive attitude towards eco-friendly management, but refused to
change. This is because farmers viewed BMP adoption as a risky activity, in that their wealth
rested on the success of innovation. This fitted with a managerial profile which emphasizes
the goal of reducing variation in income, and gives environmental protection a lower priority
than the economics of the farm business.
6.5.2 Consensus statement
There are points of consensus amongst all four factors. One statement that received a
statistically indistinguishable z-score and that all factors ranked in the same direction (score
+3) is statement 6 (Table 6-2; see Annex 10, Consensus statement). All groups agreed that if
they adopted BMPs, natural watercourses would be cleaner and could then be safely re-used
for planting other crops. This consensus statement suggests that citrus farmers perceived
natural water resources as economic goods, and essential assets in farming. This is
unquestionably because citrus production demands huge amounts of water and the cost of
water acquirement is relatively high in terms of effective irrigation systems such as
sprinklers. Furthermore, citrus farmers had experienced conflict over excessive water
consumption amongst various water users in the watershed, as well as arguments between
farmers and local residents in the critical areas. Therefore, they tended to believe that BMPs
could help solve these existing conflicts through less-polluted water and water recycling.
6.6 Discussion
The bottom-up results from Q-Methodology can provide policymakers with information for
sustainable policy development. However, caution is needed when policymakers target
different programmes to different farmer groups. For example, the traditionalist and
disinterested groups are mainly downstream farmers, while almost all of the risk-averse
farmers are upstream farmers with relatively large farms; however assuming that these
particular characteristics are likely to be consistently defining variables may not be justified
(Raje 2007). There were some downstream farmers who were represented by other
discourses, thus being a downstream farmer was not the only reason for being defined as a
traditionalist or disinterested. Similarly, there were some large-scale upstream farmers who
did not load on the risk-averse discourse. In conclusion, farmers in the Ping river basin held
a number of perspectives towards BMPs, but these were not consistently related to farm or

153
farmer characteristics. Q-Methodology is not an approach that aims to identify certain
socioeconomic groups and their associated views. Rather, Q-Methodology can be used to
identify what different perspectives exist and also what farmers share as common
perspectives about BMP uptake.
Further, as participants in the Q-study were not randomly selected, the reliable
generalisations about farm or farmer characteristics cannot be made (Danielson 2009).
However, Q-Methodology facilitates decision-making by highlighting relatively important
attitudes about the topic being studied (Durning and Brown 2006). A few dominant concerns
do emerge and provide some insights relating to the key factors affecting potential BMP
adoption. Policy interventions may need to vary group by group. Different instruments will
have varying success within different groups given the variation in the motivations and
interests across groups (Davies and Hodge 2007).
6.7 Summary
An application of Q-Methodology aims to understand farmers’ attitudes and to identify the
ways environmental issues are perceived. Evidences from Q-Methodology are expected to
enrich findings from the TPB and econometric estimation analysis by mapping the different
perspectives of citrus farmers relating to BMP uptake. The first step in Q-Methodology was
to develop a concourse and to establish the Q-Sample. In this study, concourse was gathered
from personal interviews and published materials such as newspaper, public hearings and
government reports. A concourse of 419 statements was derived. These statements were
categorised by a data matrix and 36 statements were drawn from the concourse.
Seventy two participants were purposively selected from the sample set from the TPB study.
The participants included 51% of upstream farmers and 49% of downstream farmers. The Q-
sorting was conducted during winter 2007/2008 and summer 2008. Data were analysed using
factor analysis and factor rotation provided by the PQMETHOD software. Findings revealed
a diverse range of opinions and determined salient beliefs toward BMP uptake. The four-
factor solution gave the most coherent explanation with 48% of total variance. These four
distinct groups were then labelled according to their main characteristics, and these were
conservationist, traditionalist, disinterested and risk-averse.

154
In short, the conservationist is pragmatic, moderately progressive and environmentally
favourable. The traditionalist tends to resist BMP adoption. This is signalled by a lack of
self-confidence and narrow-minded views toward policy changes. The disinterested
recognises a state of natural resource degradation, but shows a distinctive demand for short-
term returns to compensate for current losses from farming. The risk-averse is market-
sensitive and it refrains from BMP adoption because of fear of economic losses. Though four
groups hold different subjectivities in their attitudes toward BMP uptake, there are parts of
consensus. The consensus suggests that farmers perceive natural water resources as
economic goods and essential assets in farming. Viewpoints of these four groups can then be
used to deepen understanding about perceptions of BMP adoption and lead to policy design.
In sum, Q-Methodology is an alternative method to assess human subjectivity in a systematic
way. Furthermore, it would help modify the assumptions of objectivism underlying the R-
Method typically used by traditional economists. In this study the strengths of Q-
Methodology are that it allows farmers to model their own attitudes, and it preserves self-
referent factors during a statistical analysis. Evidences from this study reveal that important
beliefs are different from group to group. This in turn implies that a well-designed policy to
meet with the needs and desires of the farmers potentially increases participation.

155
7 KEY FINDINGS AND POLICY IMPLICATIONS
This thesis offers three independent studies on BMP adoption. Each of which has its own
stand-alone value, and provides meaningful information for policy implications. This chapter
outlines the key findings from each study and presents policy implications by linking the
study findings to the literature on PES (Figure 7-1). Section 7.1 summarises the key findings
from each independent study and methodological findings. These findings provide
information for a discussion regarding the development of water-related PES programmes in
section 7.2. The policy implications are presented in section 7.3. The lessons learned from
the findings in terms of nonpoint source pollution management are discussed in section 7.4,
followed by the methodological limitations and recommendations for future research in
section 7.5. Section 7.6 presents ‘a way forward’ focusing on future actions the government
should consider in order to develop a PES programme in Thailand.
Figure 7-1: Thesis structure
156
7.1 Summary of Findings
The analysis presented in the preceding chapters has highlighted the state of BMP adoption
in citrus farms in the Ping river basin. In chapter 3, the study on costs incurred to farmers
demonstrated cost components of twelve BMPs. In chapter 4, using the data collected
between December 2007 and August 2008, an empirical model based on the TPB was
applied to investigate farmers’ adoption intentions and descriptive statistics were presented.
In chapter 5, the cost information from chapter 3 provided information for the study of how
perceived costs could affect farmers’ stated intentions. Moreover, data from chapter 4 were
modelled with a logistic regression analysis to explore the significant factors influencing
adoption intentions. In chapter 6, Q-Methodology was employed to define salient attitudes
towards the adoption decision. In this chapter, the results from the above mentioned studies
are discussed in the context of available PES literature. This offers insights into policy
implications for a water-related PES programme.
7.1.1 Key findings from the independent studies 7.1.1.1 Farm-Level Cost Analysis
Influence of perceived costs on adoption intention
The observation of the relationship between perceived costs and stated intention to adopt a
particular BMP is partially relevant to the results from the TPB model and Q-Methodology,
and it suggests three main findings. First, from the farmers’ viewpoint, land opportunity cost
can be a critical determinant when selecting BMPs. This is because a perception of high
opportunity cost potentially affects perceived profitability. Neill and Lee (2001) argue that
an adoption of new technology is likely to take place if alternative land uses are more
economically viable. Similarly, Pannell (2003) stated that since benefits of BMP adoption
are not always apparent and provided the minimum scale of land needed to trial BMP is
large, these could deter farmers’ adoption. The conclusion that land opportunity cost is a
barrier for adoption of a certain BMP is not only derived from the farm-cost study, but it is
also evident in the TPB model and Q-Methodology studies, in that BMPs with large land
opportunity cost are less preferred.

157
Second, perceived cost plays an essential part in decision-making, but it may not be the most
important determinant in farmers’ adoption intentions. This conclusion is also supported by
the TPB and its empirical analysis. In the TPB model, the elicitation study, which provided
qualitative data, was conducted to determine psychological factors influencing BMP
adoption. Affordability (PBC1), reflecting farmers’ perceived costs, was one of the most
frequently stated factors, and it was incorporated in a logistic regression as an independent
variable. In the stepwise analysis, affordability was firstly entered into the equation, but it
was then removed from the equation in the final step. In this sense, from farmers’
viewpoints, affordability (or perceived cost) could be viewed as an important factor affecting
their adoption decisions, but it is statistically nonsignificant when other predictors were
taken into consideration. Furthermore, although the economic cost analysis at farm-level
showed that BMPs with low investment cost were preferred to those with relatively high
cost, there was no definite conclusion regarding the relationship between perceived costs and
stated intentions. For example, though Structural Practices are not financially attractive and
have a high opportunity cost, they were preferred by a number of farmers.
The last observation is that farmers are likely to adopt the practice they perceive that the
benefits outweigh the costs. This is supported by the finding that soil analysis is the most
preferred BMP. This finding is consistent with the work of Rolfe et al. (2008) who found
that nutrient management was favoured by farmers because the perceived benefits, such as
input use reduction, exceeded perceived implementation costs. However, this could raise an
argument regarding the influence of perceived cost, because it varies across farmers and
whether farmers adopt a new technology partially depends on their personal attitudes
towards conservation practices (Gelso et al. 2008). Thus, holding all other relevant factors
constant, that farmers will adopt practices producing higher benefits relative to costs is true
only if farmers easily distinguish costs between several BMPs.
Indication for payment
Cost components of BMP are divided into two main categories. These are installation and
annual maintenance costs, and land opportunity cost. The investigation on the cost
differences amongst twelve BMPs highlights the significance of land opportunity cost as it
shares the largest proportion in BMP cost structure. This is followed by installation costs that
occur in the first year and annual maintenance costs. The information regarding cost
component is useful for designing a PES programme. In the context of PES programmes,

158
payments per ha are the same for all service providers adopting a given practice. Thus, the
critical factors that differentially affect farmers’ ability to participate in BMP programme are
on the cost side (Pagiola et al. 2005). The observation on costs can signal a fair
compensation for land converted to conservation practices, and thus increase participation
rates.
7.1.1.2 An extension of the TPB model
Preference towards Good Husbandry
Due to the fact that BMPs are site-specific, in this thesis farmers were presented with twelve
BMPs. Farmers were asked to select the top three BMPs that they wanted to adopt in their
farms. The results in chapter 4 show that Good Husbandry is preferred to Vegetative and
Structural Practices. There are a few reasons why Good Husbandry is more attractive than
other BMP categories. These are detailed as follows:
1. Good Husbandry offers a few advantages over other functional categories. For
example, it can be trialled on a small-scale for learning process, and its effects are
observable in a shorter time compared to other BMP categories.
2. In Thailand there is legislation that prohibits certain actions in farm management.
For example, farmers are not allowed to farm in a former forest reserve. They must
hold an utilisation certificate, but they are restricted with some land use
regulations, such as extensive earthworks. This could be a barrier to the adoption of
Vegetative and Structural Practices.
3. Vegetative and Structural Practices may not be compatible with existing farm
layout or operations. Thus, farmers perceive an increase of overall complexity in
land management system from their adoption.
The most preferred BMP
The results illustrated that soil analysis is the most preferred BMP amongst farmers. Soil
analysis is defined in this thesis as a test of organic matters and fertiliser application,
particularly organic fertiliser, to match the need of crops. It is found that one-third of farmers
stated their intentions to adopt this BMP in their farms. This is because farmers perceive that
adoption can lead to a reduction in production cost, and prevent future loss in farm profit.
Further, the adoption of soil analysis is flexible and can be adopted in any farm site.

159
Contribution of psychological variables to economic behaviour
Economic decision models offer an understanding of factors affecting adoption, whereas
psychological constructs explain how such adoption is translated into decision-making
(Montoya et al. 2000). Failure to incorporate these two disciplines into the behaviour study
could result in a welfare distortion of agri-environmental policy. This is because parts of
individuals’ behaviour is unbounded rationally, but policy is often made based on a bounded
rationality assumption (Guagnano et al. 1995). In this thesis, BMPs lend themselves to the
construction and application of TPB. The inclusion of TPB in this thesis is to induce
behavioural, i.e. psychological, variables into the model. This can provide a better
explanation and prediction of economic phenomena (BMP adoption). The importance of
psychological variables in economic behaviour is supported by the findings from the
empirical model. The M-W test helps in explaining the rationales behind farmers’
differences. It was used to find how farmers’ psychological variables (or thought processes)
differ and to compare external conditions between upstream and downstream farmers.
Moreover, results from the multinomial logistic regression analysis indicate that both
psychological and economic perspectives are critical determinants for understanding why
farmers adopt conservative practices. Thus, policymakers should take into account the value,
belief and incentive of target population when implementing policies.
Reference points to increase farmers’ participation
The TPB model explicitly hypothesises behavioural intention to be an immediate
determinant of behaviour, and further suggests that psychological determinants can serve as
a point of attack to induce targeted behaviour (Ajzen 1991: 206). The logistic regression
analysis in chapter 5 included a set of psychological variables and additional variables to
increase the predictive power to the model. Results have shown that the likelihood of
adopting BMPs was associated with farm size, contribution of family labours in farm, access
to information sources apart from government agencies, and dependency on other crops.
Moreover, two significant psychological determinants were farmers’ attitudes towards
consumers and farmers’ perceived farm returns.
In this thesis, there are two ways the TPB and its regression analysis could inform
government intervention. First, the results suggest which specific psychological determinants
should be addressed. Knowing the important beliefs that underlie farmers’ attitudes, a
government can pay attention to these salient beliefs and design interventions to increase the

160
adoption rate. For example, the results show that perception about farm returns is a
significant barrier to BMP adoption. As fixed investments and significant capital layout are
required, incentive systems could be considered to keep farmers engaged (Fielding et al.
2005). Furthermore, consumers are the major referents influencing adoption intention,
channelling of information through customers is likely to be an indirect motivation to
increase farmers’ participation. Figure 7-2 illustrates supply chains delivering citrus to
consumers. An understanding in a delivery path could elaborate how marketing campaign is
used to raise awareness amongst consumers.
Figure 7-2: Marketing channels
Obviously, the most direct and simple sale is when the farmers sell their fruit directly to
consumers. Farmers peddle their fruit from house to house, or consumers go to buy at the
farms. Fruit is also delieverd through retailers, such as supermarket, fresh market, and a
peddler. The upstream channels of retailer can be farmers themselves, wholesalers, or farmer
groups/ cooperatives. A considerable amount of citrus also goes to citrus processing plant or
is packed for export.
Consumers’ food choice is influenced by taste and appearance, health, convenience, and
process (Brunso et al. 2002). At the attribute level BMP-processed fruit shows a striking
difference; for example, its contribution to environmental conservation when judging in
comparison with commercial fruit. However, there is a knowledge gap between farmers and
consumers because consumers become increasingly distanced in terms of time, space and

161
experience from the farm and production process (Jaffe and Gertler 2006). Bignebat et al.
(2009) argued that intermediaries, such as retailers, may either help or hinder transmitting of
imformation as they play an important role in making products available to consumers. As
such, stimulating consumer demand by creating the images linked to the production value is
a key to success, and marketing campaign needs to integrate this value in the purchasing
behaviour (Horlings 2009).
Second, the analysis indicates that the influence of additional determinants on adoption
intentions is attributed to backgrounds of farmers. Farmers with different backgrounds prefer
to adopt different BMP categories. Policymakers can consider these additional determinants
as an entry point for policy intervention, such as the criteria to set minimum requirements for
farmers and farms participating in a PES programme.
7.1.1.3 Q-Methodology
Farmer’s attitudes – differences and similarities
The application of Q-Methodology in chapter 6 helps to understand why farmers behave the
way they do, how opinions and attitudes are formed, how farmers were or will be affected by
the policies, and the differences between farmer groups. Q results enrich findings from the
TPB study by illustrating different farmers’ perspectives in relation to BMP uptake. During
the analysis and the interpretation of salient statements, four farmer groups were revealed.
These were conservationist, traditionalist, disinterested, and risk-averse (Figure 7-3).
Empirical work suggests that an attitude study is important for implementing policy
(Tjernstrom and Tietenberg 2008), in that psychological segmentation facilitates policies
designed to remove adoption barriers which typically vary across farmers (Pannell et al.
2006).

162
Figure 7-3: Main characteristics of each group and consensus area
Though the four farmer groups suggest that there is a wide variety of farmers’ attitudes
towards BMP adoption, there is an area of consensus where all farmers perceive a positive
aspect of BMP (Figure 7-3). All groups agreed that if they adopted BMPs, natural
watercourses would be cleaner and could then be safely re-used for planting other crops.
This agreement points toward an opportunity to promote BMPs as farmers generally hold
positive environmental values regarding water resources and perceive water as an economic
goods. In sum, Q results highlight different perspectives and offer insights into how much
differences are constructed. Furthermore, Q study provides the information of what different
perspectives exist and what farmers share as a common perspective about BMP uptake.
Q results and policy implications
As suggested by Swedeen (2006), results from Q study could benefit policy implications in
two ways. First, different management alternatives could be constructed for each discourse.
Cools et al. (2009) find that segmentation can identify target groups according to a variety of
meaningful variables and helps to develop practical guides that are appropriate for each
group. Second, policy could target at shared perspectives or consensus. Consensus may be of
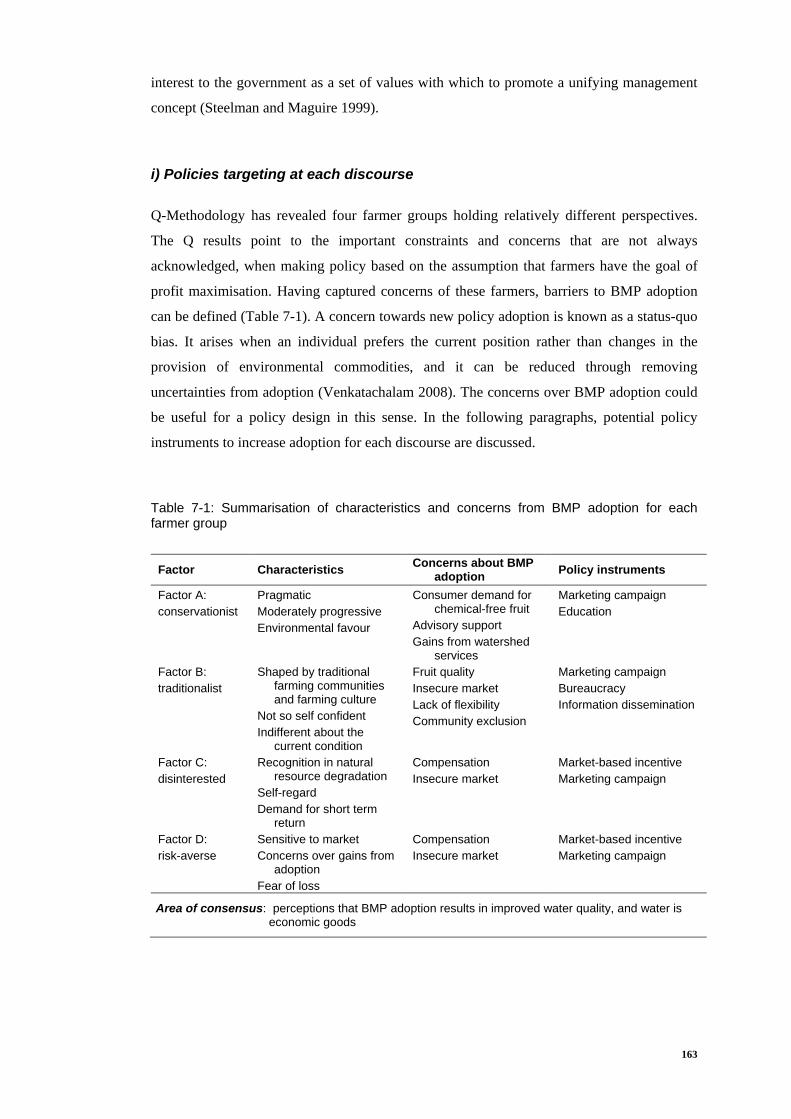
163
interest to the government as a set of values with which to promote a unifying management
concept (Steelman and Maguire 1999).
i) Policies targeting at each discourse
Q-Methodology has revealed four farmer groups holding relatively different perspectives.
The Q results point to the important constraints and concerns that are not always
acknowledged, when making policy based on the assumption that farmers have the goal of
profit maximisation. Having captured concerns of these farmers, barriers to BMP adoption
can be defined (Table 7-1). A concern towards new policy adoption is known as a status-quo
bias. It arises when an individual prefers the current position rather than changes in the
provision of environmental commodities, and it can be reduced through removing
uncertainties from adoption (Venkatachalam 2008). The concerns over BMP adoption could
be useful for a policy design in this sense. In the following paragraphs, potential policy
instruments to increase adoption for each discourse are discussed.
Table 7-1: Summarisation of characteristics and concerns from BMP adoption for each farmer group
Factor Characteristics Concerns about BMP adoption Policy instruments
Factor A: conservationist
Pragmatic Moderately progressive Environmental favour
Consumer demand for chemical-free fruit
Advisory support Gains from watershed
services
Marketing campaign Education
Factor B: traditionalist
Shaped by traditional farming communities and farming culture
Not so self confident Indifferent about the
current condition
Fruit quality Insecure market Lack of flexibility Community exclusion
Marketing campaign Bureaucracy Information dissemination
Factor C: disinterested
Recognition in natural resource degradation
Self-regard Demand for short term
return
Compensation Insecure market
Market-based incentive Marketing campaign
Factor D: risk-averse
Sensitive to market Concerns over gains from
adoption Fear of loss
Compensation Insecure market
Market-based incentive Marketing campaign
Area of consensus: perceptions that BMP adoption results in improved water quality, and water is economic goods

164
Market-based incentive: the disinterested and risk-averse groups were concerned about the
level of compensation to be paid for BMP uptake. To address this, adopting farmers should
be compensated for producing the extra benefits that arise from BMPs, otherwise the
externality will not be priced and market failure will follow (Sarker et al. 2008a). A market-
based incentive of both cash and in-kind compensation could be offered to induce desirable
behaviour (Dowd et al. 2008). For example, farmers may be compensated for capital
installation costs or increased risk in terms of decreased yields over the first few years of
implementation (Ribaudo et al. 1999).
Marketing campaign: while the conservationist realised there may be a potential market for
eco-friendly products, the traditionalist, disinterested and risk-averse expressed doubts about
there being a guaranteed market for chemical-free fruit and concerns about lower fruit
quality if organic substances were applied. According to Oates (2006), Thai consumers find
it difficult to distinguish between quality and safety labels, and many of them rely on certain
retail chains rather than quality certification. Marketing campaigns to raise awareness about
eco-friendly production processes could generate a price premium for sustainable citrus
farming (Oates 2006). Such a campaign might help to assuage farmers’ concerns about there
not being a market for chemical-free produce, and, in turn, increase the likelihood of
voluntary adoption for all farmer groups.
Bureaucracy: bureaucratic barriers and lack of flexibility, such as government regulations,
paperwork requirements, participation and eligibility requirements, are some of the main
concerns for the traditionalists. If BMPs are being promoted as a policy, the government
should launch simple regulations and make procedures flexible in order to simplify
communication between farmers and government (Kosoy et al. 2008).
Education: previous studies suggest that a lack of information about profitability and
environmental benefit has deterred farmers from the adoption of proper management
practices (FAO 2007b). This is supported by the interviews with the conservationists, who
agreed that education could open the door to opportunity for every farmer. For example,
science-based information could lower the risk perceptions of the risk-averse and enable the
traditionalist and disinterested to improve their understanding about positive outcomes from
adoption. Information could help to revise farmers’ perceptions regarding the cost

165
effectiveness of new farming practices and environmental benefits (Feather and Amacher
1994). Farmers should be informed that their farming depends on, and generates, a wide
range of ecosystem services, including watershed services such as water flow and water
quality. This can be done through training or extension workshops under the instruction of
expert farmers (Brookfield and Gyasi 2009; Hashemi et al. 2008). Ramsey and Hungerford
(2002) suggested that environmental education offered through the schooling system is
critical for removing barriers to the adoption of more eco-friendly practices producing
ecosystem services.
Information dissemination: traditionally, farm supply shops serve as a meeting place and
information centre for Thai farmers (Oates 2006). Those who step out of mainstream
farming could face significant social pressures, including being excluded by neighbours (de
Buck et al. 2001). This was one of the concerns exposed during the post-sort interviews with
traditionalists. Because supply shop retailers play an important role in information transfer,
they could potentially provide extension services, for example acting as a BMP innovation
dissemination point for farmers (FAO 1999; Fuwa and Sajise 2006).
ii) Policy targeting at a shared agreement
A few Q-studies focused on policy intervention targeting at shared values amongst all
discourses. For example, Ockwell (2008) suggested that discussion to policy intervention
could start with an area of consensus. Webler and Tuler (2001) argued that it is a challenge
for policymakers to meet with different views and to design a process that meets shared
needs. Similarly, Swedeen (2006) agreed that area of consensus serves as a basis for future
work in developing a sustainable policy that is consented by all stakeholders.
In this study, the consensus statement represents the idea that water is economic goods and
being a critical resource in citrus production (Table 7-1). This may suggest a point that
relevant to the development and operation of a PES programme. Since PES programmes can
be adopted as a business-type approach, offering a long-term environmental conservation
(Bishop et al. 2006), this identifies an acceptable condition for a BMP adoption that would
be compatible with farmers’ shared value. In other words, the area of consensus suggests that
promoting PES programme as a fair and viable agreement to sustain water quality could
open up a possibility for dialogue to satisfy solutions amongst all farmer groups.

166
Overall, the Q results highlight farmers’ constraints and interests. It also offers insights into
social, political, economic, and technical perspectives that are fundamental elements of the
farming. These perspectives are basic premises leading to a success of PES development
(Perrot-Maître 2006). For example, the findings explicitly illustrate that cash alone is not
sufficient to induce farmer’s participation. This is in line with the existing PES programme
in France, the Vittel water company providing incentives to upstream farmers to voluntarily
change their farming practices. The key issue for the success of Vittle company is an
incentive which taking into account the livelihood strategies of farm families and their long-
term plans (Perrot-Maître 2006).
7.1.2 Methodological findings
Figure 7-4 illustrates the extent to which key findings can contribute to methodology and
policy implications. In terms of methodological findings, there is a linkage between
independent studies, in that the key findings from one independent study offer information
for another independent study. First, the economic cost estimates provided cost figures for a
graphical comparison to explore a relationship between perceived cost and farmers’ adoption
intentions. Second, a sample in the Q study has been drawn from the TPB participants.
Methodological links between these independent studies are presented as follows.
First, previous studies (see for example: Rehman et al. 2007; Fielding et al. 2005) showed
that a TPB-structured questionnaire could only contain perceived costs. As such, the TPB
model could not explain how costs associate with behaviours. Alternatively, the influences
of costs on adoption decision have been investigated through a graphical illustration. In this
sense, the economic cost estimates were plotted against the frequency of stated intentions to
adopt each BMP. Notably, the graph presentation might be criticised for the lack of details
and accuracy regarding data interpretation. But, it is the second best method to present
quantitative data when the regression method could not be done.
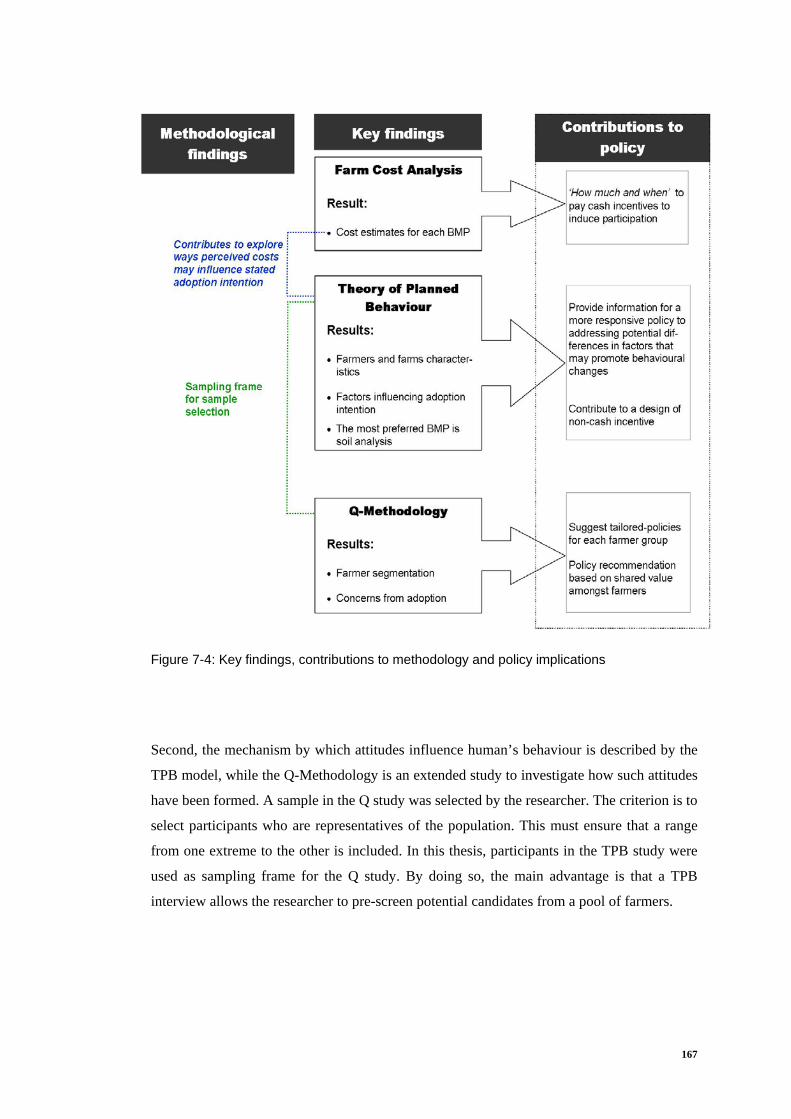
167
Figure 7-4: Key findings, contributions to methodology and policy implications
Second, the mechanism by which attitudes influence human’s behaviour is described by the
TPB model, while the Q-Methodology is an extended study to investigate how such attitudes
have been formed. A sample in the Q study was selected by the researcher. The criterion is to
select participants who are representatives of the population. This must ensure that a range
from one extreme to the other is included. In this thesis, participants in the TPB study were
used as sampling frame for the Q study. By doing so, the main advantage is that a TPB
interview allows the researcher to pre-screen potential candidates from a pool of farmers.

168
Another point why this thesis has proposed the Q-Methodology after the TPB study relates
to policy implications. Barker and Swift (2009) argued that rather than explicitly indicating
the effective intervention, TPB results can provide just general guidelines for government
intervention. TPB findings only suggest the importance of promoting supportive campaigns
through a psychological construct and inform an early intervention programme by targeting
directly to external factors. Therefore, policy implications can be done at a generic level by
highlighting the key issues the policymakers should focus on. However, given a
comprehensive perspective of human behaviour, tailored interventions would be more
efficient than interventions directed at changing behaviour in a general population (de Bruijn
et al. 2005). The challenge is to consider different types of farmers grouped by their
attitudes. In an attempt to use the Q-Methodology, the psychological segmentation
contributes to a more responsive and specific policy designed to remove adoption barriers
which vary across farmers (Pannell et al. 2006). Moreover, the revealed consensus suggests
that there is a potential to advance a PES programme as a mean to preserve water quality.
This information is useful for policy implications as the PES programme is induced not only
by transferred payment from beneficiaries to service sellers, but it also requires the existence
of a ‘pro-protection’ attitude amongst service sellers, such as farmers (Vatn 2009).
7.2 Widening the PES Perspective and Contributions to Policy
This section discusses conditions for a design and development of water-related PES
programmes. The discussion is based on findings which can contribute to PES literature. To
answer the question of how to achieve PES, three main components of PES programme are
considered. These are: i) the commodity; ii) institutional arrangement, including interplay
between sellers, buyers and intermediary, and a legal framework to support the PES
programme; and iii) payment mechanisms, addressing the issue of how the payment should
be made, how much to be paid and when to do the transaction.
7.2.1 Commodity
One of the key conditions for PES programmes is that there should have a well-defined
ecosystem service. This is important because the ecosystem service must be transformed into
a commodity, which then can be exchanged for a payment. The Millennium Ecosystem
Assessment (2005) states that cultivated land can deliver a regulating service of water

169
purification by the process, such as removal of excess nutrients and pollutants. In terms of
impaired water quality as a consequence of farm pollution, an efficient approach is needed to
tackle the problem at the source of origin. Amongst several management tools, a series of
BMPs are recommended to reduce the risk of farm pollution by intercepting, or preventing,
pollutant before it reaches water bodies. Typically, PES programmes tie payments to the
delivery of a service proxy rather than the service itself (Wunder et al. 2008; Landell-Mills
and Porras 2002). In chapter 1, twelve BMPs were defined as commodities in the sense that
they have been long perceived as contracts negotiated between service providers and
downstream beneficiaries. Buyers purchase conservation practices adopted by service
providers but they do not directly buy watershed services.
For example, the analysis in chapter 4 showed that soil analysis was the most preferred BMP
amongst citrus farmers in the Ping river basin. From the supply side, this may imply that the
soil analysis has a potential to be promoted as a commodity in the PES programme.
However, the issue of which ecosystem service is defined as a commodity has importance
beyond traditional commodity considerations, because it addresses the management of
environmental resources and human well-being. This suggests that a biophysical model is
needed to elucidate the link between ecosystem and its services (Daily et al. 2009). A
simulation model is useful to investigate the scale effects of conservation practices, and the
results can be fed into an economic model to measure the value services accruing to
beneficiaries. This information is necessary in the design of PES programme, as it develops a
baseline to assess PES additionality. The additionality is critical at the early development
stage because PES is much more a demand-oriented programme requiring performance
standard as the basis for programme decision-making (Smith 2006). In other words, the farm
produces multi-services to buyers. To appoint appropriate commodity, policymakers must
understand how well BMPs can be characterised with respect to their effects on ecosystem
services. This is to ensure that positive impacts from the BMP adoption will occur, and that
the water-related PES programme meets demand from service buyers.
7.2.2 Institutional arrangements
Wunder (2005) suggests that in the development of PES programme there needs to be
institutions and laws that make provisions for and have capacity to effectively facilitate the
transaction. This section aims to identify potential sellers and prospective buyers, to

170
determine whether an intermediary is needed to facilitate a PES programme, and to look
beyond the prevailing legislations whether they are sufficient for supporting a PES
programme.
7.2.2.1 Prospective sellers, buyers, and intermediary
Figure 7-5 presents how the key findings from the three independent studies can be used to
specify the potential sellers, buyers, and an intermediary in the PES programme.
Sellers
Citrus cultivation is one source of pollution in the Ping river basin. Impaired water quality as
a result of farm pollution suggests that alternative measures are needed to tackle the
problems of nonpoint source pollution at farm level. This thesis proposes that citrus farmers
in the Ping river basin are potential sellers who can adopt BMPs in exchange for payments.
The characteristics of sellers were described by descriptive statistics in chapter 4. Moreover,
in chapter 5, the use of TPB with a multivariate logistic regression helps to explain
complexities of farmers’ behavioural intentions by identifying significant factors explaining
the intention to adopt each BMP category, i.e. Good Husbandry, Vegetative Practice and
Structural Practice. Further, Q study to understand differences and similarities in farmers’
attitudes toward BMPs was offered in chapter 6. The findings from TPB and Q studies
enable the understanding of stated intentions within each BMP category. They are also
useful to set up eligibility requirements for participants, and suggest policy instruments to
induce farmers’ participation (Figure 7-5).
Findings from the logistic model and Q-Methodology suggested that the farmers’ decisions
were not only based on profit maximisation, but it was also influenced by internal factors,
such as personal perceptions about ability, skills, and knowledge. This is in line with the
conceptual framework proposed by the Millennium Ecosystem Assessment (2005). Based on
the framework, indirect factors, such as cultural and socio-political forces indirectly drive
changes in ecosystem services, and these factors may directly affect human well-being. The
findings that internal factors are important to decision-making are necessary for the
development of PES programme, because transfer payments can take on many forms from
actual cash to technical assistance and in-kind compensation (Wunder et al. 2008). Knowing

171
what are significant factors affecting adoption intentions and how farmers perceive BMPs,
policymakers are able to design more effective policy to motivate farmers and increase the
rate of voluntary participation.
Figure 7-5: Criteria to define prospective buyers, sellers and an intermediary
Buyers
In the context of PES, a buyer is any stakeholder who recognises a change of ecosystem
service provisions, and who can be morally, legally or rationally motivated to pay for such
service provision (Suyanto et al. 2005). Lipper et al. (2009) identified three broad categories
of buyers: public sector, private sector, and NGOs. The key to determine the source of
payments is the type and distribution of benefits generated. The conceptual framework
illustrating relationships and interactions between ecosystems and human well-being
(Millennium Ecosystem Assessment 2005), and the spatial dimension of the external positive
effects generated are useful to identify prospective buyers (Figure 7-5).
Wunder (2005) states that the beneficiaries will pay as long as the ecosystem service is
provided. This condition is based on the additionality of the PES. Buyers will participate if
they are confident that additional services, such as when reduced fertiliser rates are applied,

172
are secured (UNESCAP 2009). To this point, in the long term, an individual buyer may not
be willing to pay for a service. This gives room for a government to induce demand for
ecosystem services. In some cases a government acts as a buyer (Steed 2007) by collecting
taxes and grants, sometimes with earmarked contributions, and channelling through service
providers (Wunder 2007). How long the government can act on behalf of users depends on a
continuation of budget allocations.
Intermediary
Intermediary is defined as any actor who facilitates and maintains the exchange flows of
services and payments between sellers and buyers (Figure 7-5). The roles of intermediary are
as service and information providers, mediators, arbitrators, representatives, developers of
standards and bridge builders (Thuy et al. 2010). Moreover, an intermediary is established in
order to deal with transaction costs associated with PES programmes, especially when there
are plenty of small landholders producing nonpoint source pollution (Jack et al. 2008).
Transaction costs of PES typically include: 1) technical work to define links between the
ecosystem and the services; 2) establishment of organisations to manage, monitor and
support a programme; 3) establishment of property rights; and 4) monitoring the compliance
(Kemkes et al. 2010). The distribution of small- and medium-scale farmers is scattered along
the Ping river. This suggests that an intermediary is needed to generate collective action to
link sellers and buyers.
The meta-analysis in chapter 2 revealed that there are many forms of intermediary, such as
government agencies, NGOs, trust funds, communities, and the private sector. Each
intermediary has its own advantages and disadvantages in the development and management
of PES programmes (Thuy et al. 2010; Corbera et al. 2009). For example, farmer
organisation or community has the advantage in negotiating with service sellers who are
mainly poor farmers. But, it has the least power amongst intermediaries because of inferior
political status. Government, on the other hand, is seen as the most powerful intermediary
because of its highly centralised institution. However, the major disadvantage emerges from
this centralised power as PES programmes may not reflect the need of service sellers and
buyers.
173
The experience of PES programme in developing countries (i.e. Vietnam) suggested that
some intermediaries may perform to support their interests, such as commercial and political
missions (Thuy et al. 2010). As such, they are not neutral and may not work on the basis of
benefits for either service sellers or buyers. Moss (2009) argued that the positive impacts of
intermediaries depend on their international and local identities, relationships, capacity and
adaptation to local situations. Further discussion focuses on the need to consider a
combination of local organisations and government authorities to facilitate PES programmes
(Thuy et al. 2010). This poses a challenge on an institutional interplay, which is a concept
concerning the effectiveness of outcome regarding interactions between institutions (Young
2002). Moss (2004) recommended that, at the river basin scale, a negotiation amongst
stakeholders and a creation of new partnership are required to efficiently manage water
resource.
Practically, some water resource management programmes are based on considerations
towards stakeholder interplay and participatory approach. These initiatives are characterisied
by a catchment partnership and aim to promote collaborative resource management, to
construct groups to do joint work and to build trust. Catchment partnership is needed because
there always is a policy gap between water management planning (i.e. standards of water
quality and quantity set by government authorities) and land-use management (i.e.
conventional farming). Catchment partnership is seen in developed world; for example, the
Dee catchment partnership (Dee Catchment Partnership 2009) and the Tay area management
plan (SEPA 2008) in Scotland, and the Moreton Bay and Catchment in Australia (GWP
Toolbox 2008). These partnerships normally involve a wide range of organisations, agencies
and individuals, and work on a voluntary basis. Overall, they work as a network to establish
a shared and long-term institution to support water resource management at the river basin
scale, and to ensure that all stakeholders benefit from improvement in water quality.
7.2.2.2 Legal framework
A legal framework is needed to facilitate the establishment of PES programme. Here, a
discussion regarding legal framework for the implementation of PES is relevant to well-
defined property rights, and existing laws and regulations.

174
Property rights
Well-defined property rights are a prerequisite to commitment to conservation practices
(George et al. 2009). In the context of PES, property right is related to the characteristics of
CPR and the spatial flow of ecosystem services. Fisher et al. (2009) pointed to a subtle
difference between CPR and ecosystem services. They argued that CPRs are resources
producing benefits to human, while ecosystem services are the processes of delivering such
benefits. For example, water quality has a characteristic of CPR because it is rival and non-
excludable, whereas the regulating services of good water quality can be delivered through
farm land which is typically a private property. In this sense, policy does not focus on ‘water
regulation’ management, rather it highlights farm management practices, which provide
water regulation services.
Descriptive statistics in chapter 4 revealed that 83% of farmers were landowners, while the
remaining were tenants. For a service flow of water quality where downstream beneficiaries
pay upstream farmers for the adoption of certain practices, Vatn (2009) argued that a lack of
secured land title increases uncertainty for service buyers. The tenants are challenged with
which rights they must have to involve their lands in the PES programme. Huang and
Upadhyaya (2007) studied the characteristics of PES programmes in Southeast Asia and
found that user rights over the resources were sufficient to establish working PES
programmes. Similarly, George et al. (2009) conducted a PES study in northern Thailand.
They concluded that as long as user rights have been respected, and a strong trust has been
developed between sellers and buyers, land title issued by the government is not necessary
for the implementation of a PES programme.
Existing laws and regulations
Laws and regulations provide effective incentives for an investment in a PES programme.
Examples of legal provisions to induce farmers to change their farm management practices,
especially in input uses and production practices, are widely seen in the United States
(Swinton et al. 2006). The literature review in chapter 1 showed that current legislation in
Thailand, such as an effluent charge, subsidies, and a labelling scheme, is available to
manage farm water pollution (Thomas 2006). Nonetheless, these laws do not mandate an
engagement in PES. For the sustainability of PES programme, an appropriate legal
framework must be established so as to set institutional arrangements, responsibilities, and
175
eligibility requirement (Takoukam and Morita 2008). Thus, policymakers must consider
whether the need is to modify the existing laws and regulations to support PES, or to launch
a new legislation (Huang and Upadhyaya 2007).
7.2.3 Payment mechanism
In the context of payment, in particular the question of ‘who should pay whom’, a
fundamental question is whether farmers should be considered as polluters or service
providers. Hatfield-Dodds (2006) argued that equity principles, PPP and BPP, provide a
framework to consider who should bear the costs in achieving environmental goals. For the
most part, demand for ecosystem services from beneficiaries creates market (Landell-Mill
and Porras 2002), thereby implicitly assigning property rights over agricultural land to
farmers. PES aims to compensate farmers for increasing the amount of positive externality
above and beyond what they would have done (Antle 2007). Accordingly, a PES programme
works on the basis of BPP (Engel et al. 2008), suggesting that an action provides a benefit
must be compensated for.
The following question is whether the transfered payment within PES programmes violates
the PPP principle. For example, a perverse incentive can happen as farmers may use
practices that degrade natural resources in order that they can participate in the PES
programme. Salzman (2005) argued that this perverse incentive is unlikely unless the
expected private benefits of poor land management exceed the costs of doing so. This is
because worsening current land management practices for potential payments can cause a
significant cost in long-term farm productivity. However, if policymakers suspect the
existing of perverse incentive, an establishment of baseline for participation could reduce
such perverse incentive (Antle 2007).
There are several forms of payment mechanism depending on the characteristics of the
commodity, sellers and buyers. The review in chapter 2 also showed that the most prominent
payment mechanism for watershed services in developing countries is a government-
intermediary based transaction. As a collective entity, government pools funds from groups
of buyers and channels through sellers, and this creates a monopsony situation because a
government seemingly acts as a single buyer. This monopsony power is merely a market
form where there is a dominant buyer and multiple sellers. As such, monopsony is not

176
relevant to the enforcement of either payments or cross compliance measures. Rather, it
involves in a PES programme as an approach to reduce transaction costs, thereby increasing
the potential to establish the PES programme (Kemkes et al. 2010; Salzman 2005).
The success of some PES programmes was due to them being monopsony markets. For
example, a case in USA where the New York water authority is a single buyer for water
purification. It pays farmers in the Catskill and Croton watershed to undertake forestry
BMPs (Salzman 2005; Landell-Mills and Porras 2002). The success of this scheme is from
the fact that the buyer can control the quantities of service desired by the public and estimate
the costs to obtain such a goal (Antle 2007). The monopsony power is not limited to only
government, rather the purely private market can also act as a monopsony. An example is the
Vittel company in France who pays 26 farmers for an adoption of agricultural BMPs. The
success of this project is a trust-building and the development of a long-term participatory
process between the buyer and sellers (Perrot-Maître 2006).
Another issues relating to the payment mechanism is a payment schedule. Pagiola et al.
(2005) stated that an appropriate payment schedule must be carefully designed and
considered with care. For example, some BMPs have high front loading payments in the
very first year, while certain BMPs have an equal instalment over the length of the contract.
The suitable amount must be paid at the right time in order to induce farmers’ participation
and protect perverse incentives, such as a mismanagement of fund.
Apart from the considerations mentioned above, another issue to be considered is the total
amount paid to providers in exchange for certain services. Pagiola et al. (2005) suggested
that the payment amount is typically between the minimum a service provider is willing to
accept in changing their land management and the maximum a service buyer is willing to
pay for improved ecosystem service. As a rule of thumb, a total amount paid for sellers
should cover their private opportunity costs, and direct costs incurred in the adoption of new
practices (Sarker et al. 2008a). However, some farmers may not be interested only in direct
cash compensation. Asquith et al. (2008) argued that non-cash incentives can be more
effective than cash payment because they are seen to increase farmers’ welfare over the long
term.

177
Here, the results from the farm cost analysis in chapter 3 can give an indication on when the
payment should be made and how much it should be. On a related point, findings from the Q
study in chapter 6 could suggest what the potential non-cash payments are. The results
revealed a few factors, such as technical supports, a marketing campaign and other forms of
in-kind payments as needed to increase farmer’s participation. Acknowledging the existing
of these requirements that may change farmers’ behaviours, the government can design a
more responsive policy focusing on factors that may promote behaviour changes.
7.3 Policy Implications
7.3.1 Prerequisite conditions for PES programmes
This section addresses the requirements to develop a PES programme in order to manage
nonpoint source pollution and improve water quality in the Ping river basin. Table 7-2
outlines some specific conditions that are needed to design the PES programme. The first
condition is the geographical boundary of the PES programme which is defined to be the
Ping river basin. The second condition defines the commodity for the PES programme. As
water quality is not traded in a market, the BMPs are used as a service proxy.
The third condition concerns the eligible stakeholders: sellers, buyers and an intermediary.
Sellers are clearly defined as citrus farmers. Buyers include both users and non-users. Users
are those who receive direct benefits from an improvement in in-stream water quality, such
as fisherman, water treatment works and local tourists. On the other hand, non-users are
people who may enjoy non-use values of improved water quality and can make up a
significant portion of the demand for environmental improvement. An example is residents
who do not receive direct benefits from policy changes but notice an improvement in their
surroundings. To designate between users and non-users, it is useful to distinguish the
political jurisdiction concerning an administrative area, and the economic jurisdiction
incorporating all stakeholders who hold economic values for an environmental improvement
(Bateman et al. 2006). Furthermore, policymakers must make sure that buyers are willing to
pay for the additionality of ecosystem services. Otherwise, the government can paly a vital
role as a collective buyer.

178
Table 7-2: Design of PES programme Project: Watershed protection services through the adoption of BMPs Conditions Descriptions 1 Location The Ping river basin, northern Thailand 2 Ecosystem service Water quality
Commodity BMPs (a service proxy, such as soil analysis)
3 Potential sellers Citrus farmers, in particular small – to medium – scale farmers
Potential buyers 1) Beneficiaries, including both users and non-users; or 2) State government
Intermediary 1) At the district level, the local government, such as TAOs*, could be an intermediary
2) At the national level, the government agency such as the PCD could act as an intermediary
3) Roles of catchment partnership should be considered
4 Payment mechanism
Government-based transaction: 1) Funding methods; for example,
- For users, e.g. entrance fee for ecotourism services, or tax from ecotourism business
- For non-users, e.g. charge on household water bill - For a collective buyer, e.g. fuel tax, international donors
2) To induce farmers’ participation, the amount of payment should cover investment cost, annual maintenance cost and opportunity cost of land. The payment schedule must be stated at the enrollment.
3) Other in-kind payments, such as training must be considered
Notes: * TAO is a local government unit in Thailand. It forms the third administrative subdivision level below the district and province.
As both sellers and buyers are scattered along the river, an intermediary is needed to
facilitate the PES programme. An intermediary should also responsible for monitoring
compliance and enforcing conditionality of the PES programme. For a PES development in
the Ping river basin three options are suggested. If transactions occur at the local level, a
local government agency could serve as an intermediary. If transactions occur at the national
level, such as when the government acts as a collective buyer, the state government agency
should be an intermediary. Alternatively, a partnership can be established to bring together
all stakeholders of the Ping river basin so as to understand the needs and impacts associated
with different uses of the river basin and to achieve a sustainable development of PES
programme.
179
The fourth condition determines contract types and payment levels. An intermediary-based
transaction is suggested to control transactions and risks from an implementation of the PES
programme. Sources of payment depend on who are the buyers. For example, if the
government is a buyer, sources of funding may come from the national income such as fuel
tax or international donors. The transfer payment should cover all costs incurred by farmers,
and this payment should include both cash and in-kind payments.
These four conditions are needed for designing a PES programme. Among the four
conditions, perhaps the biggest challenge when it comes to implementing PES programmes
in developing countries is to define the effective demands for ecosystem services (Sakuyama
2006). This is because the difficulty in measuring and valuing the non-use values, and the
low willingness to pay (WTP) from low- to middle-income buyers. However, this issue
could be solved if a government intervenes and acts as either a collective buyer or a main
intermediary to sustain a long-term demand for ecosystem services. The next challenge is
how to create a supply of the services. There are other requirements that are also needed to
make the PES programme works.
7.3.2 Conditioning supply responses
Water quality has a characteristic of CPR, but the provision of a water regulating service is
done through farm land, which is often privately-owned. Therefore, policies are needed to
encourage farmers to provide such service (Kemkes et al. 2010). Behavioural changes are
likely to be successful if policies are tailored to remove farmers’ concerns from the adoption
of new conservation practices. Interventions to promote behavioural changes generally use
informational strategies to change attitudes. To be effective, information provision should be
combined with other strategies, such as rewards and increased ease to perform the target
behaviour (Lucas et al. 2008). The following sections outline some necessary interventions
to motivate small- to medium- scale farmers in the Ping river basin to participate in a PES
programme.

180
7.3.2.1 What to do to start a PES programme
1. A well-defined property right must be established: farmers must approve that
they have the right over farmland. This right could be either landowner right or user
right. This property right is to secure the conditionality of ecosystem service (Cobera
et al. 2009).
2. Additionality and baseline of ecosystem services must be established: to support
their decision-makings, farmers may need to know how changes in their farm
activities positively impact ecosystem services. A modelling, such as an ecological
economic model, can assist an analysis of the supply of ecosystem services from
agriculture. On the other hand, as a PES is a performance-based programme (Antle
2007), a credible estimate of additional flows of environmental benefits is also
useful to build social trust and create demands from prospective buyers.
3. Incentives other then direct cash payment should be considered: the incentives
should be designed to reduce perceived risks in the adoption of new technologies.
Incentives could be in the forms of direct cash payment, technical assistance or in-
kind transfer. For example, a demonstration project is a medium to transfer new
innovation from research to farm. It can improve a rate and extent of technology
transfer by providing examples and facilitating visible accomplishments.
4. Consideration should be given to flexibility in enrolment: a number of farmers
stated that institutional barriers such as contract, regulatory procedures and
environmental regulation deter adoption. Flexibility should be considered for
enrolment options to meet individual needs, such as farmers in remote area.
5. The objectives of BMP adoption must be made clear: the principles and
objectives of BMP adoption must be made clear between sellers, an intermediary
and buyers. This is also related to the condition in which payments will be paid in
exchange for a certain service.

181
7.3.2.2 What to do to sustain a programme
1. Appropriate technology is needed to monitor the compliance with the policy: as
nonpoint source pollution is hard to control and monitor, an alternative is to establish
a proxy for monitoring purpose. Policymakers may set criteria - whether to monitor
output (e.g. amount of N and P loaded into water bodies), or to change agricultural
inputs (e.g. fertiliser reduction), or to change land use (e.g. construction of terracing)
2. Certified quality labels should be promoted amongst consumers: the adoption of
some BMPs may lower fruit quality, such as colour and appearance. The literature
shows that in Thailand there is a potential market for eco-friendly products (Roitner-
Schobesberger et al. 2008; Yiridoe et al. 2005). To gain a marketing advantage,
consumers must be informed about detailed information of label background, such as
production method. Information can be spread through mass media or discussion in a
public forum. A marketing campaign might help to assuage concerns that farmers
have about a market for their BMP products.
3. The clear scientific message should be diffused to farmers: George et al. (2009)
and Wunder et al. (2005) argued that basic knowledge of the linkage between land
use and watershed services is required to sustain an effective implementation of PES
programmes. To increase the effectiveness of communication, a two-way
communication between scientists and farmers is needed, and scientific data must be
diffused to the broadest possible audiences.
4. Intermediary is accountable and its roles must be clearly defined: this is a case
when an intermediary is needed to facilitate a programme.
7.4 Nonpoint Source Pollution Management: What can be learned from the Ping river basin case?
The development of environmental policies in Thailand is different from what has been done
in Western countries. Rather than guided by demands from the general public, the emergence
of pollution management policies in Thailand has increased in response to environmental
conditionality linked to low interest loans from development agencies (Akihisa 2008; Boyle
1998). Thus, the policies are normally top-down initiatives by governments themselves.
When the Enhancement and Conservation of National Environmental Quality Act of 1992
182
was enacted, environmental policies moved toward a more bottom-up approach. Local
authorities are allowed to formulate their own environmental management plans, which must
be approved by the National Environmental Board (NEB) (ONEP 2010; Enhancement and
Conservation of National Environmental Quality Act 1992).
Impaired water quality from farm pollution is a location-specific problem. A decentralisation
of public services may allow agri-environmental policies to be more tailored to local
conditions. However, in Thailand, a reliance on paternalistic authority and bureaucratic
institutions result in a bureaucratic hierarchy. This leaves local authorities little power to
implement and regulate environmental policies. Further, the final decision for implementing
environmental policies is made at the national level (i.e. the NEB), and farmers are often
treated as a passive target. Because farmers are resource managers and they are the main
actors who deliver changes, the lack of farmers’ voices impedes the effectiveness of agri-
environmental policies.
Accordingly, this thesis aims to understand the circumstances within which farmers operate
and how they make choices. It sets this within the context of a potential MBI (PES), which
can lessen the water pollution from farms to some extent. The thesis applied a case of
nonpoint source pollution management in the Ping river basin, and suggested BMPs as
voluntary transactions to manage and control pollution at the farm scale. To investigate a
farmer’s decision-making, this thesis introduced a social psychology theory, i.e. the TPB,
and a psychology research method, i.e. Q-Methodology. Rather than being a stand-alone
alternative to understand behaviour, the psychology theory was used as a complement to a
human rationality embedded in neoclassical economics theory. The findings revealed that
there were many factors affecting farmers’ behaviours. These factors were not limited to
only external factors, such as farm environment, but also included internal factors, such as
perception and attitudes. Policy implications based on these findings must proceed with
cares. Policymakers should bear in mind that samples in this thesis included only small- to
medium- scale farmers. One may argue that policy intervention with large-scale farmers may
have higher impact on the management of water pollution. Howver, large-scale farmers who
deal with higher benefit levels may have different behavioural responses to BMPs. Thus, this
leaves a room for future research.

183
Overall, this thesis contributes to an improvement of our understanding of environmental
policy using methods from the emerging field of Ecological Economics. Ecological
Economics expresses human behaviour in terms of unbounded rationality and uncertainty,
and suggests that an alternative model of human behaviour should include endogenous
preferences and other social contexts to understand individual choices (Gowdy and Erickson
2005; Spash and Hanley 1995). This thesis aligns with a concept central to Ecological
Economics in that it incorporates social psychology theory to explore farmers’ behaviours.
The findings confirmed that sometimes farmers do not make decisions based on a profit
maximisation, and policy recommendations to induce pro-environmental behaviours were
suggested based on incentives other than monetary incentives.
Application of the results and recommended policies should proceed with caution.
Psychology models are specifically designed to generalise behaviour and to predict
aggregate outcomes, and policy changes will not affect farmers equally because farmers are
influenced by various factors (Darnton et al. 2006). Though some constraints are prevailing
in an application of psychology models to explain economic behaviours, an
acknowledgement that behaviours are not solely governed by economic considerations (i.e.
profit maximisation) could improve the effectiveness of agri-environmental policies to
manage farm pollution in Thailand.
As for a direction to develop PES programmes in Thailand, this thesis is useful, in that it
pays particular attention to a supply side of the PES programme by focusing on small- to
medium- scale farmers. The analysis centres on factors and conditions under which farmers
are likely to adopt BMPs. However, there is another aspect to be considered. Future work
should look into the demand side of PES programmes. Key issues to be addressed are who
the buyers are, and the degree to which buyers are willing and able to pay for services. For
the first question, it is necessary to clarify if there is an existing private voluntary demand for
the services, and how this demand be consolidated. Future work may also consider
environmental regulations to create demand, and investigate the role of government to pool
demand and, to some extent, to fund PES programmes.
For the second question, future study can apply a TEV concept to assess the overall
economic value of ecosystem services. Valuation techniques, such as stated preference

184
methods, could be applied to estimate WTP for non-traded environmental goods and
services. Analysis may expand from the standard valuation model by examining WTP in a
behavioural framework through the use of TPB. A few studies (for example: Spash et al.
2009; Bernath and Roschewitz 2008; Luzar and Cosse 1998) showed that TPB is
conceptually consistent with the process of contingent valuation. For example, the TPB
could be used to investigate the motive behind payments by treating WTP as a behavioural
intention, which could be predicted by attitudes toward payments, subjective norms with
respect to payments and perceived behavioural control over payments.
7.5 Limitations and Recommendations for Methodological Improvement
7.5.1 Endogenous determinants in a psychology model
TPB is an extension of a former TRA. To deal with behaviour over which people have
incomplete volitional control, the TPB includes perceived behavioural control as another
independent predictor of intentions (Ajzen and Fishbein 1980). The TPB assumes that
behaviours are predicted by behavioural intentions, and these intentions are predicted by
three cognitive predictors which are attitudes, subjective norms and perceived behavioural
controls. The construct of the TPB postulates that these three cognitive predictors are
conceptually independent (Montoya et al. 2000), and assumes that behavioural intentions are
driven only by internal psychological constructs, while external variables are considered to
influence intentions and behaviours through psychological predictors (Burton 2004; Conner
et al. 2000; Ajzen and Fishbein 1980).
With these underlying assumptions, the main limitation of the TPB model lies in its mediator
and moderator effects19
19 A moderator is a variable affecting the direction and/or strength of the relationship between an
independent variable and a dependent variable. A mediator is a variable explaining the relationship between external physical event and internal psychological significance.
(Baron and Kenny 1986). Hence, it is unlikely to avoid the problem
of endogeneity when conducting a statistical analysis. For example, Lam (1999) found that
the three internal predictors may have mutual mediating effects to each other; Yzer et al.
(2004) found that other external predictors may relate to internal predictors; and Hagger et
185
al. (2002) found that a moderating effect could influence a relationship between intentions
and behaviours.
7.5.2 Generalisation of the adoption model
The question is how meaningful an adoption model will be if it is derived from one context
and applied in a different one. A generalisation of the TPB results to other environments
must be made with caution because the factors for intentions may be different. There are two
issues that should be taken into account when making a generalisation. First, the Ping river
basin is a notable source of water in northern Thailand, and thus farmers may be more
inclined to support BMP programmes perceived to benefit them. Second, it should be noted
that during their interviews, farmers were instructed to make decisions under the predefined
condition termed as TACT. As such, there is a possibility that farmers’ decisions are
bounded by this condition. A generalisation of the results is possible if the study is applied to
closely related behaviours, or if there is a ‘fit’ in attributes of the samples and treatments
between cases. For example, there is a wide range of attributes commonly shared between
the samples.
7.5.3 The incorporation of cost in the model
The adoption model described in this thesis is a first step to understand attitude-behaviour
relationships in BMP uptake. Though cost is one factor that influences adoption of new
technologies, it is not incorporated in the adoption model for two main reasons. First, BMPs
in this thesis are considered in the context of PES. The underlying principle of PES is that
costs incurred by farmers are covered by transfer payments from beneficiaries. As such,
costs are not involved in an economic decision. Second, the main aim of this thesis is to
explain a change in behaviour and how this change can be affected. In this sense, a
psychology model is suitable to investigate economic behaviour.
It has been recognised that costs in monetary form could not be incorporated into the
psychological-based adoption model because the underlying principles of the psychology
and economic theories are different (Pieters 1989). An alternative to investigate the effect of
cost in behavioural change is to include a cost-evaluation statement in a questionnaire
(Pieters 1989). For example, ‘I can easily afford to pay for any BMP measure’. This belief

186
statement reflects the costs incurred by farmers, and it indicates whether the farmers like or
dislike the outcome as a consequence of behavioural change. This was done in this thesis.
Further, a benefit-evaluation statement was also included in a questionnaire (Annex 5). In
other words, this thesis offers an evaluation of subjective costs and benefits, rather than
investigating the actual costs and benefits involved the BMP implementation.
However, the incorporation of cost into the adoption model is an important step in the
attempt to accurately predict adoption behaviours. Future study could look for another
possible mechanism that would allow costs to be incorporated into the adoption model. To
do this, it is necessary to apply a stated preference survey method, such as the contingent
valuation, to capture farmers’ preferences toward costs. There is also an important
assumption that farmers will adopt BMPs if they receive an amount of money in return. In
other words, willingness to accept (WTA) is used to represent changes in the expenditure
level of the farmers in response to changes in the level of ecosystem services provided.
Applicability of the TPB in a contingent valuation could be done by replacing behavioural
intentions with WTA (Pouta and Rekola 2001), and farmers may be further asked to bid on
financial assistance. In this way, WTA will be predicted by attitudes, subjective norms, and
perceived behavioural controls. This WTA will improve the understanding of the payment
level that farmers are willing to adopt a certain BMP.
7.5.4 The applicability of Q results
Q-Methodology is a research method tailored for an in-depth investigation. Two main
limitations in the use of Q-Methodology are: i) a generalisation of Q results is limited; and ii)
an explanation that particular characteristics in one discourse will be consistently defining
variables is unlikely20
. This is because the sample size is small, and it is not randomly
selected. For the generalisation, one may increase the size of sample. But, this only increases
costs for no purpose because a well-selected sample is adequate to define salient attitudes.
For the explanation beyond current findings in the Q study, Danielson (2007) suggested
three techniques to overcome this problem.
20 For example, though 8 out of 10 participants, who loaded on discourse A, were downstream
farmers. It is not right to conclude that discourse A were represented by downstream farmers, as there are also downstream farmers in other discourses.

187
The first technique is a scale creation. To do this, one high-ranked statement and one low-
ranked statement are selected from each discourse. These statements will be randomly
presented in the form of psychometric scales (i.e. 5-point likert scale) to former participants.
The scores given by participants will be multiplied by the z-score of corresponding
statements, and then summed up. These scores will be normalised by converting to T-scores.
This technique allows an explanation based on the participants’ demographics. For example,
Brown (2002) used this technique and was able to draw a general conclusion that perspective
D is strongly represented among women21
.
The second technique is a profile correlation. All distinguishing statements from the Q
analysis will be presented in the form of likert scales to randomly selected participants.
Then, a Spearman correlation is used to compute the correlation between each participant’s
scores and the ranking of those statements in each discourse. The explanation of the
discourse is based on the correlation-based scales. Danielson (2007) used this technique and
found that; for example, household size and income were not related to the discourses,
discourse H was likely to be participants with high levels of education22
.
The third technique is a narrative evaluation. Statements that were highly loaded on each
discourse will be summarised and written in a short description, and then presented to the
former participants. Participants are asked a few questions on how much they agree with the
narrative summarisation. An explanation is based on the final score that participants adhere
to each discourse. Danielson (2007) used this technique and concluded that socio-
demographic variables were sporadically related to agreement with the discourse23
21 A study of Americans’ views of the Clinton-Lewinsky affair. Discourse A was labelled as
‘Kenneth Starr’, discourse B was ‘Moderates’, discourse C was ‘Clinton defenders’, and discourse D was ‘Opaque’.
. Future
study may consider applying these three techniques so as to enable researchers to match
participants to each discourse. Hence, an explanation can be made based on a prevalence of
statements among the participants and relationship to other variables.
22 A study of public views toward wildfire management among Sydney residents. Four discourses
were: F) Traditionalists; G) Responsible residents; H) Expert authorities; and I) Green democrats. 23 A study of public views toward wildfire management in New Jersey. Five discourses were: A)
Responsible managers; B) Community planners; C) Populists; D) Accountable citizens; and E) Scientific environmentalists

188
7.6 Recommendations for Future Research: BMP Uptake within a Cost-Benefit Framework
The results from the behavioural studies gave evidence about potential human behaviours
and their responses to BMP adoption. To be more specifically, the results presented who the
potential BMP adopters are and why they adopt BMPs. Perrot-Maître (2006) suggested that
understanding farmer’ s choices and constraints offer a sustainable development rather than a
short-term contract. However, only an understanding in the individual preference may not be
enough for the effective policy. A technical aspect must be included when making policy for
the management of water pollution. This aspect concerns with the understanding of how
management practices affect ecosystem and the services provided. In other words, it is
necessary to understand the effectiveness of BMPs in pollution control and how changes in
policy affect the ecological production function of ecosystem. To do this, economists must
work with ecologists and other natural scientists in order to integrate knowledge to do justice
to the underlying bio-physical and socioeconomic complexities involved in the provision of
ecosystem services (Figure 7-6) (Polasky 2008).
Figure 7-6: Impact pathway of policy change Source: adapted from Defra (2007)
According to OECD (2010), two major evaluations widely used in the policy development
process are ex-ante and ex-post evaluations. For a development of new policy, an ex-ante
evaluation can provide information on whether this policy is economically profitable. Ex-
ante assessments are based on a combination between economic and environmental models
to evaluate economic responses to the proposed policy. However, ecosystem services have
complex interactions within and between ecosystems from local to global scales.
Furthermore, the characteristics and nature of nonpoint source pollution bring difficulties in
the impact assessment. Firstly, accurate forecasts of environmental impacts may not be
possible because farm discharge is stochastic and emissions cannot be directly measured.
Secondly, the effectiveness of adopted practices is uncertain, especially in long term. Finally,

189
identifying sources of water pollution is difficult as polluters could be both point and
nonpoint sources. Accordingly, current research in the domain of Ecological Economics
either conducts a field experiment (for example: Poudel et al. 2010; Deasy et al. 2009;
Vinten et al. 2006) or applies a simulation model (for example: Yang et al. 2009; Daily and
Matson, 2008; Vinten et al. 2008; Volk et al. 2008) to capture these complexities (i.e. to
understand the impacts of pollution loads from farms, the delivery of pollution loads to
watercourses). The field study is superior in its capability to reflect natural climatic variation.
However, a simulation model is more useful in assessing long-term watershed-level BMP
effects because the field study can monitor only at a particular site and period of time (Veith
2002).
As an illustration, the behavioural studies in this thesis revealed that the most preferred BMP
amongst farmers was the soil analysis, which focuses on the reduction of fertiliser
application. Policymakers may want to understand how the adoption of this BMP could lead
to changes in water quality. It is recommended that an experiment should be done at the
fields or an adoption of simulation model, such as the Material Flow Analysis (MFA)
(Brunner and Rechberger 2004) may be useful to assess ecosystem services in bio-physical
terms by quantifying the impacts of reduction fertiliser application rates on water quality.
MFA is a tool to investigate the flows and stocks of a material-based system defined in the
space and time. It can present flows and stocks of the system in a more transparent way and
assess the relevant flows and stocks in quantifiable terms (Baccini and Brunner 1991). For
example, a previous study by Schaffner (2007) applied MFA to simulate nutrient loads in the
Thachin river basin in central Thailand. The basic model approach from her study can be
transferred to the Ping river basin provided the parametre sets are adjusted to match with the
regional differences.
Once the potential impacts of policy options on ecosystem services are identified, this needs
to revert back to an economic valuation (Figure 7-6). Economic valuation refers to a process
of monetisation of changes in environmental impacts as a result of a new policy (Pearce and
Seccombe-Hett 2000). The economic and water quality impacts of agricultural BMPs at
watershed scale in Thailand are poorly understood. To assess the economic and water quality
impacts, an integrated framework is required. Consider Figure 7-6, an introduction of
environmental policy induces changes in the reduction of pollution emission and improved
water quality, and this quality improvement affects human welfare. This suggests that a

190
water quality modelling, designed for tracing pollutants loaded into river, can serve as the
basis for an economic analysis, such as CBA. In other words, results from the model can
provide essential information to evaluate the potential of achieving water quality
improvement through reducing farm pollution.
Water quality provides two broad classes of economic benefits which are withdrawal and in-
stream benefits (Bingham et al. 2000). Withdrawal benefits include abstraction benefits for
municipal water supply and domestic use, agricultural irrigation and livestock watering, and
industry process. In-stream benefits include use and non-use benefits. In-stream use benefits
are defined as benefits associated with direct human interaction with water in the river, such
as swimming and boatable benefits; and aesthetic value of water quality, such as stream side
property owners. In-stream non-use benefits are values accruing to individuals regardless of
whether or not they have direct interaction with water. These are stewardship value, altruistic
value, bequest value, and existence value24
.
To date, numerous economic valuation methods have been used to assign quantitative
monetary values to environmental goods and services. Most of the literature has analysed
human welfare changes within the framework of TEV (Hussain et al. 2010; Richardson and
Loomis 2009; Moran and Dann 2008; Menegaki et al. 2007). Valuation techniques which are
direct or stated preference, and indirect or revealed preference are applied to measure
welfare changes in terms of WTP or WTA due to policy intervention (Pearce et al. 2006).
For example, stated preference methods involve questioning survey respondents to determine
their consumer surplus, whereas revealed preference methods use data from consumer
market behaviour to estimate economic values. Alternatively, when limited time or funding
precludes costly data collection and the development of new consumer surplus estimates, the
method of benefit transfer (BT) can be used to tailor pre-existing consumer surplus estimates
to fit new policy situations (Pearce et al. 2006; Boyle and Bergstrom 1992; Desvousges et al.
1992).
24 A stewardship value is a belief that humans are responsible for maintaining the level of water
quality though there is no withdrawal or in-stream use benefit. Altruistic value is the enjoyment people gain from knowing that the others enjoy use values. Bequest value is a benefit from ensuring that environmental goods are preserved for the future. Existence value represents enjoyment people perceive from knowing that some level of environmental quality exists.

191
With BT application, benefit estimates from existing direct or indirect valuation case studies,
or study sites, are spatially and temporally transferred to a new case study, or policy site.
There are four types of BT approaches, which are benefit estimate transfer (Boyle and
Bergstrom 1992), benefit function transfer (Kirchhoff et al. 1997), meta-analysis (Bergstrom
and Taylor 2006; Smith and Pattanayak 2002), and preference calibration (Pattanayak et al.
2007). Benefit estimate transfer is the simplest method, where economic value on a per-unit
basis is taken from study site(s) to a policy site. The function transfer relates an individual’s
willingness to pay to a set of individual and site characteristics. Characteristics from the
policy site are substituted into the model from the study site to tailor benefit estimates for the
policy site. In the meta-analysis, WTP benefit estimates from numerous similar study site(s)
serve as the dependent variable in regression analysis, and characteristics of the study site(s),
such as water quality serve as the independent variables. BT in the context of preference
calibration simply means using the estimates from multiple methods to establish numerical
values for parameters that shape a specified preference function (i.e. an indirect utility
function) for the policy site. Preference calibration was developed to avoid double counting
of benefits by conducting transfer in a manner explicitly consistent with utility theory (Smith
et al. 2002).
In terms of transferability of BT values there is a particular concern about transfer of values
from developed countries to developing countries. It is preferable to transfer benefits from a
study site located close to a policy site as the socio-economic characteristics and cultural
factors between two sites could be comparable (Ready and Navrud 2006; Krupnick 1993).
However, the valuation of water quality improvement has been largely conducted in
developed countries. Therefore, it is inevitable that BT involves transfer of a benefit estimate
from high-income countries to low-income countries. Given that users between two sites
have identical underlying preferences towards ecological services and WTP represents
willingness to pay for an improvement of environmental goods and services in country (i)
and time (t), Pattanayak et al. (2002) suggested the use of a conversion index to reflect the
relevant change in value across time and space. Further, empirical studies also reveal the
validity of international BT, provided the adjusted value transfer is used (Ready and Navrud
2006; Brouwer 2000; Bergstrom and De Civita 1999; Kirchhoff et al. 1997; Chestnut et al.
1997; Alberini et al. 1997).

192
Another caveat to BT relates to the superiority of benefit function transfer relative to unit
transfer. A number of studies have performed statistical convergent validity tests and value
surface tests on BT values derived from both unit and function transfer approaches (Muthke
and Holm-Mueller 2004; Barton 2002; Loomis et al. 1995). A major implication of these
tests is that the degree of accuracy of BT value depends on how the results will be used
(Bergstrom and De Civita 1999). The minimum degree of accuracy necessary is related to
policy context such as policy goal and objective (Ready et al. 2004), and the cost of making
a wrong decision based on the results of the BT (Filion et al. 2002) (Figure 7-7). In other
words, when applying a BT study a trade-off must be made amongst the increased cost and
delay associated with the new study, the reliability of results from a primary study (i.e.
Contingent Valuation Method), and the expected loss related to making an incorrect
decision. For example, Figure 7-7 shows that using BT to demonstrate how valuation can be
used in an environmental assessment would require a middle level of accuracy, whereas a
valuation of extremely scarce environmental attributes such as endangered species requires a
primary study as the cost of making wrong decision may be high.
Figure 7-7: Continuum of accuracy for BT analysis Source: Filion et al. (2002)
To define prospective beneficiaries from policy changes, the conceptual framework of
ecosystem services proposed by Millennium Ecosystem Assessment (2005) (Figure 7-8)
offers a link to taking an economic valuation. For example, one of the most important
services of an agricultural field is the natural purification of water (Swinton et al. 2007). An
improper use of agricultural land threatens the existence of regulating and supporting
ecosystem services (i.e. excessive uses of fertiliser in farm may affect the bioremediation of
waste through dilution and oxidation process, and impair water quality) (Ruhl 2008). The
adoption of BMP, such as reduction in fertiliser uses, results in improved water quality. A
clear and well-defined link between ecosystem services and human-wellbeing can help avoid
the problem of double counting of benefits because only the final services (i.e. benefits to
human) are taken into the decision process (i.e. CBA) (Smith 2006).

193
Figure 7-8: From ecosystem processes and final services to economic goods
Source: adapted from Bateman et al. (2010)
On a related issue, Kemkes et al. (2010) argue that an understanding of the spatial
distribution of ecosystem services is the key to identify potential beneficiaries. Spatial
distribution defines the directional flow of the service and its geographical extent to which
benefits accrue. In terms of water quality supply, the spatial distribution is known to be a
benefit accruing downstream at a regional watershed scale (Costanza 2008). The
quantification of impacts based on the conceptual framework of ecosystem services and
spatial scale allows to systematically defining the groups of beneficiary being affected by
changes in policies (and ecosystem services as a consequence).
Bateman et al. (2006) differentiated two broad types of potential beneficiary: users and non-
users. Users will hold use and option-use values and may hold non-use values, while non-
users may hold option and non-use values. One of the contested issues is that users and non-
users may hold different preferences towards a site; therefore, they may have a different

194
WTP value. For example, users may hold higher WTP values than non-users regarding
experiences with the site. On the other hand, there may be a cultural identity attached to the
site and non-users express their higher non-use values (Hanley et al. 2003). Further
discussion focuses on the issues such as: How to divide between users and non-users? and
How many of them will benefit? Though it is complex to quantify the number of non-users
benefiting from a policy change, it is necessary to estimate aggregate benefits based on a
per-person benefit from both user types (Hanley et al. 2003). Furthermore, aggregate benefits
should be considered by taking into account the conceptual framework of ecosystem services
and a spatial distribution of ecosystem services. This makes it easier to consider the
distributional impacts of the policy, and the benefit distribution could further suggest who
should pay for the project and how much (Jenkins 1999).
The economic efficiency of any new policy must be evaluated based on both positive and
negative aspects. In the context of water quality, cost estimates for achieving a given
reduction in pollutant inputs or of achieving target pollutant concentration in receiving
waters, must be considered. In general, cost assessment is straightforward and can be
determined by placing economic values on the amount of resources required to plan,
implement, and complete a programme. Pearce et al. (2006) suggested that costs simply
mean environmental losses or damages done by a project, and the sum of compliance and
regulatory costs. Provided that all relevant economic values are taken into account, these
values should be included in a CBA. To conduct a CBA, the Asian Development Bank
(ADB 1999) suggested that the with project situation (i.e. with the BMP adoption) should be
compared with the without project situation (i.e. current farming practices).
To make a comparison, CBA is a welfare-theoretical method to evaluate net social benefits
of project, programme, or policy. The advantages of CBA are that it defines gainers and
losers in spatial and temporal dimensions, and can supplement scientific and technical
information with economic information that may help decision makers (Pearce et al. 2006).
CBA has been used to inform policy decision-making; for example, the net positive benefit
suggests that a project is viable and worthwhile. In the light of CBA, it is also important to
conduct a sensitivity analysis (SA). SA indicates how the CBA outcome of a project reacts to
changes in crucial input variables. The crudest approach is to increase or decrease gross costs
and benefits (Vaughan et al. 2000). A particular attention is to the investigation of cost
variation as past experience suggested that cost can be seriously understated (Pearce et al.
195
2006). Besides the uncertainties in net benefits, Just et al. (2004) argued that a choice of
discount rate may contribute to a substantial difference in CBA outcome, and SA should
examine the net benefits under the range of plausible discount rates rather than relying on a
single rate.
CBA can benefit from the input of a water quality model. Eisen-Hecht and Kramer (2002)
agree that a simulation model allows for a more reliable prediction whether the proposed
management activity would be effective in achieving its goal. A model also gives flexibility
to compare costs and benefits for different management scenarios. In additional, the
integration of economic valuation and ecosystem services could contribute to policy
decisions, for at least in five domains (Fisher et al. 2008). Firstly, results have been passed to
relevant agencies. Secondly, results have been presented to intermediaries who are able to
facilitate a PES programme. Thirdly, CBA is the first step to gain interests from
policymakers. Fourthly, results have been used for a policy debate. Finally, CBA is a major
stimulus for the launch of many conservation programmes and this is the greatest influence
on the policy process.
Agricultural land has long been perceived to supply ecosystem services, such as water
purification (Ruhl 2008) (see for example: the Catskill watershed case in USA and the Vittel
company in France (Rollett et al. 2008)). Farmers’ management decisions both affect and are
affected by the biophysical and economic settings in which they operate, while land-use
management influences supply of ecosystem services (Foley et al. 2005). In a development
of PES programme, it is necessary to explicitly define how land-use management could
contribute to ecosystem service provision. As long as changed land management practice
continues to be the mechanism on which transfer payments are based, the knowledge of how
new management practices affect environmental outcomes is needed to confirm that the
potential positive impacts from adoption could occur.
Under the concept of Ecological Economics, natural and social capitals become the limiting
factors in economy growth (Costanza 2009a; Costanza 2009b). Thus, ecological processes
should be taken into account before conducting a valuation exercise. This is a first step to
address ecological sustainability in a rigorous way in environmental policy assessments. An
integration of ecology and economics in a valuation of ecosystem services improves

196
understanding in an additionality of new farming practices. This additionality is used as an
indicator offering a link to the estimate of economic benefits, thereby improving decision
making by clarly illustrating both bio-physical and economic consequences of policy options
(Iovanna and Newbold 2007). It is also recommended that policy should be simple enough to
be implemented yet sophisticated enough to do justice to the underlying bio-physical and
economics complexities involved (Polasky 2008).
To sunmmarise, the ultimate aim of this study was to make policy recommendations in the
development of PES programme in Thailand. PES is a new paradigm of conditional
conservation potentially addressing the management of diffuse water pollution from
agriculture. In this study, a suit of BMPs was proposed as tradable services in a PES
programme, and psychological principles were used to examine factors and beliefs
underlying intentions to adopt BMPs. From a policy perspective, the study to identify key
cognitive factors influencing adoptions is important as long as diffuse water pollution is one
of primary environmental concerns.
However, there are at least two main limitations that need to be acknowledged regarding the
present study. The first limitation concerns the employed methodologies, such as the
generalisation of the adoption model and the applicability of the results. The second
limitation is a lack of technical aspects of BMPs in particular on the role of bio-physical
model in an estimation of BMP effectiveness. These limitations were crucially addressed and
recommendations for future research were also discussed. It appears clearly from the study
that BMP is a potential tool for water conservation in Thailand. Lessons learned from this
study suggested that future research should focus on a combination of behavioural study,
economic valuation, and integrated model in order to provide insights into sustainable and
welfare-optimising resource magagement and policy.

197
REFERENCES ADB (1999) Handbook for the economic analysis of water supply projects. Manila: Asian
Development Bank. Adesina, A. A. & Chianu, J. (2002) "Determinants of farmers' adoption and adaptation of alley
farming technology in Nigeria", Agroforestry Systems, vol. 55, no. 2, pp. 99-112. Afari-Sefa, V., Yiridoe, E. K., Gordon, R., & Hebb, D. (2008) "Decision considerations and cost
analysis of beneficial management practice implementation in Thomas Brook watershed, Nova Scotia", Journal of International Farm Management, vol. 4, no. 3, pp. 1-32.
Agrawal, G. D. (1999) "Diffuse agricultural water pollution in India", Water Science and Technology, vol. 39, no. 3, pp. 33-47.
Ajzen, I. & Fishbein, M. (1980) Understanding attitudes and predicting social behaviour. New Jersey: Prentice Hall.
Ajzen, I. (1991) "The theory of planned behavior", Organizational Behavior and Human Decision Processes, vol. 50, no. 2, pp. 179-211.
Ajzen, I. (2006) Constructing a TPB questionnaire: conceptual and methodological considerations [Online]. Available at: http://socgeo.ruhosting.nl/html/files/spatbeh/tpb.measurement.pdf
Akihisa, M. (2008) "Environmental soft loan program in Asian countries: industrial pollution control or mal-use of foreign aid resources?", Journal of Cleaner Production, vol. 16, no. 5, pp. 612-621.
. (Accessed: 23 April 2007).
Alberini, A., Cropper, M., Fu, T., Krupnick, A. J., Liu, J., Shaw, D., & Harrington, W. (1997) "Valuing health effects of air pollution in developing countries: the case of Taiwan", Journal of Environmental Economics and Management, vol. 34, no. 2, pp. 107-126.
Aldrich, G. A., Grimsrud, K. M., Thacher, J. A., & Kotchen, M. J. (2007) "Relating environmental attitudes and contingent values: how robust are methods for identifying preference heterogeneity?", Environmental and Resource Economics, vol. 37, no. 4, pp. 757-775.
Aldridge, A. (2005) The Market. Cambridge: Polity Press. Andreoni, J. (1990) "Impure altruism and donations to public goods: a theory of warm-glow giving",
The Economic Journal, vol. 100, no. 401, pp. 464-477. Antle, J. M. (2007) ‘Payments for ecosystem services and U.S. farm policy’, The American Enterprise
Institute [Online]. Available at: www.aei.org/dicLib/20070515_antlefinal.pdf (Accessed: 24 February 2010).
Asafu-Adjaye, J. (2005) Environmental Economics for Non-Economists: Techniques and Policies for Sustainable Development. 2nd edn. Singapore: World Scientific Publishing.
Asquith, N. M., Vargas, M. T., & Wunder, S. (2008) "Selling two environmental services: in-kind payments for bird habitat and watershed protection in Los Negros, Bolivia", Ecological Economics, vol. 65, no. 4, pp. 675-684.
Austin, D. (1999) Economic Instruments for Pollution Control and Prevention - A Brief Overview Washington, D.C.: World Resources Institute.
Axelrod, J. N. (1968) "Attitude measures that predict purchase", Journal of Advertising Research, vol. 8, no. 1, pp. 3-17.
BAAC (2010) Interest rate. Bank of Agriculture and Agricultural Cooperatives. Available at: www.baac.or.th (Accessed: 6 February 2010).
Baccini, P. & Brunner, P. H. (1991) Metabolism of the Anthroposphere. New York: Springer. Bank of Thailand (2010a) Historical Bangkok interbank offered rate (BIBOR). Bank of Thailand.
Available at: http://www.bot.or.th (Accessed: 6 February 2010). Bank of Thailand (2010b) Historical Foreign Exchange Rates. Bank of Thailand. Available at:
www.bot.or.th (Accessed: 9 January 2010).

198
Barde, J.-P. (1994) Economic instruments in environmental policy: lessons from the OECD experience and their relevance to developing economies. Working paper No. 92, OCDE/GD (93)19, produced as part of the research programme on Environmental Management in developing countries. Paris: Organization of Economic Cooperation and Development.
Barker, M. & Swift, J. A. (2009) "Workshop on changing nutrition behaviour to improve maternal and fetal health: The application of psychological theory to nutrition behaviour change", Proceedings of the Nutrition Society, vol. 68, no. 2, pp. 205-209.
Barnes, A., Toma, L., Hall, C., & Willock, J. (2007) Implementing the action programme for nitrate vulnerable zones in Scotland: farming practices and awareness. Edinburgh: The Scottish Government.
Baron, R. M. & Kenny, D. A. (1986) "The moderator-mediator variable distinction in social psychological research: conceptual, strategic, and statistical considerations", Journal of Personality and Social Psychology, vol. 51, no. 6, pp. 1173-1182.
Barry, J. & Proops, J. (2000) Citizenship, Sustainability and Environmental Research. Cheltenham; Massachusetts: Edward Elgar.
Bartlett, J. E., Kotrlik, J. W., & Higgins, C. C. (2001) "Organizational research: determining appropriate sample size in survey research", Information Technology, Learning and Performance Journal, vol. 19, no. 1, pp. 43-50.
Barton, D. N. (2002) "The transferability of benefit transfer: contingent valuation of water quality improvements in Costa Rica", Ecological Economics, vol. 42, no. 1-2, pp. 147-164.
Bateman, I. J., Day, B. H., Georgiou, S., & Lake, I. (2006) "The aggregation of environmental benefit values: welfare measures, distance decay and total WTP", Ecological Economics, vol. 60, no. 2, pp. 450-460.
Bateman, I., Mace, G., Fezzi, C., Barbier, E., & Turner, K. (2010) "Economic Methodology," in I. Bateman & A. Sen (eds.) UK National Ecosystem Assessment (NEA). Economic Analysis for the NEA. School of Environmental Sciences, University of East Anglia, Norwich, pp. 3-48.
Beedell, J. & Rehman, T. (2000) "Using social-psychology models to understand farmer's conservation behaviour", Journal of Rural Studies, vol. 16, no. 1, pp. 117-127.
Begg, D., Fischer, S., & Dornbusch, R. (2003) Economics. 7th edn. London: McGraw-Hill. Bendoricchio, G., Calligaro, L., & Carrer, G. M. (1999) "Consequences of diffuse pollution on the
water quality of rivers in the watershed of the lagoon of Venice (Italy)", Water Science and Technology, vol. 39, no. 3, pp. 113-120.
Bergstrom, J. C. & De Civita, P. (1999) "Status of benefits transfer in the United States and Canada: a review", Canadian Journal of Agricultural Economics, vol. 47, no. 1, pp. 79-87.
Bergstrom, J. C. & Taylor, L. O. (2006) "Using meta-analysis for benefit transfer: theory and practice", Ecological Economics, vol. 60, no. 2, pp. 351-360.
Bernath, K. & Roschewitz, A. (2008) "Recreational benefits of urban forests: explaining visitors' willingness to pay in the context of the Theory of Planned Behavior", Journal of Environmetnal Management, vol. 89, no. 3, pp. 155-166.
Bignebat, C., Koc, A., & Lemeilleur, S. (2009) "Linking small producers to supermarkets? The role of intermediaries on the fresh fruit and vegetable market in Turkey", EAAE-IAAE Seminar 'Small Farms: Decline or persistence'. 26-27 June 2009. Canterbury, UK.
Bingham, T. H., Bondelid, T. R., Depro, B. M., Figueroa, R. C., Hauber, A. B., Unger, S. J., & van Houtven, G. L. (2000) A benefits assessment of water pollution control programs since 1972: part 1, the benefits of point source controls for conventional pollutants in rivers and streams. Final report, project No. 68-C6-0021 6600-4. Washington, D.C.: US Environmental Protection Agency.
Bishop, J., Kapila, S., Hicks, F., & Mitchell, P. (2006) Building biodiversity business: report of a scoping study. Discussion draft. Gland: The International Union for the Conservation of Nature and Natural Resources.
Bland, J. M. & Altman, D. G. (2000) "Statistics notes: the odds ratio", British Medical Journal, vol. 320, p. 1468.
Boadway, R. W. & Bruce, N. (1984) Welfare Economics. Oxford: Basil Blackwell.
199
Borin, M., Vianello, M., Morari, F., & Zanin, G. (2005) "Effectiveness of buffer strips in removing pollutants in runoff from a cultivated field in North-East Italy", Agriculture, Ecosystems and Environment, vol. 105, no. 1-2, pp. 101-114.
Bosch, D. J. & Pease, J. W. (2000) "Economic risk and water quality protection in agriculture", Review of Agricultural Economics, vol. 22, no. 2, pp. 438-463.
Boyle, J. (1998) "Cultural influences on implementing environmental impact assessment: insights from Thailand, Indonesia, and Malaysia", Environmental Impact Assessment Review, vol. 18, no. 2, pp. 95-116.
Boyle, K. J. & Bergstrom, J. C. (1992) "Benefit transfer studies: myths, pragmatism, and idealism", Water Resources Research, vol. 28, no. 3, pp. 657-663.
Brodt, S., Klonsky, K., & Tourte, L. (2006) "Farmer goals and management styles: implications for advancing biologically based agriculture", Agricultural Systems, vol. 89, no. 1, pp. 90-105.
Brodt, S., Klonsky, K., Tourte, L., Duncan, R., Hendricks, L., Ohmart, C., & Verdegaal, P. (2004) "Influence of farm management style on adoption of biologically integrated farming practices in California.", Renewable Agriculture and Food Systems., vol. 19, no. 4, pp. 237-247.
Bromley, D. W. (1992) "The commons, common property, and environmental policy", Environmental and Resource Economics, vol. 2, no. 1, pp. 1-17.
Bromley, D. W. (2007) "Environmental regulations and the problem of sustainability: Moving beyond "market failure", Ecological Economics, vol. 63, no. 4, pp. 676-683.
Bromley, D.W. & Hodge, I. (1990) "Private property rights and presumptive policy entitlements: reconsidering the premises of rural policy", European Review of Agricultural Economic, vol. 17, no. 2, pp. 197-214.
Bromley, D.W. (1991) Environment and Economy: Property Rights and Public Policy. Oxford: Oxford University Press.
Brookfield, H. & Gyasi, E. A. (2009) "Academics among farmers: Linking intervention to research", Geoforum, vol. 40, no. 2, pp. 217-227.
Brouwer, R. (2000) "Environmental value transfer: state of the art and future prospects", Ecological Economics, vol. 32, no. 1, pp. 137-152.
Brown, L., Boone, K., Noke, S., & Ward, A. (2007) Agricultural best management practices. Ohio State University Extension Fact Sheet. AEX-464-91. Ohio: Ohio State University.
Brown, S. R. & Wattanakul, S. (2008) "Professional and policy perspectives on avian influenza within an epistemic Community", The International Society for the Scientific Study of Subjectivity and McMaster University. 24th Annual Q Conference Abstract. 2-4 October 2008. Ontario, Canada. Available at: http://www.qmethod.org/qconference/current/conferenceabstract.php#44 (Accessed: 19 January 2009).
Brown, S. R. (1980) Political Subjectivity: Applications of Q Methodology in Political Science. New Haven: Yale University Press.
Brown, S. R. (1991) A Q methodological tutorial. Kent State University. Available at: http://facstaff.uww.edu/cottlec/QArchive/Primer1.html (Accessed: 28 March 2007).
Brown, S. R. (2002) "Q technique and questionnaires", Operant Subjectivity, vol. 25, no. 2, pp. 117-126.
Brown, S. R., Durning, D. W., & Selden, S. C. (2008) "Q Methodology," in G. J. Miller & K. Yang, (eds.) Handbook of Research Methods in Public Administration. 2nd edn. vol. 134. New York: CRC Press, pp. 721-764.
Brunner, P. H. & Rechberger, H. (2004) Practical Handbook of Material Flow Analysis. Florida: CRC Press.
Brunso, K., Fjord, T. A., & Grunert, K. G. (2002) Consumers' food choice and quality perception. Working paper no. 77. Aarhus: The Aarhus School of Business, Arrhus University.
Bulte, E., Gerking, S., List, J. A., & de Zeeuw, A. (2005) "The effect of varying the causes of environmental problems on stated values: evidence from a field study", Journal of Environmental Economics and Management, vol. 49, no. 2, pp. 330-342.

200
Burton, R. (2004) "Reconceptualising the 'behavioural approach' in agricultural studies: a socio-psychological perspective", Journal of Rural Studies, vol. 20, pp. 359-371.
Callan, S. J. & Thomas, J. M. (2000) Environmental Economics and Management: Theory, Policy, and Applications. 2nd edn. London: Fort Worth.
Campbell, N., D'Arcy, B., Frost, A., Novotny, V., & Sansom, A. (2004) Diffuse Pollution: An Introduction to the Problems and Solutions. London: IWA Publishing.
Carlsson, F., Frykblom, P., & Lagerkvist, C. J. (2005) "Using cheap talk as a test of validity in choice experiments", Economics Letters, vol. 89, no. 2, pp. 147-152.
Carman, D. (2005) Terraces. SERA-17. Virginia Polytechnic Institute and State Univeristy Available at:
Carpenter, S. R. (1998) "Sustainability and common-pool resources: alternatives to tragedy", Society for Philosophy and Technology, vol. 3, no. 4, pp. 36-57.
www.sera17.ext.vt.edu/Documents/BMP_Terraces.pdf (Accessed: 9 August 2010).
Cary, J. W. & Wilkinson, R. L. (1997) "Perceived profitability and farmers' conservation behaviour", Journal of Agricultural Economics, vol. 48, no. 1-3, pp. 13-21.
Cary, J. W., Webb, T. J., & Barr, N. F. (2001) The Adoption of Sustainable Practices: Some New Insights. An Analysis of Drivers and Constraints for the Adoption of Sustainable Practices Derived from Research. Canberra: Bureau of Rural Sciences.
Centner, T. J., Houston, J. E., Keeler, A. G., & Fuchs, C. (1999) "The adoption of best management practices to reduce agricultural water contamination", Limnologica, vol. 29, no. 3, pp. 366-373.
Chagrin River Watershed Partners (2006) Why riparian setbacks? The Chagrin River Watershed Partners. Available at:
Chaisamrej, R. & Zimmerman, R. (2007) "Integrating the theory of planned behaviour, altruism, and self-construal to predict paper recycling behavior in individualistic and collectivistic societies: implications for communication campaign design", The Annual Meeting of the International Communication Association, TBA, San Francisco, California, USA 23 May 2007. Available at:
www.crwp.org (Accessed: 9 November 2007).
http://www.allacademic.com/meta/p_mla_apa_research_citation/1/7/0/8/0/p170802_index.html (Accessed: 2 September 2009).
Chestnut, L., Ostro, B., & Vicit-Vadakan, N. (1997) "Transferability of air pollution control health benefits estimates form the United States to developing countries: evidence from the Bangkok study", American Journal of Agricultural Economics, vol. 79, no. 5, pp. 1630-1635.
Coase, R. H. (1960) "The problem of social cost", The Journal of Law and Economics, vol. 3, no. 1, pp. 1-44.
Cobera, E., Soberanis, C. G., & Brown, K. (2009) "Institutional dimensions of payments for ecosystem services: an analysis of Mexico's carbon forestry programme", Ecological Economics, vol. 68, no. 3, pp. 743-761.
Cochran, W. G. (1977) Sampling Techniques. 3rd edn. New York: John Wiley & Sons. Collins, K. (2004) "The Water Framework Directive and the impact on agriculture", in D. Lewis, & L.
Gairns (eds.) Agriculture and the Environment Water Framework Directive and Agriculture. Proceeding of the SAC and SEPA Biennial Conference. Edinburgh: Scottish Agricultural College, pp. 4-5.
Conner, M. & Armitage, C. J. (1998) "Extending the theory of planned behaviour: a review and avenues for further research", Journal of Applied Social Psychology, vol. 28, no. 15, pp. 1429-1464.
Conner, M., Sheeran, P., Norman, P., & Armitage, C. J. (2000) "Temporal stability as a moderator of relationships in the theory of planned behaviour", British Journal of Social Psychology, vol. 39, no. 4, pp. 469-493.
Cook, A. J., Kerr, G. N., & Moore, K. (2002) "Attitudes and intentions towards purchasing GM food", Journal of Economic Psychology, vol. 23, no. 5, pp. 557-572.
Cook, A. J., Moore, K., & Steel, G. D. (2005) "Taking a position: a reinterpretation of the theory of planned behaviour", Journal for the Theory of Social Behaviour, vol. 35, no. 2, pp. 143-154.
Cools, M., Moons, E., Janssens, B., & Wets, G. (2009) "Shifting towards environment-friendly modes: profiling travellers using Q-methodology", Transportation, vol. 36, no. 4, pp. 437-453.

201
Corbera, E., Soberanis, C. G., & Brown, K. (2009) "Institutional dimensions of payments for ecosystem services: an analysis of Mexico's carbon forestry programme", Ecological Economics, vol. 68, no. 3, pp. 743-61.
Costanza, R. (2008) "Ecosystem services: Multiple classification systems are needed", Biological Conservation, vol. 141, no. 2, pp. 350-352.
Costanza, R. (2009a) "A new development model for a 'full' world", Development, vol. 52, no. 3, pp. 369-376.
Costanza, R. (2009b) "Toward a new sustainable economy", Real-World Economics Review, vol. 49, pp. 20-21.
Costanza, R., D'Arge, R., de Groot, R., Farber, S., Grasso, M., Hannon, B., Limburgh, K., Naeem, S., O'Neill, R. V., Paruelo, J., Raskin, R. G., Sutton, P., & van Denbelt, M. (1997) "The value of the world's ecosystem services and natural capital", Nature, vol. 387, no. 6630, pp. 253-260.
Cubbage, F. W. (2004) "Costs of forestry best management practices in the south: A review", Water, Air, and Soil Pollution: Focus, vol. 4, no. 1, pp. 131-142.
Cummings, R. G. & Taylor, L. O. (1999) "Unbiased value estimates for environmental goods: a cheap talk design for the contingent valuation method", The American Economic Review, vol. 89, no. 3, pp. 649-665.
Cuttle, S. P., Haygarth, P. M., Chadwick, D. R., Newell-Price, P., Harris, D., Shepherd, M. A., Chambers, B. J., & Humphrey, R. (2007) An inventory of measures to control diffuse water pollution from agriculture (DWPA): user manual. Report under Defra project ES0203 [Online]. Available at: http://www.defra.gov.uk/science/project_data/DocumentLibrary/es0203/es0203_4145_FRA.pdf (Accessed: 6 February 2007).
Daily, G. C. & Matson, P. A. (2008) "Ecosystem services: from theory to implementation", Proceedings of the National Academy of Sciences, vol. 105, no. 28, pp. 9455-9456.
Daily, G. C. (1997) "Introduction: What are Ecosystem Services?," in G. C. Daily (ed.) Nature's Services: Societal Dependence on Natural Ecosystems. Washington, D.C.: Island Press, pp. 1-10.
Daily, G. C., Polasky, S., Goldstein, J., Kareiva, P. M., Mooney, H. A., Pejchar, L., Ricketts, T. H., Salzman, J., & Shallenberger, R. (2009) "Ecosystem services in decision making: time to deliver", Frontiers in Ecology and the Environment, vol. 7, no. 1, pp. 21-28.
Danielson, S. (2007) Discourses about wildfire in New Jersey and New South Wales. PhD. Thesis. Department of Geography, Clark University, Worcester, Massachusetts,USA [Online]. Available at: http://debitage.net/academic/DissFull.pdf (Accessed: 18 April 2010).
Danielson, S. (2009) "Q Method and Surveys: Three ways to combine Q and R", Field Methods, vol. 21, no. 3, pp. 219-237.
D'Arcy, B. & Frost, A. (2001) "The role of Best Management Practices in alleviating water quality problems associated with diffuse pollution", The Science of the Total Environment, vol. 265, no. 1-3, pp. 359-367.
D'Arcy, B., Usman, F., Griffiths, D., & Chatfield, P. (1998) "Initiatives to tackle diffuse pollution in the UK", Water Science and Technology, vol. 38, no. 10, pp. 131-138.
Darnton, A., Elster-Jones, J., Lucas, K., & Brooks, M. (2006) Promoting pro-environmental behaviour: Existing evidence to inform better policy making, Summary report. London: Department for Environment, Food and Rural Affairs. Available at: http://randd.defra.gov.uk/Document.aspx?Document=SD14002_3822_FRP.pdf
Davidson, J. & Weersink, A. (1998) "What Does it take for a Market to Function?", Review of Agricultural Economics, vol. 20, no. 2, pp. 558-572.
(Accessed: 19 April 2010).
Davies, B. B. & Hodge, I. D. (2007) "Exploring environmental perspectives in lowland agriculture: A Q methodology study in East Anglia, UK", Ecological Economics, vol. 61, no. (2-3), pp. 323-333.
Dawnay, E. & Shah, H. (2005) Extending the 'rational man' model of human behaviour: Seven key principles. [Online]. Available at: http://www.environment-

202
agency.gov.uk/static/documents/Research/ext.therationalman_1194332.pdf
de Bruijn, G.-J., Kremers, P. J., Schaalma, H., van Mechelen, W., & Brug, J. (2005) "Determinants of adolescent bicycle use for transportation and snacking behavior", Preventive Medicine, vol. 40, pp. 658-667.
(Accessed: 23 January 2009).
de Buck, A. J., van Rijn, I., Roling, N. G., & Wossink, G. A. A. (2001) "Farmers' reasons for changing or not changing to more sustainable practices: An exploratory study of arable farming in the Netherlands", The Journal of Agricultural Education and Extension, vol. 7, no. 3, pp. 153-166.
Dean, T. W. (2004) Secure pesticide storage: facility size and location. Fact Sheet PI-29. Florida: Institute of Food and Agricultural Sciences, University of Florida.
Deasy, C., Quinton, J. N., Silgram, M., Bailey, A. P., Jackson, B., & Stevens, C. J. (2009) "Mitigation options for sediment and phosphorous loss from winter-sown arable crops", Journal of Environmental Quality, vol. 38, no. 5, pp. 2121-2130.
Dee Catchment Partnership (2009) Dee catchment partnership business plan. Aberdeen: The Macaulay Land Use Research.
Defra (2003) Water, air and soil codes: summary, PB4029. London: Department for Environment Food and Rural Affairs.
Defra (2007) An introductory guide to valuing ecosystem services. London: Department for Environment, Food and Rural Affairs.
Desvousges, W. H., Naughton, M. C., & Parsons, G. R. (1992) "Benefit transfer: conceptual problems in estimating water quality benefits using existing studies", Water Resources Research, vol. 28, no. 3, pp. 675-683.
Dierks, L. H. (2005) Trust as a Determinant of Consumer Behaviour under Uncertainty: An Empirical Analysis of Consumers' Reactions to a Random External Shock in Europe. Gottingen: Curvillier Verlag.
Dietz, T., Dolsak, N., Ostrom, E., & Stern, P. C. (2002) "The Drama of the Commons," in E. Ostrom, T. Dietz, N. Dolsak, P.C. Stern, S. Stovich & E.U. Weber (eds.) The Drama of the Commons. Washington, D.C.: National Academy Press, pp. 3-28.
DOAE (2002) Good agricultural practice of tangerine (in Thai). GAP No.4. Bangkok: Department of Agricultural Extension, Ministry of Agriculture and Cooperatives.
DOAE (2007a) Agricultural survey. Information Centre, Department of Agricultural Extension. Available at: http://www.doae.go.th (Accessed: 20 January 2010).
DOAE (2007b) Thai agriculture statistics. Information Centre, Department of Agricultural Extension. Available at: http://www.doae.go.th (Accessed: 20 January 2010).
Doss, C. R. & Morris, M. L. (2001) "How does gender affect the adoption of agricultural innovations? The case of improved maize technology in Ghana", Agricultural Economics, vol. 25, no. 1, pp. 27-39.
Dowd, B. M., Press, D., & Huertos, M. L. (2008) "Agricultural nonpoint source water pollution policy: The case of California's Central Coast", Agriculture, Ecosystems & Environment, vol. 128, no. 3, pp. 151-161.
Duncan, E. (2006) Payments for environmental services: an equitable approach for reducing poverty and conserving nature. Gland: World Wildlife Fund.
Durning, D. W. & Brown, S. R. (2006) "Q Methodology and Decision Making," in G. Morcol (ed.) Handbook of decision making. Pennsylvania: CRC Press, pp. 537-564.
Earle, T. R., Rose, C. W., & Brownlea, A. A. (1979) "Socio-economic predictors of intention towards soil conservation and their implication in environmental management", Journal of Environmental Management, vol. 9, pp. 225-235.
East, R. (1993) "Investment decisions and the theory of planned behaviour", Journal of Economic Psychology, vol. 14, no. 2, pp. 337-375.
Edwards-Jones, G. (2006) "Modelling farmer decision-making: Concepts, progress and challenges", Animal Science, vol. 82, no. 6, pp. 783-790.

203
Edwards-Jones, G., Deary, I., & Willock, J. (1998) "Incorporating psychological variables in models of farmer behaviours: does it make for better predictions?", Etudes et Recherches sur les Systèmes Agraires et Développement, vol. 31, pp. 153-174.
Egger, M., Smith, G. D., & Phillips, A. N. (1997), "Meta-analysis: principles and procedures", BMJ, vol. 315, no. 7121, pp. 1533-1537.
Eisen-Hecht, J. I. & Kramer, R. A. (2002) "Estimating the economic value of water quality protection in the Catawba River Basin", Water Resource Research, vol. 38, no. 9, pp. 21-1-21-10.
Ellen, P. S., Wiener, J. L., & Cobb-Walgren, C. (1991) "The role of perceived consumer effectiveness in motivating environmentally conscious behaviors", Journal of Public Policy and Marketing, vol. 10, no. 2, pp. 102-117.
Ellis, G., Barry, J., & Robinson, C. (2007) "Many ways to say 'no', different ways to say 'yes': applying Q-Methodology to understand public acceptance of wind farm proposals". Journal of Environmental Planning and Management, vol. 50, no. 4, pp. 517-551.
Engel, S., Pagiola, S., & Wunder, S. (2008) "Designing payments for environmental services in theory and practice: an overview of the issues", Ecological Economics, vol. 65, no. 4, pp. 663-674.
Enhancement and Conservation of National Environmental Quality Act B.E.2535, 1992. Ervin, A. & Ervin, D. E. (1982) "Factors affecting the use of soil conservation practices: hypotheses,
evidence and policy implication", Land Economics, vol. 58, no. 3, pp. 225-236. Fafchamps, M. (2003) Rural Poverty, Risk and Development. Gloucestershire; Massachusetts: Edward
Elgar. Fagan, H. B., Diamond, J., Myers, R., & Gill, J. M. (2008) "Perception, intention, and action in
adolescent obesity", The Journal of the American Board of Family Medicine, vol. 21, no. 6, pp. 555-561.
Fairweather, J. R. & Klonsky, K. (2009) "Response to Vanclay et al. on farming styles: Q methodology for identifying styles and its relevance to extension", Sociologia Ruralis, vol. 49, no. 2, pp. 189-198.
Fairweather, J. R., Swaffield, S. R., & Simmons, D. G. (1998) Understanding visitors' experiences in Kaikoura using photographs of landscapes and Q method. Report No. 5. Christchurch: Tourism Research and Education Centre (TREC), Lincoln University.
FAO (1999) Fertilizer strategies. Rome: FAO and IFA. FAO (2006) Rapid growth of selected Asian economies: lessons and implications for agriculture and
food security, Republic of Korea, Thailand and Viet Nam. Bangkok: The Food and Agriculture Organization of the United Nations, Regional Office for Asia and the Pacific.
FAO (2007a) "Risk, Risk Management and Information Requirements," in Managing Risk in Farming. Rome: The Food and Agriculture Organization of the United Nations, pp. 1-27.
FAO (2007b) The state of food and agriculture 2007: paying farmers for environmental services,. Rome: The Food and Agriculture Organization of the United Nations.
Feather, P. M. & Amacher, G. S. (1994) "Role of information in the adoption of best management practices for water quality improvement", Agricultural Economics, vol. 11, no. 2-3, pp. 159-170.
Feather, P. M. & Cooper, J. (1995) Voluntary incentives for reducing agricultural nonpoint source water pollution. Agriculture Information Bulletin Number 716. Washington, D.C.: United States Department of Agriculture.
Feder, G., Just, R. E., & Zilberman, D. (1985) "Adoption of agricultural innovations in developing countries: a survey", Economic Development and Cultural Change, vol. 33, no. 2, pp. 255-298.
Fernandez-Cornejo, J., Beach, E. D., & Huang, W. Y. (1994) "The adoption of IPM techniques by vegetable growers in Florida, Michigan and Texas", Journal of Agriculture and Applied Economics, vol. 26, no. 1, pp. 158-172.
Field, A. (2005) Discovering Statistics Using SPSS. 2nd edn. London: SAGE. Field, R., Stuck, S., Tafuri, A., Ports, M., Clar, M., Clark, S., & Rushton, B. (2006) Urban
watersheds: current and future directions. Virginia: American Society of Civil Engineers.
204
Fielding, K. S., McDonald, R., & Louis, W. R. (2008) "Theory of planned behaviour, identity and intentions to engage in environmental activism", Journal of Environmental Psychology, vol. 28, no. 4, pp. 318-326.
Fielding, K. S., Terry, D. J., Masser, B. M., Bordia, P., & Hogg, M. A. (2005) "Explaining landholders' decisions about riparian zone management: the role of behavioural, normative, and control beliefs", Journal of Environmental Management, vol. 77, no. 1, pp. 12-21.
Filion, F. L., Frehs, J., & Sprecher, D. (2002) Revealing the economic value of biodiversity: a new incentive measure to conserve and protect it. ENV/EPOC/GEEI/BIO(1997)18/FINAL, prepared for the Group on Economic and Environmental Policy Integration, Expert Group on Economic Aspects of Biodiversity. Paris: Organisation for Economic Co-operation and Development.
Fink, A. (2003) How to manage, analyse, and interpret survey data. 2nd edn. London: SAGE. Fisher, B., Kulindwa, K., Mwanyoka, I., Turner, R. K., & Burgess, N. D. (2009) Common pool
resource management and PES: lessons and constraints for water PES in Tanzania. Ecological Economics. doi:10.1016/j.ecolecon.2009.11.008. In press
Fisher, B., Turner, K., Zylstra, M., Brouwer, R., de Groot, R., Farber, S., Ferraro, P., Green, R., Hadley, D., Harlow, J., Jefferiss, P., Kirkby, C., Morling, P., Mowatt, S., Naidoo, R., Paavola, J., Strassburg, B., Yu, D., & Balmford, A. (2008) "Ecosystem services and economic theory: integration for policy-relevant research", Ecological Applications, vol. 18, no. 8, pp. 2050-2067.
Florida Department of Agriculture and Consumer Services (2004) Best Management Practices for Citrus Groves in the Peace River and Manasota Basins. Florida: Florida Department of Agriculture and Consumer Services.
Florida Department of Agriculture and Consumer Services (2005) Best Management Practices for Gulf Citrus. 5M-7.005.11.05. Florida: Florida Department of Agriculture and Consumer Services.
Foley, J. A., DeFries, R., Asner, G. P., Barford, C., Bonan, G., Carpenter, S. R., Chapin, F. S., Coe, M. T., Daily, G. C., Gibbs, H. K., Helkowski, J. H., Holloway, T., Howard, E. A., Kucharik, C. J., Monfreda, C., Patz, J. A., Prentice, I. C., Ramankutty, N., & Snyder, P. K. (2005) "Global consequences of land use", Sciences, vol. 309, no. 5734, pp. 570-574.
Francis, J. J., Eccles, M. P., johnston, M., Walker, A., Grimshaw, J., Foy, R., Kaner, E. F. S., Smith, L., & Bonetti, D. (2004) Constructing questionnaires based on the theory of planned behaviour: a manual of health services researchers. Newcastle upon Tyne: Centre of Health Services Research, University of Newcastle, and European Union.
Franzel, S. (1999) "Socioeconomic factors affecting the adoption potential of improved tree fallows in Africa", Agroforestry Systems, vol. 47, no. 1, pp. 305-321.
Frost, C. A. (1999) "A summary of the agricultural issues raised at the conference (IAWQ 3rd International Conference on Diffuse Pollution)", Water Science and Technology, vol. 39, no. 12, pp. 361-364.
Fulgie, K. O. (1999) "Conservation tillage and pesticide use in the Cornbelt", Journal of Agricultural and Applied Economics, vol. 31, no. 1, pp. 133-147.
Furlong, N., Lovelace, E., & Lovelace, K. (2000) Research Methods and Statistics: An Integrated Approach. London: Hartcourt College.
Fuwa, N. & Sajise, A. J. (2006) Toward Environmental Services Incentive Policies for the Rice Sector: a survey and a Philippine Case Study. Rome: FAO.
Gabler, J. & Jones, M. Y. (2000) "Behavior and behavioral intentions in a retail setting", ANZMAC 2000 Visionary Marketing for the 21st Century: Facing the Challenge. School of Marketing and Management, Griffith University, Gold Coast, Queensland, Australia, 28November – 1 December 2000, pp. 377-382. Available at: http://smib.vuw.ac.nz:8081/www/ANZMAC2000/home.htm.
Garforth, C. & Rehman, T. (2005) Review of literature on measuring farmers' values, goals and objectives. Research project EPES 0405/17, Project report number 2. Reading: School of Agriculture, Policy and Development, University of Reading.
(Accessed: 1 December 2006).

205
Garforth, C. (2010) "Motivating farmers: insights from social psychology", NMC 49th Annual Meeting. 31 January – 3 Febuary 2010. New Mexico, USA. Available at:
Geauga Soil and Water Conservation District (2006) "NPDES phase II corner: riparian areas and setbacks", The Geaugrapher, Winter, p. 5.
http://www.nmconline.org/annualmeet/2010/progAM2010.htm (Accessed: 20 August 2010).
Gelso, B. R., Fox, J. A., & Peterson, J. M. (2008) "Farmers' perceived costs of wetlands: effects of wetland size, hydration, and dispersion", American Journal of Agricultural Economics, vol. 90, no. 1, pp. 172-185.
George, A., Pierret, A., Boonsaner, A., Valentin, C., Orange, D., & Planchon, O. (2009) "Potential and limitations of payment for environmental services (PES) as a means to manage watershed services in mainland Southeast Asia", International Journal of the Commons, vol. 3, no. 1, pp. 16-40.
Gillespie, J., Kim, S.-A., & Paudel, K. (2007) "Why don't producers adopt best management practices? an analysis of the beef cattle industry", Agricultural Economics, vol. 36, no. 1, pp. 89-102.
Gillham, B. (2000) Developing a Questionnaire. London: Continuum. Gitau, M. W., Veith, T. L., & Gburek, W. J. (2004) "Farm-level optimization of BMP placement for
cost-effective pollution reduction", Transactions of the ASAE, vol. 47, no. 6, pp. 1923-1931. Gorton, M., Douarin, E., Davidova, S., & Latruffe, L. (2008) "Attitudes to agricultural policy and
farming futures in the context of the 2003 CAP reform: A comparison of farmers in selected established and new Member States", Journal of Rural Studies, vol. 24, no. 3, pp. 322-336.
Gouyon, A. (2003) Rewarding the upland poor for environmental services: a review of initiatives from developed countries. Nairobi: World Agroforestry Centre.
Gowdy, J. & Erickson, J. (2005) "Ecological economics at a crossroad", Ecological Economics, vol. 53, no. 11, pp. 17-20.
Green, C. H. & Haney, R. (2005) Grassed waterways. SERA-17. 2005. Virginia Polytechnic Institute and State Univeristy. Available at:
Greene, B. A. (1973) Rate of adoption of new farm practices in the central plains of Thailand. Cornell International Bulletin Number 24. New York: Cornell University Press.
http://www.sera17.ext.vt.edu/Documents/BMP_Grassed_Waterways.pdf (Accessed: 7 August 2010).
Gregersen, H. & Contreras, A. (1992) Economic assessment of forestry project impacts. Rome: Food and Agriculture Organization of the United Nations.
Greiner, R., Patterson, L., & Miller, O. (2009) "Motivations, risk perceptions and adoption of conservation practices by farmers". Agricultural Systems, vol. 99, no. 2-3, pp. 86-104.
Guagnano, G. A., Stern, P. C., & Dietz, T. (1995) "Influences on attitude-behavior relationships: a natural experiment with curbside recycling", Environment and Behavior, vol. 27, no. 5, pp. 699-718.
Guehlstorf, N. P. (2008) "Understanding the scope of farmer perceptions of risk: considering farmer opinions on the use of genetically modified (GM) crops as a stakeholder voice in policy", Journal of Agricultural and Environmental Ethics, vol. 21, no. 6, pp. 541-558.
Guerin, T. F. (1999) "An Australia perspective on the constraints to the transfer and adoption of innovations in land management", Environmental Conservation, vol. 26, no. 4, pp. 289-304.
Gunningham, N. & Sinclair, D. (2005) "Policy instrument choice and diffuse source pollution", Journal of Environmental Law, vol. 17, no. 1, pp. 51-81.
GWP Toolbox. (2008) Australia: Moreton Bay & Catchments (#297). Global Water Partnership. Available at:
Haab, T. C. & McConnell, K. E. (2002) "Social norms and illicit behaviour: an evolutionary model of compliance", Journal of Environmental Management, vol. 66, no. 1, pp. 67-76.
www.gwptoolbox.org/index.php?option=com_case&id=222&Itemid=0 (Accessed: 27 August 2010).
Hagger, M. S., Chatzisarantis, N. L. D., & Biddle, S. J. H. (2002) "A meta-analytic review of the theories of reasoned action and planned behavior in physical activity: predictive validity and the

206
contribution of additional variables", Journal of Sport and Exercise Psychology, vol. 24, no. 1, pp. 3-32.
Hair, J. F., Black, W. C., Babin, B. J., & Anderson, R. E. (2009) Multivariate Data Analysis: A Global Perspective. 7th edn. New Jersey: Pearson.
Hall, C. (2008) "Identifying farmer attitudes towards genetically modified (GM) crops in Scotland: are they pro- or anti- GM?", Geoforum, vol. 39, no. 1, pp. 204-212.
Hanley, N., Schlapfer, F., & Spurgeon, J. (2003) "Aggregating the benefits of environmental improvements: distance-decay functions for use and non-use values", Journal of Environmental Management, vol. 68, no. 3, pp. 297-304.
Hardin, G. (1968) "The tragedy of the commons", Sciences, vol. 162, no. 3859, pp. 1243-1248. Harrington, W. & Morgenstern, R. D. (2004) "Economic incentives versus command and control:
what's the best approach for solving environmental problems?", Resources, Fall/Winter, pp. 13-17.
Hashemi, S. M., Mokhtarnia, M., Erbaugh, J. M., & Asadi, A. (2008) "Potential of extension workshops to change farmers' knowledge and awareness of IPM", Science of The Total Environment, vol. 407, no. 5, pp. 84-88.
Hatfield-Dodds, S. (2006) "The catchment care principle: a new equity principle for environmental policy, with advantages for efficiency and adaptive governance", Ecological Economics, vol. 56, no. 3, pp. 373-385.
Hattam, C. (2006) "Barriers to the adoption of organic agriculture: an investigation using the theory of planned behaviour", Aspects of Applied Biology 79, COR 2006. 18-20 September 2006. Heriot-Watt University, Edinburgh, in C. Atkinson, B. Ball, D.H.K. Davies, R. Reeeds, G. Russell, E.A. Stockdale, C.A. Watson, R. Walker, and D. Younie (eds.) What Will Organic Farming Deliver? Association of Applied Biologists, pp. 73. Available at: http://orgprints.org/10182/ (Accessed: 4 July 2008).
Hawes, E. & Smith, M. (2005) Riparian buffer zones: Functions and recommended widths. Connecticut: Yale School of Forestry and Environmental Studies. Available at:
Helmer, R. & Hespanhol, I. (1997) Water Pollution Control: A Guide to the Use of Water Quality Management Principles. London: E&FN Spon.
http://www.ci.durham.nc.us/departments/planning/pdf/wqattachment3.pdf (Accessed: 7 August 2010).
Henning, S. A. & Cardona, H. (2000) "An analysis of factors influencing adoption of BMPs among Louisiana sugarcane producers", The 2000 American Agricultural Economics Association Meeting. 30 July 2000. Florida, USA. Available at: http://ageconsearch.umn.edu/handle/21838 (Accessed: 25 March 2007).
Herath, P. H. M. U. & Takeya, H. (2003) "Factors determining intercropping by rubber smallholders in Sri Lanka: a logit analysis", Agricultural Economics, vol. 29, no. 2, pp. 159-168.
Hodge, I.D. (1989) "Compensation for nature conservation", Environment and Planning A, vol. 21, no. 8, pp. 1027-1036.
Hope, R. A., Porras, I., Borgoyary, M., Miranda, M., Agarwal, C., Tiwari, S., & Amezaga, J. M. (2007) Negotiating watershed services. London: International Institute for Environment and Development.
Hoppe, R. & Wiebe, K. (2002) Agricultural resources and environmental indicators: land ownership and farm structure. AH722. Washington, D.C.: United Stated Department of Agriculture.
Horlings, S. (2009) Marketing sustainability: Bridging the gap between branding, sustainability and consumer demands. Utrecht: Initiatief Duurzame Handel.
Hosmer, D. W. & Lemeshow, S. (1989) Applied Logistic Regression. New York: John Wiley & sons. Huang, M. & Upadhyaya, S. K. (2007) Watershed-based payment for environmental services in Asia.
Working paper no. 06-07. Virginia: Winrock International and Office of International Research, Education, and Development (OIRED), Virginia Tech.
Huijps, K., Hogeveen, H., Lam, T. J. G. M., & Huirne, R. B. M. (2009) "Preferences of cost factors for mastitis management among Dutch diary farmers using adaptive conjoint analysis", Preventive Veterinary Medicine, vol. 92, no. 4, pp. 351-359.

207
Husak, A. L., Grado, S. C., & Bullard, S. H. (2004) "Perceived values of benefits from Mississippi' s forestry best management practices", Water, Air and Soil Pollution, vol. 4, no. 1, pp. 171-185.
Hussain, S.S., Winrow-Giffin, A., Moran, D., Robinson, L.A., Fofana, A., Paramor, A.L. & Frid, C.L.J. (2010) "An ex ante ecological economic assessment of the benefits arising from marine protected areas designation in the UK", Ecological Economics, vol. 69, no. 4, pp. 828-838.
Ice, G. (2004) "History of innovative best management practice development and its role in addressing water quality limited waterbodies", Journal of Environmental Engineering, vol. 130, no. 6, pp. 683-689.
Ichiki, A., Kamimura, K., & Okubo, T. (2003) "Simulation analysis on pollutant behaviour in rice paddy fields around Akanoi bay of lake Biwa, Japan", The 7th International Conference on Diffuse Pollution & Basin Management. 17-22 August 2003. Dublin, Ireland. Available at: http://www.ucd.ie/dipcon/docs/theme03/theme03_35.PDF (Accessed: 12 December 2006).
IDEQ (2005) Catalog of stormwater best management practices for Idaho cities and counties. Idaho: Idaho Department of Environmental Quality. Available at:
IIED (2004) Developing markets for watershed protection services and improved livelihoods. Implementation phase planning workshop report. London: International Institute for Environment and Development.
www.deq.state.id.us/water/data_reports/storm_water/catalog/index.cfm. (Accessed: 9 August 2010).
Ingram, J., Fry, P., & Mathieu, A. (2010) "Revealing different understandings of soil held by scientists and farmers in the context of soil protection and management", Land Use Policy, vol. 27, no. 1, pp. 51-60.
Ioris, A. A. R. (2004) "Allocation and abstraction of water in rural Scotland", in D. Lewis, & L. Gairns (eds.) Agriculture and the Environment Water Framework Directive and Agriculture. Proceeding of the SAC and SEPA Biennial Conference. Edinburgh: Scottish Agricultural College, pp. 9-19.
Iovanna, R. & Newbold, S. C. (2007) "Ecological sustainability in policy assessments: a wide-angle view and a close watch", Ecological Economics, vol. 63, no. 4, pp. 639-648.
Jack, B. K., Kousky, C., & Sims, K. R. E. (2008) "Designing payments for ecosystems services: lessons from previous experience with incentive-based mechanisms", Proceedings of the National Academy of Science of the United States of America, vol. 150, no. 28, pp. 9465-9470.
Jaffe, J. & Gertler, M. (2006) "Victual viccissitudes: consumer deskilling and the (gendered) transformation of food systems", Agriculture and Human Values, vol. 23, no. 2, pp. 143-162.
Jeanes, K., van Noordwijk M., Joshi L., Widayati A., Farida, & Leimona B. (2006) Rapid Hydrological Appraisal in the Context of Environmental Service Rewards. Bogor Borat: World Agroforestry Centre.
Jenkins, G. P. (1999) "Evaluation of stakeholder impacts in cost-benefit analysis", Impact Assessment and Project Appraisal, vol. 17, no. 2, pp. 87-96.
Julia Igual, J. F. & Server Izquierdo, R. J. (2000) Economics and financial comparison of organic and conventinoal citrus-growing systems. Study prepared for the Horticultural Product Group, Raw Materials, Tropical and Horticultural Products Service, Commodities and Trade Division. Rome: FAO
Jungbluth, F. (2000) Economic analysis of crop protection in citrus production in central Thailand. A Publication of the Pesticide Policy Project: Special Issue Publication Series No. 4. Hannover: University of Hannover.
Just, R. E., Hueth, D. L., & Schmitz, A. (2004) The Welfare Economics of Public Policy: A Practical Approach to Project and Policy Evaluation. Massachusetts: Edward Elgar.
Kaine, G. & Bewsell, D. (2008) "Adoption of integrated pest management by apple growers: the role of context", International Journal of Pest Management, vol. 54, no. 3, pp. 255-265.
Kaiser, F., Wolfing, S., & Fuhrer, U. (1999) "Environmental attitude and ecological behaviour", Journal of Environmental Psychology, vol. 19, no. 1, pp. 1-19.
208
Kammel, D. W. & O'Neil, D. (1990) "Farm-sized maxing/ loading pad and agri-chemical storage facility", International Summer Meeting of American Society of Agricultural Engineer 1990. 24-27 June 1990. Columbus, Ohio, USA.
Karppinen, H. (2005) "Forest owners' choice of reforestation method: an application of the theory of planned behavior", Forest Policy and Economics, vol. 7, no. 3, pp. 393-409.
Katz, M. H. (1999) Multivariable Analysis: A Practical Guide for Clinicians. Cambridge: Cambridge University Press.
Kemkes, R. J., Farley, J., & Koliba, C. J. (2010) "Determining when payments are an effective policy approach to ecosystem service provision", Ecological Economics, vol. 69, no. 11, pp. 2069-2074.
Kerns, W. R. & Kramer, R. A. (1985) "Farmers' attitudes toward nonpoint pollution control and participation in cost-share programs", Water Resources Bulletin, vol. 21, no. 2, pp. 207-215.
Khamkanya, T. (2009) BMPs costs. [Interview] Ulster University with W. Bumbudsanpharoke. 25 May 2009.
Kinoshita, Y. 1991, "Determinants of strategy choices in deciding an order of preference for a group", in The Biennial meeting of the Society for Research in Child Development. 18-20 April 1991. Seattle, Washington, D.C.
Kirchhoff, S., Colby, B. G., & LaFrance, J. T. (1997) "Evaluating the performance of benefit transfer: an empirical inquiry", Journal of Environmental Economics and Management, vol. 33, no. 1, pp. 75-93.
Knowler, D. & Bradshaw, B. (2007) "Farmers' adoption of conservation agriculture: a review and synthesis of recent research", Food Policy, vol. 32, no. 1, pp. 25-48.
Kosoy, N., Corbera, E., & Brown, K. (2008) "Participation in payments for ecosystem services: Case studies from the Lacandon rainforest, Mexico", Geoforum, vol. 39, no. 6, pp. 2073-2083.
Kosoy, N., Miguel, M.-T., Roldan, M., & Joan, M.-A. (2007) "Payments for environmental services in watershed: insights from a comparative study of three cases in Central America", Ecological Economics, vol. 61, no. 2-3, pp. 446-455.
Kramer, B., de Hegedus, P., & Gravina, V. (2003) Evaluating a dairy herd improvement project in Uruguay: testing and explaining Q-Methodology. Journal of International Agricultural and Extension Education, vol.10, no. 2, pp. 41-50.
Kripanont, N. (2007) Examining a Technology Acceptance Model of Internet Usage by Academics within Thai Business Schools. PhD thesis. School of Information Systems, Faculty of Business and Law, Victoria University, Melbourne, Australia [Online]. Available at: http://wallaby.vu.edu.au/adt-VVUT/uploads/approved/adt-VUT20070911.152902/public/02whole.pdf (Accessed: 16 March 2010).
Krumrine, M. (2004) "Riparian buffers de-mystified!", Tributary Times, vol. 3, no. 5. Available at:
Krupnick, A. J. (1993) "Benefit transfers and valuation of environmental improvements", Resources, vol. 110, Winter, pp. 1-6.
www.gaelwolf2.com/dnrec/trib_times_2004_5_riparian_buffers.htm (Accessed: 7 August 2010).
Krutz, L. J., Senseman, S. A., Dizier, M. C., Hoffman, D. W., & Tierney, D. P. (2004) "Inflitration and adsorption of dissolved metolachlor, metolachlor oxanilic acid, and metolachlor ethanesulfonic acid by buffalograss (Buchloe dactyloides) filter strip", Weed Science, vol. 52, no. 1, pp. 166-171.
Kuehne, G., Bjornlund, H., & Cheers, B. (2008) "Identifying common traits among Australian irrigators using cluster analysis", Water Science and Technology, vol. 58, no. 3, pp. 587-595.
Kurz, T. (2002) "The psychology of environmentally sustainable behaviour: Fitting together pieces of the puzzle", Analyses of Social Issues and Public Policy, vol. 2, no. 1, pp. 257-278.
Lam, S. P. (1999) "Predicting intentions to conserve water from the theory of planned behavior, perceived moral obligation, and perceived water right", Journal of Applied Social Psychology, vol. 29, no. 5, pp. 1058-1071.

209
Landell-Mills, N. & Porras, I. T. (2002) Silver bullet of fools' gold? a review of markets for forest environmental services and their impact on the poor. London: International Institute for Environmental and Development.
Landell-Mills, N. (2002) "Developing markets for forest environmental services: an opportunity for promoting equity while securing efficiency?", Philosophical transactions. Series A, Mathematical, physical, and engineering sciences, vol. 360, no. 1797, pp. 1817-1825.
Laroche, M. & Sadokierski, R. (1994) "Role of confidence in a multi-brand model of intentions for high-involvement service", Journal of Business Research, vol. 29, no. 1, pp. 1-12.
Larson, R., Brethour, C., Sparling, B., Cortus, B., Klimas, M., Moore, T., & Richards, J. S. (2007) "An economic evaluation of best management practices for crop nutrients in Canadian agriculture", The IFA International Workshop on Fertilizer Best Management Practices. 7-9 March 2007. Brussels, Belgium.
Leiser, D. & Azar, O. H. (2008) "Behavioral economics and decision making: applying insights from psychology to understand how people make economic decisions", Journal of Economic Psychology, vol. 29, no. 5, pp. 613-618.
Lipper, L., McCarthy, N., & Zilberman, D. (2009) "Putting Payments for Environmental Services in the Context of Economic Development," in L. Lipper, T. Sakuyama, R. Stringer, & D. Zilberman (eds.) Payment for Environmental Services in Agricultural Landscapes: Economic Policies and Poverty Reduction in Developing Countries. Rome: Food and Agriculture Organisation of the United Nations and Springer, pp. 9-33.
Lobley, M. & Butler, A. (2010) The impact of CAP reform on farmers' plans for the future: Some evidence from South West England. Food Policy, doi: 10.1016/j.foodpol.2010.04.001, In press.
Loehr, R. C. (1984) Pollution Control for Agriculture. 2nd edn. Florida: Academic Press. Loomis, J. B., Roach, F. W., & Ready, R. (1995) "Testing transferability of recreation demand models
across regions: a study of corps of engineers reservoirs", Water Resources Research, vol. 31, no. 3, pp. 721-730.
Lubell, M. & Fulton, A. (2008) "Local policy networks and agricultural watershed management", Journal of Public Administration Research and Theory, vol. 18, no. 4, pp. 673-696.
Lucas, K., Brooks, M., Darnton, A., & Elster-Jones, J. (2008) "Promoting pro-environmental behaviour: existing evidence and policy implications" Environmental Science and Policy, vol. 11, no. 5, pp. 456-466.
Lui, W.Q., Gan, L., & Zhang, X.L. (2002) "Cost-competitive incentives for wind energy development in China: institutional dynamics and policy changes", Energy Policy, vol. 30, no. 9, pp. 753-765.
Lutz, E., Pagiola, S., & Reiche, C. (1994) "The costs and benefits of soil conservation: the farmers' viewpoint", The World Bank Research Observer, vol. 9, no. 2, pp. 273-295.
Luzar, E. J. & Cosse, K. J. (1998) "Willingness to pay or intention to pay: the attitude-behaviour relationship in contingent valuation", Journal of Socio-Economics, vol. 27, no. 3, pp. 427-444.
Luzzi, L. & Spencer, A. J. (2008) "Factors influencing the use of public dental services: an application of the theory of planned behavior", BMC Health Services Research, vol. 8, p. 93.
Marod, D., Watcharinrat, C., Duengkae, P., & Jenkitkarn, S. (2005) Implementation of the ramsar convention in Thailand: management and protection of wetland areas - Chiang Saen Lake (Phase II) (in Thai). Bangkok: Office of Natural Resources and Environmental Policy and Planning.
Matthew, S., Pease, S. M., Gordon, A. M., & Williams, P. A. (1993) "Landowner perceptions and the adoption of agroforestry practices in southern Ontario, Canada", Agroforestry Systems, vol. 21, no. 2, pp. 159-168.
Mayer, P. M., Reynolds, S. K., McCutchen, M. D., & Canfield, T. J. (2006) Riparian buffer width, vegetative cover, and nitrogen removal effectiveness: a review of current science and regulations. EPA/600/R-05/118. Ohio: US EPA.
Mayet, S. T. & Niess, S. (2008) Examining the predictive value of the theory of planned behavior and stages of change on fruit and vegetable intake. Department of Health, Hawaii, USA [Online].

210
Available at: www.hawaii.gov/health/hjph/2008_Articles/volume1/pdf/10.pdf. (Accessed: 2 February 2009).
Mayrand, K. & Paquin, M. (2004) Payments for environmental services: a survey and assessment of current schemes, Paper for the Commission for Environmental Cooperation of North America. Montreal: Unisféra International Centre.
McGechan, M. B., Lewis, D. R., & Vinten, A. J. A. (2008) "A river water pollution model for assessment of best management practices for livestock farming", Biosystems Engineering, vol. 99, no. 2, pp. 292-303.
McKeown, B. & Thomas, D. (1988) Q Methodology.California: SAGE. Menegaki, A. N., Hanley, N. & Tsagarakis, K.P. (2007) "The social acceptability and valuation of
recycled water in Crete: A study of consumers' and farmers' attitudes", Ecological Economics, vol. 62, no. 1, pp. 7-18.
Millennium Ecosystem Assessment (2003) Ecosystems and human well-being: a framework for assessment. Washington, D.C.: Island Press.
Millennium Ecosystem Assessment (2005) Ecosystems and human well-being: wetlands and water, synthesis. Washington, D.C.: Island Press.
Montoya, I. D., Atkinson, J. S., & Trevino, R. A. (2000) "Economics as a factor in models of behavioral motivation and change", Substance Use and Misuse, vol. 35, no. 3, pp. 329-346.
Moran, D. & Dann, S. (2008) "The economic value of water use: Implications for implementing the Water Framework Directive in Scotland", Journal of Environmental Management, vol. 87, no. 3, pp. 484-496.
Morf, M. E., Miller, C. M., & Syrotuik, J. M. (1976) "A comparison of cluster analysis and Q-factor analysis", Journal of Clinical Psychology, vol. 32, no. 1, pp. 59-64.
Moss, T. (2004) "The governance of land use in river basins: prospects for overcoming problems of institutional interplay with the EU Water Framework Directive", Land Use Policy, vol. 21, no. 1, pp. 85-94.
Moss, T. (2009) "Intermediaries and the governance of sociotechnical networks in transition", Environment and Planning A, vol. 41, no. 6, pp. 1480-1495.
Muthke, T. & Holm-Mueller, K. (2004) "National and international benefit transfer testing with a rigorous test procedure", Environmental and Resource Economics, vol. 29, no. 3, pp. 323-336.
Nakasone, H. & Yamamoto, T. (2003) "How much does diffuse pollution affect an aquatic ecosystem", The 7th International Conference on Diffuse Pollution & Basin Management. 17-22 August 2003. Dublin, Ireland. Available at: http://www.ucd.ie/dipcon/docs/theme03/theme03_24.PDF (Accessed: 12 December 2006).
Namruengsri, W. (2005) The management of fertilizer in citrus orchards (in Thai). Bangkok: Horticulture Research Institute, Department of Agriculture.
Namruengsri, W. (2008) BMPs costs. [Interview] Department of Agriculture, Thailand with W. Bumbudsanpharoke. 2 August 2008.
Neill, S. P. & Lee, D. R. (2001) "Explaining the adoption and disadoption of sustainable agriculture: The case of cover crops in Northern Honduras", Economic Development and Cultural Change, vol. 494, no. 4, pp. 793-820.
Nendel, C. (2009) "Evaluation of best management practices for N fertilisation in regional field vegetable production with a small-scale simulation model", European Journal of Agronomy, vol. 30, no. 2, pp. 110-118.
Newbold, P. (1995) Statistics for Business and Economics. 4th edn. New Jersey: Prentice Hall. Nicolaisen, J., Dean, A., & Hoeller, P. (1991) "Economics and the environment: a survey of issues
and policy options", OECD Economic Studies, vol. 16, Spring, pp. 7-43. Niskanen, A. (1998) "Financial and economic profitability of reforestation in Thailand", Forestry
Ecology and Management, vol. 104, no. 1-3, pp. 57-68. Novotny, V. (1998) "Diffuse Pollution from Agriculture - Worldwide Outlook," in T. Petchey, B. J.
D'Arcy, & C. A. Frost (eds.) Diffuse Pollution and Agriculture II. Aberdeen: Scottish Agricultural College, pp. 23-38.

211
Novotny, V. (2003) Water Quality: Diffuse Pollution and Watershed Management. 2nd edn. New York: John Wiley & Sons.
Nunnally, J. C. (1978) Psychometric Theory. 2nd edn. New York: McGraw-Hill. Nyaupane, N. P. & Gillespie, J. (2009) "The influences of land tenancy and rotation selection on
crawfish farmers' adoption of best management practices", The Southern Agricultural Economics Association Annual Meeting. 31 January – 3 February 2009. Atlanta, Georgia, USA.
OAE (2007) Agricultural statistics of Thailand 2007 (in Thai). Bangkok: Office of Agricultural Economics.
Oates, C. (2006) "Annex 9 - Quality and safety of fruits and vegetables in Thailand," in E.B. Esquerra, J-J. Cadilhon, & A.W. Shepherd (eds.) Proceedings of the FAO/AFMA Workshop on Quality and Safety in the Traditional Horticultural Marketing Chains of Asia, Bangkok, 7-10 November 2005. RAP Publication 2006/15. Bangkok: The Food and Agriculture Organization of the United Nations and Agricultural and Food Marketing Association for Asia and the Pacific. Available at: http://www.fao.org/docrep/meeting/011/ag102e/ag102e00.HTM (Accessed: 5 March 2008).
Ockwell, D. G. (2008) "'Opening up' policy to reflexive appraisal: a role for Q methodology? a case study of fire management in Cape York, Australia", Policy Sciences, vol. 41, no. 4, pp. 263-292.
OECD (1972) Recommendation of the council on guiding principles concerning international economic aspects of environmental policies. Council Document No. C(72)128. Paris: Organization of Economic Cooperation and Development.
OECD (2002) The polluter-pays principle as it relates to international trade. COM/ENV/TD(2001)44/FINAL, joint working party on Trade and Environment. Paris: Organisation for Economic Co-operation and Development.
OECD (2010) "Ex-ante and ex-post evaluation of agri-environmental policies", OECD Agriculture and Food, vol. 2010, no. 8, pp. 67-75.
Olson, J. C. & Reynolds, T. J. (2001) "The Means-End Approach to Uderstanding Consumer Decision Making," in J. A. Howard & G. E. Warren (eds.) Understanding Consumer Decision Making: the Means-End Approach to Marketing and Advertising Strategy. New Jersey: Routledge, pp. 3-23
ONEP (2010) Policy and Plan. Bangkok: Office of Natural Resources and Environmental Policy and Planning. Available at: www.onep.go.th (Accessed: 19 April 2010).
Ostrom, E., Gardner, R., & Walker, J. (1994) Rule, Games, & Common-Pool Resources. Michigan: The University of Michigan Press.
Otto, S., Vianello, M., Infantino, A., Zanin, G., & Di Guardo, A. (2008) "Effect of a full-grown vegetative filter strip on herbicide runoff: maintaining of filter capacity over time", Chemosphere, vol. 71, no. 1, pp. 74-82.
Ovans, A. (1998) "Briefings from the editors: market research, the customer doesn't always know best", Harvard Business Review, vol. 76, no. 3, pp. 12-13.
Pagiola, S. & Platais, G. (2002) Payments for Environmental Services. Environmental Strategy Notes no 3., New York: The World Bank.
Pagiola, S. & Platais, G. (2007) Payments for environmental services: from theory to practice. Washington, D.C.: The World Bank.
Pagiola, S. (2002) "Paying for Water Services in Central America," in S. Pagiola, J. Bishop, & N. Landell-Mills (eds.) Selling Forest Environmental Services Market-Based Mechanisms for Conservation and Development. London: Earthscan Publications, pp. 37-62.
Pagiola, S. (2005) "Can payments for environmental services help reduce poverty? an exploration of the issues and the evidence to date from Latin America", World Development, vol. 33, no. 2, pp. 237-253.
Pagiola, S., Arcenas, A., & Platais, G. (2005) "Can payments for environmental services help reduce poverty? an exploration of the issues and the evidence to date from Latin America", World Development, vol. 33, no. 2, pp. 237-253.
212
Pannell, D. J. (2003), "Uncertainty and Adoption of Sustainable Farming Systems," in B. A. Babcock, R. W. Fraser, & J. N. Lekakis (eds.) Risk Management and the Environment: Agriculture in Perspective. Dordrecht: Kluwer Academic Publishers, pp. 67-81.
Pannell, D. J., Malcolm, B., & Kingwell, R. S. (2000) "Are we risking too much? perspectives on risk in farm modelling", Agricultural Economics, vol. 23, no. 1, pp. 69-78.
Pannell, D. J., Marshall, G. R., Barr, N., Curtis, A., Vanclay, F., & Wilkinson, R. (2006) "Understanding and promoting of conservation practices by rural landholders", Australian Journal of Experiment Agriculture, vol. 46, no. 11, pp. 1407-1424.
Papandreou, A. A. (1994) Externality and Institutions. Oxford: Clarendon Press. Parkin, M., Powell, M., & Matthews, K. (1997) Economics. 3rd edn. Massachusetts: Addison-Wesley. Parsons, L. & Boman, B. (2006) "Best management practices for Florida citrus", HortTechnology, vol.
16, no. 3, pp. 389-393. Pattanayak, S. K., Wing, J. M., Depro, B. M., van Houtven, G. L., De Civita, P., Stieb, D. M., &
Hubbell, B. (2002) International health benefits transfer application tool: the use of PPP and inflation indices. Final report, prepared for Economic Analysis and Evaluation Division Office of Policy Coordination and Economic Analysis Policy and Planning Directorate Healthy Environments and Consumer Safety Branch Health Canada. Ontario: Health Canada.
Pattanayak, S., Smith, V. K., & van Houtven, G. (2007) "Improving the Practice of Benefits Transfer: A Pcalibration Approach," in R. Navrud & R. Ready (eds.) Environmental Value Transfer: Issues and Methods. Dordrecht: Springer, pp. 241-260.
PCD (2005) Summary of state of Thailand's pollution in year 2005 (in Thai). Bangkok: Pollution Control Department.
PCD (2006) Managing agricultural pollution and water pollution from nonpoint source pollution: Songkhla lake (in Thai). Final report, PCD 02-193. Bangkok: Pollution Control Department.
Pearce, D. W., Atkinson, G., & Mourato, S. (2006) Cost-benefit analysis and the environment: recent developments. Paris: Organisation for Economic Co-operation and Development.
Pearce, D.W., & Seccombe-Hett, T. (2000) "Economic valuation and environmental decision-making in Europe", Environmental Science & Technology, vol. 34, no. 8, pp. 1419-1425.
Peirce, J. J., Weiner, R. F., & Vesilind, P. A. (1998) Environmental Pollution and Control. 4th edn. Boston: Butterworth-Heinemann.
Peris Moll, E. M. & Julia Igual, J. F. (2006) "Production costs of the organic Clementine crop in the region of Valencia (Spain)", Spanish Journal of Agricultural Research, vol. 4, no. 1, pp. 17-25.
Perrot-Maître, D. (2006) The Vittel payments for ecosystem service: a 'perfect' PES case? Project paper no.3. London: International Institute for Environment and Development. Available at:
Pieters, R. G. M. (1989) "A note on cost in economic psychology", Journal of Economic Psychology, vol. 10, no. 4, pp. 441-455.
http://www.iied.org/pubs/pdfs/G00388.pdf (Accessed 4 June 2009).
Pigou, A. (1920) The Economics of Welfare. London: Macmillan. Polasky, S. (2008) "What's nature done for you lately: measuring the value of ecosystem services",
Choices, vol. 23, no. 2, pp. 42-46. Poole, N. & Baron, L. (1996) "Consumer awareness of citrus fruit attributes", British Food Journal,
vol. 98, no. 1, pp. 23-28. Portney, P. R. (2003) "Market-based approaches to environmental policy: a ‘refresher’ course",
Resources, Summer, pp. 15-18. Postel, S. L. & Thompson, B. H. (2005) "Watershed protection: capturing the benefits of nature's
water supply services", Natural Resources Forum, vol. 29, no. 2, pp. 98-108. Poudel, D. D., Jeong, C. Y., & DeRamus, A. (2010) "Surface run-off water quality from agricultural
lands and residential areas", Outlook on Agriculture39, vol. 39, no. 2, pp. 95-105. Pouta, E. & Rekola, M. (2001) "The theory of planned behaviour in predicting willingness to pay for
abatement of forest regeneration", Society and Natural Resources, vol. 14, no. 2, pp. 93-106.
213
Powell, I. & White, A. (2001) A conceptual framework for developing markets and market-based instruments for environmental services of forests. Paper prepared for developing markets for environmental services of forests. 4 October 2000, Vancouver, British Columbia, Canada.
Prato, T. (1998) Natural Resource and Environmental Economics. Iowa: Iowa State University Press. Prokopy, L. S., Floress, K., Klotthor-Weinkauf, D., & Baumgart-Getz, A. (2008) "Determinants of
agricultural best management practice adoption: evidence from the literature", Journal of Soil and Water Conservation, vol. 63, no. 5, pp. 300-311.
Quinn, C.H., Fraser, E.D.G., Hubacek, K. & Reed, M.S. (2010) "Property rights in UK uplands and the implications for policy and management" Ecological Economics. doi: 10.1016/j.ecolecon.2010.02.006. In press.
Rabin, M. (1998) "Psychology and economics", Journal of Economic Literature, vol. 36, no. 1, pp. 11-46.
Rahelizatovo, N. C. & Gillespie, J. M. (2004) "The adoption of best-management practices by Louisiana dairy producers", Journal of Agricultural and Applied Economics, vol. 36, no. 1, pp. 229-240.
Rahelizatovo, N. C. (2002) Adoption of Best Management Practices in the Louisiana dairy industry. PhD thesis. The Department of Agricultural Economics and Agribusiness, Louisiana State University, Los Angeles, USA [Online]. Available at: http://etd.lsu.edu/docs/available/etd-1112102-180551/unrestricted/Rahelizatovo_dis.pdf (Accessed: 16 March 2010).
Rahm, M. R. & Huffman, W. E. (1984) "The adoption of reduced tillage: the role of human capital and other variables", American Journal of Agricultural Economics, vol. 66, no. 4, pp. 405-413.
Raje, F. (2007) "Using Q Methodology to develop more perceptive insights on transport and social inclusion", Transport Policy, vol. 14, no. 6, pp. 467-477.
Ramsey, J. & Hungerford, H. R. (2002) "Perspectives on environmental education in the United States," in T. Dietz & P. C. Stern (eds.) New Tools for Environmental Protection: Education, Information and Voluntary Measures. Washington, D.C.: The National Academies Press, pp. 147-160.
Rao, N. S., Zachary, M. E., Schneiderman, E. M., Zion, M. S., Lee, D. R., & Steenhuis, T. S. (2009) "Modeling watershed-scale effectiveness of agricultural best management practices to reduce phosphorous loading", Journal of Environmental Management, vol. 90, no. 3, pp. 1385-1395.
Ready, R. & Navrud, S. (2006) "International benefit transfer: methods and validity tests", Ecological Economics, vol. 60, no. 2, pp. 429-434.
Ready, R., Navrud, S., Day, B., Dubourg, R., Machado, F., Mourato, S., Spanninks, F., & Rodriquez, M. X. V. (2004) "Benefit transfer in Europe: how reliable are transfer between countries?", Environmental and Resource Economics, vol. 29, no. 1, pp. 67-82.
Reed, P. (1999) "Effect of perceived cost on judgments regarding the efficacy of investment", Journal of Economic Psychology, vol. 20, no. 6, pp. 657-676.
Rehman, T., McKemey, K., Yates, C. M., Cooke, R. J., Garforth, C. J., Tranter, R. B., Park, J. R., & Dorward, P. T. (2007) "Identifying and understanding factors influencing the uptake of new technologies on dairy farms in SW England using the theory of reasoned action", Agricultural Systems, vol. 94, no. 2, pp. 281-293.
Ribaudo, M. O., Horan, R. D., & Smith, M. E. (1999) Economics of water quality protection from nonpoint sources: theory and practice. Agricultural Economic Report Number 782. Washington, D.C.: United States Department of Agriculture.
Richardson, L. & Loomis, J. (2009) "The total economic value of threatened, endangered and rare species: an updated meta-analysis", Ecological Economics, vol. 68, no. 5, pp. 1535-1548.
RID (2007) GIS data [CD-ROM]. The Royal Irrigation Department. Rodriguez, J. M., Molnar, J. J., Fazio, R. A., Sydnor, E., & Lowe, M. J. (2009) "Barriers to adoption
of sustainable agriculture practices: change agent perspectives", Renewable Agriculture and Food Systems, vol. 24, no. 1, pp. 60-71.
Rogers, A. (1996) Taking Action: An Environmental Guide for You and Your Community. New York: UN Environment Programme and UN-Non Governmental Liaison Service.

214
Roitner-Schobesberger, B., Darnhofer, I., Somsook, S., & Vogl, C. R. (2008) "Consumer perceptions of organic foods in Bangkok, Thailand", Food Policy, vol. 33, no. 2, pp. 112-121.
Rolfe, J., Wake, J., Higham, W., Windle, J., & Trendell, P. (2008) Best management practice adoption in the sugar industry for improving water quality: the Mackey Whitsunday region. CIRM Occasional paper. Queensland: Consortium for Integrated Resource Management.
Rollett, A., Haines-Young, R., Potschin, M., & Kumar, P. (2008), Delivering environmental services through agri-environment programmes: a scoping study. EO0300011 - FC 73-03-03-54. Notthingham: Centre for Environmental Management,The University of Nottingham.
Rosa, H., Barry, D., Kandel, S., & Dimas, L. (2004) Compensation for environmental services and rural communities: lessons from the Americas. Working paper series No. 96. Massachusetts: Political Economy Research Institute, University of Massachusetts Amherst.
Rose, C. M. (2002) "Common Property, Regulatory Property, and Environmental Protection: Comparing Community-based Management and Tradable Environmental Allowances," in E. Ostrom, T. Dietz, N. Dolsak, P.C. Stern, S. Stovich & E.U. Weber (eds.) The Drama of the Commons. Washington, D.C.: National Academy Press, pp. 233-258.
Ross, M. H. & Stiles, D. (1973) "An exception to the Law of Demand", The Journal of Consumer Affairs, vol. 7, no. 2, pp. 128-144.
Ruhl, J. B. (2008) "Agriculture and ecosystem services: strategies for state and local governments", NYU Environmental Law Journal, vol. 17, no. 1, pp. 424-459.
Saengcharoen, W., Chongsuvivatwong, V., Lerkiatbundit, S., & Wongpoowarak, P. (2008) "Factors influencing dispensing of antibiotics for upper respiratory infections among Southern Thai community pharmacists", Journal of Clinical Pharmacy and Therapeutics, vol. 33, no. 2, pp. 123-129.
Sajjakulnukit, B. & Verapong, P. (2003) "Sustainable biomass production for energy in Thailand", Biomass and Bioenergy, vol. 25, no. 5, pp. 557-570.
Sakuyama, T. (2006) Environmental service incentives component: policy implications and guidance. Roles of Agriculture Project. Rome: The Food and Agriculture Organization of the United Nations
Salzman, J. (2005) "The promise and perils of payments for ecosystem services", Internaltional Journal of Innovation and Sustainable Development, vol. 1, no. 1/2, pp. 5-20.
Sample, D. J., Heaney, J. P., Wright, L. T., Fan, C. Y., Lai, F. H., & Field, R. (2003) Costs of best management practices and associated land for urban storm water control. EPA/600/JA-03/261. New Jersey: US Environmental Protection Agency.
Sarker, A., Ross, H., & Shrestha, K. K. (2008a) "A common-pool resource approach for water quality management: An Australian case study", Ecological Economics, vol. 68, no. 1-2, pp. 461-471.
Sarker, A., Ross, H., & Shrestha, K.K. (2008b) "Interdependence of common-pool resources: lessons from a set of nested catchments in Australia", Human Ecology, vol. 36, no. 6, pp. 821-834.
Sattler, C. & Nagel, U. J. (2010) "Factors affecting farmers' acceptance of conservation measures - A case study from north-eastern Germany", Land Use Policy, vol. 27, no. 1, pp. 70-77.
Schaffner, M. (2007) Applying a Material Flow Analysis model to Assess River Water Pollution and Mitigation Potentials: A Case-Study in the Thachin River basin, Central Thailand. PhD thesis. University of Bern, Switzerland [Online]. Available at: http://www.zb.unibe.ch/download/eldiss/07schaffner_m.pdf (Accessed: 16 March 2010).
Schlager, E. & Ostrom, E. (1992) "Property-rights regimes and natural-resource: a conceptual analysis", Land Economics, vol. 68, no. 3, pp. 249-262.
Schmolck, P. (2002) PQMethod 2.11 [Computer programme]. Available at: http://www.lrz-muenchen.de/~schmolck/qmethod/downpqx.htm (Accessed: 26 August 2008).
Schönhart, M., Schauppenlehner, T., Schmid, E., & Muhar, A. (2010) "Integration of bio-physical and economic models to analyze management intensity and landscape structure effects at farm and landscape", Agricultural Systems. doi:10.1016/j.agsy.2010.03.014. In press.
Schuster, J. L. (1996) Soil and vegetation management: keys to water conservation on rangeland. E-168. Texas Agricultural Extension Service. Available at: http://lubbock.tamu.edu/irrigate/documents/2074410-E168.pdf. (Accessed: 18 August 2010).

215
Segerson, K. & Wu, J. (2006) " Nonpoint pollution control: inducing first-best outcomes through the use of threats", Journal of Environmental Economics and Management, vol. 51, pp. 165-184.
SEPA (2008) Have your say on improving the quality of our water environment. Tay draft area management plan 2009-2015. Edinburgh: Scottish Environment Protection Agency.
SEPA (2010) SEPA Agricultural Best Management Practices (BMPs). Scottish Environment Protection Agency. Available at:
Setia, P. P. & Johnson, G. V. (1988) "Soil conservation management sytems under uncertainty", North Central Journal of Agricultural Economics, vol. 10, no. 1, pp. 111-124.
http://apps.sepa.org.uk/bmp/Default.aspx. (Accessed: 9 August 2010).
Sharpley, A.N., Kleinman, P.J.A., Jordan, P., Bergstrom, L., & Allen, A.L. (2009) Evaluating the success of phosphorous management from field to watershed. Journal of Environmental Quality, vol. 38, no. 5, pp. 1981-1988.
Sheikh, A. D., Rehman, T., & Yates, C. M. (2003) "Logit models for identifying the factor that influence the uptake of new 'no-tillage' technologies by farmers in the rice-wheat and the cotton-wheat farming systems of Pakistan's Punjab", Agricultural Systems, vol. 75, no. 1, pp. 79-95.
Shogren, J. F. & Taylor, L. O. (2008) "On behavioural-Environmental Economics", Review of Environmental Economics and Policy, vol. 2, no. 1, pp. 26-44.
Sierra, R. & Russman, E. (2006) "On the efficiency of environmental service payments: a forest conservation assessment in the Osa Peninsula, Costa", Ecological Economics, vol. 59, no. 1, pp. 131-141.
Silverman, D. (2006) Interpreting Qualitative Data. 3rd edn. London: SAGE. Smith, K. R. (2006) "Public payments for environmental services from agriculture: precedents and
possibilities", American Journal of Agricultural Economics, vol. 88, no. 5, pp. 1167-1173. Smith, V. K. & Pattanayak, S. K. (2002) "Is meta-analysis a Noah's Ark for non-market valuation?",
Environmental and Resource Economics, vol. 22, no. 1-2, pp. 271-296. Smith, V. K., van Houtven, G., & Pattanayak, S. K. (2002) "Benefit transfer via preference
calibration: "prudential algebra" for policy", Land Economics, vol. 78, no. 1, pp. 132-152. Smith, V. L. (2005) "Behavioral economics research and the foundations of economics", The Journal
of Socio-Economics, vol. 34, no. 2, pp. 135-150. Soule, M. J. & Tegene, A. W. K. D. (2000) "Land tenure and the adoption of conservation practices",
American Journal of Agricultural Economics, vol. 82, no. 4, pp. 993-1005. Spash, C. L. & Biel, A. (2002) "Social psychology and economics in environmental research",
Journal of Economic Psychology, vol. 23, no. 5, pp. 551-555. Spash, C. L. & Hanley, N. (1995) "Preferences, information and biodiversity preservation",
Ecological Economics, vol. 12, no. 3, pp. 191-208. Spash, C. L., Urama, K., Burton, R., Kenyon, W., Shannon, P., & Hill G. (2009) "Motives behind
willingness to pay for improving biodiversity in a water ecosystem: economics, ethics and social psychology", Ecological Economics, vol. 68, no. 4, pp. 955-964.
Sriwichailamphan, T., Sriboonchitta, S., Wiboonpongse, A., & Chaovanapoonphol, Y. (2008) "Factors affecting Good Agricultural Practice in pineapple farming in Thailand", in P. J. Batt & T. D. Vien (eds.) Proceedings of the Second International Symposium on Improving the Performance of Supply Chains in the Transitional Economies. Leuven: International Society for Horticultural Science, pp. 325-331. Available at: http://www.actahort.org/books/794/794_40.htm (Accessed: 13 August 2009).
Stanley, D. L. (2000) "The economic of the adoption of BMPs: the case of mariculture water management", Ecological Economics, vol. 35, no. 2, pp. 145-155.
Stavins, R. & Whitehead, B. (1992) The Greening of America's Taxes: Pollution Charges and Environmental Protection. Washington, D.C.: Progressive Policy Institute.
Steed, B. C. (2007) "Government payments for ecosystem services - lessens from Costa Rica", Journal of Land Use and Environmental Law, vol. 23, no. 1, pp. 177-202.

216
Steelman, T. A. & Maguire, L. A. (1999) "Understanding participant perspectives: Q Methodology in national forest management", Journal of Policy Analysis and Management, vol. 18, no. 3, pp. 361-388.
Stephenson, W. (1953) The study of behavior: Q-technique and its methodology. Chicago: University of Chicago Press.
Stone, G. D. (2007) "Agricultural deskilling and the spread of genetically modified cotton in Waragal", Current Anthropology, vol. 48, no. 1, pp. 67-103.
Stover, E., Hebb, J., & Motis, T. (2002) Pesticide mix-load and sprayer wash-down systems for Florida citrus. HS-871. Florida: The Institute of Food and Agricultural Sciences, University of Florida.
Sule Alonso, M., Paquin, J. P., & Levey, J. P. (2002) "Modelling perceived quality in fruit products: their extrinsic and intrinsic attributes", Journal of Food Products Marketing, vol. 8, no. 1, pp. 29-48.
Sumner, P. E. & Bader, M. J. (2009) Pesticide storage and mixing facilities. Bulletin 1095. Georgia: College of Agricultural and Environmental Sciences & Family and Consumer Sciences, The University of Georgia
Sutton, S. (1998) "Predicting and explaining intentions and behavior: how well are we doing?", Journal of Applied Social Psychology, vol. 28, no. 15, pp. 1317-1338.
Suyanto, S., Leimona, B., Permana, R. P., & Chandler, F. J. C. (2005) Review of the Development Environmental Services Market in Indonesia. Bogor: World Agroforestry Center.
Swedeen, P. (2006) "Post-normal science in practice: a Q study of the potential for sustainable forestry in Washington State, USA", Ecological Economics, vol. 57, no. 2, pp. 190-208.
Swinton, S. M., Lupi, F., Robertson, G. P., & Hamilton, S. K. (2007) "Ecosystem services and agriculture: cultivating agricultural ecosystems for diverse benefits", Ecological Economics, vol. 64, no. 2, pp. 245-252.
Swinton, S. M., Lupi, F., Robertson, G. P., & Landis, D. A. (2006) "Ecosystem services from agriculture: looking beyond the usual suspects", American Journal of Agricultural Economics, vol. 88, no. 5, pp. 1160-1166.
Takoukam, P. T. & Morita, S. (2008) A policy and legal framework supporting payments for ecosystem services. Annual Review: July 2007-June 2008(FY08). Washington, D.C.: The World Bank.
ten Klooster, P. M., Visser, M., & de Jong, M. D. T. (2008) "Comparing two image research instruments: The Q-sort method versus the Likert attitude questionnaire", Food Quality and Preference, vol. 19, no. 5, pp. 511-518.
Tenge, A. J., de Graaff, J., & Hella, J. P. (2004) "Social and economic factors for adoption of soil and water conservation in West Usambara Highlands, Tanzania", Land Degradation and Development, vol. 15, no. 2, pp. 99-114.
Tetiwat, O. & Huff, S. L. (2003) "Factors Influencing the Acceptance of Web-Based Online Education for Thai Educators: Impact of Thai Culture and Values," in T. Thanasankit (ed.) E-Commerce and Cultural Values. Pennsylvania: IGI Publishing, pp. 236-266.
The Royal Government Gazette B.E. 2537 (1994). Volume 111, Part 16, 1994. The World Bank (2000) Thailand environment monitor 2000: the 'Green' environmental agenda.
Bangkok: The World Bank. The World Bank (2001) Thailand environment monitor 2001: water quality. Bangkok: The World
Bank. The World Bank (2004) Thailand: country development partnership – environment. Bangkok: The
World Bank. Thomas, D. E. (2006) Participatory watershed management for Ping river basin. Final report.
Bangkok: Natural Resources and Environmental Policy and Planning. Thurston, H. W. (2006) "Opportunity costs of residential best management practices for stormwater
runoff control", Journal of Water Resource Planning and Management, vol. 132, no. 2, pp. 89-96.

217
Thuy, P. T., Campbell, B. M., Garnett, S., Aslin, H., & Ha, H. M. (2010) "Importance and impacts of intermediary boundary organizations in facilitating payment for environmental services in Vietnam", Environmental Conservation, vol. 37, no. 1, pp. 64-72.
Tjernstrom, E. & Tietenberg, T. (2008) "Do differences in attitudes explain differences in national climate change policies?", Ecological Economics, vol. 65, no. 2, pp. 315-324.
Tomich, T. P., Thomas, D. E., & van Noordwijk, M. (2004) "Environmental services and land use change in Southeast Asia: from recognition to regulation or reward?", Agriculture, Ecosystems and Environment, vol. 104, no. 1, pp. 229-244.
Tonmanee, N. & Kanchanakool, N. (1999) "Agricultural diffuse pollution in Thailand", Water Science and Technology, vol. 39, no. 3, pp. 61-66.
Traore, N., Landry, R., & Amara, N. (1998) "On-farm adoption of conservation practices: the role of farm and farmer characteristics, perceptions, and health hazards", Land Economics, vol. 74, no. 1, pp. 114-127.
Tversky, A. & Kahenman, D. (1986) "Rational choice and the framing of decisions", The Journal of Business, vol. 59, no. 4, pp. 251-278.
UNESCAP (2009) Innovative socio-economic policy for improving environmental performance: payments for ecosystem services. Bangkok: United Nations Economic and Social Commission for Asia and the Pacific.
Unrau, Y. A. (1998) "Understanding and interpreting polytomous logistic regression: applications to research on social work practice", Research on Social Work Practice, vol. 8, no. 2, pp. 223-235.
US Army Center for Public Works (1997) Design and construction of a pesticide storage and mixing facility. Public Works Technical Bulletin No. 420-76-2. Virginia: Department of the Army, US Army Center for Public Works.
US EPA (2000) Water quality/quantity BMPs for Indian river area citrus groves. Florida: Indian River Research and Educational Center, US Environmental Protection Agency.
US EPA (2003) National management measures to control nonpoint pollution from agriculture. EPA 841-B-03-004. Washington, D.C.: U.S. Environmental Protection Agency.
US EPA (2004) The use of best management practices in urban watersheds. EPA/600/R-04/184. Washington, D.C.: US Environmental Protection Agency.
US EPA (2008) Development document for proposed effluent guidelines and standards for the construction and development category. Washington, D.C.: United States Environmental Protection Agency.
US EPA (2010) Watershed planning: glossary of terms. US Environmental Protection Agency. [Online]. Available at: http://iaspub.epa.gov/watershedplan/informationSource.do?pageId=56&navId=44&range=a. (Accessed: 24 January 2010).
USDA & Mississippi State University. (1999) Water related Best Management Practices in the landscape. Mississippi State University . Available at:
Valentin, L., Bernardo, D. J., & Kastens, T. L. (2004) "Testing the empirical relationship between best management practice adoption and farm profitability", Review of Agricultural Economics, vol. 26, no. 4, pp. 489-504.
http://abe.msstate.edu/csd/NRCS-BMPs/contents.html (Accessed: 7 August 2010)
van den Bergh, J. C. J. M., Ferrer-i-Carbonell, A., & Munda, G. (2000) "Alternative models of individual behaviour and implications for environmental policy", Ecological Economics, vol. 32, no. 1, pp. 43-61.
van Exel, J. & de Graaf, G. (2005) Q methodology: a sneak preview. Available at: www.jobvanexel.nl (Accessed 9 January 2010).
van Gossum, P., Luyddsert, S., Serbruyns, I., & Mortier, F. (2005) "Forest groups as support to private forest owners in developing close-to-nature management", Forest Policy and Economics, vol. 7, no. 4, pp. 589-601.
van Liere, K. & Dunlap, R. (1980) "The social bases of environmental concern: a review of hypotheses, explanations, and empirical evidence", Public Opinion Quarterly, vol. 44, no. 2, pp. 181-197.

218
van Raaij, W. F. (1981) "Economic psychology", Journal of Economic Psychology, vol. 1, no. 1, pp. 1-24.
Vanclay, F., Howden, P., Mesiti, L., & Glyde, S. (2006) "The social and intellectual construction of farming styles: testing Dutch ideas in Australian agriculture", Sociologia Ruralis, vol. 46, no. 1, pp. 61-82.
Vanhonacker, F., Verbeke, W., van Poucke, E., & Tuyttens, F. A. M. (2007) "Segmentation based on consumers' perceived importance and attitude toward farm animal welfare", International Journal of Sociology of Food and Agriculture, vol. 15, no. 3, pp. 84-100.
Vatn, A. (2009) "An institutional analysis of payments for environmental services", Ecological Economics, vol. 69, no. 6, pp. 1245-1252.
Vaughan, W. J., Darling, A. H., & Rodriguez, D. J. (2000) Uncertainty in the economic appraisal of water quality improvement investments: the case for project risk analysis. Technical paper series, No. ENV-137. Washington, D.C.: Inter-American Development Bank.
Veith, T. L. (2002) Agricultural BMP placement for cost-effective pollution control at the watershed level. PhD Thesis. Faculty of Virginia Polytechnic Institute and State University. Available at:
Venkatachalam, L. (2008), "Behavioural economics for environmental policy", Ecological Economics, vol. 67, no. 4, pp. 640-645.
http://citeseerx.ist.psu.edu/ (Accessed: 7 September 2010).
Vinten, A. J. A., Booth, P., MacLeod, M., Urama, K., Lago, M., Moran, D., & Jones, M. (2008) "A potential framework for national and local scale cost: effectiveness and cost: benefit analysis of phosphorous pollution mitigation of surface freshwater bodies", in SAC/SEPA Biennial Conference Agriculture and the Environment VII Land Management in a Changing Environment. Edinburgh: Scottish Agricultural College,pp. 127-133.
Vinten, A. J. A., Donnelly, S., Ball, B. C., Crawford, C. E., Ritchie, R. M., & Parker, J. P. (2006) "A field trial to evaluate the pollution potential to ground and surface waters from woodchip corrals for overwintering livestock outdoors", Soil Use and Management, vol. 22, no. 1, pp. 82-94.
Vinten, A. J. A., Lewis, D. R., McGechan, M. B., Duncan, A., Aitken, M., Hill, C., & Crawford, C. (2004) "Predicting the effect of livestock inputs of E.coli on microbiological compliance of bathing waters", Water Research, vol. 38, no. 14-15, pp. 3215-3224.
Volk, M., Hirschfeld, J., Dehnhardt, A., Schmidt, G., Bohn, C., Liersch, S., & Gassman, P. W. (2008) "Integrated ecological-economic modelling of water pollution abatement management options in the Upper Ems river basin", Ecological Economics, vol. 66, no. 1, pp. 66-76.
Wang, X. (2006) "Management of agricultural nonpoint source pollution in China: current status and challenges", Water Science and Technology, vol. 53, no. 2, pp. 1-9.
Water Quality Management Bureau (2006) Wastewater Management Approaches (2006-2009) (in Thai). 2nd edn. Bangkok: Pollution Control Department.
Watts, S. & Stenner, P. (2005) "Doing Q methodology: theory, method and interpretation", Qualitative Research in Psychology, vol. 2, no. 1, pp. 67-91.
Wauters, E., Bielders, C., Poesen, J., Govers, G., & Mathijs, E. (2010) "Adoption of soil conservation practices in Belgium: an examination of the theory of planned behaviour in the agri-environmental domain", Land Use Policy, vol. 27, no. 1, pp. 86-94.
Webler, T. & Tuler, S. (2001) "Public participation in watershed management planning: views on process from people in the field", Human Ecology Review, vol. 8, no. 2, pp. 29-39.
Webler, T., Danielson, S., & Tuler, S. (2009) Using Q method to revedal social perspectives in environmetnal research. Massachesetts: Social and Environmental Research Institute.
Wertz-Kanounnikoff, S. (2006) Payments for environmental services - a solution for biodiversity conservation?Report number 12. Paris: IDDRI.
Westergren, A., Karlsson, S., Andersson, P., Ohlsson, O., & Hallberg, I. R. (2001) "Eating difficulties, need for assisted easting, nutritional status and pressure ulcers in patients admitted for stroke rehabilitation", Journal of Clinical Nursing, vol. 10, no. 2, pp. 257-269.
Wheaton, R. Z. & Monke, E. J. (2001) Terracing as a 'Best Management Practice' for controlling erosion and protecting water quality. Agricultural Engineering Department, Purdue University.

219
Available at:
Whitten, S., Salzman, J., Shelton, D., & Proctor, W. (2003) "Markets for ecosystem services: applying the concepts", The 47th Annual Conference of the Australian Agricultural and Resource Economics Society. Available at:
http://www.extension.purdue.edu/extmedia/AE/AE-114.html (Accessed: 7 August 2010).
http://www.ecosystemservicesproject.org/html/publications/docs/Markets_AARES2003.pdf (Accessed: 15 December 2006).
Whittington, D. (2002), "Improving the performance of contingent valuation studies in developing countries", Environmental and Resource Economics, vol. 22, no. 1, pp. 323-367.
Whittington, D. (2004) "Ethical issues with contingent valuation surveys in developing countries: a note on informed consent and other concerns", Environmental and Resource Economics, vol. 28, no. 4, pp. 507-515.
Wieland, R., Parker, D., Gans, W., & Martin, A. (2009) Costs and cost efficiencies for some nutrient reduction practices in Maryland. Report under award No. NA07NOS4190161. Maryland: Department of Agricultural and Resource Economics, University of Maryland.
Willock, J., Deary, I., Edward-Jones, G., Gibson, G., McGregor, M., Sutherland, A., Dent, B., Morgan, O., & Grieve, R. (1999) "The role of attitudes and objectives in farmer decision making: business- and environmentally-oriented behaviour in Scotland", Journal of Agricultural Economics, vol. 50, no. 2, pp. 286-303.
Woodhead, A., Legg, W., & Packham, R. (2004) "Developing policy for communities managing diffuse source pollution: a case study from subtropical catchment of NSW, Australia", International Journal of Agricultural Sustainability, vol. 2, no. 1, pp. 43-54.
Wossink, G. A. A. & Osmond, D. L. (2002) "Farm economics to support the design of cost-effective best management practice (BMP) programs to improve water quality: nitrogen control in the Neuse river basin, North Carolina", Journal of Soil and Water Conservation, vol. 57, no. 4, pp. 213-220.
Woznick, G. D. (1987) "Human capital, information, and the early adoption of new technology", The Journal of Human Resources, vol. 22, no. 1, pp. 101-112.
Wu, S. S. & Annis, D. H. (2007) "Asymptotic efficiency of majority rule relative to rank-sum method for selecting the best population", Journal of Statistical Planning and Inference, vol. 137, no. 6, pp. 1838-1850.
Wunder, S. (2005) Payments for environmental services: some nuts and bolts. Occasional Paper No.42. Bogor Barat: Center for International Forestry Research.
Wunder, S. (2006) "Are direct payments for environmental services spelling doom for sustainable forest management in the tropics?", Ecology and Society, vol. 11, no. 2, p. 23.
Wunder, S. (2007), "The efficiency of payments for environmental services in tropical conservation", Conservation Biology, vol. 21, no. 1, pp. 48-58.
Wunder, S., Bui, D. T., & Ibarra, E. (2005) Payment is good, control is better: why payments for forest environmental services in Vietnam have so far remained incipient. Bogor Barat: Center for International Forestry Research.
Wunder, S., Engel, S., & Pagiola, S. (2008) "Taking stock: a comparative analysis of payments for environmental services programs in developed and developing countries", Ecological Economics, vol. 65, no. 4, pp. 834-852.
Xepapadeas, A. P. (1995) "Observability and choice of instrument mix in the control of externalities", Journal of Public Economics, vol. 56, pp. 485-498.
Yang, Q., Zhao, Z. Y., Benoy, G., Chow, I. L., Rees, H. W., Bourque, C. P. A., & Meng, F.-R. (2009) "A watershed-scale assessment of cost-effectiveness of sediment abatement with flow diversion terraces", Journal of Environmental Quality, vol. 39, no. 1, pp. 220-227.
Yeager, T. (2007) "BMPs can help solve surface water-quality issues", American Nurseryman, vol. 205, no. 12, pp. 62-63.
Yiridoe, E., Bonti-Ankomah, S., & Ralph, C. (2005) "Comparison of consumer perceptions and preference toward organic versus conventionally produced foods: a review and update of the literature", Renewable Agriculture and Food Systems, vol. 20, no. 4, pp. 193-205.

220
Young, O. R. (2002) The Institutional Dimensions of Environmental Change: Fit, Interplay, and Scale. London: MIT Press.
Yzer, M. C., Cappella, J. N., Fishbein, M., Harnik, R., Sayeed, S., & Ahern, R. K. (2004) "The role of distal variables in behavior change: Effects of adolescents' risk for marijuana use on intention to use marijuana", Journal of Applied Social Psychology, vol. 34, no. 6, pp. 1229-1250.
Zentner, R. P., Wall, D. D., Nagy, C. N., Smith, E. G., Young, D. L., Miller, P. R., Campbell, C. A., McConkey, B. G., Brandt, S. A., Lafond, G. P., Johnston, A. M., & Derksen, D. A. (2002) "Economics of crop diversification and soil tillage opportunities in the Canadian prairies", Agronomy Journal, vol. 94, no. 2, pp. 216-230.
Zerbe, R. O. & McCurdy, H. (2000) "The end of market failure", Regulation, vol. 23, no. 2, pp. 10-14. Zhou, S., Herzfeld, T., Glauben, T., Zhang, Y., & Hu, B. (2008) "Factor affecting Chinese farmers'
decisions to adopt a water-saving technology", Canadian Journal of Agricultural Economics, vol. 56, pp. 51-61.
Zhou, X., Helmers, M. J., Al-Kaisi, M., & Hanna, H. M. (2009) "Cost-effectiveness and cost-benefit analysis of conservation management practices for sediment reduction in an Iowa agricultural watershed", Journal of Soil and Water Conservation, vol. 64, no. 5, pp. 314-323.
Zubair, M. & Garforth, C. (2006) "Farm level tree planting in Pakistan: the role of farmer's perception and attitudes", Agroforestry Systems, vol. 66, no. 3, pp. 217-229.

221
Annex 1: Current Payment for Watershed Services Programmes Project area Country Market driver Commodity Payment mechanism References Bermajo river basin Argentina and
Bolivia G & Mul Org Designed contract Pooled- transaction/ OTC-
user fee Organization of American States (2005)
Hunter river Australia G Credit scheme/ emission trade
G intermediary-based/ clearing house/ auction
Environmental Protection Authority (2003)
Liverpool Plains Australia G & NGOs Credit scheme Auction Liverpool Plains Land Management Committee and WWF (2005)
Bubble licensing Australia G Emission trade G intermediary-based Kraemer et al. (2003) Macquarie river Australia G & C Credit scheme G intermediary-based/ pooled-
transaction Perrot-Maître and Davis (2001)
NSW/ dry land salinity Australia G Emission trade Auction Landell-Mills and Porras (2002); Perrot-Maître and Davis (2001)
Piracicaba river Brazil G Right re-allocation G intermediary-based UN-HABITAT (2006) State of Parana Brazil G Right re-allocation Redistribution mechanism Mayrand and Paquin (2004); Perrot-
Maître and Davis (2001); Monzoni (2001)
Ribeira do Iguape Brazil G Right re-allocation G intermediary-based Monzoni (2001) Minas Gerais Brazil G Right re-allocation G intermediary-based Mayrand and Paquin (2004); Monzoni
(2001) Paraiba do Sul river Brazil G Right re-allocation G intermediary-based Diz and Soeftestad (2004) RSP Canada C & G Designed contract G intermediary-based United Nations (2005) The Greencover Canada G Designed contract/
scientific proof G intermediary-based Agriculture and Agri-Food Canada
(2007) Beijing, Hebei, Shanxi China G Right re-allocation Internal trading MWR (2003) Jianxi province China G Right re-allocation Direct negotiation/ G
intermediary-based/ OTC-user fee
Liu (2002)
Jinhua river China G Right re-allocation Direct negotiation/ G intermediary-based
Liu (2005)
Qujiang China G Right re-allocation G intermediary-based Bautista (2003) Wuhua China G Land tenure
transfer G intermediary-based Deyi (1996)

222
Project area Country Market driver Commodity Payment mechanism References Valle del Cauca Columbia C & G Right re-allocation C intermediary-based/pooled-
transaction/ OTC-user fee Perrot-Maître and Davis (2001); Echavarria (2000); Echavarria and Lochman (1998)
RACs Columbia G Right re-allocation G intermediary-based Rodriguez Becerra and Ponce de Leon (1999)
Energia Global Costa Rica G Designed contract G & NGOs intermediary-based/ pooled-transaction/ OTC-user fee
Redondo-Brenes and Welsh (2006); Russo and Candela (2006)
Platanar Costa Rica P Designed contract G & NGOs intermediary-based/ pooled-transaction/ OTC-user fee
Redondo-Brenes and Welsh (2006); Russo and Candela (2006)
Monteverda Costa Rica G Right re-allocation G intermediary-based/ pooled-transaction
Hope et al. (2007); Russo and Candela (2006); Perrot-Maître and Davis (2001)
Heredia Costa Rica G Right re-allocation Trust fund intermediary-based Kosoy et al. (2007); Redondo-Brenes and Welsh (2006)
Del Oro Costa Rica P Eco-labelling Direct negotiation Porras et al. (2006) FONAFIFO Costa Rica G & NGOs & P Right re-
allocation/ Eco-labelling
G & NGOs intermediary-based/ OTC-user fee
Redondo-Brenes and Welsh (2006); Russo and Candela (2006); Mayrand and Paquin (2004)
Pimampiro Ecuador C & NGOs Right re-allocation NGOs intermediary-based Echavarria et al. (2003) Cuenca city Ecuador G Right re-allocation G & C intermediary-based/
OTC-user fee Echavarria et al. (2003)
Yanuncay Ecuador C Designed contract Direct negotiation/ G intermediary-based
Echavarria et al. (2003)
Quito Ecuador G Designed contract/ right re-allocation
Trust fund intermediary-based/ pooled transaction/ OTC-user fee
Echavarria (2002)
AEMs Estonia G Designed contract G intermediary-based United Nations (2005) AEMs EU G Designed contract G intermediary-based United Nations (2005) Nestle water France P Designed contract Direct negotiation Déprés and Grolleau (2005) Auxerre France P Designed contract Direct negotiation Déprés and Grolleau (2005)

223
Project area Country Market driver Commodity Payment mechanism References Mangfall valley Germany P Designed contract Direct negotiation Déprés and Grolleau (2005) Sierra de las Minas Guatemala G Designed contract Pooled-transaction Méndez et al. (2004) El Escondido Honduras G Extra payment G intermediary-based Mayrand and Paquin (2004) Jesus de Otoro Honduras C & NGOs Designed contract/
right re-allocation NGOs intermediary-based Kosoy et al. (2007); Kosoy et al. (2005)
Himachal Pradesh India G Designed contract G intermediary-based/ internal trading
Sengupta et al. (2003)
Bhoj India G Designed contract/ eco-labelling
G intermediary-based Winrock International India (2005)
Sukhomajari India G Water right trade G intermediary-based/ pooled-transaction/OTC-user fee
Sengupta et al. (2003)
Hanyana India C Water right trade Direct negotiation Sengupta et al. (2003) Maharashtra India C Water right trade C intermediary-based Apte (2001) Madhya Pradesh India G Right re-allocation G intermediary-based Winrock International India (2005) Segara river Indonesia G Right re-allocation Direct negotiation/ G
intermediary-based Munawir et al.(2003)
Brantas river Indonesia G Right re-allocation G intermediary-based Munawir and Vermeulen (2007) Cidanau river Indonesia G Designed contract G intermediary-based Munawir et al.(2003) REPS Ireland G Designed contract G intermediary-based United Nations (2005) Coatepec Mexico G Extra payment G intermediary-based Mayrand and Paquin (2004) CONAFOR Mexico G Designed contract Trust fund intermediary-based Muñoz-Piña et al. (2005) San Pedro del Norte Nicaragua G Designed contract G intermediary-based Sustainable Agriculture and Rural
Development (2005) Maasin The
Philippines G Right re-allocation G intermediary-based Arocena-Francisco and Salas (2004)
Makiling forest reserve The Philippines
G Right re-allocation Trust fund intermediary-based/ OTC-user fee
Perrot-Maître and Davis (2001)
WfW RSA G Right re-allocation G intermediary-based King et al. (2003) Agriculture Charge RSA G Right re-allocation G intermediary-based DWAF (2003b)

224
Project area Country Market driver Commodity Payment mechanism References SFRA RSA G Emission trade OTC-user fee DWAF (2003a) Industry Charge RSA G Right re-allocation G intermediary-based DWAF (2003c) Phalaborwa barrage RSA G & NGOs Designed contract Pooled transaction CSIR and IIED (2005) Intensive farming Switzerland G Designed contract G intermediary-based United Nations (2005) Portland, Oregon USA G Designed contract/
land tenure transfer
G intermediary-based/ OTC user fee
Johnson et al. (2002)
Impaired water body USA G Emission trade G intermediary-based Federal Water Pollution Control Act (2002)
New York USA G Designed contract/ land tenure transfer
Trust fund & NGOs intermediary-based
Perrot-Maître and Davis (2001)
CRP USA G Designed contract G intermediary-based Perrot-Maître and Davis (2001) Lower Boise river USA G Credit scheme Clearing house Perrot-Maître and Davis (2001) Nutrient trading USA G Designed contract/
emission trade G intermediary-based/ clearing house
Ross & Associates Environmental Consulting (2000)
Salmon-safe USA P Eco-labelling Retail based Smith et al. (2006) Ecolotree USA P Scientific proof OTC-user fee Ecolotree (2004) Tar-Pamilco basin USA G Emission trade Clearing house Environomics (1999) Great Miami river USA G Designed contract/
credit scheme G intermediary-based Miami Conservancy District (2005)
National programme Vietnam G Designed contract/ land tenure transfer
G intermediary-based Wunder et al. (2005); Sikor (2001)
Notes: 1) G = Government agency; P = Private agency; C = Community; Mul Org = Multilateral organisation ; NGOs = Non-government organisations 2) OTC = Over the counter trade

225
Annex 2: Cost worksheet
T1 Ditch management (Cost per Rai)
No. Description Q'ty Unit Material Labour Total 1 Earthwork of 1 ditch per rai (2.0T, 0.5B x 1.0) 50 cu.m. - 45.00 2,250.00 1.1 Planning of Irrigation Routes 10% 225.00 1.2 Removing unwanted materials and trees from ditch lines 30% 675.00 1.3 Excavation 60% 1,350.00 2 Annual maintenance: Slope adjustment 60 sq.m. - 5.00 300.00 2.1 Removing unwanted plant 50% 150.00 2.2 Ditch Maintenance 50% 150.00 T2 Herbicide Application (Cost per Rai) No. Description Q'ty Unit Material Labour Total 1 Normal shadow area of citrus 3m x 3m 587.8 sq.m. - 1.00 587.76 1.1 Removing unwanted plants 100% 587.76 2 Annual soil maintenance 587.8 sq.m. - 0.50 293.88 2.1 Removing new unwanted plants 100% 293.88 T3 Pesticide application (Cost per Rai) No. Description Q'ty Unit Material Labour Total 1 Standard Equipment 0.1 Man/Rai - 1,360.00
1.1 Spraying Equipment 1.0 set
550.00 - 550.00 1.2 Gloves 1.0 set 30.00 - 30.00
1.3 Glasses 1.0 set
180.00 - 180.00
1.4 Spraying suit 1.0 set
450.00 - 450.00
1.5 Helmet 1.0 set
150.00 - 150.00 2 Annual maintenance times
2.1 Sprayer equipment calibration time
consuming
2.2 Record keeping time
consuming T4 Nutrient management (Cost per Rai) No. Description Q'ty Unit Material Labour Total 1 Soil analysis 0.1 Man/Rai 3,300.00
1.1 Organic matter test 1.0 sample
1,000.00 1,000.00
1.2 Organic fertiliser 920.0 kg
2.50 2,300.00 2 Annual maintenance 1 times 1,650.00
2.1 Organic matter test 1.0 sample
150.00 150.00
2.2 Organic fertiliser 600.0 kg
2.50 1,500.00

226
T5 Vegetative Cover (Cost per Rai) No. Description Q'ty Unit Material Labour Total
1 First-time grass growing 800.0 sq.m.
0.50
1.00 1,200.00 1.1 Seeding/Planting 50% 600.00 1.2 Plowing (tillage) 50% 600.00
2 Annual maintenance: Grass field maintenance 1600.0 sq.m.
-
0.25 400.00 2.1 Maintaining vegetative field 80% 320.00
2.2 Replanting some destroyed area 20% 80.00 T6 Mulching (Cost per Rai) No. Description Q'ty Unit Material Labour Total
1 First-time mulching (Buy-in some straw etc.) 587.8 sq.m.
0.50
1.00 881.63 1.1 Procuring straw/dried plants 50% 440.82 1.2 Improving soil surface 25% 220.41 1.3 Paving 25% 220.41
2 Annual maintenance: Field maintenance 293.9 sq.m.
-
1.00 293.88 2.1 Remulching (if necessary) 50% 146.94 2.2 Paving 50% 146.94 T7 Vegetative Buffer Strip (Cost in Lumpsum) for distance 15 m No. Description Q'ty Unit Material Labour Total
1 First-time planting (Buffer width 6m) 90.0 sq.m.
2.50
10.00 1,125.00 - including clearing, tilage, and planting 1.1 Preparing soil surface 30% 337.50 1.2 Procuring seeds/plants 5% 56.25 1.3 Planting 65% 731.25
2 Field maintenance 90.0 sq.m.
-
1.00 90.00 2.1 Vetiver trimming 70% 63.00 2.2 Replanting some destroyed area 30% 27.00 T8 Grassed Waterway (Cost per Rai) No. Description Q'ty Unit Material Labour Total 1 Earthwork of 1 ditch per rai (2.0T, 0.5B x 0.5) 1,365.00 1.1 Preparing waterway routes 25% 341.25 1.2 Excavation 50% 682.50 1.3 Seeding/Planting 25% 341.25
2 Annual maintenance 80 sq.m.
-
1.50 120.00 2.1 Maintaining grass 40% 48.00 2.2 Maintaining ditch 60% 72.00

227
T9 On-site retention pond (Cost in Lumpsum) for citrus area 1 rai No. Description Q'ty Unit Material Labour Total
1 First-time excavation (slope 1:1, depth 3 m.) 12.65 m 15,155.54
1.1 Preparing pond area 25% 4,211.85 1.2 Excavation 50% 8,423.69 1.3 Vetiver planting 25% 2,520.00 2 Annual field maintenance 306.3 cu.m. - 2.50 765.79 2.1 Vetiver trimming 70% 63.00 2.2 Replanting some destroyed area 30% 27.00 T10 Terracing (Typical Soil Terracing for Orchard Bench Terrace) No. Description Q'ty Unit Material Labour Total 1 Earthwork for slope 1: 25 1,846.53 1.1 Design&Preparing slope area 15% 276.98 1.2 Excavation + Backfill 50% 923.27
1.3 Planting of vegetative cover in between citrus lines 35% 646.29
2 Annual maintenance 935.00 2.1 Maintaining soil surface for slope&terrace area 65% 260.00 2.2 Maintaining planted area 35% 675.00 T11 Permanent mix load and wash-down site Option I (farm size < 10 rais) No. Description Q'ty Unit Material Labour Total 1 Standard Building size 2.5m x 2.5m 1.1 Excavation+Backfill 3.8 cu.m. - 55.00 206.25 1.2 RC. Slab 1.9 cu.m. 750.00 350.00 2,062.50 1.3 Block wall 24.0 sq.m. 140.00 75.00 5,160.00 1.4 Roofing 10.8 sq.m. 180.00 150.00 3,564.00 1.5 Accessories (door, window, etc.) 1.0 lumpsum 2,500.00 500.00 3,000.00 1.6 Electrical and Mechanical works 1.0 lumpsum 5000.00 2500.00 7,500.00 1.7 Chemical Storage Tank 1.0 lumpsum 7500.00 1500.00 9,000.00 1.8 Water Pump 1.0 lumpsum 3500.00 500.00 4,000.00 1.9 Miscellaneous 10% 1.0 lumpsum - - 3,449.28 Sub-Total 19,570.00 5,630.00 37,942.03 2 Standard deck 5m x 5m W/ deck 5m x 5m Excavation+Backfill 12.5 cu.m. - 55.00 687.50 RC. Slab 7.5 cu.m. 750.00 350.00 8,250.00 Sub-Total 750.00 405.00 8,937.50 2.1 Design&Preparing site 5% 446.88 2.2 Building + Pre-Load Area 50% 4,468.75 2.3 Equipment 20% 1,787.50 2.4 Labour 20% 1,787.50 2.5 Construction tools 5% 446.88 3 Yearly maintenance 1 times

228
Miscellaneous (5% of building cost) 1.0 lumpsum 2,343.98 3.1 Maintaining site condition 100% 2,343.98 Option II (farm size 10.01 - 50 rais) No. Description Q'ty Unit Material Labour Total 1 Standard Building size 4m x 4m 1.1 Excavation+Backfill 9.6 cu.m. - 55.00 528.00 1.2 RC. Slab 4.8 cu.m. 750.00 350.00 5,280.00 1.3 Block wall 38.4 sq.m. 140.00 75.00 8,256.00 1.4 Roofing 19.2 sq.m. 180.00 150.00 6,336.00 1.5 Accessories (door, window, etc.) 1.0 lumpsum 5,000.00 500.00 5,500.00 1.6 Electrical and Mechanical works 1.0 lumpsum 7500.00 2500.00 10,000.00 1.7 Chemical Storage Tank 1.0 lumpsum 7500.00 1500.00 9,000.00 1.8 Water Pump 1.0 lumpsum 3500.00 500.00 4,000.00 1.9 Miscellaneous 10% 1.0 lumpsum - - 4,890.00 Sub-Total 24,570.00 5,630.00 53,790.00 2 Standard deck 5m x 5m W/ deck 5m x 5m Excavation+Backfill 12.5 cu.m. - 55.00 687.50 RC. Slab 7.5 cu.m. 750.00 350.00 8,250.00 Sub-Total 750.00 405.00 8,937.50 2.1 Design&Preparing site 5% 446.88 2.2 Building + Pre-Load Area 50% 4,468.75 2.3 Equipment 20% 1,787.50 2.4 Labour 20% 1,787.50 2.5 Construction tools 5% 446.88 3 Yearly maintenance 1 times Miscellaneous (5% of building cost) 1.0 lumpsum 3,136.38 3.1 Maintaining site condition 100% 3,136.38 Option III (farm size > 50 rais) No. Description Q'ty Unit Material Labour Total 1 Standard Building size 6.5m x 6.5m 1.1 Excavation+Backfill 25.0 cu.m. - 55.00 1,375.00 1.2 RC. Slab 15.0 cu.m. 750.00 350.00 16,500.00 1.3 Block wall 48.0 sq.m. 140.00 75.00 10,320.00 1.4 Roofing 30.0 sq.m. 180.00 150.00 9,900.00 1.5 Accessories (door, window, etc.) 1.0 lumpsum 10,000.00 500.00 10,500.00 1.6 Electrical and Mechanical works 1.0 lumpsum 12500.00 2500.00 15,000.00 1.7 Chemical Storage Tank 1.0 lumpsum 10000.00 1500.00 11,500.00 1.8 Water Pump 1.0 lumpsum 6000.00 500.00 6,500.00 1.8 Miscellaneous 10% 1.0 lumpsum - - 8,159.50 Sub-Total 39,570.00 5,630.00 89,754.50 2 Standard deck 5m x 5m W/ deck 5m x 5m Excavation+Backfill 12.5 cu.m. - 55.00 687.50 RC. Slab 7.5 cu.m. 750.00 350.00 8,250.00 Sub-Total 750.00 405.00 8,937.50 2.1 Design&Preparing site 5% 446.88

229
2.2 Building + Pre-Load Area 50% 4,468.75 2.3 Equipment 20% 1,787.50 2.4 Labour 20% 1,787.50 2.5 Construction tools 5% 446.88 3 Yearly maintenance 1 times Miscellaneous (5% of building cost) 1.0 lumpsum 4,934.60 3.1 Maintaining site condition 100% 4,934.60
T12 Riparian Setback (for an area of 1,296 m2) No. Description Q'ty Unit Material Labour Total 1 First-time planting (Buffer width 36m) 1296.0 sq.m. 0.50 3.50 5,184.00 - including clearing, tilage, and planting 1.1 Preparing riparian area 25% 1,296.00 1.2 Planting/Seeding 75% 3,888.00 2 Annual maintenance 1296.0 sq.m. - 0.50 648.00 2.1 Maintaining riparian plant 70% 453.60 2.2 Replanting some destroyed area 30% 194.40

230
Annex 3: Cost estimate of a mix-load and wash-down site
Assumptions & Calculations:
1. The permanent station comprises of Installation costs
a. Wash-down and mixing –loading area, and b. Pesticide storage area
The literatures show that the size of functional areas of an operation is dependent on the amount of pesticide stored at the facility and the number of employees (Kammel and O’Neil 1990). Thus, the wash-down and mix-load area will be treated as fixed installation cost, while the storage area will be treated as variable installation cost. The total cost has a characteristic of mixed-cost with a step-function relationship with farm size.
Further, the maintenance cost and opportunity cost will vary depending on the total mixed-cost
2. For the fixed installation cost it is assumed that the effective functional area of wash-down and mixing-loading area is 5m x 5m (or 25 m2) for every farm size. The total fixed installation cost is 1,787.50/ rai/ year
3. For the variable installation cost, based on the observation of chemical purchasing behaviour of farmers the analysis will divide farm size into three categories. These are
a. Farm size < 10 rais b. 10.01 – 50 rais, and c. Farm size > 50 rais
4. It is assumed that the chemical procurement is done twice a year.
5. A basic 2-storey shelf with an area of 1m2 can store pesticide package sized 2m2.
6. A work by Dean (2004) states that at least 10% more space than that needed for the largest amount of pesticide even expected to be stored is what farmer must have. The total amount of pesticide to be stored is calculated based on the pesticide application surveyed by Uchiyama et al. (2007).
7. The storage was calculated based on engineer estimation
Farm size (rai) Storage area required (m2) < 10 rais 2.5m x 2.5m = 6.25 m2
10.01 – 50 rais 4m x 4m = 16m2 > 50 rais 6.5m x 6.5m = 42.25m2
8. The total variable costs is thus,
Farm size (rai) Total variable cost (THB)/ rai/ year < 10 rais 7,588.41
10.01 – 50 rais 10,758.00 > 50 rais 17,950.90

231
9. A step function of total cost and farm size is plotted to find a representative equation.
7,588.41
10,758.00
17,950.90
9,375.91
12,545.50
19,738.40
y = 5181.2x + 3524.1
-
5,000.00
10,000.00
15,000.00
20,000.00
25,000.00
5 30 131
Farm size (rai)
Costs (THB)FC
VC
TC
Linear (TC)
10. The total cost equation show that the average total installation costs is 5,181.20THB/ rai/
year
1. The maintenance cost is 5% of total installation costs. Thus,
Maintenance costs
Farm size (rai) Total maintenance cost (THB)/ rai/ year < 10 rais 468.80
10.01 – 50 rais 627.72 > 50 rais 5,654.26
2. A step function of total maintenance cost and farm size is plotted to find a representative equation
468.80
627.28
986.92
y = 259.06x + 176.21
-
200.00
400.00
600.00
800.00
1,000.00
1,200.00
5 30 131
Farm size (rai)
Cost (THB)
VC Maintenance
Linear (VCMaintenance)
3. The total cost equation show that the average total maintenance costs is 259.06THB/ rai/ year

232
1. The opportunity cost is as follows:
Opportunity costs
Farm size (rai) Land opportunity cost (THB)/ rai/ year < 10 rais 5,121.84a
10.01 – 50 rais 7,682.76b
> 50 rais 12,804.60c
Notes: a) four trees removed; b) six trees removed; c) ten trees removed
2. A step function of total opportunity cost and farm size is plotted to find a representative equation
3. The total cost equation shows that the average total opportunity costs is 3,841.40THB/ rai/
year based on the returns over variable costs (THB1,280.46 per tree)

233
Annex 4: Questions for elicitation study
Guide for Interviewer Good morning. We are from … and we conduct a study of citrus growers in the Ping river basin. We are interested in the reasons why growers do or do not adopt BMPs in their farms. Please tell us what you are really thinking. There is no right or wrong answer. The scenarios describing 1) benefits from watershed services, 2) effects of farm nonpoint source pollution, and 3) BMPs will be given to participants, and then questions will be asked. Participants will be notified that
- BMPs are voluntary measure which is likely to be promoted by the state government in the near future.
- There is no ideal management practices system for controlling a particular pollutant in all situations. The system should be designed based on the type of pollutant, the source of the pollutant, the cause of pollutant, the agricultural climatic and environmental conditions, and the willingness and ability of the citrus growers in implement and maintain the practices. A: Background Name: ……………………………………. Age: ………. years Gender: ………..Male ……….Female Address: ……………………………………… B: Intentions 1 Given three scenarios, will you adopt BMPs? (yes/no) 2 On the scale 1 to 7, how difficult is it for you to make a decision? (1 = not at all difficult, 7 =
extremely difficult) ……………. C: Attitudes 3 What do you believe are the advantages of BMPs adoption? 4 What do you believe are the disadvantages of BMPs adoption? 5 Is there anything else you associate with your own views about BMPs adoption? D: Subjective norms 6 Are they any individual or groups who would support or facilitate if you are going to adopt
BMPs? 7 Are they any individual or groups who would resist or retard if you are going to adopt BMPs? 8 Is there anything else you associate with other people’s views about BMPs adoption? E: Perceived behavioural control 9 What factors or circumstances enable you to adopt BMPs? 10 What factors or circumstances make it difficult or impossible for you to adopt BMPs? 11 Are there any other issues that come to mind when you think about BMPs adoption? F: Current situation 12 At present, is there any conservation practice done in you fields, and if ‘yes’ what? 13 In your opinion, which practices are likely to be done (by yourself) in your farm, and which
practices should be promoted by external agencies such as government, farmer association?

234
Thai version

235

236
Annex 5: Final questionnaire

237

238

239

240
Thai version

241

242

243

244
Annex 6: Illustrations for presentation Roles of watershed services
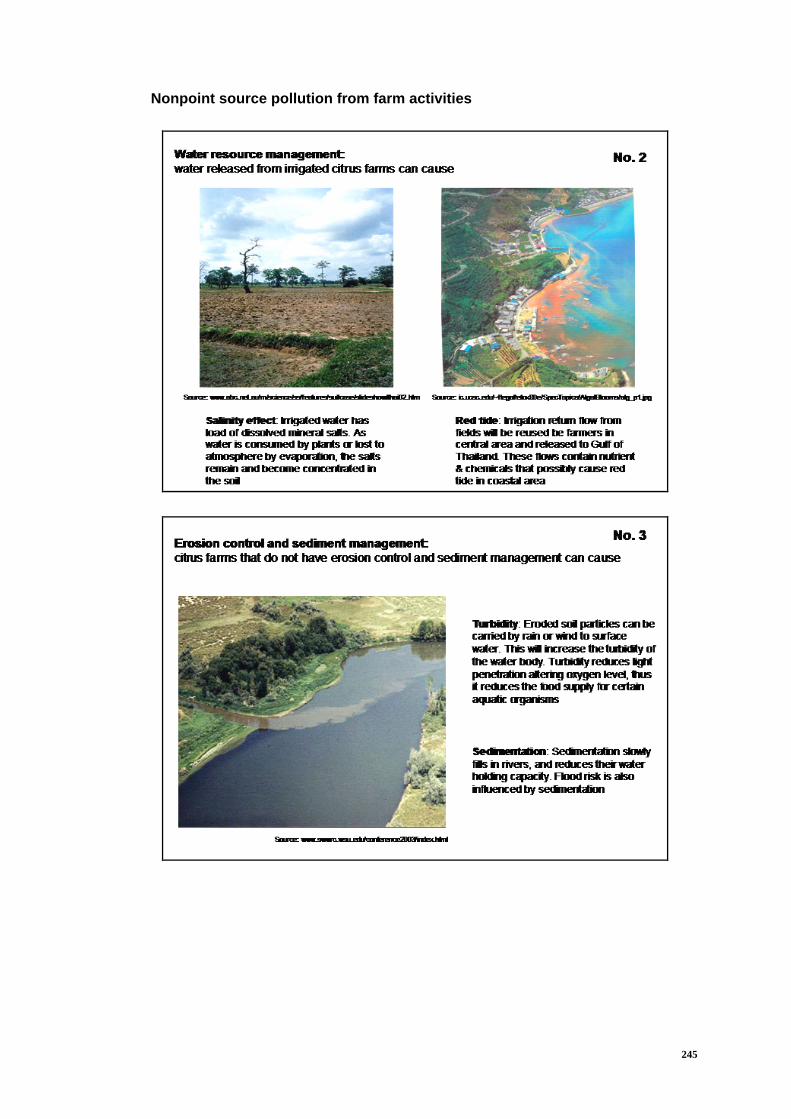
245
Nonpoint source pollution from farm activities

246

247
Twelve BMPs by categories Good Husbandry
Vegetative Practices

248
Structural Practices

249
Water quality map

250
Annex 7: Forward stepwise methods to select psychological variables (SPSS 16.0) Nominal Regression [DataSet1] H:\nan_SPSS\analysis\DUMMY\Dummy new cutpoffpoint.sav
Step Summary
Model Action Effect(s)
Model Fitting Criteria Effect Selection Tests
AIC BIC -2 Log
Likelihood Chi-Squarea df Sig.
Step 0 0 Entered Intercept 340.065 346.834 336.065 . Step 1 1 Entered PBC1g3 335.615 349.153 327.615 8.451 2 .015 Step 2 2 Entered PBC2g2 330.383 350.690 318.383 9.232 2 .010 Step 3 3 Entered SN1g2 327.587 354.662 311.587 6.796 2 .033 Step 4 4 Entered SN1g3 321.767 355.612 301.767 9.820 2 .007
5 Removed PBC1g3 322.111 349.187 306.111 4.344 2 .114 Stepwise Method: Forward Stepwise a. The chi-square for entry is based on the likelihood ratio test.
Model Fitting Information
Model
Model Fitting Criteria Likelihood Ratio Tests
AIC BIC -2 Log
Likelihood Chi-
Square df Sig.
Intercept Only 340.065 346.834 336.065 Final 322.111 349.187 306.111 29.954 6 .000
Goodness-of-Fit
Chi-Square df Sig.
Pearson 420.348 420 .486 Deviance 301.952 420 1.000
Pseudo R-Square
Cox and Snell .128 Nagelkerke .163 McFadden .088
Likelihood Ratio Tests
Effect
Model Fitting Criteria Likelihood Ratio Tests
AIC of Reduced Model
BIC of Reduced Model
-2 Log Likelihood of Reduced Model Chi-Square df Sig.
Intercept 322.111 349.187 3.061E2 .000 0 . PBC2g2 326.574 346.881 314.574 8.463 2 .015 SN1g3 333.586 353.893 321.586 15.475 2 .000 SN1g2 332.114 352.421 320.114 14.003 2 .001 The chi-square statistic is the difference in -2 log-likelihoods between the final model and a reduced model. The reduced model is formed by omitting an effect from the final model. The null hypothesis is that all parameters of that effect are 0. a. This reduced model is equivalent to the final model because omitting the effect does not increase the degrees of freedom.

251
Parameter Estimates
Category of the 1st ordera B Std. Error Wald df Sig. Exp(B)
95% Confidence Interval for Exp(B)
Lower Bound
Upper Bound
Vegetative practice
Intercept .252 1.163 .047 1 .828
[PBC2g2=0] .899 .488 3.400 1 .065 2.457 .945 6.388
[PBC2g2=1] 0b . . 0 . . . .
[SN1g3=0] -2.700 1.052 6.587 1 .010 .067 .009 .528
[SN1g3=1] 0b . . 0 . . . .
[SN1g2=0] -2.106 1.091 3.724 1 .054 .122 .014 1.033
[SN1g2=1] 0b . . 0 . . . . Structural practice
Intercept -3.435 .719 22.841 1 .000 [PBC2g2=0] .975 .422 5.352 1 .021 2.652 1.161 6.060 [PBC2g2=1] 0b . . 0 . . . . [SN1g3=0] .372 .408 .830 1 .362 1.451 .652 3.230 [SN1g3=1] 0b . . 0 . . . . [SN1g2=0] 1.394 .592 5.546 1 .019 4.031 1.263 12.862 [SN1g2=1] 0b . . 0 . . . .
a. The reference category is: Good husbandry. b. This parameter is set to zero because it is redundant.
Classification
Observed
Predicted
Good husbandry Vegetative practice Structural practice Percent Correct
Good husbandry 157 0 0 100.0% Vegetative practice 24 0 0 .0% Structural practice 37 0 0 .0% Overall Percentage 100.0% .0% .0% 72.0%

252
Annex 8: Forced entry method (SPSS 16.0) Nominal Regression [DataSet1] H:\nan_SPSS\analysis\DUMMY\Dummy new cutpoffpoint.sav
Model Fitting Information
Model
Model Fitting Criteria Likelihood Ratio Tests
AIC BIC -2 Log
Likelihood Chi-Square df Sig.
Intercept Only 344.224 350.993 340.224 Final 340.548 550.387 216.548 123.676 60 .000
Goodness-of-Fit
Chi-Square df Sig.
Pearson 363.276 374 .645 Deviance 216.548 374 1.000
Pseudo R-Square
Cox and Snell .433 Nagelkerke .548 McFadden .364
Likelihood Ratio Tests
Effect
Model Fitting Criteria Likelihood Ratio Tests
AIC of Reduced
Model
BIC of Reduced
Model
-2 Log Likelihood of
Reduced Model Chi-Square df Sig.
Intercept 340.548 550.387 2.165E2 .000 0 . nPRIg3 345.208 548.278 225.208 8.660 2 .013 nPRIg1 340.548 550.387 2.165E2 .000 0 . nGOVg2 336.813 539.883 216.813 .265 2 .876 MEMg2 337.804 540.873 217.804 1.256 2 .534 DT1 338.270 541.340 218.270 1.723 2 .423 IN1 336.899 539.969 216.899 .351 2 .839 LANDg2 338.344 541.414 218.344 1.796 2 .407 PT1 336.918 539.988 216.918 .370 2 .831 FW1 341.817 544.887 221.817 5.269 2 .072 SOILg3 338.957 542.027 218.957 2.410 2 .300 SOILg1 340.548 550.387 2.165E2 .000 0 . STREAMg1 340.548 550.387 2.165E2 .000 0 . UT 340.548 550.387 2.165E2 .000 0 . SIZEg4 348.499 551.569 228.499 11.951 2 .003 SIZEg2 341.099 544.169 221.099 4.551 2 .103 HEALTHg2 336.808 539.877 216.808 .260 2 .878 PAST1 339.080 542.150 219.080 2.532 2 .282 CROPg2 350.182 553.251 230.182 13.634 2 .001 GENg2 339.745 542.815 219.745 3.197 2 .202 EDU1 340.427 543.497 220.427 3.879 2 .144 AGEg5 338.302 541.371 218.302 1.754 2 .416 AGEg3 337.606 540.676 217.606 1.058 2 .589 AGEg1 340.548 550.387 2.165E2 .000 0 .

253
SN1g2 356.323 559.393 236.323 19.775 2 .000 PBC2g2 347.231 550.300 227.231 10.683 2 .005 SN1g3 356.507 559.577 236.507 19.959 2 .000 AGEg2 338.198 541.268 218.198 1.650 2 .438 AGEg4 338.102 541.171 218.102 1.554 2 .460 EDUr 340.548 550.387 2.165E2 .000 0 . GENg1 340.548 550.387 2.165E2 .000 0 . CROPg1 340.548 550.387 2.165E2 .000 0 . PASTr 340.548 550.387 2.165E2 .000 0 . HEALTHg1 340.548 550.387 2.165E2 .000 0 . SIZEg1 340.548 550.387 2.165E2 .000 0 . SIZEg3 337.379 540.449 217.379 .831 2 .660 SIZEg5 354.376 557.446 234.376 17.828 2 .000 DT 339.131 542.201 219.131 2.583 2 .275 STREAMg2 337.027 540.097 217.027 .479 2 .787 SOILg2 337.187 540.256 217.187 .639 2 .727 FWr 340.548 550.387 2.165E2 .000 0 . PTr 340.548 550.387 2.165E2 .000 0 . LANDg1 340.548 550.387 2.165E2 .000 0 . INr 340.548 550.387 2.165E2 .000 0 . DTr 340.548 550.387 2.165E2 .000 0 . MEMg1 340.548 550.387 2.165E2 .000 0 . nGOVg1 340.548 550.387 2.165E2 .000 0 . nGOVg3 336.718 539.788 216.718 .170 2 .918 nPRIg2 344.120 547.190 224.120 7.572 2 .023 The chi-square statistic is the difference in -2 log-likelihoods between the final model and a reduced model. The reduced model is formed by omitting an effect from the final model. The null hypothesis is that all parameters of that effect are 0. a. This reduced model is equivalent to the final model because omitting the effect does not increase the degrees of freedom.
Parameter Estimates
Category of the 1st ordera B Std. Error Wald df Sig. Exp(B)
95% Confidence Interval for Exp(B)
Lower Bound Upper Bound
Vegetative practice
Intercept -23.172 7.831 8.755 1 .003
[nPRIg3=0] 20.813 .000 . 1 . 1.094E9 1.094E9 1.094E9
[nPRIg3=1] 0b . . 0 . . . .
[nPRIg1=0] 0b . . 0 . . . .
[nGOVg2=0] .367 .795 .214 1 .644 1.444 .304 6.861
[nGOVg2=1] 0b . . 0 . . . .
[MEMg2=0] -.169 .785 .046 1 .829 .844 .181 3.935
[MEMg2=1] 0b . . 0 . . . .
[DT1=0] .078 .750 .011 1 .917 1.081 .248 4.704
[DT1=1] 0b . . 0 . . . .
[IN1=0] .445 .769 .336 1 .562 1.561 .346 7.040
[IN1=1] 0b . . 0 . . . .
[LANDg2=0] -.815 .898 .825 1 .364 .443 .076 2.571
[LANDg2=1] 0b . . 0 . . . .
[PT1=0] .302 1.029 .086 1 .769 1.353 .180 10.165
[PT1=1] 0b . . 0 . . . .
[FW1=0] 2.854 1.421 4.033 1 .045 17.363 1.071 281.476
[FW1=1] 0b . . 0 . . . .

254
[SOILg3=0] .956 .756 1.597 1 .206 2.601 .591 11.452
[SOILg3=1] 0b . . 0 . . . .
[SOILg1=0] 0b . . 0 . . . .
[STREAMg1=0] 0b . . 0 . . . .
[UT=0] 0b . . 0 . . . .
[SIZEg4=0] 2.194 1.389 2.494 1 .114 8.970 .589 136.583
[SIZEg4=1] 0b . . 0 . . . .
[SIZEg2=0] 1.998 .995 4.028 1 .045 7.373 1.048 51.874
[SIZEg2=1] 0b . . 0 . . . .
[HEALTHg2=0] .291 .696 .175 1 .675 1.338 .342 5.231
[HEALTHg2=1] 0b . . 0 . . . .
[PAST1=0] .653 1.017 .412 1 .521 1.921 .262 14.102
[PAST1=1] 0b . . 0 . . . .
[CROPg2=0] 1.118 .729 2.351 1 .125 3.060 .732 12.784
[CROPg2=1] 0b . . 0 . . . .
[GENg2=0] .168 .680 .061 1 .805 1.183 .312 4.485
[GENg2=1] 0b . . 0 . . . .
[EDU1=0] 1.382 .837 2.726 1 .099 3.981 .772 20.523
[EDU1=1] 0b . . 0 . . . .
[AGEg5=0] -2.770 2.201 1.584 1 .208 .063 .001 4.680
[AGEg5=1] 0b . . 0 . . . .
[AGEg3=0] -2.051 2.068 .984 1 .321 .129 .002 7.401
[AGEg3=1] 0b . . 0 . . . .
[AGEg1=0] 0b . . 0 . . . .
[SN1g2=0] -2.774 1.271 4.767 1 .029 .062 .005 .753
[SN1g2=1] 0b . . 0 . . . .
[PBC2g2=0] 1.651 .731 5.110 1 .024 5.214 1.246 21.827
[PBC2g2=1] 0b . . 0 . . . .
[SN1g3=0] -3.625 1.239 8.562 1 .003 .027 .002 .302
[SN1g3=1] 0b . . 0 . . . .
[AGEg2=0] -2.061 1.952 1.115 1 .291 .127 .003 5.841
[AGEg2=1] 0b . . 0 . . . .
[AGEg4=0] -2.372 2.004 1.400 1 .237 .093 .002 4.744
[AGEg4=1] 0b . . 0 . . . .
[EDUr=0] 0b . . 0 . . . .
[GENg1=0] 0b . . 0 . . . .
[CROPg1=0] 0b . . 0 . . . .
[PASTr=0] 0b . . 0 . . . .
[HEALTHg1=0] 0b . . 0 . . . .
[SIZEg1=0] 0b . . 0 . . . .
[SIZEg3=0] .624 1.019 .375 1 .540 1.866 .253 13.755
[SIZEg3=1] 0b . . 0 . . . .
[SIZEg5=0] 1.137 1.540 .545 1 .460 3.117 .152 63.749
[SIZEg5=1] 0b . . 0 . . . .
[DT=0] -.694 1.068 .422 1 .516 .500 .062 4.056
[DT=1] 0b . . 0 . . . .
[STREAMg2=0] -.535 .772 .481 1 .488 .586 .129 2.659

255
[STREAMg2=1] 0b . . 0 . . . .
[SOILg2=0] .672 1.120 .360 1 .548 1.958 .218 17.574
[SOILg2=1] 0b . . 0 . . . .
[FWr=0] 0b . . 0 . . . .
[PTr=0] 0b . . 0 . . . .
[LANDg1=0] 0b . . 0 . . . .
[INr=0] 0b . . 0 . . . .
[DTr=0] 0b . . 0 . . . .
[MEMg1=0] 0b . . 0 . . . .
[nGOVg1=0] 0b . . 0 . . . .
[nGOVg3=0] -.319 .905 .124 1 .725 .727 .123 4.286
[nGOVg3=1] 0b . . 0 . . . .
[nPRIg2=0] 2.301 1.005 5.236 1 .022 9.980 1.391 71.605
[nPRIg2=1] 0b . . 0 . . . . Structural practice
Intercept -1.666 5.548 .090 1 .764 [nPRIg3=0] 1.556 1.753 .787 1 .375 4.739 .152 147.309 [nPRIg3=1] 0b . . 0 . . . . [nPRIg1=0] 0b . . 0 . . . . [nGOVg2=0] -.108 .633 .029 1 .865 .898 .260 3.102 [nGOVg2=1] 0b . . 0 . . . . [MEMg2=0] .672 .640 1.104 1 .293 1.959 .559 6.867 [MEMg2=1] 0b . . 0 . . . . [DT1=0] .791 .608 1.694 1 .193 2.206 .670 7.265 [DT1=1] 0b . . 0 . . . . [IN1=0] -.036 .547 .004 1 .947 .964 .330 2.819 [IN1=1] 0b . . 0 . . . . [LANDg2=0] .930 1.078 .744 1 .388 2.533 .307 20.936 [LANDg2=1] 0b . . 0 . . . . [PT1=0] -.369 .742 .247 1 .619 .691 .161 2.961 [PT1=1] 0b . . 0 . . . . [FW1=0] .882 .872 1.022 1 .312 2.415 .437 13.352 [FW1=1] 0b . . 0 . . . . [SOILg3=0] -.515 .710 .527 1 .468 .597 .149 2.401 [SOILg3=1] 0b . . 0 . . . . [SOILg1=0] 0b . . 0 . . . . [STREAMg1=0] 0b . . 0 . . . . [UT=0] 0b . . 0 . . . . [SIZEg4=0] -2.451 .942 6.773 1 .009 .086 .014 .546 [SIZEg4=1] 0b . . 0 . . . . [SIZEg2=0] -.260 .827 .099 1 .753 .771 .152 3.903 [SIZEg2=1] 0b . . 0 . . . . [HEALTHg2=0] .209 .646 .105 1 .746 1.233 .348 4.371 [HEALTHg2=1] 0b . . 0 . . . . [PAST1=0] -.816 .606 1.818 1 .178 .442 .135 1.448 [PAST1=1] 0b . . 0 . . . . [CROPg2=0] 2.308 .789 8.556 1 .003 10.056 2.142 47.223 [CROPg2=1] 0b . . 0 . . . . [GENg2=0] -1.068 .620 2.971 1 .085 .344 .102 1.158 [GENg2=1] 0b . . 0 . . . .
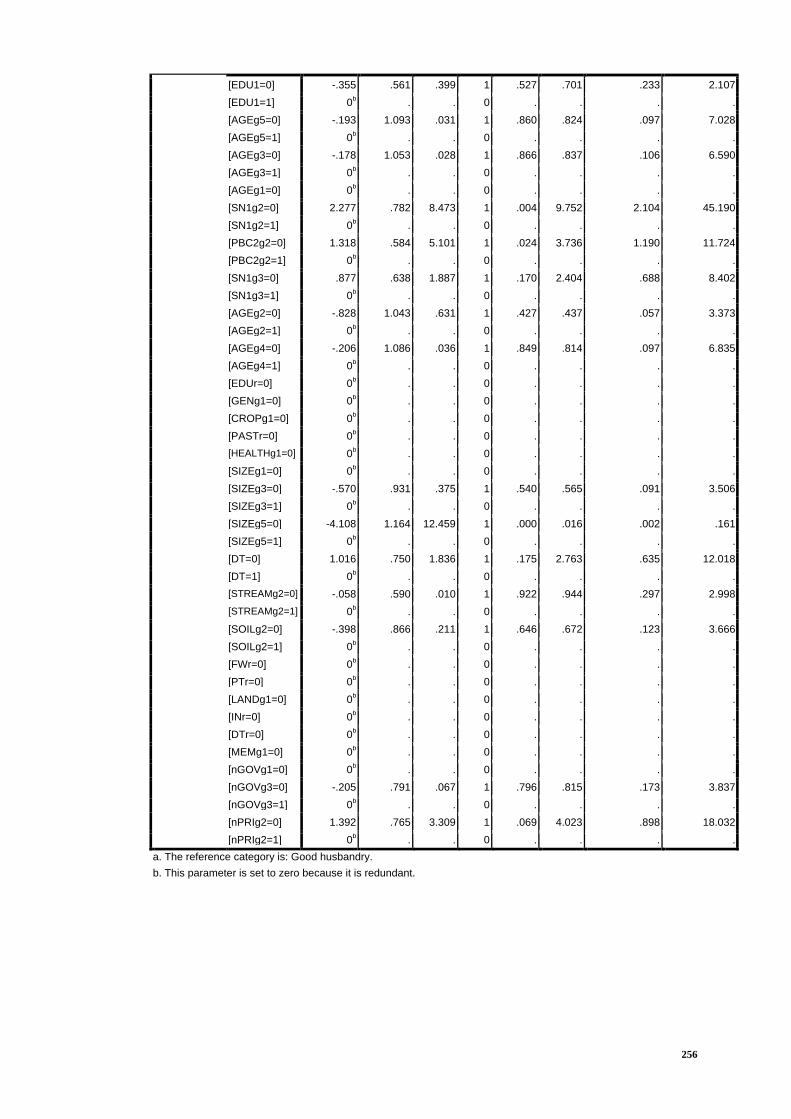
256
[EDU1=0] -.355 .561 .399 1 .527 .701 .233 2.107 [EDU1=1] 0b . . 0 . . . . [AGEg5=0] -.193 1.093 .031 1 .860 .824 .097 7.028 [AGEg5=1] 0b . . 0 . . . . [AGEg3=0] -.178 1.053 .028 1 .866 .837 .106 6.590 [AGEg3=1] 0b . . 0 . . . . [AGEg1=0] 0b . . 0 . . . . [SN1g2=0] 2.277 .782 8.473 1 .004 9.752 2.104 45.190 [SN1g2=1] 0b . . 0 . . . . [PBC2g2=0] 1.318 .584 5.101 1 .024 3.736 1.190 11.724 [PBC2g2=1] 0b . . 0 . . . . [SN1g3=0] .877 .638 1.887 1 .170 2.404 .688 8.402 [SN1g3=1] 0b . . 0 . . . . [AGEg2=0] -.828 1.043 .631 1 .427 .437 .057 3.373 [AGEg2=1] 0b . . 0 . . . . [AGEg4=0] -.206 1.086 .036 1 .849 .814 .097 6.835 [AGEg4=1] 0b . . 0 . . . . [EDUr=0] 0b . . 0 . . . . [GENg1=0] 0b . . 0 . . . . [CROPg1=0] 0b . . 0 . . . . [PASTr=0] 0b . . 0 . . . . [HEALTHg1=0] 0b . . 0 . . . . [SIZEg1=0] 0b . . 0 . . . . [SIZEg3=0] -.570 .931 .375 1 .540 .565 .091 3.506 [SIZEg3=1] 0b . . 0 . . . . [SIZEg5=0] -4.108 1.164 12.459 1 .000 .016 .002 .161 [SIZEg5=1] 0b . . 0 . . . . [DT=0] 1.016 .750 1.836 1 .175 2.763 .635 12.018 [DT=1] 0b . . 0 . . . . [STREAMg2=0] -.058 .590 .010 1 .922 .944 .297 2.998 [STREAMg2=1] 0b . . 0 . . . . [SOILg2=0] -.398 .866 .211 1 .646 .672 .123 3.666 [SOILg2=1] 0b . . 0 . . . . [FWr=0] 0b . . 0 . . . . [PTr=0] 0b . . 0 . . . . [LANDg1=0] 0b . . 0 . . . . [INr=0] 0b . . 0 . . . . [DTr=0] 0b . . 0 . . . . [MEMg1=0] 0b . . 0 . . . . [nGOVg1=0] 0b . . 0 . . . . [nGOVg3=0] -.205 .791 .067 1 .796 .815 .173 3.837 [nGOVg3=1] 0b . . 0 . . . . [nPRIg2=0] 1.392 .765 3.309 1 .069 4.023 .898 18.032 [nPRIg2=1] 0b . . 0 . . . .
a. The reference category is: Good husbandry. b. This parameter is set to zero because it is redundant.

257
Classification
Observed
Predicted
Good husbandry Vegetative practice Structural practice Percent Correct
Good husbandry 145 5 7 92.4% Vegetative practice 14 8 2 33.3% Structural practice 19 1 17 45.9% Overall Percentage 81.7% 6.4% 11.9% 78.0%

258
Annex 9: Q-Sample
Social aspect Ecological aspect Economic aspect Water resource management
Our water here is as safe to drink as anywhere in the country (1)
I can no longer fish from river that used to be a food source for a decade (4)
I have never discharged waste into natural watercourses (2)
Natural watercourses are contaminated with chemicals (5)
Good water quality is a social benefit (3)
If I adopt BMPs, the natural watercourse will be cleaner and water can be re-used for planting other crops (6)
Erosion control and sediment management
Government agencies should provide advisory services on soil management (7)
I do not know which tree could reduce soil erosion effects (10)
To control weeds and grass, I prefer to use a power lawnmower than herbicides (8)
Soil on my farm is easily eroded (11)
Vetiver (local plant) can stabilise farm ditches, but I cannot afford to buy the plants (9)
I do not have enough land to allocate to BMP activities (12)
Pest management Chemically sprayed citrus from my farm is safe to eat (13)
Applying the dosage of chemicals suggested on the label will not harm human health (16)
We should use organic substances instead of chemical pesticides on citrus farms (14)
Chemicals do not always imply toxicity (17)
If I do not apply pesticide as I have been accustomed to do, the fruit quality may drop (15)
Chemical-free labels on food are important for consumer purchasing decisions (18)
Nutrient management I tend to use fertilisers that are widely used by my neighbours (19)
I am happy to use fertilisers introduced by agricultural input retailers (22)
An application of organic fertiliser rather than chemicals will reduce pollution (20)
Growers should apply the right amount of fertiliser to match the trees’ need because over-application will harm the environment (23)
The application of organic fertiliser will give better fruit quality (21)
Without an application of chemical fertiliser, trees do not provide good yield (24)
Overall views about BMPs
BMPs are needed to stop fighting between citrus growers and residents (25)
My neighbours will support me if I adopt BMPs (28)
Man cause pollutant emission, therefore we should take some actions to lessen pollution (26)
We can gain more watershed benefits if we can restrict pollution from our farm production (29)
Growers can comply with BMPs if they get enough monetary support from government (27)
In the long run, BMPs help enhance competitiveness in terms of chemical-free product (30)
The BMPs will lead to more red-tape, but I can adopt them despite this (31)
We could not introduce BMPs correctly because we do not have enough understanding (34)
We should restrict citrus cultivation to designated areas (32)
Most citrus growers are not aware of water availability in the watershed (35)
Labour requirement for BMPs is a big problem (33)
I cannot adopt BMPs because I do not have enough funds (36)
Note: Number in parenthesis indicates statement number
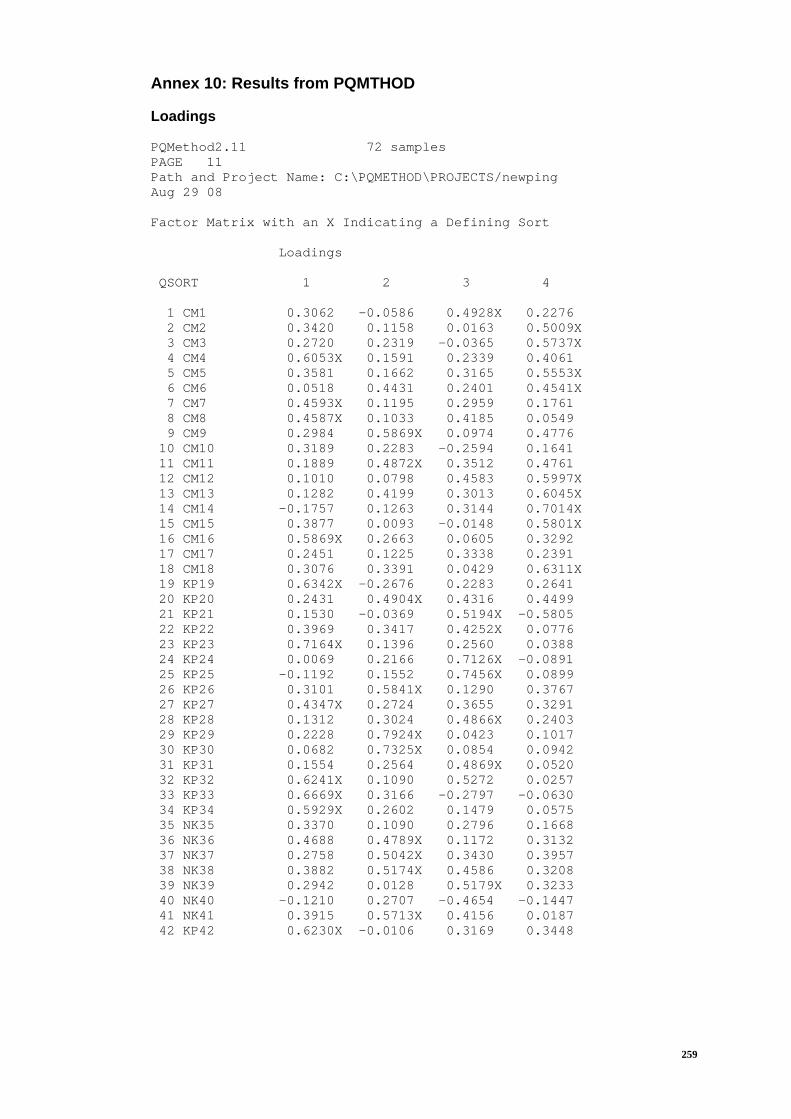
259
Annex 10: Results from PQMTHOD Loadings PQMethod2.11 72 samples PAGE 11 Path and Project Name: C:\PQMETHOD\PROJECTS/newping Aug 29 08 Factor Matrix with an X Indicating a Defining Sort Loadings QSORT 1 2 3 4 1 CM1 0.3062 -0.0586 0.4928X 0.2276 2 CM2 0.3420 0.1158 0.0163 0.5009X 3 CM3 0.2720 0.2319 -0.0365 0.5737X 4 CM4 0.6053X 0.1591 0.2339 0.4061 5 CM5 0.3581 0.1662 0.3165 0.5553X 6 CM6 0.0518 0.4431 0.2401 0.4541X 7 CM7 0.4593X 0.1195 0.2959 0.1761 8 CM8 0.4587X 0.1033 0.4185 0.0549 9 CM9 0.2984 0.5869X 0.0974 0.4776 10 CM10 0.3189 0.2283 -0.2594 0.1641 11 CM11 0.1889 0.4872X 0.3512 0.4761 12 CM12 0.1010 0.0798 0.4583 0.5997X 13 CM13 0.1282 0.4199 0.3013 0.6045X 14 CM14 -0.1757 0.1263 0.3144 0.7014X 15 CM15 0.3877 0.0093 -0.0148 0.5801X 16 CM16 0.5869X 0.2663 0.0605 0.3292 17 CM17 0.2451 0.1225 0.3338 0.2391 18 CM18 0.3076 0.3391 0.0429 0.6311X 19 KP19 0.6342X -0.2676 0.2283 0.2641 20 KP20 0.2431 0.4904X 0.4316 0.4499 21 KP21 0.1530 -0.0369 0.5194X -0.5805 22 KP22 0.3969 0.3417 0.4252X 0.0776 23 KP23 0.7164X 0.1396 0.2560 0.0388 24 KP24 0.0069 0.2166 0.7126X -0.0891 25 KP25 -0.1192 0.1552 0.7456X 0.0899 26 KP26 0.3101 0.5841X 0.1290 0.3767 27 KP27 0.4347X 0.2724 0.3655 0.3291 28 KP28 0.1312 0.3024 0.4866X 0.2403 29 KP29 0.2228 0.7924X 0.0423 0.1017 30 KP30 0.0682 0.7325X 0.0854 0.0942 31 KP31 0.1554 0.2564 0.4869X 0.0520 32 KP32 0.6241X 0.1090 0.5272 0.0257 33 KP33 0.6669X 0.3166 -0.2797 -0.0630 34 KP34 0.5929X 0.2602 0.1479 0.0575 35 NK35 0.3370 0.1090 0.2796 0.1668 36 NK36 0.4688 0.4789X 0.1172 0.3132 37 NK37 0.2758 0.5042X 0.3430 0.3957 38 NK38 0.3882 0.5174X 0.4586 0.3208 39 NK39 0.2942 0.0128 0.5179X 0.3233 40 NK40 -0.1210 0.2707 -0.4654 -0.1447 41 NK41 0.3915 0.5713X 0.4156 0.0187 42 KP42 0.6230X -0.0106 0.3169 0.3448

260
PQMethod2.11 72 samples PAGE 12 Path and Project Name: C:\PQMETHOD\PROJECTS/newping Aug 29 08 Factor Matrix with an X Indicating a Defining Sort (continued) Loadings QSORT 1 2 3 4 43 CM43 0.0864 0.3790 -0.1313 0.4471X 44 CM44 0.4063X 0.2499 0.1270 -0.0722 45 CM45 -0.1409 0.2426 0.2515 0.5246X 46 CM46 0.2899 0.5153X 0.2576 0.1850 47 CM47 0.4584 0.4911X 0.2444 0.4763 48 CM48 0.0480 0.1179 0.5138X 0.2669 49 CM49 -0.1484 0.4240X 0.2156 0.0345 50 CM50 0.4652X 0.0046 0.3490 0.4045 51 CM51 -0.4102 0.2238 0.0460 0.2916 52 CM52 -0.0664 0.4293 0.4679X 0.3214 53 MHS53 0.3639X 0.0492 0.0565 0.3095 54 MHS54 0.0798 0.2172 0.1272 0.7485X 55 MHS55 0.0716 0.4552X 0.0889 0.4391 56 MHS56 0.2868 0.1305 0.4876X -0.0548 57 MHS57 0.3047 0.0838 0.2234 0.4908X 58 MHS58 0.2148 -0.1037 0.4907X 0.4345 59 MHS59 0.2031 -0.1433 0.2505 0.5759X 60 KP60 0.1186 0.1746 0.4751X 0.2126 61 KP61 0.3036 0.1417 -0.0528 0.2311 62 KP62 0.2379 -0.0860 0.3219 0.4087X 63 KP63 0.3152 0.0102 0.5931X 0.3049 64 KP64 0.1257 -0.0351 0.2542 0.6253X 65 KP65 0.2923 0.4256X 0.3645 0.2424 66 KP66 0.3152 0.2798 0.2819 0.3934 67 KP67 -0.0467 0.5573X 0.0169 -0.1016 68 KP68 0.0006 0.2946 0.6220X 0.1901 69 KP69 0.0405 0.1482 0.5178X 0.4085 70 KP70 0.1003 0.0800 0.1540 0.4401X 71 LP71 0.3562 0.2908 0.4488X 0.1409 72 LP72 0.7646X -0.1738 0.0927 0.3398 % expl.Var. 12 10 12 14

261
Distinguishing statements PQMethod2.11 72 samples PAGE 30 Path and Project Name: C:\PQMETHOD\PROJECTS/newping Aug 29 08 Distinguishing Statements for Factor 1 (P < .05; Asterisk (*) Indicates Significance at P < .01) Both the Factor Q-Sort Value and the Normalized Score are shown. Factors 1 2 3 4 No. Statement No. RNK SCORE RNK SCORE RNK SCORE RNK SCORE 18 Label is importance for buying decision 18 2 1.17 1 0.60 1 0.81 0 0.34 20 Applying of organic fertiliser reduces pollution 20 2 1.01 1 0.60 3 1.38 1 0.64 26 Letting thing takes care doesn't mean pollution 26 2 0.91* 0 0.05 0 0.14 0 0.22 29 More watershed benefit will be gained 29 1 0.67 0 0.26 0 -0.20 3 1.20 2 I've never discharged waste into watercourse 2 1 0.61* 4 2.16 -1 -0.33 4 1.85 21 Organic fertiliser use give better fruit quality 21 0 0.52 -1 -0.33 2 0.96 0 0.14 9 Though vetiver stabilise hedge, I can't afford 9 0 0.49 2 0.95 0 -0.18 -2 -1.19 28 Neighbours will support if I adopt 28 0 0.35 0 -0.21 1 0.84 1 0.74 4 I can't fish from lake used to be food source 4 0 0.21* -2 -1.02 -1 -0.49 -2 -1.49 5 Watercourse is contaminated with chemicals 5 0 0.10* -3 -1.27 -3 -1.56 -1 -0.61 35 Most of us aren't aware of water quantity 35 -1 -0.50 -1 -0.91 -4 -1.74 -2 -0.92 33 Labour requirement is a big deal 33 -1 -0.57 -2 -0.94 -3 -1.51 0 0.02 11 Soil in my farm is easily eroded 11 -1 -0.65* -3 -1.11 -2 -1.35 -3 -1.58 13 Sprayed fruit is not dangerous to consume 13 -2 -1.09* 1 0.68 2 0.97 2 1.00 24 W/O chemical fertiliser, citrus can't boost crop 24 -2 -1.22* 0 -0.09 0 0.09 1 0.38 16 Apply suggested dosage won't harm human health 16 -3 -1.34* 1 0.40 0 -0.20 1 0.43 15 If not use pesticide as I did, fruit quality drop 15 -3 -1.56* 2 1.04 1 0.28 0 0.16

262
PQMethod2.11 72 samples PAGE 31 Path and Project Name: C:\PQMETHOD\PROJECTS/newping Aug 29 08 Distinguishing Statements for Factor 2 (P < .05 ; Asterisk (*) Indicates Significance at P < .01) Both the Factor Q-Sort Value and the Normalized Score are shown. Factors 1 2 3 4 No. Statement No. RNK SCORE RNK SCORE RNK SCORE RNK SCORE 15 If not use pesticide as I did, fruit quality drop 15 -3 -1.56 2 1.04* 1 0.28 0 0.16 9 Though vetiver stabilise hedge, I can't afford 9 0 0.49 2 0.95 0 -0.18 -2 -1.19 29 More watershed benefit will be gained 29 1 0.67 0 0.26 0 -0.20 3 1.20 10 I don't know which tree protect soil erosion 10 -1 -0.64 0 -0.01* -1 -0.71 -3 -1.63 28 Neighbours will support if I adopt 28 0 0.35 0 -0.21* 1 0.84 1 0.74 21 Organic fertiliser use give better fruit quality 21 0 0.52 -1 -0.33* 2 0.96 0 0.14 23 Put right amount of fertiliser 23 1 0.86 -1 -0.37* 1 0.88 2 0.90 30 BMP enhance food safety competitiveness in LR 30 1 0.52 -1 -0.55* 0 0.13 2 0.78 33 Labour requirement is a big deal 33 -1 -0.57 -2 -0.94 -3 -1.51 0 0.02 4 I can't fish from lake used to be food source 4 0 0.21 -2 -1.02* -1 -0.49 -2 -1.49 31 BMP brings red tape, but I can adopt 31 0 -0.28 -3 -1.09* -1 -0.28 0 0.06 1 Water is as safe to drink as anywhere 1 -4 -1.97 -4 -2.44 0 -0.23 -4 -2.04

263
PQMethod2.11 72 samples PAGE 32 Path and Project Name: C:\PQMETHOD\PROJECTS/newping Aug 29 08 Distinguishing Statements for Factor 3 (P < .05 ; Asterisk (*) Indicates Significance at P < .01) Both the Factor Q-Sort Value and the Normalized Score are shown. Factors 1 2 3 4 No. Statement No. RNK SCORE RNK SCORE RNK SCORE RNK SCORE 27 We can comply if got monetary support 27 1 0.55 1 0.39 4 2.01* 2 1.04 20 Applying of organic fertiliser reduces pollution 20 2 1.01 1 0.60 3 1.38 1 0.64 3 Good water quality is a social benefit 3 4 1.98 3 1.90 3 1.26* 3 1.77 21 Organic fertiliser use give better fruit quality 21 0 0.52 -1 -0.33 2 0.96 0 0.14 30 BMP enhance food safety competitiveness in LR 30 1 0.52 -1 -0.55 0 0.13 2 0.78 12 I don't have enough land 12 -1 -0.53 -1 -0.64 0 -0.11 -2 -1.26 9 Though vetiver stabilise hedge, I can't afford 9 0 0.49 2 0.95 0 -0.18* -2 -1.19 16 Apply suggested dosage won't harm human health 16 -3 -1.34 1 0.40 0 -0.20* 1 0.43 29 More watershed benefit will be gained 29 1 0.67 0 0.26 0 -0.20* 3 1.20 1 Water is as safe to drink as anywhere 1 -4 -1.97 -4 -2.44 0 -0.23* -4 -2.04 2 I've never discharged waste into watercourse 2 1 0.61 4 2.16 -1 -0.33* 4 1.85 4 I can't fish from lake used to be food source 4 0 0.21 -2 -1.02 -1 -0.49* -2 -1.49 36 Can't adopt because of no fund 36 0 -0.30 0 -0.26 -2 -1.18* -1 -0.15 32 Cultivation are should be restricted 32 0 -0.04 0 -0.20 -3 -1.49* -1 -0.30 33 Labour requirement is a big deal 33 -1 -0.57 -2 -0.94 -3 -1.51* 0 0.02 35 Most of us aren't aware of water quantity 35 -1 -0.50 -1 -0.91 -4 -1.74* -2 -0.92

264
PQMethod2.11 72 samples PAGE 33 Path and Project Name: C:\PQMETHOD\PROJECTS/newping Aug 29 08 Distinguishing Statements for Factor 4 (P < .05 ; Asterisk (*) Indicates Significance at P < .01) Both the Factor Q-Sort Value and the Normalized Score are shown. Factors 1 2 3 4 No. Statement No. RNK SCORE RNK SCORE RNK SCORE RNK SCORE 29 More watershed benefit will be gained 29 1 0.67 0 0.26 0 -0.20 3 1.20* 27 We can comply if got monetary support 27 1 0.55 1 0.39 4 2.01 2 1.04* 8 I prefer power lawnmower to herbicide 8 3 1.39 2 1.20 2 1.22 1 0.53* 17 Chemicals don't always imply toxicity 17 -1 -0.75 -2 -0.93 -1 -0.57 0 0.24* 21 Organic fertiliser use give better fruit quality 21 0 0.52 -1 -0.33 2 0.96 0 0.14 33 Labour requirement is a big deal 33 -1 -0.57 -2 -0.94 -3 -1.51 0 0.02* 14 We should use organic substance 14 2 1.05 2 0.96 2 1.23 -1 -0.16* 34 Not in correct way because of low understanding 34 -2 -1.16 -2 -1.00 -2 -1.17 -1 -0.57 5 Watercourse is contaminated with chemicals 5 0 0.10 -3 -1.27 -3 -1.56 -1 -0.61* 9 Though vetiver stabilise hedge, I can't afford 9 0 0.49 2 0.95 0 -0.18 -2 -1.19* 12 I don't have enough land 12 -1 -0.53 -1 -0.64 0 -0.11 -2 -1.26* 4 I can't fish from lake used to be food source 4 0 0.21 -2 -1.02 -1 -0.49 -2 -1.49* 10 I don't know which tree protect soil erosion 10 -1 -0.64 0 -0.01 -1 -0.71 -3 -1.63*

265
Consensus statement PQMethod2.11 72 samples PAGE 34 Path and Project Name: C:\PQMETHOD\PROJECTS/newping Aug 29 08 Consensus Statements -- Those That Do Not Distinguish Between ANY Pair of Factors. All Listed Statements are Non-Significant at P>.01, and Those Flagged With an * are also Non-Significant at P>.05. Factors 1 2 3 4 No. Statement No. RNK SCORE RNK SCORE RNK SCORE RNK SCORE 6 If I adopt, water is cleaner and reused 6 3 1.27 3 1.52 3 1.59 3 1.19 QANALYZE was completed at 12:01:16

266
ANNEX REFERENCES
Agriculture and Agri-Food Canada (2007) Greencover Canada. Available at: www.agr.gc.ca (Accessed: 24 November 2007).
Apte, T. (2001) Water rights, land reform and community participation: the Pani Panchayat model for sustainable water management, Delhi: Kalpavriksh Environment Action Group.
Arocena-Francisco, H. & Salas, J. C. (2004) Realities of watershed management in the Philippines: the case of the Lloilo-Maasin watershed. Discussion Paper Series No. 2004-22. Makati: Philippine Institute for Development Studies.
Bautista, G. M. (2003) Lessons in the development of markets for ecosystem services in a watershed context: a survey of different country experiences. Washington, D.C.: United States Agency for International Development, and Philippine Environmental Governance.
CSIR & IIED (2005) How can payments help manage watersheds sustainability and fairly?, Phase 3 Work plan for an Action Learning Process in South Africa 2005 – 2006. Pretoria; London: Council for Scientific and Industrial Research, and International Institute for Environment and development.
Dean, T. W. (2004) Secure pesticide storage: facility size and location. Fact Sheet PI-29. Florida: Institute of Food and Agricultural Sciences, University of Florida.
Déprés, C. & Grolleau, G. (2005) "Contracting for environmental property rights: the case of Vittel", The 99th seminar of the EAAE, The Future of Rural Europe in the Global Agri-Food System. 24-27 August 2005. Copenhagen, Denmark.
Deyi, W. (1996) "A Case Study of Successful Watershed Management in Wuhua County, Guangdong Province, China," in P. N. Sharma & M. P. Wagley (eds.) Case Studies of People's Participation in Watershed Management in Asia Part1: Nepal, China, India. Kathmandu: Food and Agriculture Organization of the United Nations.
Diz, D. & Soeftestad, L. T. (2004) "Water resources as a common good in Brazil: legal reform between theory and practice", The 9th Biannual Conference of the International Association for the Study of Common Property (IASCP). 9-13 August 2004. Oaxaca, Mexico.
DWAF (2003a) Water resource management charges: foresters understanding what you pay for. Pretoria: Department of Water Affairs and Forestry.
DWAF (2003b) Water resource management charges: simplified guide. Pretoria: Department of Water Affairs and Forestry.
DWAF (2003c) Water resource management charges: understanding your rights and responsibilities. Pretoria: Department of Water Affairs and Forestry.
Echavarria, M. & Lochman, L. (1998) Policy mechanisms for watershed conservation: case studies. Washington, D.C.: The Nature Conservancy.
Echavarria, M. (2000) Valuation of water-related services to downstream users in rural watersheds: determining values for the use and protection of water resources. Background paper no. 4 of the Land-Water Linkages in Rural Watersheds Electronic Workshop. Rome: Food and Agriculture Organization of the United Nations.
Echavarria, M. (2002) "Financing Watershed Conservation: the FONAG Water Fund in Quito, Ecaudor," in S. Pagiola, J. Bishop, & N. Landell-Mills (eds.) Selling Forest Environmental Services: Market Based Mechanisms for Conservation. London: Earthscan Publications, pp. 91-101.
Echavarria, M., Vogel, J., Albán, M., & Meneses, F. (2003) The impacts of payments for watershed services in Ecuador: emerging lessons from Pimampiro and Cuenca. London: International Institute for Environment and Development.
Ecolotree (2004) Serving your needs. Available at: http://www.ecolotree.com/servingyourneeds.html.
Environmental Protection Authority (2003) Hunter river salinity trading scheme: working together to protect river quality and sustain economic development. Sydney: Environmental Protection Authority.
(Accessed: 14 January 2007).
Environomics (1999) A summary of US effluent trading and offsets projects. Maryland: United States Environmental Protection Agency.
Federal Water Pollution Control Act. Federal Water Pollution Control Act (2002). as Amended Through P.L. 107-303, 2002.

267
Hope, R. A., Porras, I., Borgoyary, M., Miranda, M., Agarwal, C., Tiwari, S., & Amezaga, J. M. (2007) Negotiating watershed services. London: International Institute for Environment and Development.
Johnson, N., White, A., & Perrot-Maítre, D. (2002) Developing markets for water services from forests: issues and lessons for innovators. Washington, D.C.: Forest Trends, World Resource Institute and the Katoomba Group.
Kammel, D. W. & O'Neil, D. (1990) "Farm-sized maxing/ loading pad and agri-chemical storage facility", International Summer Meeting of American Society of Agricultural Engineer 1990. 24-27 June 1990. Columbus, Ohio, USA.
King, N., Letsoalo, A., & Rapholo, B. (2003) Developing markets for watershed protection services and improved livelihoods in South Africa. ENV-P-C-2003-059, prepared for IIED and the Action Learning Group. London: CSIR/ IIED.
Kosoy, N., Martinez-Tuna, M., Muradian, R., & Martinez-Alier, J. (2005) "Payments for environmental services in watershed: insights from a comparative study of two cases in Central America", Seminar on Environmental Services and Financing for the Protection and Sustainable Use of Ecosystems. 10-11 October 2005. Geneva.
Kosoy, N., Miguel, M.-T., Roldan, M., & Joan, M.-A. (2007) "Payments for environmental services in watershed: insights from a comparative study of three cases in Central America", Ecological Economics, vol. 61, no. 2-3, pp. 446-455.
Kraemer, R. A., Kampa, E., & Interwies, E. (2003) The role of tradable permits in water pollution control ecologic. Berlin: Institute for International and European Environmental Policy.
Landell-Mills, N. & Porras, I. T. (2002) Silver bullet of fools' gold? a review of markets for forest environmental services and their impact on the poor. London: International Institute for Environmental and Development.
Liu, B. (2005) "Institutional Design Considerations for Water Rights Developments in China," in B. R. Bruns, C. Ringler, & R. Meinzen-Dick (eds.) Water Rights Reform: Lessons for Institutional Design. Washington, D.C.: IFPRI publications, pp. 261-279.
Liu, C. (2002) "Market creation for environmental services of forest resources and private sector participation in China", Journal of Natural Resources, vol. 17, no. 2, pp. 246-252.
Liverpool Plains Land Management Committee & WWF (2005) Land management tenders: a new way of landcare. New South Wales: Liverpool Plains Land Management Committee.
Mayrand, K. & Paquin, M. (2004) Payments for environmental services: a survey and assessment of current schemes. Paper for the Commission for Environmental Cooperation of North America. Montreal: Unisféra International Centre.
Méndez, J. C., Hernández, O., Cobos, C. R., & Ortiz, A. (2004) "Economic valuation for the environmental service of water regulation, Southern Sierra de las Minas, Guatemala," in FAO (ed.) Payment schemes for environmental services in watersheds. Rome: Food and Agriculture Organization of the United Nations, pp. 16-17.
Miami Conservancy District (2005) Great Miami river watershed water quality credit trading program: operations manual. Miami: Miami Conservancy District.
Monzoni, M. (2001) "Market-based innovations for environment conservation in Brazil", An international conference on sustainable forestry development in China. 12 May 2001. Huang Shan, China. Available at http://www.forest-trends.org/documents/meetings/Huangshan_2001/Monzoni_Amazon_HS.pdf#search=%22market%20based%20innovations%20for%20environmental%20conservation%20in%20brazil%22 (Accessed: 5 October 2006).
Munawir & Vermeulen, S. (2007) Fair deals for watershed services in Indonesia. Natural Resource Issues No. 9. London: International Institute for Environment and Development.
Munawir, Suhardi, Salim, S., Suyanto, A., & Vermeulen, S. (2003) Action-learning to develop and test upstream-downstream transactions for watershed protection services: a diagnostic report from Segara river basin, Indonesia. Discussion paper PSDAL-LP3ES. London: International Institute for Environment and Development.
Muñoz-Piña, C., Guevara, A., Torres, J. M., & Braña, J. (2005) Paying for the hydrological services of Mexico's forests: analysis, negotiation and results. Mexico City: Instituto Nacional de Ecología.
MWR (2003) The protection of Beijing water resources in the 21st century. Ministry of Water Resource, Beijing, China [Online]. Available at: http://www.mwr.gov.cn/index/20040220/30138.asp 2004-5-3 (Accessed: 6 October 2006).
268
Organization of American States (2005) Bermejo river basin: implementation of the strategic action program for the binational basin of the Bermejo river. Washington, D.C.: General Secretariat of the Organization of American States.
Perrot-Maître, D. & Davis, P. (2001) Case studies of markets and innovative financial mechanisms for water services from forests. Washington, D.C.: The Katoomba Group.
Porras, I., Neves, N., & Miranda, M. (2006) Developing markets for watershed protection services and improved livelihoods. Technical Trip. Active Learning from Costa Rica's Payment for Environmental Service. London: International Institute of Environment and Development.
Redondo-Brenes, A. & Welsh, K. (2006) "Payment for hydrological environmental services in Costa Rica: the Procuencas case study", Tropical Resource Bulletin, vol. 25, no. Spring, pp. 19-25.
Rodriguez Becerra, M. & Ponce de Leon, E. (1999) "Financing the Green Plan ('Plan Verde') in Colombia: challenges and opportunities ". The Workshop on Financing of Sustainable Forest Management. 11-13 October 1999. Croydon, London.
Ross & Associates Environmental Consulting (2000) Lower Boise river effluent trading demonstration project: summary of participant recommendations for a trading framework. Prepared for Idaho Division of Environmental Quality. Idaho: Department of Environmental Quality.
Russo, R. O. & Candela, G. (2006) "Payment of environmental services in Costa Rica: evaluating impact and possibilities", Tierra Tropical, vol. 2, no. 1, pp. 1-14.
Sengupta, S., Mitra, K., Saigal, S., Gupta, R., Tiwari, S., & Peters, N. (2003) Developing markets for watershed protection services and improved livelihoods in India. Discussion paper. New Delhi: Winrock International India, and International Institute for Environment and Development.
Sikor, T. (2001) "The allocation of forestry land in Vietnam: did it cause the expansion of the forests in the northwest?", Forest Policy and Economics, vol. 2, no. 1, pp. 1-11.
Smith, M., de Groot, D., Perrot-Maîte, D., & Bergkamp, G. (2006) Pay - establishing payments for watershed services. Gland: International Union for Conservation of Nature.
Sustainable Agriculture and Rural Development (2005) "Case study 10 recovering positive mountain externalities: reversing land degradation through payment for environmental services at the local level in central America", Seminar on Mountain Positive Externalities, Reaping the Benefits of Europe's Precious Places: Policies Releasing the Potential of Mountain and Remoter Rural Area. 9-11 November 2005. Aviemore, Scotland.
Uchiyama, T., Baba, Y., & Bhromsiri, A. (2007) "The actual conditions of agrochemical usage and the achievement of the alternative technologies in Northern Thailand", Journal of Rural Problems, vol. 43, no. 1, pp. 195-200.
UN-HABITAT (2006) Integrated water resource management: the effect of water supply, waste water & sewage disposal on the wider drainage basin. Nairobi: The United Nations Human Settlements Programme.
United Nations (2005) "Water - related ecosystems for water management: environmental services and financing for the protection and sustainable use of ecosystems", Seminar on Environmental Services and Financing for the Protection and Sustainable Use of Ecosystems. 10-11 October 2005, Geneva. Available at: http://www.unece.org/env/documents/2005/wat/sem.5/mp.wat.sem.5.2005.4e.pdf (Accessed: 23 June 2007).
Winrock International India (2005) Negotiating socio-economic opportunities in payment for environmental service schemes: the case of Bhoj wetlands, Madhya Pradesh. New Delhi: Winrock International India.
Wunder, S., Bui, D. T., & Ibarra, E. (2005) Payment is good, control is better: why payments for forest environmental services in Vietnam have so far remained incipient. Bogor Barat: Center for International Forestry Research.