COVID-19 Global Behaviours and Attitudes
29
Report COVID-19 Global Behaviours and Attitudes The Year in Review April 2020 – April 2021 With special acknowledgement of the contribution from the WHO working group on measuring behavioural and social drivers (BeSD) of COVID-19 vaccination.
Transcript of COVID-19 Global Behaviours and Attitudes
Report
COVID-19
Global Behaviours and AttitudesThe Year in Review
April 2020 – April 2021
With special acknowledgement of the contribution from the WHO working group on measuring behavioural and social drivers (BeSD) of COVID-19 vaccination.
With special acknowledgement of the contribution from the WHO working group on measuring behavioural and social drivers (BeSD) of COVID-19 vaccination.
Compare your data with that of 15 other countries, areas or territories on coviddatahub.com
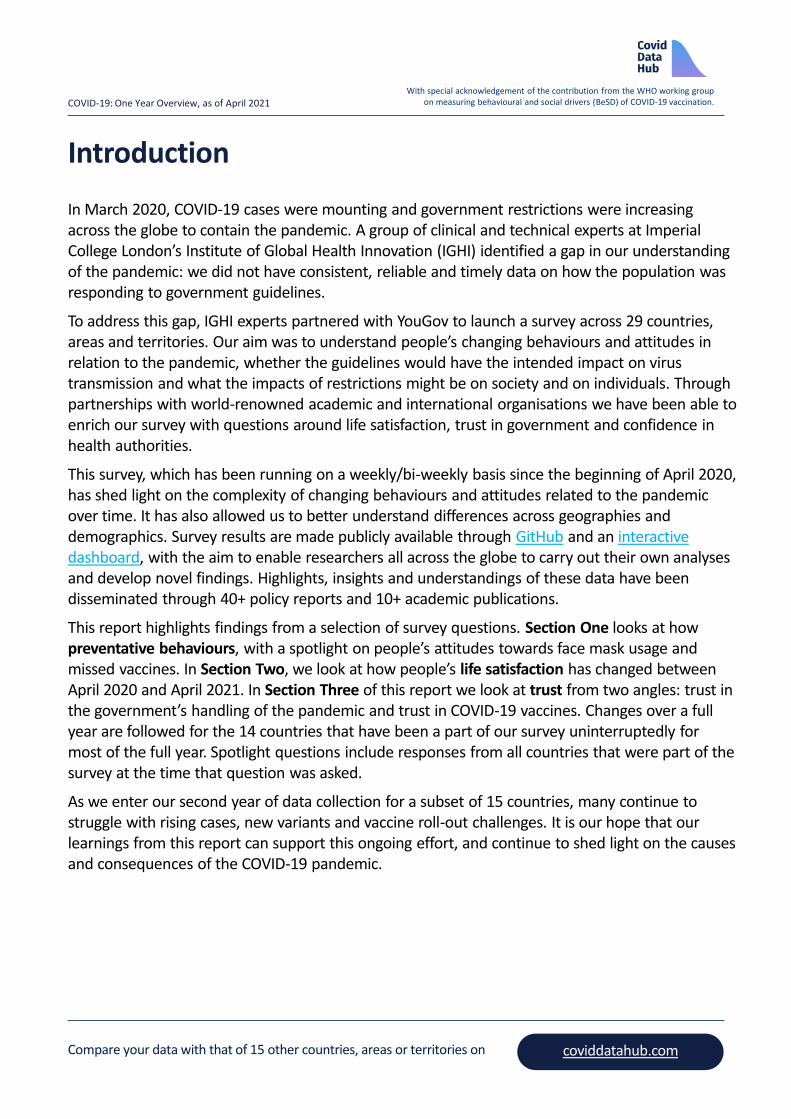
In March 2020, COVID-19 cases were mounting and government restrictions were increasing across the globe to contain the pandemic. A group of clinical and technical experts at Imperial College London’s Institute of Global Health Innovation (IGHI) identified a gap in our understanding of the pandemic: we did not have consistent, reliable and timely data on how the population was responding to government guidelines.
To address this gap, IGHI experts partnered with YouGov to launch a survey across 29 countries, areas and territories. Our aim was to understand people’s changing behaviours and attitudes in relation to the pandemic, whether the guidelines would have the intended impact on virus transmission and what the impacts of restrictions might be on society and on individuals. Through partnerships with world-renowned academic and international organisations we have been able to enrich our survey with questions around life satisfaction, trust in government and confidence in health authorities.
This survey, which has been running on a weekly/bi-weekly basis since the beginning of April 2020, has shed light on the complexity of changing behaviours and attitudes related to the pandemic over time. It has also allowed us to better understand differences across geographies and demographics. Survey results are made publicly available through GitHub and an interactive dashboard, with the aim to enable researchers all across the globe to carry out their own analyses and develop novel findings. Highlights, insights and understandings of these data have been disseminated through 40+ policy reports and 10+ academic publications.
This report highlights findings from a selection of survey questions. Section One looks at how preventative behaviours, with a spotlight on people’s attitudes towards face mask usage and missed vaccines. In Section Two, we look at how people’s life satisfaction has changed between April 2020 and April 2021. In Section Three of this report we look at trust from two angles: trust in the government’s handling of the pandemic and trust in COVID-19 vaccines. Changes over a full year are followed for the 14 countries that have been a part of our survey uninterruptedly for most of the full year. Spotlight questions include responses from all countries that were part of the survey at the time that question was asked.
As we enter our second year of data collection for a subset of 15 countries, many continue to struggle with rising cases, new variants and vaccine roll-out challenges. It is our hope that our learnings from this report can support this ongoing effort, and continue to shed light on the causes and consequences of the COVID-19 pandemic.
Introduction
COVID-19: One Year Overview, as of April 2021
With special acknowledgement of the contribution from the WHO working group on measuring behavioural and social drivers (BeSD) of COVID-19 vaccination.
Compare your data with that of 15 other countries, areas or territories on coviddatahub.com
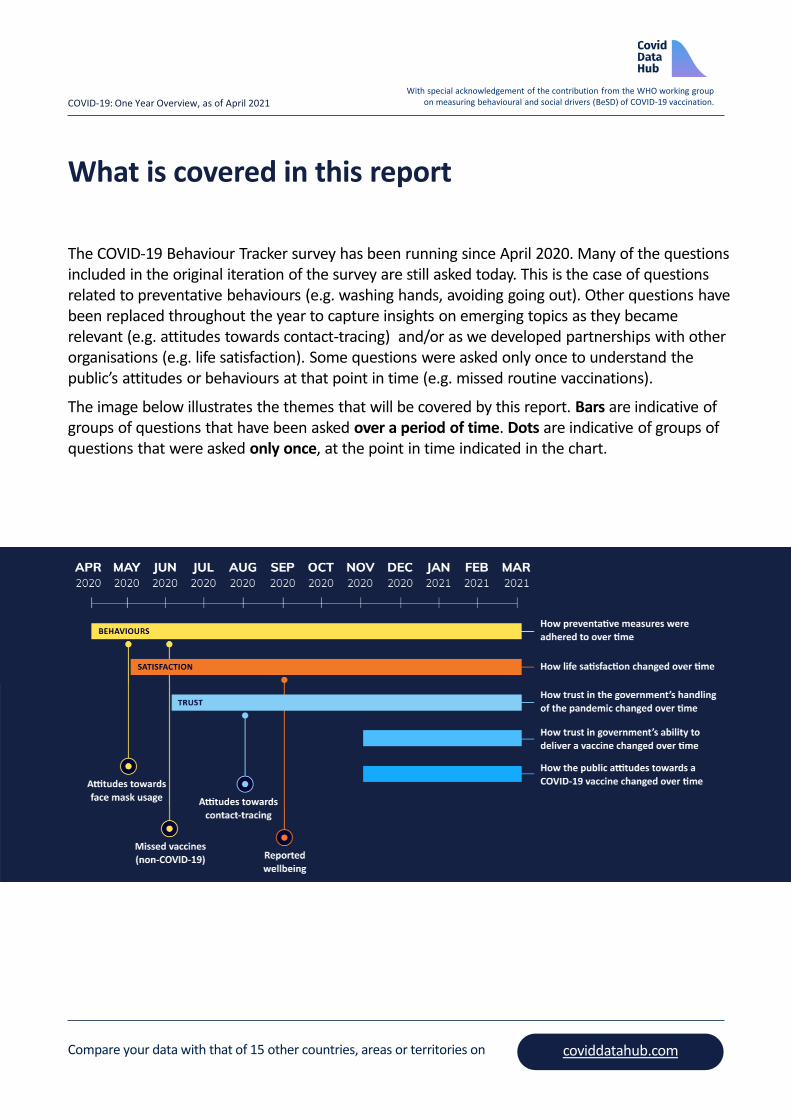
The COVID-19 Behaviour Tracker survey has been running since April 2020. Many of the questions included in the original iteration of the survey are still asked today. This is the case of questions related to preventative behaviours (e.g. washing hands, avoiding going out). Other questions have been replaced throughout the year to capture insights on emerging topics as they became relevant (e.g. attitudes towards contact-tracing) and/or as we developed partnerships with other organisations (e.g. life satisfaction). Some questions were asked only once to understand the public’s attitudes or behaviours at that point in time (e.g. missed routine vaccinations).
The image below illustrates the themes that will be covered by this report. Bars are indicative of groups of questions that have been asked over a period of time. Dots are indicative of groups of questions that were asked only once, at the point in time indicated in the chart.
What is covered in this report
COVID-19: One Year Overview, as of April 2021

With special acknowledgement of the contribution from the WHO working group on measuring behavioural and social drivers (BeSD) of COVID-19 vaccination.
Question for the research team? Get in touch here
Press enquiry? Contact Dr. Justine Alford at [email protected]
Collaborators and supportersLed by Imperial College London’s Institute of Global Health Innovation (IGHI) and YouGov
Contributors to the CovidDataHub.com project Realised by Supporters
Professor John F. Helliwell
Co-editor, World Happiness Report
Vancouver School of Economics at the
University of British Columbia, Research
Associate of the NBER and Distinguished
Fellow of the Canadian Institute for Advanced
Research
Professor Jeffrey D. Sachs
Co-editor, World Happiness Report
Director of the Center for Sustainable
Development at Columbia University Director
of the UN Sustainable
Development Solutions Network and SDG
Advocate under Secretary-General António
Guterres
Professor the Lord Richard Layard
Co-editor, World Happiness Report
Founder-Director of the Centre for Economics
Performance at the London School of
Economics
Co-founder of Action for Happiness
Professor Jan-Emmanuel De Neve
Co-editor, World Happiness Report
Director of the wellbeing Research Centre at
University of Oxford
KSI Fellow and Vice-Principal of Harris
Manchester College
Contributors to the Imperial College London -
YouGov survey include: Professor Helen Ward,
Dr. Christina J. Atchinson, Dr. Benjamin C.
Lambert, and Gavin Ellison
The Imperial College London - YouGov team
wishes to express their grateful support to
Stephan Shakespeare, Marcus Roberts, Alex
MacIntosh, Chris Curtis, Eir Nolsoe, Sharon
Paculor, Lenny Naar, Alice Blencowe, Steve
Adams from Visual DJ Ltd. and volunteers from
Made by Many: Rebecca Foy, Anna Pagan,
Gareth Cozens, Callum Jefferies, Neethu
Mathew, Micha Nicheva, Kristof Goossens
This research is made possible by generous
support for the public good
from YouGov Plc.
The Imperial College London - YouGov team
gratefully acknowledges the kind support of
Edelman Intelligence for their global social
listening contribution
Professor the Lord Ara
Darzi of Denham
Co-Director, IGHI
Melanie Leis
Director, Big Data
and Analytical Unit (BDAU), IGHI
Gianluca Fontana
Operations Director
and Senior Policy Fellow, IGHI
Dr David Nabarro
Co-Director, IGHI
Special Envoy of WHO Director
General on COVID-19
Sarah P. Jones
Faculty of Medicine,
Department of Surgery &
Cancer Research Postgraduate
Dr Manar Shafat
Contributor, BDAU
Dr Roberto Fernandez Crespo
Analytics Fellow, BDAU
Natalie Melas-Kyriazi
Contributor, BDAU
COVID-19: One Year Overview, as of April 2021
With special acknowledgement of the contribution from the WHO working group on measuring behavioural and social drivers (BeSD) of COVID-19 vaccination.
The members of the BeSD COVID-19 working group are: Neetu Abad (United States Centers for Disease Control); Helena Ballester Bon (United Nations Children’s Fund [UNICEF]); Cornelia Betsch (University of Erfurt, Germany); Noel Brewer (University of North Carolina, United States of America); Melissa Gilkey (University of North Carolina, United States of America); Julie Leask (University of Sydney, Australia); Abdul Momin Kazi (Aga Khan University, Pakistan); Ana Lisa Ong-Lim (University of the Philippines, Manila); Aaron Scherer (University of Iowa, United States of America); Holly Seale (University of New South Wales, Australia); Gilla Shapiro (University of Toronto, Canada); Smita Singh (Gavi, the Vaccine Alliance); Gillian SteelFisher (Harvard University, United States of America); Kerrie Wiley (University of Sydney, Australia); Charles Wiysonge (Cochrane South Africa). Lisa Menning and Francine Ganter Restrepo from WHO serve as the group Secretariat.
With special acknowledgement of the contribution from the WHO working group on measuring behavioural and social drivers (BeSD) of COVID-19 vaccination.
Compare your data with that of 15 other countries, areas or territories on coviddatahub.com
Key findings
• People continue to frequently wash hands as a protective measure. Hand washing is the preventative measure most adhered to. Over 80% of respondents in all countries surveyed between April 2020 and April 2021 reported washing their hands with soap and water to protect themselves or others from COVID-19.
• When face mask use started, there was an overwhelmingly positive sentiment towards face mask use. As the mandate to wear face masks in public spaces spread across the globe, we asked respondents about their feelings towards face mask use. In May 2020, people were proud to wear face masks. Over 80% of all respondents globally reported feeling proud, better protected and like they were setting a good example when they wore a face mask.
• As of today, more people are using face masks. Face mask use has increased during the past year in all surveyed countries, with the most significant increase seen in the Nordic countries. As of April 2021, over 70% of respondents report wearing face masks in all countries surveyed except Australia (42%) and Sweden (36%).
• More people are returning to work outside the home. In all countries except Japan the share of respondents who report avoiding working outside the home was lower in April 2021 than it was in April 2020. Variation across countries has also decreased: in all countries in April 2021 the share of respondents who reported avoiding working outside the home was between 29% (Australia) and 49% (UK and Canada).
• More people are going out in general. In all countries surveyed the share of respondents who report always or frequently avoiding going out has decreased since April 2020. In April 2021 the share of respondents who reported avoiding going out was between 33% (Australia) and 75% (South Korea).
• Fewer people are willing to self-isolate. While the vast majority of respondents have reported willingness to self-isolate if advised to do so by a healthcare professional (over 68% in all countries), the share of those who report that they would be unwilling to self-isolate was higher in April 2021 than it was in April 2020 across all countries surveyed. Interestingly, the share of those who report that it would be difficult for them to self isolate has remained relatively consistent over time.
• Worries about contracting COVID-19 led to missed vaccines. One of the consequences of the pandemic has been the public’s inability to get vaccines for other health problems, especially in non-high-income countries. In June 2020, 18% of respondents in Brazil and Vietnam reported that someone in their household had delayed or missed getting vaccines due to COVID-19. The most common reason for delaying or missing getting a vaccine was “worry about getting COVID-19 at the vaccination clinic” (reported by 13% of global respondents).
Section One – Preventative Behaviours
COVID-19: One Year Overview, as of April 2021
Section One - Preventative Behaviours
Missed vaccines (non-COVID-19)
Attitudes towards face mask usage
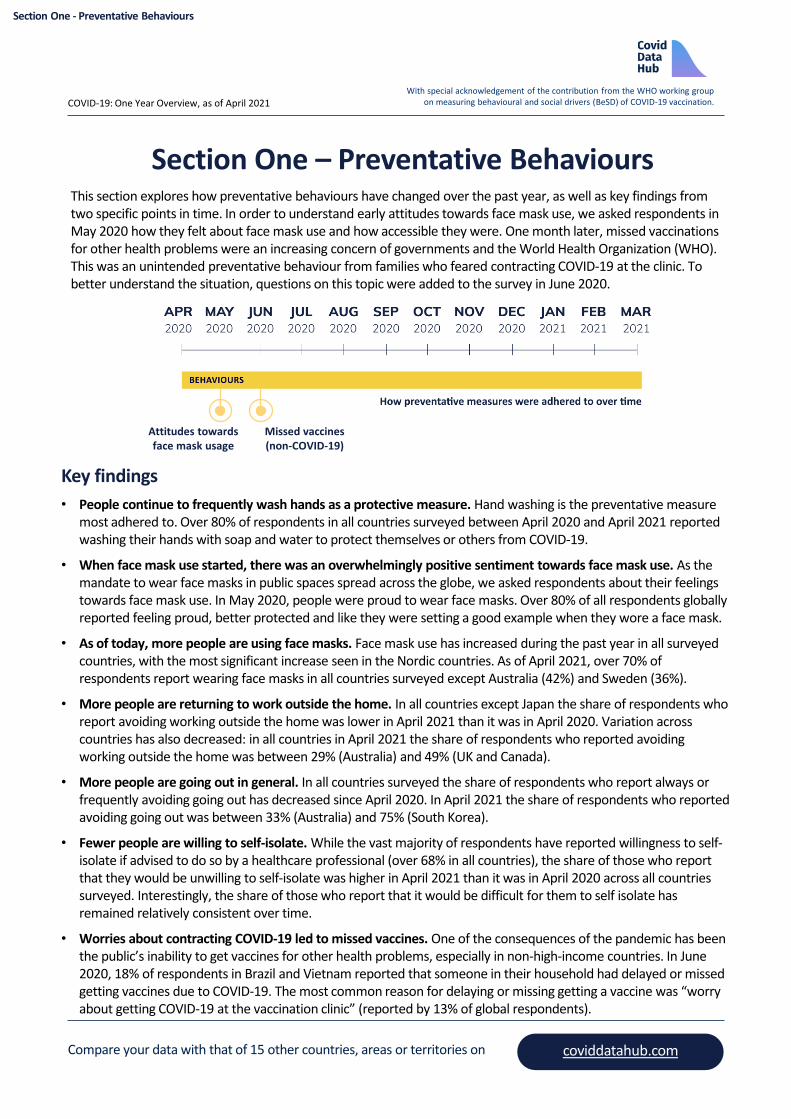
This section explores how preventative behaviours have changed over the past year, as well as key findings from two specific points in time. In order to understand early attitudes towards face mask use, we asked respondents in May 2020 how they felt about face mask use and how accessible they were. One month later, missed vaccinations for other health problems were an increasing concern of governments and the World Health Organization (WHO). This was an unintended preventative behaviour from families who feared contracting COVID-19 at the clinic. To better understand the situation, questions on this topic were added to the survey in June 2020.

With special acknowledgement of the contribution from the WHO working group on measuring behavioural and social drivers (BeSD) of COVID-19 vaccination.
Compare your data with that of 15 other countries, areas or territories on coviddatahub.com
Has the frequency of hand washing changed in the past year?
Hand washing is the preventative measure most adhered to. Across all countries surveyed, over 80% of respondents reported always or frequently washing their hands with soap and water between April 2020 and April 2021. Italy had the highest percentage of respondents reporting washing their hands and Japan had the lowest.
Country breakdown of respondents who answered ‘Always’ or ‘Frequently’ at the first and latest survey (%)
These graphs show changes in the frequency of hand washing over the last year
COVID-19: One Year Overview, as of April 2021
April 2020 April 2021 for all countries except NHL (February 2021)
Changes over time in the proportion of country's respondents who answered that they 'Always' or 'Frequently' wash their hands with soap and water to protect from COVID-19 (%)
Thinking about the last 7 days… how often have you washed your hands with soap and water to protect yourself or others from coronavirus (COVID-19)?
Country breakdown of respondents who answered ‘Rarely’ or ‘Not at all’ at the first and latest survey (%)
Section One - Preventative Behaviours
With special acknowledgement of the contribution from the WHO working group on measuring behavioural and social drivers (BeSD) of COVID-19 vaccination.
Compare your data with that of 15 other countries, areas or territories on coviddatahub.com
Early on, how did people feel about wearing face masks?
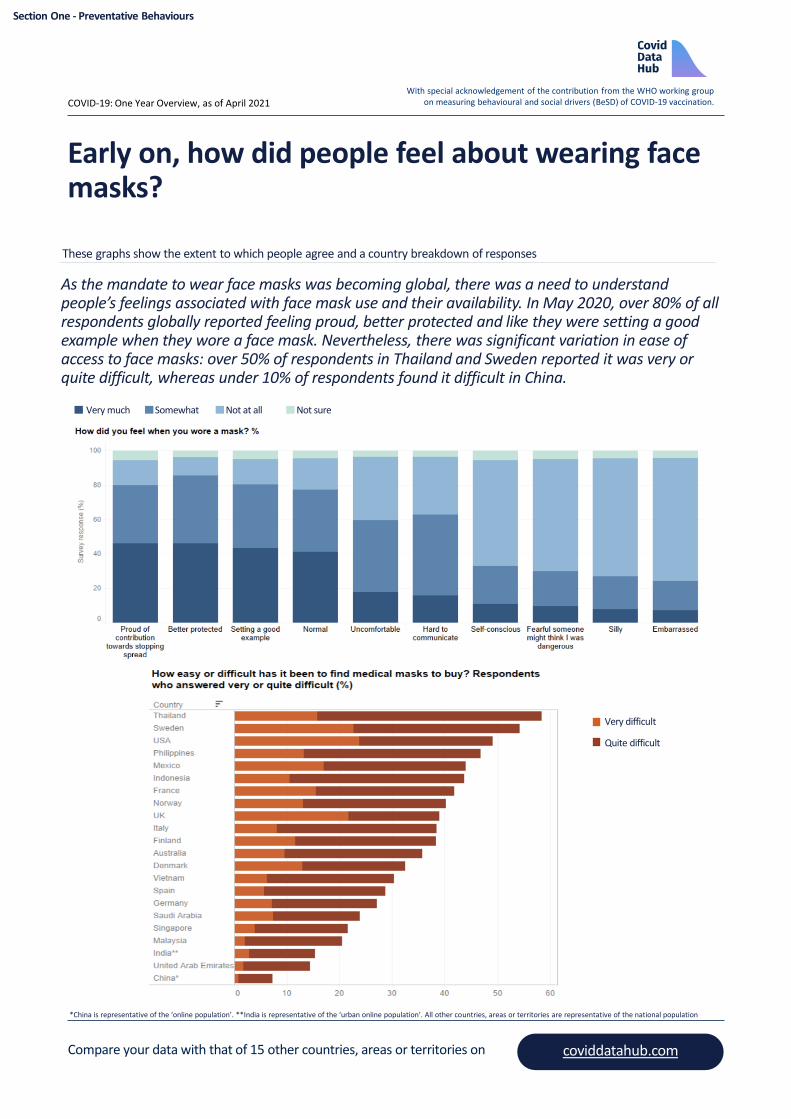
As the mandate to wear face masks was becoming global, there was a need to understand people’s feelings associated with face mask use and their availability. In May 2020, over 80% of all respondents globally reported feeling proud, better protected and like they were setting a good example when they wore a face mask. Nevertheless, there was significant variation in ease of access to face masks: over 50% of respondents in Thailand and Sweden reported it was very or quite difficult, whereas under 10% of respondents found it difficult in China.
These graphs show the extent to which people agree and a country breakdown of responses
COVID-19: One Year Overview, as of April 2021
*China is representative of the ‘online population’. **India is representative of the ‘urban online population’. All other countries, areas or territories are representative of the national population
Section One - Preventative Behaviours
Very much Somewhat Not at all Not sure
Very difficult
Quite difficult

With special acknowledgement of the contribution from the WHO working group on measuring behavioural and social drivers (BeSD) of COVID-19 vaccination.
Compare your data with that of 15 other countries, areas or territories on coviddatahub.com
Has the use of face masks changed over the past year?
Face mask use has increased during the past year in all surveyed countries. As of April 2021, over 70% of respondents report wearing face masks always or frequently in all countries surveyed except Australia (42%) and Sweden (36%). In April 2020, the Nordic countries (Sweden, Denmark, Norway) had the lowest reported rate of face mask use (10% or fewer) while South Korea had the largest (93%).
Changes over time in the proportion of country's respondents who answered that they ‘Always’ or ‘Frequently’ wore a face mask when leaving the home (%)
These graphs show the the changes in the use of face masks over time
Country breakdown of respondents who answered ‘Always’ or ‘Frequently’ at the first and latest survey (%)
COVID-19: One Year Overview, as of April 2021
April 2020 April 2021 for all countries except NHL (February 2021)
Thinking about the last 7 days… how often have you worn a face mask outside your home to protect yourself or others from coronavirus (COVID-19)?
Country breakdown of respondents who answered ‘Rarely’ or ‘Not at all’ at the first and latest survey (%)
Section One - Preventative Behaviours

With special acknowledgement of the contribution from the WHO working group on measuring behavioural and social drivers (BeSD) of COVID-19 vaccination.
Compare your data with that of 15 other countries, areas or territories on coviddatahub.com
Has avoiding working outside the home changed over the past year?
More people are returning to work outside the home. In all countries except Japan the share of respondents who report always or frequently avoiding working outside the home is lower in April 2021 than it was in April 2020. Over the past year, the trend in avoiding working outside the home has followed a U-shape in most surveyed countries, with the highest levels of avoidance found at the beginning of 2020.
Country breakdown of respondents who answered ‘Always’ or ‘Frequently’ at the first and latest survey (%)
These graphs show the changes in respondents who avoid working outside their home
Changes over time in the proportion of country's respondents who answered that they ‘Always’ or ‘Frequently’ avoided working outside the home (%)
COVID-19: One Year Overview, as of April 2021
April 2020 April 2021 for all countries except NHL (February 2021)
Thinking about the last 7 days… how often have you avoided working outside your home to protect yourself or others from coronavirus (COVID-19)?
Country breakdown of respondents who answered ‘Rarely’ or ‘Not at all’ at the first and latest survey (%)
Section One - Preventative Behaviours
With special acknowledgement of the contribution from the WHO working group on measuring behavioural and social drivers (BeSD) of COVID-19 vaccination.
Compare your data with that of 15 other countries, areas or territories on coviddatahub.com
Has avoiding going out changed over the past year?
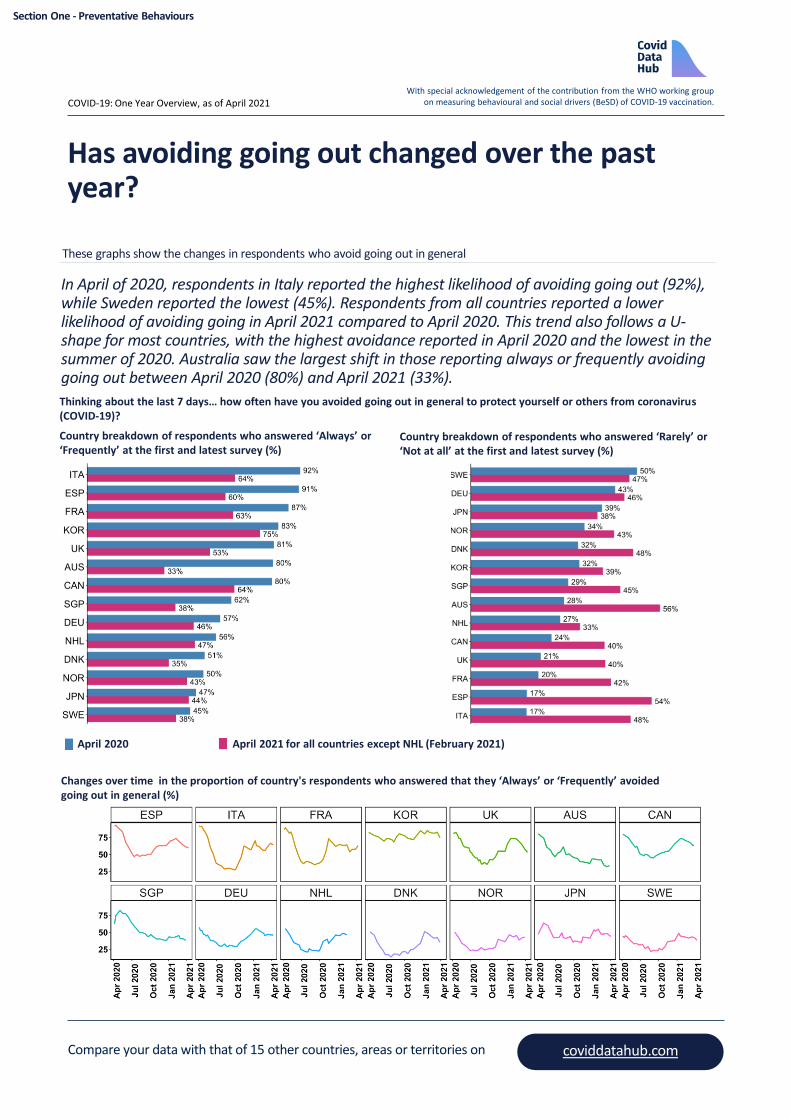
In April of 2020, respondents in Italy reported the highest likelihood of avoiding going out (92%), while Sweden reported the lowest (45%). Respondents from all countries reported a lower likelihood of avoiding going in April 2021 compared to April 2020. This trend also follows a U-shape for most countries, with the highest avoidance reported in April 2020 and the lowest in the summer of 2020. Australia saw the largest shift in those reporting always or frequently avoiding going out between April 2020 (80%) and April 2021 (33%).
These graphs show the changes in respondents who avoid going out in general
COVID-19: One Year Overview, as of April 2021
Country breakdown of respondents who answered ‘Always’ or ‘Frequently’ at the first and latest survey (%)
April 2020 April 2021 for all countries except NHL (February 2021)
Changes over time in the proportion of country's respondents who answered that they ‘Always’ or ‘Frequently’ avoided going out in general (%)
Thinking about the last 7 days… how often have you avoided going out in general to protect yourself or others from coronavirus (COVID-19)?
Country breakdown of respondents who answered ‘Rarely’ or ‘Not at all’ at the first and latest survey (%)
Section One - Preventative Behaviours
With special acknowledgement of the contribution from the WHO working group on measuring behavioural and social drivers (BeSD) of COVID-19 vaccination.
Compare your data with that of 15 other countries, areas or territories on coviddatahub.com
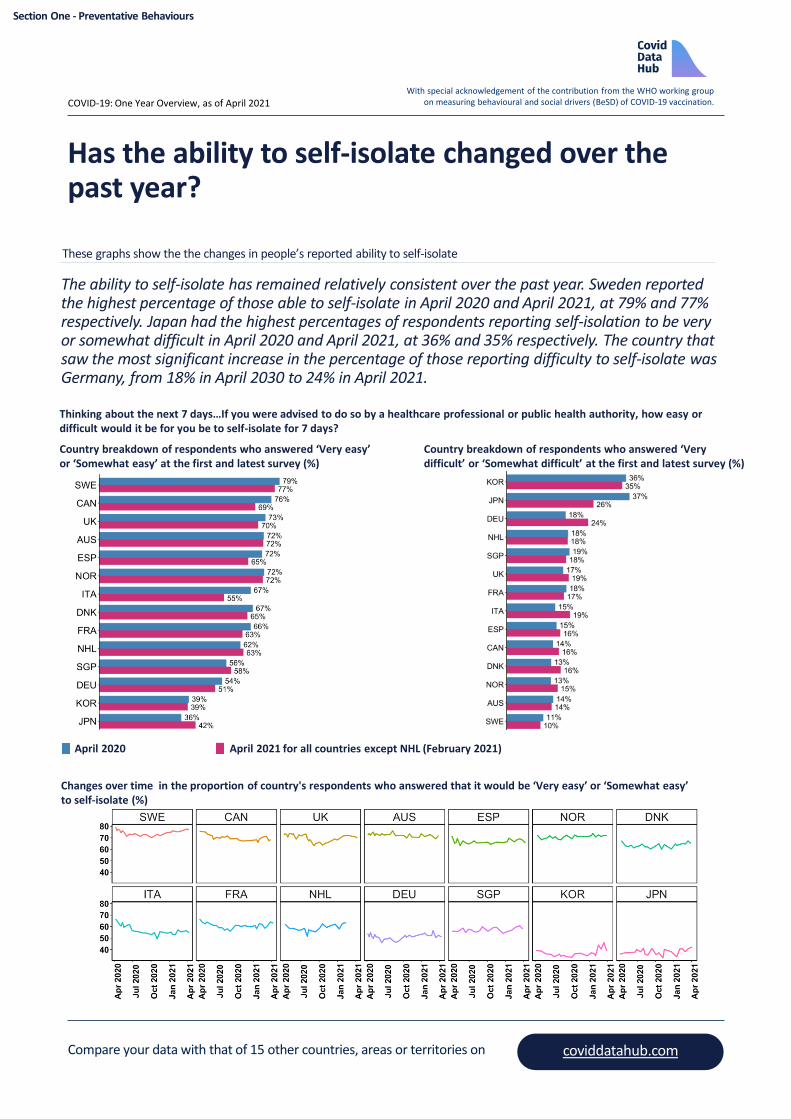
Has the ability to self-isolate changed over the past year?
The ability to self-isolate has remained relatively consistent over the past year. Sweden reported the highest percentage of those able to self-isolate in April 2020 and April 2021, at 79% and 77% respectively. Japan had the highest percentages of respondents reporting self-isolation to be very or somewhat difficult in April 2020 and April 2021, at 36% and 35% respectively. The country that saw the most significant increase in the percentage of those reporting difficulty to self-isolate was Germany, from 18% in April 2030 to 24% in April 2021.
These graphs show the the changes in people’s reported ability to self-isolate
COVID-19: One Year Overview, as of April 2021
Changes over time in the proportion of country's respondents who answered that it would be ‘Very easy’ or ‘Somewhat easy’ to self-isolate (%)
Country breakdown of respondents who answered ‘Very easy’ or ‘Somewhat easy’ at the first and latest survey (%)
April 2020 April 2021 for all countries except NHL (February 2021)
Thinking about the next 7 days…If you were advised to do so by a healthcare professional or public health authority, how easy ordifficult would it be for you be to self-isolate for 7 days?
Country breakdown of respondents who answered ‘Very difficult’ or ‘Somewhat difficult’ at the first and latest survey (%)
Section One - Preventative Behaviours

With special acknowledgement of the contribution from the WHO working group on measuring behavioural and social drivers (BeSD) of COVID-19 vaccination.
Compare your data with that of 15 other countries, areas or territories on coviddatahub.com
Has willingness to self-isolate changed over the past year?
While most respondents have reported willingness to self-isolate if advised to do so by a healthcare professional (over 68% in all countries), the share of those who report that they would be unwilling to self-isolate was higher in April 2021 than it was in April 2020. The UK had the highest percentage of respondents reporting they were very or somewhat willing to self-isolate if advised to do so in April 2020 (95%) and in April 2021 (87%). Japan had the highest percentage of respondents reporting being very or somewhat unwilling to self-isolate in April 2020 (8%) and April 2021 (9%). The largest increase in unwillingness was seen in Germany, from 5% in April 2020 to 9% in April 2021.
These graphs show the changes in people’s reported willingness to self-isolate
COVID-19: One Year Overview, as of April 2021
Thinking about the next 7 days…If you were advised to do so by a healthcare professional or public health authority to what extent are you willing or not to self-isolate for 7 days?
April 2020 April 2021 for all countries except NHL (February 2021)
Country breakdown of respondents who answered ‘Very willing’ or ‘Somewhat willing’ at the first and latest survey (%)
Country breakdown of respondents who answered ‘Very unwilling’ or ‘Somewhat unwilling’ at the first and latest survey (%)
Changes over time in the proportion of country's respondents who answered that they are/were ‘Very willing’ or ‘Somewhat willing’ to self-isolate if advised to do so (%)
Section One - Preventative Behaviours

With special acknowledgement of the contribution from the WHO working group on measuring behavioural and social drivers (BeSD) of COVID-19 vaccination.
Compare your data with that of 15 other countries, areas or territories on coviddatahub.com
Did people miss their vaccines because of COVID-19?
One of the consequences of the pandemic has been the missed or delayed routine vaccines, especially in non-high-income countries. In June 2020, 18% of respondents in Brazil and Vietnam reported that someone in their household had delayed or missed getting non-COVID vaccines due to COVID-19.
These graphs show the extent to which people agree and a country breakdown of responses
COVID-19: One Year Overview, as of April 2021
WHOQ_a.. CountryC.. Country
0 50 100
Surveyresponse(%)
BRA Brazil
VNM Vietnam
PHL Philippines
IND** India**
SAU SaudiArabia
THA Thailand
USA USA
CHN* China*
MEX Mexico
IDN Indonesia
AUS Australia
ARE UnitedArabEmirates
CAN Canada
ESP Spain
DEU Germany
ITA Italy
NOR Norway
SWE Sweden
FRA France
SGP Singapore
MYS Malaysia
DNK Denmark
UK UK
186418
1861174
1460206
137314
1365184
1361224
11818
117810
117019
11492910
82 99
6619 96
86 77
86 77
86 68
89 65
88 66
92 53
90 55
8312 5
6227 56
92 44
92 35
Has anyone in your household delayed or missed getting any vaccines because of COVID-19? This could be someone living in your home (%)
*China is representative of the ‘online population’. **India is representative of the ‘urban online population’. All other countries, areas or territories are representative of the national population
Section One - Preventative Behaviours

With special acknowledgement of the contribution from the WHO working group on measuring behavioural and social drivers (BeSD) of COVID-19 vaccination.
Compare your data with that of 15 other countries, areas or territories on coviddatahub.com
Why did people miss their vaccines during the pandemic?
In June 2020, 9% of all respondents had missed or delayed getting non-COVID-19 related vaccinations. 13% of all respondents – the largest percentage of any response – replied that they or someone in their household delayed or missed getting vaccinated because that they were worried about contracting COVID-19 at the vaccination clinic.
These graphs show the extent to which people agree and a country breakdown of responses
COVID-19: One Year Overview, as of April 2021
Of global respondents have missed or delayed getting their vaccinations9%
What is the main reason that COVID-19 made you or someone in your household delay or miss getting vaccinated? (%)
Of those who missed or delayed their vaccinations were the respondents themselves32%
Section One - Preventative Behaviours
With special acknowledgement of the contribution from the WHO working group on measuring behavioural and social drivers (BeSD) of COVID-19 vaccination.
Compare your data with that of 15 other countries, areas or territories on coviddatahub.com
Section Two – Life Satisfaction and Wellbeing
COVID-19: One Year Overview, as of April 2021
Key findings
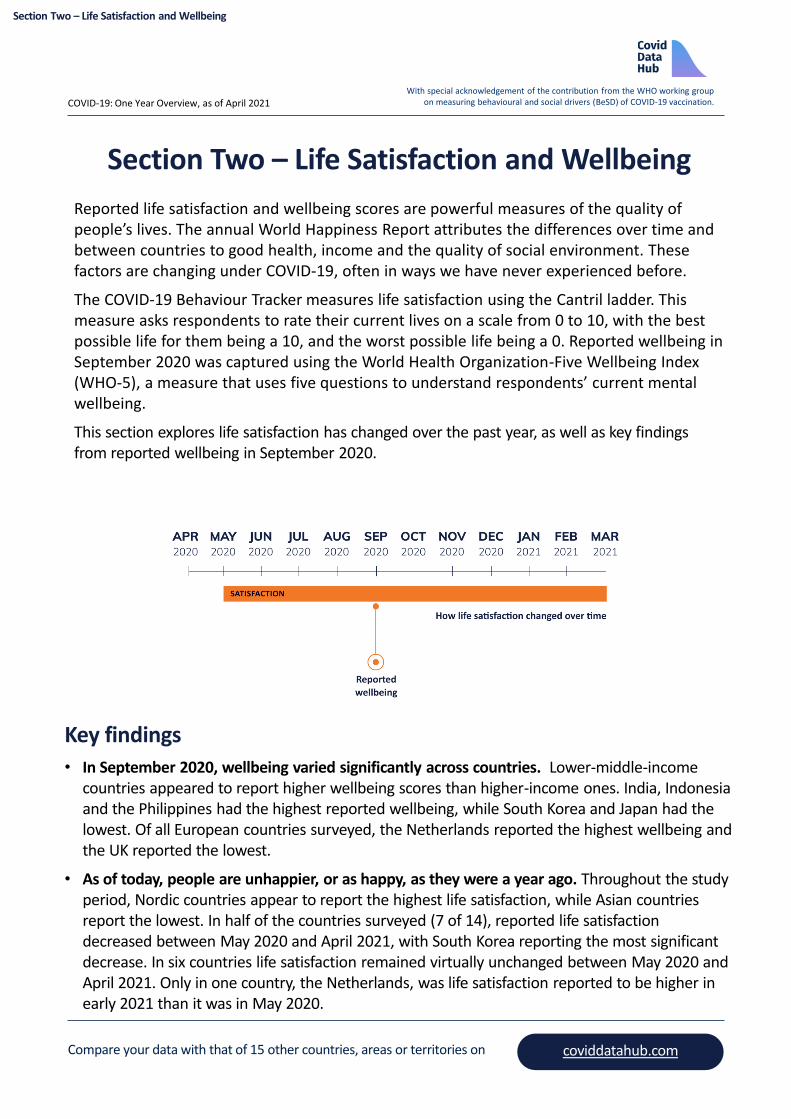
• In September 2020, wellbeing varied significantly across countries. Lower-middle-income countries appeared to report higher wellbeing scores than higher-income ones. India, Indonesia and the Philippines had the highest reported wellbeing, while South Korea and Japan had the lowest. Of all European countries surveyed, the Netherlands reported the highest wellbeing and the UK reported the lowest.
• As of today, people are unhappier, or as happy, as they were a year ago. Throughout the study period, Nordic countries appear to report the highest life satisfaction, while Asian countries report the lowest. In half of the countries surveyed (7 of 14), reported life satisfaction decreased between May 2020 and April 2021, with South Korea reporting the most significant decrease. In six countries life satisfaction remained virtually unchanged between May 2020 and April 2021. Only in one country, the Netherlands, was life satisfaction reported to be higher in early 2021 than it was in May 2020.
Section Two – Life Satisfaction and Wellbeing
Reported life satisfaction and wellbeing scores are powerful measures of the quality of people’s lives. The annual World Happiness Report attributes the differences over time and between countries to good health, income and the quality of social environment. These factors are changing under COVID-19, often in ways we have never experienced before.
The COVID-19 Behaviour Tracker measures life satisfaction using the Cantril ladder. This measure asks respondents to rate their current lives on a scale from 0 to 10, with the best possible life for them being a 10, and the worst possible life being a 0. Reported wellbeing in September 2020 was captured using the World Health Organization-Five Wellbeing Index (WHO-5), a measure that uses five questions to understand respondents’ current mental wellbeing.
This section explores life satisfaction has changed over the past year, as well as key findings from reported wellbeing in September 2020.

With special acknowledgement of the contribution from the WHO working group on measuring behavioural and social drivers (BeSD) of COVID-19 vaccination.
Compare your data with that of 15 other countries, areas or territories on coviddatahub.com
How did wellbeing vary by countries in September 2020?
In September 2020, lower-middle-income countries appeared to report higher wellbeing scores than higher-income ones. India, Indonesia and the Philippines had the highest reported wellbeing, while South Korea and Japan had the lowest. Of all European countries surveyed, the Netherlands reported the highest wellbeing, and the UK reported the lowest.
This graph shows the wellbeing score by country
COVID-19: One Year Overview, as of April 2021
The World Health Organization-Five Wellbeing Index (WHO-5) is a powerful measure of current mental wellbeing (time frame the previous two weeks). It consists of five statements that respondents rate using the following scale: all of the time, most of the time, more than half of the time, less than half of the time, some of the time, at no time. Each score is translated into a numerical value (all the time =5, at no time = 0). The combined score of the five statements is transformed into a 0-100 scale, with 0 representing the worst imaginable wellbeing and 100 representing the best. The five statements are the following:• I have felt cheerful and in good spirits• I have felt calm and relaxed• I have felt active and vigorous• I woke up feeling fresh and rested• My daily life has been filled with things that interest me
*China is representative of the ‘online population’. **India is representative of the ‘urban online population’. All other countries, areas or territories are representative of the national population
WHO-5 score by country
Section Two – Life Satisfaction and Wellbeing

With special acknowledgement of the contribution from the WHO working group on measuring behavioural and social drivers (BeSD) of COVID-19 vaccination.
Compare your data with that of 15 other countries, areas or territories on coviddatahub.com
How did life satisfaction change between May 2020 and April 2021?
Throughout the study period, reported life satisfaction was highest in the Netherlands, Denmark, Sweden and Norway, and was lowest in South Korea, Japan, Singapore and Italy. In half of the countries surveyed, reported life satisfaction decreased between May 2020 and April 2021, with South Korea reporting the most significant decrease. In six countries life satisfaction remained virtually unchanged between May 2020 and April 2021. Only in one country, the Netherlands, was life satisfaction reported to be higher in early 2021 than it was in May 2020.
This graph shows the life satisfaction score from the first and latest survey weeks
COVID-19: One Year Overview, as of April 2021
The Cantril ladder serves as a proxy for life satisfaction. Life satisfaction is a powerful measure of the quality of people’s lives. The annual World Happiness Report attributes the differences over time and between countries to good health, income and the quality of social environment. These factors are changing under COVID-19, often in ways we have never experienced before. The YouGov life satisfaction data, collected regularly as the pandemic evolves in each surveyed country, provide a valuable barometer reading of life under COVID-19, reflecting each country’s institutions and policies.
May 2020 April 2021 for all countries except NHL (February 2021)
Please imagine a ladder with steps numbered from zero at the bottom to 10 at the top. The top of the ladder represents the best possible life for you and the bottom represents the worst possible life for you. On which step of the ladder would you position yourself in? (Average country response)
Section Two – Life Satisfaction and Wellbeing

With special acknowledgement of the contribution from the WHO working group on measuring behavioural and social drivers (BeSD) of COVID-19 vaccination.
Compare your data with that of 15 other countries, areas or territories on coviddatahub.com
Section Three - Trust
COVID-19: One Year Overview, as of April 2021
Key findings
• People’s views on how their governments and health systems are handling the pandemic have worsened. While confidence in health authorities was typically higher than confidence in the government’s response, between June 2020 and April 2021 the share of people who believed the government was handling the pandemic well decreased in 12 of the 14 countries surveyed. During this same timeframe, confidence in the healthcare system’s ability to respond to COVID-19 decreased in 11 of the 14 countries surveyed.
• Willingness to get a COVID-19 vaccine has increased since November, but is decreasing in some countries. Since November 2020, willingness to get the vaccine has increased in 13 of the 14 countries surveyed. Similarly, the percentage of respondents who stated they would regret not getting a COVID-19 vaccine when it becomes available has increased in 12 of the 14 countries surveyed. As of April 2021, over half of respondents across all countries except France reported that they would definitely get the vaccine if made available to them, and over half in 11 of the 14 countries surveyed stated they would regret not getting it. In several countries, the share of respondents who stated they would definitely get the vaccine, and the share of those who stated they would regret not getting it, has decreased since the beginning of the year.
• Concerns about side-effects of a COVID-19 vaccine are lower now than they were in November, but are increasing in some countries. Compared to November 2020, concerns about side-effects of a COVID-19 vaccine have decreased in 12 of the 14 countries surveyed, although concerns have increased in several countries since the beginning of the year. As of April 2021, over half of the population were still concerned about side-effects in 5 of the 14 countries surveyed.
• Most people trust COVID-19 vaccines, but there are important access issues. In the latest data available, over 50% of the population report trust in the COVID-19 vaccine in all surveyed countries except Japan. This is despite the fact that fewer than half of respondents in most countries reported that vaccines were not hard to get. Nearly half of respondents in France (41%) and Italy (46%) reported that vaccines were not yet available to them.
• There were significant concerns around contact tracing. In August 2020, the top reasons for not wanting to provide contact information were not wanting the government to track them (30%) and not wanting technology companies to track them (25%).
Section Three - Trust
A key driver of behaviour during the pandemic is trust. One initiative that relies strongly on the public’s trust is contact-tracing. In August 2020, our survey included a group of questions about contact tracing to better understand the public’s attitudes towards this programme. This section looks at finding from these questions, as well as changes in trust over time. We look at how trust in governments’ handling of the pandemic has changed since June 2020, how trust in governments’ ability to deliver a COVID-19 vaccine has changed since November 2020, and how public attitudes towards a COVID-19 vaccine have changed since November 2020.

With special acknowledgement of the contribution from the WHO working group on measuring behavioural and social drivers (BeSD) of COVID-19 vaccination.
Compare your data with that of 15 other countries, areas or territories on coviddatahub.com
How have people’s views changed regarding their governments’ handling of the pandemic?
In 12 of the 14 countries surveyed, the share of people who believed their government was handling the pandemic well decreased between June 2020 and April 2021. The only countries where this share increased were Singapore and the UK. In 10 of the 14 countries surveyed, there was an increase in the share of those who stated they believed that their governments were handling the pandemic badly at the time of the survey. The country that saw the largest increase in the share of respondents who believed the pandemic was being handled well was Singapore (71% to 88%). The country that saw the largest increase in the share of respondents who believed the pandemic was being handled badly was Germany (25% to 68%).
These graphs show the extent to which people trust their governments’ response to the pandemic
COVID-19: One Year Overview, as of April 2021
Country breakdown of respondents who answered ‘Very well’ or ‘Somewhat well’ at the first and latest survey (%)
June 2020 April 2021 for all countries except NHL (February 2021)
Changes over time in the proportion of country's respondents who believed their government was handling the pandemic (COVID-19) ‘Very badly’ or ‘Somewhat badly’ (%)
How well or badly do you think the Government are handling the issue of the Coronavirus (COVID-19)?
Country breakdown of respondents who answered ‘Very badly’ or ‘Somewhat badly’ at the first and latest survey (%)
Section Three - Trust
With special acknowledgement of the contribution from the WHO working group on measuring behavioural and social drivers (BeSD) of COVID-19 vaccination.
Compare your data with that of 15 other countries, areas or territories on coviddatahub.com
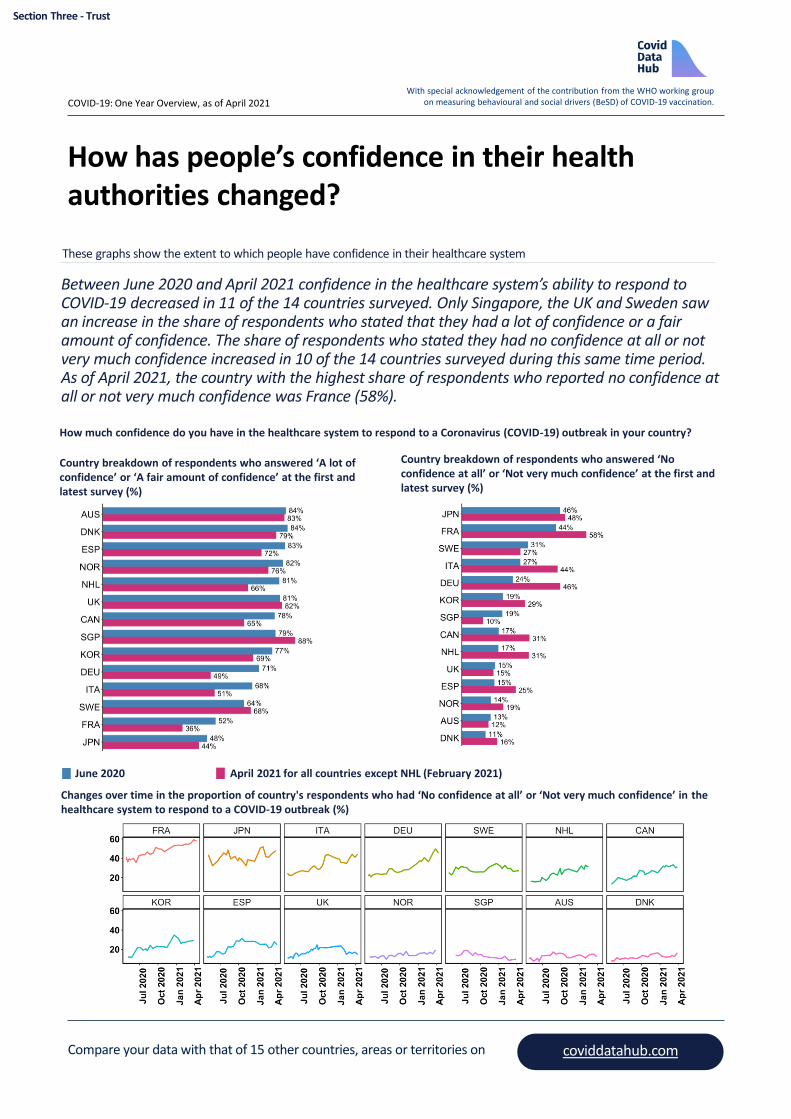
How has people’s confidence in their health authorities changed?
Between June 2020 and April 2021 confidence in the healthcare system’s ability to respond to COVID-19 decreased in 11 of the 14 countries surveyed. Only Singapore, the UK and Sweden saw an increase in the share of respondents who stated that they had a lot of confidence or a fair amount of confidence. The share of respondents who stated they had no confidence at all or not very much confidence increased in 10 of the 14 countries surveyed during this same time period. As of April 2021, the country with the highest share of respondents who reported no confidence at all or not very much confidence was France (58%).
These graphs show the extent to which people have confidence in their healthcare system
COVID-19: One Year Overview, as of April 2021
Country breakdown of respondents who answered ‘A lot of confidence’ or ‘A fair amount of confidence’ at the first and latest survey (%)
June 2020 April 2021 for all countries except NHL (February 2021)
Changes over time in the proportion of country's respondents who had ‘No confidence at all’ or ‘Not very much confidence’ in thehealthcare system to respond to a COVID-19 outbreak (%)
Country breakdown of respondents who answered ‘No confidence at all’ or ‘Not very much confidence’ at the first and latest survey (%)
How much confidence do you have in the healthcare system to respond to a Coronavirus (COVID-19) outbreak in your country?
Section Three - Trust
With special acknowledgement of the contribution from the WHO working group on measuring behavioural and social drivers (BeSD) of COVID-19 vaccination.
Compare your data with that of 15 other countries, areas or territories on coviddatahub.com
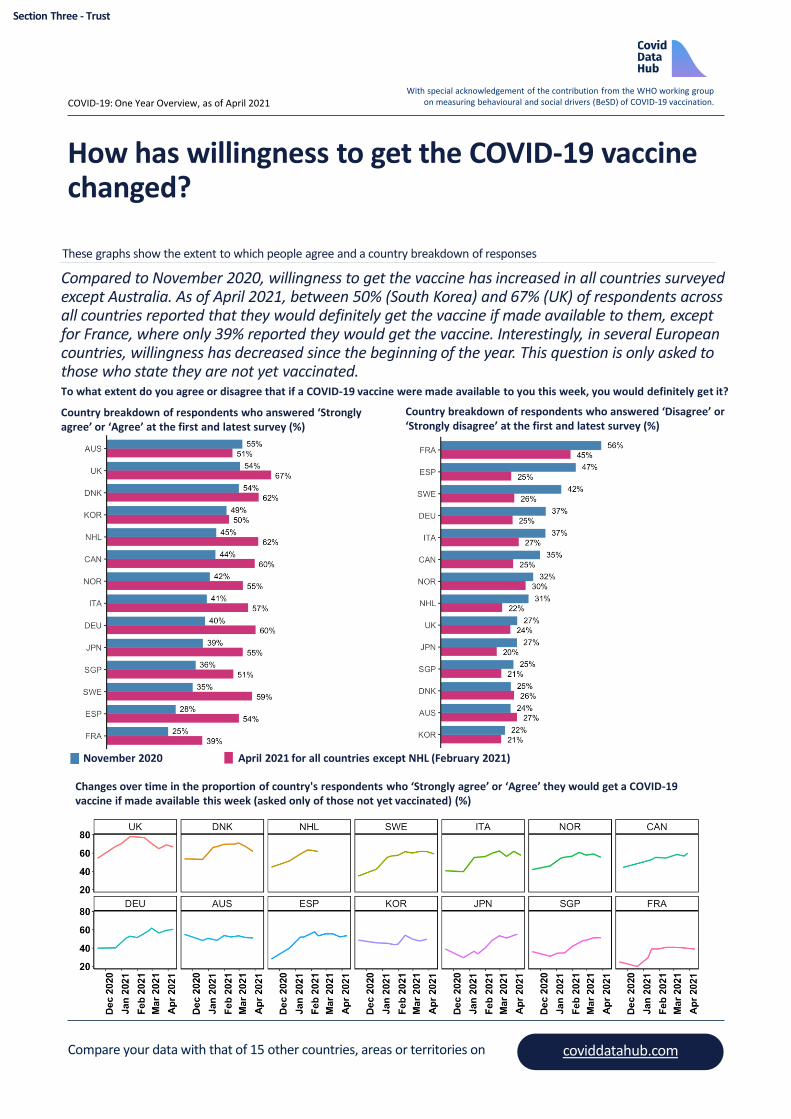
How has willingness to get the COVID-19 vaccine changed?
Compared to November 2020, willingness to get the vaccine has increased in all countries surveyed except Australia. As of April 2021, between 50% (South Korea) and 67% (UK) of respondents across all countries reported that they would definitely get the vaccine if made available to them, except for France, where only 39% reported they would get the vaccine. Interestingly, in several European countries, willingness has decreased since the beginning of the year. This question is only asked to those who state they are not yet vaccinated.
These graphs show the extent to which people agree and a country breakdown of responses
Changes over time in the proportion of country's respondents who ‘Strongly agree’ or ‘Agree’ they would get a COVID-19 vaccine if made available this week (asked only of those not yet vaccinated) (%)
COVID-19: One Year Overview, as of April 2021
Country breakdown of respondents who answered ‘Strongly agree’ or ‘Agree’ at the first and latest survey (%)
November 2020 April 2021 for all countries except NHL (February 2021)
Country breakdown of respondents who answered ‘Disagree’ or ‘Strongly disagree’ at the first and latest survey (%)
To what extent do you agree or disagree that if a COVID-19 vaccine were made available to you this week, you would definitely get it?
Section Three - Trust

With special acknowledgement of the contribution from the WHO working group on measuring behavioural and social drivers (BeSD) of COVID-19 vaccination.
Compare your data with that of 15 other countries, areas or territories on coviddatahub.com
How concerned are people about possible side-effects from a COVID-19 vaccine?
Compared to November 2020, concerns about side-effects of a COVID-19 vaccine have decreased in 12 of the 14 countries surveyed, although concerns have increased in several countries since the beginning of the year. As of April 2021, over half of the population were still concerned about side-effects in 5 of the 14 countries surveyed. The UK had the lowest share of respondents who stated they were worried about side-effects (27%), while South Korea, Japan and France had the highest (each at 60%).
These graphs show the extent to which people agree and a country breakdown of responses
Changes over time in the proportion of country’s respondents who ‘Strongly agree’ or ‘Agree’ that they are worried about potential side-effects of a COVID-19 vaccine (%)
COVID-19: One Year Overview, as of April 2021
Country breakdown of respondents who answered ‘Strongly agree’ or ‘Agree’ at the first and latest survey (%)
November 2020 April 2021 for all countries except NHL (February 2021)
Country breakdown of respondents who answered ‘Disagree’ or ‘Strongly disagree’ at the first and latest survey (%)
Section Three - Trust
To what extent do you agree or disagree that you are worried about potential side-effects of a COVID-19 vaccine?

With special acknowledgement of the contribution from the WHO working group on measuring behavioural and social drivers (BeSD) of COVID-19 vaccination.
Compare your data with that of 15 other countries, areas or territories on coviddatahub.com
How has the potential regret of not getting a COVID-19 vaccine changed?
Compared to November 2020, the percentage of respondents who stated they would regret not getting a COVID-19 vaccine when it becomes available has increased in 12 of the 14 countries surveyed. As of April 2021, over 50% of respondents in 11 of the 14 countries surveyed stated they would regret not getting it. The largest increase was seen in Spain, from 31% to 55%. In some countries this percentage has decreased since the beginning of the year, most notably in the UK.
These graphs show the extent to which people agree and a country breakdown of responses
Change over time in the proportion of country’s respondents who ‘Strongly agree’ or ‘Agree’ that if they did not get a COVID-19 vaccine when it is available, they would regret it.
COVID-19: One Year Overview, as of April 2021
Country breakdown of respondents who answered ‘Strongly agree’ or ‘Agree’ at the first and latest survey (%)
November 2020 April 2021 for all countries except NHL (February 2021)
Country breakdown of respondents who answered ‘Disagree’ or ‘Strongly disagree’ at the first and latest survey (%)
To what extent do you agree or disagree that if you do not get a COVID-19 vaccine when it is available, you will regret it?
Section Three - Trust
With special acknowledgement of the contribution from the WHO working group on measuring behavioural and social drivers (BeSD) of COVID-19 vaccination.
Compare your data with that of 15 other countries, areas or territories on coviddatahub.com
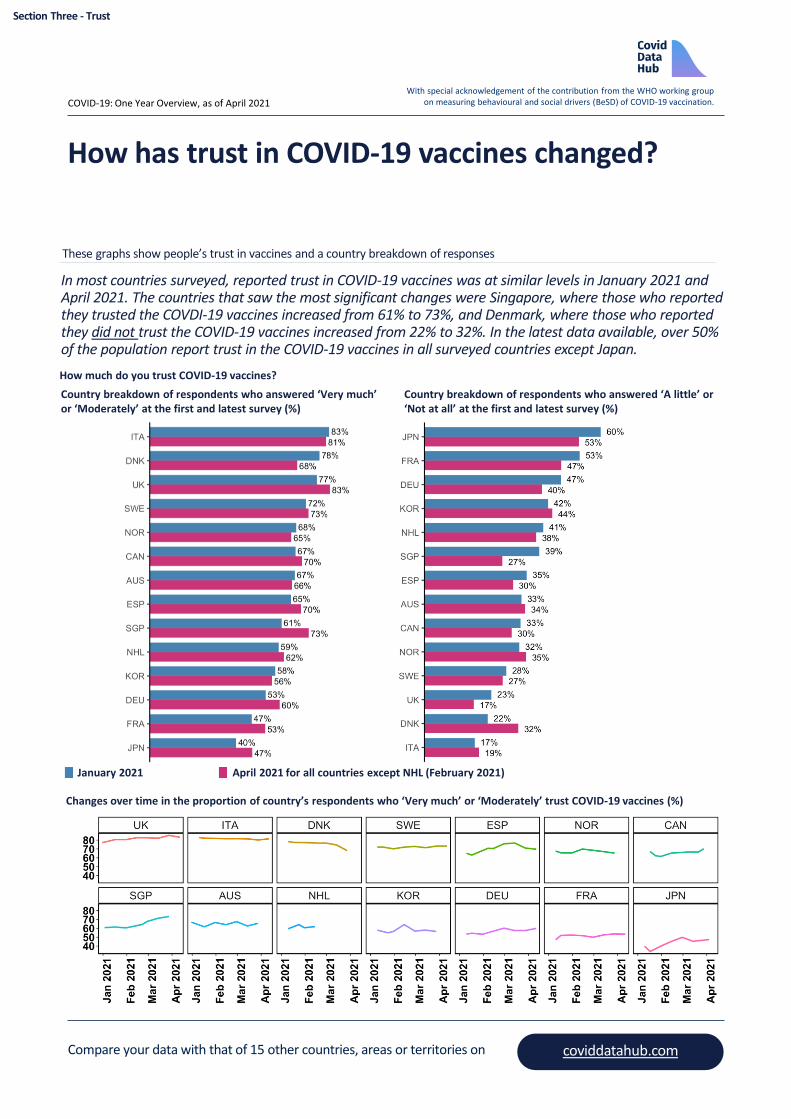
How has trust in COVID-19 vaccines changed?
In most countries surveyed, reported trust in COVID-19 vaccines was at similar levels in January 2021 and April 2021. The countries that saw the most significant changes were Singapore, where those who reported they trusted the COVDI-19 vaccines increased from 61% to 73%, and Denmark, where those who reported they did not trust the COVID-19 vaccines increased from 22% to 32%. In the latest data available, over 50% of the population report trust in the COVID-19 vaccines in all surveyed countries except Japan.
These graphs show people’s trust in vaccines and a country breakdown of responses
Changes over time in the proportion of country’s respondents who ‘Very much’ or ‘Moderately’ trust COVID-19 vaccines (%)
COVID-19: One Year Overview, as of April 2021
Country breakdown of respondents who answered ‘Very much’ or ‘Moderately’ at the first and latest survey (%)
January 2021 April 2021 for all countries except NHL (February 2021)
Country breakdown of respondents who answered ‘A little’ or ‘Not at all’ at the first and latest survey (%)
How much do you trust COVID-19 vaccines?
Section Three - Trust
With special acknowledgement of the contribution from the WHO working group on measuring behavioural and social drivers (BeSD) of COVID-19 vaccination.
Compare your data with that of 15 other countries, areas or territories on coviddatahub.com
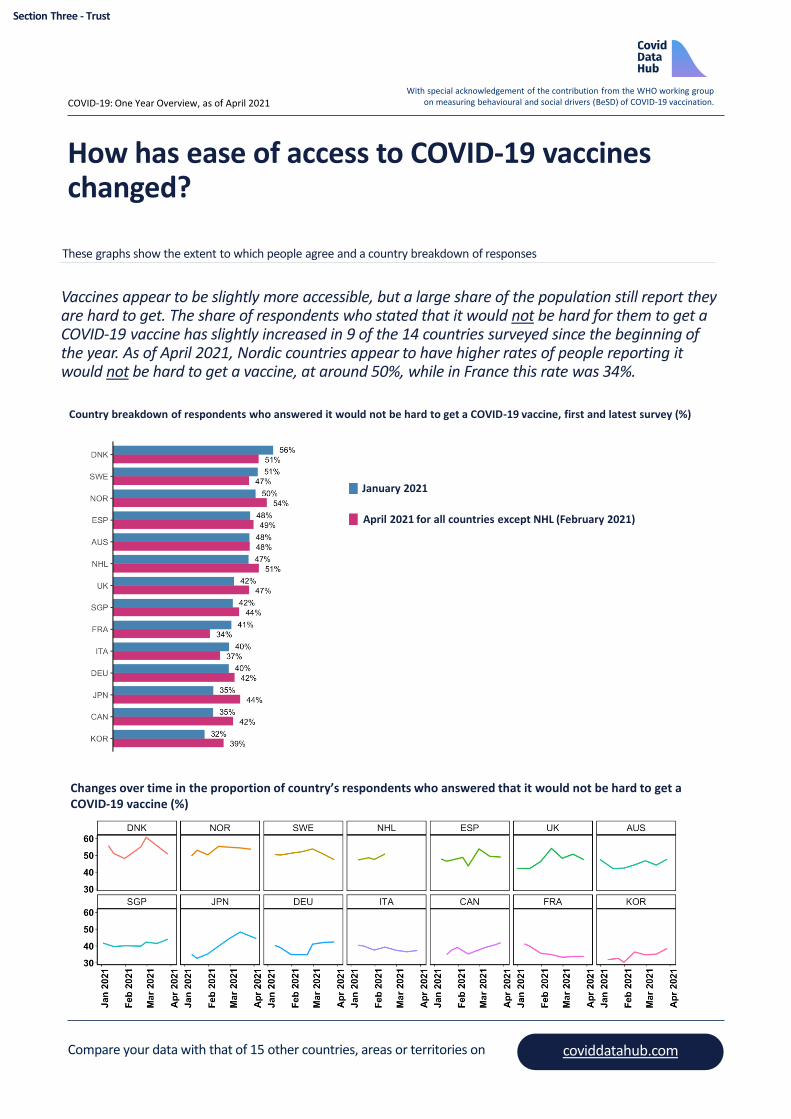
How has ease of access to COVID-19 vaccines changed?
Vaccines appear to be slightly more accessible, but a large share of the population still report they are hard to get. The share of respondents who stated that it would not be hard for them to get a COVID-19 vaccine has slightly increased in 9 of the 14 countries surveyed since the beginning of the year. As of April 2021, Nordic countries appear to have higher rates of people reporting it would not be hard to get a vaccine, at around 50%, while in France this rate was 34%.
These graphs show the extent to which people agree and a country breakdown of responses
COVID-19: One Year Overview, as of April 2021
Changes over time in the proportion of country’s respondents who answered that it would not be hard to get a COVID-19 vaccine (%)
Country breakdown of respondents who answered it would not be hard to get a COVID-19 vaccine, first and latest survey (%)
January 2021
April 2021 for all countries except NHL (February 2021)
Section Three - Trust
With special acknowledgement of the contribution from the WHO working group on measuring behavioural and social drivers (BeSD) of COVID-19 vaccination.
Compare your data with that of 15 other countries, areas or territories on coviddatahub.com
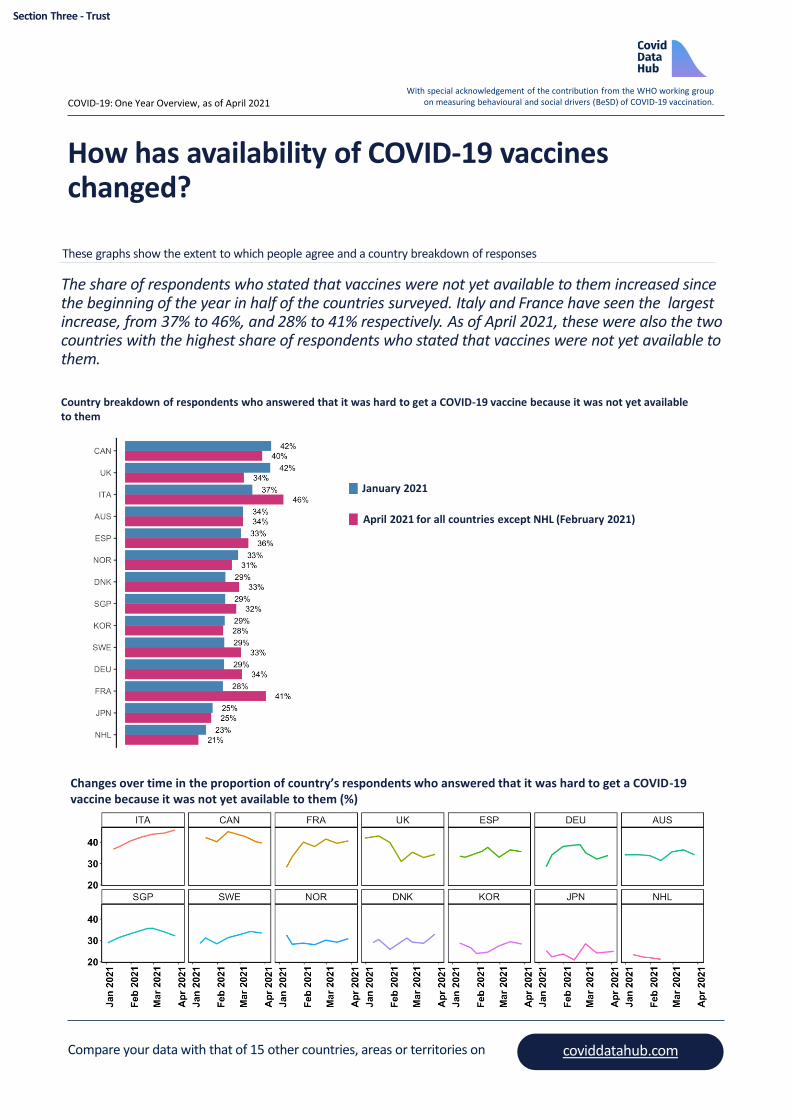
How has availability of COVID-19 vaccines changed?
The share of respondents who stated that vaccines were not yet available to them increased since the beginning of the year in half of the countries surveyed. Italy and France have seen the largest increase, from 37% to 46%, and 28% to 41% respectively. As of April 2021, these were also the two countries with the highest share of respondents who stated that vaccines were not yet available to them.
These graphs show the extent to which people agree and a country breakdown of responses
COVID-19: One Year Overview, as of April 2021
Changes over time in the proportion of country’s respondents who answered that it was hard to get a COVID-19 vaccine because it was not yet available to them (%)
Country breakdown of respondents who answered that it was hard to get a COVID-19 vaccine because it was not yet available to them
Section Three - Trust
January 2021
April 2021 for all countries except NHL (February 2021)

With special acknowledgement of the contribution from the WHO working group on measuring behavioural and social drivers (BeSD) of COVID-19 vaccination.
Compare your data with that of 15 other countries, areas or territories on coviddatahub.com
What were people’s views on contact tracing when it was introduced?
In August 2020, 61% of global respondents stated that they had heard about contact tracing on TV, making it the most common source of information on this topic. The top reasons for not wanting to provide contact information were not wanting the government to track them (30%) and not wanting technology companies to track them (25%). When asked what topics respondents would like to receive more information on, 42% chose ‘COVID-19 testing’, followed closely by topics around what would happen with the respondents and their data after being traced.
These graphs show global responses to questions related to contact tracing
COVID-19: One Year Overview, as of April 2021
From where have you heard about contact tracing? (%)
61%
46%
30%
23% 23%
16%
8% 7% 7% 6% 5%3% 3%
TV Social media Newspapers Healthauthorities
Radio World HealthOrganisation
(WHO)
Can'tremember
A communityhealth worker
My doctor Other healthor clinic staff
such as areceptionist
A nurse A contacttracing
worker whocontacted
you
Other
What is the main reason for NOT wanting to provide contact information? (%)
30%
25%
15% 15%
9% 7%
I would not want thegovernment to track me
I would not want technologycompanies to track me
It does not help the fightagainst Covid-19
Don't know I cannot be infected withCoronavirus (COVID-19)
Other
Which, if any, of the following topics related to contact tracing would you like to receive more information about? (%)
42% 41% 39% 38% 37%32%
23%
1%
COVID-19 testing What happens to mydata after being
traced
What happens tome after being
traced
What happens toother people after I
provide contact
details about them
What happens toother people's data
after I provide
contact details aboutthem
Contact tracingphone apps
Don't know Other
Section Three - Trust
1%
With special acknowledgement of the contribution from the WHO working group on measuring behavioural and social drivers (BeSD) of COVID-19 vaccination.
Compare your data with that of 15 other countries, areas or territories on coviddatahub.com
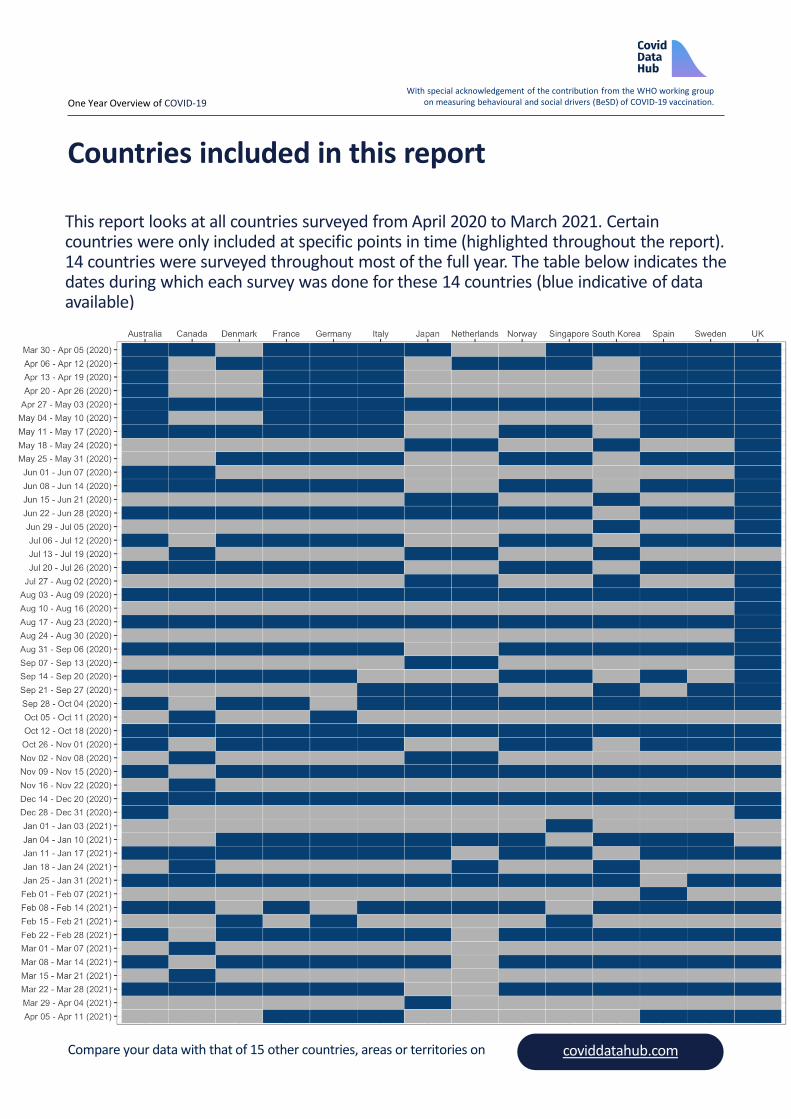
Countries included in this report
This report looks at all countries surveyed from April 2020 to March 2021. Certain countries were only included at specific points in time (highlighted throughout the report). 14 countries were surveyed throughout most of the full year. The table below indicates the dates during which each survey was done for these 14 countries (blue indicative of data available)
One Year Overview of COVID-19
CovidDataHub.com
GitHub site
For more behavioural data on a global
level, visit coviddatahub.com to explore
our interactive charts