High Profile Series™ Horizontally Curved Baffles – Colors ...
Upload
vuongkhuongCategory
view
215download
0
ATLSS is a National Center for Engineering Research on Advanced Technology for Large Structural Systems
117 ATLSS Drive
Bethlehem, PA 18015-4729
Phone: (610)758-3525 www.atlss.lehigh.edu Fax: (610)758-5902 Email: [email protected]
BEHAVIOR OF HORIZONTALLY CURVED STEEL TUBULAR-FLANGE BRIDGE GIRDERS
by
Zhuo Fan
Richard Sause
ATLSS Report No. 07-02
May 2007

ATLSS is a National Center for Engineering Research on Advanced Technology for Large Structural Systems
117 ATLSS Drive
Bethlehem, PA 18015-4729
Phone: (610)758-3525 www.atlss.lehigh.edu Fax: (610)758-5902 Email: [email protected]
BEHAVIOR OF HORIZONTALLY CURVED STEEL TUBULAR-FLANGE BRIDGE GIRDERS
by
Zhuo Fan, Ph.D. Richard Sause, Ph.D. Graduate Research Assistant Joseph T. Stuart Lehigh University Professor of Structural Engineering Lehigh University Sponsored by the Federal Highway Administration and the Pennsylvania Infrastructure Technology Alliance through a grant from the Pennsylvania Department of Community and Economic Development
ATLSS Report No. 07-02
May 2007

ii
Acknowledgements This research was conducted at the Advanced Technology for Large Structural System (ATLSS) Center of Lehigh University in Bethlehem, Pennsylvania. The research was sponsored by the Federal Highway Administration (FHWA), the Pennsylvania Infrastructure Technology Alliance (PITA) through a grant from Pennsylvania Department of Community and Economic Development, and the ATLSS Center. The findings, opinions, and conclusions expressed in this report are the authors’ and do not necessary reflect the opinions of the sponsors.

iii
Table of Contents
Acknowledgements ..............................................................................................................i Table of Contents............................................................................................................... iii List of Tables .....................................................................................................................vii List of Figures.................................................................................................................. viii Abstract................................................................................................................................1 Chapter 1 Introduction.........................................................................................................2
1.1 Overview...................................................................................................................2 1.2 Research Objectives..................................................................................................3 1.3 Report Scope.............................................................................................................3 1.4 Organization of Report .............................................................................................4
Chapter 2 Background.........................................................................................................5
2.1 Related Research ......................................................................................................5 2.2 Analytical Methods for Curved Girders ...................................................................6
2.2.1 Approximate Methods .........................................................................................6 2.2.2 Refined Methods .................................................................................................6
2.3 Theory for In-Plane Bending of Thin-Walled Girders..............................................7 2.3.1 Bending Normal Stress........................................................................................7 2.3.2 Shear Stress..........................................................................................................7
2.3.2.1 Thin-Walled Girder with Open Cross Section ..............................................7 2.3.2.2 Thin-Walled Girder with Closed Cross Section............................................8
2.4 Theory for Torsion of Thin-Walled Girders..............................................................9 2.4.1 Thin-Walled Girders with Open Section .............................................................9
2.4.1.1 Uniform Torsion............................................................................................9 2.4.1.2 Non-Uniform Torsion....................................................................................9 2.4.1.3 Total Torque ................................................................................................12
2.4.2 Thin-Walled Girders with Closed Cross Sections .............................................12 2.4.2.1 Uniform Torsion..........................................................................................12 2.4.2.2 Non-Uniform Torsion..................................................................................12 2.4.2.3 Total Torque ................................................................................................15
Chapter 3 Analytical Solutions to Differential Equations .................................................17
3.1. Differential Equations for Curved Girders ............................................................17 3.2. Solutions of Differential Equations .......................................................................18
3.2.1. Primary Bending Moment ................................................................................18 3.2.1.1 Differential Equations .................................................................................18

iv
3.2.1.2 Solutions of Differential Equations.............................................................20 3.2.2 Primary Shear Forces ........................................................................................21 3.2.3 Torsion of Girder with Open Cross Section ......................................................22
3.2.3.1 Differential Equations .................................................................................22 3.2.3.2 Solutions of Differential Equations.............................................................23 3.2.3.3 Bimoment....................................................................................................28
3.2.4 Torsion of Girder with Closed Cross Section....................................................29 3.2.4.1 Differential Equations in Terms of Warping Function................................29 3.2.4.2 Warping Torque and Bimoment ..................................................................30 3.2.4.3 St.Venant Torque .........................................................................................32 3.2.4.4 Twist Angle .................................................................................................32
3.3. Vertical Displacement for Curved Girders.............................................................34 3.3.1. Longitudinal Strain and Normal Stress ............................................................34 3.3.2. Differential Equations.......................................................................................36 3.3.3 Solutions of Differential Equation for Vertical Displacement...........................38
3.3.3.1 Solution for Girder with Open Cross Section .............................................38 3.3.3.2 Solution for Girder with Closed Cross Section...........................................40
3.4 Cross Section Rotation for Curved Girders ............................................................42 Chapter 4 Linear Elastic Theoretical Analysis ..................................................................45
4.1 Theoretical Analysis Method..................................................................................45 4.1.1 Cross Frame Forces ...........................................................................................46
4.1.1.1 Displacement Compatibility Equations ......................................................46 4.1.1.2 Constitutive Equations ................................................................................46 4.1.1.3 Equilibrium Equations ................................................................................48
4.1.2 Internal Forces ...................................................................................................49 4.2 Stress Analysis ........................................................................................................49
4.2.1 Stress Analysis of Curved I-Girders ..................................................................49 4.2.2 Stress Analysis of Curved Tubular-Flange Girders ...........................................51
Shear Stress Due to Uniform Torsion (Primary Shear Stress) ................................55 Chapter 5 Theoretical Analysis Results.............................................................................64
5.1 Bridge Configuration, Girder Dimensions, and Applied Loads .............................64 5.1.1 Bridge Configuration.........................................................................................64 5.1.2. I-Girder Dimensions.........................................................................................64 5.1.3. Tubular-Flange Girder Dimensions ..................................................................65 5.1.4 Applied Loads....................................................................................................65
5.2. Analysis Results for Curved Tubular-Flange Girder Systems ...............................65 5.2.1 Single Curved Tubular-Flange Girder ...............................................................66 5.2.2 Two Curved Tubular-Flange Girder System......................................................67

v
5.2.3 Three Curved Tubular-Flange Girder System ...................................................67 5.2.4 Summary of Findings from Results...................................................................68
5.3 Comparison with Curved I-Girder System.............................................................68 Chapter 6 Finite Element Analysis ....................................................................................96
6.1 Finite Element Model .............................................................................................96 6.1.1 Element Type.....................................................................................................96 6.1.2 Mesh Density.....................................................................................................96 6.1.3 Boundary Conditions and Loading Conditions .................................................97 6.1.4 Linear Constraints .............................................................................................97 6.1.5 Material Properties ............................................................................................97
6.2 Finite Element Analysis Results .............................................................................97 6.2.1 Single Curved Tubular-Flange Girder ...............................................................97 6.2.2 Two Curved Tubular-Flange Girder System......................................................99 6.2.3 Three Curved Tubular-Flange Girder System ...................................................99 6.2.4 Summary..........................................................................................................100
Chapter 7 Parametric Study.............................................................................................113
7.1 Single Tubular-Flange Girder ...............................................................................113 7.1.1 Effect of Tubular Flange Width .......................................................................113 7.1.2 Effect of Cross Section Depth .........................................................................114 7.1.3 Effect of Tubular Flange Depth .......................................................................114 7.1.4 Effect of Curvature ..........................................................................................115
7.2 Three Curved Tubular-Flange Girder System ......................................................116 7.2.1 Effect of Tubular Flange Width .......................................................................116 7.2.2 Effect of Tubular Flange Depth .......................................................................117 7.2.3. Effect of Curvature .........................................................................................118 7.2.3.1 Curved Tubular-Flange Girder System.........................................................118 7.2.3.2 Comparison with Curved I-Girder System...................................................119 7.2.4 Effect of Number of Cross Frames..................................................................120
7.2.4.1 Curved Tubular-Flange Girder System.....................................................120 7.2.4.2 Comparison with Curved I-Girder System ...............................................121
7.3. Comparison with Finite Element Results ............................................................122 7.3.1 Three Curved Girder System with Three Cross Frames..................................122 7.3.2 Three Curved Girder System with Multiple Cross Frames .............................123
Chapter 8 Girder Systems with Deck and Live Load......................................................166
8.1 Finite Element Model ...........................................................................................166 8.2 Effect of Concrete Deck .......................................................................................166 8.3 Live Load Analysis ...............................................................................................168

vi
8.3.1 Design Lane and Design Loads.......................................................................168 8.3.2 Live Load Distribution ....................................................................................168 8.3.3 Analysis Results...............................................................................................169
Chapter 9 Summary and Conclusions .............................................................................194
9.1 Summary...............................................................................................................194 9.2 Findings ................................................................................................................194 9.3 Conclusions...........................................................................................................196 9.4 Future Research ....................................................................................................197
References .......................................................................................................................198

vii
List of Tables
Table 5.1 Girder Geometry and Weight.............................................................................72 Table 5.2 Curved I-Girder Dimensions .............................................................................72 Table 5.3 Curved Tubular-Flange Girder Dimensions ......................................................72 Table 5.4 Maximum Stresses and Displacements for Single Girder .................................73 Table 5.5 Maximum Stress and Displacements of Curved Tubular-flange Girders ..........73 Table 5.6 Maximum Stresses and Displacements for Two-Girder Systems......................73 Table 5.7 Maximum Stresses and Displacements for Three-Girder Systems ...................74 Table 5.8 Maximum Cross Frame Forces..........................................................................74 Table 7.1 Cross Section Dimensions for Study of Tubular Flange Width.......................124 Table 7.2 Cross Section Dimensions for Study of Cross Section Depth.........................124 Table 7.3 Cross Section Dimensions for Study of Tubular Flange Depth.......................124 Table 7.4 Case 1 for Three-Girder System ......................................................................125 Table 7.5 Case 2 for Three-Girder System ......................................................................125 Table 7.6 Case 3 for Three-Girder System ......................................................................125 Table 7.7 Case 4 for Three-Girder System ......................................................................126 Table 7.8 Case 5 for Three-Girder System ......................................................................126
viii
List of Figures
Figure 2.1 Bending Moment and Curvature Sign Convention.......................................................16 Figure 2.2 Contour Coordinate and Tangential Distances on Cross Section..................................16 Figure 2.3 Associate Open Section for a Closed Section ...............................................................16 Figure 4.1 Cross Frame Forces.......................................................................................................58 Figure 4.2 Braced Cross Section Deflections at Cross Frame........................................................58 Figure 4.3 Warping Stress, Stress Resultant and Bimoment ..........................................................58 Figure 4.4 Normalized Unit Warping and Warping Static Moment ...............................................59 Figure 4.5 Primary Bending Normal Stress ...................................................................................59 Figure 4.6 Normalized Unit Warping.............................................................................................60 Figure 4.7 Global and Local Normalized Unit Warping ................................................................60 Figure 4.8 Ratio of h/bf vs.Ratio of df/bf ........................................................................................61 Figure 4.9 Vertical Shear Stress Distribution .................................................................................61 Figure 4.11 Ratio of h/bf vs.Ratio of df/bf ......................................................................................63 Figure 5.1 Three-Girder Bridge Cross Section Schematic .............................................................75 Figure 5.2 Schematic Framing Plan of Three-Girder Bridge .........................................................75 Figure 5.3 Primary Bending Normal Stress at P2 (Single Girder) .................................................76 Figure 5.4 Warping Normal Stress at P2 (Single Girder) ...............................................................76 Figure 5.5 Total Normal Stress at P2 (Single Girder) ....................................................................76 Figure 5.6 St. Venant Shear Stress at P6r (Single Girder) ..............................................................77 Figure 5.7 Warping Shear Stress at P6r (Single Girder).................................................................77 Figure 5.8 Vertical Shear Stress at P6r (Single Girder) ..................................................................77 Figure 5.9 Total Shear Stress at P6r (Single Girder) ......................................................................78 Figure 5.10 Vertical Displacement (Single Girder) ........................................................................78 Figure 5.11 Cross Section Rotation (Single Girder).......................................................................78 Figure 5.12 Von-Mises Stress at P2 (Single Girder).......................................................................79 Figure 5.13 Primary Bending Normal Stress of Inner Girder at P2 (Two-Girder Case) ................79 Figure 5.14 Warping Normal Stress of Inner Girder at P2 (Two-Girder Case) ..............................79 Figure 5.15 Total Normal Stress of Inner Girder at P2 (Two-Girder Case) ...................................80 Figure 5.16 St.Venant Shear Stress of Inner Girder at P6r (Two-Girder Case) ..............................80 Figure 5.17 Warping Shear Stress of Inner Girder at P6r (Two-Girder Case)................................80 Figure 5.18 Vertical Shear Stress of Inner Girder at P6r (Two-Girder Case) .................................81 Figure 5.19 Total Shear Stress of Inner Girder at P6r (Two-Girder Case) .....................................81 Figure 5.20 Vertical Displacement of Inner Girder (Two-Girder Case) .........................................81 Figure 5.21 Cross Section Rotation of Inner Girder (Two-Girder Case) .......................................82 Figure 5.22 Von-Mises Stress of Inner Girder at P2 (Two-Girder Case) .......................................82 Figure 5.23 Primary Bending Normal Stress of Outer Girder at P3 (Two-Girder Case) ...............82 Figure 5.24 Warping Normal Stress of Outer Girder at P3 (Two-Girder Case) .............................83

ix
Figure 5.25 Total Normal Stress of Outer Girder at P3 (Two-Girder Case)...................................83 Figure 5.26 St.Venant Shear Stress of Outer Girder at P6r (Two-Girder Case) .............................83 Figure 5.27 Warping Shear Stress of Outer Girder at P6r (Two-Girder Case) ...............................84 Figure 5.28 Vertical Shear Stress of Outer Girder at P6r (Two-Girder Case) ................................84 Figure 5.29 Total Shear Stress of Outer Girder at P6r (Two-Girder Case) ....................................84 Figure 5.30 Vertical Displacement of Outer Girder (Two-Girder Case) ........................................85 Figure 5.31 Cross Section Rotation of Outer Girder (Two-Girder Case).......................................85 Figure 5.32 Von-Mises Stress of Outer Girder at P3 (Two-Girder Case).......................................85 Figure 5.33 Primary Bending Normal Stress of Inner Girder at P3 (Three-Girder Case)..............86 Figure 5.34 Warping Normal Stress of Inner Girder at P3 (Three-Girder Case)............................86 Figure 5.35 Total Normal Stress of Inner Girder at P3 (Three-Girder Case) .................................86 Figure 5.36 St.Venant Shear Stress of Inner Girder at P6r (Three-Girder Case)............................87 Figure 5.37 Warping Shear Stress of Inner Girder at P6r (Three-Girder Case) .............................87 Figure 5.38 Vertical Shear Stress of Inner Girder at P6r (Three-Girder Case)...............................87 Figure 5.39 Total Shear Stress of Inner Girder at P6r (Three-Girder Case) ...................................88 Figure 5.40 Vertical Displacement of Inner Girder (Three-Girder Case).......................................88 Figure 5.41 Cross Section Rotation of Inner Girder (Three-Girder Case) .....................................88 Figure 5.42 Von-Mises Stress of Inner Girder at P3 (Three-Girder Case) .....................................89 Figure 5.43 Primary Bending Normal Stress of Middle Girder at P3 (Three-Girder Case)...........89 Figure 5.44 Warping Normal Stress of Middle Girder at P3 (Three-Girder Case) ........................89 Figure 5.45 Total Normal Stress of Middle Girder at P3 (Three-Girder Case) ..............................90 Figure 5.46 St.Venant Shear Stress of Middle Girder at P6r (Three-Girder Case).........................90 Figure 5.47 Warping Shear Stress of Middle Girder at P6r (Three-Girder Case) ..........................90 Figure 5.48 Vertical Shear Stress of Middle Girder at P6r (Three-Girder Case)............................91 Figure 5.49 Total Shear Stress of Middle Girder at P6r (Three-Girder Case)................................91 Figure 5.50 Vertical Displacement of Middle Girder (Three-Girder Case)....................................91 Figure 5.51 Cross Section Rotation of Middle Girder (Three-Girder Case) ..................................92 Figure 5.52 Von-Mises Stresses of Middle Girder at P3 (Three-Girder Case)...............................92 Figure 5.53 Primary Bending Normal Stress of Outer Girder at P3 (Three-Girder Case) .............92 Figure 5.54 Warping Normal Stress of Outer Girder at P3 (Three-Girder Case) ...........................93 Figure 5.55 Total Normal Stress of Outer Girder at P3 (Three-Girder Case) ................................93 Figure 5.56 St.Venant Shear Stress of Outer Girder at P6r (Three-Girder Case) ...........................93 Figure 5.57 Warping Shear Stress of Outer Girder at P6r (Three-Girder Case).............................94 Figure 5.58 Vertical Shear Stress of Outer Girder at P6r (Three-Girder Case) ..............................94 Figure 5.59 Total Shear Stress of Outer Girder at P6r (Three-Girder Case) ..................................94 Figure 5.60 Vertical Displacement of Outer Girder (Three-Girder Case) ......................................95 Figure 5.61 Cross Section Rotation of Outer Girder (Three-Girder Case) ....................................95 Figure 5.62 Von-Mises Stress of Outer Girder at P3 (Three-Girder Case).....................................95 Figure 6.1 Finite Element Model of Three-Girder System ..........................................................101 Figure 6.2 Boundary Condition....................................................................................................102

x
Figure 6.3 Linear Constraints ..............................................................................................................102 Figure 6.4 Total Normal Stress at P2 (Single Girder)..........................................................................103 Figure 6.5 Total Shear Stress at P6r (Single Girder) ...........................................................................103 Figure 6.6 Vertical Displacement (Single Girder) ...............................................................................103 Figure 6.7 Cross Section Rotation (Single Girder)..............................................................................104 Figure 6.8 Von-Mises Stress at P2 (Single Girder)..............................................................................104 Figure 6.9 Total Normal Stress of Inner Girder at P2 (Two-Girder Case)...........................................104 Figure 6.10 Total Shear Stress of Inner Girder at P6r (Two-Girder Case)...........................................105 Figure 6.11 Vertical Displacement of Inner Girder (Two-Girder Case) ..............................................105 Figure 6.12 Cross Section Rotation of Inner Girder (Two-Girder Case).............................................105 Figure 6.13 Von-Mises Stress of Inner Girder at P2 (Two-Girder Case).............................................106 Figure 6.14 Total Normal Stress of Outer Girder at P3 (Two-Girder Case) ........................................106 Figure 6.15 Total Shear Stress of Outer Girder at P6r (Two-Girder Case)..........................................106 Figure 6.16 Vertical Displacement of Outer Girder (Two-Girder Case)..............................................107 Figure 6.17 Cross Section Rotation of Outer Girder (Two-Girder Case) ............................................107 Figure 6.18 Von-Mises Stress of Outer Girder at P3 (Two-Girder Case) ............................................107 Figure 6.19 Total Normal Stress of Inner Girder at P2 (Three-Girder Case) ......................................108 Figure 6.20 Total Shear Stress of Inner Girder at P6r (Three-Girder Case) ........................................108 Figure 6.21 Vertical Displacement of Inner Girder (Three-Girder Case) ............................................108 Figure 6.22 Cross Section Rotation of Inner Girder (Three-Girder Case) ..........................................109 Figure 6.23 Von-Mises Stress of Inner Girder at P2 (Three-Girder Case)...........................................109 Figure 6.24 Total Normal Stress of Middle Girder at P3 (Three-Girder Case) ...................................109 Figure 6.25 Total Shear Stress of Middle Girder at P6r (Three-Girder Case) .....................................110 Figure 6.26 Vertical Displacement of Middle Girder (Three-Girder Case).........................................110 Figure 6.27 Cross Section Rotation of Middle Girder (Three-Girder Case) .......................................110 Figure 6.28 Von-Mises Stress of Middle Girder at P3 (Three-Girder Case) .......................................111 Figure 6.29 Total Normal Stress of Outer Girder at P3 (Three-Girder Case)......................................111 Figure 6.30 Total Shear Stress of Outer Girder at P6r (Three-Girder Case)........................................111 Figure 6.31 Vertical Displacement of Outer Girder (Three-Girder Case) ...........................................112 Figure 6.32 Cross Section Rotation of Outer Girder (Three-Girder Case)..........................................112 Figure 6.33 Von-Mises Stress of Outer Girder at P3 (Three-Girder Case)..........................................112 Figure 7.1 Maximum Bending Normal Stress vs. Tubular Flange Width............................................127 Figure 7.2 Maximum Warping Normal Stress vs. Tubular Flange Width ...........................................127 Figure 7.3 Maximum Total Normal Stress vs. Tubular Flange Width .................................................127 Figure 7.4 Maximum St.Venant Shear Stress vs. Tubular Flange Width.............................................128 Figure 7.5 Maximum Vertical Shear Stress vs. Tubular Flange Width................................................128 Figure 7.6 Maximum Total Shear Stress vs. Tubular Flange Width ....................................................128 Figure 7.7 Maximum Von-Mises Stress vs. Tubular Flange Width .....................................................129 Figure 7.8 Maximum Vertical Displacement vs. Tubular Flange Width .............................................129 Figure 7.9 Maximum Cross Section Rotation vs. Tubular Flange Width............................................129

xi
Figure 7.10 Maximum Bending Normal Stress vs. Cross Section Depth............................................130 Figure 7.11 Maximum Warping Normal Stress vs. Cross Section Depth............................................130 Figure 7.12 Maximum Total Normal Stress vs. Cross Section Depth .................................................130 Figure 7.13 Maximum St. Venant Shear Stress vs. Cross Section Depth ............................................131 Figure 7.14 Maximum Vertical Shear Stress vs. Cross Section Depth ................................................131 Figure 7.15 Maximum Total Shear Stress vs. Cross Section Depth ....................................................131 Figure 7.16 Maximum Von-Mises Stress vs. Cross Section Depth .....................................................132 Figure 7.17 Maximum Vertical Displacement vs. Cross Section Depth..............................................132 Figure 7.18 Maximum Cross Section Rotation vs. Cross Section Depth ............................................132 Figure 7.19 Maximum Bending Normal Stress vs. Tubular Flange Depth..........................................133 Figure 7.20 Maximum Warping Normal Stress vs. Tubular Flange Depth .........................................133 Figure 7.21 Maximum Total Normal Stress vs. Tubular Flange Depth ...............................................133 Figure 7.22 Maximum St. Venant Shear Stress vs. Tubular Flange Depth..........................................134 Figure 7.23 Maximum Vertical Shear Stress vs. Tubular Flange Depth..............................................134 Figure 7.24 Maximum Total Shear Stress vs. Tubular Flange Depth ..................................................134 Figure 7.25 Maximum Von-Mises Stress vs. Tubular Flange Depth ...................................................135 Figure 7.26 Maximum Vertical Displacement vs. Tubular Flange Depth ...........................................135 Figure 7.27 Maximum Cross Section Rotation vs. Tubular Flange Depth..........................................135 Figure 7.28 Maximum Bending Normal Stress vs. Girder Curvature .................................................136 Figure 7.29 Maximum Warping Normal Stress vs. Girder Curvature .................................................136 Figure 7.30 Maximum Total Normal Stress vs. Girder Curvature.......................................................136 Figure 7.31 Maximum St.Venant Shear Stress vs. Girder Curvature ..................................................137 Figure 7.32 Maximum Warping Shear Stress vs. Girder Curvature ....................................................137 Figure 7.33 Maximum Vertical Shear Stress vs. Girder Curvature .....................................................137 Figure 7.34 Maximum Total Shear Stress vs. Girder Curvature..........................................................138 Figure 7.35 Maximum Von-Mises Stress vs. Girder Curvature...........................................................138 Figure 7.36 Maximum Vertical Displacement vs. Girder Curvature ...................................................138 Figure 7.37 Maximum Cross Section Rotaion vs. Girder Curvature...................................................139 Figure 7.38 Maximum Bending Normal Stress vs. Tubular Flange Width..........................................139 Figure 7.39 Maximum Warping Normal Stress vs. Tubular Flange Width .........................................139 Figure 7.40 Maximum Total Normal Stress vs. Tubular Flange Width ...............................................140 Figure 7.41 Maximum St.Venant Shear Stress vs. Tubular Flange Width...........................................140 Figure 7.42 Maximum Warping Shear Stress vs. Tubular Flange Width.............................................140 Figure 7.43 Maximum Vertical Shear Stress vs. Tubular Flange Width..............................................141 Figure 7.44 Maximum Total Shear Stress vs. Tubular Flange Width ..................................................141 Figure 7.45 Maximum Von Mises Stress vs. Tubular Flange Width ...................................................141 Figure 7.46 Maximum Vertical Displacement vs. Tubular Flange Width ...........................................142 Figure 7.47 Maximum Cross Section Rotation vs. Tubular Flange Width..........................................142 Figure 7.48 Maximum Bending Normal Stress vs. Tubular Flange Depth..........................................142 Figure 7.49 Maximum Warping Normal Stress vs. Tubular Flange Depth .........................................143
xii
Figure 7.50 Maximum Total Normal Stress vs. Tubular Flange Depth ...............................................143 Figure 7.51 Maximum St.Venant Shear Stress vs. Tubular Flange Depth...........................................143 Figure 7.52 Maximum Warping Shear Stress vs. Tubular Flange Depth.............................................144 Figure 7.53 Maximum Vertical Shear Stress vs. Tubular Flange Depth..............................................144 Figure 7.54 Maximum Total Shear Stress vs. Tubular Flange Depth ..................................................144 Figure 7.55 Maximum Von-Mises Stress vs. Tubular Flange Depth ...................................................145 Figure 7.56 Maximum Vertical Displacement vs. Tubular Flange Depth ...........................................145 Figure 7.57 Maximum Cross Section Rotation vs. Tubular Flange Depth..........................................145 Figure 7.58 Maximum Bending Normal Stress vs. Girder Curvature for TFG System ......................146 Figure 7.59 Maximum Warping Normal Stress vs. Girder Curvature for TFG System ......................146 Figure 7.60 Maximum Total Normal Stress vs. Girder Curvature for TFG System............................146 Figure 7.61 Maximum St. Venant Shear Stress vs. Girder Curvature for TFG System.......................147 Figure 7.62 Maximum Warping Shear Stress vs. Girder Curvature for TFG System .........................147 Figure 7.63 Maximum Vertical Shear Stress vs. Girder Curvature for TFG System...........................147 Figure 7.64 Maximum Total Shear Stress vs. Girder Curvature for TFG System...............................148 Figure 7.65 Maximum Von-Mises Stress vs. Girder Curvature for TFG System................................148 Figure 7.66 Maximum Vertical Displacement vs. Girder Curvature for TFG System ........................148 Figure 7.67 Maximum Cross Section Rotation vs. Girder Curvature for TFG System.......................149 Figure 7.68 Maximum Bending Normal Stress vs. Girder Curvature for I-Girder System.................149 Figure 7.69 Maximum Warping Normal Stress vs. Girder Curvature for I-Girder System.................149 Figure 7.70 Maximum Total Normal Stress vs. Girder Curvature for I-Girder System ......................150 Figure 7.71 Maximum St.Venant Shear Stress vs. Girder Curvature for I-Girder System ..................150 Figure 7.72 Maximum Warping Shear Stress vs. Girder Curvature for I-Girder System....................150 Figure 7.73 Maximum Vertical Shear Stress vs. Girder Curvature for I-Girder System .....................151 Figure 7.74 Maximum Total Shear Stress vs. Girder Curvature for I-Girder System .........................151 Figure 7.75 Maximum Von-Mises Stress vs. Girder Curvature for I-Girder System ..........................151 Figure 7.76 Maximum Vertical Displacement vs. Girder Curvature for I-Girder System...................152 Figure 7.77 Maximum Cross Section Rotation vs. Girder Curvature for I-Girder System .................152 Figure 7.78 Maximum Bending Normal Stress vs. Girder Curvature .................................................152 Figure 7.79 Maximum Warping Normal Stress vs. Girder Curvature .................................................153 Figure 7.80 Maximum Total Normal Stress vs. Girder Curvature.......................................................153 Figure 7.81 Maximum St.Venant Shear Stress vs. Girder Curvature ..................................................153 Figure 7.82 Maximum Warping Shear Stress vs. Girder Curvature ....................................................154 Figure 7.83 Maximum Vertical Shear Stress vs. Girder Curvature .....................................................154 Figure 7.84 Maximum Total Shear Stress vs. Girder Curvature..........................................................154 Figure 7.85 Maximum Von-Mises Stress vs. Girder Curvature...........................................................155 Figure 7.86 Maximum Vertical Displacement vs. Girder Curvature ...................................................155 Figure 7.87 Maximum Cross Section Rotation vs. Girder Curvature .................................................155 Figure 7.88 Maximum Bending Normal Stress of Inner Girder vs. Number of Cross Frames ...........156 Figure 7.89 Maximum Warping Normal Stress of Inner Girder vs. Number of Cross Frames ...........156

xiii
Figure 7.90 Maximum Total Normal Stress of Inner Girder vs. Number of Cross Frames.................156 Figure 7.91 Maximum St.Venant Shear Stress of Inner Girder vs. Number of Cross Frames.............157 Figure 7.92 Maximum Warping Shear Stress of Inner Girder vs. Number of Cross Frames ..............157 Figure 7.93 Maximum Vertical Shear Stress of Inner Girder vs. Number of Cross Frames................157 Figure 7.94 Maximum Total Shear Stress of Inner Girder vs. Number of Cross Frames....................158 Figure 7.95 Maximum Von-Mises Stress of Inner Girder vs. Number of Cross Frames.....................158 Figure 7.96 Maximum Vertical Displacement of Inner Girder vs. Number of Cross Frames .............158 Figure 7.97 Maximum Cross Section Rotation of Inner Girder vs. Number of Cross Frames............159 Figure 7.98 Maximum Bending Normal Stress of Middle Girder vs. Number of Cross Frames ........159 Figure 7.99 Maximum Warping Normal Stress of Middle Girder vs. Number of Cross Frames ........159 Figure 7.100 Maximum Total Normal Stress of Middle Girder vs. Number of Cross Frames............160 Figure 7.101 Maximum St.Venant Shear Stress of Middle Girder vs. Number of Cross Frames .......160 Figure 7.102 Maximum Warping Shear Stress of Middle Girder vs. Number of Cross Frames .........160 Figure 7.103 Maximum Vertical Shear Stress of Middle Girder vs. Number of Cross Frames ..........161 Figure 7.104 Maximum Total Shear Stress of Middle Girder vs. Number of Cross Frames...............161 Figure 7.105 Maximum Von-Mises Stress of Middle Girder vs. Number of Cross Frames................161 Figure 7.106 Maximum Vertical Displacement of Middle Girder vs. Number of Cross Frames ........162 Figure 7.107 Maximum Cross Section Rotation of Middle Girder vs. Number of Cross Frames.......162 Figure 7.108 Maximum Bending Normal Stress of Outer Girder vs. Number of Cross Frames.........162 Figure 7.109 Maximum Warping Normal Stress of Outer Girder vs. Number of Cross Frames.........163 Figure 7.110 Maximum Total Normal Stress of Outer Girder vs. Number of Cross Frames ..............163 Figure 7.111 Maximum St.Venant Shear Stress of Outer Girder vs. Number of Cross Frames ..........163 Figure 7.112 Maximum Warping Shear Stress of Outer Girder vs. Number of Cross Frames............164 Figure 7.113 Maximum Vertical Shear Stress of Outer Girder vs. Number of Cross Frames .............164 Figure 7.114 Maximum Total Shear Stress of Outer Girder vs. Number of Cross Frames .................164 Figure 7.115 Maximum Von-Mises Stress of Outer Girder vs. Number of Cross Frames ..................165 Figure 7.116 Maximum Vertical Displacement of Outer Girder vs. Number of Cross Frames...........165 Figure 7.117 Maximum Cross Section Rotation of Outer Girder vs. Number of Cross Frames .........165 Figure 8.1 Finite Element Model for Girder System with Composite Concrete Deck........................171 Figure 8.2 Total Normal Stress at P3 for TG1 .....................................................................................172 Figure 8.3 Total Normal Stress at P2 for TG1 .....................................................................................172 Figure 8.4 Total Shear Stress at P6r for TG1.......................................................................................172 Figure 8.5 Vertical Displacement for TG1...........................................................................................173 Figure 8.6 Cross Section Rotation for TG1 .........................................................................................173 Figure 8.7 Total Normal Stress at P3 for TG2 .....................................................................................173 Figure 8.8 Total Normal Stress at P2 for TG2 .....................................................................................174 Figure 8.9 Total Shear Stress at P6r for TG2.......................................................................................174 Figure 8.10 Vertical Displacement for TG2.........................................................................................174 Figure 8.11 Cross Section Rotation for TG2 .......................................................................................175 Figure 8.12 Total Normal Stress at P3 for TG3 ...................................................................................175
xiv
Figure 8.13 Total Normal Stress at P2 for TG3 ...................................................................................175 Figure 8.14 Total Shear Stress at P6r for TG3.....................................................................................176 Figure 8.15 Vertical Displacement for TG3.........................................................................................176 Figure 8.16 Cross Section Rotation for TG3 .......................................................................................176 Figure 8.17 Live Load Distribution for Maximum Effect on TG3......................................................177 Figure 8.18 Live Load Distribution for Maximum Effect on TG2......................................................177 Figure 8.19 Live Load Distribution for Maximum Effect on TG1......................................................177 Figure 8.20 Total Normal Stress at P3 for G1 and TG1 with 5 stiffeners (Lane Load) .......................178 Figure 8.21 Total Normal Stress at P2 for G1 and TG1 with 5 stiffeners (Lane Load) .......................178 Figure 8.22 Vertical Displacement for G1 and TG1 with 5 stiffeners (Lane Load) ............................178 Figure 8.23 Cross Section Rotation for G1 and TG1 with 5 Stiffeners (Lane Load) ..........................179 Figure 8.24 Total Normal Stress at P3 for G2 and TG2 with 5 Stiffeners (Lane Load) ......................179 Figure 8.25 Total Normal Stress at P2 for G2 and TG2 with 5 Stiffeners (Lane Load) ......................179 Figure 8.26 Vertical Displacement for G2 and TG2 with 5 Stiffeners (Lane Load)............................180 Figure 8.27 Cross Section Rotation for G2 and TG2 with 5 Stiffeners (Lane Load) ..........................180 Figure 8.28 Total Normal Stress at P3 for G3 and TG3 with 5 Stiffeners (Lane Load) ......................180 Figure 8.29 Total Normal Stress at P2 for G3 and TG3 with 5 Stiffeners (Lane Load) ......................181 Figure 8.30 Vertical Displacement for G3 and TG3 with 5 Stiffeners (Lane Load)............................181 Figure 8.31 Cross Section Rotation for G3 and TG3 with 5 Stiffeners (Lane Load) ..........................181 Figure 8.32 Total Normal Stress at P3 for G1 and TG1 with 5 Stiffeners (Truck Load).....................182 Figure 8.33 Total Normal Stress at P2 for G1 and TG1 with 5 Stiffeners (Truck Load).....................182 Figure 8.34 Vertical Displacement for G1 and TG1 with 5 Stiffeners (Truck Load) ..........................182 Figure 8.35 Cross Section Rotation for G1 and TG1 with 5 Stiffeners (Truck Load).........................183 Figure 8.36 Total Normal Stress at P3 for G1 and TG2 with 5 Stiffeners (Truck Load).....................183 Figure 8.37 Total Normal Stress at P2 for G2 and TG2 with 5 Stiffeners (Truck Load).....................183 Figure 8.38 Vertical Displacement for G2 and TG2 with 5 Stiffeners (Truck Load) ..........................184 Figure 8.39 Cross Section Rotation for G2 and TG2 with 5 Stiffeners (Truck Load).........................184 Figure 8.40 Total Normal Stress at P3 for G3 and TG3 with 5 Stiffeners (Truck Load).....................184 Figure 8.41 Total Normal Stress at P2 for G3 and TG3 with 5 Stiffeners (Truck Load).....................185 Figure 8.42 Vertical Displacement for G3 and TG3 with 5 Stiffeners (Truck Load) ..........................185 Figure 8.43 Cross Section Rotation for G3 and TG3 with 5 Stiffeners (Truck Load).........................185 Figure 8.44 Total Normal Stress at P3 for G1 and TG1 with 9 Stiffeners (Lane Load) ......................186 Figure 8.45 Total Normal Stress at P2 for G1 and TG1 with 9 Stiffeners (Lane Load) ......................186 Figure 8.46 Vertical Displacement for G1 and TG1 with 9 Stiffeners (Lane Load)............................186 Figure 8.47 Cross Section Rotation for G1 and TG1 with 9 Stiffeners (Lane Load) ..........................187 Figure 8.48 Total Normal Stress at P3 for G2 and TG2 with 9 Stiffeners (Lane Load) ......................187 Figure 8.49 Total Normal Stress at P2 for G2 and TG2 with 9 Stiffeners (Lane Load) ......................187 Figure 8.50 Vertical Displacement for G2 and TG2 with 9 Stiffeners (Lane Load)..........................188 Figure 8.51 Cross Section Rotation for G2 and TG2 with 9 Stiffeners (Lane Load) ..........................188 Figure 8.52 Total Normal Stress at P3 for G3 and TG3 with 9 Stiffeners (Lane Load) ......................188

xv
Figure 8.53 Total Normal Stress at P2 for G3 and TG3 with 9 Stiffeners (Lane Load) ......................189 Figure 8.54 Vertical Displacement for G3 and TG3 with 9 Stiffeners (Lane Load)............................189 Figure 8.55 Cross Section Rotation for G3 and TG3 with 9 Stiffeners (Lane Load) ..........................189 Figure 8.56 Total Normal Stress at P3 for TG1 with 9 Stiffeners (Truck Load)..................................190 Figure 8.57 Total Normal Stress at P2 for TG1 with 9 Stiffeners (Truck Load)..................................190 Figure 8.58 Vertical Displacement for TG1 with 9 Stiffeners (Truck Load) .......................................190 Figure 8.59 Cross Section Rotation for TG1 with 9 Stiffeners (Truck Load) .....................................191 Figure 8.60 Total Normal Stress at P3 for TG2 with 9 Stiffeners (Truck Load)..................................191 Figure 8.61 Total Normal Stress at P2 for TG2 with 9 Stiffeners (Truck Load)..................................191 Figure 8.62 Vertical Displacement for TG2 with 9 Stiffeners (Truck Load) .......................................192 Figure 8.63 Cross Section Rotation for TG2 with 9 Stiffeners (Truck Load) .....................................192 Figure 8.64 Total Normal Stress at P3 for TG3 with 9 Stiffeners (Truck Load)..................................192 Figure 8.65 Total Normal Stress at P2 for TG3 with 9 Stiffenres (Truck Load)..................................193 Figure 8.66 Vertical Displacement for TG3 with 9 Stiffeners (Truck Load) .......................................193 Figure 8.67 Cross Section Rotation for TG3 with 9 Stiffeners (Truck Load) .....................................193

1
Abstract
A new type of curved steel bridge girder, called a curved tubular-flange girder, with rectangular tubes as flanges, is proposed and studied in this report. A curved steel tubular-flange girder has much larger torsional stiffness than a curved I-girder and less potential for cross section distortion than a curved box-girder. Therefore, it has potential advantages compared to curved I-girders and box-girders. A theoretical analysis method for systems of curved tubular-flange girders braced by cross frames is presented. A stress analysis method for tubular-flange girders is also provided. The behavior of curved tubular-flange girder systems is studied using the theoretical analysis method and compared to the behavior of the corresponding curved I-girder systems. A parametric study is performed using the theoretical analysis method to investigate the effects of geometric parameters on the behavior of curved tubular-flange girder systems. The studied parameters include tubular-flange width, tubular-flange depth, cross section depth, girder curvature, and the number of cross frames. Finite element analyses are conducted to verify the theoretical analysis method, to study the behavior of a curved tubular-flange girder system under dead load, and to study the behavior of a curved tubular-flange girder system with a composite concrete deck under dead and live load. The study shows that a curved tubular-flange girder system develops much less warping normal stress and cross section rotation than a corresponding curved I-girder system. The difference is especially significant for a single curved girder under its own weight, suggesting that curved tubular-flange girders would be much easier to transport and erect than curved I-girders. As girder curvature increases, the rate of increase in the stresses and displacements for a single I-girder is much greater than for a single curved tubular-flange girder. Smaller cross frame forces develop in a tubular-flange girder system than in an I-girder system, which results in smaller cross frame members. The study also indicates that a curved tubular-flange girder system may need fewer cross frames than a curved I-girder system. Finally, for curved girder systems with a composite deck, the behavior of tubular-flange girder systems is dominated by bending stresses, while the behavior of I-girder systems includes significant warping stresses, again suggesting that the tubular-flange girder system may be more efficient.

2
Chapter 1 Introduction
1.1 Overview
Curved highway bridges are increasingly needed to accommodate complex highway conditions in urban and suburban areas, and to provide safe highway alignments in difficult terrain. The behavior of curved bridges is more complicated than the behavior of straight bridges because the curvature induces torsion in the bridge. Curved steel I-girder systems or box-girder systems are often used in curved bridges. However, each of these systems has potential problems. First, stability is a major issue during construction. A single curved I-girder may not be able to support itself during erection, because the torsional stresses and displacements may be large, even under only the girder self-weight, due to the low torsional stiffness of the I-girder. Therefore, temporary shoring may be needed to erect an I-girder bridge framing system. Second, the cross frames between curved I-girders must be designed as primary load-carrying members because they work with the girders to resist the torsion carried by the bridge system. Since curved I-girders develop significant warping stress due to their low torsional stiffness, a large number of cross frames may be needed to reduce the warping stress. These cross frames may be expensive. A box-girder has a large torsional stiffness and negligible warping stress. However, cross section distortion may occur and lead to significant distortional stresses. Thus, bracing must be used inside the box to maintain the box shape and avoid cross section distortion. The internal bracing inside a box-girder makes box-girder design, construction, and maintenance complex and expensive. Fatigue problems are also a concern for box-girders due to the potential cross section distortion and the bracing details. In this report, a new type of curved girder, the curved tubular-flange girder, is proposed and studied. The tubular-flange girder has round, square, or rectangular tubes in place of the plate flanges of an I-girder. The web of a tubular-flange is similar to that of an I-girder. Owing to the torsional stiffness of the tubular-flanges, a tubular-flange girder has much higher torsional stiffness than an I-girder, and should have less cross-section distortion than a box-girder. As shown later in the report, a single curved tubular-flange girder develops much smaller stresses and displacements than a single curved I-girder under self-weight or other construction loading. In addition, a curved tubular-flange girder system may require fewer cross frames than a curved I-girder system. A curved tubular-flange girder may develop cross section distortion, in particular, distortion of the web and the tubular-flanges. However, web transverse stiffeners can eliminate the web distortion.

3
The focus of this study is the linear elastic behavior of single curved tubular-flange girders and systems of curved tubular-flange girders braced by cross frames. A theoretical analysis method for the curved tubular-flange girder system is presented. Finite element models are developed and used to verify the accuracy of the theoretical analysis method. The analysis results for curved tubular-flange girder systems are compared with those of curved I-girder systems. A parametric study is also carried out to show the effect of cross section parameters on the behavior of curved tubular-flange girder systems.
1.2 Research Objectives
The overall objective of this report is to study the behavior of curved tubular-flange bridge girders under construction and service conditions. The specific objectives are as follows:
(1) To propose a theoretical analysis method for single curved tubular-flange girders and systems of multiple curved tubular-flange girders braced by cross frames. Displacements and stresses on the cross section are provided by the analysis method.
(2) To develop finite element models to simulate the behavior of curved tubular-
flange girder systems under construction loads and live loads. (3) To compare the behavior of curved tubular-flange girders with curved I-girders
and identify advantages and disadvantages of curved tubular-flange girders. (4) To conduct a parametric study to show the effect of cross section parameters on
the behavior of curved tubular-flange girders. (5) To study the influence of a concrete deck on a tubular-flange girder system and
to study the live load behavior of a curved tubular-flange girder bridge.
1.3 Report Scope
To achieve the objectives, linear elastic analyses of systems of curved tubular-flange girders with cross frames were conducted. A theoretical analysis method for curved tubular-flange girder systems with multiple girders and cross frames is presented. Finite element analyses of curved tubular-flange girder systems are presented and used to verify the theoretical analysis method. A parametric study using both the theoretical analysis and finite element methods is presented. The study involves curved single tubular-flange girders and a tubular-flange girder system with three girders. The parametric study investigates the influence of girder geometry, including the tubular flange width, tubular-flange depth, the cross section depth, the curvature of the girders,

4
and the number of cross frames. The behavior of curved tubular-flange girders with a composite bridge deck under the action of live loads and dead loads is also presented.
1.4 Organization of Report
The report consists of nine chapters. Chapter 1 introduces the research and the organization of the report. Chapter 2 presents background knowledge which relates to curved tubular-flange girders. Chapter 3 presents the differential equations for simply supported single curved girders and the solutions to these equations. Chapter 4 presents the theoretical analysis method for tubular-flange girder systems with multiple girders and cross frames. Chapter 4 also presents the stress analysis of curved tubular-flange girders. In Chapter 5, the theoretical analysis method presented in Chapter 4 is used to analyze single curved tubular-flange girders and tubular-flange girder systems with multiple girders. Chapter 5 also compares curved tubular-flange girders and I-girders. Finite element simulations of curved tubular-flange system are presented in Chapter 6 and are compared with the theoretical analysis results presented in Chapter 5. The parametric study is presented in Chapter 7. The study of tubular-flange girders with a composite deck is presented in Chapter 8. Finally, Chapter 9 summarizes the research and provides conclusions.

5
Chapter 2 Background
The background material related to this report is reviewed in this chapter. The previous research on curved girders usually focused on concrete or steel I- or box-section girders. Research on girder cross sections with tubular flanges is limited to straight girders. In this chapter, previous research on the theory of curved open and closed section girders, and previous research on straight tubular-flange girders are briefly reviewed. Then, the analytical methods given in AASHTO Guide Specification for Horizontally Curved Highway Bridges (AASHTO 2003) are summarized. The chapter then summarizes the theory for thin-walled structural members related to this study.
2.1 Related Research
A significant amount of analytical and experimental research on curved I-girders and curved box girders has been completed. This research involves analytical methods, stability and ultimate strength analyses, and so on. Herein, only research related to the linear elastic behavior of curved tubular-flange girders (TFGs) is summarized. Dabrowski (1968) presented the differential equations for a single curved girder and gave closed form solutions to the differential equations for curved girders with either an open cross section or a closed cross section under several different loading and boundary conditions. To determine cross section stresses, Dabrowski extended thin-walled beam theory for straight girders to curved girders. Some details of Dabrowski’s work will be introduced in Section 2.4, and Chapter 3 will make a more detailed presentation of Dabrowski’s results. Kim (2005) studied straight I-shaped girders with one concrete-filled round tubular flange and one flat plate flange. His research investigated the flexural strength and stability of concrete-filled tubular flange girders (TFGs) with the tubular-flange as the compression flange. Finite element analyses and experiments were conducted. Kim listed several advantages of concrete-filled TFGs over I-girders, including: (1) a concrete-filled tubular flange provides more strength, stiffness and stability than a flat plate flange; (2) a concrete-filled TFG needs fewer diaphragms than a similar I-girder to maintain lateral torsional stability. Kim also provided design recommendations for straight concrete-filled TFGs. Wimer (2004) conducted a design study of concrete-filled TFGs. The TFGs had a rectangular tube as the compression flange, a flat plate as the tension flange, and either a corrugated web or a flat web. A four-girder prototype bridge was considered.

6
Eighteen design combinations were studied. Wimer (2004) also conducted experiments and analyses of concrete-filled TFGs and he concluded that tubular flanges increase the torsional stiffness of the girder, and allow large unbraced lengths to be used in bridges with TFGs. Richardson et al. (1963) presented a rigorous theoretical analysis method to determine the internal forces and stresses for each girder in a curved I-girder system. They separated the I-girder system into individual girders. The unknown interaction forces between the girders and cross frames were treated as external forces applied to the individual girders. Cross frame deflections were considered. Since there are two equilibrium equations and two displacement compatibility equations for each cross frame, a series of simultaneous linear equations are obtained, and then, the unknown interaction forces are determined by solving these equations.
2.2 Analytical Methods for Curved Girders
Both approximate and refined analytical methods have been proposed for the analysis of curved bridges in the AASHTO Guide Specification of Horizontally Curved Steel Girders (AASHTO 2003). The approximate analytical methods are usually used for preliminary analysis and the refined methods are used for final or detailed analysis.
2.2.1 Approximate Methods
The V-load method (U.S. Steel Corporation 1984) is a widely used approximate method for the analysis of curved I-girder bridges and is best suited for the analyses needed for preliminary design.
2.2.2 Refined Methods
Two refined methods of analyses are summarized here briefly, namely the classic theoretical method and the finite element method. The classic theoretical method was summarized by Zureick and Naqib (1997). This method solves differential equations for a curved bridge girder to obtain the internal forces and displacements of the girders. The solution is a closed form or a convergent series solution of the differential equations. Then, thin-walled member theory is used to determine the cross section stresses. However, the classic theoretical method has some limitations. Solutions of the differential equations may be very difficult or impossible for some loading and boundary conditions. And also, thin-walled member theory may not be applicable to all cases of the curved bridge girders.
The finite element method is a widely used refined method for the analysis of curved girder bridge system. This method can be applied to various girder configurations under different loading and boundary conditions. The disadvantage of the finite element method is the time and effort needed to build the finite element model.
7
2.3 Theory for In-Plane Bending of Thin-Walled Girders
This section summarizes thin-walled member theory that is needed for the analysis of stresses and displacements of bridge girders.
2.3.1 Bending Normal Stress
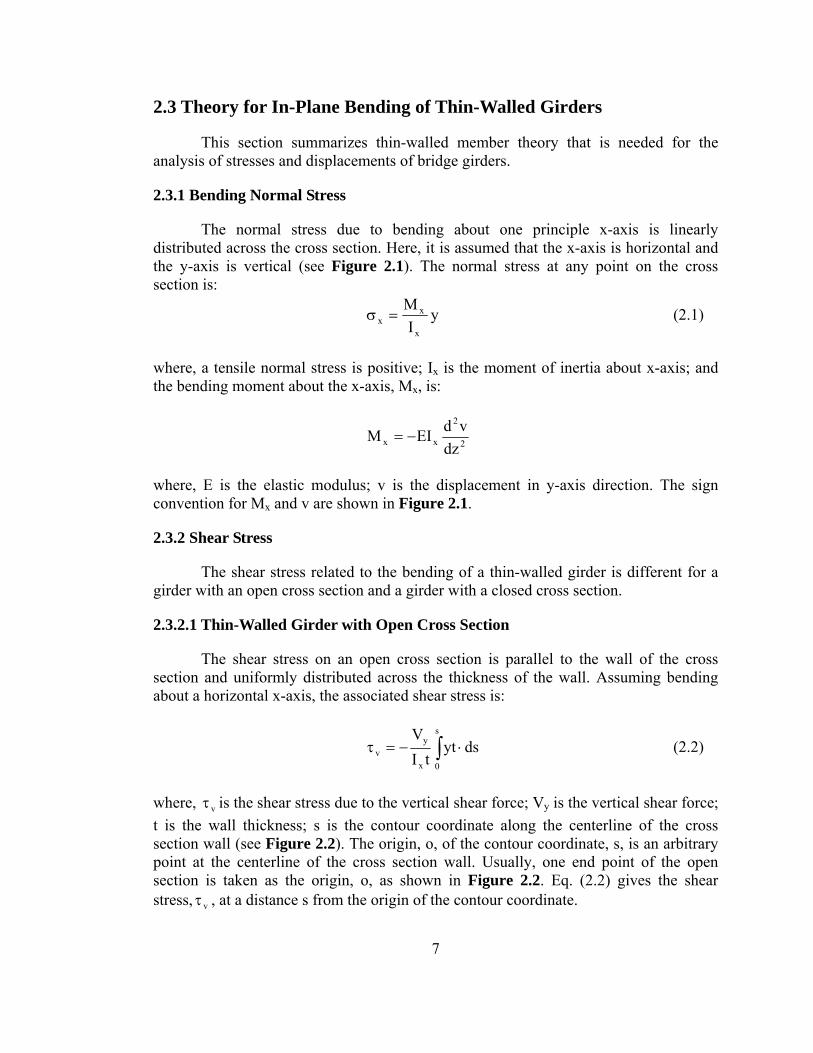
The normal stress due to bending about one principle x-axis is linearly distributed across the cross section. Here, it is assumed that the x-axis is horizontal and the y-axis is vertical (see Figure 2.1). The normal stress at any point on the cross section is:
yI
M
x
xx =σ (2.1)
where, a tensile normal stress is positive; Ix is the moment of inertia about x-axis; and the bending moment about the x-axis, Mx, is:
2
2
xx dzvdEIM −=
where, E is the elastic modulus; v is the displacement in y-axis direction. The sign convention for Mx and v are shown in Figure 2.1.
2.3.2 Shear Stress
The shear stress related to the bending of a thin-walled girder is different for a girder with an open cross section and a girder with a closed cross section.
2.3.2.1 Thin-Walled Girder with Open Cross Section
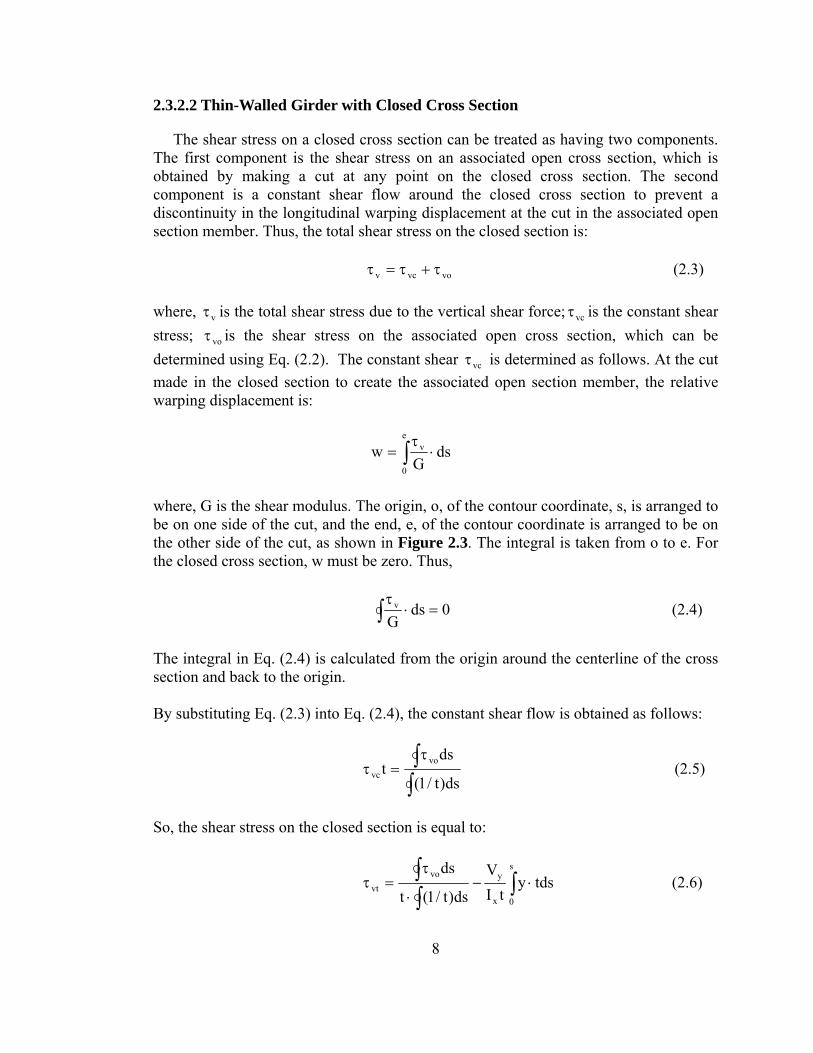
The shear stress on an open cross section is parallel to the wall of the cross section and uniformly distributed across the thickness of the wall. Assuming bending about a horizontal x-axis, the associated shear stress is:
∫ ⋅−=τs
0x
yv dsyt
tIV
(2.2)
where, vτ is the shear stress due to the vertical shear force; Vy is the vertical shear force; t is the wall thickness; s is the contour coordinate along the centerline of the cross section wall (see Figure 2.2). The origin, o, of the contour coordinate, s, is an arbitrary point at the centerline of the cross section wall. Usually, one end point of the open section is taken as the origin, o, as shown in Figure 2.2. Eq. (2.2) gives the shear stress, vτ , at a distance s from the origin of the contour coordinate.
8
2.3.2.2 Thin-Walled Girder with Closed Cross Section
The shear stress on a closed cross section can be treated as having two components. The first component is the shear stress on an associated open cross section, which is obtained by making a cut at any point on the closed cross section. The second component is a constant shear flow around the closed cross section to prevent a discontinuity in the longitudinal warping displacement at the cut in the associated open section member. Thus, the total shear stress on the closed section is: vovcv τ+τ=τ (2.3) where, vτ is the total shear stress due to the vertical shear force; vcτ is the constant shear stress; voτ is the shear stress on the associated open cross section, which can be determined using Eq. (2.2). The constant shear vcτ is determined as follows. At the cut made in the closed section to create the associated open section member, the relative warping displacement is:
∫ ⋅τ
=e
0
v dsG
w
where, G is the shear modulus. The origin, o, of the contour coordinate, s, is arranged to be on one side of the cut, and the end, e, of the contour coordinate is arranged to be on the other side of the cut, as shown in Figure 2.3. The integral is taken from o to e. For the closed cross section, w must be zero. Thus,
∫ =⋅τ
0dsG
v (2.4)
The integral in Eq. (2.4) is calculated from the origin around the centerline of the cross section and back to the origin. By substituting Eq. (2.3) into Eq. (2.4), the constant shear flow is obtained as follows:
∫∫ τ=τ
ds)t/1(
dst
vovc (2.5)
So, the shear stress on the closed section is equal to:
∫∫∫ ⋅−⋅
τ=τ
s
0x
yvovt tdsy
tIV
ds)t/1(t
ds (2.6)

9
2.4 Theory for Torsion of Thin-Walled Girders
The torsion theory for thin-walled girders presented in this section is based on Dabrowski (1968) and Galambos (1968). Dabrowski (1968) used this theory in the analysis of curved girders. The theory assumes that the cross section shape is preserved, the displacements and deformations are small and the material is linear elastic.
2.4.1 Thin-Walled Girders with Open Section
Torsion is usually treated as consisting of two components, uniform torsion and non-uniform torsion.
2.4.1.1 Uniform Torsion
Under uniform torsion, also called St. Venant torsion, the twist angle per length is constant along the girder. The longitudinal warping displacements are also constant along the girder. Only shear stress is induced, and the corresponding torque is called St.Venant torque. The St. Venant torque is:
dzdGJMstϕ
= (2.7)
where, Mst is the St. Venant torque on the cross section; ϕ is the twist angle; J is the torsion constant and is (for a thin-walled cross section):
∫=s
3dst31J (2.8)
The St. Venant shear stress distribution on a thin-walled open cross section is parallel to the walls of the cross section and varies linearly across the thickness of the walls. The maximum shear stress on a wall is equal to:
tJ
Mstst ⋅=τ (2.9)
where, stτ is the St. Venant shear stress on the wall; t is the wall thickness.
2.4.1.2 Non-Uniform Torsion
Under non-uniform torsion, also called warping torsion, the warping
deformation is constrained. Both the rate of change of the twist angle,dzdϕ , and the
longitudinal warping displacement, w, vary along the length of the girder. As a result, in

10
addition to the St. Venant shear stress, longitudinal warping normal stress and shear stress are induced under non-uniform torsion.
Warping Normal Stress
The warping normal stress results from the restrained warping displacements along the girder and can be expressed as follows:
2
2
nw dzdE ϕ⋅ω⋅=σ (2.10)
where, nω is the normalized unit warping and is defined as:
)s(ds)s(t)s(A1)s( 0
e
00n ω−ω=ω ∫ (2.11)
where, A is the cross section area; e is the contour coordinate at the end point of the open section member; 0ω is the unit warping with respect to the shear center of the cross section and is defined as
∫ρ=ωs
000 ds)s( (2.12)
where, 0ρ is the perpendicular distance between the tangent to a point on the cross section and the shear center (S.C. in Figure 2.2). For convenience, the concept of a bimoment is introduced, and is defined from the warping normal stress as follows:
∫ ωσ−=e
0nw tdsB (2.13)
Substituting Eq. (2.10) into Eq. (2.13) yields:
2
2
w dzdEIB ϕ
−= (2.14)
where, wI is the warping moment of inertia, equal to:

11
∫ω=e
0
2nw tdsI (2.15)
The warping normal stress represented in term of the bimoment is:
nw
w IB
ω⋅−=σ (2.16)
Warping Shear Stress
As the warping normal stress varies along the length of the girder, warping shear stress is induced. The warping shear flow is:
3
3
ww dzdESt ϕ
−=τ (2.17)
where, wτ is the warping shear stress; Sw is the warping static moment, equal to:
∫ ⋅ω=s
0nw tdsS (2.18)
The contribution of the warping shear stress to resisting torsion is called the warping torque. By the integration of the warping shear flow about the shear center, the warping torque is obtained as:
3
3
w
e
00ww dz
dEIdstM ϕ−=ρ⋅τ= ∫ (2.19)
The warping shear stress can be expressed in term of the warping torque as:
ww
ww S
tIM
⋅=τ (2.20)
From Eq. (2.14) and Eq. (2.19), the relation between the bimoment and warping torque is shown to be:
=wMdzdB (2.21)
12
2.4.1.3 Total Torque
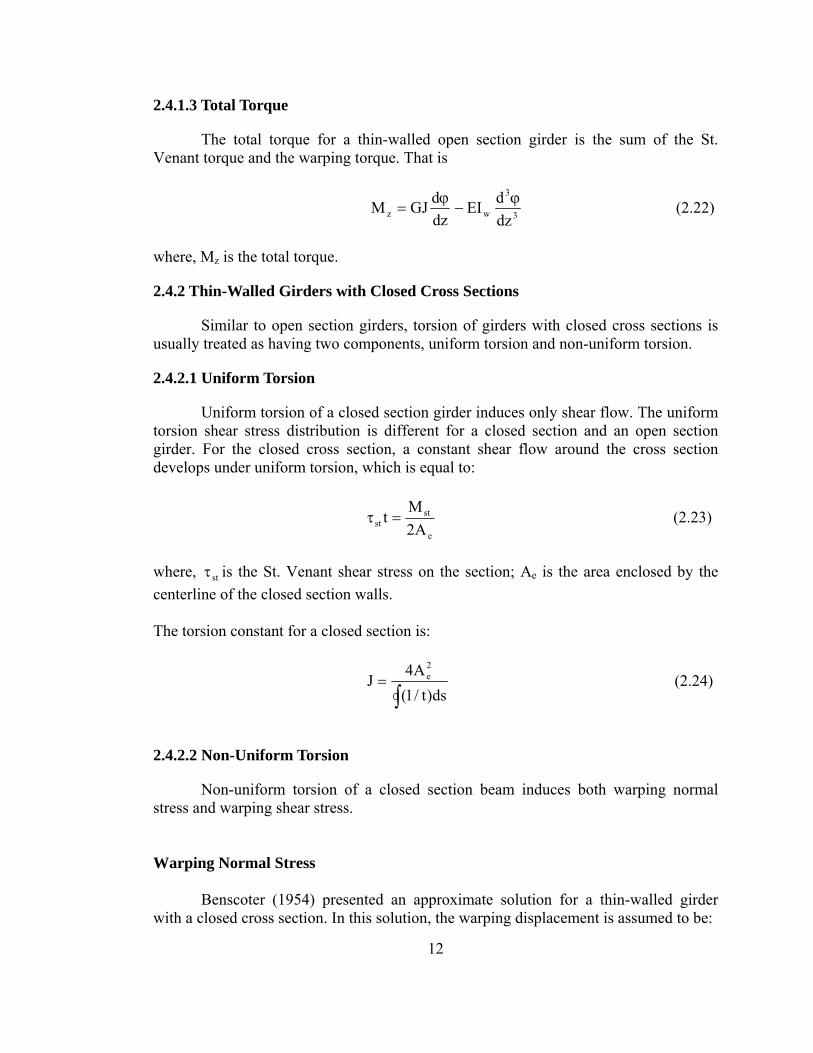
The total torque for a thin-walled open section girder is the sum of the St. Venant torque and the warping torque. That is
dzdGJM zϕ
= 3
3
w dzdEI ϕ
− (2.22)
where, Mz is the total torque.
2.4.2 Thin-Walled Girders with Closed Cross Sections
Similar to open section girders, torsion of girders with closed cross sections is usually treated as having two components, uniform torsion and non-uniform torsion.
2.4.2.1 Uniform Torsion
Uniform torsion of a closed section girder induces only shear flow. The uniform torsion shear stress distribution is different for a closed section and an open section girder. For the closed cross section, a constant shear flow around the cross section develops under uniform torsion, which is equal to:
e
stst A2
Mt =τ (2.23)
where, stτ is the St. Venant shear stress on the section; Ae is the area enclosed by the centerline of the closed section walls. The torsion constant for a closed section is:
∫
=ds)t/1(
A4J
2e (2.24)
2.4.2.2 Non-Uniform Torsion
Non-uniform torsion of a closed section beam induces both warping normal stress and warping shear stress.
Warping Normal Stress
Benscoter (1954) presented an approximate solution for a thin-walled girder with a closed cross section. In this solution, the warping displacement is assumed to be:

13
⋅ω= nwdz
)z(df
where, w is the warping displacement; f(z) is a dimensionless warping function; nω is the normalized unit warping for the closed section and is defined as:
)s(t
ds
tdsA2
)s( 0
s
0
en ω−=ω ∫
∫ (2.25)
where, 0ω (s) has the same definition as given previously for a girder with an open section, and is given by Eq. (2.12). The starting point of integral, o, where s = 0, in Eq. (2.25) can be an arbitrary point on the cross section. Thus, the warping normal stress is given as follows:
2
2
nw dzfdE
dzdwE ⋅ω⋅=⋅=σ (2.26)
where, wσ is the warping normal stress. The bimoment for a girder with a closed section is:
2
2
w
s
0nw dz
fdEItdsB −=ωσ−= ∫ (2.27)
where, wI is the warping moment of inertia for a girder with a closed section as follow:
∫ ⋅ω= tdsI 2nw (2.28)
The warping normal stress is given in terms of the bimoment as follows:
nw
w IB
ω⋅−=σ (2.29)
Warping Shear Stresses
The warping shear flow is in equilibrium with the normal stress. The warping shear flow is expressed with respect to the warping function as:

14
3
3
ww dzfdSEt −=τ (2.30)
where, wτ is the warping shear stress; wS is the secondary warping moment. Then the warping torque is obtained as:
3
3
w
s
00ww dz
fdEIdstM −=ρ⋅τ= ∫ (2.31)
The warping shear stress can be expressed in term of warping torque as:
w
w
ww S
tIM
⋅⋅
=τ (2.32)
where, wτ is the warping shear stress. wS for a girder with a closed cross section is considered to have two parts, namely, a statically determinate part and a statically indeterminate part (Benscoter,1954). wS is expressed as follows: wwiw SSS −= (2.33) where, Swi is the warping indeterminate moment; Sw is the warping statical moment and is determined by the following equation:
∫ ⋅ω=s
0nw tdsS (2.34)
To maintain continuity of warping displacements for a closed section, the secondary shear flow has to satisfy the following equation (Benscoter, 1954):
0t
dstw =⋅τ∫ (2.35)
Substituting Eq. (2.32) into Eq. (2.35), the following equation is obtained:
∫∫ =t
dsSt
dsS wiw (2.36)
By integrating Eq. (2.36), Swi is determined and then wS can be determined from Eq. (2.33).

15
2.4.2.3 Total Torque
The total torque for a closed section girder is the summation of the uniform torque and non-uniform torque and is expressed as below:
dzdGJM zϕ
= 3
3
w dzfdEI− (2.37)

16
o
x zy
z
y,
Mx
MxGirder v
(a) Positive bending moment (b) Curvature in yz plane
Figure 2.1 Bending Moment and Curvature Sign Convention
C
y
x
Shear Center (S.C.)
Origin o, s = 0s
End e
0ρ
Q(x,y)
Tangent of Point Q
Figure 2.2 Contour Coordinate and Tangential Distances on Cross Section
s Origin o
End eC
y
x Cut
Figure 2.3 Associate Open Section for a Closed Section

17
Chapter 3 Analytical Solutions to Differential Equations
A detailed discussion of the differential equations of equilibrium and the analytical solution of these equations for a simply supported curved girder is provided in this chapter.
3.1. Differential Equations for Curved Girders
The differential equations for a simply supported curved girder subjected to uniformly distributed loads are presented by Dabrowski (1968). In this chapter, the theory for thin-walled girders presented in Chapter 2, with all of the assumptions given there, is extended for curved girders. The derivation of differential equations in this section follows that of Dabrowski (1968). Dabrowski makes the following additional assumptions: the curved girder is radially supported at the ends, and the cross section dimensions (width and depth) are small in comparison to the span length and the radius of curvature.
Figure 3.1 shows a differential element of a curved thin-walled girder subjected to uniform loads. The centroid of the cross-section is the origin of the coordinate system. The cross-section is singly symmetric and the coordinate of the shear center is (0, y0). The x-axis is located in the plane of the curvature of the girder and is directed toward the center of curvature. The y-axis is perpendicular to the plane of the curvature and the positive direction is downward. The z-axis is in the direction of the tangent of the curved girder. A distributed radial load, px(z), and a vertical load, py(z), as well as a distributed torque, mz(z), are applied at the shear center of the cross-section. The shear forces,Vx, Vy, and the total torque, Mz, also act at the shear center. The bending moments, Mx, My, and the axial force N act at the centroid of the cross-section.
From equilibrium of forces in the directions of the x-, y-, and z-axis respectively, the differential equations of equilibrium for a curved girder subjected to distributed loads are as follows:
x-axis: 0)z(pRN
dzdV
xx =++ (3.1)
y-axis: 0)z(pdz
dVy
y =+ (3.2)
z-axis: 0=RV
-dzdN x (3.3)

18
where, R is the radius of curvature of the curved girder. Additional differential equations of equilibrium based on the moments about x-, y-, and z-axis are as follows:
x-axis: 0V)yVM(R1
dzdM
y0xzx =−++ (3.4)
y-axis: 0=V-dz
dMx
y (3.5)
z-axis: 0)z(m)NyM(R1-
dzdM
z0xz =++ (3.6)
where, y0 is the y-axis coordinate of the shear center.
3.2. Solutions of Differential Equations
Dabrowski (1968) provided solutions of the differential equations of equilibrium, but did not present many of the details involved in developing the solutions. Here, Dabrowski’s results are reviewed with additional details provided.
In the following subsections, the differential equation solutions for a single span curved girder with an open cross section and a closed section under uniformly distributed and concentrated loads are presented, respectively. The applied distributed loads include a uniformly distributed vertical load, py, and a uniformly distributed torque, mz. The applied concentrated loads included the vertical load, P, and the torque, T. Simply-supported boundary condition are assumed, with each end free to warp, but restrained against twist.
3.2.1. Primary Bending Moment
3.2.1.1 Differential Equations
Considering only the equilibrium equations involving the uniformly distributed load py, and the uniformly distributed torque, mz, Eqs. (3.2), (3.3) and (3.6) are rewritten as:
yy p
dzdV
−= (3.6)
dzdN
RVx = (3.7)
z0xz m)NyM(
R1
dzdM
−+= (3.8)

19
Replacing the term RVx in Eq. (3.4) with Eq. (3.7) and taking the first derivative, results
in the following:
0=dz
dV-y
dzNd
+RdzdM
+dzMd y
02
2z
2x
2
(3.9)
Substituting Eq. (3.8) and Eq. (3.6) into Eq. (3.9), results in a differential equation relating the bending moment and the axial load to the applied loads as follows:
0=p+ydz
Nd+
Rm
-R
Ny+M+
dzMd
y02
2z
20x
2x
2
(3.10)
For a simply-supported curved girder with no axial load applied along the z-axis and no radial load px(z), the axial force is zero. Thus, Eq. (3.10) is simplified to:
yz
2x
2x
2
p-R
m=
RM
+dzMd
(3.11)
Eq. (3.11) is the differential equation relating the bending moment of a curved girder to the uniformly distributed vertical load and torque.
When a curved girder is subjected to a concentrated vertical load, P, and torque, T, applied at position z0, the fundamental differential equation can be written based on the equation for distributed loads and torque. The concentrated loads are treated as a special case of distributed loads using the Dirac Delta function as follows:
)zz(P)z(p 0y −δ= (3.12a) )zz(T)z(m 0z −δ= (3.12b) The equivalent distributed vertical load in Eq. (3.12a) and equivalent distributed torque in Eq. (3.12b) are equal to P and T respectively, acting at position z0. When z is not equal to z0, the equivalent distributed loads py(z) and mz(z) are both zero.
Replacing py and mz in Eq. (3.11) with Eqs. (3.12a) and (3.12b), the differential equation for a concentrated vertical load, P, and torque, T, is as follows:
)z-z()P-RT(
RM
dzMd
02x
2x
2
δ=+ (3.13)

20
3.2.1.2 Solutions of Differential Equations
The complete solution of a differential equation is the summation of the homogeneous solution and the particular solution.
The homogenous equations for Eqs. (3.11) and (3.13) are the same and are equal to:
0=RM
+dzMd
2x
2x
2
The homogenous solution, Mxh, is:
)Rzsin(C)
Rzcos(CM 21xh += (3.14)
The coefficients C1 and C2 are determined later from the boundary conditions.
The particular solutions, Mxp, for Eqs. (3.11) and (3.13) are as follows. For the uniformly distributed load, py, and torque, mz: 2
yzxp Rp-RmM ⋅⋅= (3.15) For the concentrated vertical load, P, and concentrated torque, T: z < z0 0M xp = (3.16a)
z > z0 )R
zzsin()PR-T(M 0
xp−
= (3.16b)
Thus, the complete solution for the bending moment is as follows. For the uniformly distributed loads, py, and torque, mz, the bending moment is:
)Rzsin(C)
Rzcos(CM 21x += + 2
yz Rp-Rm ⋅⋅ (3.17)
For the concentrated load, P, and torque, T, applied at position z0, the bending moment is:

21
z < z0 )Rzsin(C)
Rzcos(CM 21x += (3.18a)
z > z0 )Rzsin(C)
Rzcos(CM 21x += + )
Rzz
sin()RP-T( 0y
− (3.18b)
The boundary conditions for the simply supported girder require that the bending moment is equal to zero at each end of the girder. z = 0 0)0z(M x == (3.19a) z = L 0)Lz(M x == (3.19b) Substituting Eqs. (3.19) into Eqs. (3.17) and (3.18) respectively, the coefficients C1 and C2 can be determined. Thus, the complete solutions for the bending moment of a single span curved girder with simple supports are expressed as follows. For the uniformly distributed vertical load, py, and torque, mz, the bending moment is:
)1)
RLsin(
)R
zLsin()Rzsin(
()RmRp(M z2
yx −
−+
⋅−= (3.20)
For the concentrated load, P, and torque, T, applied at position z0, the bending moment is:
z < z0 )Rzsin(
)RLsin(
)R
zLsin(
)TPR(M0
x ⋅
−
−= (3.21a)
z > z0 )R
zLsin()
RLsin(
)Rz
sin()TPR(M
0
x−
⋅−= (3.21b)
3.2.2 Primary Shear Forces
The lateral shear force, Vx, can be determined for Eq. (3.3). With no lateral load, px, and no axial force N, the result is:
0Vx = (3.22)

22
The vertical shear force Vy can be determined by integration of Eq. (3.2) as follows:
∫=z
0yy dzpV +C (3.23)
3.2.3 Torsion of Girder with Open Cross Section
3.2.3.1 Differential Equations
The total torque Mz on a cross-section is assumed to consist of two components, the St. Venant torque Mst and the warping torque Mw. The fundamental differential equations are developed as follows. The total torque is: wstz MMM += (3.24)
The St. Venant torque for the open section girder is given by Eq. (2.7), as follows:
dzdGJMstϕ
=
The warping torque for the open section girder is given by Eq. (2.19), as follows:
3
3
ww dzdEIM ϕ
−=
Substituting Eqs. (2.7) and (2.19) into Eq. (3.24), the total torque is rewritten in terms of the twist angle, ϕ , as follows:
3
3
wz dzdEI -
dzdGJM ϕϕ
= (3.25)
Substituting Eq. (3.25) into Eq. (3.8) with the axial force, N, equal to zero for a simply supported curved girder, the differential equation expressed in terms of the twist angle is as follows:
)R
M -m(EI
1dzd-
dzd x
zw
2
22
4
4
=ϕ
λϕ (3.26)

23
where, wEI
GJ=λ . This differential equation is used for a curved girder subjected to
the distributed vertical load, py, and torque, m.
For the concentrated vertical load, P, and torque, T, the fundamental differential equation can be written based on the equation for distributed load and torque. The concentrated loads can be expressed using the Dirac Delta function as in Eq. (3.12a) and (3.12b). Replacing mz in Eq. (3.26) with Eq. (3.12b), the differential equation for the concentrated loading case is:
]R
M-)z-z(T[EI
1dzd-
dzd x
0w
2
22
4
4
δ=ϕ
λϕ (3.27)
If both distributed loads and concentrated loads are applied to the curved girder, the differential equation, based on Eqs. (3.26) and (3.27), is:
]R
M-)z-z(Tm[EI
1dzd-
dzd x
0zw
2
22
4
4
δ+=ϕ
λϕ (3.28)
If the bending moment, Mx, is known, the twist angle can be solved from the differential equation. Then, the St. Venant torque, the warping torque and the total torque on a cross section can be determined by Eqs. (2.7), (2.19) and (3.24) respectively.
3.2.3.2 Solutions of Differential Equations
The homogeneous equation is:
0dzd-
dzd
2
22
4
4
=ϕ
λϕ (3.29)
The solution of this homogeneous equation is:
4321 CzCzcoshCzsinhC ++λ+λ=ϕ (3.30)
where, coefficients C1 to C4 are determined later from the boundary conditions.
The particular solutions for Eqs. (3.26) and (3.27) can be obtained by analogy to a straight girder with a thin-walled open cross section. Thus, the particular solutions for the twist angle for a curved girder are as follows. For the uniformly distributed torque, mz, the particular solution is:

24
2zp z
GJ2m -=ϕ (3.31)
For the concentrated torque, T, the particular solution is:
0 < z < z0 0p =ϕ (3.32a)
z > z0 )]z-z(-)z-z(sinh
[GJT
00
p λλ
=ϕ (3.32b)
The term R
M- x may be considered as a series of concentrated torques applied along the
whole length of the girder. The particular solution due to the term R
M- x is:
z > 0z 0000x
z
0p zd)]zz(-)zz(sinh[(
RGJ)z(M
−λ−λ
=ϕ ∫ (3.33)
where, 0z is the position of the applied equivalent torqueR
)z(M- 0x . For a simply-
supported curved girder, the bending moment Mx is given by Eqs. (3.20) or (3.21). Substituting Eq. (3.20) or (3.21) into the Eq. (3.33), the particular solution can be obtained by integration. Hence, the complete solution of the twist angle for the curved girder is:
p4321 CzCzcoshCzsinhC ϕ+++λ+λ=ϕ (3.34)
Substituting Eqs. (3.31), (3.32) and (3.33) into Eq. (3.34), the complete solution for a curved girder subjected to uniformly distributed loads and concentrated loads, respectively, is as follows. For the uniformly distributed vertical load, py, and torque, mz, the twist angle is:
2z4321 z
GJ2m-CzCzcoshCzsinhC ++λ+λ=ϕ 00
0xz
0
zd)]z-(z-)zz(sinh[RGJM
λ−λ
− ∫
(3.35)
where, the bending moment Mx is given by Eq. (3.20). For the concentrated vertical load, Py, and torque, T, applied at the position z0, the twist angle is:
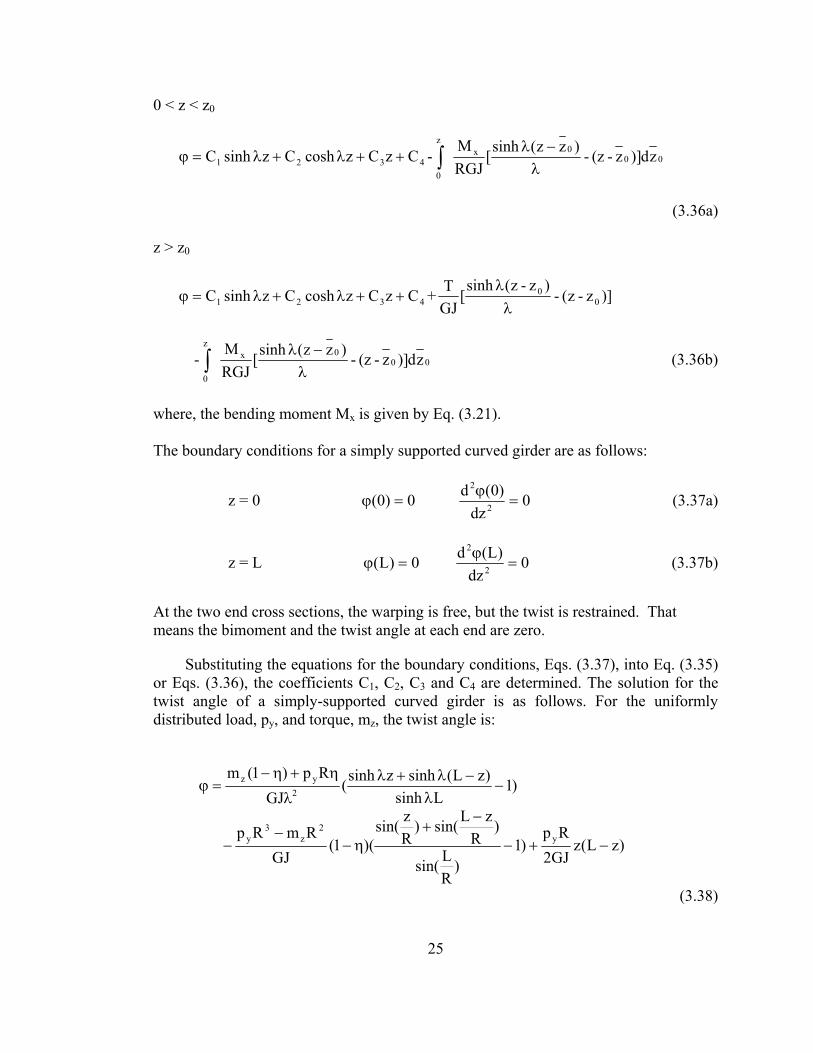
25
0 < z < z0
4321 CzCzcoshCzsinhC ++λ+λ=ϕ - 000x
z
0
zd)]z-(z-)zz(sinh[RGJM
λ−λ
∫
(3.36a)
z > z0
4321 CzCzcoshCzsinhC ++λ+λ=ϕ + )]z-z(-)z-z(sinh
[GJT
00
λλ
- 000x
z
0
zd)]z-(z-)zz(sinh[RGJM
λ−λ
∫ (3.36b)
where, the bending moment Mx is given by Eq. (3.21).
The boundary conditions for a simply supported curved girder are as follows:
z = 0 0)0( =ϕ 0dz
)0(d2
2
=ϕ (3.37a)
z = L 0)L( =ϕ 0dz
)L(d2
2
=ϕ (3.37b)
At the two end cross sections, the warping is free, but the twist is restrained. That means the bimoment and the twist angle at each end are zero.
Substituting the equations for the boundary conditions, Eqs. (3.37), into Eq. (3.35) or Eqs. (3.36), the coefficients C1, C2, C3 and C4 are determined. The solution for the twist angle of a simply-supported curved girder is as follows. For the uniformly distributed load, py, and torque, mz, the twist angle is:
)1Lsinh
)zL(sinhzsinh(GJ
Rp)1(m2
yz −λ
−λ+λλ
η+η−=ϕ
)zL(zGJ2Rp
)1)
RLsin(
)R
zLsin()Rzsin(
)(1(GJ
RmRp y2
z3
y −+−
−+
η−−
−
(3.38)
26
where, η is a dimensionless parameter and is equal to:
2)R(11λ+
=η (3.39)
For the concentrated load P and torque T applied at position z0, the twist angle is: 0 < z < z0
zL
)zL(GJPR)
Rzsin(
)RLsin(
)R
zLsin(
)1(GJ
PRTR 0
02 −
+
−
η−−
=ϕ
zsinhLsinh
)zL(sinhGJ
PR)1(T 0 λλ−λ
λ⋅η+η−
−
(3.40a)
z0 < z < L
zsinhLsinhzsinh
GJPR)1(Tz
Lz
GJPR)
Rzsin(
)RLsin(
)Lz
sin()1(
GJPRTR 00
02
λλλ
λ⋅η+η−
−+η−−
=ϕ
(3.40b)
According to Eqs. (3.24), (2.7) and (2.19), the total torque, the St. Venant torque and the warping torque at a cross section can be determined completely from the twist angle. Hence, the torques for the curved thin-walled open-section girders are as follows. For the uniformly distributed load, py, and torque, mz, the St. Venant torque is:
2
Lz2Rp)
RLsin(
)R
zLcos()Lzcos(
)1)(RpRm(M y2
yzst−
−
−−
η−−=
)Lsinh(
)]zL(cosh[)zcosh(]pR)1(m[ z λλ−λ−λ
η+η−+
(3.41) The warping torque is:
)RLsin(
)R
zLcos()Rzcos(
)RpRm(Lsinh
)]zL(cosh[zcosh(Rp)1(mM 2
yzyz
w
−−
η−+λ
−λ−λλ
η+η−−=
(3.42)

27
The total torque is:
2
)R
zL(Rz
Rp)
RLsin(
)R
zLcos()Rzcos(
)RpRm(M 2y
2yzz
−−
−
−−
−= (3.43)
For the concentrated vertical load, P, and torque, T, applied at position z0, the St. Venant torque is: 0 < z < z0
L
)zL(PR)
Rzcos(
)RLsin(
)R
zLsin(
)1)(PRT(M 0
0
st−
+
−
η−−=
zcoshLsinh
)zL(sinh]PR)1(T[ 0 λ
λ−λ
η+η−−
(3.44a) z0 < z < L
)zL(coshLsinhzsinh
]PR)1(T[Lz
PR)R
zLcos()
RLsin(
)Rz
sin()1)(PRT(M 00
0
st −λλλ
η+η−+−−
η−−−=
(3.44b) The warping torque is: 0 < z < z0
)Rzcos(
)RLsin(
)R
zLsin(
)PRT(zcoshLsinh
)zL(sinh]PR)1(T[M
0
0w
−
η−+λλ−λ
η+η−=
(3.45a) z0 < z < L
)R
zLcos()
RLsin(
)Rz
sin()PRT()zL(cosh
Lsinhzsinh
]PR)1(T[M0
0w
−η−−−λ
λλ
η+η−−=
(3.45b)

28
The total torque is: 0 < z < z0
LzL
PR)Rzcos(
)RLsin(
)R
zLsin(
)PRT(M 0
0
z−
+
−
−= (3.46)
z0 < z < L
Lz
PR)R
zLcos()
RLsin(
)Rzsin(
)PRT(M 0z −
−−−= (3.47)
3.2.3.3 Bimoment
Eq. (2.14) gives the bimoment for a girder with an open cross section as:
2
2
w dzdEIB ϕ
−=
Since the twist angle is known from the differential equation solution, the bimoment, B, can be determined by substituting Eq. (3.38) or Eqs. (3.39) into Eq. (2.14). The bimoment expressions for a simply-supported curved girder with an open cross section subjected to uniformly distributed loads and concentrated loads are as follows. For the uniformly distributed vertical load, py, and torque, mz, the bimoment is:
+λ
−λ+λ−
λ
η+η−−= )
)Lsinh()]zL(sinh[)zsinh(
1(Rp)1(m
Bc
cc2
c
yz
)1)
RLsin(
)R
zLsin()Rzsin(
()RpRm( 3y
2z −
−+
η− (3.48)
For the concentrated vertical load, P, and torque, T, applied at position z0, the bimoment is:

29
0 < z < z0
)Rzsin(
)RLsin(
)R
zLsin(
)PRTR()zsinh()Lsinh(
)]zL(sinh[PR)1(TB0
20
−
η−+λλ−λ
λη+η−
=
(3.49) z0 < z < L
)R
zLsin()
RLsin(
)Rz
sin()PRTR()]zL(sinh[
)Lsinh()zsinh(PR)1(TB
0
20 −η−+−λ
λλ
λη+η−
=
(3.50)
3.2.4 Torsion of Girder with Closed Cross Section
The warping torque for a girder with a closed cross section is related to the warping function f(z), rather than the twist angle, ϕ (z), as shown in Eq. (2.31):
3
3
ww dzfdEIM −=
So the warping function has to be determined before the warping torque can be determined.
3.2.4.1 Differential Equations in Terms of Warping Function
The total torque for a closed cross section girder is given by Eq. (2.33) as:
3
3
wz dzfdEI
dzdGJM −ϕ
=
The relationship between the twist angle and the warping function is given by Dabrowski (1968) as:
c
z
GIM
dzdf
dzd
+μ=ϕ (3.51)
where, μ is a warping shear parameter, defined as:
cIJ1−=μ (3.52)

30
Ic is the central moment of inertia, which is:
∫ρ=A
20c dAI (3.53)
where 0ρ is as defined in Chapter 2. Substituting Eq. (3.51) into the total torque Eq. (2.33) yields a differential equation with regard to the warping function:
z3
3
w Mdz
fdEIdzdfGJ μ=−μ (3.54)
After differentiating Eq. (3.54) once and substituting Eq. (3.8) into Eq. (3.54), the differential equation in terms of the warping function is obtained as follows:
)R
M -m(EIdz
fd-dz
fd xz
w2
22
c4
4 μ=λ (3.55)
where, w
c EIGJ
μ=λ .
3.2.4.2 Warping Torque and Bimoment
Comparing Eq. (3.26) to Eq. (3.55) shows that the differential equation for a girder with a closed cross section has the same form as that for a girder with an open cross section. The only difference is the constantμ , which amplifies the applied loads and appears in the constant λc. That is, the applied loads, py, mz, P, and T become μpy, μmz, μP, and μT, and λ is replaced by λc. In addition, the boundary conditions for a girder with a closed cross section differ from the boundary conditions for a girder with an open cross section. The simple support boundary conditions are:
z = 0 0)0( =ϕ 0dz
)0(fd2
2
= (3.56a)
z = L 0)L( =ϕ 0dz
)0(fd2
2
= (3.56b)
The procedure used to determine the twist angle can be used to determine the warping function f(z). After the warping function is determined, the bimoment for a closed cross section can be determined by Eq. (2.27), which is:
31
2
2
w dzfdEIB −=
The results show that the bimoment is as follows. For the uniformly distributed vertical load, py, and torque, mz, the bimoment is:
+λ
−λ+λ−
λ
η+η−μ−= )
)Lsinh()]zL(sinh[)zsinh(
1(Rp)1(m
Bc
cc2
c
yz
)1)
RLsin(
)R
zLsin()Rzsin(
()RpRm( 3y
2z −
−+
η−μ (3.57)
For the concentrated vertical load, P, and torque, T, applied at position z0, the bimoment is : 0 < z < z0
)Rzsin(
)RLsin(
)R
zLsin(
)PRTR()zsinh()Lsinh(
)]zL(sinh[PR)1(TB0
2c
c
0c
c
−
η−μ+λλ−λ
λη+η−μ
=
(3.58a)
z0 < z < L
)R
zLsin()
RLsin(
)Rz
sin()PRTR()]zL(sinh[
)Lsinh()zsinh(PR)1(TB
0
2c
c
0c
c
−η−μ+−λ
λλ
λη+η−μ
=
(3.58b)
As given in Eq. (2.21), dzdBM w = , so the warping torque for a closed cross section
girder is as follows. For the uniformly distributed vertical load, py, and torque, mz, the warping torque is:

32
)RLsin(
)R
zLcos()Rzcos(
)RpRm(Lsinh
)]zL(cosh[zcosh(Rp)1(mM 2
yzc
cc
c
yzw
−−
η−μ+λ
−λ−λλ
η+η−μ−=
(3.59) For the concentrated vertical load, P, and torque, T, applied at position z0, the warping torque is: 0 < z < z0
)Rzcos(
)RLsin(
)R
zLsin(
)PRT(zcoshLsinh
)zL(sinh]PR)1(T[M
0
cc
0cw
−
η−μ+λλ−λ
η+η−μ=
(3.60a) z0 < z < L
)R
zLcos()
RLsin(
)Rz
sin()PRT()zL(cosh
Lsinhzsinh
]PR)1(T[M0
cc
0cw
−η−μ−−λ
λλ
η+η−μ−=
(3.60b)
3.2.4.3 St.Venant Torque
The total torque is determined by Eq. (3.43) or Eqs. (3.46). Then, the St.Venant torque can be obtained for a girder with a closed cross section as follows: wzst MMM −=
3.2.4.4 Twist Angle
The twist angle is determined by integrating Eq. (3.51), after the warping function f(z) and the total torque are known. The twist angle is as follows. For the uniformly distributed load, py, and torque, mz, the twist angle is:
ypzm pCmC ⋅+⋅=ϕ ϕϕ
where,

33
⎥⎥⎦
⎤
⎢⎢⎣
⎡⋅
λη−
⋅μ−⋅= ϕϕϕ 22c
12
m C)1(CRGJ1C
⎥⎥⎦
⎤
⎢⎢⎣
⎡⋅
λη⋅
⋅μ−−
⋅+⋅−= ϕϕϕ 22c
2
3
13
p CRR
)zL(z2
RCRGJ1C
⎥⎥⎥⎥
⎦
⎤
⎢⎢⎢⎢
⎣
⎡
−
−+
⋅η⋅μ−=ϕ 1)
RLsin(
)R
zLsin()Rzsin(
)1(C 1
⎥⎦
⎤⎢⎣
⎡λ
−λ+λ−=ϕ )Lsinh(
)]zL(sinh[)zsinh(1C
c
cc2
For the concentrated vertical load, P, and torque, T, applied at position z0, the twist angle is: 0 < z < z0
PCTC 1P1T ⋅+⋅=ϕ ϕϕ
where,
⎥⎦
⎤⎢⎣
⎡⋅
λη−
⋅μ−⋅= ϕϕϕ 4c
31T C1CRGJ1C
⎥⎦
⎤⎢⎣
⎡⋅
λη⋅
μ−⋅
⋅−+⋅−= ϕϕϕ 4
c
02
32
1P CRLR
z)zL(RCR
GJ1C
)Rzsin(
)RLsin(
)R
zLsin(
)1(C0
3 ⋅
−
⋅η⋅μ−=ϕ
)zsinh()Lsinh(
)]zL(sinh[C c
c
0c4 λ⋅
λ−λ
=ϕ
z0 < z < L
PCTC 2P2T ⋅+⋅=ϕ ϕϕ
where,
34
⎥⎦
⎤⎢⎣
⎡⋅
λη−
⋅μ−⋅= ϕϕϕ 6c
52T C1CRGJ1C
⎥⎦
⎤⎢⎣
⎡⋅
λη⋅
⋅μ−−⋅⋅
+⋅−= ϕϕϕ 6c
05
22P CR
L)zL(zR
CRGJ1C
)R
zLsin()
RLsin(
)Rz
sin()1(C
0
5−
⋅⋅η⋅μ−=ϕ
)]zL(sinh[)Lsinh()zsinh(
C cc
0c6 −λ⋅
λλ
=ϕ
3.3. Vertical Displacement for Curved Girders
This section summarizes the solution for the vertical displacement for single span curved girders, which was presented by Dabrowski (1968).
3.3.1. Longitudinal Strain and Normal Stress
The longitudinal strain in the z-axis direction for a curved girder comes from bending, torsion, axial displacement and radius displacement. The strain due to the torsion is different for open section and closed section girders. In the following section, the longitudinal strains for an open section girder and a closed section girder will be presented separately. Open Section Girder
The strain due to bending of a curved girder is similar to the bending strain for a straight girder and is:
ydy
vdxdx
ud2
2
2
2
b +−=ε (3.61)
where, u is the displacement in the radial or x-axis direction; and v is the displacement in the vertical or y-axis direction.
Torsion produces a longitudinal strain, which is equal to:
n2
2
t dzd
ωϕ
−=ε (3.62)
Assuming that the cross section dimensions are small compared to the radius of curvature of the girder, the strain due to the radial displacement is:

35
)xR(R
)yy(u2
0u +
θ−+−=ε (3.63)
where, θ is the total rotation angle of the cross section and is:
Rv
−ϕ=θ (3.64)
The strain due to axial displacement at the cross section centroid is the derivative of the axial displacement.
dzdw
a =ε (3.65)
where, w is the axial displacement at the cross section centroid in the z-axis direction. Thus, the total longitudinal strain of the curved girder is a summation of the previous four strains which are given by Eqs. (3.61), (3.62), (3.63), and (3.64) respectively. The total longitudinal strain is:
ydy
vdxdx
ud2
2
2
2
+−=ε n2
2
dzd
ωϕ
−dzdw
+ )xR(R
)yy(u2
0 +θ−+
− (3.66)
The normal stressσ is equal to: ε⋅=σ E (3.67) Substituting Eq. (3.66) into Eq. (3.67), the normal stress for a curved girder with an open cross section is:
)]xR(R
)yy(udzdw
dzdy
dyvdx
dxud[E 2
0n2
2
2
2
2
2
+θ−+
−+ωϕ
−+−⋅=σ (3.68)
Closed Section Girder
For a girder with a closed cross section, the warping shear deformations affect the warping displacement. The warping shear deformations were accounted for in the warping function f(z). The warping displacement is expressed as:
ndzdfw ω−=

36
Thus, the longitudinal strain due to torsion is:
n2
2
t dzfd
dzdw
ω−==ε
The other contributions to the longitudinal strain for a closed section girder are the same as those for an open section girder, and the total strain is:
ε = ydy
vdxdx
ud2
2
2
2
+− - n''f ω + '
zw - )xr(r
)yy(u2
0 +θ−+
Then the normal stress is equal to:
)]xR(R
)yy(udzdw
dzfdy
dyvdx
dxud[E 2
0n2
2
2
2
2
2
+θ−+
−+ω−+−⋅=σ
3.3.2. Differential Equations
The bending moments Mx, My and the axial force N are equal to:
Mx = - ∫A
σ y dA (3.69)
My = ∫A
σ x dA (3.70)
N = ∫A
σ dA (3.71)
Introducing the normal stress into Eqs. (3.69), (3.70) and (3.71), the relationship between the stress resultants and the displacements are obtained:
⎥⎥⎦
⎤
⎢⎢⎣
⎡ θ⎟⎟⎠
⎞⎜⎜⎝
⎛⋅−⋅+⎟⎟
⎠
⎞⎜⎜⎝
⎛+−⎟⎟
⎠
⎞⎜⎜⎝
⎛ θ−−= ∫ 2
A
20x22
2
xy2
2
xx RdAxyyI
Ru
dxudI
RdyvdIEM (3.72)
⎥⎥⎦
⎤
⎢⎢⎣
⎡ θ⎟⎟⎠
⎞⎜⎜⎝
⎛⋅−⋅−⎟⎟
⎠
⎞⎜⎜⎝
⎛ θ−−⎟⎟
⎠
⎞⎜⎜⎝
⎛+−= ∫ 2
A
20y2
2
xy22
2
yy RdAyxyI
RdyvdI
Ru
dxudIEM 3.73)
2xy0
REI
Ryu
dzdwEAN θ
−⎟⎠⎞
⎜⎝⎛ θ−
−= (3.74)

37
For a simply supported girder under only vertical load, the bending moment My and the axial load N are equal to zero. Setting Eqs. (3.73) and (3.74) equal to zero, respectively, leads to the following:
2y
A
2
02
2
y
xy22
2
RI
dAyxy
Rdyvd
II
Ru
dxud θ
⎟⎟⎟⎟
⎠
⎞
⎜⎜⎜⎜
⎝
⎛ ⋅−+⎟⎟
⎠
⎞⎜⎜⎝
⎛ θ−=+
∫ (3.75)
2xy0
RAI
Ryu
dzdw θ
=θ−
− (3.76)
Assuming that the radius of the girder curvature is much greater than the cross section dimensions, the right hand side of Eq. (3.76) is approximately to zero. Then, the strain due to the torsion from Eq. (3.65) can be expressed as:
Ryu
dzdw 0
tθ−
==ε (3.77)
Substituting Eqs. (3.75) and (3.64) into Eq. (3.72), a differential equation with respect to the vertical displacement v and the twist angle ϕ is obtained as follow:
R
)1(EI
MRv)1(
dyvd
x
x22
2 ϕψρ
−+ψ
−=ψρ
−+ (3.78)
where,ψ and ρ are both dimensionless coefficients related to the cross section shape and are defined as:
yx
2xy
III
1−=ψ ,
∫ ∫−=ρA A
2y
2xy
yx
)xdAyIydAxI(IRI
1
ψ equals 1 for singly-symmetric and doubly-symmetric cross sections. ρ is zero for singly-symmetric and doubly-symmetric sections. Hence, Eq. (3.78) can be rewritten for symmetric cross sections as:
REI
MRv
dyvd
x
x22
2 ϕ+−=+ (3.79)

38
For asymmetric cross sections, the quotient ρ /ψ is very small relative to 1, and assuming that the cross section dimensions are small in comparison to the radius of the girder curvature, the term ρ in Eq. (3.78) may be neglected. Eq. (3.79) is valid for both open and closed sections.
3.3.3 Solutions of Differential Equation for Vertical Displacement
Results for the bending moment Mx and the twist angle ϕ in Eq. (3.79) were given earlier in this chapter. So the vertical displacement, v, can be determined by solving Eq. (3.79). The boundary conditions for a simply supported curved girder are: z = 0 v(0) = 0 (3.80a)
z = L v(L) = 0 (3.80b)
By introducing the bending moment and the twist angle into Eq. (3.79) and integrating twice, the vertical displacement v can be determined. Since the twist angle is different for open and closed cross sections, the expression for the vertical displacement, v, is also different for open and closed cross sections.
3.3.3.1 Solution for Girder with Open Cross Section
For the uniformly distributed load, py, and torque, mz, the vertical displacement is:
yvpzvm pCmCv ⋅+⋅= where,
⎥⎦⎤
⎢⎣⎡ ⋅
λη−
χ+⋅−= 2v21v3
vm C)1(RCRxEI
1C
⎥⎥⎥⎥
⎦
⎤
⎢⎢⎢⎢
⎣
⎡
⋅λη⋅
⋅χ+
−
−−
−+
⋅⋅χ−⋅= 2v2
24
1v4
xvp CR]
2
)R
zL(Rz
1)
RLsin(
)R
zLsin()Rzsin(
[RCREI1C
⎥⎥⎥⎥
⎦
⎤
⎢⎢⎢⎢
⎣
⎡ −+
+−
−−+
+⋅⎥⎦
⎤⎢⎣
⎡η−χ+
ψ=
)RLsin(
)R
zLsin()Rzsin(
))
RLtan(2
RL
1()
RLsin(2
)R
zLcos(R
zL)Rzcos(
Rz
1)1(1C 1v

39
⎥⎥⎥⎥
⎦
⎤
⎢⎢⎢⎢
⎣
⎡
λ−λ+λ
η+−
−+
η−=)Lsinh(
)]zL(sinh[)zsinh(1)
RLsin(
)R
zLsin()Rzsin(
)1(C 2v
where, GJEIx=χ
For the concentrated vertical load, P, and torque, T, the vertical displacement is: 0 < z < z0
PCTCv 1vP1vT ⋅+⋅=
[ ]4v2
3v2
x1vT C)1(RCR
EI1C ⋅η−⋅η⋅χ+⋅−=
⎥⎥⎥⎥
⎦
⎤
⎢⎢⎢⎢
⎣
⎡
⋅χη+
⎥⎥⎥⎥
⎦
⎤
⎢⎢⎢⎢
⎣
⎡ ⋅−
−
−
⋅⋅χ−⋅= 4v32
00
33v
3
x1vP CR
L
z)R
zL(
)Rzsin(
)RLsin(
)R
zLsin(
RCREI1C
])
RLsin(
)Rzsin(
))
RLsin(
)Rz
sin(
RL)
RzL
sin()R
zLcos(
Rz
()Rzcos(
Rz
)RLsin(
)R
zLsin(
[2
)1(1
C0
000
0
3v −−
+−
−
−η−χ+ψ=
)zsinhLsinhR
)zL(sinh)
Rzsin(
)RLsin(
)R
zLsin(
(C 0
0
4v λλλ−λ
−
−
=
z0 < z < L PCTCv 2vP2vT ⋅+⋅= where,

40
[ ]6v2
5v2
x2vT C)1(RCR
EI1C ⋅η−χη+⋅−=
⎥⎥⎥⎥
⎦
⎤
⎢⎢⎢⎢
⎣
⎡
⋅χη+
⎥⎥⎥⎥
⎦
⎤
⎢⎢⎢⎢
⎣
⎡
⋅−
−−
χ−⋅= 6v320
0
35v
3
x2vP CR
LR)zL(z
)R
zLsin()
RLsin(
)Rz
sin(RCR
EI1C
⎪⎪⎩
⎪⎪⎨
⎧
−−−
η−χ+ψ= )
RzLcos()
RzL(
)RLsin(
)Rz
sin(
2
)1(1
C0
5v
⎪⎪⎭
⎪⎪⎬
⎫−
⋅
⎥⎥⎥⎥
⎦
⎤
⎢⎢⎢⎢
⎣
⎡ −
−+−
)RLsin(
)R
zLsin()
)RLsin(
)R
zLsin(
RL)
Rz
sin()Rz
cos(R
zL(0
00
)]zL(sinh[)Lsinh(R
)zsinh()
RzLsin(
)RLsin(
)Rz
sin(C 0
0
6v −λλλ
λ−
−=
3.3.3.2 Solution for Girder with Closed Cross Section
For the uniformly distributed load, py, and torque, mz, the vertical displacement is:
yvpczvmc pCmCv ⋅+⋅= where,
⎥⎥⎦
⎤
⎢⎢⎣
⎡⋅
λη−
χ⋅μ+⋅−= 8v2c
7v3
xvmc C)1(RCR
EI1C
⎥⎥⎥⎥
⎦
⎤
⎢⎢⎢⎢
⎣
⎡
⋅λ
η⋅⋅χ⋅μ+
−−−
−+
⋅⋅χ−⋅= 8v2c
2
24
7v4
xvpc CR]
R2)zL(z1
)RLsin(
)R
zLsin()Rzsin(
[RCREI1C

41
⎥⎥⎥⎥
⎦
⎤
⎢⎢⎢⎢
⎣
⎡ −+
+−
−−+
+⋅⎥⎦
⎤⎢⎣
⎡η⋅μ−χ+
ψ=
)RLsin(
)R
zLsin()Rzsin(
))
RLtan(2
RL
1()
RLsin(2
)R
zLcos(R
zL)Rzcos(
Rz
1)1(1C 7v
⎥⎥⎥⎥
⎦
⎤
⎢⎢⎢⎢
⎣
⎡
λ−λ+λ
η+−
−+
η−=)Lsinh(
)]zL(sinh[)zsinh(1
)RLsin(
)R
zLsin()Rzsin(
)1(Cc
cc8v
For the loading case with concentrated vertical load, P, and torque, T, the vertical displacement is: 0 < z < z0
PCTCv 1vPc1vTc ⋅+⋅= where,
[ ]10v2
9v2
x1vTc C)1(RCR
EI1C ⋅η−⋅η⋅χ⋅μ+⋅−=
⎥⎥⎥⎥
⎦
⎤
⎢⎢⎢⎢
⎣
⎡
⋅⋅η⋅χ⋅μ+
⎥⎥⎥⎥
⎦
⎤
⎢⎢⎢⎢
⎣
⎡ ⋅−
−
−
⋅⋅χ−⋅= 10v32
00
39v
3
x1vPc CR
L
z)R
zL(
)Rzsin(
)RLsin(
)R
zLsin(
RCREI1C
⎪⎪⎩
⎪⎪⎨
⎧
−
−μη−χ+ψ= )
Rzcos(
Rz
)RLsin(
)R
zLsin(
2
)1(1
C0
9v
⎪⎪⎭
⎪⎪⎬
⎫
⎥⎥⎥⎥
⎦
⎤
⎢⎢⎢⎢
⎣
⎡
−−
+−
)RLsin(
)Rzsin(
)RLsin(
)Rz
sin(
RL)
RzL
sin()R
zLcos(
Rz
0
000

42
)zsinh()Lsinh(R)zL(sinh
)Rzsin(
)RLsin(
)R
zLsin(
C ccc
0c
0
10v λλλ−λ
−
−
=
z0 < z < L
PCTCv 2vPc2vTc ⋅+⋅= where,
[ ]12v2
11v2
x2vTc C)1(RCR
EI1C ⋅η−μχη+⋅−=
⎥⎥⎥⎥
⎦
⎤
⎢⎢⎢⎢
⎣
⎡
⋅μχη+
⎥⎥⎥⎥
⎦
⎤
⎢⎢⎢⎢
⎣
⎡
⋅−
−−
χ−⋅= 12v320
0
311v
3
x2vPc CR
LR)zL(z
)R
zLsin()
RLsin(
)Rz
sin(RCR
EI1C
⎥⎥⎥⎥
⎦
⎤
⎢⎢⎢⎢
⎣
⎡−−
μη−χ+ψ= )
RzLcos()
RzL(
)RLsin(
)Rz
sin(
2
)1(1
C0
11v
)
RLsin(
)R
zLsin(
)RLsin(
)R
zLsin(
RL)
Rz
sin()Rz
cos(R
zL0
00
−
⋅
⎥⎥⎥⎥
⎦
⎤
⎢⎢⎢⎢
⎣
⎡ −
−+−
−
)]zL(sinh[)Lsinh(R
)zsinh()
RzLsin(
)RLsin(
)Rz
sin(C c
cc
0c
0
12v −λλλ
λ−
−=
3.4 Cross Section Rotation for Curved Girders
This section summarizes the solution for the cross section rotation for single span curved girders, which was presented by Dabrowski (1968). The rotation of a curved girder cross section differs from that of a straight girder. For a straight girder, the cross section rotation is equal to the cross section twist angle. However, for a curved

43
girder, the vertical displacement contributes to the rotation. The rotation of the cross section is determined by Eq. (3.64) as follows:
Rv
−ϕ=θ
Since the twist angle and vertical displacement are as given in the previous sections of this chapter, the cross section rotation can be determined by Eq. (3.64) using the previous results.
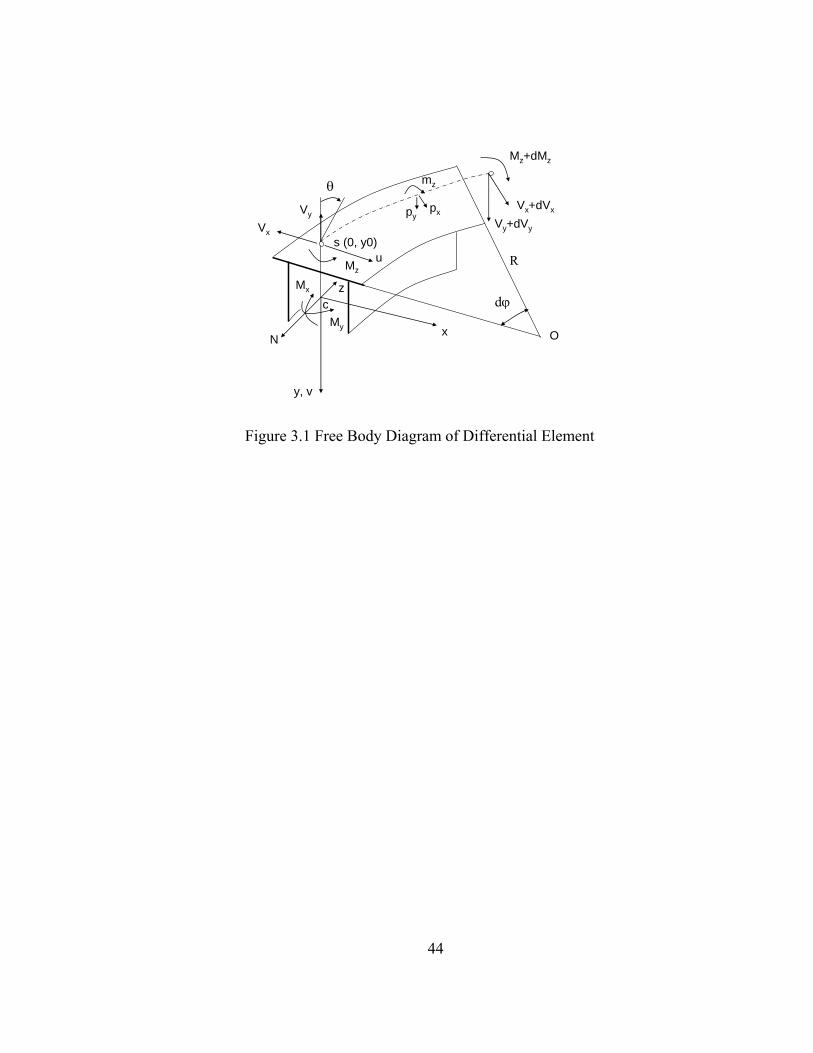
44
O
y, v
x
zc
NMy
Mx
s (0, y0)
Mz+dMz
Vy+dVy
Vx+dVx
u
θpxpy
mz
Vx
Vy
Mz
ϕd
R
Figure 3.1 Free Body Diagram of Differential Element
45
Chapter 4 Linear Elastic Theoretical Analysis
The behavior of a curved girder bridge structure differs from that of individual girders because the cross-frames between girders resist the cross section rotation. A theoretical analysis method is proposed in this chapter to analyze a curved bridge structure composed of multiple curved girders connected by cross frames. In this method, the bridge structure is treated as a set individual curved girders, with the vertical forces and torques carried by the cross frames between girders treated as loads applied to each girder. The response of each girder to these vertical forces and torques, as well as the applied loads, is determined using the equations developed in Chapter 3. A set of equations are written for each girder, with the vertical forces and torques carried by the cross frames as unknowns. The equations are solved for these unknowns and then each girder is analyzed in detail. To illustrate the theoretical method, a simply supported curved multiple-girder bridge subjected to a uniformly distributed load p and torque m is analyzed.
4.1 Theoretical Analysis Method
The theoretical analysis method for curved girder bridges presented in this chapter is based on the following assumptions:
(1) The cross section of each curved girder remains plane under bending. (2) Cross section distortion and shear lag in each curved girder is neglected. (3) The bending normal stresses are assumed to be linearly distributed through the depth of the cross section. (4) The cross frames are assumed to be rigid and to be rigidly connected to the girders.
The theoretical analysis method is developed in four steps. (1) Each girder is isolated from the structure. The forces at the interface between the
girder and the cross frames are treated as external concentrated forces applied to each girder at the cross sections braced by the cross frames (see Figure 4.1). Thus, there are two types of load applied to each girder: the actual applied loads and the concentrated forces from the cross frames.
(2) The concentrated forces acting on the girders from the cross frames are determined. Initially, the concentrated vertical force and torque acting on each girder at each cross frame location are unknown. They are determined by solving a set of equilibrium equations and displacement compatibility equations between the cross frames and the girders.
(3) The internal forces and deflections for each girder are determined, using results from Chapter 3.
(4) Thin-walled member theory is used to conduct the cross section stress analysis for each girder, and the stresses are obtained for each girder in the bridge.

46
4.1.1 Cross Frame Forces
For convenience, the concentrated vertical forces and torques acting on the girders at the interface with the cross frames are simply called cross frame forces. These forces are determined by solving a set of equilibrium equations and displacement compatibility equations for the cross frames and the girders. Figure 4.1 shows a free body diagram of a typical cross frame and the cross frame forces between the adjacent girders and the cross frame. All forces shown in Figure 4.1 are acting in the positive direction.
4.1.1.1 Displacement Compatibility Equations
Based on the assumption that each cross frame is rigid and is rigidly connected to the adjacent girders, the following two displacement compatibility equations are written for each cross frame, which connects two adjacent girder, i and (i+1): (i) The difference in the vertical displacements for the ith girder and the (i+1)th girder is equal to the rotation of the (i+1)th girder multiplied by the space between girder i and (i+1). p
)1i()1i()i( Svv ⋅θ=− ++ (4.1a) (ii) The rotation of the ith girder is equal to the rotation of the (i+1)th girder at the braced cross section.
)1i()i( +θ=θ (4.1b)
where, )i(v and )i(θ are the vertical displacement and the total rotation of the ith girder respectively at the braced cross section; )1i(v + and )1i( +θ are the vertical displacement and the total cross section rotation of the (i+1)th girder respectively at the braced cross section; Sp is the girder spacing. Figure 4.2 shows the displacements of the cross section of each girder at the cross frame location. Eqs. (4.1a) and (4.1b) are written for each cross frame. If the bridge has ng girders and j cross frames in a cross section (where 1nj g −= ), there will be 2j displacement compatibility equations.
4.1.1.2 Constitutive Equations
Using the principle of superposition, the total cross section rotation and the vertical displacement of the cross section of a typical interior girder at the location of the cross frame can be expressed in terms of the applied loads and the cross frame forces. Here, it is assumed that the applied loads are the uniformly distributed load p and torque m.

47
)2,i(g,z
)i(6k
)2,i(g
)i(5k
)1,i(g,z
)i(4k
)1,i(g
)i(3k
)i()i(2k
)i()i(1k
)i( MaVaMaVamapa ⋅+⋅+⋅+⋅+⋅+⋅=θ (4.2a)
)2,i(g,z
)i(6)1k(
)2,i(g
)i(5)1k(
)1,i(g,z
)i(4)1k(
)1,i(g
)i(3)1k(
)i()i(2)1k(
)i()i(1)1k(
)i( MaVaMaVamapav ⋅+⋅+⋅+⋅+⋅+⋅= ++++++
(4.2b) where, akq is an influence coefficient corresponding to each type of force. These coefficients are the rotation or the vertical deflection due to a unit load. The results given in Chapter 3 provide these influence coefficients. )1,i(
gV and )2,i(gV are the vertical
force on the ith girder from its left and right side cross frames, respectively; )1,i(g,zM and
)2,i(g,zM are the torque on the ith girder from its left and right side cross frames,
respectively.
Since there is no cross frame on the left side of the inner girder (girder 1) of the bridge, the cross frame forces )1,1(
g,zM and )1,1(gV are zero. Therefore, for the inner girder,
the total cross-section rotation and the vertical displacement of the cross section at the cross frame location can be expressed as:
)2,1(
g,z)1(
16)2,1(
g)1(
15)1()1(
12)1()1(
11)1( MaVamapa ⋅+⋅+⋅+⋅=θ (4.2c)
)2,1(g,z
)1(26
)2,1(g
)1(25
)1()1(22
)1()1(21
)1( MaVamapav ⋅+⋅+⋅+⋅= (4.2d)
Similarly, the cross frame forces )2,n(g,zM and )2,n(
gV on the right side of the outer girder (girder n) are zero. Therefore, for the outer girder, the total cross section rotation and the vertical displacement of the cross section at the cross frame location can be expressed as: )1,n(
g,z)n(
4)1n2()1,n(
g)n(
3)1n2()n()n(
2)1n2()n()n(
1)1n2()n( MaVamapa ⋅+⋅+⋅+⋅=θ −−−− (4.2e)
)1,i(
g,z)i(4n2
)1,i(g
)i(3n2
)n()n(2n2
)n()n(1n2
)n( MaVamapav ⋅+⋅+⋅+⋅= (4.2f) By substituting Eqs. (4.2) into Eqs. (4.1a) and (4.1b) for the pair of girders attached to each cross frame, the two deflection compatibility equations at each cross frame location are expressed in terms of the unknown cross frame forces. Since there are 4 unknown cross frame forces for each cross frame, as shown in Figure 4.1, 2j compatibility equations with 4j unknown cross frame forces are obtained for each cross section of the bridge having j cross frames.

48
4.1.1.3 Equilibrium Equations
The equilibrium equations for each cross frame (see Figure 4.1) can be written as: 0VV )1,1i(
c)2,i(
c =+ + (4.3a)
0SVMM p)1,1i(
c)1,1i(
c,z)2,i(
c,z =⋅−+ ++ (4.3b) The forces at the interface between the girder and the cross frame are equal and opposite to each other and are expressed as follows: )2,i(
c)2,i(
g VV = (4.4a)
)1,1i(c
)1,1i(g VV ++ = (4.4b)
)2,i(
c,z)2,i(
g,z MM = (4.4c)
)1,1i(c,z
)1,1i(g,z MM ++ = (4.4d)
Substituting Eqs. (4.4) into Eqs. (4.3), the relationship between the cross frame forces on girder i and girder i+1 are presented in the following equations:
0VV )1,1i(g
)2,i(g =+ + (4.5a)
0SVMM p
)1,1i(g
)1,1i(g,z
)2,i(g,z =⋅−+ ++ (4.5b)
For convenient later use, Eqs. (4.5a) and (4.5b) are rewritten as follows:
)1,1i(g
)2,i(g VV +−= (4.6a)
p
)1,1i(g
)1,1i(g,z
)2,i(g,z SVMM ⋅+−= ++ (4.6b)
Eqs. (4.6a) and (4.6b) are written for each cross frame. If the bridge has ng girders and j cross frames in a braced cross section (where, again, 1nj g −= ), there will be 2j equilibrium equations. Thus, the 2j equilibrium equation, combined with the 2j displacement compatibility equations, provide a total of 4j simultaneous equations for determining the 4j unknown cross frame forces at a bridge cross section with cross frames. If the bridge has nc interior cross sections (not including the end cross frames) with j cross frames at each section, the same procedure can be applied to each such bridge cross section. Thus, a total of 4ncj linear simultaneous equations with 4ncj

49
unknown cross frame forces are obtained and can be solved to determine the cross frame forces.
4.1.2 Internal Forces
After the cross frame forces are determined, the total set of forces acting on each curved girder, including the actual applied loads and the concentrated forces at the cross frames, are known. Each curved girder develops internal forces, namely, bending moment, shear force, and torque, as discussed in Chapter 3. The internal forces that develop under uniform or concentrated loads and torques were given in Chapter 3. Using the principle of superposition, the internal forces for each girder are determined from the uniform and concentrated loads acting on each girder.
4.2 Stress Analysis
The stresses in the curved girders are determined from the internal forces using the thin-walled member theory, summarized in Chapter 2. The stress analysis is different for open cross section and closed cross section girders. As noted in Chapter 1, the behavior of curved tubular-flange girders are compared with the behavior of curved I-girders in this report, so the stress analysis of curved I-girders is summarized in this chapter. Since an I-girder is an open section girder, the thin-walled open section theory is used. The cross section of the tubular-flange girder includes closed section components (the tubular flanges) and an open section component (the web). Therefore, the stress analysis of a tubular-flange girder involves both thin-walled open and closed section theory. The stress analysis methods are introduced separately for curved I-girders and curved tubular-flange girders in the following sections.
4.2.1 Stress Analysis of Curved I-Girders
The stresses on a curved I-girder cross section considered in this study are the normal stress due to the vertical (primary) bending, the normal stress due to the warping torsion, the shear stress due to the vertical shear force, the shear stress due to the warping torsion, and the shear stress due to the St. Venant torsion (see Figure 4.3).
Normal Stress Due to Vertical (Primary) Bending
The vertical (primary) bending normal stress for a curved I-girder is assumed to be similar to that of a straight I-girder. The influence of the girder curvature is neglected, and the primary bending normal stress is determined by Eq. (2.1) as follows:
yI
M
x
xx =σ

50
Normal Stress Due to Warping Torsion
The warping normal stress is determined from Eq. (2.16) as follows:
nw
w IB
ω⋅−=σ
where, the normalized unit warping, nω is as shown in Figure 4.4.
Shear Stress Due to Vertical Shear Force
The shear stress due to the vertical shear force is parallel to the walls of the cross section and uniformly distributed across the thickness of the walls. The shear stress is determined by Eq. (2.2) as follows:
∫ ⋅−=τs
0x
yv dsyt
tIV
Shear Stress Due to Warping Torsion
As the warping normal stress varies along the length of the girder, warping shear stress is induced and the shear stress is determined from Eq.(2.20) as follows:
ww
ww S
tIM
⋅=τ
where, the warping static moment Sw for the I-girder is shown in Figure 4.4.
After completing the integration shown in Eq. (2.15), the warping moment of inertia for a doubly symmetric I-girder can be expressed as follows:
4
hII
2yf
w
⋅= (4.7)
where, h is the centerline distance between the flanges; Iyf is the moment of inertia of the flange about y-axis as follows:
6tbI f
3f
yf =

51
Shear Stress Due to St. Venant Torsion
The St. Venant shear stress distribution is parallel to the walls of the cross section and varies linearly across the thickness of the walls, t. The shear stress is determined by Eq. (2.9) as follows:
tJ
Mstst ⋅=τ
where, the torsion constant, J, is given by Eq. (2.8).
4.2.2 Stress Analysis of Curved Tubular-Flange Girders
The stresses on a curved tubular-flange girder cross section considered in this study are the normal stress due to the vertical (primary) bending, the normal stress due to the warping torsion, the shear stress due to the vertical shear force, the shear stress due to the warping torsion, and the shear stress due to the St. Venant torsion. Only doubly symmetric tubular-flange girder cross sections are considered in this study.
Figure 4.5(a) shows a tubular-flange girder cross section and dimensions. Herein, h is the distance between the centerlines of the tube top and bottom walls, which is equal to the cross section depth less the tube thickness; h0 is the distance between the centroids of the top and bottom tubular flanges; bf is the tube width; and df is the tube depth with respect to the centerlines of the tube walls. Several specific points on the tube are numbered for easily describing the stresses at those points. Points 2, 3, 4, 5 identify the four corner points of each tube respectively. Points 1 and 6 are the middle points of the tube walls.
Normal Stress Due to Vertical (Primary) Bending
Based on beam theory, the normal stress is linearly distributed through the depth of the cross section. Thus, the primary bending normal stress for a tubular-flange girder is similar to that of an I-girder and is determined by Eq. (2.1). Figure 4.5(b) shows the bending normal stress distribution for a cross section under positive bending moment.
yI
M
x
xx =σ
Normal Stress Due to Warping Torsion
The warping normal stress for a tubular-flange girder is determined from Eq. (2.29) as follows:

52
nw
w IB
ω⋅−=σ
The normalized unit warping nω is calculated by Eq. (2.26) as follows:
)s(t
ds
tdsA2
)s( 0
s
0
en ω−=ω ∫
∫
The integral expressions in Eq. (2.26) only relate to the closed part of the cross section. The normalized unit warping for a tubular-flange girder cross section with any size rectangular tube is given in Figure 4.6, where, n is the aspect ratio of the tubular-flange and is equal to df/bf.
It is observed that the normalized unit warping nω of the tubular-flange girder can be decomposed into two parts: ngω and nlω , as shown in Figure 4.7(a) and Figure 4.7(b). ngω in Figure 4.7(a) is defined as the global normalized unit warping. It is similar to the normalized unit warping of an I-girder with the tubular flange centroid distance, h0, (see Figure 4.7(c)). nlω is defined as the local normalized unit warping, and is equal to the normalized unit warping of the flange tube (see Figure 4.7(d)).
The warping moment of inertia is calculated from Eq. (2.28) as follows:
∫ ⋅ω= tdsI 2nw
A general formula for the warping moment of inertia wI of a tubular-flange girder with any size rectangular tube is as follows:
)n1(12
tb)n1(n)n31(
12tbh
I f5f
22f
3f
20
w +⋅⋅−⋅
++⋅⋅
= (4.8)
where, tf is the thickness of the tubular flange.
Similarly, the warping moment of inertia of a tubular-flange girder may also be separated into two parts. The first term in Eq. (4.8) can be written as:
4
hII
20yf
wg
⋅= (4.9)
where, wgI is the global warping moment of inertia; Iyf is the tubular-flange moment of inertia about the y-axis, which is equal to:

53
)n31(3
tbI f3f
yf +⋅⋅
=
Eq. (4.9) is similar to the warping moment of inertia for an I-girder (Eq. (4.7)) with the tubular flange centroid distance, h0, used in place of the flange centerline spacing. The second term of Eq. (4.8) is equal to twice the warping moment of inertia of the flange tube about its own shear center, since there are two tubes in the cross section. This term is defined as the local warping moment of inertia and is calculated as follows:
12
tb)n1(nI f5f
22
wl⋅−
= (4.10)
Comparing the global warping moment of inertia, Iwg, to the local warping moment of inertia, Iwl, it is suggested that Iwl is relatively very small and possibly negligible. This possibility is studied here. Assume that if the ratio of Iwl to Iwg is less than 5%, then Iwl is small enough to be neglected. That is:
%5II
wg
wl ≤ (4.11)
Substituting Eqs. (4.9) and (4.10) into Eq. (4.11), the following equation is obtained:
)n31()n1(
)n1(n20bh 22
f
0
+⋅+−⋅
≥ (4.12)
Since h0 = h - df, Eq. (4.12) can be expressed as a ratio of h/bf as follows:
n)n31()n1(
)n1(n20bh 22
f
++⋅+−⋅
≥ (4.13)
where, as noted earlier, n = df/bf. If Eq. (4.12) or Eq. (4.13a) is satisfied, Iwl is less than 5% of Iwg. In addition, to avoid overlap of the top and bottom tubes, h has to greater than or equal to 2df, that is, fd2h ≥ . For df = nbf , the following equation is obtained:
n2bh
f
≥ (4.14)
Therefore, if the ratio of h/bf satisfies both Eqs. (4.13) and Eqs. (4.14), then Iwl can be neglected. Figure 4.8 plots h/bf versus n from Eqs. (4.13) and (4.14), treating the equations as equalities. The inequalities are satisfied for h/bf values above the plotted curves. Figure 4.8 shows that for 55.0n ≤ , as long as Eq. (4.13) is satisfied, that is, the

54
value of h/bf is located on or above Curve I, Eq. (4.14) is automatically satisfied. Therefore, for h/bf satisfying Eq. (4.13) and 55.0n ≤ , Iwl is negligible; Figure 4.8 also shows that for 1n55.0 ≤≤ , as long as Eq.(4.14) is satisfied, that is, the value of h/bf is located on or above Curve II, Eq. (4.13) is automatically satisfied and Iwl is negligible. Note that Figure 4.8 considers only cases where 1n ≤ . Practical cross sections will satisfy Eqs. (4.13) and (4.14), and thus, the warping moment of inertia for the tubular-flange girder can be expressed simply as:
4
hII
20yf
w
⋅= (4.15)
For the results presented later in the report, this simplification was not used. Shear Stress Due to Vertical Shear Force
As noted earlier, the cross section of a tubular-flange girder includes closed section components (the tubular flanges) and an open section component (the web). The shear stress on the tubular flange cross sections is assumed to follow the thin-walled closed section theory and the shear stress on the web cross section follow the thin-walled open section theory. First, for the tubular flanges, an equivalent open section is obtained by making a cut on each tubular-flange. The shear stress on this open section is determined using the thin-walled open section theory (Eq. (2.2)) as follows:
∫ ⋅−=τs
0x
yvo tdsy
tIV
Then, the thin-walled closed section theory is applied and the constant shear flow on the tubular-flange is determined by Eq. (2.5) as follows:
∫∫⋅
τ=τ
ds)t1(t1
dsvovc
Thus, the shear stress due to the vertical shear force on the tubular-flange cross section is equal to:
∫∫∫ ⋅−⋅
τ=τ
s
0x
yvovt tdsy
tIV
ds)t/1(t
ds
Figure 4.9 shows the vertical shear stress distribution. The vertical shear stresses are symmetric about the x-axis and anti-symmetric about the y-axis. The maximum stress occurs at the point where the web and the flange join (Point 6).

55
Shear Stress Due to Torsion
The shear stress in a tubular flange girder under torsion is treated in two parts. One part is the “primary” shear stress which is determined from uniform torsion theory. The other part is the “secondary” shear stress, which is determined by the continuity condition of the axial displacements (Benscoter 1954).
Shear Stress Due to Uniform Torsion (Primary Shear Stress)
The uniform torsion stress is proportional to the torsional rigidity GJ. The total uniform torque acting on the cross section, Mst, can be divided into three parts, which are proportional to the torsional rigidity of the top tubular flange, the bottom tubular flange and the web, respectively. However, the web torsional rigidity is much smaller than that of each tubular flange and is neglected in the present study. For a doubly symmetric tubular flange girder, the uniform torque carried by one tubular flange is equal to half of the total uniform torque acting on the cross section. Uniform torsion produces a constant shear flow around each closed tubular flange. This shear flow is constant across the thickness of the tube walls. Therefore, the shear stress is given as:
tA4
M
e
stst =τ (4.16)
where, Mst is the St.Venant torque; Ae is the area enclosed by the tubular flange; t is the wall thickness. Shear Stress Due to Warping Torsion (Secondary Shear Stress)
The secondary shear stress is determined by Eq. (2.32) as follows:
w
w
ww S
tIM
⋅=τ
The secondary warping moment wS for the tubular-flange girder can be expressed using Eq. (2.33): wwiw SSS −= where, Swi is the warping indeterminate moment; Sw is the warping statical moment and is determined by Eq. (2.34):
∫ ⋅ω=s
0nw tdsS

56
Swi is determined by Eq. (2.36):
∫∫ =t
dsSt
dsS wiw
Herein, the warping indeterminate moment Swi is assumed constant for a tubular-flange girder and then can be obtained by solving Eq. (2.36) as follows:
∫
∫=
tds
dst
S
Sw
wi
Thus, substituting Swi and Sw into Eq. (2.33), the secondary warping moment for the tubular-flange girder is determined as follows:
w
w
w S
tds
dst
S
S −=
∫
∫ (4.17)
Figure 4.10(a) shows the secondary warping moment wS for the tubular-flange girder. Similar to the normalized unit warping, nω , wS can be decomposed into two parts: the global normalized warping moment wgS (see Figure 4.10(b)) and the local warping moment wlS (see Figure 4.10(c)).
Assuming that if the ratio of wlS / wgS is less than or equal to 5%, then wlS is negligible. Since wS varies along the wall, only the maximum value 1wlS and 1wgS are compared. That is:
%5SS
1wg
1wl ≤ (4.18)
Substituting 1wlS and 1wgS into Eq. (4.18), the following equation is obtained:
n)n1(3
)n1(n20bh
f
++−⋅⋅
≥ (4.19)
If the ratio of h/bf satisfies both Eq. (4.14) and Eq. (4.19), wlS is negligible. Figure 4.11 plots h/bf versus n from Eqs. (4.14) and (4.19), treating the equations as equalities. The inequalities are satisfied for h/bf values above the plotted curves. Figure 4.11 shows
57
that for 74.0n ≤ , if Eq. (4.19) is satisfied, then Eq. (4.14) is automatically satisfied and wlS is negligible; for 74.0n > , if Eq. (4.14) is satisfied, then Eq. (4.19) is automatically
satisfied and wlS is negligible. For the results presented later in the report, wlS was not neglected.

58
i i+1
)2,i(gV
)2,i(cV
)1,1i(gV +
)1,1i(g,zM +)2,i(
g,zM
)1,1i(cV +
)2,1i(gV +
)2,1i(g,zM +
)1,i(g,zM
)1,i(gV
)1,1i(c,zM +)2,i(
c,zM
)1,i(cV
)1,i(c,zM
)2,1i(c,zM +
)2,1i(cV +
Cross Frame
Figure 4.1 Cross Frame Forces
i i+1
)i(v )1i(v +
)1i( +θ)i(θ
Figure 4.2 Braced Cross Section Deflections at Cross Frame
fM
fM
Warping shear stress wτ
Warping normal stress wσ
x
y
z
fV
fV
Flange shear
Flange moment Bimoment B= h
h
fMfM
Figure 4.3 Warping Stress, Stress Resultant and Bimoment

59
16
thb f2
f
16thb f
2f
wS
4hbf− _
+
+_
4hbf−
4hbf
4hbf
nω
h
bf
12 3
12 3
Figure 4.4 Normalized Unit Warping and Warping Static Moment
bf
df
h
(a) Tubular-flange cross section (b) Bending normal stress distribution
x
y
+
+ +
+
_
_
_ _
xσ
h0
12 3
4 56l
12 3
4 56l
6r
6r
Figure 4.5 Primary Bending Normal Stress

60
)n1(4)n1(bn
4bh 2
ff0
+−⋅
+−
)n1(4)n1(bn
4bh 2
ff0
+−⋅
−−
)n1(4)n1(bn
4bh 2
ff0
+−⋅
−
)n1(4)n1(bn
4bh 2
ff0
+−⋅
+
)n1(4)n1(bn
4bh 2
ff0
+−⋅
+−
)n1(4)n1(bn
4bh 2
ff0
+−⋅
−−
)n1(4)n1(bn
4bh 2
ff0
+−⋅
−
)n1(4)n1(bn
4bh 2
ff0
+−⋅
+
+
+
+
__
_
+_
+
+_
_
Figure 4.6 Normalized Unit Warping nω
4bh f0−
4bh f0
4bh f0
4bh f0−
)n1(4)n1(nb 2
f
+−
)n1(4)n1(nb 2
f
+−
−
)n1(4)n1(nb 2
f
+−
)n1(4)n1(nb 2
f
+−
−
)n1(4)n1(nb 2
f
+−
)n1(4)n1(nb 2
f
+−
−)n1(4
)n1(nb 2f
+−
)n1(4)n1(nb 2
f
+−
−
+_
+
+
+
+
+ _
++
_+
+
_
++
_+
+
_
(a) Global warping ngω (b) Local warping nlω (df < bf)
4bh f0−
4bh f0 + _
_ +
h0
bf
4bh f0−
)n1(4)n1(nb 2
f
+−
)n1(4)n1(nb 2
f
+−
−
)n1(4)n1(nb 2
f
+−
)n1(4)n1(nb 2
f
+−
−+
+
++
_
_
(df < bf)
4bh f0
(c) nω for I-girder (d) nω for rectangular tube
Figure 4.7 Global and Local Normalized Unit Warping

61
0
0.2
0.4
0.6
0.8
1
1.2
1.4
1.6
1.8
2
0 0.1 0.2 0.3 0.4 0.5 0.6 0.7 0.8 0.9 1
df/bf
h/b f
Curve II, h/bf = 2n
Curve I
(0.55,1.1)
Figure 4.8 Ratio of h/bf vs.Ratio of df/bf
01v =τ , )2
d2
h(
2bt
IV f0ff
x
y2v +⋅
⋅⋅=τ
)2
d2
h(
2bt
IV f0ff
x
y3v +⋅
⋅⋅−=τ
2tdh
IV
)2
d2
h(
2bt
IV ff0
x
yf0ff
x
y4v
⋅⋅⋅++⋅
⋅⋅=τ
2tdh
IV
)2
d2
h(
2bt
IV ff0
x
yf0ff
x
y5v
⋅⋅⋅−+⋅
⋅⋅−=τ
2tdh
IV
2hbt
IV ff0
x
y0ff
x
yl6v
⋅⋅⋅+
⋅⋅⋅=τ
2tdh
IV
2hbt
IV ff0
x
y0ff
x
yr6v
⋅⋅⋅−
⋅⋅⋅−=τ
Figure 4.9 Vertical Shear Stress Distribution
2 1 3
4 56l6r

62
)n1(48t)n2n1(nb
)4
dtb8
tb(
2h
S f23
fffff2
f01w
+−+
−+⋅=
)n1(24t)n1(nb
4dtb
2h
S f23
ffff02w
+−
+⋅= , 2w3w SS =
)n1(24t)n1(nb
4dtb
2h
S f23
ffff04w
+−
+⋅−= , 4w5w SS =
)n1(48t)n2n1(nb
)4
dtb8
tb(
2h
S f23
fffff2
f06w
+−+
−+⋅−=
(a) Warping moment wS
)4
dtb8
tb(2
hS ffff
2f0
1wg +⋅=
4dtb
2h
S fff02wg ⋅= , 2wg3wg SS =
4dtb
2h
S fff04wg ⋅−= , 4wg5wg SS =
)4
dtb8
tb(
2h
S ffff2
f06wg +⋅−=
(b) Global warping moment wgS
)n1(48t)n2n1(nb
S f23
f1wl
+−+
−=
)n1(24t)n1(nb
S f23
f2wl
+−
=
2wl5wl4wl3wl SSSS ===
1wl6wl SS =
(c) Local warping moment wlS
Figure 4.10 Normalized Warping Moment
2 1 3
4 56
2 1 3
4 56
2 1 3
4 56
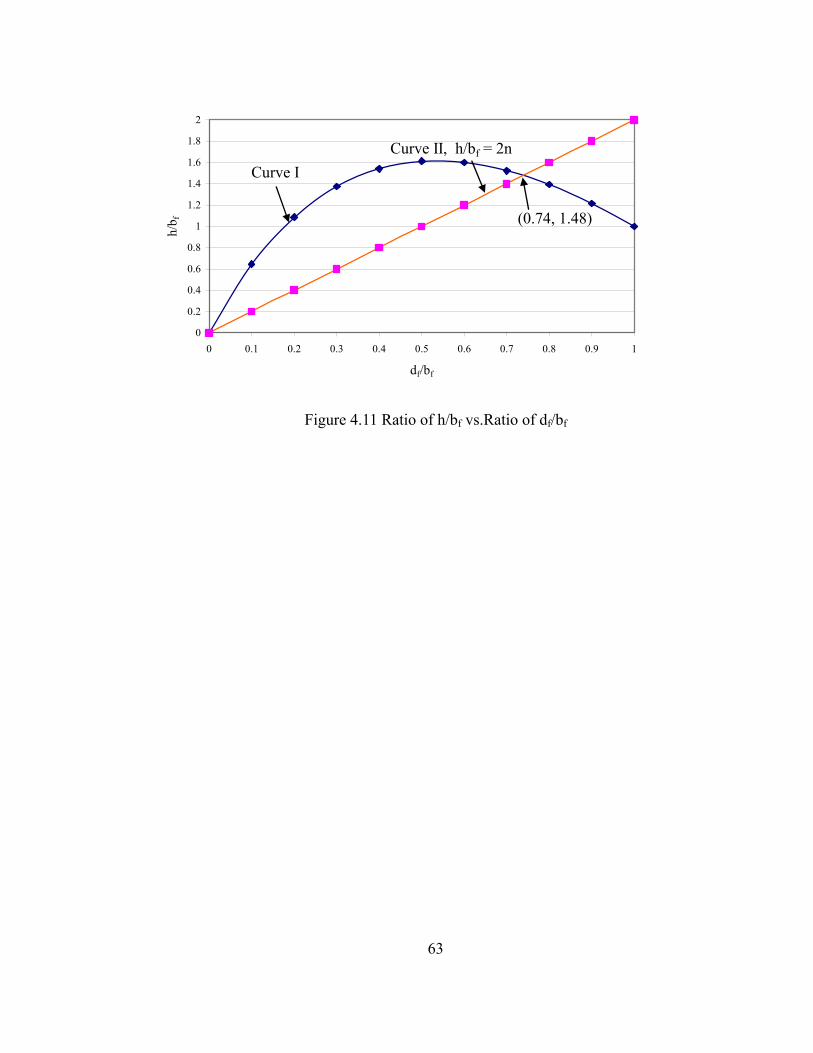
63
0
0.2
0.4
0.6
0.8
1
1.2
1.4
1.6
1.8
2
0 0.1 0.2 0.3 0.4 0.5 0.6 0.7 0.8 0.9 1
df/bf
h/b f
Curve II, h/bf = 2nCurve I
(0.74, 1.48)
Figure 4.11 Ratio of h/bf vs.Ratio of df/bf

64
Chapter 5 Theoretical Analysis Results
Analyses of curved tubular-flange girder bridge systems are presented in this chapter. The theoretical method discussed in Chapter 4 is used. A single girder, a two-girder system and a three-girder system are studied, respectively. The loading and support conditions represent conditions that might occur during construction of a bridge. Specifically, the analysis of the single girder system represents a single bridge girder placed on its bearings and laterally braced at the bearings without intermediate bracing along the span. The two- and three-girder systems represent two-girder and three-girder bridges during the placement of the bridge deck after the cross frames are in place. Each girder system is simply-supported at the girder ends and subjected to uniformly distributed vertical loads. Comparisons with curved I-girder systems are presented at the end of the chapter.
5.1 Bridge Configuration, Girder Dimensions, and Applied Loads
5.1.1 Bridge Configuration
Figure 5.1 shows a schematic of the cross section of the three-girder bridge system, including the girder spacing and the overhang. For the two-girder bridge system, the girder spacing and the overhang width are the same as for the three-girder system. The configuration of these curved girder systems is based on a curved I-girder test specimen used in FHWA tests (Zureick and Naqib 1999). The FHWA test specimen was a curved three-girder system with girders and cross frames arranged as shown schematically in Figure 5.2. The span, radius and weight of each FHWA test specimen girder were as shown in Table 5.1. The ratio of the overall span to the radius of curvature (L/R) of the girders was 0.45. Three intermediate cross frames were used along the span length and the ratio of the unbraced length to the radius of curvature (Lb/R) was 0.1125 for each girder. The cross frames shown schematically in Figure 5.2 were made from 5-in diameter steel tubes with ¼ in. wall thickness. In all cases, the girders and cross frames were assumed to be made of steel with an elastic modulus of 29000 ksi and Poison’s ratio of 0.3.
5.1.2. I-Girder Dimensions
To enable the behavior of the curved tubular-flange girder systems to be compared against the behavior of curved I-girder systems, corresponding curved I-girders were also analyzed using the theoretical method presented in Chapter 4. The cross-section dimensions of the three doubly-symmetric curved I-girders, denoted G1, G2, G3, are given in Table 5.2. For the single girder study, girder G2 is used. Girders G1 and G2 are used for the two-girder system and girders G1, G2 and G3 are used for the three-girder system.

65
5.1.3. Tubular-Flange Girder Dimensions
The three curved tubular-flange girders, denoted TG1, TG2, and TG3, are designed to have the same girder weight and cross section depth as the corresponding curved I-girders G1, G2 and G3 respectively. The dimensions of the doubly-symmetric tubular-flange girders are given in Table 5.3. Girder TG2 is used for the single girder. Girders TG1 and TG2 are used for the two-girder system and girders TG1, TG2 and TG3 are used for the three-girder system.
5.1.4 Applied Loads
The loads considered for analyses of the girders under construction conditions include only the dead load. During the placement of the cast-in-place concrete deck, the concrete deck does not contribute to the resistance of the system and is treated as a dead load applied on each bridge girder. Since the overhangs equal half the spacing between the girders and the overhangs do not add torsion to the external and internal girders (see Figure 5.1). Only uniformly distributed vertical loads are applied to each girder. The dead load includes the following items:
An 8-in thick concrete slab with a concrete unit weight of 150 lbs/ft3. Concrete hauches with an estimated weight of 40 lbs/ft. Stay-in-place deck forms with a weight of 16 lbs/ft2. Cross frames with an estimated weight of 10% of the girder self-weight. The girder self-weight (see Table 5.1).
For the single girder study, the dead load that is applied during construction is actually only the girder self-weight, given in Table 5.1. For the two-girder system, the full dead load applied to girder TG1 and TG2 is 105 lbs/in and 110 lbs/in, respectively. For the three-girder system, the full dead load applied to girder TG1, TG2 and TG3 is 105 lbs/in, 110 lbs/in and 129 lbs/in, respectively. The analysis of the single girder under the full dead load (110 lbs/in) was conducted for the purpose of comparison with the two-girder and three-girder system results. Therefore, two types of dead loads are considered for the single girder study, namely, girder self-weight only and full dead load.
5.2. Analysis Results for Curved Tubular-Flange Girder Systems
The stresses and displacements at only critical points in the girders are presented in the plots shown in the following sections. These important points on the cross section are labeled in Figure 4.4 and Figure 4.5. The analysis results for the corresponding curved I-girder are presented along with the curved tubular-flange girder results in the plots for the purpose of comparison. The following notation is used in legends for the plots: GN, which indicates the result for the corresponding curved I-girder, where N is the girder number, either 1,2 or 3; TGN, which indicates the result for the corresponding curved tubular-flange girder, where N is the girder number, either 1,2 or 3.

66
5.2.1 Single Curved Tubular-Flange Girder
During the construction stage, curved girders could be erected individually without shoring, and therefore, they would carry dead loads before cross frames are installed. As mentioned in Section 5.1.4, two types of dead loads are considered for the single curved tubular-flange girder study. One is the single girder self-weight, which is the actual load applied on a single curved tubular-flange girder during construction and the other is the full dead load given in Section 5.1.4, which is an imaginary dead load applied on a single curved tubular-flange girder to enable comparison of the single girder results with the two-and three-girder system results. Since the analysis is linear elastic, the stresses and displacements under these two types of dead load are the same and only the magnitude of the stresses and displacements change. So the results for the single curved tubular-flange girder under the full dead load are plotted in Figure 5.3 through Figure 5.12. To find the results for girder self-weight only, the results in these figures can be multiplied by the factor 0.182. The maximum stresses and displacements for the single curved tubular-flange girder under the girder self-weight are presented in Table 5.4. The discussion in this section is based on the results under the full dead load. Since the cross section is doubly symmetric, stresses in the top and bottom flange are symmetric or anti-symmetric, so the plots show only stresses at the critical points in the girder top flange and the displacements at the cross section centroid. The plots also show I-girder results which are discussed later.
The analysis results indicate that the warping stress is not significant and the bending stress is dominant in the simply supported single curved tubular-flange girder. For the girder that was studied, the warping normal stress equals only 7% of the bending normal stress. The maximum total normal stress in the top flange occurs at Point 2 (P2) of the midspan cross-section. For shear stresses, the results show that the warping shear stress is negligible and the St. Venant stress dominates the total shear stress. Unlike in the I-girder, the tubular flanges also carry a small amount of vertical shear, so the vertical shear stress is considered in calculating the total shear stress in the tubular flange. The maximum total shear stress in the top flange occurs at the right side of Point 6 (P6r) at the two end cross sections. Since the total normal stress is much larger than the total shear stress in the single curved tubular-flange girder, the maximum Von-Mises stress in the top flange occurs at P2 of the midspan cross-section, where the shear stresses are zero. Therefore, only the total normal stress contributes to the maximum Von-Mises stress at this location. The maximum vertical displacement occurs at midspan and is 1/250 of the arc span length of the girder (L). The maximum cross section rotation occurs at midspan and equal to 0.0303 rad. Since the cross section depth is 50.375 in., as shown in Table 5.3, this maximum cross section rotation results in a relative horizontal displacement between the top and bottom flanges of 1.53 in. The ratio of the relative horizontal displacement to the cross section width, which is 20 in., is 1/13.

67
5.2.2 Two Curved Tubular-Flange Girder System
In a two-girder bridge system, the cross frames restrain the cross-section rotation of the girders, but they also increase the vertical load on the outer girder and decrease the vertical load on the inner girder. Since the internal forces on the inner girder are smaller than those on the outer girder, the outer girder is usually designed to have larger capacity. Figure 5.13 through Figure 5.32 presents the stresses at the critical points and the displacements at the centroids of the two girders in the two-girder system.
The analysis results show that the interaction of the cross frames with the girders increases the warping normal stress and warping shear stress in the regions near the braced cross section relative to the results for a single girder. The cross sections with the largest warping shear stress are the interior braced cross sections in the two-girder system. For the single girder, the largest warping shear stress is at the end cross sections. However, the bending normal stresses are still much larger than the warping normal stresses. The St.Venant shear stresses are still much larger than both the warping shear stresses and the vertical shear stresses. For the inner girder (TG1), the maximum total normal stress occurs at P2 in the region near the midspan. For the outer girder, the maximum total normal stress occurs at Point 3 (P3) at the midspan. For both girders in the two-girder system, the St. Venant shear stress is the dominant part of the total shear stress and the total normal stress is still much larger than the total shear stress. The maximum total shear stress occurs at the two end cross sections, and the maximum Von-Mises stress is dominated by the total normal stress, and is essentially equal in magnitude to the maximum total normal stress.
Comparing to the single girder (see Table 5.5), the maximum total normal stress is reduced for the inner girder, but increased for the outer girder. The maximum total shear stress in both girders of the two-girder system is smaller than the maximum total shear stress of the single girder. The change in the maximum Von-Mises stress, relative to the single girder case, is similar to the change in the maximum total normal stress for both girders. The cross section rotations of both girders are reduced in the two-girder system due to the restraint from the cross frames. Relative to the single girder, the vertical displacement is reduced for the inner girder, but increased for the outer girder, since the cross frames decrease the vertical load on the inner girder and increase the vertical load on the outer girder.
Hence, it is concluded for the two-girder system that the cross frames transfer loads from the inner girder to the outer girder, thus as shown, the outer tubular-flange girder needs to be designed with a larger capacity than the inner girder.
5.2.3 Three Curved Tubular-Flange Girder System
For the three-girder system, the stresses at the critical points and the displacements at the centroids are presented in Figure 5.33 through Figure 5.62.

68
Similar to the single girder and the two-girder system, the bending normal stress is much larger than the warping normal stress in the three-girder system. The maximum total normal stress for each girder occurs at P3 of the midspan cross section. The maximum total shear stress for each girder occurs at the two end cross sections. The maximum Von-Mises stress for each girder is essentially the same magnitude as the maximum total normal stress and occurs at P3 of the midspan cross section. The largest stresses and displacements in the three-girder system occur in the outer girder (TG3). Comparing to the single and two-girder system (see Table 5.5), the analysis results show that the total normal stress, the total shear stress, and the displacement of the inner girder and the middle girder in the three-girder system are smaller than the results of the associated girders in the single girder and the two-girder system respectively. The largest stresses and displacements among the three girders in the three-girder system are smaller than the largest stresses and deflections in the single and two-girder system. In addition, unlike the single girder, the warping shear stress is not negligible in the two- and three-girder systems. However, the warping shear stress at the end cross sections is small enough to be ignored relative to the total shear stress. Since the maximum total shear stress for each girder occurs at the end cross sections, the contribution of the warping shear stress to the maximum total shear stress is negligible.
5.2.4 Summary of Findings from Results
Based on the analysis of the single girder and the two- and three-girder systems, it is observed that the critical stresses and displacements in the three-girder system are smaller than those in the two-girder system and the single girder. For the two-girder system, the outer girder has the largest stress and displacement demands due to the load transfer from the inner girder to the outer girder. For the three-girder case, the torsional stiffness of the bridge system is significantly increased, so the stresses and displacements, especially the St.Venant shear stress and the cross section rotation, are reduced, compared to those of the two-girder system and the single girder.
5.3 Comparison with Curved I-Girder System
As noted in Section 5.1, the I-girders have the same self-weight and cross section depth as the corresponding tubular-flange girders. As a result of these similarities and the differing cross section shapes, the curved I-girders have a larger flexural rigidity and smaller St.Venant torsional constant than the corresponding curved tubular-flange girders. Therefore, for the two- and three-girder systems, the curved I-girders tend to have a smaller bending normal stress and vertical displacement than the corresponding curved tubular-flange girder. However, the curved tubular-flange girders have much lower warping normal stress and less cross section rotation than the corresponding curved I-girders. For the curved tubular-flange girder, the bending normal stress is dominant, and is much larger than the warping normal stress and the shear stresses. For the curved I-girder, the warping normal stress can be very large and is larger than the bending normal stress for the single girder case. The St.Venant shear stress is small for the I-girder, except for the single girder case. The vertical shear stress

69
is negligible in the I-girder flange. A detailed discussion of these comparisons is as follows.
The analysis results for the single tubular-flange girder and I-girder under the girder self-weight are used for the comparison in this section (see Table 5.4). For the single girder case, the single curved I-girder is not capable of carrying the girder self-weight due to its low torsional stiffness, and the displacements are very large. The vertical displacement of the I-girder is 1/71 of the arc span length. The cross section rotation of the single I-girder is 0.307 rad. The relative horizontal displacement between the top and bottom flanges due to this cross section rotation is 15.5 in., which is 77% of the I-girder cross section width, i.e. 20 in. The total normal stress and total shear stress for the single curved I-girder are also significantly larger than those of the corresponding tubular-flange girder. The single curved tubular-flange girder is much better in resisting the girder self-weight due to its higher torsional stiffness. The single tubular-flange girder develops much smaller stresses and displacements than the corresponding single curved I-girder. The vertical displacement of the single curved tubular-flange girder is 1/1400 of the girder arc span length. The cross section rotation of the single tubular-flange girder is 5.52 x 10⁻³ rad. and the resulting relative horizontal displacement between the top and bottom flange is 0.28 in., which is 1/71 of the cross section width, 20 in. So, the single curved tubular-flange girder develops small stresses and displacements under the girder self-weight. Hence, unlike the single curved I-girder, the single curved tubular-flange girder is capable of supporting itself. Temporary bracing or shoring may not be needed for a single curved tubular-flange girder as the girder is erected.
For the two-girder systems, the increase in vertical load on the outer girder and decrease in vertical load on the inner girder are greater for the I-girder system than the tubular-flange girder system due to the low torsional stiffness of the I-girder. Thus, the bending normal stress in the inner I-girder is much less than that in the inner tubular-flange girder (see Figure 5.13), while the bending normal stress of the outer I-girder and the outer tubular-flange girder are similar (see Figure 5.23). The warping normal stresses for the inner and outer I-girders are larger than the warping normal stress in the inner and outer tubular-flange girders, respectively. Since the warping normal stress magnitude is similar to the bending normal stress magnitude for the I-girder, the warping normal stress has a large influence on the total normal stress of the I-girder (see Figure 5.15 and Figure 5.25). The warping normal stress varies significantly along the span. As a result, the total normal stress along the span has a large variation for the curved I-girders, especially for the outer girder. However, the warping normal stress has a very small contribution to the total normal stress for the tubular-flange girder. So the variation of the total normal stress along the span follows the bending normal stress and the girder cross-section is used more efficiently. The maximum total normal stress for the outer I-girder is larger than that for the outer tubular-flange girder due to the significant warping normal stress developed in the I-girder (see Table 5.6).
For the two-girder systems, the St.Venant and vertical shear stresses in the I-girders are both smaller than those of the tubular-flange girders. So the total shear

70
stresses in the curved I-girders are smaller than those in the tubular-flange girders (see Table 5.6). The tubular-flange girder system develops less cross section rotation (see Table 5.6) than the curved I-girder system due to the larger torsional stiffness of the tubular-flange girders. The vertical displacement for the inner tubular-flange girder is larger than that for the inner I-girder (see Table 5.6). However, the vertical displacement for the outer tubular-flange girder is smaller than that for the outer I-girder.
For the three-girder systems, the comparisons are similar to those for the two-girder systems. The bending normal stresses for the three tubular-flange girders are larger than those of the corresponding three I-girders. The warping normal stresses for the tubular-flange girders are much less than those of the I-girders, especially for the middle and outer girder. The total normal stress for the inner tubular-flange is larger than for the inner I-girder, since the bending normal stress has more influence on the total normal stress (see Table 5.7). However, the maximum total normal stresses for the middle and outer tubular-flange girder are less than those for the middle and outer I-girder, respectively (see Table 5.7). The differences in total normal stress between the tubular-flange girders and the I-girders are reduced with respect to the two-girder case. Similar to the two-girder systems, the total normal stress along the span has a large variation for the curved I-girders.
For the three-girder systems, the St.Venant shear stress and total shear stress for the tubular-flange girders are larger than those for the I-girders (see Table 5.7). The cross section rotation of the tubular-flange girders is smaller than those of the I-girders due to the higher torsional stiffness of tubular-flange girders (see Table 5.7). However, the vertical displacement due to bending for the three girders is much larger than the component due to the cross section rotation. As a result, the vertical displacement of the tubular-flange girders is larger than that of the I-girders (see Table 5.7).
Table 5.8 presents the cross frame forces, which are the concentrated vertical forces and torques on the girders at the interface between the girders and the cross frames. These forces are equal and opposite to the vertical forces and bending moments carried by cross frames. The maximum cross frame forces for the cross frame between TG1/G1 and TG2/G2 as well as between TG2/G2 and TG3/G3 are given. The results show that the forces carried by the cross frames for the tubular-flange girder system are smaller than for the I-girder system. Because the tubular-flange girder has higher torsional stiffness than the I-girder, smaller cross frame forces develop in the tubular-flange girder system. As a result, the cross frames in tubular-flange girder systems can be designed with smaller members.
Based on the previous discussion, the findings of the study are summarized as follows: (1) a single curved tubular-flange girder can carry the girder self-weight, and there appears to be no need for temporary shoring or support as the girders are erected, however, a single curved I-girder needs temporary shoring or support to carry the girder self-weight; (2) a curved I-girder is better at resisting bending, but develops very large warping normal stress and cross section rotation, while the curved tubular-flange girder

71
is effective at resisting torsion, and develops small warping normal stress and cross section rotation; (3) the bending normal stress is the major part of the total normal stress for a curved tubular-flange girder, but the warping normal stress and the bending normal stress have similar contributions to the total normal stress for a curved I-girder. As a result, the total normal stress is more uniform over the span for a curved tubular-flange girder, but the total normal stress varies widely over the span for a curved I-girder; (4) the warping shear stress is negligible for a single curved tubular-flange girder, however, for the two- and three-girder systems, the warping shear stress is large at the braced cross sections, but its contribution to the maximum total shear stress at the end cross sections is negligible; (5) Compared to the I-girder system, the tubular-flange girder system develops smaller cross frame forces, which would permit smaller size of cross frame members in tubular-flange girder systems.

72
Table 5.1 Girder Geometry and Weight
Girders Span (ft)
Radius (ft)
Weight (lb/in)
G1 / TG1 86.093 191.25 15.40 G2 / TG2 90.000 200.00 20.02 G3 / TG3 93.938 208.75 36.96
Table 5.2 Curved I-Girder Dimensions
Girders Flanges(in) Web (in) Depth (in)
G1 16 x 17/16 48 x 7/16 50.125 G2 20 x 19/16 48 x 1/2 50.375 G3 24 x 9/4 48 x 1/2 52.500
Table 5.3 Curved Tubular-Flange Girder Dimensions
Girders Tubular Flange (in)
Web (in)
Depth (in)
TG1 16 x 8 x 0.421 33.283 x 7/16 50.125
TG2 20 x 10 x 0.489 29.398 x 7/16 50.375 TG3 24 x 12 x 0.823 26.853 x 8/16 52.500

73
Table 5.4 Maximum Stresses and Displacements for Single Girder
Girders xσ (ksi) tτ (ksi) v (in) θ (rad)
TG2 -3.155 -0.883 -0.764 0.00552
G2 -20.243 -11.847 -15.52 0.307 Note: xσ is the total normal stress; tτ is the total shear stress; v is the vertical displacement; θ is the cross section rotation.
Table 5.5 Maximum Stress and Displacements of Curved Tubular-flange Girders
Girders xσ (ksi) tτ (ksi) v (in) θ (rad)
Single Girder TG2 -17.33 -7.55 -4.20 0.030
TG1 -10.84 -4.71 -2.58 0.020 Two-Girder System TG2 -24.05 -6.28 -4.84 0.020
TG1 -10.21 -2.23 -1.77 0.0044
TG2 -13.94 -2.64 -2.48 0.0044 Three-Girder System TG3 -17.71 -3.00 -3.19 0.0044
Note: xσ is the total normal stress; tτ is the total shear stress; v is the vertical displacement; θ is the cross section rotation.
Table 5.6 Maximum Stresses and Displacements for Two-Girder Systems
Girders xσ (ksi) tτ (ksi) v (in) θ (rad)
TG1 -10.84 -4.71 -2.58 0.020
TG2 -24.05 -6.28 -4.84 0.020
G1 2.52 -1.61 -1.86 0.038
G2 -40.47 -3.17 -5.84 0.042 Note: xσ is the total normal stress; tτ is the total shear stress; v is the vertical displacement; θ is the cross section rotation.

74
Table 5.7 Maximum Stresses and Displacements for Three-Girder Systems
Girders xσ (ksi) tτ (ksi) v (in) θ (rad)
TG1 -10.21 -2.23 -1.77 0.0044
TG2 -13.94 -2.64 -2.48 0.0044
TG3 -17.71 -3.00 -3.19 0.0044
G1 -8.30 -0.83 -1.12 0.0086
G2 -15.41 -1.07 -1.89 0.0093
G3 -20.52 -2.05 -2.66 0.0093 Note: xσ is the total normal stress; tτ is the total shear stress; v is the vertical displacement; θ is the cross section rotation.
Table 5.8 Maximum Cross Frame Forces
Cross Frame Vertical Force (kip)
Moment (kip-in)
TG1 – TG2 16.36 1116 TG2 – TG3 22.86 2476
G1 – G2 22.67 1893 G2 – G3 31.91 3958

75
8.75 ft 8.75 ft4.375 ft 4.375 ft
Deck
Girder Girder Girder
TG2TG1Stiffener
Cross FrameCross Frame
TG3
8 in
Figure 5.1 Three-Girder Bridge Cross Section Schematic
TG1 (G1)
TG2 (G2)
TG3 (G3)
CF
CF
CF
CF
CF
CF
CF
CF
CF
CF
Figure 5.2 Schematic Framing Plan of Three-Girder Bridge

76
-120
-100
-80
-60
-40
-20
0
20
0 0.25 0.5 0.75 1
Normalized Length
Stre
ss (k
si)
G2
TG2
Figure 5.3 Primary Bending Normal Stress at P2 (Single Girder)
-120
-100
-80
-60
-40
-20
0
20
0 0.25 0.5 0.75 1
Normalized length
Stre
ss (k
si)
G2
TG2
Figure 5.4 Warping Normal Stress at P2 (Single Girder)
-120
-100
-80
-60
-40
-20
0
20
0 0.25 0.5 0.75 1
Normalized Length
Stre
ss (k
si)
G2
TG2
Figure 5.5 Total Normal Stress at P2 (Single Girder)

77
-80
-60
-40
-20
0
20
40
60
80
0 0.25 0.5 0.75 1
Normalized Length
Stre
ss (k
si)
G2TG2
Figure 5.6 St. Venant Shear Stress at P6r (Single Girder)
-2
-1.5
-1
-0.5
0
0.5
1
1.5
2
0 0.25 0.5 0.75 1
Normalized Length
Stre
ss (k
si)
G2TG2
Figure 5.7 Warping Shear Stress at P6r (Single Girder)
-2
-1.5
-1
-0.5
0
0.5
1
1.5
2
0 0.25 0.5 0.75 1
Normalized Length
Stre
ss (k
si)
G2TG2
Figure 5.8 Vertical Shear Stress at P6r (Single Girder)

78
-80
-60
-40
-20
0
20
40
60
80
0 0.25 0.5 0.75 1
Normalized Length
Stre
ss (k
si)
G2
TG2
Figure 5.9 Total Shear Stress at P6r (Single Girder)
-100
-80
-60
-40
-20
0
20
0 0.25 0.5 0.75 1
Normalized Length
Dis
plac
emen
t (in
)
G2TG2
Figure 5.10 Vertical Displacement (Single Girder)
-2
-1.6
-1.2
-0.8
-0.4
0
0.4
0 0.25 0.5 0.75 1
Normalized Length
Rot
atio
n (ra
d)
G2TG2
Figure 5.11 Cross Section Rotation (Single Girder)

79
-120
-70
-20
30
80
130
0 0.25 0.5 0.75 1
Normalized Length
Stre
ss (k
si)
G2TG2
Figure 5.12 Von-Mises Stress at P2 (Single Girder)
-12
-10
-8
-6
-4
-2
0
2
0 0.25 0.5 0.75 1
Normalized Length
Stre
ss (k
si)
G1
TG1
Figure 5.13 Primary Bending Normal Stress of Inner Girder at P2 (Two-Girder Case)
-12
-10
-8
-6
-4
-2
0
0 0.25 0.5 0.75 1
Normalized Length
Stre
ss (k
si)
G1
TG1
Figure 5.14 Warping Normal Stress of Inner Girder at P2 (Two-Girder Case)

80
-12
-10
-8
-6
-4
-2
0
0 0.25 0.5 0.75 1
Normalized Length
Stre
ss (k
si)
G1
TG1
Figure 5.15 Total Normal Stress of Inner Girder at P2 (Two-Girder Case)
-6
-4
-2
0
2
4
6
0 0.25 0.5 0.75 1
Normalized Length
Stre
ss (k
si)
G1TG1
Figure 5.16 St.Venant Shear Stress of Inner Girder at P6r (Two-Girder Case)
-4
-3
-2
-1
0
1
2
3
4
0 0.25 0.5 0.75 1
Normalized Length
Stre
ss (k
si)
G1
TG1
Figure 5.17 Warping Shear Stress of Inner Girder at P6r (Two-Girder Case)

81
-4
-3
-2
-1
0
1
2
3
4
0 0.25 0.5 0.75 1
Normalized Length
Stre
ss (k
si)
G1
TG1
Figure 5.18 Vertical Shear Stress of Inner Girder at P6r (Two-Girder Case)
-6
-4
-2
0
2
4
6
0 0.25 0.5 0.75 1
Normalized Length
Stre
ss (k
si)
G1
TG1
Figure 5.19 Total Shear Stress of Inner Girder at P6r (Two-Girder Case)
-3
-2.5
-2
-1.5
-1
-0.5
0
0 0.1 0.2 0.3 0.4 0.5 0.6 0.7 0.8 0.9 1
Normalized Length
Dis
plac
emen
t (in
)
G1
TG1
Figure 5.20 Vertical Displacement of Inner Girder (Two-Girder Case)

82
-0.04
-0.03
-0.02
-0.01
0
0 0.25 0.5 0.75 1
Normalized Length
Rot
atio
n (ra
d)
G1
TG1
Figure 5.21 Cross Section Rotation of Inner Girder (Two-Girder Case)
0
2
4
6
8
10
12
0 0.25 0.5 0.75 1
Normalized Length
Stre
ss (k
si)
G1TG1
Figure 5.22 Von-Mises Stress of Inner Girder at P2 (Two-Girder Case)
-30
-25
-20
-15
-10
-5
0
0 0.25 0.5 0.75 1
Normalized Length
Stre
ss (k
si)
G2
TG2
Figure 5.23 Primary Bending Normal Stress of Outer Girder at P3 (Two-Girder Case)

83
-20
-15
-10
-5
0
5
10
15
0 0.25 0.5 0.75 1
Normalized Length
Stre
ss (k
si)
G2
TG2
Figure 5.24 Warping Normal Stress of Outer Girder at P3 (Two-Girder Case)
-50
-40
-30
-20
-10
0
10
0 0.25 0.5 0.75 1
Normalized Length
Stre
ss (k
si)
G2
TG2
Figure 5.25 Total Normal Stress of Outer Girder at P3 (Two-Girder Case)
-6
-4
-2
0
2
4
6
0 0.25 0.5 0.75 1
Normalized Length
Stre
ss (k
si)
G2TG2
Figure 5.26 St.Venant Shear Stress of Outer Girder at P6r (Two-Girder Case)

84
-6
-4
-2
0
2
4
6
0 0.25 0.5 0.75 1
Normalized Length
Stre
ss (k
si)
G2
TG2
Figure 5.27 Warping Shear Stress of Outer Girder at P6r (Two-Girder Case)
-6
-4
-2
0
2
4
6
0 0.25 0.5 0.75 1
Normalized Length
Stre
ss (k
si)
G2TG2
Figure 5.28 Vertical Shear Stress of Outer Girder at P6r (Two-Girder Case)
-8
-6
-4
-2
0
2
4
6
8
0 0.25 0.5 0.75 1
Normalized Length
Stre
ss (k
si)
G2
TG2
Figure 5.29 Total Shear Stress of Outer Girder at P6r (Two-Girder Case)

85
-7
-6
-5
-4
-3
-2
-1
0
0 0.25 0.5 0.75 1
Normalized Length
Dis
plac
emen
t (in
)
G2
TG2
Figure 5.30 Vertical Displacement of Outer Girder (Two-Girder Case)
-0.05
-0.04
-0.03
-0.02
-0.01
0
0 0.25 0.5 0.75 1
Normalized Length
Rot
atio
n (ra
d)
G2
TG2
Figure 5.31 Cross Section Rotation of Outer Girder (Two-Girder Case)
0
10
20
30
40
50
0 0.25 0.5 0.75 1
Normalized Length
Stre
ss (k
si)
G2
TG2
Figure 5.32 Von-Mises Stress of Outer Girder at P3 (Two-Girder Case)

86
-10
-8
-6
-4
-2
0
0 0.25 0.5 0.75 1
Normalized Length
Stre
ss (k
si)
G1
TG1
Figure 5.33 Primary Bending Normal Stress of Inner Girder at P3 (Three-Girder Case)
-6
-4
-2
0
2
4
0 0.25 0.5 0.75 1
Normalized Length
Stre
ss (k
si)
G1
TG1
Figure 5.34 Warping Normal Stress of Inner Girder at P3 (Three-Girder Case)
-12
-10
-8
-6
-4
-2
0
2
0 0.25 0.5 0.75 1
Normalized Length
Stre
ss (k
si)
G1
TG1
Figure 5.35 Total Normal Stress of Inner Girder at P3 (Three-Girder Case)

87
-2
-1.5
-1
-0.5
0
0.5
1
1.5
2
0 0.25 0.5 0.75 1
Normalized Length
Stre
ss (k
si)
G1TG1
Figure 5.36 St.Venant Shear Stress of Inner Girder at P6r (Three-Girder Case)
-0.8
-0.6
-0.4
-0.2
0
0.2
0.4
0.6
0.8
0 0.25 0.5 0.75 1
Normalized Length
Stre
ss (k
si)
G1
TG1
Figure 5.37 Warping Shear Stress of Inner Girder at P6r (Three-Girder Case)
-1.2
-0.8
-0.4
0
0.4
0.8
1.2
0 0.25 0.5 0.75 1
Normalized Length
Stre
ss (k
si)
G1
TG1
Figure 5.38 Vertical Shear Stress of Inner Girder at P6r (Three-Girder Case)

88
-3
-2
-1
0
1
2
3
0 0.25 0.5 0.75 1
Normalized Length
Stre
ss (k
si)
G1TG1
Figure 5.39 Total Shear Stress of Inner Girder at P6r (Three-Girder Case)
-5
-4
-3
-2
-1
0
0 0.25 0.5 0.75 1
Normalized Length
Dis
plac
emen
t (in
)
G1
TG1
Figure 5.40 Vertical Displacement of Inner Girder (Three-Girder Case)
-0.01
-0.008
-0.006
-0.004
-0.002
0
0 0.25 0.5 0.75 1
Normalized Length
Rot
atio
n (ra
d)
G1
TG1
Figure 5.41 Cross Section Rotation of Inner Girder (Three-Girder Case)
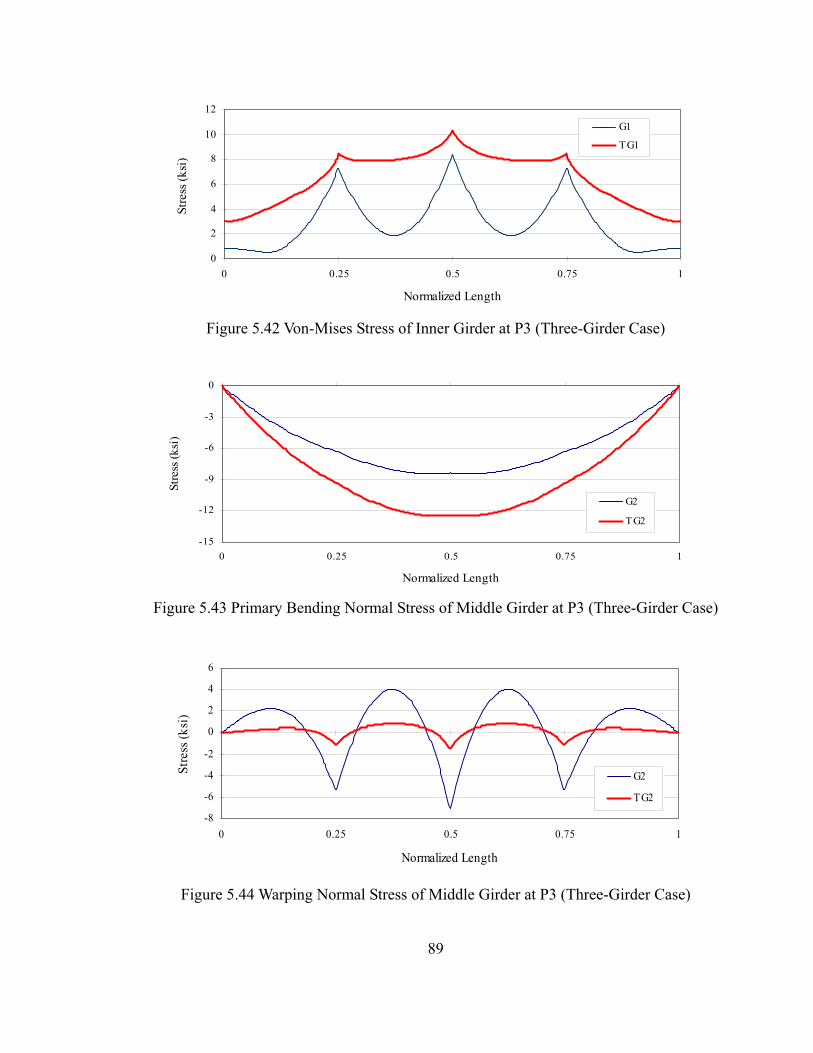
89
0
2
4
6
8
10
12
0 0.25 0.5 0.75 1
Normalized Length
Stre
ss (k
si)
G1
TG1
Figure 5.42 Von-Mises Stress of Inner Girder at P3 (Three-Girder Case)
-15
-12
-9
-6
-3
0
0 0.25 0.5 0.75 1
Normalized Length
Stre
ss (k
si)
G2
TG2
Figure 5.43 Primary Bending Normal Stress of Middle Girder at P3 (Three-Girder Case)
-8
-6
-4
-2
0
2
4
6
0 0.25 0.5 0.75 1
Normalized Length
Stre
ss (k
si)
G2
TG2
Figure 5.44 Warping Normal Stress of Middle Girder at P3 (Three-Girder Case)

90
-20
-16
-12
-8
-4
0
4
0 0.25 0.5 0.75 1
Normalized Length
Stre
ss (k
si)
G2
TG2
Figure 5.45 Total Normal Stress of Middle Girder at P3 (Three-Girder Case)
-2
-1.5
-1
-0.5
0
0.5
1
1.5
2
0 0.25 0.5 0.75 1
Normalized Length
Stre
ss (k
si)
G2TG2
Figure 5.46 St.Venant Shear Stress of Middle Girder at P6r (Three-Girder Case)
-1.2
-0.8
-0.4
0
0.4
0.8
1.2
0 0.25 0.5 0.75 1
Normalized Length
Stre
ss (k
si)
G2TG2
Figure 5.47 Warping Shear Stress of Middle Girder at P6r (Three-Girder Case)

91
-1.5
-1
-0.5
0
0.5
1
1.5
0 0.25 0.5 0.75 1
Normalized Length
Stre
ss (k
si)
G2
TG2
Figure 5.48 Vertical Shear Stress of Middle Girder at P6r (Three-Girder Case)
-3
-2
-1
0
1
2
3
0 0.25 0.5 0.75 1
Normalized Length
Stre
ss (k
si)
G2
TG2
Figure 5.49 Total Shear Stress of Middle Girder at P6r (Three-Girder Case)
-2.8
-2.4
-2
-1.6
-1.2
-0.8
-0.4
0
0 0.25 0.5 0.75 1
Normalized Length
Dis
plac
emen
t (in
)
G2
TG2
Figure 5.50 Vertical Displacement of Middle Girder (Three-Girder Case)

92
-0.01
-0.008
-0.006
-0.004
-0.002
0
0 0.25 0.5 0.75 1
Normalized Length
Rot
atio
n (ra
d)
G2
TG2
Figure 5.51 Cross Section Rotation of Middle Girder (Three-Girder Case)
0
4
8
12
16
0 0.25 0.5 0.75 1
Normalized Length
Stre
ss (k
si)
G2
TG2
Figure 5.52 Von-Mises Stresses of Middle Girder at P3 (Three-Girder Case)
-20
-16
-12
-8
-4
0
0 0.25 0.5 0.75 1
Normalized Length
Stre
ss (k
si)
G3
TG3
Figure 5.53 Primary Bending Normal Stress of Outer Girder at P3 (Three-Girder Case)

93
-10-8
-6
-4
-20
2
4
6
0 0.25 0.5 0.75 1
Normalized Length
Stre
ss (k
si)
G3
TG3
Figure 5.54 Warping Normal Stress of Outer Girder at P3 (Three-Girder Case)
-24
-20
-16
-12
-8
-4
0
4
0 0.25 0.5 0.75 1
Normalized Length
Stre
ss (k
si)
G3
TG3
Figure 5.55 Total Normal Stress of Outer Girder at P3 (Three-Girder Case)
-2
-1.5
-1
-0.5
0
0.5
1
1.5
2
0 0.25 0.5 0.75 1
Normalized Length
Stre
ss (k
si)
G3TG3
Figure 5.56 St.Venant Shear Stress of Outer Girder at P6r (Three-Girder Case)

94
-2
-1.5
-1
-0.5
0
0.5
1
1.5
2
0 0.25 0.5 0.75 1
Normalized Length
Stre
ss (k
si)
G3
TG3
Figure 5.57 Warping Shear Stress of Outer Girder at P6r (Three-Girder Case)
-2
-1.5
-1
-0.5
0
0.5
1
1.5
2
0 0.25 0.5 0.75 1
Normalized Length
Stre
ss (k
si)
G3TG3
Figure 5.58 Vertical Shear Stress of Outer Girder at P6r (Three-Girder Case)
-4
-3
-2
-1
0
1
2
3
4
0 0.25 0.5 0.75 1
Normalized Length
Stre
ss (k
si)
G3
TG3
Figure 5.59 Total Shear Stress of Outer Girder at P6r (Three-Girder Case)

95
-4
-3.2
-2.4
-1.6
-0.8
0
0 0.25 0.5 0.75 1
Normalized Length
Dis
plac
emen
t (in
)
G3
TG3
Figure 5.60 Vertical Displacement of Outer Girder (Three-Girder Case)
-0.01
-0.008
-0.006
-0.004
-0.002
0
0 0.25 0.5 0.75 1
Normalized Length
Rot
atio
n (ra
d)
G3
TG3
Figure 5.61 Cross Section Rotation of Outer Girder (Three-Girder Case)
0
3
6
9
12
15
18
21
0 0.25 0.5 0.75 1
Normalized Length
Stre
ss (k
si)
G3
TG3
Figure 5.62 Von-Mises Stress of Outer Girder at P3 (Three-Girder Case)

96
Chapter 6 Finite Element Analysis
Finite element analyses of curved tubular-flange girder systems were conducted to compare with the theoretical analysis results presented in Chapter 5. The general purpose finite element program, ABAQUS v6.5 (ABAQUS 2003) was used for the analyses. The single girder, two-girder, and three-girder systems described in Chapter 5 were modeled and analyzed using the finite element method. The results of the finite element analyses show that cross section distortion develops in a curved tubular-flange girder under load. This distortion is not considered in the theoretical model for the curved tubular-flange girder. In addition, cross frame deflection, also not considered in the theoretical method, was observed. Therefore, multiple finite element models were built to consider these effects, including models with or without cross section distortion, and with or without cross frame deflection. For the models without cross section distortion, linear kinematic constraints were used to restrain the distortion of the cross section. For the models without cross frame deflection, the stiffness of the cross frames was made very large to eliminate the cross frame deflection. Comparisons between the results from these finite element models and those from the theoretical analysis are presented.
6.1 Finite Element Model
The main parameters considered in developing the finite element model include the element type, finite element mesh density, loading, boundary conditions and material properties.
6.1.1 Element Type
The linear, finite-membrane-strain, fully integrated, quadrilateral shell element S4 in ABAQUS v6.5 was used to model the curved tubular-flange girders. This general purpose shell element is valid for analyses of both thin and thick shells. The S4 shell element has four integration points across the element and five section points (integration points) through the thickness of the shell element. Truss element T3D2 was used to model the cross frames.
6.1.2 Mesh Density
For an accurate finite element analysis, a sufficiently refined finite element mesh is necessary. As the mesh density increases, the finite element analysis results will converge. For the finite element models used in this chapter, the web, the top and bottom walls of the tubular flanges have 200 elements along the span length and 12 elements across the plate width. The side walls of the tubular-flanges have 200 elements along the span length and 6 elements across the plate width. Thus, total 16800 elements were used for each curved tubular-flange girder (see Figure 6.1).

97
6.1.3 Boundary Conditions and Loading Conditions
The finite element models include simple support boundary conditions for the girders. The coordinate system and the corresponding degrees of freedom for the finite element models are presented in Figure 6.2. The x-axis is in the radial direction. The y-axis is in the circumferential tangential direction. The z-axis is in the vertical direction. The vertical displacements (u3) are specified as zero at the centroid of the two end cross sections for each girder. The circumferential displacement (u2) at the centroid of the left end cross section for each girder is restrained. All the nodes on the left and right end cross section of each girder are restrained to prevent displacement in the radial direction (u1) and rotation about y-axis (u5). Thus, the end cross sections are restrained against twist, and free to warp. The distributed vertical load is modeled as the pressure load applied to the top flange of each girder.
6.1.4 Linear Constraints
ABAQUS v6.5 defines a linear multiple-point constraint in the form of an equation. That is, 0uAuAuA R
knPj2
Pi1 =+++ L , where, P
iu is a nodal variable at node P, degree of freedom i, and the An are coefficients that define the relative motion of the nodes. For the curved tubular-flange girder finite element models, the cross section distortion was restrained by imposing the following constraints (see Figure 6.3): (1) every node on the cross section has the same rotation about the y-axis (u5) as that of the cross section centroid, that is, for a node P on the cross section, the linear constraint equation is 0uu C
5P5 =− ; (2) the nodal displacements in the x-axis direction are linearly
distributed over the depth of the cross section, that is, for a node P on the cross section, the linear constraint equation is 0uAuu C
5pC1
P1 =−− . These linear constraint equations
are written for every node on the cross section.
6.1.5 Material Properties
The steel of the tubular-flange girders was modeled as an elastic isotropic material with an elastic modulus of 29000 ksi, and Poisson’s ratio of 0.3. The same material was used for the cross frames, except for the models in which cross frame deflection was restrained, where a large elastic modulus was used.
6.2 Finite Element Analysis Results
6.2.1 Single Curved Tubular-Flange Girder
The girder TG2 described in Chapter 5 was used for the finite element analyses of a single curved tubular-flange girder. Four types of finite element models were built and analyzed. One model, M1, includes kinematic constraints restraining the cross section distortion, making the model consistent with the assumptions of the theoretical analysis. The second model, M2, allows cross section distortion to develop. For the

98
third model, M3, the cross section distortion was unrestrained, but eleven transverse stiffeners were introduced, evenly spaced along the span. The fourth model, M4, includes linear constraints to restrain the distortion of the web, but does not include constraints on distortion of the tubular flanges. The stresses at the critical points and the deflections at the cross section centroid are shown in plots of the finite element analysis results in Figure 6.4 through Figure 6.8. As discussed in Chapter 5, Point 2 (P2) has the maximum total normal stress and the maximum Von-Mises stress on the cross section in the simply supported single curved tubular-flange girder. The right side of Point 6 (P6r) has the maximum total shear stress on the cross section. Therefore, stresses at these points are shown in the plots.
Figure 6.4 through Figure 6.8 show that the results from the theoretical analysis are good in agreement with the results from finite element model M1. However, for the Von-Mises stress shown in Figure 6.8, the M1 finite element result is smaller than the theoretical result, while, for the other stresses and the displacements, the M1 results are slightly larger than the theoretical results. The Von-Mises stresses in the 3D finite element model, however, also include the contributions from the normal stress in the radial direction, which tend to reduce the Von-Mises stress at P2. The normal stress in the radial direction is small and neglected in the theoretical analysis.
Comparing the theoretical results with the results from finite element model M2 shows that the distortion has a significant effect on the bending normal stress and the deflections. However, the distortion has little influence on the total shear stress (see Figure 6.5). As discussed in the previous chapter, most of the total shear stress for the single curved tubular-flange girder is St.Venant shear stress. The vertical shear stress is roughly 20% of the total shear stress and the warping shear stress is negligible. Thus, the cross section distortion has little effect on the St.Venant shear stress for the single curved tubular-flange girder, and the shear stress due to cross section distortion is small enough to be neglected. These findings suggest that the cross section distortion of the single curved tubular-flange girder is mainly from web distortion. To investigate this possibility, eleven evenly spaced transverse web stiffeners were added to model M2 to restrain the web distortion, resulting in model M3.
The results from finite element model M3 show that the total normal stress and the deflections of M3 are very close to the theoretical results. The M3 results show restraint of the web distortion by the stiffeners introduces warping normal and shear stresses which contribute to the total normal stress and the total shear stress. Finite element model M4, with only the web distortion restrained was analyzed. The M4 results show that the total normal stress at P2 is in good agreement with the theoretical results. The M4 displacements are close to the corresponding theoretical results, but M4 cross section rotations are larger than the theoretical results.
These results show that the influence of the cross section distortion on the single curved tubular-flange girder results is mainly from web distortion. This distortion has a significant effect on the normal stress and the displacements, but the effect of web distortion can be reduced by transverse stiffeners.

99
6.2.2 Two Curved Tubular-Flange Girder System
The girders TG1 and TG2 described in Chapter 5 were used for the finite element analyses of a two-girder system. Four types of finite element models were built and used in the finite element analyses. The first model, denoted M5, restrains the cross section distortion, but allows cross frame deflections to develop. The second model, denoted M6, restrains the cross section distortion, and includes rigid cross frames. For the third model, denoted M7, both the cross section distortion and the cross frame deflections are unrestrained. For the fourth model, denoted M8, web distortion is restrained, but the tubular flange distortion and the cross frame deflections are allowed to develop. The stresses at the girder critical points and the deflections at the cross section centroid are presented in Figure 6.9 through Figure 6.18. Similar to the theoretical results discussed in Chapter 5. P2 has the maximum total normal stress and the maximum Von-Mises stress for the inner girder. P3 has the maximum total normal stress and the maximum Von-Mises stress for the outer girder. The right side of Point 6 (P6r) has the maximum total shear stress for both girders.
The results from the theoretical analyses are in a good agreement with the results from finite element models M5 and M6. The M5 results, which include cross frame deflections, and the M6 results, which do not include cross frame deflections, have little difference. Therefore, the effects of the cross section deflections in the two-girder system may be negligible. For the finite element models including cross section distortion, the results indicate that the cross frames induce the large stresses due to distortion at the cross sections which are braced by the cross frames (see Figures 6.9, 6.10, 6.14 and 6.15). The cross section distortion also induces greater cross section rotation for both girders. Cross section distortion of the inner girder reduces the total normal stress at the braced cross sections to nearly zero for the model which both web distortion and tube distortion are allowed, M7, (see Figure 6.9). Cross section distortion of the outer girder of model M7 increases the total normal stress by about 13% at the braced cross sections (see Figure 6.14). Away from the braced cross sections, the total normal stress in both girders of model M7 is close to the theoretical result. The cross section distortion induces a jump in the shear stress at the braced cross sections. As a result, the critical cross section for the total shear stress may change from the end section to the first braced cross section. As shown in the figures, the stresses and displacements from model M8 are close to the results from model M7, which shows that the tubular-flange distortion influences the displacements of model M8. Therefore, the web distortion in the two-girder system may have only a small contribution to the total distortion and a large contribution comes from the tubular-flange distortion.
6.2.3 Three Curved Tubular-Flange Girder System
The girders TG1, TG2 and TG3 described in Chapter 5 were used for the finite element analyses of a three-girder system. Five types of finite element models were built and analyzed to compare with the theoretical results. Four of these finite element models are similar to those used for the two-girder system. The fifth model, denoted

100
M9, includes nine cross frames evenly spaced to investigate the influence of the number of cross frames on distortion.
It is found that for each of the three girders, the results from the theoretical analyses are in a good agreement with the results from finite element model M6 (without cross section distortion and cross frame deflection). However, the results from finite element model M5 (without cross section distortion, but with cross frame deflection) differ from the theoretical results, especially for the total normal stresses for the inner girder TG1, and the total shear stress and the cross section rotation for the outer girder TG3. A comparison of the model M7 results (with cross section distortion and cross frame deflection) and the model M8 results (with tube distortion and cross frame deflection, but without web distortion) shows that restraining the web distortion reduces some of the cross section rotation and some of the stresses induced by cross section distortion. However, the cross section rotation in model M8 is still much larger than the theoretical results, indicating that significant distortion develops in the tubular flanges. The stresses and cross section rotation for model M9, which includes cross section distortion and cross frame deflection, but has a greater number of cross frames (9) than the other models (5), are smaller than those for models M7 and M8. The model M9 results are closer to the theoretical results than the model M7 and M8 results, indicating that using more cross frames can reduce the effects of cross section distortion.
6.2.4 Summary
The findings of the finite element results can be summarized as follows. When the finite element model includes constraints which are similar to the assumptions of the theoretical method, that is, cross section distortion and cross frame deflection are restrained, the theoretical results are in a good agreement with the finite element results. For a single tubular-flange girder, the effects of the cross section distortion are mainly a result of web distortion. If the web distortion can be restrained, for example, by using transverse stiffeners, the effects of cross section distortion for a single tubular-flange girder can be significantly reduced. For a multiple-girder system, stresses due to cross section distortion develop near the cross sections braced by cross frames which influence the stresses over the unbraced lengths between the cross frames. The cross section distortion results in larger cross section rotations near the middle of the unbraced lengths. Restraining the web distortion in a multiple-girder system produces a modest reduction in stresses and cross section rotation. The tubular flange distortion can have a significant effect on the stresses and cross section rotation. The effect of the cross frame deflections is small for the two-girder system, and somewhat larger for the three-girder system, especially for the inner girder normal stress and the outer girder rotation.

101
(a) Overview of Three-Girder System
(b) Finite Element Mesh of Three Girder System
Figure 6.1 Finite Element Model of Three-Girder System

102
Cx
z
x (1)
z (3)
y(2)
45
6
Left End Section: Right End Section:
Centroid (C): Centroid (C):
0u C1 = , 0u C
2 = , 0u C3 = 0u C
1 = , 0u C3 =
Other Nodes: Other Nodes:
0u1 = , 0u 5 = 0u1 = , 0u 5 =
Figure 6.2 Boundary Condition
Ap
P
Cx
zxσ
(1) 0uu C
5P5 =− (2) 0uAuu C
5pC1
P1 =−−
Figure 6.3 Linear Constraints

103
-24
-20
-16
-12
-8
-4
0
0 0.25 0.5 0.75 1
Normalized Length
Stre
ss (k
si)
Theory M1 M2M3 M4
Theory M3 M1
M4 M2
Figure 6.4 Total Normal Stress at P2 (Single Girder)
-12
-8
-4
0
4
8
12
0 0.25 0.5 0.75 1
Normalized Length
Stre
ss (k
si)
Theory M1 M2M3 M4
M3
Figure 6.5 Total Shear Stress at P6r (Single Girder)
-8
-7-6
-5
-4
-3-2
-1
0
0 0.25 0.5 0.75 1
Normalized Length
Dis
plac
emen
t (in
)
Theory M1 M2M3 M4
Figure 6.6 Vertical Displacement (Single Girder)

104
0
0.02
0.04
0.06
0.08
0.1
0.12
0.14
0 0.25 0.5 0.75 1
Normalized Length
Rot
atio
n (ra
d)
TheoryM1M2M3M4
Figure 6.7 Cross Section Rotation (Single Girder)
0
4
8
12
16
20
24
0 0.25 0.5 0.75 1
Normalized Length
Stre
ss (k
si)
Theory M1 M2M3 M4
Figure 6.8 Von-Mises Stress at P2 (Single Girder)
-14
-12
-10
-8
-6
-4
-2
0
2
0 0.25 0.5 0.75 1
Normalized Length
Stre
ss (k
si)
Theory M5 M6M7 M8
Figure 6.9 Total Normal Stress of Inner Girder at P2 (Two-Girder Case)

105
-6
-4
-2
0
2
4
6
0 0.25 0.5 0.75 1
Normalized Length
Stre
ss (k
si)
Theory M5 M6M7 M8
M7M8
M5
Theory
M6
Figure 6.10 Total Shear Stress of Inner Girder at P6r (Two-Girder Case)
-3
-2.5
-2
-1.5
-1
-0.5
0
0 0.25 0.5 0.75 1
Normalized Length
Dis
plac
emen
t (in
)
Theory M5 M6M7 M8
Theory
M6
M7
M8
M5
Figure 6.11 Vertical Displacement of Inner Girder (Two-Girder Case)
0
0.005
0.01
0.015
0.02
0.025
0.03
0.035
0 0.25 0.5 0.75 1
Normalized Length
Rot
atio
n (ra
d)
Theory M5 M6M7 M8
M7M8
TheoryM5 M6
Figure 6.12 Cross Section Rotation of Inner Girder (Two-Girder Case)

106
0
2
4
6
8
10
12
14
0 0.25 0.5 0.75 1
Normalized Length
Stre
ss (k
si)
Theory M5 M6M7 M8
Figure 6.13 Von-Mises Stress of Inner Girder at P2 (Two-Girder Case)
-35
-30
-25
-20
-15
-10
-5
0
0 0.25 0.5 0.75 1
Normalized Length
Stre
ss (k
si)
Theory M5 M6M7 M8
M7 M8
M5
Theory M6
Figure 6.14 Total Normal Stress of Outer Girder at P3 (Two-Girder Case)
-12
-8
-4
0
4
8
12
0 0.25 0.5 0.75 1
Normalized Length
Stre
ss (k
si)
Theory M5 M6M7 M8
M7
M8
Theory M6
M5
Figure 6.15 Total Shear Stress of Outer Girder at P6r (Two-Girder Case)

107
-7
-6
-5
-4
-3
-2
-1
0
0 0.25 0.5 0.75 1
Normalized Length
Dis
plac
emen
t (in
)
Theory M5 M6M7 M8
Theory
M6
M5M7
M8
Figure 6.16 Vertical Displacement of Outer Girder (Two-Girder Case)
0
0.01
0.02
0.03
0.04
0.05
0 0.25 0.5 0.75 1
Normalized Length
Rot
atio
n (ra
d)
Theory M5 M6M7 M8
Theory M6
M7
M8M5
Figure 6.17 Cross Section Rotation of Outer Girder (Two-Girder Case)
0
5
10
15
20
25
30
35
0 0.25 0.5 0.75 1
Normalized Length
Stre
ss (k
si)
Theory M5 M6M7 M8
M7
M8Theory
M5
M6
Figure 6.18 Von-Mises Stress of Outer Girder at P3 (Two-Girder Case)

108
-14
-12
-10
-8
-6
-4
-2
0
0 0.25 0.5 0.75 1
Normalized Length
Stre
ss (k
si)
Theory M5 M6M7 M8 M9
M7M5
M8
M9Theory
M6
Figure 6.19 Total Normal Stress of Inner Girder at P2 (Three-Girder Case)
-6
-4
-2
0
2
4
6
0 0.25 0.5 0.75 1
Normalized Length
Stre
ss (k
si)
Theory M5 M6M7 M8 M9
M7
M8Theory
M6M5
M9
Figure 6.20 Total Shear Stress of Inner Girder at P6r (Three-Girder Case)
-4
-3
-2
-1
0
0 0.25 0.5 0.75 1
Normalized Length
Dis
plac
emen
t (in
)
Theory M5 M6M7 M8 M9
Theory
M8M5
M6M9
M7
Figure 6.21 Vertical Displacement of Inner Girder (Three-Girder Case)

109
0
0.002
0.004
0.006
0.008
0.01
0.012
0 0.25 0.5 0.75 1
Normalized Length
Rot
atio
n (ra
d)
Theory M5 M6M7 M8 M9
M7
M8
M9Theory
M5
M6
Figure 6.22 Cross Section Rotation of Inner Girder (Three-Girder Case)
0
2
4
6
8
10
12
14
0 0.25 0.5 0.75 1
Normalized Length
Stre
ss (k
si)
Theory M5 M6
M7 M8 M9
Figure 6.23 Von-Mises Stress of Inner Girder at P2 (Three-Girder Case)
-16
-14
-12
-10
-8
-6
-4
-2
0
0 0.25 0.5 0.75 1
Normalized Length
Stre
ss (k
si)
Theory M5 M6M7 M8 M9
Figure 6.24 Total Normal Stress of Middle Girder at P3 (Three-Girder Case)
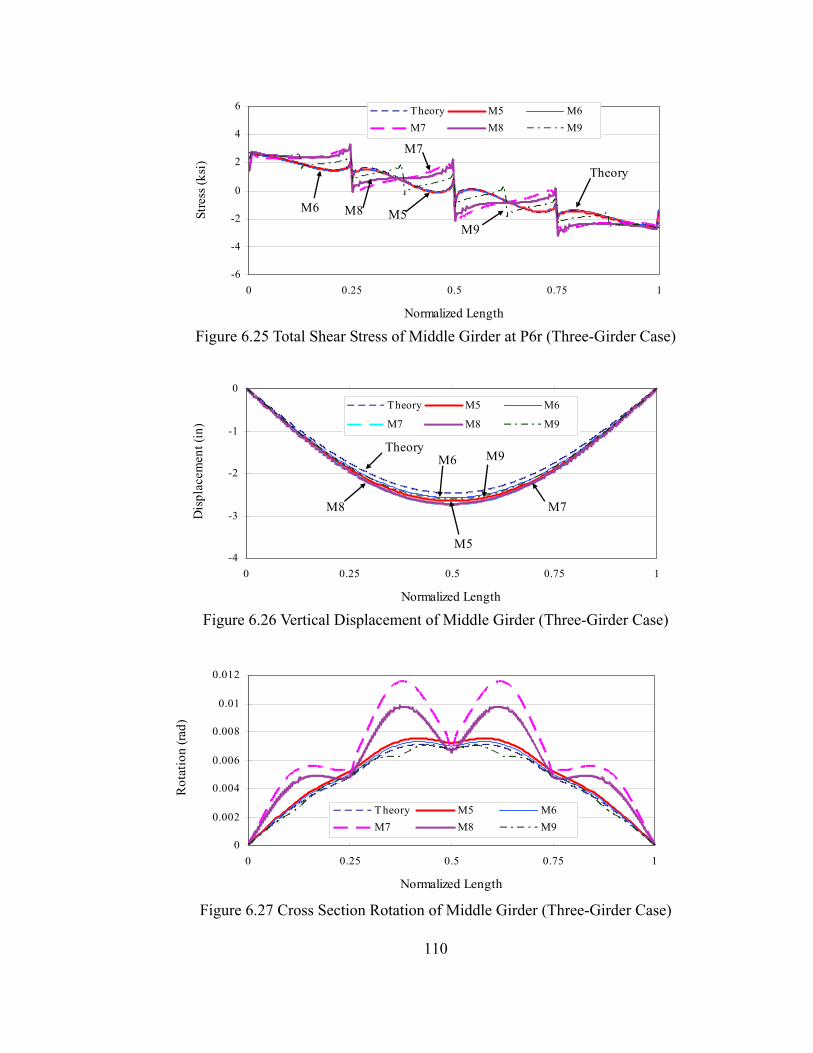
110
-6
-4
-2
0
2
4
6
0 0.25 0.5 0.75 1
Normalized Length
Stre
ss (k
si)
Theory M5 M6M7 M8 M9
M6 M5
Theory
M9M8
M7
Figure 6.25 Total Shear Stress of Middle Girder at P6r (Three-Girder Case)
-4
-3
-2
-1
0
0 0.25 0.5 0.75 1
Normalized Length
Dis
plac
emen
t (in
)
Theory M5 M6
M7 M8 M9
TheoryM6 M9
M5
M8 M7
Figure 6.26 Vertical Displacement of Middle Girder (Three-Girder Case)
0
0.002
0.004
0.006
0.008
0.01
0.012
0 0.25 0.5 0.75 1
Normalized Length
Rot
atio
n (ra
d)
Theory M5 M6M7 M8 M9
Figure 6.27 Cross Section Rotation of Middle Girder (Three-Girder Case)

111
0
2
4
6
8
10
12
14
16
0 0.25 0.5 0.75 1
Normalized Length
Stre
ss (k
si)
Theory M5 M6M7 M8 M9
M7
M8
M9
M5
M6Theory
Figure 6.28 Von-Mises Stress of Middle Girder at P3 (Three-Girder Case)
-20
-16
-12
-8
-4
0
0 0.25 0.5 0.75 1
Normalized Length
Stre
ss (k
si)
Theory M5 M6M7 M8 M9
TheoryM6
M9M7
M8
M5
Figure 6.29 Total Normal Stress of Outer Girder at P3 (Three-Girder Case)
-6
-4
-2
0
2
4
6
0 0.25 0.5 0.75 1
Normalized Length
Stre
ss (k
si)
Theory M5 M6M7 M8 M9
TheoryM6M7
M8M9
M5
Figure 6.30 Total Shear Stress of Outer Girder at P6r (Three-Girder Case)

112
-4
-3
-2
-1
0
0 0.25 0.5 0.75 1
Normalized Length
Dis
plac
emen
t (in
)
Theory M5 M6M7 M8 M9
Theory
M6
M7
M8
M5M9
Figure 6.31 Vertical Displacement of Outer Girder (Three-Girder Case)
0
0.002
0.004
0.006
0.008
0.01
0.012
0.014
0.016
0 0.25 0.5 0.75 1
Normalized Length
Rot
atio
n (ra
d)
Theory M5 M6M7 M8 M9
Figure 6.32 Cross Section Rotation of Outer Girder (Three-Girder Case)
0
4
8
12
16
20
0 0.25 0.5 0.75 1
Normalized Length
Stre
ss (k
si)
Theory M5 M6
M7 M8 M9
Figure 6.33 Von-Mises Stress of Outer Girder at P3 (Three-Girder Case)

113
Chapter 7 Parametric Study
This chapter presents the results of a parametric study of the effect of different curved tubular-flange girder cross section parameters on the stresses and displacements. The parametric study is carried out for the single curved tubular-flange girder and the three curved tubular-flange girder system described previously. For this parametric study, as each parameter is varied, the cross section area (the girder self-weight) and the other cross section dimensions are kept constant, except the web thickness which are adjusted to keep the cross section area constant.
7.1 Single Tubular-Flange Girder
The parameters included in this study are the tubular flange width, bf, tubular flange depth, df, web thickness, tw, cross section depth, d, and the girder curvature parameter, L/R. For each single tubular-flange girder considered in this study, the arc span length, L, the radius of curvature, R, and the cross section area are equal to those of the single tubular-flange girders described in Chapter 5, except when the study focuses on the girder curvature parameter, L/R. For the study of the girder curvature, L is constant and R varies. For the study of the effect of tubular flange width, the tubular-flange depth and the cross section depth, the applied load is the full dead load described in Chapter 5. Thus, the results of the parametric study can be compared with the results presented in Chapter 5 and Chapter 6. For the study of the girder curvature i.e., L/R, the applied load is the girder self-weight.
7.1.1 Effect of Tubular Flange Width
The cross section dimensions for the girders considered in this study are given in Table 7.1. As the tubular flange width, bf, varies, the cross section depth, d, the tubular flange depth, df, the tubular flange thickness, tf, are constant, but the web thickness, tw, is varied to keep the cross section area constant.
The analysis results are shown in Figure 7.1 through Figure 7.9. As bf increases, Ix, Iyf, Iw, J, and Ae also increase. The bending normal stress, bσ , is inversely proportional to Ix and the St.Venant shear stress, stτ , is inversely proportional to Ae, therefore, bσ and stτ decrease with the increase in bf. The warping normal stress, wσ , has a slight decrease with the increae in bf, since Iw increases. The vertical displacement, v, and the cross section rotation, θ , are related to both bending and torsion. v and θ decrease with the increase in bf, since Ix and J both increase. bσ dominates the total normal stress, xσ , so xσ has the same trend as bσ . stτ dominates the total shear stress, tτ , so tτ has the same trend as stτ . Since the increase in bf
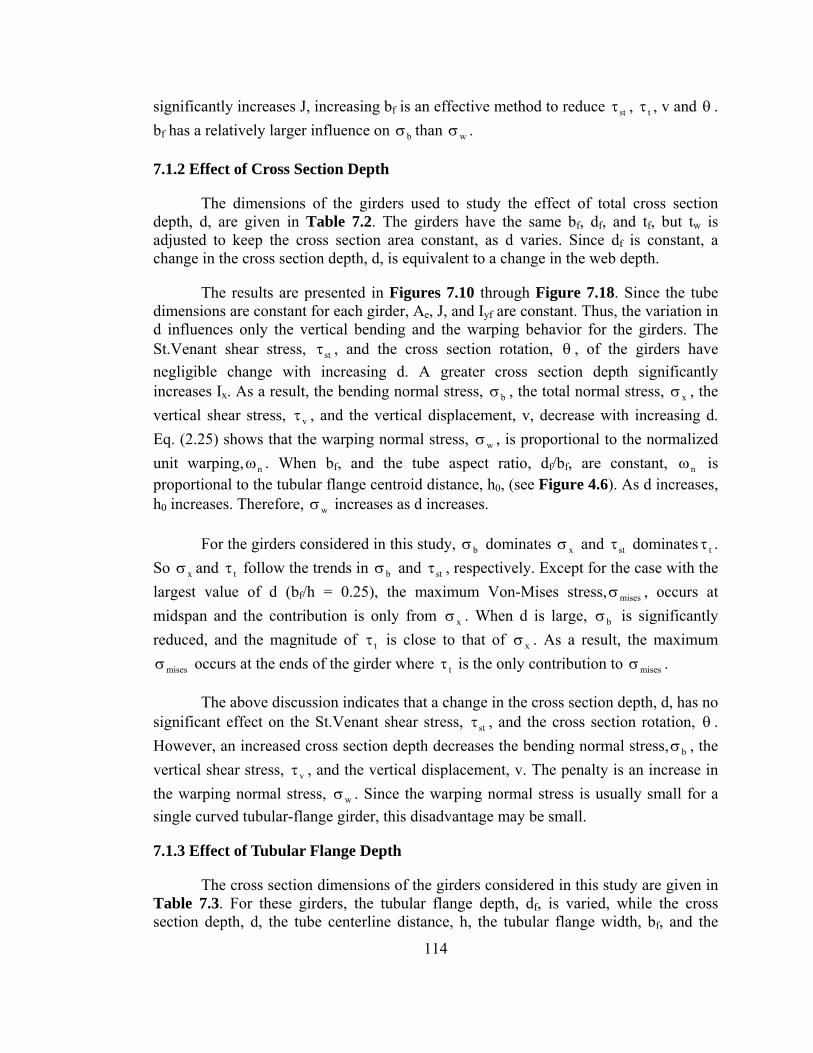
114
significantly increases J, increasing bf is an effective method to reduce stτ , tτ , v and θ . bf has a relatively larger influence on bσ than wσ .
7.1.2 Effect of Cross Section Depth
The dimensions of the girders used to study the effect of total cross section depth, d, are given in Table 7.2. The girders have the same bf, df, and tf, but tw is adjusted to keep the cross section area constant, as d varies. Since df is constant, a change in the cross section depth, d, is equivalent to a change in the web depth.
The results are presented in Figures 7.10 through Figure 7.18. Since the tube dimensions are constant for each girder, Ae, J, and Iyf are constant. Thus, the variation in d influences only the vertical bending and the warping behavior for the girders. The St.Venant shear stress, stτ , and the cross section rotation, θ , of the girders have negligible change with increasing d. A greater cross section depth significantly increases Ix. As a result, the bending normal stress, bσ , the total normal stress, xσ , the vertical shear stress, vτ , and the vertical displacement, v, decrease with increasing d. Eq. (2.25) shows that the warping normal stress, wσ , is proportional to the normalized unit warping, nω . When bf, and the tube aspect ratio, df/bf, are constant, nω is proportional to the tubular flange centroid distance, h0, (see Figure 4.6). As d increases, h0 increases. Therefore, wσ increases as d increases.
For the girders considered in this study, bσ dominates xσ and stτ dominates tτ . So xσ and tτ follow the trends in bσ and stτ , respectively. Except for the case with the largest value of d (bf/h = 0.25), the maximum Von-Mises stress, misesσ , occurs at midspan and the contribution is only from xσ . When d is large, bσ is significantly reduced, and the magnitude of tτ is close to that of xσ . As a result, the maximum
misesσ occurs at the ends of the girder where tτ is the only contribution to misesσ .
The above discussion indicates that a change in the cross section depth, d, has no significant effect on the St.Venant shear stress, stτ , and the cross section rotation, θ . However, an increased cross section depth decreases the bending normal stress, bσ , the vertical shear stress, vτ , and the vertical displacement, v. The penalty is an increase in the warping normal stress, wσ . Since the warping normal stress is usually small for a single curved tubular-flange girder, this disadvantage may be small.
7.1.3 Effect of Tubular Flange Depth
The cross section dimensions of the girders considered in this study are given in Table 7.3. For these girders, the tubular flange depth, df, is varied, while the cross section depth, d, the tube centerline distance, h, the tubular flange width, bf, and the
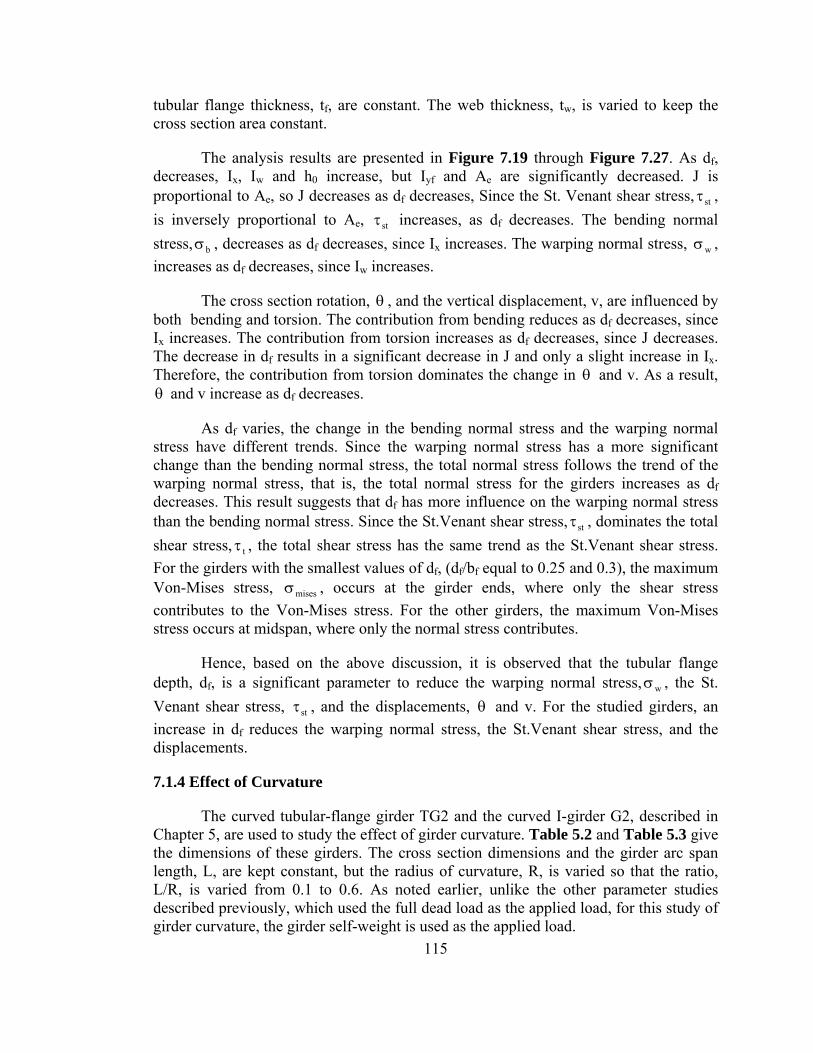
115
tubular flange thickness, tf, are constant. The web thickness, tw, is varied to keep the cross section area constant.
The analysis results are presented in Figure 7.19 through Figure 7.27. As df, decreases, Ix, Iw and h0 increase, but Iyf and Ae are significantly decreased. J is proportional to Ae, so J decreases as df decreases, Since the St. Venant shear stress, stτ , is inversely proportional to Ae, stτ increases, as df decreases. The bending normal stress, bσ , decreases as df decreases, since Ix increases. The warping normal stress, wσ , increases as df decreases, since Iw increases.
The cross section rotation, θ , and the vertical displacement, v, are influenced by both bending and torsion. The contribution from bending reduces as df decreases, since Ix increases. The contribution from torsion increases as df decreases, since J decreases. The decrease in df results in a significant decrease in J and only a slight increase in Ix. Therefore, the contribution from torsion dominates the change in θ and v. As a result, θ and v increase as df decreases.
As df varies, the change in the bending normal stress and the warping normal stress have different trends. Since the warping normal stress has a more significant change than the bending normal stress, the total normal stress follows the trend of the warping normal stress, that is, the total normal stress for the girders increases as df decreases. This result suggests that df has more influence on the warping normal stress than the bending normal stress. Since the St.Venant shear stress, stτ , dominates the total shear stress, tτ , the total shear stress has the same trend as the St.Venant shear stress. For the girders with the smallest values of df, (df/bf equal to 0.25 and 0.3), the maximum Von-Mises stress, misesσ , occurs at the girder ends, where only the shear stress contributes to the Von-Mises stress. For the other girders, the maximum Von-Mises stress occurs at midspan, where only the normal stress contributes.
Hence, based on the above discussion, it is observed that the tubular flange depth, df, is a significant parameter to reduce the warping normal stress, wσ , the St. Venant shear stress, stτ , and the displacements, θ and v. For the studied girders, an increase in df reduces the warping normal stress, the St.Venant shear stress, and the displacements.
7.1.4 Effect of Curvature
The curved tubular-flange girder TG2 and the curved I-girder G2, described in Chapter 5, are used to study the effect of girder curvature. Table 5.2 and Table 5.3 give the dimensions of these girders. The cross section dimensions and the girder arc span length, L, are kept constant, but the radius of curvature, R, is varied so that the ratio, L/R, is varied from 0.1 to 0.6. As noted earlier, unlike the other parameter studies described previously, which used the full dead load as the applied load, for this study of girder curvature, the girder self-weight is used as the applied load.

116
Figure 7.28 through Figure 7.37 plot the maximum stresses and displacements for the single tubular-flange girder and the single I-girder as the girder curvature varies. The plots show that the maximum total normal stress, total shear stress, and the displacements for the single curved tubular-flange girder and the single curved I-girder increase with an increase in the curvature. The maximum bending normal stress and the maximum vertical shear stress for both types of girders are almost constant as the girder curvature is varied. The curvature has more influence on the warping normal stress, warping shear stress, St. Venant shear stress, vertical displacement, and cross section rotation.
The results show that the single curved I-girder develops much larger stresses and displacements than the single curved tubular-flange girder for the same L/R. As shown in Figure 7.28 through Figure 7.37, the slope of the curve at each point for the single I-girder is much larger than that for the single tubular-flange girder. Therefore, as L/R increases, the rate of increase in the stresses and displacements for the single curved I-girder is significantly larger than for the single curved tubular-flange girder.
7.2 Three Curved Tubular-Flange Girder System
A parametric study of a three-girder system is presented in this section. The three girders in the system have different cross section dimensions. Five cases are included in the parametric study and the girder cross section dimensions for each case are given, respectively, in Table 7.4 through Table 7.8. Each case has three cross frames, except for the study of the effect of cross frames. The applied load is the full dead load described in Chapter 5.
7.2.1 Effect of Tubular Flange Width
The cross section dimensions of the three-girder systems used to study the effect of the tubular flange width are given in Tables 7.4, 7.5, and 7.6. The three girders in each system have different cross section dimensions. In each case, as the tubular-flange width, bf, is varied, the tubular-flange depth, df, the tubular-flange thickness, tf, and the total cross section depth, d, are kept constant for each girder. The web thickness, tw, is varied to keep the cross section area constant.
The effect of tubular flange width is discussed for the inner girder, TG1, the middle girder, TG2, and the outer girder, TG3, respectively. The results are presented in Figure 7.38 through Figure 7.47. The results show that the stresses and displacements for TG1, TG2 and TG3 have similar trends and decrease with the increase in bf. As bf increases, J, Ix, Iw, and Ae increase. Therefore, the bending normal stress decreases due to the increase of Ix; the warping normal stress decreases due to the increase of Iw; the St.Venant shear stress decreases due to the increase of Ae. The cross section rotation and the vertical displacement are influenced by both bending and torsion, and the cross section rotation and the vertical displacement decrease, since J and Ix increase. The results show that the increase in bf significantly decreases the warping normal stress.

117
Hence, the tubular flange width, bf, is an important parameter to reduce the stresses and displacements, especially the warping normal stress.
7.2.2 Effect of Tubular Flange Depth
The three cases that were studied are presented in Tables 7.6, 7.7, and 7.8. The three girders in each case have different cross section dimensions. The analysis results are given in Figure 7.48 through Figure 7.57. In each case, the tubular-flange depth, df, is varied, while the tubular-flange width, bf, the tubular-flange thickness, tf, and the total cross section depth, d, are kept constant for each girder. The web thickness, tw, is varied to keep the cross section area constant.
The stresses and displacements for the inner girder, TG1, the middle girder, TG2, and the outer girder, TG3, have similar trends as df varies. The results show that the bending normal stress, the vertical shear stress, and the vertical displacements increase as df increases, but the warping normal stress and the cross section rotation decrease as df increases. df has little influence on the St.Venant shear stress, the bending normal stress in the outer girder, and the vertical displacement of the outer girder.
As df increases, Ae, J, and Iw also increase, but Ix slightly decreases. Since the bending normal stress, the vertical shear stress, and the vertical displacement are inversely proportional to Ix, the bending normal stress, the vertical shear stress, and the vertical displacement increase with the increase in df. The twist angle is inversely proportional to J and the cross section rotation is dominated by the twist angle, so the cross section rotation decreases with the increase in df. The warping normal stress also decreases as df increases, since Iw increases. As discussed in Chapter 5, the cross frames restrain the rotation of the girders, but increase the vertical load on the outside girder and decrease the vertical load on the inside girder. Since the torsional constant, J, increases as df increases, the increment of the vertical load decrease on the inner girder and vertical load increase on the outer girder is decreased. Thus, the vertical loads applied on the inner girder become larger and the vertical loads applied on the outer girder become smaller with the increase in df. Therefore, the bending moment, Mx, increases in the inner girder and decreases in the outer girder as df increases. For the inner girder, as df increases, the changes in both Mx and Ix have the same influence on the bending normal stress. That is, Mx is increasing and Ix is decreasing, so the bending normal stress increases as df increases. For the outer girder, both Mx and Ix decrease as df increases, but Ix is dominant, and the bending normal stress increases as df increases. However, as shown in Figure 7.48, the increase in the bending normal stress is small. For a similar reason, df has little influence on the St.Venant shear stress. The increase in J and the decrease in Ix decreases the cross frame restraint of the cross section rotation, so the total St.Venant torque, Mst, carried by each girder increases as df increases. The St. Venant shear stress is proportional to Mst, but inversely proportional to Ae. The influence on the St. Venant shear stress from Mst and Ae counteract each other and the St.Venant shear stress remains relatively constant. Based on the previous discussion, it is concluded that the tubular flange depth, df, is a significant parameter to reduce the
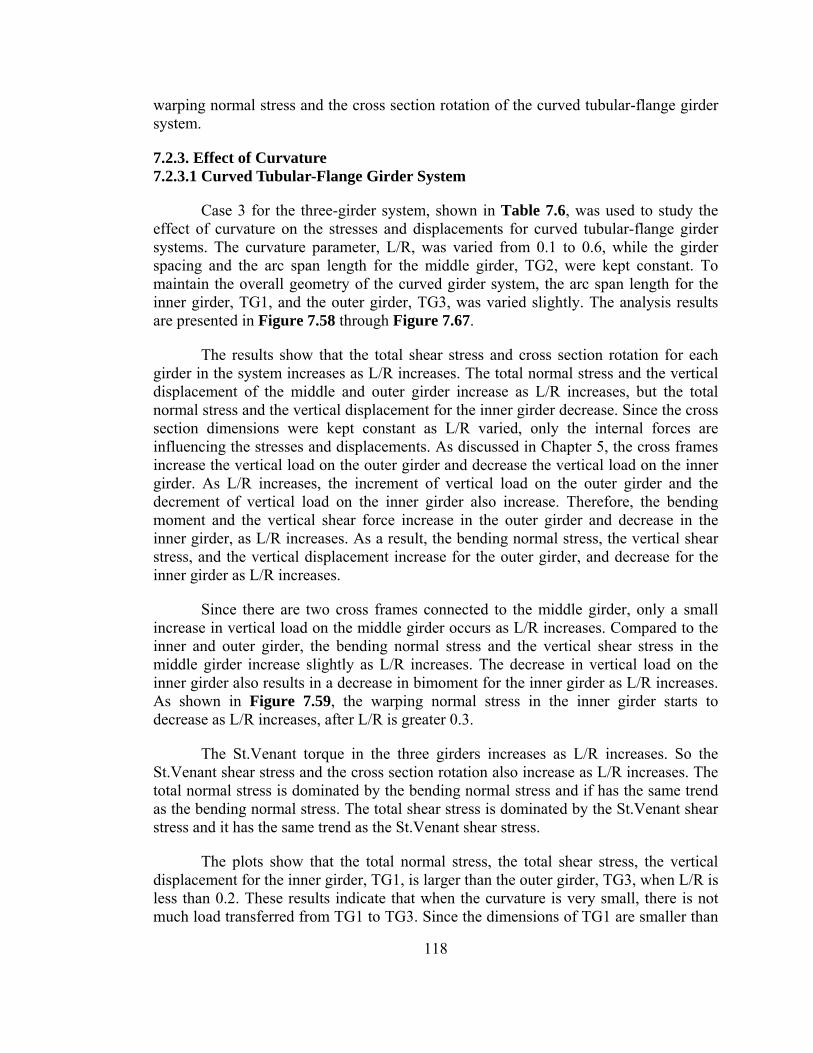
118
warping normal stress and the cross section rotation of the curved tubular-flange girder system.
7.2.3. Effect of Curvature 7.2.3.1 Curved Tubular-Flange Girder System
Case 3 for the three-girder system, shown in Table 7.6, was used to study the effect of curvature on the stresses and displacements for curved tubular-flange girder systems. The curvature parameter, L/R, was varied from 0.1 to 0.6, while the girder spacing and the arc span length for the middle girder, TG2, were kept constant. To maintain the overall geometry of the curved girder system, the arc span length for the inner girder, TG1, and the outer girder, TG3, was varied slightly. The analysis results are presented in Figure 7.58 through Figure 7.67.
The results show that the total shear stress and cross section rotation for each girder in the system increases as L/R increases. The total normal stress and the vertical displacement of the middle and outer girder increase as L/R increases, but the total normal stress and the vertical displacement for the inner girder decrease. Since the cross section dimensions were kept constant as L/R varied, only the internal forces are influencing the stresses and displacements. As discussed in Chapter 5, the cross frames increase the vertical load on the outer girder and decrease the vertical load on the inner girder. As L/R increases, the increment of vertical load on the outer girder and the decrement of vertical load on the inner girder also increase. Therefore, the bending moment and the vertical shear force increase in the outer girder and decrease in the inner girder, as L/R increases. As a result, the bending normal stress, the vertical shear stress, and the vertical displacement increase for the outer girder, and decrease for the inner girder as L/R increases.
Since there are two cross frames connected to the middle girder, only a small increase in vertical load on the middle girder occurs as L/R increases. Compared to the inner and outer girder, the bending normal stress and the vertical shear stress in the middle girder increase slightly as L/R increases. The decrease in vertical load on the inner girder also results in a decrease in bimoment for the inner girder as L/R increases. As shown in Figure 7.59, the warping normal stress in the inner girder starts to decrease as L/R increases, after L/R is greater 0.3.
The St.Venant torque in the three girders increases as L/R increases. So the St.Venant shear stress and the cross section rotation also increase as L/R increases. The total normal stress is dominated by the bending normal stress and if has the same trend as the bending normal stress. The total shear stress is dominated by the St.Venant shear stress and it has the same trend as the St.Venant shear stress.
The plots show that the total normal stress, the total shear stress, the vertical displacement for the inner girder, TG1, is larger than the outer girder, TG3, when L/R is less than 0.2. These results indicate that when the curvature is very small, there is not much load transferred from TG1 to TG3. Since the dimensions of TG1 are smaller than

119
the dimensions of TG3 and they carry similar load, TG1 develops larger stresses and displacements than TG3. Hence, when L/R is less than 0.2 for the studied tubular-flange girder system, the curvature has only a small effect on the tubular-flange girder system.
7.2.3.2 Comparison with Curved I-Girder System
The curved I-girder system, given in Table 5.2, was used for the comparative study. Figure 7.68 through Figure 7.77 present the analysis results of the curvature effect for the I-girder system. The plots show that the stresses and displacements for the three girders in the I-girder system have trends similar to those for the corresponding girder in the tubular-flange girder system as the curvature parameter, L/R, varies.
Figure 7.78 through Figure 7.87 present the results from both the tubular-flange girder and I-girder system for comparison. Since the I-girder is more efficient under bending and less efficient under torsion, the bending normal stress and the vertical displacement for each I-girder is smaller than that for the corresponding tubular-flange girder, but the warping normal stress for each I-girder is larger than that for the corresponding tubular-flange girder. As L/R increases, the rate of increase in the bending normal stress and the vertical displacement for each girder in both systems is similar, but the rate of increase in the warping normal stress for each I-girder is significantly greater than that for the corresponding tubular-flange girder. When L/R is larger than 0.35, the total normal stress for the inner I-girder, G1, is smaller than for the corresponding tubular-flange girder, TG1, but the total normal stress for the outer I-girder, G3, is larger than for the corresponding tubular-flange girder TG3, since the warping normal stress is large for the I-girder. The rate of increase in the total normal stress for each I-girder is faster than for the corresponding tubular-flange girder as L/R increases. For the total shear stress, the St.Venant shear stress and the vertical shear stress for each I-girder is smaller than for the corresponding tubular-flange girder, so the total shear stress for each girder in the I-girder system is smaller than for the corresponding tubular-flange girder, except for TG3, when L/R is less than 0.3. The rate of increase in the total shear stress for the I-girder system is slower than for the tubular-flange system as L/R increases. The cross section rotation for each I-girder is larger than for the corresponding tubular-flange girder, since the tubular-flange girder system has higher torsional stiffness. The Von-Mises stress has a trend similar to the trend in bending normal stress, since the bending normal stress is dominant in the Von-Mises stress.
Based on the above discussion, the following findings are obtained: (1) when L/R is greater than 0.3 (see Figure 7.85), the tubular-flange girder system has less Von-Mises stress than the I-girder system and the stress in the I-girder is more sensitive to the curvature increase; (2) for any curvature, the bending normal stress and the vertical displacement for the I-girder system is smaller than for the tubular-flange girder system, but the cross section rotation for the I-girder system is larger than for the tubular-flange girder system.

120
7.2.4 Effect of Number of Cross Frames
7.2.4.1 Curved Tubular-Flange Girder System
This section presents a study of the effect of the number of intermediate cross frames on the stresses and displacements in a tubular-flange girder system. As in the previous study, the three-girder system described in Table 7.6 was used for the study. The maximum stresses and displacements from the theoretical and finite element analyses are shown in Figure 7.88 through Figure 7.117. The theoretical results for a curved I-girder bridge system with the dimensions given in Table 5.2 are also presented in the plots for comparison. The number of cross frames given in the plots denotes only the intermediate cross frames and does not include the end cross frames at the bearings.
The results show that increasing the number of cross-frames has little effect on the bending normal stress for the inner girder, TG1, the middle girder, TG2, and the outer girder, TG3, but reduces the warping normal stress for the three girders, TG1, TG2, and TG3. The total normal stress for the inner girder, TG1, the middle girder, TG2, and the outer girder, TG3, gradually decreases with the increase in the number of cross frames. The further decrease in the total normal stress as cross frames are added is negligible after four intermediate cross-frames are used in the system. The St.Venant shear stress and the warping shear stress for the three girders decrease with the increase in the number of cross-frames, but the reduction in the warping shear stress is larger than the reduction in St.Venant shear stress. Similar to the bending normal stress, the number of cross frames has little influence on the vertical shear stress. The total shear stress gradually decreases with the increase in the number of cross-frames. The vertical displacement for TG1 becomes smaller when the number of the cross-frames increases. The further decrease in the vertical displacement as cross frames are added is negligible after three cross frames are used in the system. The vertical displacement of TG2 and TG3 has little change with the increase in the number of cross frames. After the system has three cross frames, increasing the number of cross frames has a small influence on the cross section rotation for the three girders. Since only the total normal stress contributes to the maximum Von-Mises stress, the trend of the Von-Mises stress is similar to that of the total normal stress.
Overall, an increase in the number of cross frames reduces the warping normal stress, warping shear stress, the St.Venant shear stress. Based on the above discussion, the following findings are obtained: (1) increasing the number of cross frames reduces the stresses and displacements for the curved tubular-flange girder system; (2) the number of cross frames has more influence on the warping normal stress, the warping shear stress, and the St.Venant shear stress for a curved tubular-flange girder system; (3) only three cross frames are needed, since more than three cross frames produces very limited reductions in stresses and displacements. Therefore, three cross-frames are recommended for the curved tubular-flange girder system that was studied.

121
7.2.4.2 Comparison with Curved I-Girder System
Theoretical analysis results for the curved I-girder system with multiple cross frames are also presented in Figure 7.88 through Figure 7.117. The results show that the increase in the number of cross frames has a negligible effect on the bending normal stress and the vertical shear stress for the I-girder system. This result is similar to the result for the tubular-flange girder system. The bending normal stress and the vertical shear stress in the I-girder system with any number of cross frames is smaller than in the corresponding tubular-flange girders, since the I-section is more efficient in bending and shear.
The warping normal stress and warping shear stress in the I-girder system are much larger than in the corresponding tubular-flange girder for any number of cross frames. The warping normal stress is especially large for the I-girder. The increase in the number of cross frames provides a more significant reduction in the warping normal and the warping shear stress for the I-girder system than for the tubular-flange girder system. The St.Venant shear stress in the I-girder system with one cross frame is much larger than that in the tubular-flange girder system. However, the St.Venant shear stress in the I-girder system is significantly reduced by using two or three cross frames. When three or more cross frames are used, the St.Venant shear stress in the I-girder system slightly decreases with the increase in the number of the cross frames, and becomes smaller than the St.Venant shear stress in the tubular-flange girder system.
The total normal stress for a girder in the I-girder system with one cross frame is significantly larger than for the corresponding girder in the tubular-flange girder system. With an increase in the number of cross frames, the total normal stress in the I-girder system decreases and becomes smaller than that of the corresponding girder in the tubular-flange girder system when enough cross frames are used. The results show that to make the total normal stress in the I-girder system less than that in the tubular-flange system, at least three cross frames are needed for the inner girder, four cross frames are needed for the middle girder and six cross frames are needed for the outer girder. Thus, when the recommended three cross frames are used for each system, the total normal stress in the middle and outer girder in the tubular-flange girder system is smaller than in the corresponding girder in the I-girder system.
The total shear stress in the I-girder system is less than in the tubular-flange girder, except for the case with one cross frame. The cross section rotation for the I-girder system is significantly larger than for the tubular-flange girder system for the cases with one or two cross frames. When three or more cross frames are used, the cross section rotations in the I-girder system are similar to or slightly larger than those in the tubular-flange girder system.
As discussed in Chapter 5, compared to the curved tubular-flange girder, the curved I-girder has a much smaller torsional stiffness, and significant stresses and displacements, especially the warping normal stress and the St.Venant shear stress, develop in a single curved I-girder. These stresses and displacements are large enough

122
so that the single curved I-girder can not carry its self-weight when supported at the ends. However, a curved tubular-flange girder has large torsional stiffness and develops much smaller stresses and displacements under self-weight when supported at the ends. A single curved tubular-flange girder carries its self-weight easily. For the three-girder system, the cross frames effectively restrain the torsion in each I-girder, and thus, significantly reduce the warping normal stress, St.Venant shear stress, and cross section rotation. Since the curved tubular-flange girder develops the much smaller warping normal stress, St.Venant shear stress, and cross section rotation, the cross frames have less effect on it. Only a few cross frames are needed for the tubular-flange girder to sufficiently reduce the stresses and displacements.
Based on the above discussion, the following findings are obtained: (1) increasing the number of cross frames has more influence on the curved I-girder system behavior than the curved tubular-flange girder system behavior; (2) only a few cross frames are needed in a tubular-flange girder system; (3) a curved tubular-flange system has smaller stresses and displacements than a curved I-girder system when three or less cross frames are used.
7.3. Comparison with Finite Element Results
Finite element analyses of the three-girder systems used to study the effect of tubular-flange width were conducted. Cases 3, 4 and 5, as given in Tables 7.6, 7.7, and 7.8, were analyzed. The purpose of these analyses was to verify the theoretical analysis results. As mentioned in Chapter 4, the cross frames are assumed to be rigid in the theoretical analysis model, which may not fully reflect the actual situation. The finite element model, M5, described in Chapter 6, was used to conduct the finite element analysis. Model M5 does not include the cross section distortion, but includes cross frame deflections.
7.3.1 Three Curved Girder System with Three Cross Frames
Only the total normal stress, the total shear stress, the vertical displacement and the cross section rotation from the finite element (FE) analysis are presented in Figures 7.40, 7.44, 7.46, and 7.47. The results show the differences between the finite element results and the theoretical results for stresses and displacements are largest for the inner girder and the outer girder, but the differences for the middle girder are small. The maximum difference is for the cross section rotation of the outer girder and this difference is about 35%. Since the cross frame deflections greatly influence the cross section rotation, as well as the vertical loads on the inner girder and the outer girder, these differences between the finite element results and the theoretical results are understandable.

123
7.3.2 Three Curved Girder System with Multiple Cross Frames
The results from the finite element analyses for the cases with multiple cross frames are presented together with the theoretical results. The finite element results are given for only the total normal stress, the total shear stress, the Von-Mises stress, the vertical displacement and the cross section rotation.
Similar to the case with three cross frames, the stresses and the displacements from the finite element analyses and theoretical analyses for the middle girder are relatives close to each other. The maximum difference occurs in the cross section rotation of the outer girder (Figure 7.117), which shows more than 30% difference between the finite element and theoretical analysis results. The results show that the differences between the finite element results and the theoretical results become slightly smaller with the increase in the number of cross frames. The total normal stress in the inner girder, TG1, the vertical displacement of the inner girder, TG1, the total shear stress in the outer girder, TG3, and the cross section rotation of the outer girder,TG3, have larger differences. When the number of cross frames increases from three to seven, the difference in the total normal stress and the vertical displacement of TG1 changes from 13% to 10%, and the difference in the total shear stress and the cross section rotation of TG3 changes from 21% to 17% and from 34% to 27% respectively. For the other stresses and displacements, most of the differences are less than 5%. Despite the differences between the theoretical results and the finite element results, the plots show that the stresses and displacements have the same trends as the theoretical results with an increasing number of cross frames.
Based on the above discussion, the following findings are obtained: (1) neglecting the cross frame deflections introduces errors in the theoretical analysis results, especially for the cross section rotation of the outer girder; (2) the errors for the three-girder system with different cross section dimensions do not influence findings of the parameter study, regarding the variations in stresses and displacements as parameters change, but the actual values of the stresses and displacements may not be accurate.

124
Table 7.1 Cross Section Dimensions for Study of Tubular Flange Width
Girders bf/h d (in) h (in) bf (in) df (in) df/bf tf (in) tw (in)
PG1 0.24 50.3863 49.8863 12 6 0.500 0.5 0.9496
PG2 0.30 50.3863 49.8863 16 6 0.375 0.5 0.7356
PG3 0.36 50.3863 49.8863 20 6 0.300 0.5 0.5216
Table 7.2 Cross Section Dimensions for Study of Cross Section Depth
Girders bf/h d (in) h (in) bf (in) df (in) df/bf tf (in) tw (in)
PG8 0.25 72.535 72 18 9 0.5 0.535 0.2565
PG9 0.30 60.535 60 18 9 0.5 0.535 0.3308
PG7 0.36 50.420 49.886 18 9 0.5 0.535 0.4375
PG10 0.40 45.535 45 18 9 0.5 0.535 0.5183
PG11 0.45 40.535 40 18 9 0.5 0.535 0.6390
Table 7.3 Cross Section Dimensions for Study of Tubular Flange Depth
Girders bf/h d (in) h (in) bf (in) df (in) df/bf tf (in) tw (in)
PG16 0.40 50.375 49.886 20 5 0.25 0.4887 0.5745
PG17 0.40 50.375 49.886 20 6 0.30 0.4887 0.5530
PG18 0.40 50.375 49.886 20 7 0.35 0.4887 0.5290
PG19 0.40 50.375 49.886 20 8 0.40 0.4887 0.5021
PG20 0.40 50.375 49.886 20 9 0.45 0.4887 0.4719
PG4 0.40 50.375 49.886 20 10 0.50 0.4887 0.4375
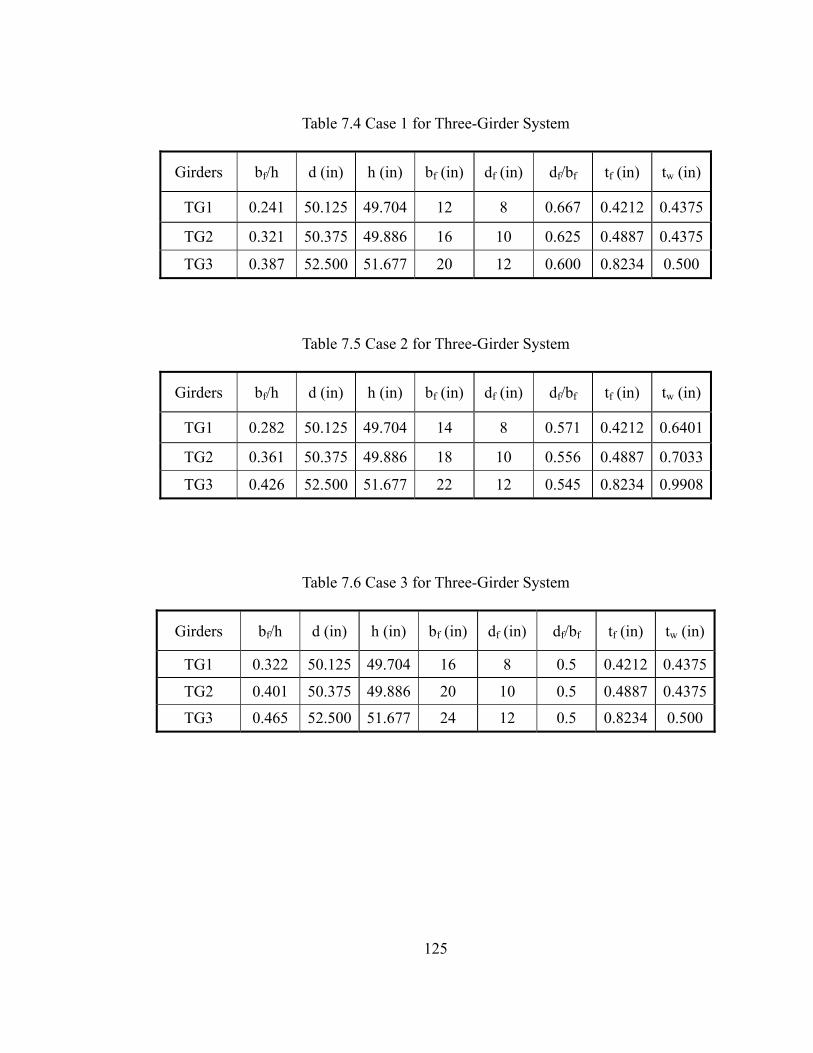
125
Table 7.4 Case 1 for Three-Girder System
Girders bf/h d (in) h (in) bf (in) df (in) df/bf tf (in) tw (in)
TG1 0.241 50.125 49.704 12 8 0.667 0.4212 0.4375
TG2 0.321 50.375 49.886 16 10 0.625 0.4887 0.4375
TG3 0.387 52.500 51.677 20 12 0.600 0.8234 0.500
Table 7.5 Case 2 for Three-Girder System
Girders bf/h d (in) h (in) bf (in) df (in) df/bf tf (in) tw (in)
TG1 0.282 50.125 49.704 14 8 0.571 0.4212 0.6401
TG2 0.361 50.375 49.886 18 10 0.556 0.4887 0.7033
TG3 0.426 52.500 51.677 22 12 0.545 0.8234 0.9908
Table 7.6 Case 3 for Three-Girder System
Girders bf/h d (in) h (in) bf (in) df (in) df/bf tf (in) tw (in)
TG1 0.322 50.125 49.704 16 8 0.5 0.4212 0.4375
TG2 0.401 50.375 49.886 20 10 0.5 0.4887 0.4375
TG3 0.465 52.500 51.677 24 12 0.5 0.8234 0.500

126
Table 7.7 Case 4 for Three-Girder System
Girders bf/h d (in) h (in) bf (in) df (in) df/bf tf (in) tw (in)
TG1 0.322 50.125 49.704 16 6.4 0.4 0.4212 0.4732
TG2 0.401 50.375 49.886 20 8 0.4 0.4887 0.502
TG3 0.464 52.500 51.677 24 9.6 0.4 0.8234 0.674
Table 7.8 Case 5 for Three-Girder System
Girders bf/h d (in) h (in) bf (in) df (in) df/bf tf (in) tw (in)
TG1 0.322 50.125 49.704 16 4.8 0.3 0.4212 0.5029
TG2 0.401 50.375 49.886 20 6 0.3 0.4887 0.5529
TG3 0.464 52.500 51.677 24 7.2 0.3 0.8234 0.8021

127
-20
-16
-12
-8
-4
0
12 14 16 18 20
Tubular Flange Width (in)
Stre
ss (k
si)
Figure 7.1 Maximum Bending Normal Stress vs. Tubular Flange Width
-4
-3
-2
-1
0
12 14 16 18 20
Tubular Flange Width (in)
Stre
ss (k
si)
Figure 7.2 Maximum Warping Normal Stress vs. Tubular Flange Width
-24
-20
-16
-12
-8
-4
0
12 14 16 18 20
Tubular Flange Width (in)
Stre
ss (k
si)
Figure 7.3 Maximum Total Normal Stress vs. Tubular Flange Width

128
-20
-16
-12
-8
-4
0
12 14 16 18 20
Tubular Flange Width (in)
Stre
ss (k
si)
Figure 7.4 Maximum St.Venant Shear Stress vs. Tubular Flange Width
-2
-1.5
-1
-0.5
0
12 14 16 18 20
Tubular Flange Width (in)
Stre
ss (k
si)
Figure 7.5 Maximum Vertical Shear Stress vs. Tubular Flange Width
-20
-16
-12
-8
-4
0
12 14 16 18 20
Tubular Flange Width (in)
Stre
ss (k
si)
Figure 7.6 Maximum Total Shear Stress vs. Tubular Flange Width

129
0
4
8
12
16
20
24
28
32
12 14 16 18 20
Tubular Flange Width (in)
Stre
ss (k
si)
Figure 7.7 Maximum Von-Mises Stress vs. Tubular Flange Width
-12
-8
-4
0
12 14 16 18 20
Tubular Flange Width (in)
Dis
plac
emen
t (in
)
Figure 7.8 Maximum Vertical Displacement vs. Tubular Flange Width
-16
-12
-8
-4
0
12 14 16 18 20
Tubular Flange Width (in)
Rot
atio
n (r
ad%
)
Figure 7.9 Maximum Cross Section Rotation vs. Tubular Flange Width

130
-25
-20
-15
-10
-5
0
40 45 50 55 60 65 70 75
Cross Section Depth (in)
Stre
ss (k
si)
Figure 7.10 Maximum Bending Normal Stress vs. Cross Section Depth
-5
-4
-3
-2
-1
0
40 45 50 55 60 65 70 75
Cross Section Depth (in)
Stre
ss (k
si)
Figure 7.11 Maximum Warping Normal Stress vs. Cross Section Depth
-25
-20
-15
-10
-5
0
40 45 50 55 60 65 70 75
Cross Section Depth (in)
Stre
ss (k
si)
Figure 7.12 Maximum Total Normal Stress vs. Cross Section Depth
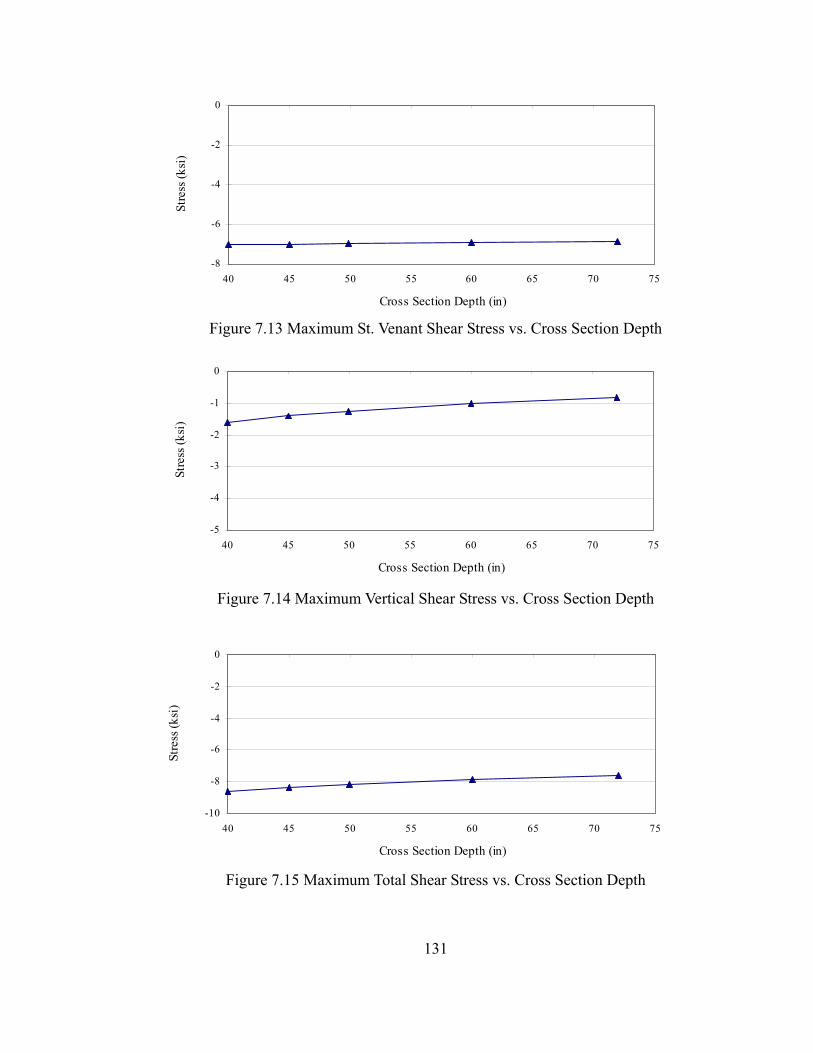
131
-8
-6
-4
-2
0
40 45 50 55 60 65 70 75
Cross Section Depth (in)
Stre
ss (k
si)
Figure 7.13 Maximum St. Venant Shear Stress vs. Cross Section Depth
-5
-4
-3
-2
-1
0
40 45 50 55 60 65 70 75
Cross Section Depth (in)
Stre
ss (k
si)
Figure 7.14 Maximum Vertical Shear Stress vs. Cross Section Depth
-10
-8
-6
-4
-2
0
40 45 50 55 60 65 70 75
Cross Section Depth (in)
Stre
ss (k
si)
Figure 7.15 Maximum Total Shear Stress vs. Cross Section Depth

132
0
8
16
24
32
40 45 50 55 60 65 70 75
Cross Section Depth (in)
Stre
ss (k
si)
Figure 7.16 Maximum Von-Mises Stress vs. Cross Section Depth
-12
-10
-8
-6
-4
-2
0
40 45 50 55 60 65 70 75
Cross Section Depth (in)
Dis
plac
emen
t (in
)
Figure 7.17 Maximum Vertical Displacement vs. Cross Section Depth
-4
-3
-2
-1
0
40 45 50 55 60 65 70 75
Cross Section Depth (in)
Rot
atio
n (ra
d %
)
Figure 7.18 Maximum Cross Section Rotation vs. Cross Section Depth

133
-20
-16
-12
-8
-4
0
5 6 7 8 9 10
Tubular Flange Depth (in)
Stre
ss (k
si)
Figure 7.19 Maximum Bending Normal Stress vs. Tubular Flange Depth
-5
-4
-3
-2
-1
0
5 6 7 8 9 10
Tubular Flange Depth (in)
Stre
ss (k
si)
Figure 7.20 Maximum Warping Normal Stress vs. Tubular Flange Depth
-25
-20
-15
-10
-5
0
5 6 7 8 9 10
Tubular Flange Depth (in)
Stre
ss (k
si)
Figure 7.21 Maximum Total Normal Stress vs. Tubular Flange Depth

134
-14
-12
-10
-8
-6
-4
-2
0
5 6 7 8 9 10
Tubular Flange Depth (in)
Stre
ss (k
si)
Figure 7.22 Maximum St. Venant Shear Stress vs. Tubular Flange Depth
-5
-4
-3
-2
-1
0
5 6 7 8 9 10
Tubular Flange Depth (in)
Stre
ss (k
si)
Figure 7.23 Maximum Vertical Shear Stress vs. Tubular Flange Depth
-14
-12
-10
-8
-6
-4
-2
0
5 6 7 8 9 10
Tubular Flange Depth (in)
Stre
ss (k
si)
Figure 7.24 Maximum Total Shear Stress vs. Tubular Flange Depth

135
0
5
10
15
20
25
5 6 7 8 9 10
Tubular Flange Depth (in)
Stre
ss (k
si)
Figure 7.25 Maximum Von-Mises Stress vs. Tubular Flange Depth
-8
-6
-4
-2
0
5 6 7 8 9 10
Tubular Flange Depth (in)
Dis
plac
emen
t (in
)
Figure 7.26 Maximum Vertical Displacement vs. Tubular Flange Depth
-10
-8
-6
-4
-2
0
5 6 7 8 9 10
Tubular Flange Depth (in)
Rot
atio
n (ra
d %
)
Figure 7.27 Maximum Cross Section Rotation vs. Tubular Flange Depth

136
-30
-25
-20
-15
-10
-5
0
0 0.1 0.2 0.3 0.4 0.5 0.6 0.7
L/R
Stre
ss (k
si) TG2
G2
Figure 7.28 Maximum Bending Normal Stress vs. Girder Curvature
-30
-25
-20
-15
-10
-5
0
0 0.1 0.2 0.3 0.4 0.5 0.6 0.7
L/R
Stre
ss (k
si)
TG2
G2
Figure 7.29 Maximum Warping Normal Stress vs. Girder Curvature
-30
-25
-20
-15
-10
-5
0
0 0.1 0.2 0.3 0.4 0.5 0.6 0.7
L/R
Stre
ss (k
si) TG2
G2
Figure 7.30 Maximum Total Normal Stress vs. Girder Curvature

137
-20
-16
-12
-8
-4
0
0 0.1 0.2 0.3 0.4 0.5 0.6 0.7
L/R
Stre
ss (k
si) TG2
G2
Figure 7.31 Maximum St.Venant Shear Stress vs. Girder Curvature
-0.4
-0.3
-0.2
-0.1
0
0.1
0 0.1 0.2 0.3 0.4 0.5 0.6 0.7
L/R
Stre
ss (k
si) TG2
G2
Figure 7.32 Maximum Warping Shear Stress vs. Girder Curvature
-0.3
-0.25
-0.2
-0.15
-0.1
-0.05
0
0 0.1 0.2 0.3 0.4 0.5 0.6 0.7
L/R
Stre
ss (k
si) TG2
G2
Figure 7.33 Maximum Vertical Shear Stress vs. Girder Curvature

138
-20
-16
-12
-8
-4
0
0 0.1 0.2 0.3 0.4 0.5 0.6 0.7
L/R
Stre
ss (k
si) TG2
G2
Figure 7.34 Maximum Total Shear Stress vs. Girder Curvature
0
5
10
15
20
25
30
0 0.1 0.2 0.3 0.4 0.5 0.6 0.7
L/R
Stre
ss (k
si)
TG2
G2
Figure 7.35 Maximum Von-Mises Stress vs. Girder Curvature
-30
-25
-20
-15
-10
-5
0
0 0.1 0.2 0.3 0.4 0.5 0.6 0.7
L/R
Dis
plac
emen
t (in
) TG2
G2
Figure 7.36 Maximum Vertical Displacement vs. Girder Curvature

139
-48
-40
-32
-24
-16
-8
0
0 0.1 0.2 0.3 0.4 0.5 0.6 0.7
L/R
Rot
atio
n (r
ad %
)
TG2
G2
Figure 7.37 Maximum Cross Section Rotaion vs. Girder Curvature
-20
-16
-12
-8
-4
0
12 14 16 18 20 22 24
Tubular Flange Width (in)
Stre
ss (k
si)
TG1
TG2
TG3
Figure 7.38 Maximum Bending Normal Stress vs. Tubular Flange Width
-3
-2
-1
0
12 14 16 18 20 22 24
Tubular Flange Width (in)
Stre
ss (k
si)
TG1
TG2
TG3
Figure 7.39 Maximum Warping Normal Stress vs. Tubular Flange Width

140
-24
-20
-16
-12
-8
-4
0
12 14 16 18 20 22 24
Tubular Flange Width (in)
Stre
ss (k
si)
TG1 TG2 TG3
TG1(FE) TG2(FE) TG3(FE)
Figure 7.40 Maximum Total Normal Stress vs. Tubular Flange Width
-2
-1.5
-1
-0.5
0
12 14 16 18 20 22 24
Tubular Flange Width (in)
Stre
ss (k
si)
TG1
TG2
TG3
Figure 7.41 Maximum St.Venant Shear Stress vs. Tubular Flange Width
-1.5
-1
-0.5
0
12 14 16 18 20 22 24
Tubular Flange Width (in)
Stre
ss (k
si)
TG1
TG2
TG3
Figure 7.42 Maximum Warping Shear Stress vs. Tubular Flange Width

141
-2
-1.5
-1
-0.5
0
12 14 16 18 20 22 24
Tubular Flange Width (in)
Stre
ss (k
si)
TG1
TG2
TG3
Figure 7.43 Maximum Vertical Shear Stress vs. Tubular Flange Width
-6
-4
-2
0
12 14 16 18 20 22 24
Tubular Flange Width (in)
Stre
ss (k
si)
TG1 TG2 TG3
TG1(FE) TG2(FE) TG3(FE)
Figure 7.44 Maximum Total Shear Stress vs. Tubular Flange Width
0
4
8
12
16
20
24
12 14 16 18 20 22 24
Tubular Flange Width (in)
Stre
ss (k
si)
TG1
TG2
TG3
Figure 7.45 Maximum Von Mises Stress vs. Tubular Flange Width
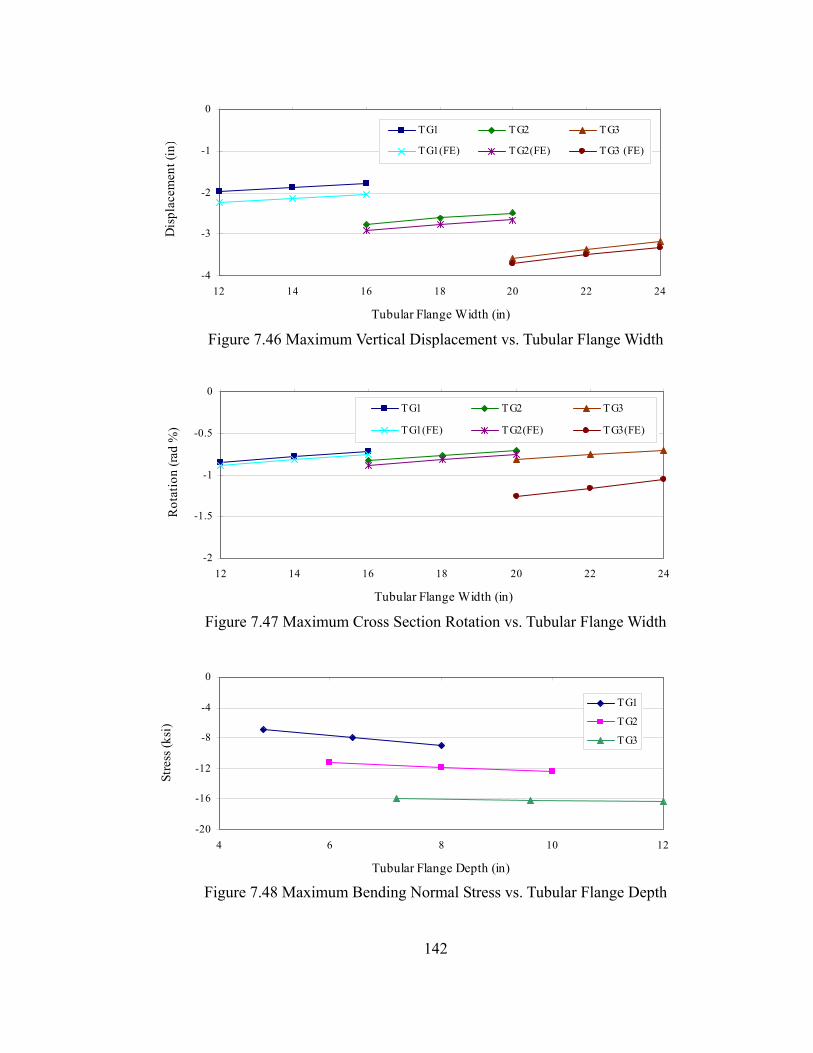
142
-4
-3
-2
-1
0
12 14 16 18 20 22 24
Tubular Flange Width (in)
Dis
plac
emen
t (in
)
TG1 TG2 TG3
TG1(FE) TG2(FE) TG3 (FE)
Figure 7.46 Maximum Vertical Displacement vs. Tubular Flange Width
-2
-1.5
-1
-0.5
0
12 14 16 18 20 22 24
Tubular Flange Width (in)
Rot
atio
n (ra
d %
)
TG1 TG2 TG3
TG1(FE) TG2(FE) TG3(FE)
Figure 7.47 Maximum Cross Section Rotation vs. Tubular Flange Width
-20
-16
-12
-8
-4
0
4 6 8 10 12
Tubular Flange Depth (in)
Stre
ss (k
si)
TG1
TG2
TG3
Figure 7.48 Maximum Bending Normal Stress vs. Tubular Flange Depth

143
-4
-3
-2
-1
0
4 6 8 10 12
Tubular Flange Depth (in)
Stre
ss (k
si)
TG1
TG2
TG3
Figure 7.49 Maximum Warping Normal Stress vs. Tubular Flange Depth
-20
-16
-12
-8
-4
0
4 6 8 10 12
Tubular Flange Depth (in)
Stre
ss (k
si) TG1
TG2
TG3
Figure 7.50 Maximum Total Normal Stress vs. Tubular Flange Depth
-4
-3
-2
-1
0
4 6 8 10 12
Tubular Flange Depth (in)
Stre
ss (k
si)
TG1
TG2
TG3
Figure 7.51 Maximum St.Venant Shear Stress vs. Tubular Flange Depth

144
-2
-1.5
-1
-0.5
0
4 6 8 10 12
Tubular Flange Depth (in)
Stre
ss (k
si)
TG1
TG2
TG3
Figure 7.52 Maximum Warping Shear Stress vs. Tubular Flange Depth
-2
-1.5
-1
-0.5
0
4 6 8 10 12
Tubular Flange Depth (in)
Stre
ss (k
si)
TG1
TG2
TG3
Figure 7.53 Maximum Vertical Shear Stress vs. Tubular Flange Depth
-4
-3
-2
-1
0
4 6 8 10 12
Tubular Flange Depth (in)
Stre
ss (k
si)
TG1
TG2
TG3
Figure 7.54 Maximum Total Shear Stress vs. Tubular Flange Depth

145
0
4
8
12
16
20
24
4 6 8 10 12
Tubular Flange Depth (in)
Stre
ss (k
si)
TG1
TG2
TG3
Figure 7.55 Maximum Von-Mises Stress vs. Tubular Flange Depth
-4
-3
-2
-1
0
4 6 8 10 12
Tubular Flange Depth (in)
Dis
plac
emen
t (in
)
TG1
TG2
TG3
Figure 7.56 Maximum Vertical Displacement vs. Tubular Flange Depth
-0.9
-0.6
-0.3
0
4 6 8 10 12
Tubular Flange Depth (in)
Rot
atio
n (ra
d %
)
TG1
TG2
TG3
Figure 7.57 Maximum Cross Section Rotation vs. Tubular Flange Depth

146
-20
-15
-10
-5
0
0 0.1 0.2 0.3 0.4 0.5 0.6 0.7
L/R
Stre
ss (k
si)
TG1TG2
TG3
Figure 7.58 Maximum Bending Normal Stress vs. Girder Curvature for TFG System
-5
-4
-3
-2
-1
0
0 0.1 0.2 0.3 0.4 0.5 0.6 0.7
L/R
Stre
ss (k
si)
TG1TG2
TG3
Figure 7.59 Maximum Warping Normal Stress vs. Girder Curvature for TFG System
-25
-20
-15
-10
-5
0
0 0.1 0.2 0.3 0.4 0.5 0.6 0.7
L/R
Stre
ss (k
si)
TG1TG2
TG3
Figure 7.60 Maximum Total Normal Stress vs. Girder Curvature for TFG System

147
-3
-2
-1
0
1
0 0.1 0.2 0.3 0.4 0.5 0.6 0.7
L/R
Stre
ss (k
si)
TG1TG2TG3
Figure 7.61 Maximum St. Venant Shear Stress vs. Girder Curvature for TFG System
-1.8-1.6-1.4-1.2
-1-0.8-0.6-0.4-0.2
0
0 0.1 0.2 0.3 0.4 0.5 0.6 0.7
L/R
Stre
ss (k
si)
TG1TG2TG3
Figure 7.62 Maximum Warping Shear Stress vs. Girder Curvature for TFG System
-2
-1.6
-1.2
-0.8
-0.4
0
0 0.1 0.2 0.3 0.4 0.5 0.6 0.7
L/R
Stre
ss (k
si)
TG1TG2TG3
Figure 7.63 Maximum Vertical Shear Stress vs. Girder Curvature for TFG System
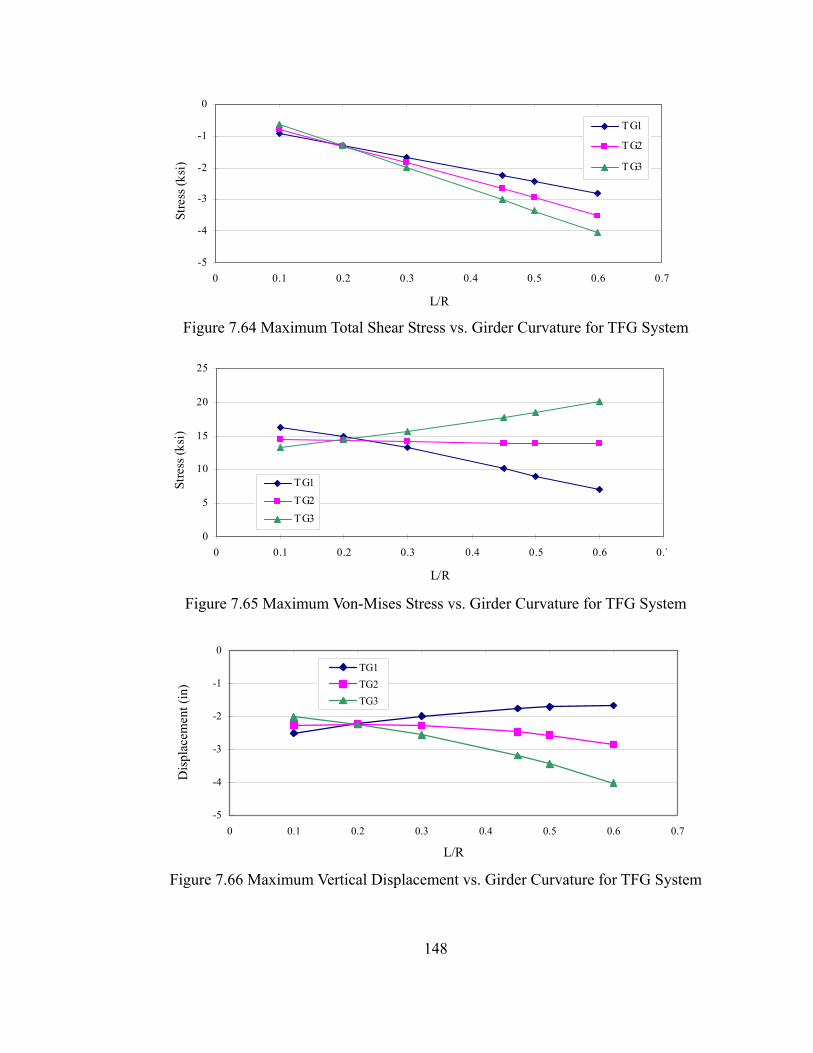
148
-5
-4
-3
-2
-1
0
0 0.1 0.2 0.3 0.4 0.5 0.6 0.7
L/R
Stre
ss (k
si)
TG1
TG2
TG3
Figure 7.64 Maximum Total Shear Stress vs. Girder Curvature for TFG System
0
5
10
15
20
25
0 0.1 0.2 0.3 0.4 0.5 0.6 0.7
L/R
Stre
ss (k
si)
TG1TG2TG3
Figure 7.65 Maximum Von-Mises Stress vs. Girder Curvature for TFG System
-5
-4
-3
-2
-1
0
0 0.1 0.2 0.3 0.4 0.5 0.6 0.7
L/R
Dis
plac
emen
t (in
)
TG1TG2TG3
Figure 7.66 Maximum Vertical Displacement vs. Girder Curvature for TFG System

149
-1.6
-1.2
-0.8
-0.4
0
0.4
0 0.1 0.2 0.3 0.4 0.5 0.6 0.7
L/R
Rot
atio
n (r
ad %
)
TG1TG2TG3
Figure 7.67 Maximum Cross Section Rotation vs. Girder Curvature for TFG System
-20
-15
-10
-5
0
0 0.1 0.2 0.3 0.4 0.5 0.6 0.7
L/R
Stre
ss (k
si)
G1
G2
G3
Figure 7.68 Maximum Bending Normal Stress vs. Girder Curvature for I-Girder System
-20
-16
-12
-8
-4
0
0 0.1 0.2 0.3 0.4 0.5 0.6 0.7
L/R
Stre
ss (k
si)
G1
G2
G3
Figure 7.69 Maximum Warping Normal Stress vs. Girder Curvature for I-Girder System

150
-30
-25
-20
-15
-10
-5
0
0 0.1 0.2 0.3 0.4 0.5 0.6 0.7
L/R
Stre
ss (k
si)
G1G2
G3
Figure 7.70 Maximum Total Normal Stress vs. Girder Curvature for I-Girder System
-3
-2
-1
0
1
0 0.1 0.2 0.3 0.4 0.5 0.6 0.7
L/R
Stre
ss (k
si)
G1G2G3
Figure 7.71 Maximum St.Venant Shear Stress vs. Girder Curvature for I-Girder System
-1.8-1.6-1.4-1.2
-1-0.8-0.6-0.4-0.2
0
0 0.1 0.2 0.3 0.4 0.5 0.6 0.7
L/R
Stre
ss (k
si)
G1G2G3
Figure 7.72 Maximum Warping Shear Stress vs. Girder Curvature for I-Girder System

151
-2
-1.6
-1.2
-0.8
-0.4
0
0 0.1 0.2 0.3 0.4 0.5 0.6 0.7
L/R
Stre
ss (k
si)
G1G2G3
Figure 7.73 Maximum Vertical Shear Stress vs. Girder Curvature for I-Girder System
-5
-4
-3
-2
-1
0
0 0.1 0.2 0.3 0.4 0.5 0.6 0.7
L/R
Stre
ss (k
si)
G1G2G3
Figure 7.74 Maximum Total Shear Stress vs. Girder Curvature for I-Girder System
0
5
10
15
20
25
30
0 0.1 0.2 0.3 0.4 0.5 0.6 0.7
L/R
Stre
ss (k
si)
G1G2G3
Figure 7.75 Maximum Von-Mises Stress vs. Girder Curvature for I-Girder System

152
-5
-4
-3
-2
-1
0
0 0.1 0.2 0.3 0.4 0.5 0.6 0.7
L/R
Dis
plac
emen
t (in
)
G1G2G3
Figure 7.76 Maximum Vertical Displacement vs. Girder Curvature for I-Girder System
-1.80
-1.50
-1.20
-0.90
-0.60
-0.30
0.00
0.30
0.60
0 0.1 0.2 0.3 0.4 0.5 0.6 0.7
L/R
Rot
atio
n (r
ad)
G1G2G3
Figure 7.77 Maximum Cross Section Rotation vs. Girder Curvature for I-Girder System
-1.80
-1.50
-1.20
-0.90
-0.60
-0.30
0.00
0.30
0.60
0 0.1 0.2 0.3 0.4 0.5 0.6 0.7
L/R
Rot
atio
n (r
ad)
G1G2G3
Figure 7.78 Maximum Bending Normal Stress vs. Girder Curvature

153
-16
-12
-8
-4
0
0 0.1 0.2 0.3 0.4 0.5 0.6 0.7
L/R
Stre
ss (k
si)
TG1 TG2 TG3
G1 G2 G3
Figure 7.79 Maximum Warping Normal Stress vs. Girder Curvature
-30
-25
-20
-15
-10
-5
0
0 0.1 0.2 0.3 0.4 0.5 0.6 0.7
L/R
Stre
ss (k
si)
TG1 TG2 TG3
G1 G2 G3
Figure 7.80 Maximum Total Normal Stress vs. Girder Curvature
-30
-25
-20
-15
-10
-5
0
0 0.1 0.2 0.3 0.4 0.5 0.6 0.7
L/R
Stre
ss (k
si)
TG1 TG2 TG3
G1 G2 G3
Figure 7.81 Maximum St.Venant Shear Stress vs. Girder Curvature

154
-1.8-1.6-1.4-1.2
-1-0.8-0.6-0.4-0.2
0
0 0.1 0.2 0.3 0.4 0.5 0.6 0.7
L/R
Stre
ss (k
si)
TG1 TG2 TG3
G1 G2 G3
Figure 7.82 Maximum Warping Shear Stress vs. Girder Curvature
-2
-1.6
-1.2
-0.8
-0.4
0
0 0.1 0.2 0.3 0.4 0.5 0.6 0.7
L/R
Stre
ss (k
si)
TG1 TG2 TG3
G1 G2 G3
Figure 7.83 Maximum Vertical Shear Stress vs. Girder Curvature
-5
-4
-3
-2
-1
0
0 0.1 0.2 0.3 0.4 0.5 0.6 0.7
L/R
Stre
ss (k
si)
TG1 TG2 TG3
G1 G2 G3
Figure 7.84 Maximum Total Shear Stress vs. Girder Curvature

155
0
5
10
15
20
25
30
0 0.1 0.2 0.3 0.4 0.5 0.6 0.7
L/R
Stre
ss (k
si)
TG1 TG2 TG3G1 G2 G3
Figure 7.85 Maximum Von-Mises Stress vs. Girder Curvature
-5
-4
-3
-2
-1
0
0 0.1 0.2 0.3 0.4 0.5 0.6 0.7
L/R
Dis
plac
emen
t (in
)
TG1 TG2 TG3
G1 G2 G3
Figure 7.86 Maximum Vertical Displacement vs. Girder Curvature
-1.8
-1.5
-1.2
-0.9
-0.6
-0.3
0
0.3
0.6
0 0.1 0.2 0.3 0.4 0.5 0.6 0.7
L/R
Rot
atio
n (r
ad %
)
TG1 TG2 TG3G1 G2 G3
Figure 7.87 Maximum Cross Section Rotation vs. Girder Curvature

156
-12
-10
-8
-6
-4
-2
0
0 1 2 3 4 5 6 7 8
Number of Cross Frames
Stre
ss (k
si)
TG1
G1
Figure 7.88 Maximum Bending Normal Stress of Inner Girder vs. Number of Cross
Frames
-30
-25
-20
-15
-10
-5
0
0 1 2 3 4 5 6 7 8
Number of Cross Frames
Stre
ss (k
si)
TG1
G1
Figure 7.89 Maximum Warping Normal Stress of Inner Girder vs. Number of Cross
Frames
-30
-25
-20
-15
-10
-5
0
0 1 2 3 4 5 6 7 8
Number of Cross Frames
Stre
ss (k
si)
TG1
G1
TG1(FE)
Figure 7.90 Maximum Total Normal Stress of Inner Girder vs. Number of Cross Frames

157
-4.5-4
-3.5-3
-2.5
-2-1.5
-1-0.5
0
0 1 2 3 4 5 6 7 8
Number of Cross Frames
Stre
ss (k
si)
TG1
G1
Figure 7.91 Maximum St.Venant Shear Stress of Inner Girder vs. Number of Cross
Frames
-1.4
-1.2
-1
-0.8
-0.6
-0.4
-0.2
0
0 1 2 3 4 5 6 7 8
Number of Cross Frames
Stre
ss (k
si)
TG1
G1
Figure 7.92 Maximum Warping Shear Stress of Inner Girder vs. Number of Cross
Frames
-1.2
-0.8
-0.4
0
0 1 2 3 4 5 6 7 8
Number of Cross Frames
Stre
ss (k
si) TG1
G1
Figure 7.93 Maximum Vertical Shear Stress of Inner Girder vs. Number of Cross
Frames

158
-5
-4
-3
-2
-1
0
0 1 2 3 4 5 6 7 8Number of Cross Frames
Stre
ss (k
si)
TG1
G1
TG1(FE)
Figure 7.94 Maximum Total Shear Stress of Inner Girder vs. Number of Cross Frames
0
5
10
15
20
25
30
0 1 2 3 4 5 6 7 8
Number of Cross Frames
Stre
ss (k
si)
TG1
G1
TG1(FE)
Figure 7.95 Maximum Von-Mises Stress of Inner Girder vs. Number of Cross Frames
-3
-2.5
-2
-1.5
-1
-0.5
0
0 1 2 3 4 5 6 7 8
Number of Cross Frames
Stre
ss (k
si)
TG1
G1
TG1(FE)
Figure 7.96 Maximum Vertical Displacement of Inner Girder vs. Number of Cross
Frames

159
-2
-1.5
-1
-0.5
0
0 1 2 3 4 5 6 7 8
Number of Cross Frames
Rot
atio
n (r
ad %
)TG1
G1
TG1(FE)
Figure 7.97 Maximum Cross Section Rotation of Inner Girder vs. Number of Cross
Frames
-14
-12
-10
-8
-6
-4
-2
0
0 1 2 3 4 5 6 7 8
Number of Cross Frames
Stre
ss (k
si) TG2
G2
Figure 7.98 Maximum Bending Normal Stress of Middle Girder vs. Number of Cross
Frames
-35
-30
-25
-20
-15
-10
-5
0
0 1 2 3 4 5 6 7 8
Number of Cross Frames
Stre
ss (k
si)
TG2
G2
Figure 7.99 Maximum Warping Normal Stress of Middle Girder vs. Number of Cross
Frames
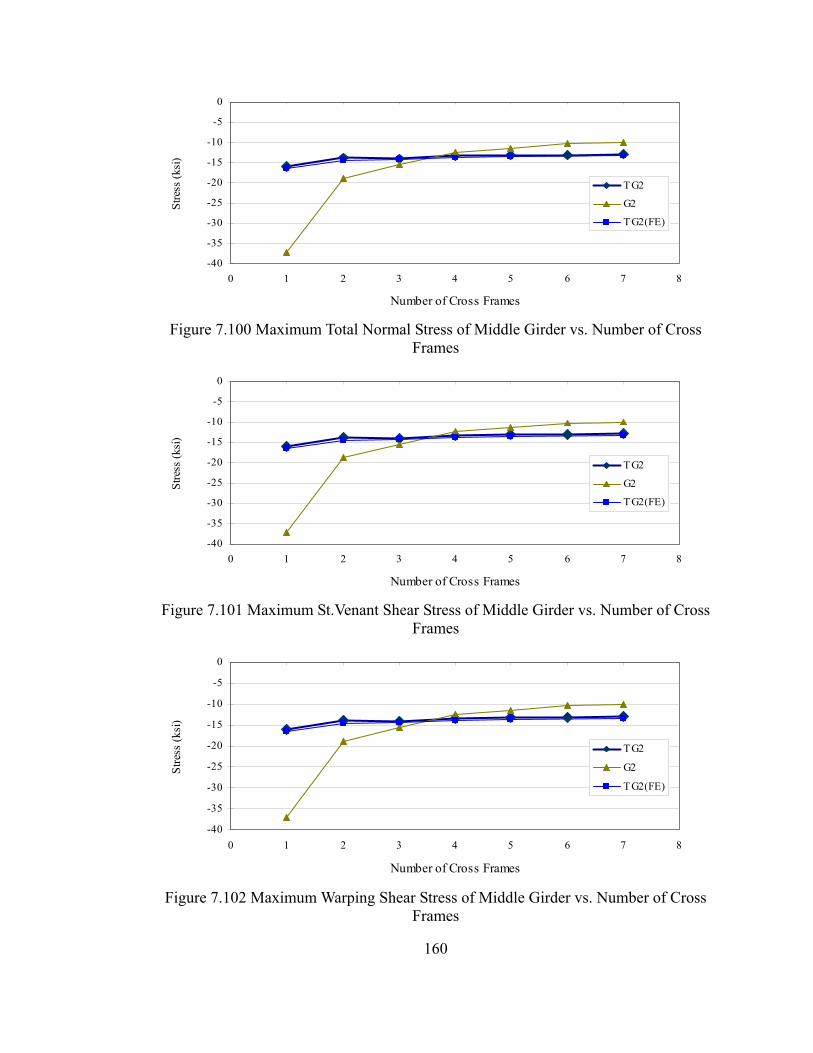
160
-40
-35
-30
-25
-20
-15
-10
-5
0
0 1 2 3 4 5 6 7 8
Number of Cross Frames
Stre
ss (k
si)
TG2
G2
TG2(FE)
Figure 7.100 Maximum Total Normal Stress of Middle Girder vs. Number of Cross
Frames
-40
-35
-30
-25
-20
-15
-10
-5
0
0 1 2 3 4 5 6 7 8
Number of Cross Frames
Stre
ss (k
si)
TG2
G2
TG2(FE)
Figure 7.101 Maximum St.Venant Shear Stress of Middle Girder vs. Number of Cross
Frames
-40
-35
-30
-25
-20
-15
-10
-5
0
0 1 2 3 4 5 6 7 8
Number of Cross Frames
Stre
ss (k
si)
TG2
G2
TG2(FE)
Figure 7.102 Maximum Warping Shear Stress of Middle Girder vs. Number of Cross
Frames

161
-1.6
-1.2
-0.8
-0.4
0
0 1 2 3 4 5 6 7 8
Number of Cross Frames
Stre
ss (k
si)
TG2
G2
Figure 7.103 Maximum Vertical Shear Stress of Middle Girder vs. Number of Cross
Frames
-1.6
-1.2
-0.8
-0.4
0
0 1 2 3 4 5 6 7 8
Number of Cross Frames
Stre
ss (k
si)
TG2
G2
Figure 7.104 Maximum Total Shear Stress of Middle Girder vs. Number of Cross
Frames
-1.6
-1.2
-0.8
-0.4
0
0 1 2 3 4 5 6 7 8
Number of Cross Frames
Stre
ss (k
si)
TG2
G2
Figure 7.105 Maximum Von-Mises Stress of Middle Girder vs. Number of Cross
Frames

162
-3.5
-3
-2.5
-2
-1.5
-1
-0.5
0
0 1 2 3 4 5 6 7 8
Number of Cross Frames
Stre
ss (k
si)
TG2
G2
TG2(FE)
Figure 7.106 Maximum Vertical Displacement of Middle Girder vs. Number of Cross
Frames
-3.5
-3
-2.5
-2
-1.5
-1
-0.5
0
0 1 2 3 4 5 6 7 8
Number of Cross Frames
Stre
ss (k
si)
TG2
G2
TG2(FE)
Figure 7.107 Maximum Cross Section Rotation of Middle Girder vs. Number of Cross
Frames
-3.5
-3
-2.5
-2
-1.5
-1
-0.5
0
0 1 2 3 4 5 6 7 8
Number of Cross Frames
Stre
ss (k
si)
TG2
G2
TG2(FE)
Figure 7.108 Maximum Bending Normal Stress of Outer Girder vs. Number of Cross
Frames

163
-35
-30
-25
-20
-15
-10
-5
0
0 1 2 3 4 5 6 7 8
Number of Cross Frames
Stre
ss (k
si)
TG3
G3
Figure 7.109 Maximum Warping Normal Stress of Outer Girder vs. Number of Cross
Frames
-45
-40-35
-30
-25-20
-15
-10-5
0
0 1 2 3 4 5 6 7 8
Number of Cross Frames
Stre
ss (k
si)
TG3
G3
TG3(FE)
Figure 7.110 Maximum Total Normal Stress of Outer Girder vs. Number of Cross
Frames
-7
-6
-5
-4
-3
-2
-1
0
0 1 2 3 4 5 6 7 8
Number of Cross Frames
Stre
ss (k
si)
TG3
G3
Figure 7.111 Maximum St.Venant Shear Stress of Outer Girder vs. Number of Cross
Frames

164
-2.5
-2
-1.5
-1
-0.5
0
0 1 2 3 4 5 6 7 8
Number of Cross Frames
Stre
ss (k
si)
TG3
G3
Figure 7.112 Maximum Warping Shear Stress of Outer Girder vs. Number of Cross
Frames
-1.6
-1.2
-0.8
-0.4
0
0 1 2 3 4 5 6 7 8
Number of Cross Frames
Stre
ss (k
si)
TG3
G3
Figure 7.113 Maximum Vertical Shear Stress of Outer Girder vs. Number of Cross
Frames
-8
-7
-6
-5
-4
-3
-2
-1
0
0 1 2 3 4 5 6 7 8Number of Cross Frames
Stre
ss (k
si)
TG3
G3
TG3(FE)
Figure 7.114 Maximum Total Shear Stress of Outer Girder vs. Number of Cross Frames

165
0
10
20
30
40
50
0 1 2 3 4 5 6 7 8
Number of Cross Frames
Stre
ss (k
si)
TG3
G3
TG3(FE)
Figure 7.115 Maximum Von-Mises Stress of Outer Girder vs. Number of Cross Frames
-4
-3.5
-3
-2.5
-2
-1.5
-1
-0.5
0
0 1 2 3 4 5 6 7 8
Number of Cross Frames
Stre
ss (k
si)
TG3
G3
TG3(FE)
Figure 7.116 Maximum Vertical Displacement of Outer Girder vs. Number of Cross
Frames
-2
-1.5
-1
-0.5
0
0 1 2 3 4 5 6 7 8
Number of Cross Frames
Rot
atio
n (r
ad %
)
TG3
G3
TG3(FE)
Figure 7.117 Maximum Cross Section Rotation of Outer Girder vs. Number of Cross
Frames

166
Chapter 8 Girder Systems with Deck and Live Load
The studies presented in the previous chapters focus on curved tubular-flange girder bridge systems under construction conditions before the deck is placed on the bridge. These previous studies focus on individual girders or systems of girders with cross frames under dead load. This chapter presents studies on the behavior of a curved tubular-flange girder bridge system after the concrete deck is composite with the girders. First, the effect of the concrete deck on curved tubular-flange girder bridge system behavior is investigated. Then, a study of a curved tubular-flange girder bridge with a composite concrete deck under live load is presented. The live load considered in this study consists of the design truck and design lane loads from the AASHTO LRFD bridge design specification (AASHTO 2004). Finite element models are utilized to analyze the curved tubular-flange girder bridge with a composite concrete deck.
8.1 Finite Element Model
ABAQUS v6.5 (2003) was used to model the curved tubular-flange girder bridge system with a composite concrete deck. The element type, mesh density, boundary and loading conditions for the girders and the cross frames are the same as those described in Chapter 6. An 8-in thick concrete slab was added to the finite element model for the curved tubular-flange girder system without a concrete deck, described in Chapter 6. The concrete was modeled as an elastic isotropic material with an elastic modulus of 3860 ksi and a Poisson’s ratio of 0.11. The concrete deck was modeled using shell element S4 in ABAQUS (2003). The mesh for the concrete deck has 200 elements along the span length and 94 elements across the deck width. Thus, a total of 18800 elements were used for the concrete deck model (see Figure 8.1). The nodes at the left corner, midpoint and right corner of the top surface of the top tubular-flange are connected to the concrete deck. The connection between the concrete deck and the top flange of the girders was modeled as a rigid beam (see Figure 8.1). When the top flange of the girder is composite with the concrete deck, the stresses in the top flange are very small. So the studies presented in this chapter focus on the stresses in the bottom flange.
8.2 Effect of Concrete Deck
To study the effect of the concrete deck, the finite element results for a curved tubular-flange girder with a composite concrete deck are compared to the results for a girder with non-composite concrete deck. The finite element models for a girder with non-composite concrete deck were described in Chapter 6. The non-composite deck is treated as dead load applied on the girders. The curved tubular-flange girder system with a composite concrete deck is studied under the same loading applied to the curved tubular-flange girder with a non-composite concrete deck, which is described in Chapter 5 and includes the dead load of the girders, cross frames, deck forms, concrete haunch,

167
and deck. The girders in both systems are given in Table 5.3. Two types of finite element models are considered to study the effect of the composite concrete deck. One model is the model M5, described in Chapter 6, which restrains cross section distortion, but allows cross frame deflection; the other model is the model M7, described in Chapter 6, which allows cross section distortion and cross frame deflection. In models M5 and M7, five lines of cross frames and five sets of transverse stiffeners per girder are included.
The analysis results from model M5 are presented in Figure 8.2 through Figure 8.16. The results show that the stresses and displacements in the system with a composite concrete deck (Composite TG1, TG2, TG3) are smaller than those in the system with a non-composite deck (non-composite TG1, TG2, TG3). For the composite case, the concrete deck is integrated with the curved tubular-flange girders and the structure stiffness is significantly increased. As a result, the stresses and displacements are reduced in the system with a composite concrete deck. In particular, the warping normal and shear stress in the cross section with cross frames is significantly reduced. For the system with the composite concrete deck, the total normal stress of each girder at P3 and P2 are close and the difference is less than 8%. That indicates that most of the normal stress in the girder is bending normal stress and the warping normal stress is negligible in the system with composite deck (and without distortion). Figures 8.4, 8.9 and 8.14 show that the total shear stress in the system with the composite concrete deck (and without distortion) has no jump in shear stress at the cross sections attached to the cross frames, which indicates that the warping shear stress is small. As discussed in Chapter 5, the cross frames induce the significant warping normal stress and warping shear stress near the cross sections attached to the cross frames. It appears that the concrete deck produces a continuous restraint against girder torsion (rather than the discrete restraint produced by cross frames), and, as a result, the warping normal stress and the warping shear stress are significantly reduced. Hence, it is concluded that the composite concrete deck effectively increases the system stiffness and reduces the stress and displacements, especially, the warping normal and shear stress.
The results from the model M7 are shown in Figure 8.17 through Figure 8.31. Comparing the results from M7 with the corresponding results from M5 indicates that considerable additional stress and displacement occur due to girder distortion in both the system with the composite concrete deck and the system with the non-composite deck. The results from M7 also show that the stresses and displacements in the system with the composite concrete deck are smaller than those in the system with the non-composite concrete deck. Comparing the results for TG1 with the results for TG2 and TG3, it shows that the composite concrete deck reduces the effect of cross section distortion on the girders and this influence is gradually increasing from TG1 to TG3. However, the distribution of stresses and displacements along the length of the girders are similar for the non-composite and composite cases. The results suggest that the composite concrete deck does not prevent the cross section distortion from developing in the girder system, but reduces the effect of cross section distortion on the stresses and displacements.

168
Based on the discussion given above, the following findings are summarized: (1) the composite concrete deck increases the structure system stiffness and reduces stresses and displacements, especially the warping normal stress; (2) the composite deck reduces the effect of the cross section distortion on the stresses and displacements, especially for the outer girder TG3; (3) for a curved tubular-flange girder system with a composite concrete deck and without cross section distortion, the primary bending normal stress is dominant in the total normal stress and the warping normal stress is very small and may be negligible.
8.3 Live Load Analysis
Live load analyses were conducted for both a curved tubular-flange girder system and a curved I-girder system, and the results were compared. Both systems had a composite concrete deck. The lane load and design truck load given in AASHTO (2004) are considered separately in the live load analysis for the curved girder bridge in this study. A new finite element model, denoted model M10, was built for the live load analyses. The model M10 allows cross section distortion and cross frame deflection, but nine equally spaced transverse stiffeners were added to reduce the cross section distortion. The live load distributions for the maximum load effect on each girder are shown in Figure 8.17 through Figure 8.19.
8.3.1 Design Lane and Design Loads
The design lane is the lane designation used by the bridge engineer for live-load placement. The width and location of the design lanes may or may not be the same as the traffic lanes. For the curved tubular-flange girder bridge considered in this report (see Figure 5.1), the total bridge deck width is 26.25 ft. The curb is assumed to be located 2.375 ft. inside the edge of the deck. Two design lanes were assumed, and labeled Design Lane I and Design Lane II, as shown in Figure 8.17 through Figure 8.19. The design lane width is 10.75 ft.
The design truck load and the design lane load are both used to model the live load. The AASHTO HS20 truck given in AASHTO (2004) is used as the design truck load and the design lane load is a uniform pressure of 0.64 kips/ft per design lane applied over a 10-ft width in each design lane (AASHTO 2004).
8.3.2 Live Load Distribution
Live load analyses should produce the maximum load effect on each girder. Hence, the design truck and the design load are placed in a position within the design lanes on the deck to produce the maximum flexural effect on each girder. The location of the design truck and the design lane load for each girder are described as follows.
To obtain the maximum flexural effect on girder TG3, two trucks are positioned side by side with the middle axles on the midspan of the bridge (see Figure 8.17). Both

169
axle spacings of the AASHTO HS20 truck are 14 ft. The wheel transverse spacing is 6 ft. The front and back outside wheel of the truck in Design Lane I (Truck I) are positioned on the top of TG3, which is 2 ft. radially inside the curb. The resulting position of the middle outside wheel of Truck I is 2.47 ft. radially inside the curb. The front and back outside wheel of the truck in Design Lane II (Truck II) are positioned 2 ft. radially inside the outside edge of the Design Lane II, which is centered on girder TG2. The resulting position of the middle outside wheel of Truck II is 2.50 ft. radially inside the edge of Design Lane II. The design lane loads (0.64 kips/ft) in each design lane are uniformly distributed over the 10-ft radial width from the outside edge of each design lane.
The live load distribution to maximize the flexural effect on girder TG2 (see Figure 8.18) is similar to that on girder TG3. However, for girder TG2, Design Truck I is moved 0.28 ft. towards the center line of the bridge and the design lane load in Design Lane I is moved 0.75 ft. towards the center line. The middle inside wheel of Design Truck I is then 2 ft. away from girder TG2, which is also the inside edge of the design lane. The design lane load starts from the inside edge of Design Lane I and is uniformly distributed over the 10-ft width.
For the inside girder TG1 (see Figure 8.19), one design truck is used and the middle inside wheel is positioned on top of the midspan of girder TG1, which is 2 ft. inside the curb. The design lane load is uniformly distributed from the inside edge of the design lane outward 10-ft radially.
8.3.3 Analysis Results
The live load analysis results for each tubular-flange girder and the corresponding I-girder are presented in Figure 8.20 through Figure 8.67.
The results from model M7 under the lane load, presented from Figure 8.20 through Figure 8.31, and under the truck load, presented in Figure 8.32 through Figure 8.43, show that the maximum total normal stress and the cross section rotation for the curved tubular-flange girder system with the composite deck are smaller than those for the corresponding curved I-girder system with the composite deck. However, the vertical displacement for the curved tubular-flange girder system with the composite deck is similar to or slightly larger than that for the curved I-girder system with the composite deck. The I-girder system has much larger variation in total normal stress along the span length than the tubular-flange girder system. This variation shows that significant warping normal stress is developed in the I-girder system.
The results from model M10 are shown in Figure 8.44 through Figure 8.55 for the lane load and Figure 8.56 through Figure 8.67 for the truck load. The results show that using more stiffeners significantly reduces effects of cross section distortion in the tubular-flange girder system under live load, especially for the middle girder TG2 and the outer girder TG3. The variation of the total normal stress along the span length for TG2 and TG3 are similar to that shown in the previous section for TG2 and TG3 (with a

170
composite deck) under uniform load when cross section distortion was restrained (model M5). That is, the sharp changes in normal stress due to distortion absence.
Hence, based on the above discussion, the following findings are obtained: (1) For a curved tubular-flange girder system with a composite concrete deck under the action of live load, using more stiffeners (greater than five) significantly reduces the cross section distortion, and as a result, the primary bending normal stress dominates the total normal stress and the warping normal stress is small; (2) compared to a curved tubular-flange girder system, a curved I-girder system with a composite deck under live load develops larger warping normal stress and cross section rotation.

171
a. Overview of Girder System with Composite Concrete Deck
Rigid beam
Concrete deck
Girder
Element nodes
(b) Mesh of Concrete Slab (Part of Span Length) (c) Connection of Concrete Slab to Girder
Figure 8.1 Finite Element Model for Girder System with Composite Concrete Deck

172
0
4
8
12
16
20
0.00 0.25 0.50 0.75 1.00
Normalized Length
Stre
ss (k
si)
Composite M5 TG1 Non-Composite M5 TG1Composite M7 TG1 Non-Composite M7 TG1
Figure 8.2 Total Normal Stress at P3 for TG1
0
4
8
12
16
20
0.00 0.25 0.50 0.75 1.00
Normalized Length
Stre
ss (k
si)
Composite M5 TG1 Non-Composite M5 TG1
Composite M7 TG1 Non-Composite M7 TG1
Figure 8.3 Total Normal Stress at P2 for TG1
-4
-2
0
2
4
0 0.25 0.5 0.75 1
Normalized Length
Stre
ss (k
si)
Composite M5 TG1 Non-Composite M5 TG1
Composite M7 TG1 Non-Composite M7 TG1
Figure 8.4 Total Shear Stress at P6r for TG1

173
-4
-3
-2
-1
0
0 0.25 0.5 0.75 1
Normalized Length
Dis
plac
emen
t (in
)
Composite M5 TG1 Non-Composite M5 TG1Composite M7 TG1 Non-Composite M7 TG1
Figure 8.5 Vertical Displacement for TG1
0
0.003
0.006
0.009
0.012
0.015
0.018
0 0.25 0.5 0.75 1
Normalized Length
Rot
atio
n (ra
d)
Composite M5 TG1 Non-Composite M5 TG1
Composite M7 TG1 Non-Composite M7 TG1
Figure 8.6 Cross Section Rotation for TG1
0
4
8
12
16
20
0.00 0.25 0.50 0.75 1.0
Normalized Length
Stre
ss (k
si)
Composite M5 TG2 Non-Composite M5 TG2Composite M7 TG2 Non-Composite M7 TG2
Figure 8.7 Total Normal Stress at P3 for TG2
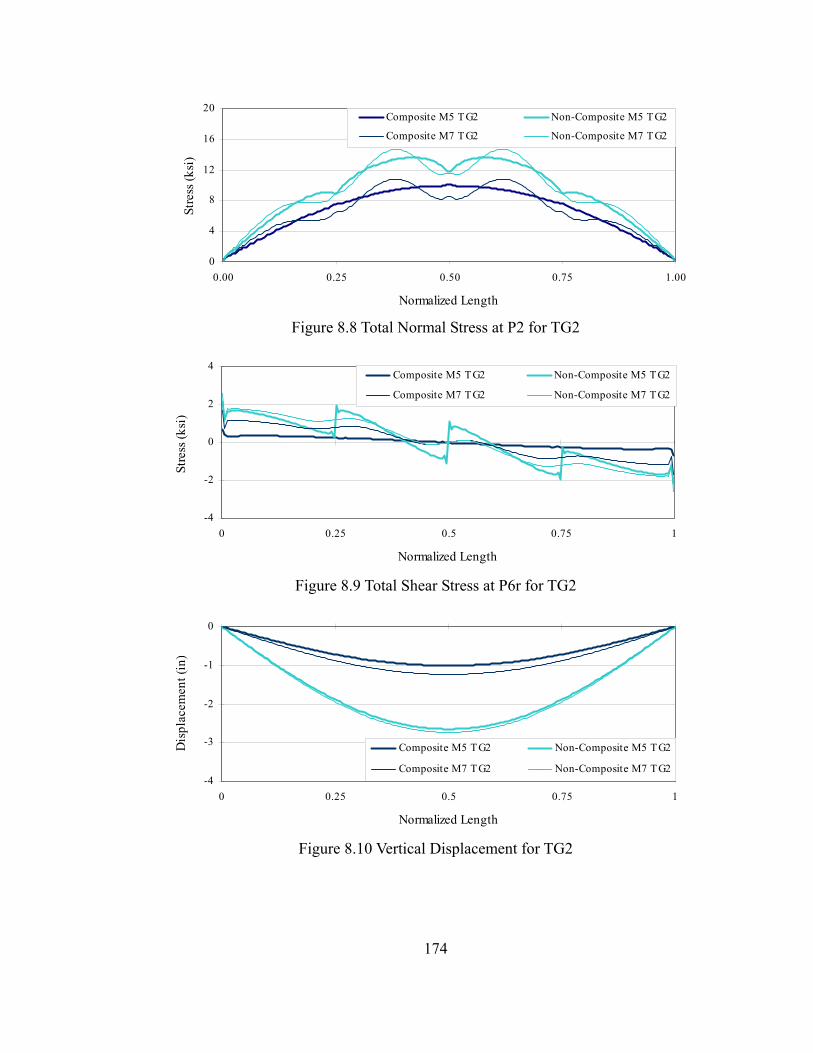
174
0
4
8
12
16
20
0.00 0.25 0.50 0.75 1.00
Normalized Length
Stre
ss (k
si)
Composite M5 TG2 Non-Composite M5 TG2
Composite M7 TG2 Non-Composite M7 TG2
Figure 8.8 Total Normal Stress at P2 for TG2
-4
-2
0
2
4
0 0.25 0.5 0.75 1
Normalized Length
Stre
ss (k
si)
Composite M5 TG2 Non-Composite M5 TG2
Composite M7 TG2 Non-Composite M7 TG2
Figure 8.9 Total Shear Stress at P6r for TG2
-4
-3
-2
-1
0
0 0.25 0.5 0.75 1
Normalized Length
Dis
plac
emen
t (in
)
Composite M5 TG2 Non-Composite M5 TG2
Composite M7 TG2 Non-Composite M7 TG2
Figure 8.10 Vertical Displacement for TG2

175
0
0.003
0.006
0.009
0.012
0.015
0.018
0 0.25 0.5 0.75 1
Normalized Length
Rot
atio
n (ra
d)
Composite M5 TG2 Non-Composite M5 TG2Composite M7 TG2 Non-Composite M7 TG2
Figure 8.11 Cross Section Rotation for TG2
0
4
8
12
16
20
0.00 0.25 0.50 0.75 1.00
Normalized Length
Stre
ss (k
si)
Composite M5 TG3 Non-Composite M5 TG3Composite M7 TG3 Non-Composite M7 TG3
Figure 8.12 Total Normal Stress at P3 for TG3
0
4
8
12
16
20
0.00 0.25 0.50 0.75 1.00
Normalized Length
Stre
ss (k
si)
Composite M5 TG3 Non-Composite M5 TG3Composite M7 TG3 Non-Composite M7 TG3
Figure 8.13 Total Normal Stress at P2 for TG3

176
-4
-2
0
2
4
0 0.25 0.5 0.75 1
Normalized Length
Stre
ss (k
si)
Composite M5 TG3 Non-Composite M5 TG3
Composite M7 TG3 Non-Composite M7 TG3
Figure 8.14 Total Shear Stress at P6r for TG3
-4
-3
-2
-1
0
0 0.25 0.5 0.75 1
Normalized Length
Dis
plac
emen
t (in
)
Composite M5 TG3 Non-Composite M5 TG3Composite M7 TG3 Non-Composite M7 TG3
Figure 8.15 Vertical Displacement for TG3
0
0.003
0.006
0.009
0.012
0.015
0.018
0 0.25 0.5 0.75 1
Normalized Length
Rot
atio
n (ra
d)
Composite M5 TG3 Non-Composite M5 TG3
Composite M7 TG3 Non-Composite M7 TG3
Figure 8.16 Cross Section Rotation for TG3

177
TG1
TG2
TG3
Des
ign
Lane
I
Des
ign
Lane
II
2’
2’
Truck I
Truck II
10’ l
ane
load
10’ L
ane
load
Curb
Curb
Figure 8.17 Live Load Distribution for Maximum Effect on TG3
TG1
TG2
TG3
Des
ign
Lane
I
Des
ign
Lane
II
2’
Truck I
Truck II
10’ l
ane
load
10’ L
ane
load
2’
Curb
Curb
Figure 8.18 Live Load Distribution for Maximum Effect on TG2
TG1
TG2
TG3
Des
ign
Lane
I
Des
ign
Lane
II
Truck
10’ L
ane
Load
2’
Curb
Curb
Figure 8.19 Live Load Distribution for Maximum Effect on TG1

178
0
1
2
3
4
5
0 0.2 0.4 0.6 0.8 1
Normalized Length
Stre
ss (k
si)
G1
TG1
Figure 8.20 Total Normal Stress at P3 for G1 and TG1 with 5 stiffeners (Lane Load)
-1
0
1
2
3
4
5
0 0.2 0.4 0.6 0.8 1
Normalized Length
Stre
ss (k
si)
G1
TG1
Figure 8.21 Total Normal Stress at P2 for G1 and TG1 with 5 stiffeners (Lane Load)
-0.5
-0.4
-0.3
-0.2
-0.1
0
0 0.2 0.4 0.6 0.8 1
Normalized Length
Dis
plac
emen
t (in
)
G1
TG1
Figure 8.22 Vertical Displacement for G1 and TG1 with 5 stiffeners (Lane Load)

179
-0.0005
0
0.0005
0.001
0.0015
0.002
0 0.1 0.2 0.3 0.4 0.5 0.6 0.7 0.8 0.9 1
Normalized Length
Rot
atio
n (ra
d)
G1
TG1
Figure 8.23 Cross Section Rotation for G1 and TG1 with 5 Stiffeners (Lane Load)
0
1
2
3
4
5
0 0.2 0.4 0.6 0.8 1
Normalized Length
Stre
ss (k
si)
G2
TG2
Figure 8.24 Total Normal Stress at P3 for G2 and TG2 with 5 Stiffeners (Lane Load)
0
1
2
3
4
5
0 0.2 0.4 0.6 0.8 1
Normalized Length
Stre
ss (k
si)
G2
TG2
Figure 8.25 Total Normal Stress at P2 for G2 and TG2 with 5 Stiffeners (Lane Load)

180
-0.5
-0.4
-0.3
-0.2
-0.1
0
0 0.2 0.4 0.6 0.8 1
Normalized Length
Dis
plac
emen
t (in
)G2
TG2
Figure 8.26 Vertical Displacement for G2 and TG2 with 5 Stiffeners (Lane Load)
0
0.0005
0.001
0.0015
0.002
0.0025
0 0.1 0.2 0.3 0.4 0.5 0.6 0.7 0.8 0.9 1
Normalized Length
Rot
atio
n (ra
d)
G2
TG2
Figure 8.27 Cross Section Rotation for G2 and TG2 with 5 Stiffeners (Lane Load)
0
1
2
3
4
5
0 0.2 0.4 0.6 0.8 1
Normalized Length
Stre
ss (k
si)
G3
TG3
Figure 8.28 Total Normal Stress at P3 for G3 and TG3 with 5 Stiffeners (Lane Load)

181
0
1
2
3
4
5
0 0.2 0.4 0.6 0.8 1
Normalized Length
Stre
ss (k
si)
G3
TG3
Figure 8.29 Total Normal Stress at P2 for G3 and TG3 with 5 Stiffeners (Lane Load)
-0.5
-0.4
-0.3
-0.2
-0.1
0
0 0.2 0.4 0.6 0.8 1
Normalized Length
Dis
plac
emen
t (in
)
G3
TG3
Figure 8.30 Vertical Displacement for G3 and TG3 with 5 Stiffeners (Lane Load)
0
0.0005
0.001
0.0015
0.002
0.0025
0 0.1 0.2 0.3 0.4 0.5 0.6 0.7 0.8 0.9 1
Normalized Length
Rot
atio
n (ra
d)
G3
TG3
Figure 8.31 Cross Section Rotation for G3 and TG3 with 5 Stiffeners (Lane Load)

182
0
4
8
12
16
20
24
28
0.00 0.25 0.50 0.75 1.00
Normalized Length
Stre
ss (k
si)
G1TG1
Figure 8.32 Total Normal Stress at P3 for G1 and TG1 with 5 Stiffeners (Truck Load)
-4
0
4
8
12
16
20
24
28
0 0.25 0.5 0.75 1
Normalized Length
Stre
ss (k
si)
G1TG1
Figure 8.33 Total Normal Stress at P2 for G1 and TG1 with 5 Stiffeners (Truck Load)
-3
-2.5
-2
-1.5
-1
-0.5
0
0 0.25 0.5 0.75 1
Normalized Length
Dis
plac
emen
t (in
)
G1TG1
Figure 8.34 Vertical Displacement for G1 and TG1 with 5 Stiffeners (Truck Load)
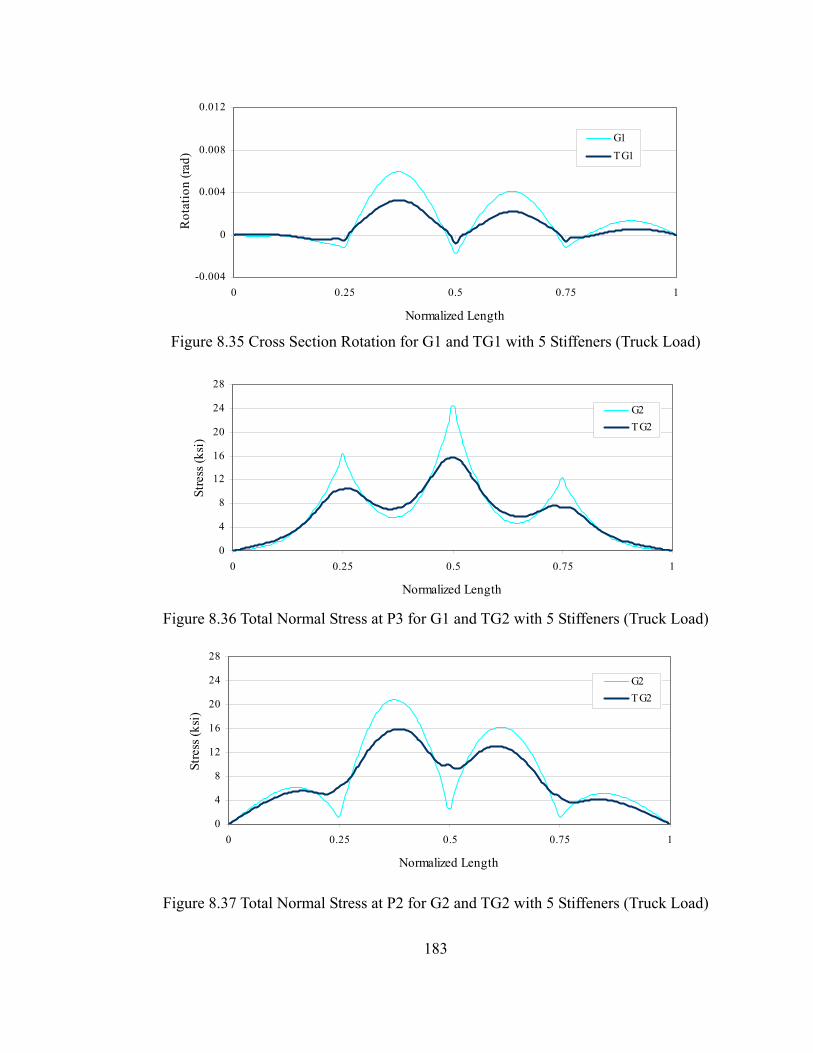
183
-0.004
0
0.004
0.008
0.012
0 0.25 0.5 0.75 1
Normalized Length
Rot
atio
n (ra
d)
G1TG1
Figure 8.35 Cross Section Rotation for G1 and TG1 with 5 Stiffeners (Truck Load)
0
4
8
12
16
20
24
28
0 0.25 0.5 0.75 1
Normalized Length
Stre
ss (k
si)
G2TG2
Figure 8.36 Total Normal Stress at P3 for G1 and TG2 with 5 Stiffeners (Truck Load)
0
4
8
12
16
20
24
28
0 0.25 0.5 0.75 1
Normalized Length
Stre
ss (k
si)
G2TG2
Figure 8.37 Total Normal Stress at P2 for G2 and TG2 with 5 Stiffeners (Truck Load)

184
-3
-2.5
-2
-1.5
-1
-0.5
0
0 0.25 0.5 0.75 1
Normalized Length
Dis
plac
emen
t (in
)
G2TG2
Figure 8.38 Vertical Displacement for G2 and TG2 with 5 Stiffeners (Truck Load)
0
0.002
0.004
0.006
0.008
0.01
0.012
0 0.25 0.5 0.75 1
Normalized Length
Rot
atio
n (ra
d)
G2TG2
Figure 8.39 Cross Section Rotation for G2 and TG2 with 5 Stiffeners (Truck Load)
0
4
8
12
16
20
24
28
0 0.25 0.5 0.75 1
Normalized Length
Stre
ss (k
si) G3
TG3
Figure 8.40 Total Normal Stress at P3 for G3 and TG3 with 5 Stiffeners (Truck Load)

185
0
4
8
12
16
20
24
0.00 0.25 0.50 0.75 1.00
Normalized Length
Stre
ss (k
si)
G3TG3
Figure 8.41 Total Normal Stress at P2 for G3 and TG3 with 5 Stiffeners (Truck Load)
-3
-2.5
-2
-1.5
-1
-0.5
0
0 0.25 0.5 0.75 1
Normalized Length
Dis
plac
emen
t (in
)
G3TG3
Figure 8.42 Vertical Displacement for G3 and TG3 with 5 Stiffeners (Truck Load)
0
0.002
0.004
0.006
0.008
0.01
0.012
0 0.25 0.5 0.75 1
Normalized Length
Rot
atio
n (ra
d)
G3TG3
Figure 8.43 Cross Section Rotation for G3 and TG3 with 5 Stiffeners (Truck Load)

186
0
1
2
3
4
0.00 0.25 0.50 0.75 1.00
Normalized Length
Stre
ss (k
si)
G1TG1
Figure 8.44 Total Normal Stress at P3 for G1 and TG1 with 9 Stiffeners (Lane Load)
0
1
2
3
4
0 0.25 0.5 0.75 1
Normalized Length
Stre
ss (k
si)
G1
TG1
Figure 8.45 Total Normal Stress at P2 for G1 and TG1 with 9 Stiffeners (Lane Load)
-0.5
-0.4
-0.3
-0.2
-0.1
0
0.00 0.25 0.50 0.75 1.00
Normalized Length
Dis
plac
emen
t (in
)
G1
TG1
Figure 8.46 Vertical Displacement for G1 and TG1 with 9 Stiffeners (Lane Load)

187
-0.002
-0.0012
-0.0004
0.0004
0.0012
0.002
0 0.25 0.5 0.75 1
Normalized Length
Rot
atio
n (ra
d)
G1TG1
Figure 8.47 Cross Section Rotation for G1 and TG1 with 9 Stiffeners (Lane Load)
0
1
2
3
4
0.00 0.25 0.50 0.75 1.00
Normalized Length
Stre
ss (k
si)
G2TG2
Figure 8.48 Total Normal Stress at P3 for G2 and TG2 with 9 Stiffeners (Lane Load)
0.0
1.0
2.0
3.0
4.0
0 0.25 0.5 0.75 1
Normalized Length
Stre
ss (k
si)
G2
TG2
Figure 8.49 Total Normal Stress at P2 for G2 and TG2 with 9 Stiffeners (Lane Load)
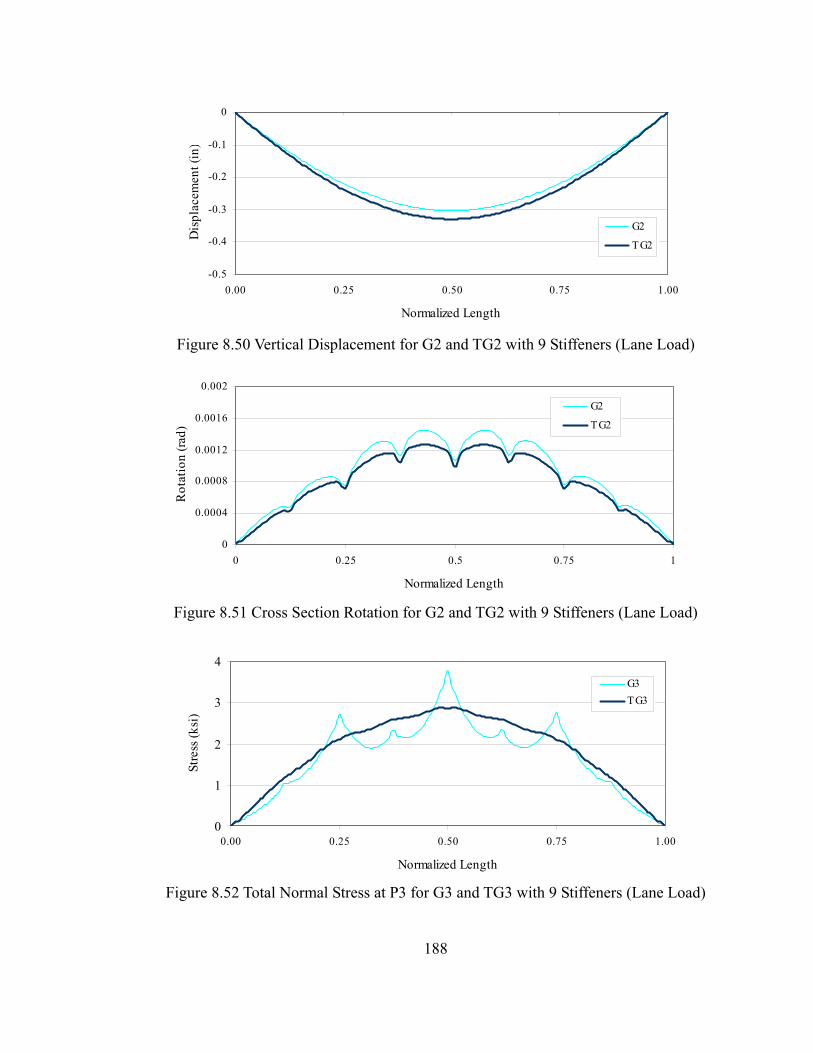
188
-0.5
-0.4
-0.3
-0.2
-0.1
0
0.00 0.25 0.50 0.75 1.00
Normalized Length
Dis
plac
emen
t (in
)
G2
TG2
Figure 8.50 Vertical Displacement for G2 and TG2 with 9 Stiffeners (Lane Load)
0
0.0004
0.0008
0.0012
0.0016
0.002
0 0.25 0.5 0.75 1
Normalized Length
Rot
atio
n (ra
d)
G2
TG2
Figure 8.51 Cross Section Rotation for G2 and TG2 with 9 Stiffeners (Lane Load)
0
1
2
3
4
0.00 0.25 0.50 0.75 1.00
Normalized Length
Stre
ss (k
si)
G3TG3
Figure 8.52 Total Normal Stress at P3 for G3 and TG3 with 9 Stiffeners (Lane Load)

189
0.0
1.0
2.0
3.0
4.0
0 0.25 0.5 0.75 1
Normalized Length
Stre
ss (k
si)
G3TG3
Figure 8.53 Total Normal Stress at P2 for G3 and TG3 with 9 Stiffeners (Lane Load)
-0.5
-0.4
-0.3
-0.2
-0.1
0
0.00 0.25 0.50 0.75 1.00
Normalized Length
Dis
plac
emen
t (in
)
G3
TG3
Figure 8.54 Vertical Displacement for G3 and TG3 with 9 Stiffeners (Lane Load)
0
0.0004
0.0008
0.0012
0.0016
0.002
0 0.25 0.5 0.75 1
Normalized Length
Rot
atio
n (ra
d)
G3TG3
Figure 8.55 Cross Section Rotation for G3 and TG3 with 9 Stiffeners (Lane Load)

190
0
4
8
12
16
20
0 0.25 0.5 0.75 1
Normalized Length
Stre
ss (k
si)
G1TG1
Figure 8.56 Total Normal Stress at P3 for TG1 with 9 Stiffeners (Truck Load)
0
4
8
12
16
20
0 0.25 0.5 0.75 1
Normalized Length
Stre
ss (k
si)
G1TG1
Figure 8.57 Total Normal Stress at P2 for TG1 with 9 Stiffeners (Truck Load)
-3
-2.5
-2
-1.5
-1
-0.5
0
0.00 0.25 0.50 0.75 1.00
Normalized Length
Dis
plac
emen
t (in
)
G1TG1
Figure 8.58 Vertical Displacement for TG1 with 9 Stiffeners (Truck Load)

191
-0.002
0
0.002
0.004
0.006
0.008
0 0.25 0.5 0.75 1
Normalized Length
Rot
atio
n (ra
d)
G1TG1
Figure 8.59 Cross Section Rotation for TG1 with 9 Stiffeners (Truck Load)
0
4
8
12
16
20
0 0.25 0.5 0.75 1
Normalized Length
Stre
ss (k
si)
G2TG2
Figure 8.60 Total Normal Stress at P3 for TG2 with 9 Stiffeners (Truck Load)
0
4
8
12
16
20
0 0.25 0.5 0.75 1
Normalized Length
Stre
ss (k
si)
G2TG2
Figure 8.61 Total Normal Stress at P2 for TG2 with 9 Stiffeners (Truck Load)

192
-3
-2.5
-2
-1.5
-1
-0.5
0
0 0.25 0.5 0.75 1
Normalized Length
Dis
plac
emen
t (in
)
G2
TG2
Figure 8.62 Vertical Displacement for TG2 with 9 Stiffeners (Truck Load)
0
0.002
0.004
0.006
0.008
0 0.25 0.5 0.75 1
Normalized Length
Rot
atio
n (ra
d)
G2TG2
Figure 8.63 Cross Section Rotation for TG2 with 9 Stiffeners (Truck Load)
0
4
8
12
16
20
0 0.25 0.5 0.75 1
Normalized Length
Stre
ss (k
si)
G3TG3
Figure 8.64 Total Normal Stress at P3 for TG3 with 9 Stiffeners (Truck Load)
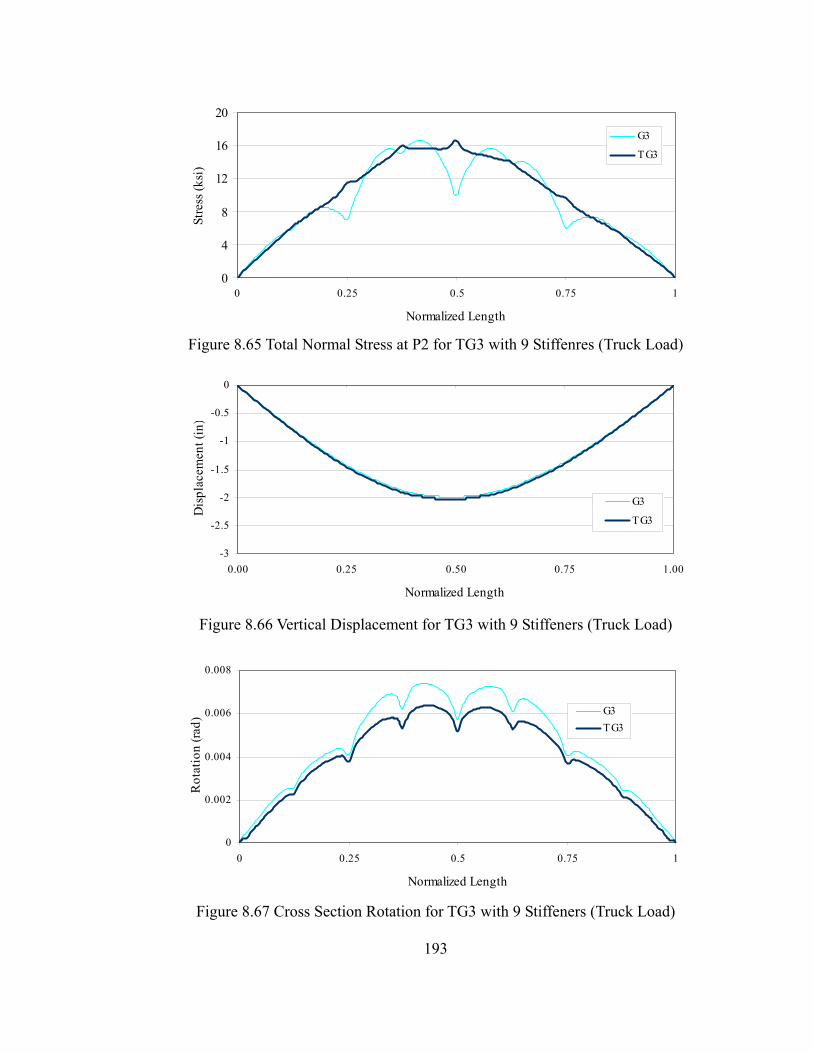
193
0
4
8
12
16
20
0 0.25 0.5 0.75 1
Normalized Length
Stre
ss (k
si)
G3
TG3
Figure 8.65 Total Normal Stress at P2 for TG3 with 9 Stiffenres (Truck Load)
-3
-2.5
-2
-1.5
-1
-0.5
0
0.00 0.25 0.50 0.75 1.00
Normalized Length
Dis
plac
emen
t (in
)
G3
TG3
Figure 8.66 Vertical Displacement for TG3 with 9 Stiffeners (Truck Load)
0
0.002
0.004
0.006
0.008
0 0.25 0.5 0.75 1
Normalized Length
Rot
atio
n (ra
d)
G3TG3
Figure 8.67 Cross Section Rotation for TG3 with 9 Stiffeners (Truck Load)

194
Chapter 9 Summary and Conclusions
9.1 Summary
A new type of curved girder, called a curved tubular-flange girder, is studied in this report. For the curved tubular-flange girder system that was studied, rectangular tubes are used as top and bottom girder flanges instead of the traditional plate flanges. Tubular-flange girders have much larger torsional stiffness than I-girders and less potential for cross section distortion than box-girders. Therefore, curved tubular-flange girders have potential advantages compared to curved I-girders and box-girders. Hence, theoretical and finite element analyses were carried out to investigate the behavior of curved tubular-flange girder systems.
A theoretical method was presented to study the behavior of simply supported curved tubular-flange girder bridge systems. In this theoretical method, the cross frames between the girders are assumed to be rigid. A cross section stress analysis method for tubular-flange girders was presented. A parametric study was performed using the theoretical analysis method for single curved tubular-flange girders and three-girder systems to investigate the effect of geometric parameters on the behavior of curved tubular-flange girder systems. The studied parameters include the tubular-flange width, tubular-flange depth, cross section depth, girder curvature, and the number of cross frames. The theoretical analysis results from selected cases were also compared with the results from finite element analyses to verify the parametric study results.
Finite element simulations for curved tubular-flange girder systems were performed to verify the theoretical analysis method and study the behavior of curved tubular-flange girder systems with and without a composite concrete deck. The effect of cross section distortion and the influence of the composite concrete deck were investigated. A live load analysis was carried out for both a curved tubular-flange girder system with a composite deck and a curved I-girder system with a composite deck. The finite element results for the curved tubular-flange girder system were compared with those of the corresponding curved I-girder system.
9.2 Findings
The following findings are obtained from the theoretical analyses: • The warping of curved tubular-flange girders can be considered to consist of two
parts, namely, lateral bending of each tubular-flange about the y-axis and warping of each rectangular tube about its own shear center.

195
• From the cross section stress analysis of tubular-flange girders, it was found that for a doubly-symmetric tubular-flange cross section, the warping moment of inertia can be simply expressed as:
4
hII
20yf
w
⋅= (4.15)
• A curved tubular-flange girder is effective at resisting torsion, owing to its large
torsional stiffness, and it develops relatively small warping normal stress and cross section rotation compared to a corresponding I-girder, while the corresponding curved I-girder is better at resisting bending, but develops relatively large warping normal stress and cross section rotation.
• For simply-supported single curved tubular-flange girders and multiple curved
tubular-flange girder systems braced by cross frames, the following observations were made regarding stresses: the bending normal stress makes the dominant contribution to the total normal stress, relative to the warping normal stress; the St.Venant shear stress makes the dominant contribution to the total shear stress, relative to the warping shear stress and the vertical shear stress. For a single curved tubular-flange girder, the warping shear stress over the entire span is negligible. For two-girder and three-girder systems, the warping shear stress at the cross section with the maximum total shear stress is negligible, but is not negligible at other cross sections.
• A simply-supported single curved tubular-flange girder develops much smaller
stresses and displacements than the corresponding single curved I-girder. The practical impact of this result is that a single curved tubular-flange girder would be easier to transport and erect than a single I-girder.
• The cross frame forces in a curved tubular-flange girder system are smaller than
in the corresponding curved I-girder system. Therefore, smaller cross frame members can be used in a curved tubular-flange girder system.
The following findings are obtained from the parametric study:
• A curved tubular-flange girder with a wider and/or thicker tube results in reduced stresses and displacements. The bending and warping normal stresses are especially reduced.
• An increase in the cross section depth effectively reduces the bending normal stress, the vertical shear stress, and the vertical displacement, but the increase in the cross section depth has little effect on the St.Venant shear stress and the cross section rotation.
• An increase in the tubular-flange depth reduces the warping normal stress, the St.Venant shear stress, and the displacement.
196
• A single curved tubular-flange girder develops much smaller stresses and displacements than a corresponding single curved I-girder for the same bridge girder curvature.
• An increase in the curvature of bridge girders has much more influence on stresses and displacements for a single curved I-girder than for a single curved tubular-flange girder. As the girder curvature increases, the rate of increase in the stresses and displacements for a single curved I-girder is much greater than for a single curved tubular-flange girder.
• Fewer cross frames are needed for a curved tubular-flange girder system to have levels of stress that are similar to those of the corresponding curved I-girder system.
The following findings are obtained from finite element analyses:
• Cross section distortion was observed for curved tubular-flange girders under loading. The cross section distortion comes from web distortion and the distortion of the tubular flanges. The cross section distortion results in increased stresses and displacements.
• For a single curved tubular-flange girder, web distortion is the main source of cross section distortion and using transverse web stiffeners effectively reduces the effect of cross section distortion on the stresses and displacements.
• For a multiple curved tubular-flange girder system, the cross section distortion mainly results from concentrated forces and torques acting on the girders at the cross frames locations. Tubular flange distortion is the major source of cross section distortion and using transverse web stiffeners produces only a modest reduction in the effect of cross section distortion.
• For a curved tubular-flange girder system with a composite concrete deck, the composite concrete deck increases the system stiffness and reduces the warping normal stress in the girders.
• A curved tubular-flange girder with a composite concrete deck develops less warping normal stress and cross section rotation than the corresponding curved I-girder. Using an appropriate number of transverse web stiffeners on the curved tubular-flange girders of a multiple girder system with a composite concrete deck effectively reduces the effect of cross section distortion, especially, for the outer girder of the multiple girder system.
9.3 Conclusions
Based on the research on curved tubular-flange girder systems reported in this report, the following conclusions are made.
• The theoretical analysis method for curved tubular-flange girder systems presented in the report is accurate for cases without cross section distortion.

197
• Cross section distortion for curved single tubular-flange girders is not a major concern, since the distortion can be effectively controlled by transverse web stiffeners.
• Owing to their increased torsional stiffness, curved single tubular-flange girders should be easier to lift, transport, and erect than curved single I-girders.
• A curved tubular-flange girder system needs fewer cross frames than the corresponding I-girder system to develop similar levels of stress.
• Smaller cross frame members can be used in a curved tubular-flange girder system, compared to the corresponding I-girder system, since smaller cross frame forces develop in the curved tubular-flange girder system.
• Cross section distortion is a concern for curved tubular-flange girder systems (girders braced by cross frames) without a composite concrete deck.
• For a curved tubular-flange girder system with a composite concrete deck, the effect of cross section distortion can be effectively controlled by transverse web stiffeners.
• Bending normal stress dominates the behavior of a curved tubular-flange girder system with a composite concrete deck, when sufficient transverse web stiffeners are used, since the warping normal stress is small. On the other hand, the behavior of curved I-girder systems involves bending normal stress and significant warping normal stress, which suggests that curved tubular-flange girder systems can be designed to be more efficient than I-girder systems for curved highway bridges.
9.4 Future Research
The following future research is recommended:
• Study the nonlinear behavior of curved steel tubular-flange girder systems, including geometric and material nonlinear behavior, and investigate the ultimate strength of curved tubular-flange girder systems.
• Study and develop practical methods to restrain the cross section distortion of curved tubular-flange girders, especially the distortion of the tubular flanges.
• Develop practical methods of fabricating curved steel tubular-flange girders. • Conduct experimental research to verify theoretical and finite element analysis
results. • Propose design criteria for preliminary and final design of curved steel tubular-
flange girder systems for bridge.

198
References
AASHTO (2003) AASHTO Guide Specifications for Horizontally Curved Steel Girder
Highway Bridges, American Association of State Highway Transportation Officials
(AASHTO), Washington, D.C.
AASHTO (2004) AASHTO LRFD Bridge Design Specification, American Association
of State Highway Transportation Officials (AASHTO), Washington, D.C.
ABAQUS (2003) “Standard User’s Manual”, v6.5. 2003.
Benscoter, S.U., (1954) “A Theory of Torsion Bending for Multicell Beams,” J. Applied Mechanics, March, 25-34. Dabrowski, R. (1968) Curved Thin-Walled Girders, Theory and Annalysis, Cement and Concrete Association, London. Galambos, T. V. (1968) Structural Members and Frames, Prentice-Hall, Englewood Cliffs, NJ. Kim, B. J. (2005) “High Performance Steel Girders with Tubular Flanges,” Ph.D. Report, Lehigh University, Bethlehem, PA. Richardson, Gordon, and Associate (1963) “Analysis and Design of Horizontal Curved Steel Bridge Girders,” United States Steel Corporation, Pittsburgh, PA. Wimer, M. R. (2004) “Concrete Filled Rectangular Tubular Flange Girders with Corrugated and Flat Webs,” M.S. Thesis, Lehigh University, Bethlehem, PA. U.S. Steel Corporation (1984) V-Load Method, Pittsburgh, PA. Zureick A., and Naqib, R. (1999) “Horizontally Curved Steel I-Girders, State-of-the-art: Part I-Analysis Methods,” Journal of Bridge Engineering, Vol. 4, No. 1, pp. 1-10.