
BEHAVIOR OF HORIZONTALLY CURVED COMPOSITE …arjournal.org/files/2016/06/ARJ-V.2n.5.254-265.pdf ·...
12
Page | 254 Available online at http://arjournal.org ISSN: 2423-4796 Applied Research Journal Vol.2, Issue, 5, pp.254-265, May, 2016 *Corresponding author: Amer F. Izzet, Email: [email protected] Department of Civil Engineering, College of Engineering, University of Baghdad, IRAQ. APPLIED RESEARCH JOURNAL RESEARCH ARTICLE BEHAVIOR OF HORIZONTALLY CURVED COMPOSITE BRIDGE DECKS UNDER IRAQI STANDARD BRIDGE LIVE LOADS * Amer F. Izzet., Aymen R. Mohammed Department of Civil Engineering, College of Engineering, University of Baghdad, Iraq. ARTICLE INFO ABSTRACT Article History: Received: 20, April, 2016 Final Accepted: 08, May, 2016 Published Online: 11, May, 2016 The purpose of this paper is to study the effect of curvature and the girder spacing on the flexural behavior of horizontally curved in plane composite concrete-steel I-girder bridges under Iraqi live loads, using a Finite Element model by ANSYS Workbench 14.5 commercial software. Many parametric cases study of various degrees of curvature [(L/R) = 0.1, 0.2, 0.3, 0.4, 0.5, 0.6 radians], girder spacing (1.5, 1.75, 2.0, 2.25 m) and Iraqi live load cases were adopted in this research. The numerical analysis results generally shows that the deflection, mid-span bottom flange longitudinal strain of girders increases when the bridge curvature increased under all selected Iraqi live load cases, and there is little effect of the girder spacing on the mid-span deflection under all the selected cases of Iraqi standard live loads. © Copy Right, ARJ, 2016. All rights reserved Key words: Finite Element, Curved Bridges, Composite Section, Iraqi Bridges Live loads, Girder Distribution Factor. 1. INTRODUCTION The horizontally curved bridges becomes the favorite alternative for the designer for highway interchanges and urban expressways, since the geometric design a function of complicated geometrics (horizontal and vertical alignments), limited rights of way, and traffic mitigation. The Finite Element Method is one of the best methods, which is applicable to idealize most types of structure and widely used method in many engineering applications [1]. For horizontally curved composite concrete-steel I-girder deck many model can be adapted under FEM approach [2] bridge concrete deck can be modeled as shell element including membrane and bending effects or 8-node brick element. Description of the buckling behavior of web panel under a combined shear and bending moment loads[3], linear-Elastic static, geometrically non- linear static and buckling analysis was adopted by Finite Element Analysis (MSC/NASTRAN 1994) to predict the overall behavior of the system under combined shear and bending. A finite element analysis used 8-noded doubly curved thin shell elements to idealize the curved plate girder loaded at mid span by concentrated point load; the major conclusion of this study was that the thinner webs curved girders had a clear effect of tension field action compared with the thicker webs girders [4]. A finite element analysis used a SAP2000 software was used to create the 3-D Finite Element model, shell elements were used to idealize a curved steel I-girder bridge [5]. The objective of this study is to investigate the flexural behavior under Iraqi Standard live loads (military loads) and to evaluate the girder vertical load share or Girder Distribution Factor (GDF). 2. MATERIAL AND METHODS 2.1. Geometry Modeling A 3-D AutoCAD drawing was created and exported to ANSYS WORKBENCH 14.5 software as solid model to idealize the bridge model parts, which is consist of concrete deck, steel girders, stiffeners and diaphragms, while the double layer deck reinforcements were created in the ANSYS Worckbench design modular as a line body as shown in Fig. 1
Transcript of BEHAVIOR OF HORIZONTALLY CURVED COMPOSITE …arjournal.org/files/2016/06/ARJ-V.2n.5.254-265.pdf ·...

P a g e | 254 Available online at http://arjournal.org
ISSN: 2423-4796
Applied Research Journal Vol.2, Issue, 5, pp.254-265, May, 2016
*Corresponding author: Amer F. Izzet, Email: [email protected] Department of Civil Engineering, College of Engineering, University of Baghdad, IRAQ.
APPLIED RESEARCH JOURNAL
RESEARCH ARTICLE
BEHAVIOR OF HORIZONTALLY CURVED COMPOSITE BRIDGE DECKS UNDER IRAQI STANDARD BRIDGE LIVE LOADS
* Amer F. Izzet., Aymen R. Mohammed
Department of Civil Engineering, College of Engineering, University of Baghdad, Iraq.
ARTICLE INFO ABSTRACT
Article History:
Received: 20, April, 2016 Final Accepted: 08, May, 2016 Published Online: 11, May, 2016
The purpose of this paper is to study the effect of curvature and the girder spacing on the flexural behavior of horizontally curved in plane composite concrete-steel I-girder bridges under Iraqi live loads, using a Finite Element model by ANSYS Workbench 14.5 commercial software. Many parametric cases study of various degrees of curvature [(L/R) = 0.1, 0.2, 0.3, 0.4, 0.5, 0.6 radians], girder spacing (1.5, 1.75, 2.0, 2.25 m) and Iraqi live load cases were adopted in this research. The numerical analysis results generally shows that the deflection, mid-span bottom flange longitudinal strain of girders increases when the bridge curvature increased under all selected Iraqi live load cases, and there is little effect of the girder spacing on the mid-span deflection under all the selected cases of Iraqi standard live loads.
© Copy Right, ARJ, 2016. All rights reserved
Key words:
Finite Element, Curved Bridges, Composite Section, Iraqi Bridges Live loads, Girder Distribution Factor.
1. INTRODUCTION
The horizontally curved bridges becomes the favorite alternative for the designer for highway interchanges and urban expressways, since the geometric design a function of complicated geometrics (horizontal and vertical alignments), limited rights of way, and traffic mitigation. The Finite Element Method is one of the best methods, which is applicable to idealize most types of structure and widely used method in many engineering applications [1]. For horizontally curved composite concrete-steel I-girder deck many model can be adapted under FEM approach [2] bridge concrete deck can be modeled as shell element including membrane and bending effects or 8-node brick element. Description of the buckling behavior of web panel under a combined shear and bending moment loads[3], linear-Elastic static, geometrically non-linear static and buckling analysis was adopted by Finite Element Analysis (MSC/NASTRAN 1994) to predict the overall behavior of the system under combined shear and bending. A finite element analysis used 8-noded doubly curved thin shell elements to idealize the curved plate girder loaded at mid span by concentrated point load; the major conclusion of this study was that the thinner webs curved girders had a clear effect of tension field action compared with the thicker webs girders [4]. A finite element analysis used a SAP2000 software was used to create the 3-D Finite Element model, shell elements were used to idealize a curved steel I-girder bridge [5].
The objective of this study is to investigate the flexural behavior under Iraqi Standard live loads (military loads) and to evaluate the girder vertical load share or Girder Distribution Factor (GDF).
2. MATERIAL AND METHODS
2.1. Geometry Modeling
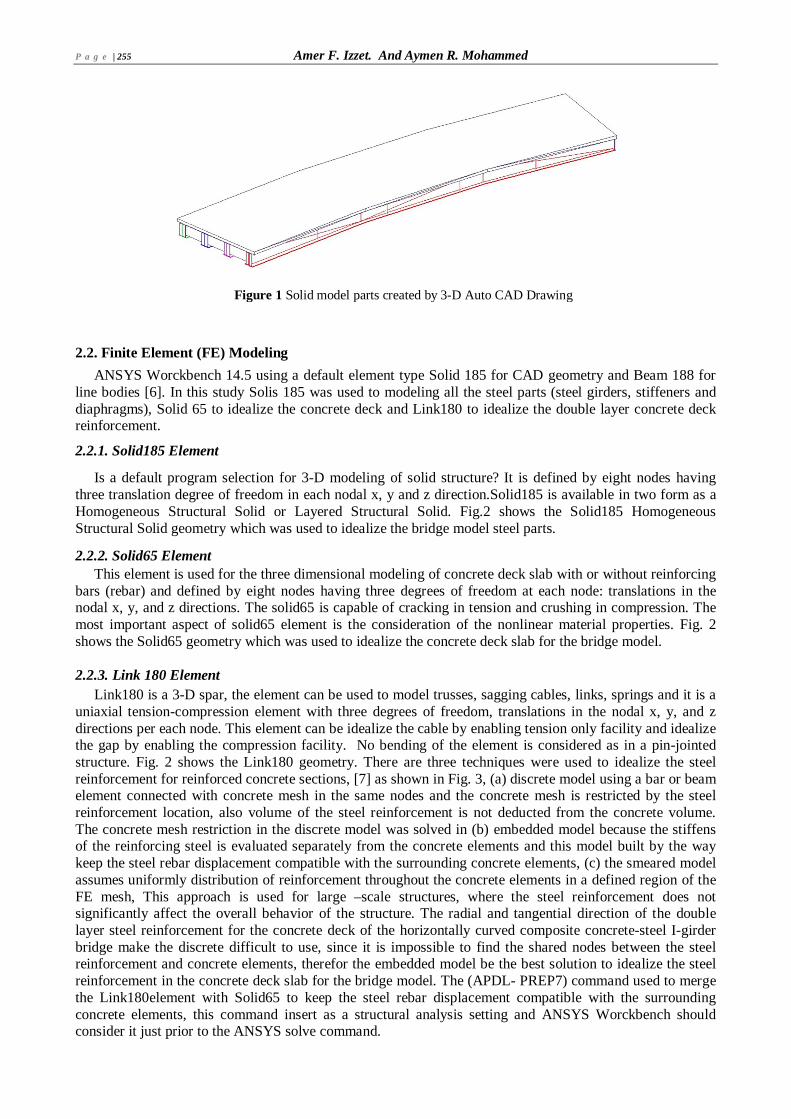
A 3-D AutoCAD drawing was created and exported to ANSYS WORKBENCH 14.5 software as solid model to idealize the bridge model parts, which is consist of concrete deck, steel girders, stiffeners and diaphragms, while the double layer deck reinforcements were created in the ANSYS Worckbench design modular as a line body as shown in Fig. 1
P a g e | 255 Amer F. Izzet. And Aymen R. Mohammed
2.2. Finite Element (FE) Modeling
ANSYS Worckbench 14.5 using a default element type Solid 185 for CAD geometry and Beam 188 for line bodies [6]. In this study Solis 185 was used to modeling all the steel parts (steel girders, stiffeners and diaphragms), Solid 65 to idealize the concrete deck and Link180 to idealize the double layer concrete deck reinforcement.
2.2.1. Solid185 Element
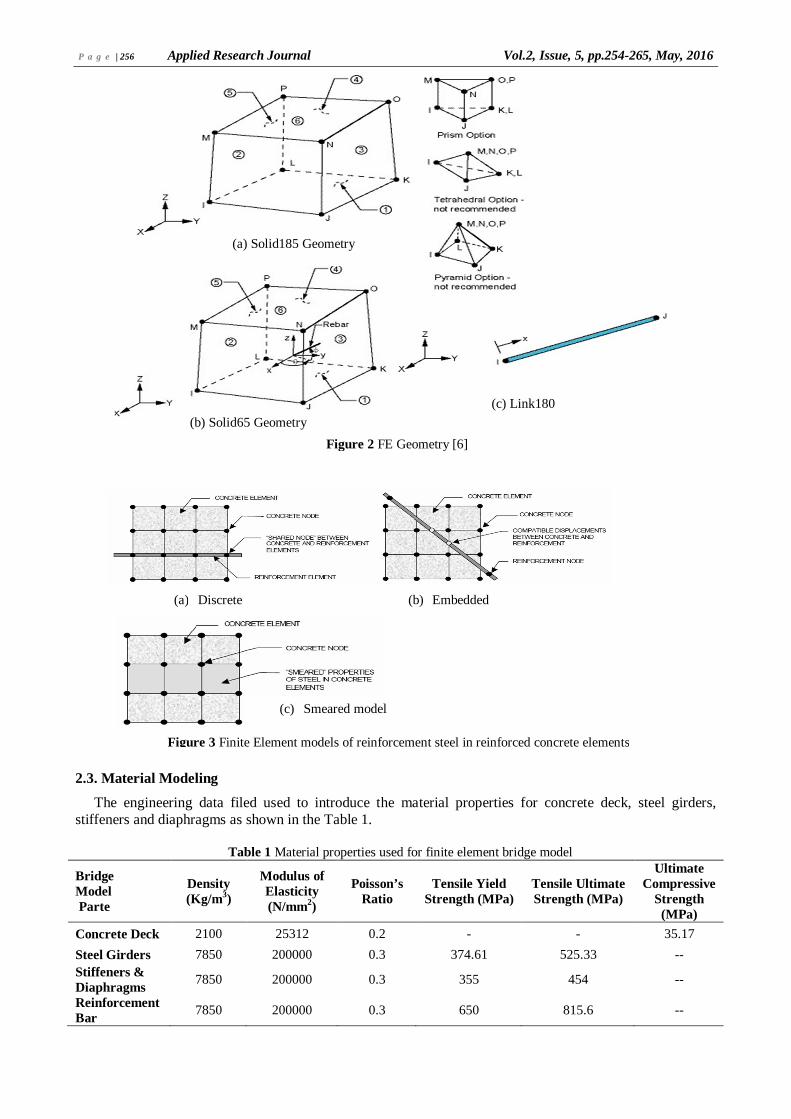
Is a default program selection for 3-D modeling of solid structure? It is defined by eight nodes having three translation degree of freedom in each nodal x, y and z direction.Solid185 is available in two form as a Homogeneous Structural Solid or Layered Structural Solid. Fig.2 shows the Solid185 Homogeneous Structural Solid geometry which was used to idealize the bridge model steel parts.
2.2.2. Solid65 Element
This element is used for the three dimensional modeling of concrete deck slab with or without reinforcing bars (rebar) and defined by eight nodes having three degrees of freedom at each node: translations in the nodal x, y, and z directions. The solid65 is capable of cracking in tension and crushing in compression. The most important aspect of solid65 element is the consideration of the nonlinear material properties. Fig. 2 shows the Solid65 geometry which was used to idealize the concrete deck slab for the bridge model.
2.2.3. Link 180 Element
Link180 is a 3-D spar, the element can be used to model trusses, sagging cables, links, springs and it is a uniaxial tension-compression element with three degrees of freedom, translations in the nodal x, y, and z directions per each node. This element can be idealize the cable by enabling tension only facility and idealize the gap by enabling the compression facility. No bending of the element is considered as in a pin-jointed structure. Fig. 2 shows the Link180 geometry. There are three techniques were used to idealize the steel reinforcement for reinforced concrete sections, [7] as shown in Fig. 3, (a) discrete model using a bar or beam element connected with concrete mesh in the same nodes and the concrete mesh is restricted by the steel reinforcement location, also volume of the steel reinforcement is not deducted from the concrete volume. The concrete mesh restriction in the discrete model was solved in (b) embedded model because the stiffens of the reinforcing steel is evaluated separately from the concrete elements and this model built by the way keep the steel rebar displacement compatible with the surrounding concrete elements, (c) the smeared model assumes uniformly distribution of reinforcement throughout the concrete elements in a defined region of the FE mesh, This approach is used for large –scale structures, where the steel reinforcement does not significantly affect the overall behavior of the structure. The radial and tangential direction of the double layer steel reinforcement for the concrete deck of the horizontally curved composite concrete-steel I-girder bridge make the discrete difficult to use, since it is impossible to find the shared nodes between the steel reinforcement and concrete elements, therefor the embedded model be the best solution to idealize the steel reinforcement in the concrete deck slab for the bridge model. The (APDL- PREP7) command used to merge the Link180element with Solid65 to keep the steel rebar displacement compatible with the surrounding concrete elements, this command insert as a structural analysis setting and ANSYS Worckbench should consider it just prior to the ANSYS solve command.
Figure 1 Solid model parts created by 3-D Auto CAD Drawing
P a g e | 256 Applied Research Journal Vol.2, Issue, 5, pp.254-265, May, 2016
2.3. Material Modeling
The engineering data filed used to introduce the material properties for concrete deck, steel girders, stiffeners and diaphragms as shown in the Table 1.
Table 1 Material properties used for finite element bridge model
Bridge Model Parte
Density (Kg/m3)
Modulus of Elasticity (N/mm2)
Poisson’s Ratio
Tensile Yield Strength (MPa)
Tensile Ultimate Strength (MPa)
Ultimate Compressive
Strength (MPa)
Concrete Deck 2100 25312 0.2 - - 35.17 Steel Girders 7850 200000 0.3 374.61 525.33 -- Stiffeners & Diaphragms 7850 200000 0.3 355 454 --
Reinforcement Bar 7850 200000 0.3 650 815.6 --
Figure 2 FE Geometry [6]
(a) Solid185 Geometry
(b) Solid65 Geometry (c) Link180
(a) Discrete model
(b) Embedded
(c) Smeared model
Figure 3 Finite Element models of reinforcement steel in reinforced concrete elements

P a g e | 257 Amer F. Izzet. And Aymen R. Mohammed
2.3.1. Concrete Deck Properties
The concrete modules of elasticity tests gives different results of stress-strain curve; the most appropriate experimental curve was selected to introduce the uniaxial stress-strain curve in the Finite Element model. Fig. 4 shows the material concrete model was adopted in Finite Element analysis.
2.3.2. Steel sections Properties
Steel materials include, girders steel, stiffeners, diaphragms and steel reinforcements assumed to behave as an elastic-plastic model with strain hardening in both compression and tension [8]. Fig. 5 shows stress-strain relationship was used to idealize the steel in the finite element analysis. 2.4. Real Constant
The Solid185 and Solid65 elements doesn’t need to introduce a real constant [6], while the (APDL- R, maited) command was used to specify the cross-sectional area of the Link180 element as shown in Table 2.
Table 2 Real Constant for the Finite Elements.
Element Type Material No.
Volume Ratio
Orientation angle
Cross-sectional area(mm2)
Initial strain(mm/mm)
Solid65 0 0 0 0 0 Solid185 0 0 0 0 0 Link180 -- -- -- 11.63 0
2.5. Mesh size
ANSYS Worckbench 14.5 needs a primary element size to adopt it in the auto- mesh generation; the primary element size was selected as 15 mm, therefore there are two solid65 element through the concrete deck depth and there are 16 solid185 elements through the steel girder web depth, while there are a special mesh divisions for top and bottom steel girder flange due to flange width, curvature and the joint connection with transverse diaphragms. The program auto-generation provides a triangular mesh for transvers diaphragms and a stiffener to overcome the girder-diaphragm problems, Plate 1 shows the Finite Element mesh of the curved bridge model.
2.6. Analysis setting
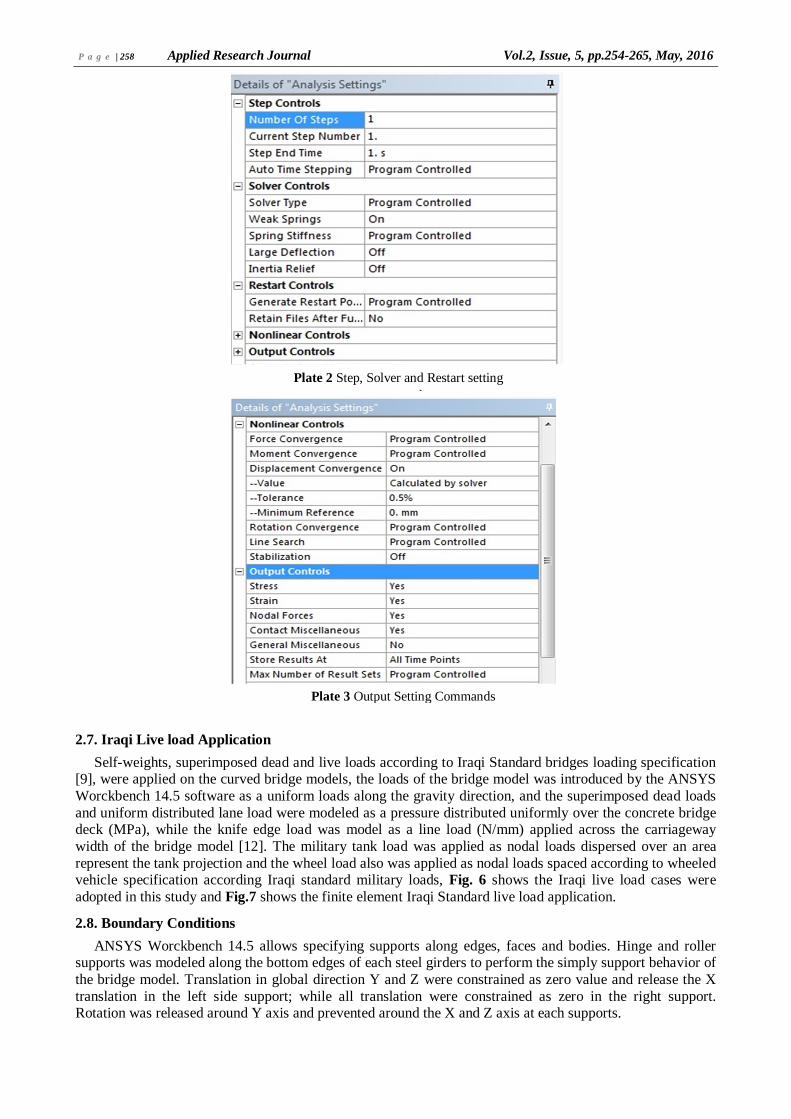
Typical commands for the static analysis in the present study related to step controls, solver controls and restart control are shown in the Plate 2, while for non-linear controls, and output controls are shown in the Plate 3. The displacement convergence was activated to predict the good results.
Figure 5 Idealized uniaxial stress-strain relationship for steel
Figure 4 Concrete Material Modeling.
Plate 1 Finite Element Mesh of the Curved Bridge
P a g e | 258 Applied Research Journal Vol.2, Issue, 5, pp.254-265, May, 2016
2.7. Iraqi Live load Application
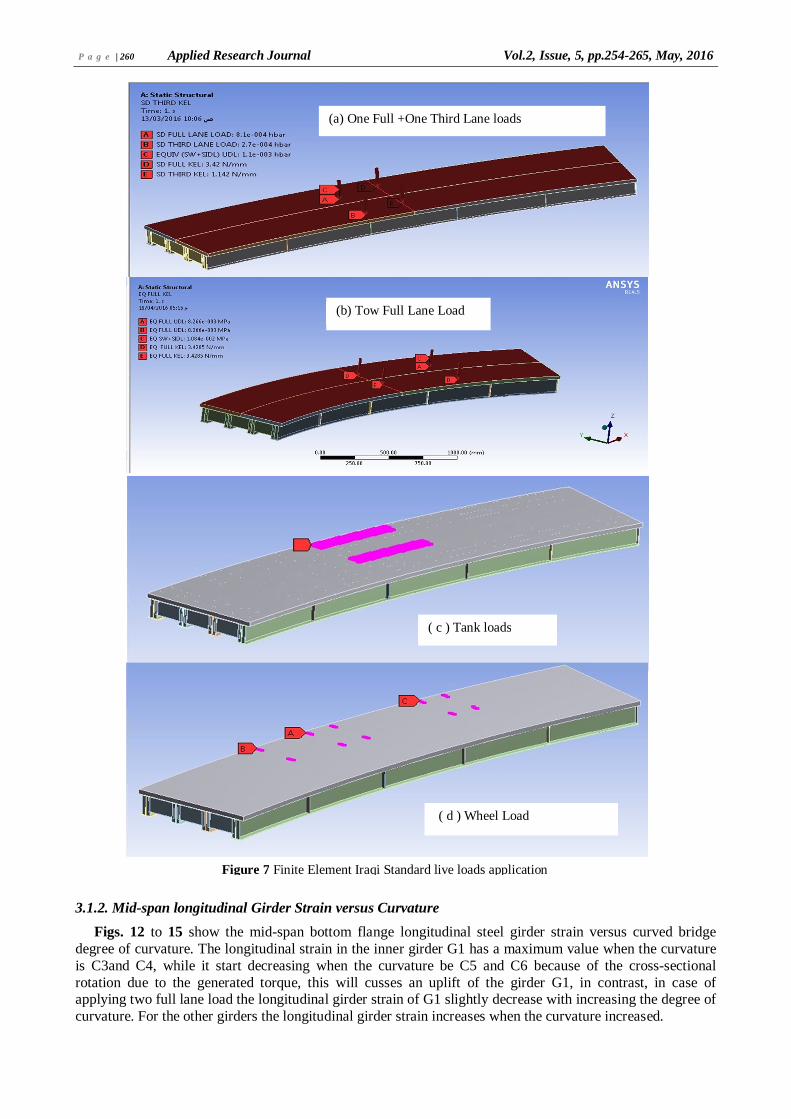
Self-weights, superimposed dead and live loads according to Iraqi Standard bridges loading specification [9], were applied on the curved bridge models, the loads of the bridge model was introduced by the ANSYS Worckbench 14.5 software as a uniform loads along the gravity direction, and the superimposed dead loads and uniform distributed lane load were modeled as a pressure distributed uniformly over the concrete bridge deck (MPa), while the knife edge load was model as a line load (N/mm) applied across the carriageway width of the bridge model [12]. The military tank load was applied as nodal loads dispersed over an area represent the tank projection and the wheel load also was applied as nodal loads spaced according to wheeled vehicle specification according Iraqi standard military loads, Fig. 6 shows the Iraqi live load cases were adopted in this study and Fig.7 shows the finite element Iraqi Standard live load application.
2.8. Boundary Conditions
ANSYS Worckbench 14.5 allows specifying supports along edges, faces and bodies. Hinge and roller supports was modeled along the bottom edges of each steel girders to perform the simply support behavior of the bridge model. Translation in global direction Y and Z were constrained as zero value and release the X translation in the left side support; while all translation were constrained as zero in the right support. Rotation was released around Y axis and prevented around the X and Z axis at each supports.
Plate 2 Step, Solver and Restart setting commands
Plate 3 Output Setting Commands

P a g e | 259 Amer F. Izzet. And Aymen R. Mohammed
3. RESULT AND DISCUSSION
The effect of curvature and girder spacing on the flexural behavior of simply supported horizontally curved composite concrete-steel I-girder bridges under Iraqi live loads were discussed in this research for different cases of curvature and girder spacing using Finite Element modeling by Ansys Worckbench 14.5 software.
3.1. The effect of Curvature
3.1.1. Mid-span deflection versus degree of curvature
Figs. 8 to 11 show the deflection versus curved bridge degree of curvature for the values [(L/R) = 0.1, 0.2, 0.3, 0.4, 0.5, and 0.6], where L is the central curved span of 30m and R is the radius of curvature 300, 150, 100, 75, 60, and 50 m respectively under the standard Iraqi live loads as shown in Fig.9 and 10. The inner girder G1 under all live load cases has a slightly decrease in the deflection due to increasing the curvature of the bridge model, while the effect of curvature appeared clearly in interior girder G2 and more than that for exterior girders G3 and G4.
Figure 6 Iraqi Standard Live Loads
b-
d-
e
a-
c-
P a g e | 260 Applied Research Journal Vol.2, Issue, 5, pp.254-265, May, 2016
3.1.2. Mid-span longitudinal Girder Strain versus Curvature
Figs. 12 to 15 show the mid-span bottom flange longitudinal steel girder strain versus curved bridge degree of curvature. The longitudinal strain in the inner girder G1 has a maximum value when the curvature is C3and C4, while it start decreasing when the curvature be C5 and C6 because of the cross-sectional rotation due to the generated torque, this will cusses an uplift of the girder G1, in contrast, in case of applying two full lane load the longitudinal girder strain of G1 slightly decrease with increasing the degree of curvature. For the other girders the longitudinal girder strain increases when the curvature increased.
(a) One Full +One Third Lane loads
( c ) Tank loads
( d ) Wheel Load
Figure 7 Finite Element Iraqi Standard live loads application
(b) Tow Full Lane Load

P a g e | 261 Amer F. Izzet. And Aymen R. Mohammed
Figure 8 Deflection -Curveture One Lane Full Load S200
Figure 9 Deflection -Curveture Tow Full Lane Load Full S200
Figure 10 Deflection versus Curveture -Tank S200
Figure 11 Defelection versus Curveture-Wheel S200
Figure 12 Long Girder Strain-Curveture Lane Load S200
Figure 13 Long Girder Strain-Curveture Tow Lane Load FullS200
Figure 14 Girder strain versus curveture -Tank S200
Figure 15 Girder strain versus curveture -Wheel S200
3.1.3. Flexural Girder Distribution Factor (GDF) versus Curvature.
The Girder Distribution Factor (GDF) was calculated according to equation 1, [10]:
20
30
40
50
60
70
80
C1 C2 C3 C4 C5 C6D
efle
ctio
n (m
m)
G1G2G3G4
2030405060708090
C1 C2 C3 C4 C5 C6
Def
lect
ion
(mm
)
G1G2G3G4
20
30
40
50
60
70
80
C1 C2 C3 C4 C5 C6
Def
lect
ion
(mm
)
G1G2G3G4
203040
50607080
90
C1 C2 C3 C4 C5 C6
Def
lect
ion
(mm
)
G1G2G3G4
3.E-44.E-44.E-45.E-45.E-46.E-46.E-47.E-47.E-4
C1 C2 C3 C4 C5 C6
Lon
g. G
irde
r St
rain
G1 G2 G3 G4
3.E-4
4.E-4
5.E-4
6.E-4
7.E-4
8.E-4
C1 C2 C3 C4 C5 C6
Lon
g. G
irde
r St
rain
G1 G2 G3 G4
2.E-4
3.E-4
4.E-4
5.E-4
6.E-4
7.E-4
8.E-4
C1 C2 C3 C4 C5 C6
Lon
g. G
irde
r St
rain
G1 G2 G3 G4
2.E-4
3.E-4
4.E-4
5.E-4
6.E-4
7.E-4
8.E-4
C1 C2 C3 C4 C5 C6
Lon
g. G
irde
r St
rain
G1 G2 G3 G4

P a g e | 262 Applied Research Journal Vol.2, Issue, 5, pp.254-265, May, 2016
(퐺퐷퐹) = 휎
∑ 휎 (1)
Where; 퐺퐷퐹 is the ratio of the generated longitudinal mid-span bottom flange stresses in the specified girder to the total curved bridge longitudinal stresses response? Figs. 16 to 19 show the variation of the live load girder distribution factor (GDF) versus the curvatures for the selected bridge case.
The two full lane load case produce a larger difference in the GDF for girders other than that of one lane load case, the Tank and Wheel Load has a slightly effect when changing the curvature of the bridge models.
Figure 16 GDF versus curveture -One Full Lane- S200 Figure 17 GDF versus curveture -Two Full Lane- S200
Figure 18 GDF versus curveture -Tank S200
Figure 19 GDF versus curveture -Wheel S200
3.2. The Effect of Girder Spacing
This parametric study consider a girder spacing of (1.50, 1.75, 2.0, and 2.25) m with carriageway width of (5.75, 6.50, 7.0, and 8.0) m respectively and central span of 30 m to illustrate the overall effect of the girder spacing on the flexural behavior of horizontally curved composite concrete-steel I-girder bridges.
3.2.1. Deflection versus Girder Spacing
Figs. 20 to 23 show the variation of the deflection versus the girder spacing for the selected bridge cases. The girder spacing has a little effect comparing with curvature on the girder mid-span deflection. The Tank and Wheel live loads cases show approximate similar behavior in the girder deflection with varying the girder spacing of the bridge model, while the one full Lane load case show a slightly increasing in the girder deflection with increasing the girder spacing.
3.2.2. Longitudinal Girder Strain versus Girder Spacing
Figs. 24 to 27 show the variation of the longitudinal strain at bottom flange of steel girder versus the girder spacing for the selected bridge case, the two full lane load case shows approximate a constant slope curve while the other load cases show an increasing in the curve slope, this because of the eccentricity of the load resultant in this load cases larger than that in the two full lane load case.
The Wheel load case produces the maximum longitudinal girder strain with increasing the girder spacing for bridge models. The variation of girder spacing produces a slightly effects comparing with that of the curvature on the longitudinal girder strain.
0.1
0.15
0.2
0.25
0.3
0.35
0.4
C1 C2 C3 C4 C5 C6
GD
F S2
00
G1 G2 G3 G4
0.15
0.2
0.25
0.3
0.35
0.4
C1 C2 C3 C4 C5 C6
GD
F S2
00
G1 G2 G3 G4
0.1
0.2
0.3
0.4
C1 C2 C3 C4 C5 C6
GD
F S2
00
G1 G2 G3 G4
0.1
0.2
0.3
0.4
C1 C2 C3 C4 C5 C6
GD
F S2
00
G1 G2 G3 G4

P a g e | 263 Amer F. Izzet. And Aymen R. Mohammed
Figure 20 Deflection-Girder Spacing - One Full lane Load (L/R)=0.3
Figure 21 Deflection-Girder Spacing - Two Full lane Load (L/R)=0.3
Figure 22 Deflection-Girder Spacing - Tank Load (L/R)=0.3
Figure 23 Deflection-Girder Spacing - Wheel Load (L/R)=0.3
Figure 24 Long. Girder Strain-Spacing One Lane Full Load ( L/R)=0.3
Figure 25 Long. Girder Strain-Spacing Two Lane Full Load ( L/R)=0.3
Figure 26 Long. Girder Strain-Spacing Tanke Load ( L/R)=0.3
Fig.ure 27 Long. Girder Strain-Spacing Wheel Load ( L/R)=0.3
2.E-4
3.E-4
4.E-4
5.E-4
6.E-4
7.E-4
S150 S175 S200 S225
Lon
g. G
irde
r St
rain
G1 G2 G3 G4
4.E-4
5.E-4
6.E-4
7.E-4
8.E-4
S150 S175 S200 S225
Lon
g. G
irde
r St
rain
G1 G2 G3 G4
3.E-44.E-44.E-45.E-45.E-46.E-46.E-47.E-4
S150 S175 S200 S225
Lon
g. G
irde
r St
rain
G1 G2 G3 G4
3.E-4
4.E-4
5.E-4
6.E-4
7.E-4
S150 S175 S200 S225
Lon
g. G
irde
r St
rain G1 G2 G3 G4
202530354045505560
S150 S175 S200 S225D
efle
ctio
n (m
m)
G1 G2 G3 G4
303540455055606570
S150 S175 S200 S225
Def
lect
ion
(mm
)
G1 G2 G3 G4
202530354045505560
S150 S175 S200 S225
Def
lect
ion
(mm
)
G1 G2 G3 G4
20
30
40
50
60
70
S150 S175 S200 S225
Def
lect
ion
(mm
)
G1 G2 G3 G4
P a g e | 264 Applied Research Journal Vol.2, Issue, 5, pp.254-265, May, 2016
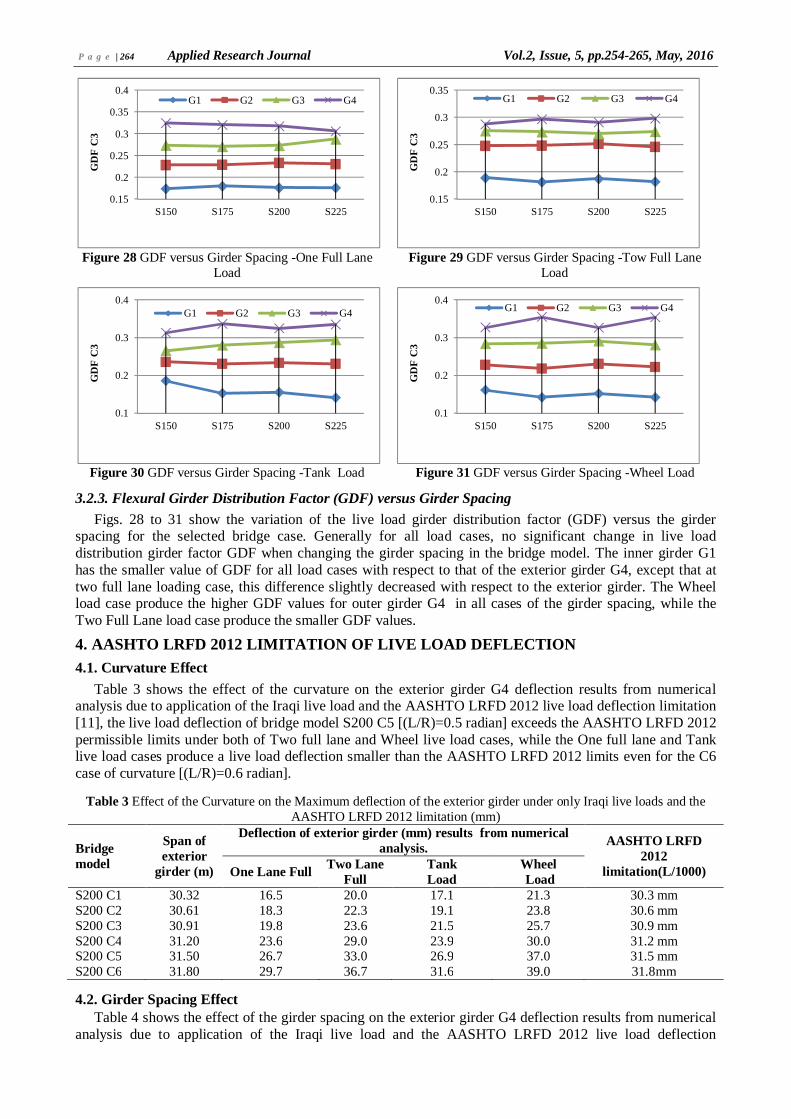
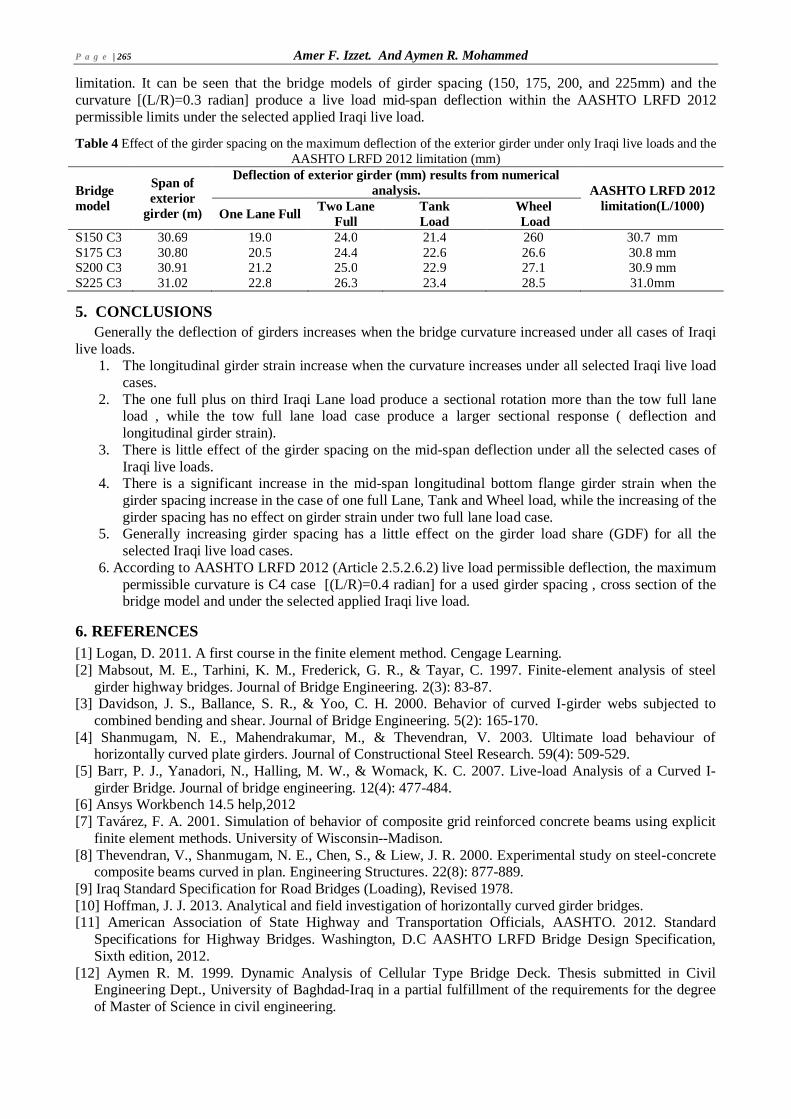
Figure 28 GDF versus Girder Spacing -One Full Lane Load
Figure 29 GDF versus Girder Spacing -Tow Full Lane Load
Figure 30 GDF versus Girder Spacing -Tank Load
Figure 31 GDF versus Girder Spacing -Wheel Load
3.2.3. Flexural Girder Distribution Factor (GDF) versus Girder Spacing
Figs. 28 to 31 show the variation of the live load girder distribution factor (GDF) versus the girder spacing for the selected bridge case. Generally for all load cases, no significant change in live load distribution girder factor GDF when changing the girder spacing in the bridge model. The inner girder G1 has the smaller value of GDF for all load cases with respect to that of the exterior girder G4, except that at two full lane loading case, this difference slightly decreased with respect to the exterior girder. The Wheel load case produce the higher GDF values for outer girder G4 in all cases of the girder spacing, while the Two Full Lane load case produce the smaller GDF values.
4. AASHTO LRFD 2012 LIMITATION OF LIVE LOAD DEFLECTION
4.1. Curvature Effect
Table 3 shows the effect of the curvature on the exterior girder G4 deflection results from numerical analysis due to application of the Iraqi live load and the AASHTO LRFD 2012 live load deflection limitation [11], the live load deflection of bridge model S200 C5 [(L/R)=0.5 radian] exceeds the AASHTO LRFD 2012 permissible limits under both of Two full lane and Wheel live load cases, while the One full lane and Tank live load cases produce a live load deflection smaller than the AASHTO LRFD 2012 limits even for the C6 case of curvature [(L/R)=0.6 radian].
Table 3 Effect of the Curvature on the Maximum deflection of the exterior girder under only Iraqi live loads and the
AASHTO LRFD 2012 limitation (mm)
Bridge model
Span of exterior
girder (m)
Deflection of exterior girder (mm) results from numerical analysis. AASHTO LRFD
2012 limitation(L/1000) One Lane Full Two Lane
Full Tank Load
Wheel Load
S200 C1 30.32 16.5 20.0 17.1 21.3 30.3 mm S200 C2 30.61 18.3 22.3 19.1 23.8 30.6 mm S200 C3 30.91 19.8 23.6 21.5 25.7 30.9 mm S200 C4 31.20 23.6 29.0 23.9 30.0 31.2 mm S200 C5 31.50 26.7 33.0 26.9 37.0 31.5 mm S200 C6 31.80 29.7 36.7 31.6 39.0 31.8 mm
4.2. Girder Spacing Effect
Table 4 shows the effect of the girder spacing on the exterior girder G4 deflection results from numerical analysis due to application of the Iraqi live load and the AASHTO LRFD 2012 live load deflection
0.15
0.2
0.25
0.3
0.35
0.4
S150 S175 S200 S225
GD
F C
3G1 G2 G3 G4
0.15
0.2
0.25
0.3
0.35
S150 S175 S200 S225
GD
F C
3
G1 G2 G3 G4
0.1
0.2
0.3
0.4
S150 S175 S200 S225
GD
F C
3
G1 G2 G3 G4
0.1
0.2
0.3
0.4
S150 S175 S200 S225G
DF
C3
G1 G2 G3 G4
P a g e | 265 Amer F. Izzet. And Aymen R. Mohammed
limitation. It can be seen that the bridge models of girder spacing (150, 175, 200, and 225mm) and the curvature [(L/R)=0.3 radian] produce a live load mid-span deflection within the AASHTO LRFD 2012 permissible limits under the selected applied Iraqi live load. Table 4 Effect of the girder spacing on the maximum deflection of the exterior girder under only Iraqi live loads and the
AASHTO LRFD 2012 limitation (mm)
Bridge model
Span of exterior
girder (m)
Deflection of exterior girder (mm) results from numerical analysis. AASHTO LRFD 2012
limitation(L/1000) One Lane Full Two Lane Full
Tank Load
Wheel Load
S150 C3 30.69 19.0 24.0 21.4 260 30.7 mm S175 C3 30.80 20.5 24.4 22.6 26.6 30.8 mm S200 C3 30.91 21.2 25.0 22.9 27.1 30.9 mm S225 C3 31.02 22.8 26.3 23.4 28.5 31.0 mm
5. CONCLUSIONS
Generally the deflection of girders increases when the bridge curvature increased under all cases of Iraqi live loads.
1. The longitudinal girder strain increase when the curvature increases under all selected Iraqi live load cases.
2. The one full plus on third Iraqi Lane load produce a sectional rotation more than the tow full lane load , while the tow full lane load case produce a larger sectional response ( deflection and longitudinal girder strain).
3. There is little effect of the girder spacing on the mid-span deflection under all the selected cases of Iraqi live loads.
4. There is a significant increase in the mid-span longitudinal bottom flange girder strain when the girder spacing increase in the case of one full Lane, Tank and Wheel load, while the increasing of the girder spacing has no effect on girder strain under two full lane load case.
5. Generally increasing girder spacing has a little effect on the girder load share (GDF) for all the selected Iraqi live load cases.
6. According to AASHTO LRFD 2012 (Article 2.5.2.6.2) live load permissible deflection, the maximum permissible curvature is C4 case [(L/R)=0.4 radian] for a used girder spacing , cross section of the bridge model and under the selected applied Iraqi live load.
6. REFERENCES
[1] Logan, D. 2011. A first course in the finite element method. Cengage Learning. [2] Mabsout, M. E., Tarhini, K. M., Frederick, G. R., & Tayar, C. 1997. Finite-element analysis of steel
girder highway bridges. Journal of Bridge Engineering. 2(3): 83-87. [3] Davidson, J. S., Ballance, S. R., & Yoo, C. H. 2000. Behavior of curved I-girder webs subjected to
combined bending and shear. Journal of Bridge Engineering. 5(2): 165-170. [4] Shanmugam, N. E., Mahendrakumar, M., & Thevendran, V. 2003. Ultimate load behaviour of
horizontally curved plate girders. Journal of Constructional Steel Research. 59(4): 509-529. [5] Barr, P. J., Yanadori, N., Halling, M. W., & Womack, K. C. 2007. Live-load Analysis of a Curved I-
girder Bridge. Journal of bridge engineering. 12(4): 477-484. [6] Ansys Workbench 14.5 help,2012 [7] Tavárez, F. A. 2001. Simulation of behavior of composite grid reinforced concrete beams using explicit
finite element methods. University of Wisconsin--Madison. [8] Thevendran, V., Shanmugam, N. E., Chen, S., & Liew, J. R. 2000. Experimental study on steel-concrete
composite beams curved in plan. Engineering Structures. 22(8): 877-889. [9] Iraq Standard Specification for Road Bridges (Loading), Revised 1978. [10] Hoffman, J. J. 2013. Analytical and field investigation of horizontally curved girder bridges. [11] American Association of State Highway and Transportation Officials, AASHTO. 2012. Standard
Specifications for Highway Bridges. Washington, D.C AASHTO LRFD Bridge Design Specification, Sixth edition, 2012.
[12] Aymen R. M. 1999. Dynamic Analysis of Cellular Type Bridge Deck. Thesis submitted in Civil Engineering Dept., University of Baghdad-Iraq in a partial fulfillment of the requirements for the degree of Master of Science in civil engineering.