Begin End ShowTable of Contents THE FINANCIAL SECTOR - 9.3.2 Copyright © 2013 N.S.
46
Begin End Show Table of Contents THE FINANCIAL SECTOR - 9.3.2 Copyright © 2013 N.S.
Transcript of Begin End ShowTable of Contents THE FINANCIAL SECTOR - 9.3.2 Copyright © 2013 N.S.

BeginEnd ShowTable of Contents
THE FINANCIAL SECTOR - 9.3.2
Copyright © 2013 N.S.
Last SlideViewed
ForwardBackEnd ShowResourcesTitle Page Table of Contents
Copyright © 2013 N.S.
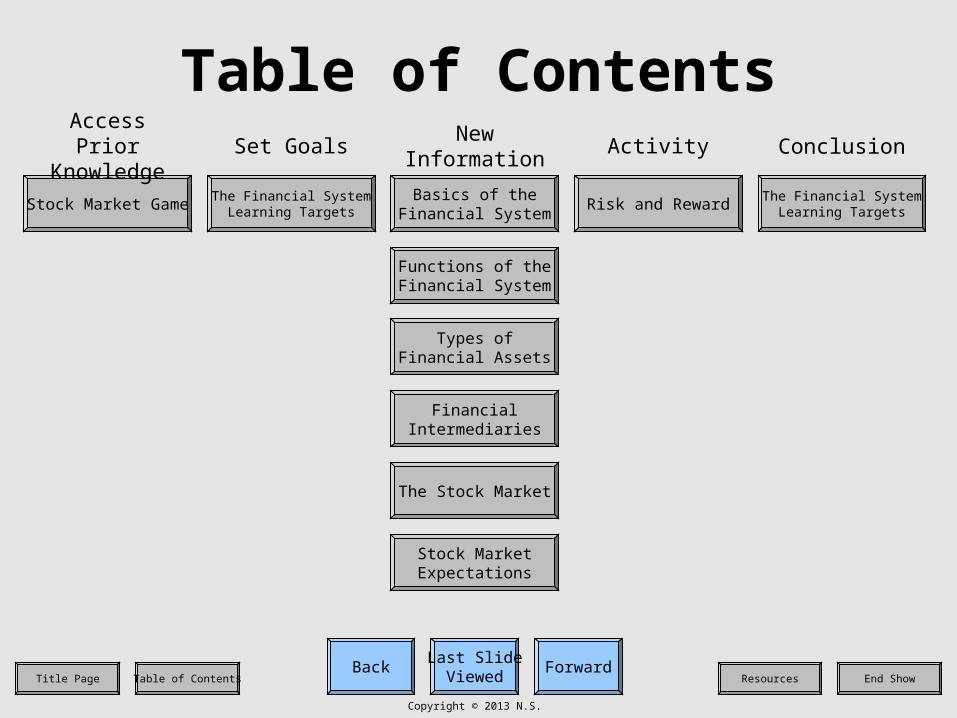
Table of Contents
Stock Market Game The Financial SystemLearning Targets
The Financial SystemLearning Targets
Basics of theFinancial System
Risk and Reward
Functions of theFinancial System
Types ofFinancial Assets
FinancialIntermediaries
The Stock Market
Access PriorKnowledge
Set GoalsNew
InformationActivity Conclusion
Stock MarketExpectations
Last SlideViewed
ForwardBackEnd ShowResourcesTitle Page Table of Contents
Copyright © 2013 N.S.
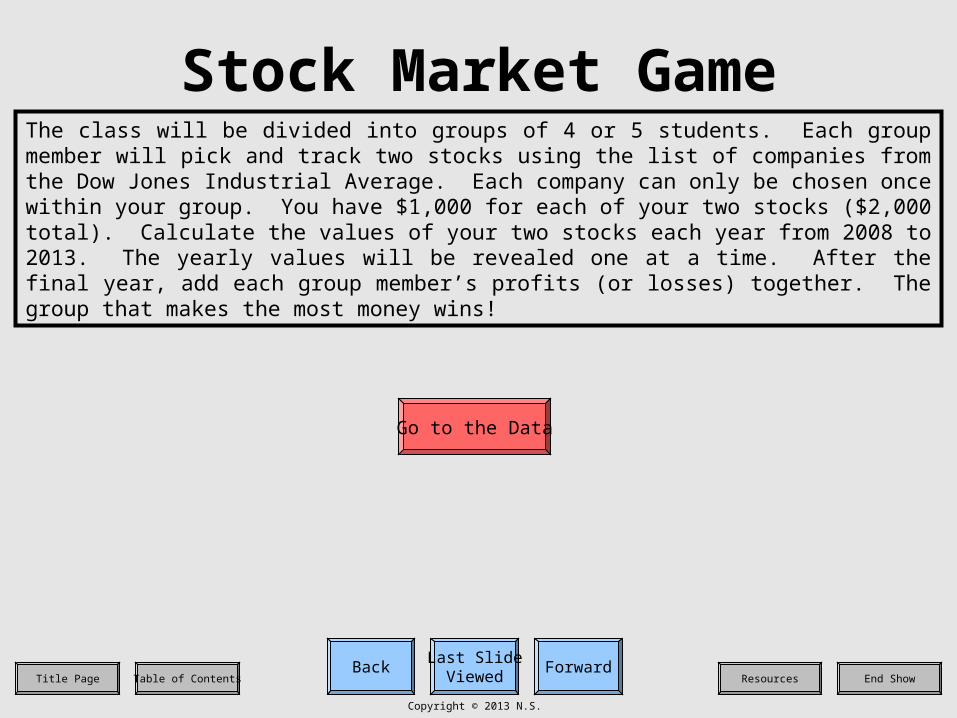
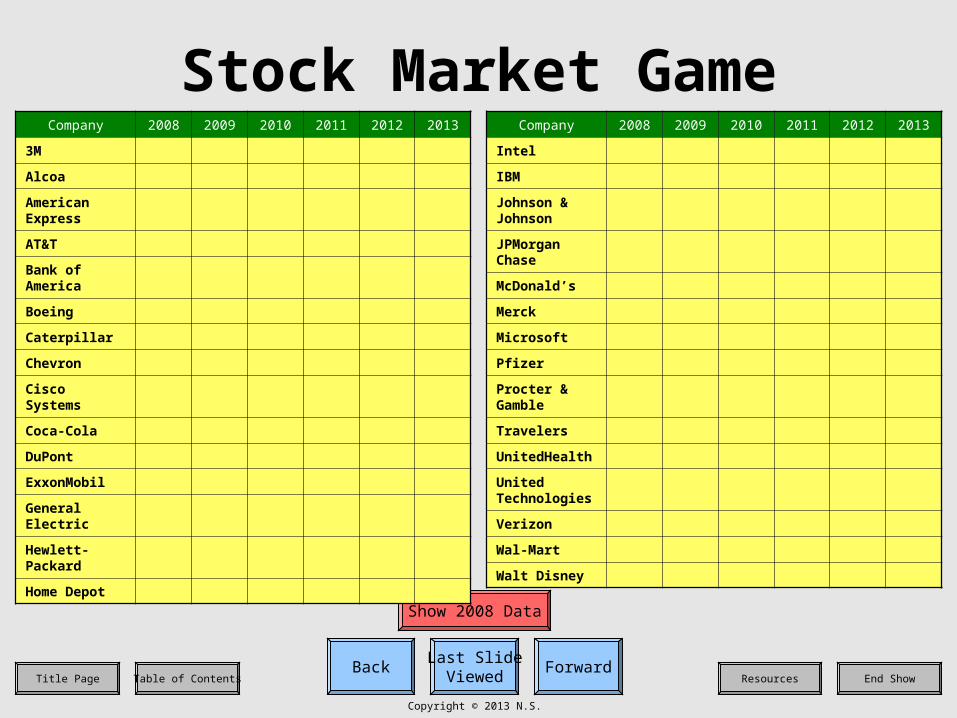
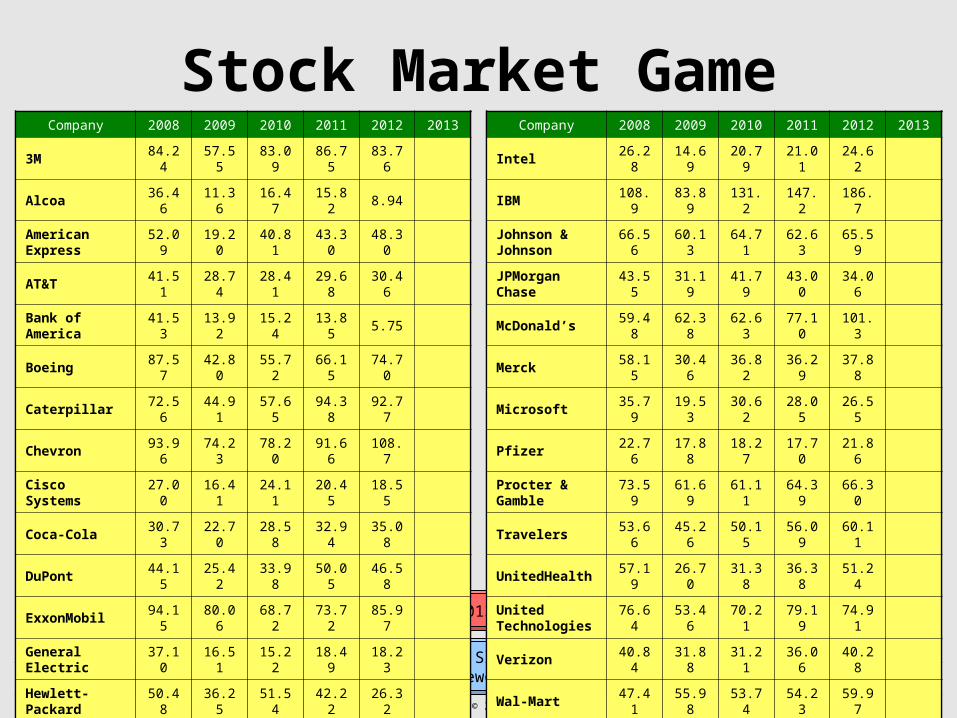
Stock Market GameThe class will be divided into groups of 4 or 5 students. Each group member will pick and track two stocks using the list of companies from the Dow Jones Industrial Average. Each company can only be chosen once within your group. You have $1,000 for each of your two stocks ($2,000 total). Calculate the values of your two stocks each year from 2008 to 2013. The yearly values will be revealed one at a time. After the final year, add each group member’s profits (or losses) together. The group that makes the most money wins!
Go to the Data
Last SlideViewed
ForwardBackEnd ShowResourcesTitle Page Table of Contents
Copyright © 2013 N.S.
Stock Market Game
Show 2008 Data
Company 2008 2009 2010 2011 2012 2013
3M
Alcoa
American Express
AT&T
Bank of America
Boeing
Caterpillar
Chevron
Cisco Systems
Coca-Cola
DuPont
ExxonMobil
General Electric
Hewlett-Packard
Home Depot
Company 2008 2009 2010 2011 2012 2013
Intel
IBM
Johnson & Johnson
JPMorgan Chase
McDonald’s
Merck
Microsoft
Pfizer
Procter & Gamble
Travelers
UnitedHealth
United Technologies
Verizon
Wal-Mart
Walt Disney
Last SlideViewed
ForwardBackEnd ShowResourcesTitle Page Table of Contents
Copyright © 2013 N.S.
Stock Market Game
Show 2009 Data
Company 2008 2009 2010 2011 2012 2013
3M
Alcoa
American Express
AT&T
Bank of America
Boeing
Caterpillar
Chevron
Cisco Systems
Coca-Cola
DuPont
ExxonMobil
General Electric
Hewlett-Packard
Home Depot
Company 2008 2009 2010 2011 2012 2013
Intel
IBM
Johnson & Johnson
JPMorgan Chase
McDonald’s
Merck
Microsoft
Pfizer
Procter & Gamble
Travelers
UnitedHealth
United Technologies
Verizon
Wal-Mart
Walt Disney
Company 2008 2009 2010 2011 2012 2013
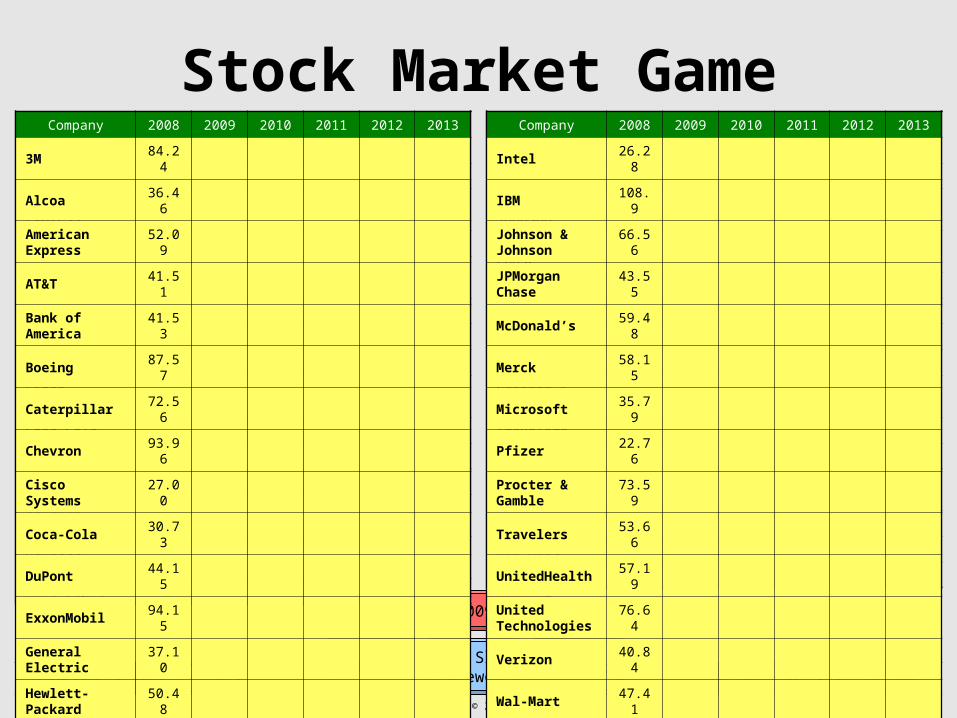
3M 84.24
Alcoa 36.46
American Express
52.09
AT&T 41.51
Bank of America
41.53
Boeing 87.57
Caterpillar 72.56
Chevron 93.96
Cisco Systems 27.00
Coca-Cola 30.73
DuPont 44.15
ExxonMobil 94.15
General Electric 37.10
Hewlett-Packard
50.48
Home Depot 27.13
Company 2008 2009 2010 2011 2012 2013
Intel 26.28
IBM 108.9
Johnson & Johnson
66.56
JPMorgan Chase
43.55
McDonald’s 59.48
Merck 58.15
Microsoft 35.79
Pfizer 22.76
Procter & Gamble
73.59
Travelers 53.66
UnitedHealth 57.19
United Technologies
76.64
Verizon 40.84
Wal-Mart 47.41
Walt Disney 32.32
Last SlideViewed
ForwardBackEnd ShowResourcesTitle Page Table of Contents
Copyright © 2013 N.S.
Company 2008 2009 2010 2011 2012 2013
Intel 26.28
IBM 108.9
Johnson & Johnson
66.56
JPMorgan Chase
43.55
McDonald’s 59.48
Merck 58.15
Microsoft 35.79
Pfizer 22.76
Procter & Gamble
73.59
Travelers 53.66
UnitedHealth 57.19
United Technologies
76.64
Verizon 40.84
Wal-Mart 47.41
Walt Disney 32.32
Company 2008 2009 2010 2011 2012 2013
3M 84.24
Alcoa 36.46
American Express
52.09
AT&T 41.51
Bank of America
41.53
Boeing 87.57
Caterpillar 72.56
Chevron 93.96
Cisco Systems 27.00
Coca-Cola 30.73
DuPont 44.15
ExxonMobil 94.15
General Electric 37.10
Hewlett-Packard
50.48
Home Depot 27.13
Stock Market Game
Show 2010 Data
Company 2008 2009 2010 2011 2012 2013
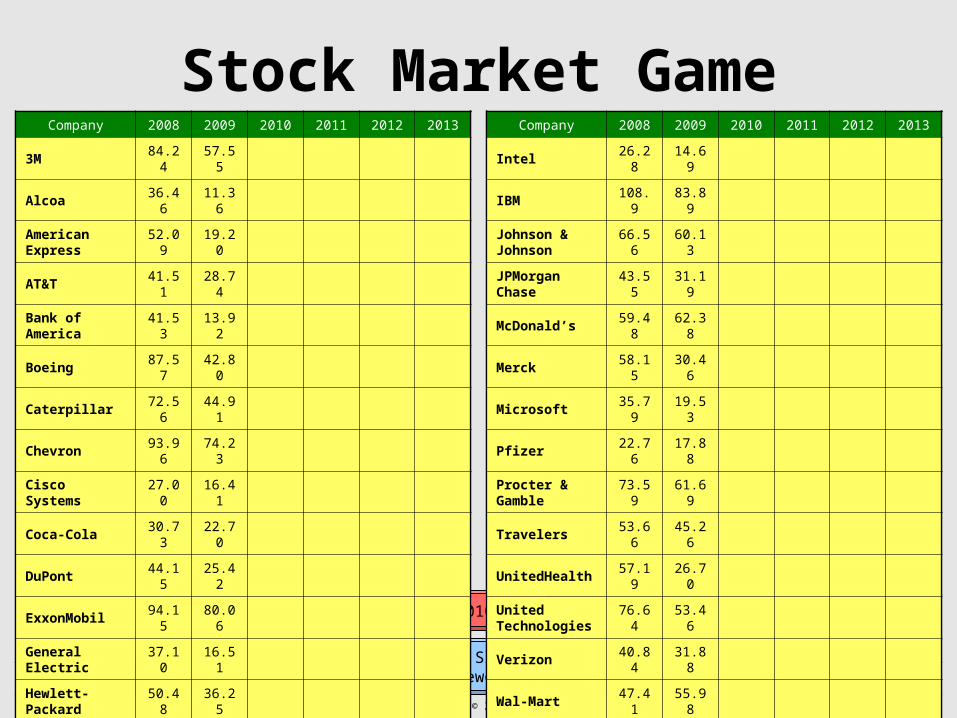
3M 84.24 57.55
Alcoa 36.46 11.36
American Express
52.09 19.20
AT&T 41.51 28.74
Bank of America
41.53 13.92
Boeing 87.57 42.80
Caterpillar 72.56 44.91
Chevron 93.96 74.23
Cisco Systems 27.00 16.41
Coca-Cola 30.73 22.70
DuPont 44.15 25.42
ExxonMobil 94.15 80.06
General Electric 37.10 16.51
Hewlett-Packard
50.48 36.25
Home Depot 27.13 23.07
Company 2008 2009 2010 2011 2012 2013
Intel 26.28 14.69
IBM 108.9 83.89
Johnson & Johnson
66.56 60.13
JPMorgan Chase
43.55 31.19
McDonald’s 59.48 62.38
Merck 58.15 30.46
Microsoft 35.79 19.53
Pfizer 22.76 17.88
Procter & Gamble
73.59 61.69
Travelers 53.66 45.26
UnitedHealth 57.19 26.70
United Technologies
76.64 53.46
Verizon 40.84 31.88
Wal-Mart 47.41 55.98
Walt Disney 32.32 22.76

Last SlideViewed
ForwardBackEnd ShowResourcesTitle Page Table of Contents
Copyright © 2013 N.S.
Company 2008 2009 2010 2011 2012 2013
Intel 26.28 14.69
IBM 108.9 83.89
Johnson & Johnson
66.56 60.13
JPMorgan Chase
43.55 31.19
McDonald’s 59.48 62.38
Merck 58.15 30.46
Microsoft 35.79 19.53
Pfizer 22.76 17.88
Procter & Gamble
73.59 61.69
Travelers 53.66 45.26
UnitedHealth 57.19 26.70
United Technologies
76.64 53.46
Verizon 40.84 31.88
Wal-Mart 47.41 55.98
Walt Disney 32.32 22.76
Company 2008 2009 2010 2011 2012 2013
3M 84.24 57.55
Alcoa 36.46 11.36
American Express
52.09 19.20
AT&T 41.51 28.74
Bank of America
41.53 13.92
Boeing 87.57 42.80
Caterpillar 72.56 44.91
Chevron 93.96 74.23
Cisco Systems 27.00 16.41
Coca-Cola 30.73 22.70
DuPont 44.15 25.42
ExxonMobil 94.15 80.06
General Electric 37.10 16.51
Hewlett-Packard
50.48 36.25
Home Depot 27.13 23.07
Stock Market Game
Show 2011 Data
Company 2008 2009 2010 2011 2012 2013
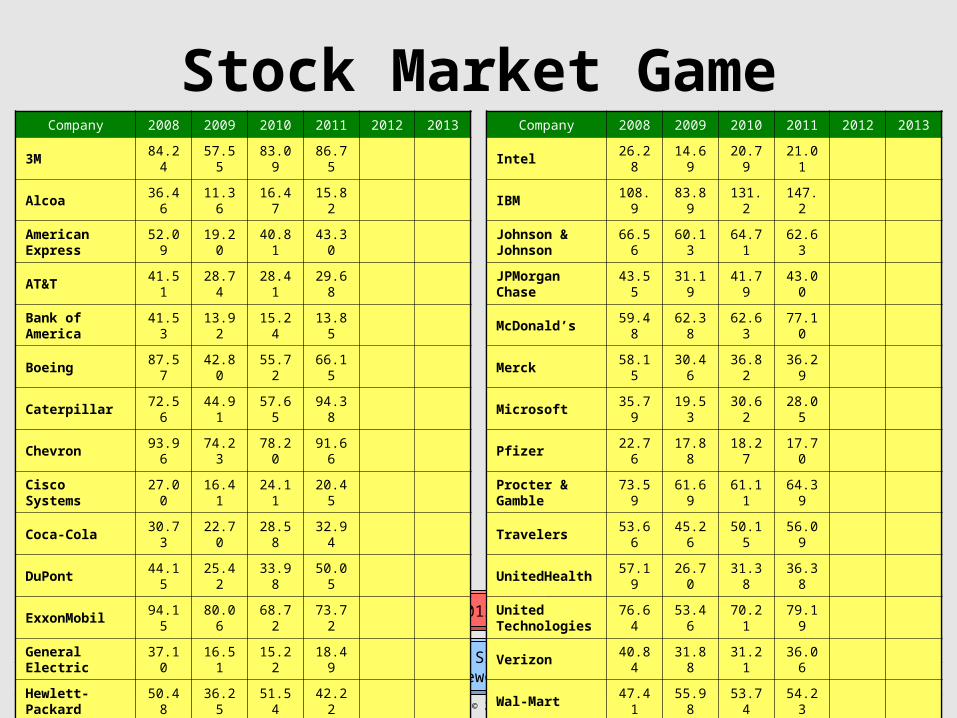
3M 84.24 57.55 83.09
Alcoa 36.46 11.36 16.47
American Express
52.09 19.20 40.81
AT&T 41.51 28.74 28.41
Bank of America
41.53 13.92 15.24
Boeing 87.57 42.80 55.72
Caterpillar 72.56 44.91 57.65
Chevron 93.96 74.23 78.20
Cisco Systems 27.00 16.41 24.11
Coca-Cola 30.73 22.70 28.58
DuPont 44.15 25.42 33.98
ExxonMobil 94.15 80.06 68.72
General Electric 37.10 16.51 15.22
Hewlett-Packard
50.48 36.25 51.54
Home Depot 27.13 23.07 29.15
Company 2008 2009 2010 2011 2012 2013
Intel 26.28 14.69 20.79
IBM 108.9 83.89 131.2
Johnson & Johnson
66.56 60.13 64.71
JPMorgan Chase
43.55 31.19 41.79
McDonald’s 59.48 62.38 62.63
Merck 58.15 30.46 36.82
Microsoft 35.79 19.53 30.62
Pfizer 22.76 17.88 18.27
Procter & Gamble
73.59 61.69 61.11
Travelers 53.66 45.26 50.15
UnitedHealth 57.19 26.70 31.38
United Technologies
76.64 53.46 70.21
Verizon 40.84 31.88 31.21
Wal-Mart 47.41 55.98 53.74
Walt Disney 32.32 22.76 32.50
Last SlideViewed
ForwardBackEnd ShowResourcesTitle Page Table of Contents
Copyright © 2013 N.S.
Company 2008 2009 2010 2011 2012 2013
Intel 26.28 14.69 20.79
IBM 108.9 83.89 131.2
Johnson & Johnson
66.56 60.13 64.71
JPMorgan Chase
43.55 31.19 41.79
McDonald’s 59.48 62.38 62.63
Merck 58.15 30.46 36.82
Microsoft 35.79 19.53 30.62
Pfizer 22.76 17.88 18.27
Procter & Gamble
73.59 61.69 61.11
Travelers 53.66 45.26 50.15
UnitedHealth 57.19 26.70 31.38
United Technologies
76.64 53.46 70.21
Verizon 40.84 31.88 31.21
Wal-Mart 47.41 55.98 53.74
Walt Disney 32.32 22.76 32.50
Company 2008 2009 2010 2011 2012 2013
3M 84.24 57.55 83.09
Alcoa 36.46 11.36 16.47
American Express
52.09 19.20 40.81
AT&T 41.51 28.74 28.41
Bank of America
41.53 13.92 15.24
Boeing 87.57 42.80 55.72
Caterpillar 72.56 44.91 57.65
Chevron 93.96 74.23 78.20
Cisco Systems 27.00 16.41 24.11
Coca-Cola 30.73 22.70 28.58
DuPont 44.15 25.42 33.98
ExxonMobil 94.15 80.06 68.72
General Electric 37.10 16.51 15.22
Hewlett-Packard
50.48 36.25 51.54
Home Depot 27.13 23.07 29.15
Stock Market Game
Show 2012 Data
Company 2008 2009 2010 2011 2012 2013
3M 84.24 57.55 83.09 86.75
Alcoa 36.46 11.36 16.47 15.82
American Express
52.09 19.20 40.81 43.30
AT&T 41.51 28.74 28.41 29.68
Bank of America
41.53 13.92 15.24 13.85
Boeing 87.57 42.80 55.72 66.15
Caterpillar 72.56 44.91 57.65 94.38
Chevron 93.96 74.23 78.20 91.66
Cisco Systems 27.00 16.41 24.11 20.45
Coca-Cola 30.73 22.70 28.58 32.94
DuPont 44.15 25.42 33.98 50.05
ExxonMobil 94.15 80.06 68.72 73.72
General Electric 37.10 16.51 15.22 18.49
Hewlett-Packard
50.48 36.25 51.54 42.22
Home Depot 27.13 23.07 29.15 35.20
Company 2008 2009 2010 2011 2012 2013
Intel 26.28 14.69 20.79 21.01
IBM 108.9 83.89 131.2 147.2
Johnson & Johnson
66.56 60.13 64.71 62.63
JPMorgan Chase
43.55 31.19 41.79 43.00
McDonald’s 59.48 62.38 62.63 77.10
Merck 58.15 30.46 36.82 36.29
Microsoft 35.79 19.53 30.62 28.05
Pfizer 22.76 17.88 18.27 17.70
Procter & Gamble
73.59 61.69 61.11 64.39
Travelers 53.66 45.26 50.15 56.09
UnitedHealth 57.19 26.70 31.38 36.38
United Technologies
76.64 53.46 70.21 79.19
Verizon 40.84 31.88 31.21 36.06
Wal-Mart 47.41 55.98 53.74 54.23
Walt Disney 32.32 22.76 32.50 37.74
Last SlideViewed
ForwardBackEnd ShowResourcesTitle Page Table of Contents
Copyright © 2013 N.S.
Company 2008 2009 2010 2011 2012 2013
Intel 26.28 14.69 20.79 21.01
IBM 108.9 83.89 131.2 147.2
Johnson & Johnson
66.56 60.13 64.71 62.63
JPMorgan Chase
43.55 31.19 41.79 43.00
McDonald’s 59.48 62.38 62.63 77.10
Merck 58.15 30.46 36.82 36.29
Microsoft 35.79 19.53 30.62 28.05
Pfizer 22.76 17.88 18.27 17.70
Procter & Gamble
73.59 61.69 61.11 64.39
Travelers 53.66 45.26 50.15 56.09
UnitedHealth 57.19 26.70 31.38 36.38
United Technologies
76.64 53.46 70.21 79.19
Verizon 40.84 31.88 31.21 36.06
Wal-Mart 47.41 55.98 53.74 54.23
Walt Disney 32.32 22.76 32.50 37.74
Company 2008 2009 2010 2011 2012 2013
3M 84.24 57.55 83.09 86.75
Alcoa 36.46 11.36 16.47 15.82
American Express
52.09 19.20 40.81 43.30
AT&T 41.51 28.74 28.41 29.68
Bank of America
41.53 13.92 15.24 13.85
Boeing 87.57 42.80 55.72 66.15
Caterpillar 72.56 44.91 57.65 94.38
Chevron 93.96 74.23 78.20 91.66
Cisco Systems 27.00 16.41 24.11 20.45
Coca-Cola 30.73 22.70 28.58 32.94
DuPont 44.15 25.42 33.98 50.05
ExxonMobil 94.15 80.06 68.72 73.72
General Electric 37.10 16.51 15.22 18.49
Hewlett-Packard
50.48 36.25 51.54 42.22
Home Depot 27.13 23.07 29.15 35.20
Stock Market Game
Show 2013 Data
Company 2008 2009 2010 2011 2012 2013
3M 84.24 57.55 83.09 86.75 83.76
Alcoa 36.46 11.36 16.47 15.82 8.94
American Express
52.09 19.20 40.81 43.30 48.30
AT&T 41.51 28.74 28.41 29.68 30.46
Bank of America
41.53 13.92 15.24 13.85 5.75
Boeing 87.57 42.80 55.72 66.15 74.70
Caterpillar 72.56 44.91 57.65 94.38 92.77
Chevron 93.96 74.23 78.20 91.66 108.7
Cisco Systems 27.00 16.41 24.11 20.45 18.55
Coca-Cola 30.73 22.70 28.58 32.94 35.08
DuPont 44.15 25.42 33.98 50.05 46.58
ExxonMobil 94.15 80.06 68.72 73.72 85.97
General Electric 37.10 16.51 15.22 18.49 18.23
Hewlett-Packard
50.48 36.25 51.54 42.22 26.32
Home Depot 27.13 23.07 29.15 35.20 42.41
Company 2008 2009 2010 2011 2012 2013
Intel 26.28 14.69 20.79 21.01 24.62
IBM 108.9 83.89 131.2 147.2 186.7
Johnson & Johnson
66.56 60.13 64.71 62.63 65.59
JPMorgan Chase
43.55 31.19 41.79 43.00 34.06
McDonald’s 59.48 62.38 62.63 77.10 101.3
Merck 58.15 30.46 36.82 36.29 37.88
Microsoft 35.79 19.53 30.62 28.05 26.55
Pfizer 22.76 17.88 18.27 17.70 21.86
Procter & Gamble
73.59 61.69 61.11 64.39 66.30
Travelers 53.66 45.26 50.15 56.09 60.11
UnitedHealth 57.19 26.70 31.38 36.38 51.24
United Technologies
76.64 53.46 70.21 79.19 74.91
Verizon 40.84 31.88 31.21 36.06 40.28
Wal-Mart 47.41 55.98 53.74 54.23 59.97
Walt Disney 32.32 22.76 32.50 37.74 37.97
Last SlideViewed
ForwardBackEnd ShowResourcesTitle Page Table of Contents
Copyright © 2013 N.S.
Company 2008 2009 2010 2011 2012 2013
Intel 26.28 14.69 20.79 21.01 24.62
IBM 108.9 83.89 131.2 147.2 186.7
Johnson & Johnson
66.56 60.13 64.71 62.63 65.59
JPMorgan Chase
43.55 31.19 41.79 43.00 34.06
McDonald’s 59.48 62.38 62.63 77.10 101.3
Merck 58.15 30.46 36.82 36.29 37.88
Microsoft 35.79 19.53 30.62 28.05 26.55
Pfizer 22.76 17.88 18.27 17.70 21.86
Procter & Gamble
73.59 61.69 61.11 64.39 66.30
Travelers 53.66 45.26 50.15 56.09 60.11
UnitedHealth 57.19 26.70 31.38 36.38 51.24
United Technologies
76.64 53.46 70.21 79.19 74.91
Verizon 40.84 31.88 31.21 36.06 40.28
Wal-Mart 47.41 55.98 53.74 54.23 59.97
Walt Disney 32.32 22.76 32.50 37.74 37.97
Company 2008 2009 2010 2011 2012 2013
3M 84.24 57.55 83.09 86.75 83.76
Alcoa 36.46 11.36 16.47 15.82 8.94
American Express
52.09 19.20 40.81 43.30 48.30
AT&T 41.51 28.74 28.41 29.68 30.46
Bank of America
41.53 13.92 15.24 13.85 5.75
Boeing 87.57 42.80 55.72 66.15 74.70
Caterpillar 72.56 44.91 57.65 94.38 92.77
Chevron 93.96 74.23 78.20 91.66 108.7
Cisco Systems 27.00 16.41 24.11 20.45 18.55
Coca-Cola 30.73 22.70 28.58 32.94 35.08
DuPont 44.15 25.42 33.98 50.05 46.58
ExxonMobil 94.15 80.06 68.72 73.72 85.97
General Electric 37.10 16.51 15.22 18.49 18.23
Hewlett-Packard
50.48 36.25 51.54 42.22 26.32
Home Depot 27.13 23.07 29.15 35.20 42.41
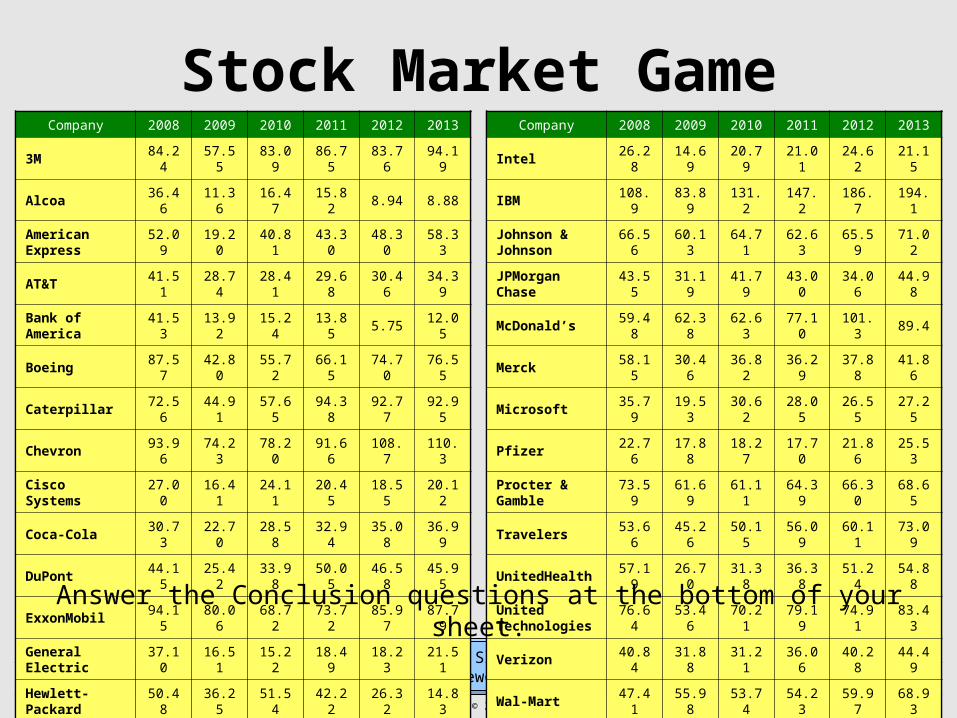
Stock Market GameCompany 2008 2009 2010 2011 2012 2013
3M 84.24 57.55 83.09 86.75 83.76 94.19
Alcoa 36.46 11.36 16.47 15.82 8.94 8.88
American Express
52.09 19.20 40.81 43.30 48.30 58.33
AT&T 41.51 28.74 28.41 29.68 30.46 34.39
Bank of America
41.53 13.92 15.24 13.85 5.75 12.05
Boeing 87.57 42.80 55.72 66.15 74.70 76.55
Caterpillar 72.56 44.91 57.65 94.38 92.77 92.95
Chevron 93.96 74.23 78.20 91.66 108.7 110.3
Cisco Systems 27.00 16.41 24.11 20.45 18.55 20.12
Coca-Cola 30.73 22.70 28.58 32.94 35.08 36.99
DuPont 44.15 25.42 33.98 50.05 46.58 45.95
ExxonMobil 94.15 80.06 68.72 73.72 85.97 87.79
General Electric 37.10 16.51 15.22 18.49 18.23 21.51
Hewlett-Packard
50.48 36.25 51.54 42.22 26.32 14.83
Home Depot 27.13 23.07 29.15 35.20 42.41 63.57
Company 2008 2009 2010 2011 2012 2013
Intel 26.28 14.69 20.79 21.01 24.62 21.15
IBM 108.9 83.89 131.2 147.2 186.7 194.1
Johnson & Johnson
66.56 60.13 64.71 62.63 65.59 71.02
JPMorgan Chase
43.55 31.19 41.79 43.00 34.06 44.98
McDonald’s 59.48 62.38 62.63 77.10 101.3 89.4
Merck 58.15 30.46 36.82 36.29 37.88 41.86
Microsoft 35.79 19.53 30.62 28.05 26.55 27.25
Pfizer 22.76 17.88 18.27 17.70 21.86 25.53
Procter & Gamble
73.59 61.69 61.11 64.39 66.30 68.65
Travelers 53.66 45.26 50.15 56.09 60.11 73.09
UnitedHealth 57.19 26.70 31.38 36.38 51.24 54.88
United Technologies
76.64 53.46 70.21 79.19 74.91 83.43
Verizon 40.84 31.88 31.21 36.06 40.28 44.49
Wal-Mart 47.41 55.98 53.74 54.23 59.97 68.93
Walt Disney 32.32 22.76 32.50 37.74 37.97 50.80
Answer the Conclusion questions at the bottom of your sheet.
Last SlideViewed
ForwardBackEnd ShowResourcesTitle Page Table of Contents
Copyright © 2013 N.S.
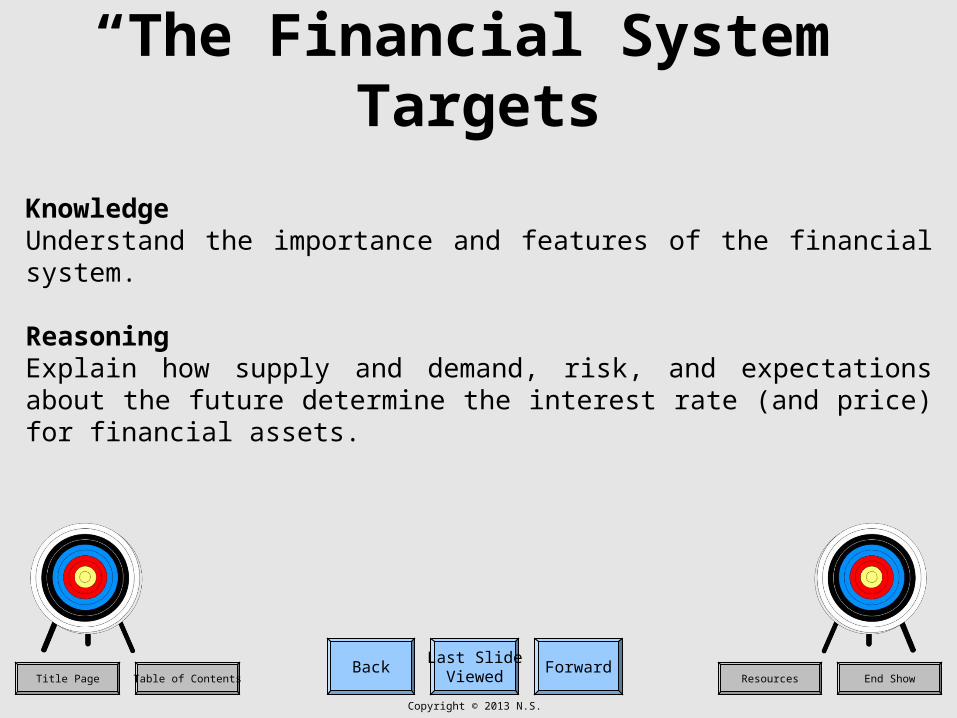
“The Financial System” Targets
KnowledgeUnderstand the importance and features of the financial system.
ReasoningExplain how supply and demand, risk, and expectations about the future determine the interest rate (and price) for financial assets.
Last SlideViewed
ForwardBackEnd ShowResourcesTitle Page Table of Contents
Copyright © 2013 N.S.
Basics of the Financial System
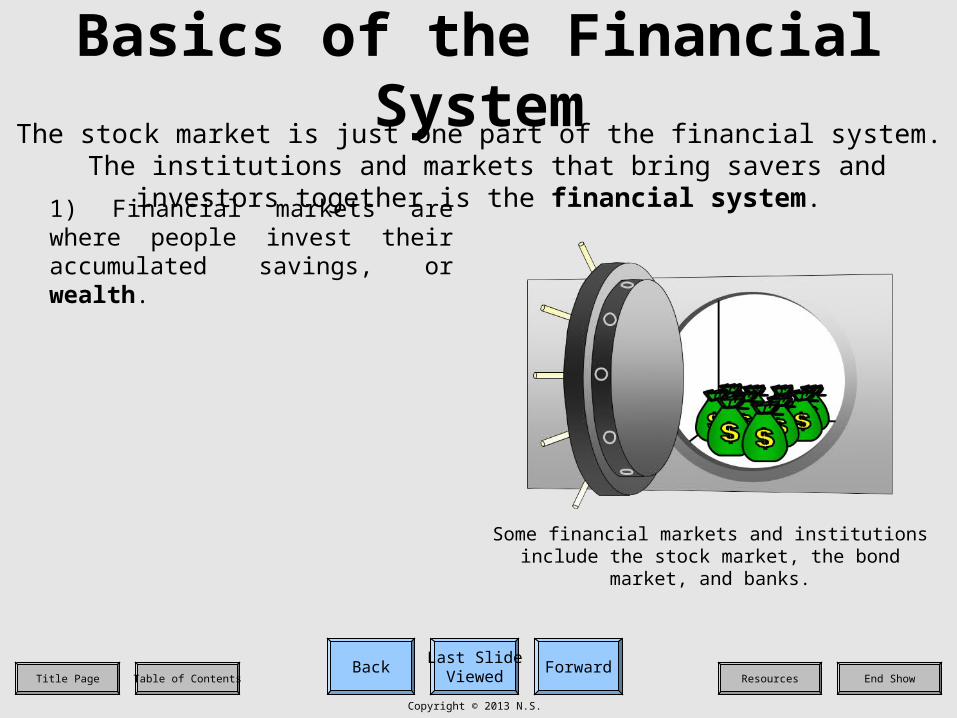
The stock market is just one part of the financial system. The institutions and markets that bring savers and investors together is the financial system.
Last SlideViewed
ForwardBackEnd ShowResourcesTitle Page Table of Contents
Copyright © 2013 N.S.
Basics of the Financial System
The stock market is just one part of the financial system. The institutions and markets that bring savers and investors together is the financial system.
1) Financial markets are where people invest their accumulated savings, or wealth.
Some financial markets and institutions include the stock market, the bond market, and banks.
Last SlideViewed
ForwardBackEnd ShowResourcesTitle Page Table of Contents
Copyright © 2013 N.S.
Basics of the Financial System
The stock market is just one part of the financial system. The institutions and markets that bring savers and investors together is the financial system.
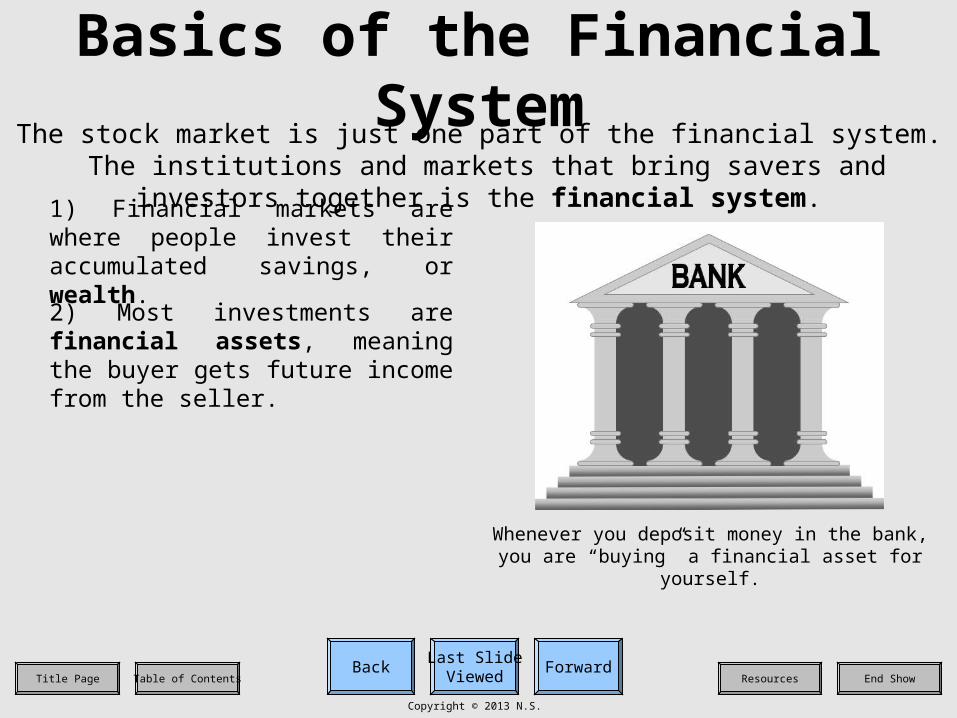
1) Financial markets are where people invest their accumulated savings, or wealth.
Whenever you deposit money in the bank, you are “buying” a financial asset for yourself.
2) Most investments are financial assets, meaning the buyer gets future income from the seller.
Last SlideViewed
ForwardBackEnd ShowResourcesTitle Page Table of Contents
Copyright © 2013 N.S.
Basics of the Financial System
The stock market is just one part of the financial system. The institutions and markets that bring savers and investors together is the financial system.
1) Financial markets are where people invest their accumulated savings, or wealth.
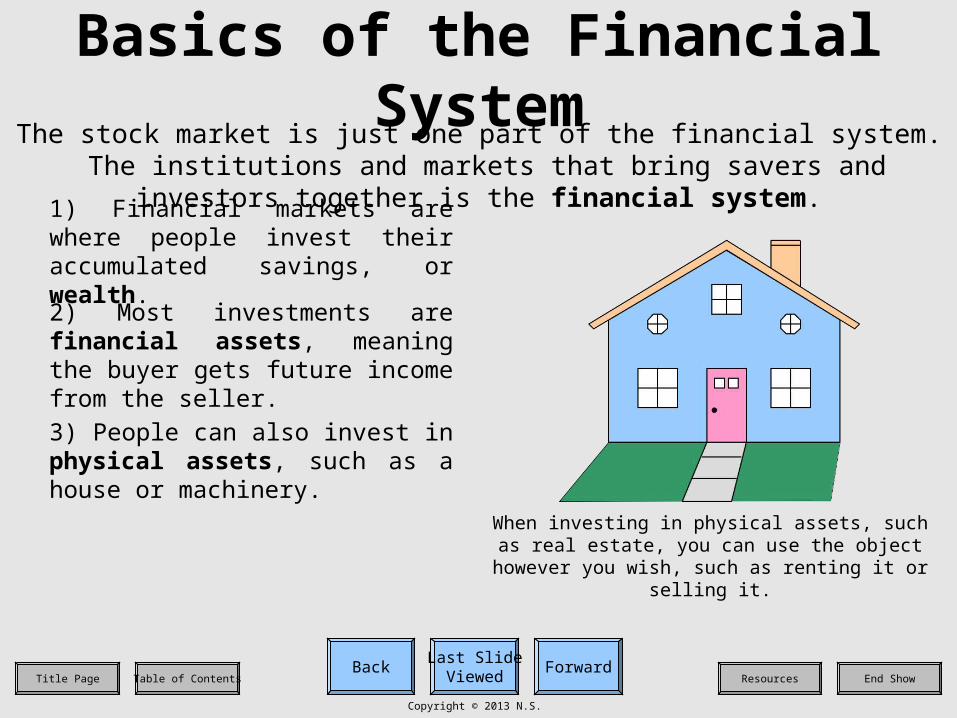
When investing in physical assets, such as real estate, you can use the object however you wish,
such as renting it or selling it.
2) Most investments are financial assets, meaning the buyer gets future income from the seller.
3) People can also invest in physical assets, such as a house or machinery.
Last SlideViewed
ForwardBackEnd ShowResourcesTitle Page Table of Contents
Copyright © 2013 N.S.
Basics of the Financial System
The stock market is just one part of the financial system. The institutions and markets that bring savers and investors together is the financial system.
1) Financial markets are where people invest their accumulated savings, or wealth.
2) Most investments are financial assets, meaning the buyer gets future income from the seller.
3) People can also invest in physical assets, such as a house or machinery.
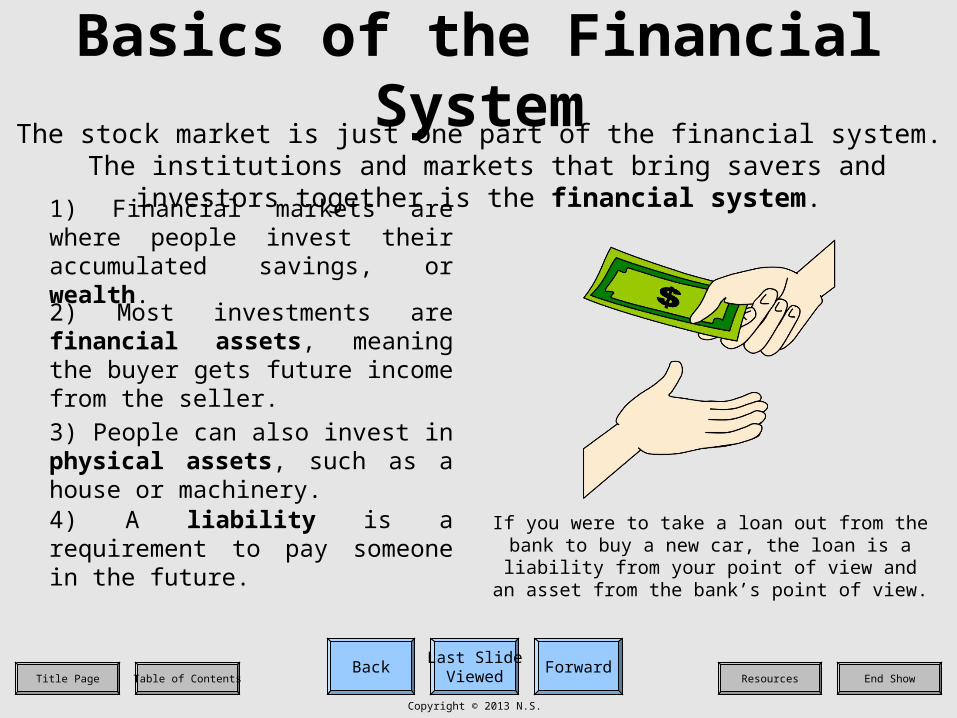
4) A liability is a requirement to pay someone in the future.
If you were to take a loan out from the bank to buy a new car, the loan is a liability from your point of view
and an asset from the bank’s point of view.
Last SlideViewed
ForwardBackEnd ShowResourcesTitle Page Table of Contents
Copyright © 2013 N.S.
Functions of the Financial System
The purpose of the financial system is to reduce transaction costs, reduce financial risk, and provide liquidity.
Last SlideViewed
ForwardBackEnd ShowResourcesTitle Page Table of Contents
Copyright © 2013 N.S.
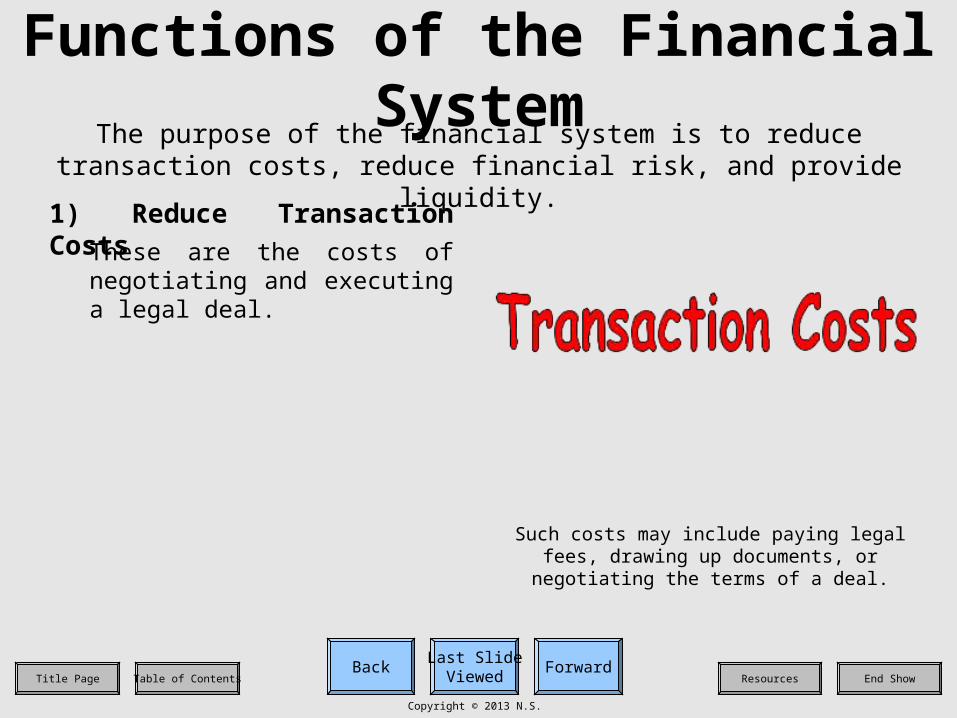
Functions of the Financial System
The purpose of the financial system is to reduce transaction costs, reduce financial risk, and provide liquidity.
1) Reduce Transaction CostsThese are the costs of negotiating and executing a legal deal.
Such costs may include paying legal fees, drawing up documents, or negotiating the terms of a deal.

Last SlideViewed
ForwardBackEnd ShowResourcesTitle Page Table of Contents
Copyright © 2013 N.S.
Functions of the Financial System
The purpose of the financial system is to reduce transaction costs, reduce financial risk, and provide liquidity.
1) Reduce Transaction CostsThese are the costs of negotiating and executing a legal deal.
People are generally risk-averse, meaning they prefer lower returns on a safe investment than the
higher returns on a riskier investment.
2) Reduce Financial RiskPeople are more willing to make investments if risk is minimized.
Last SlideViewed
ForwardBackEnd ShowResourcesTitle Page Table of Contents
Copyright © 2013 N.S.
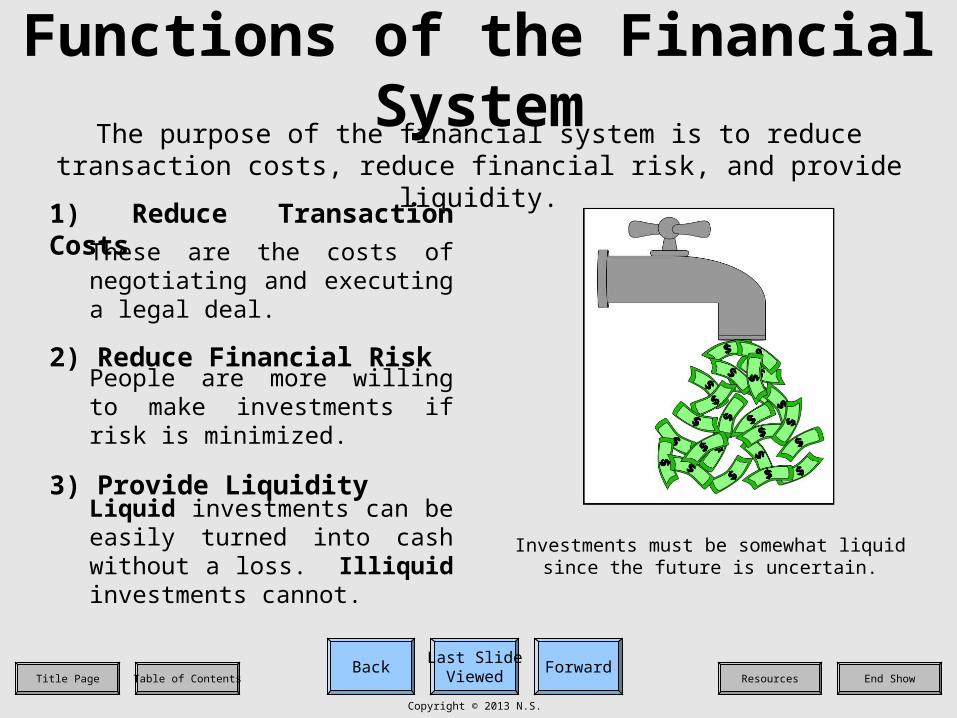
Functions of the Financial System
The purpose of the financial system is to reduce transaction costs, reduce financial risk, and provide liquidity.
1) Reduce Transaction CostsThese are the costs of negotiating and executing a legal deal.
2) Reduce Financial RiskPeople are more willing to make investments if risk is minimized.
3) Provide LiquidityLiquid investments can be easily turned into cash without a loss. Illiquid investments cannot.
Investments must be somewhat liquid since the future is uncertain.
Last SlideViewed
ForwardBackEnd ShowResourcesTitle Page Table of Contents
Copyright © 2013 N.S.
Types of Financial AssetsFinancial assets have value because of a contractual agreement between two
parties. (They have no physical value, like physical assets.)

Last SlideViewed
ForwardBackEnd ShowResourcesTitle Page Table of Contents
Copyright © 2013 N.S.
Types of Financial AssetsFinancial assets have value because of a contractual agreement between two
parties. (They have no physical value, like physical assets.)
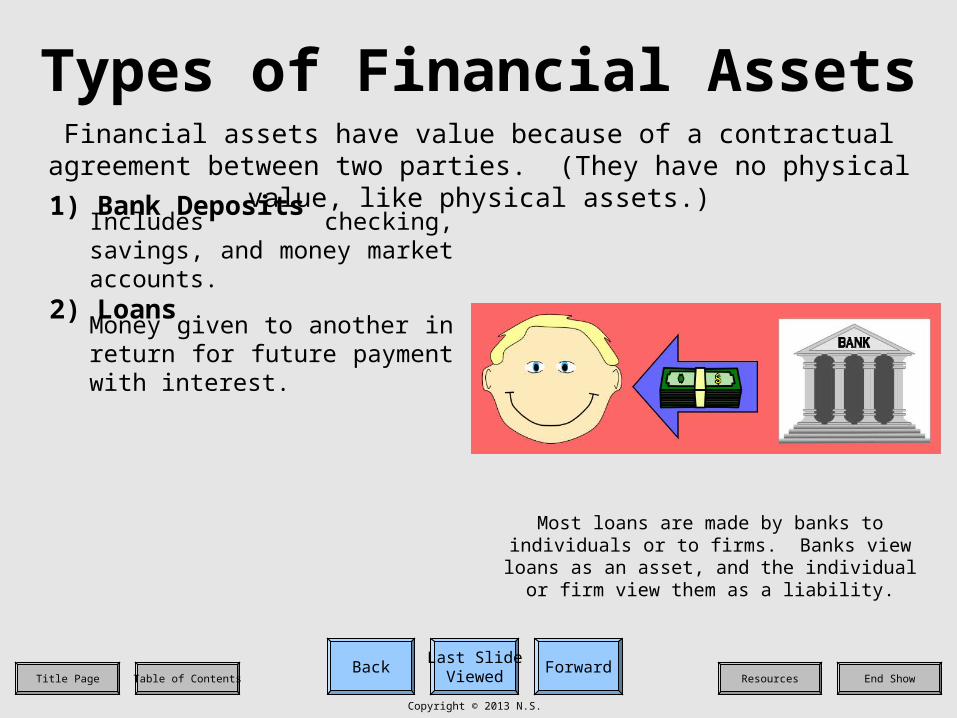
1) Bank DepositsIncludes checking, savings, and money market accounts.
Bank deposits are viewed as an asset by the depositor, and they are viewed as a liability by the
bank.
Last SlideViewed
ForwardBackEnd ShowResourcesTitle Page Table of Contents
Copyright © 2013 N.S.
Types of Financial AssetsFinancial assets have value because of a contractual agreement between two
parties. (They have no physical value, like physical assets.)
1) Bank DepositsIncludes checking, savings, and money market accounts.
Most loans are made by banks to individuals or to firms. Banks view loans as an asset, and the
individual or firm view them as a liability.
2) LoansMoney given to another in return for future payment with interest.
Last SlideViewed
ForwardBackEnd ShowResourcesTitle Page Table of Contents
Copyright © 2013 N.S.
Types of Financial AssetsFinancial assets have value because of a contractual agreement between two
parties. (They have no physical value, like physical assets.)
1) Bank DepositsIncludes checking, savings, and money market accounts.
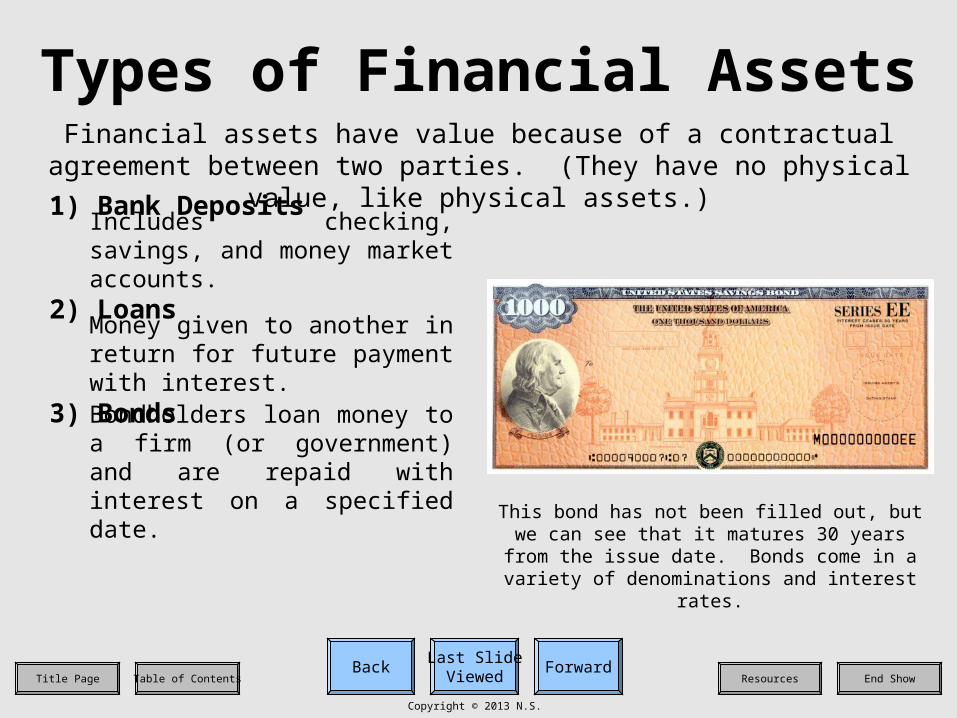
This bond has not been filled out, but we can see that it matures 30 years from the issue date. Bonds come
in a variety of denominations and interest rates.
2) LoansMoney given to another in return for future payment with interest.
3) BondsBondholders loan money to a firm (or government) and are repaid with interest on a specified date.
Last SlideViewed
ForwardBackEnd ShowResourcesTitle Page Table of Contents
Copyright © 2013 N.S.
Types of Financial AssetsFinancial assets have value because of a contractual agreement between two
parties. (They have no physical value, like physical assets.)
1) Bank DepositsIncludes checking, savings, and money market accounts.
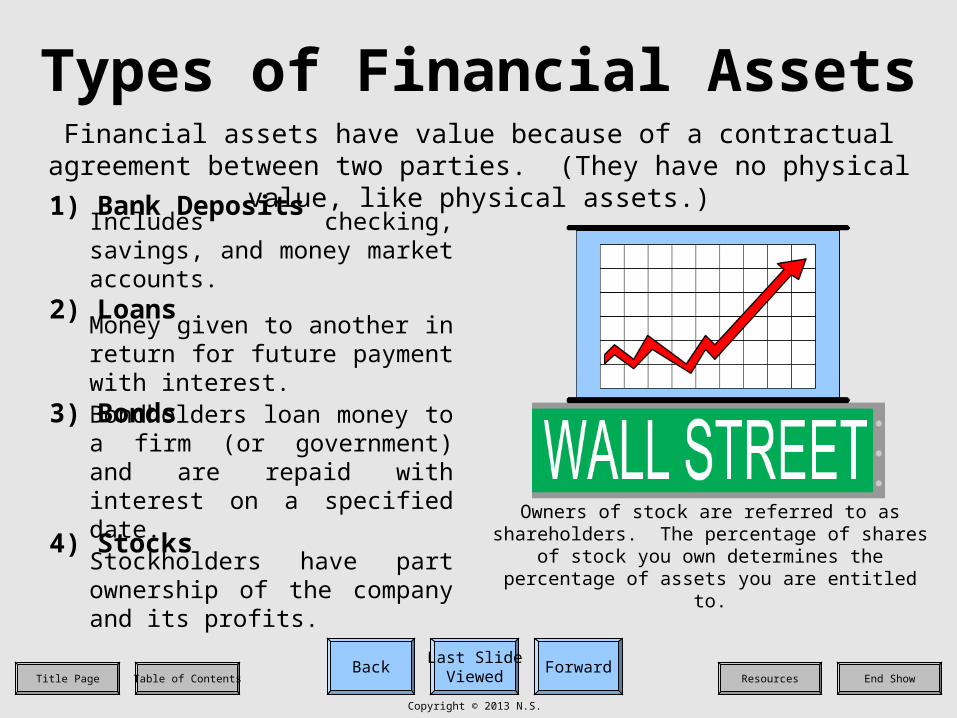
Owners of stock are referred to as shareholders. The percentage of shares of stock you own
determines the percentage of assets you are entitled to.
2) LoansMoney given to another in return for future payment with interest.
3) BondsBondholders loan money to a firm (or government) and are repaid with interest on a specified date.
4) StocksStockholders have part ownership of the company and its profits.

Last SlideViewed
ForwardBackEnd ShowResourcesTitle Page Table of Contents
Copyright © 2013 N.S.
Financial IntermediariesFinancial intermediaries are institutions that gather together money from
many people and transform those funds into financial assets.
Last SlideViewed
ForwardBackEnd ShowResourcesTitle Page Table of Contents
Copyright © 2013 N.S.
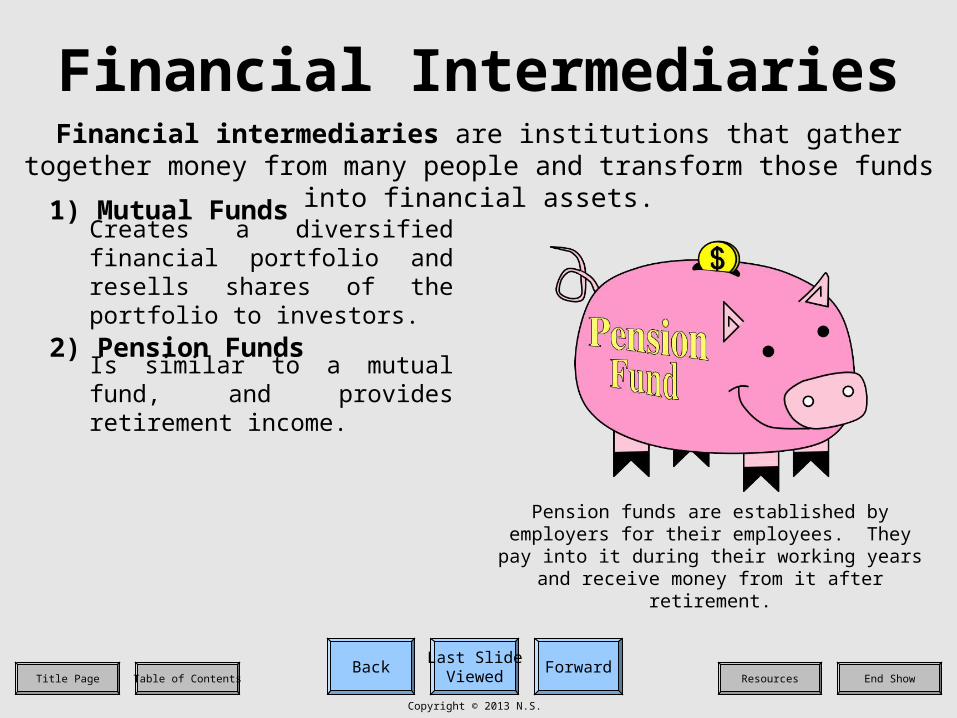
Financial IntermediariesFinancial intermediaries are institutions that gather together money from
many people and transform those funds into financial assets.
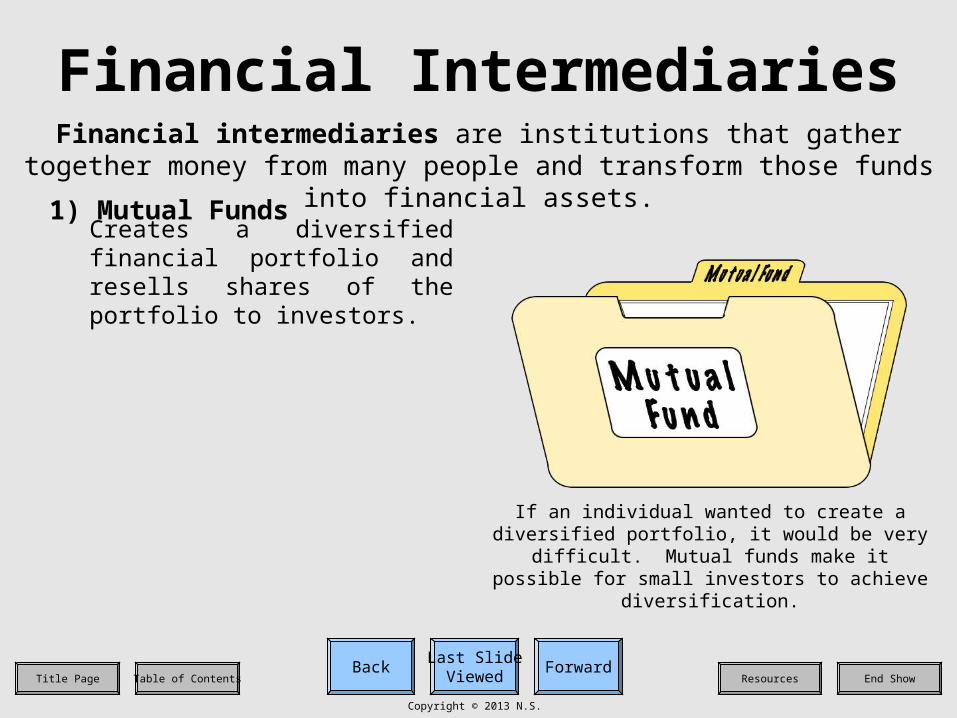
1) Mutual FundsCreates a diversified financial portfolio and resells shares of the portfolio to investors.
If an individual wanted to create a diversified portfolio, it would be very difficult. Mutual funds make it possible for small investors to achieve
diversification.
Last SlideViewed
ForwardBackEnd ShowResourcesTitle Page Table of Contents
Copyright © 2013 N.S.
Financial IntermediariesFinancial intermediaries are institutions that gather together money from
many people and transform those funds into financial assets.
1) Mutual FundsCreates a diversified financial portfolio and resells shares of the portfolio to investors.
Pension funds are established by employers for their employees. They pay into it during their working years and receive money from it after retirement.
2) Pension FundsIs similar to a mutual fund, and provides retirement income.
Last SlideViewed
ForwardBackEnd ShowResourcesTitle Page Table of Contents
Copyright © 2013 N.S.
Financial IntermediariesFinancial intermediaries are institutions that gather together money from
many people and transform those funds into financial assets.
1) Mutual FundsCreates a diversified financial portfolio and resells shares of the portfolio to investors.
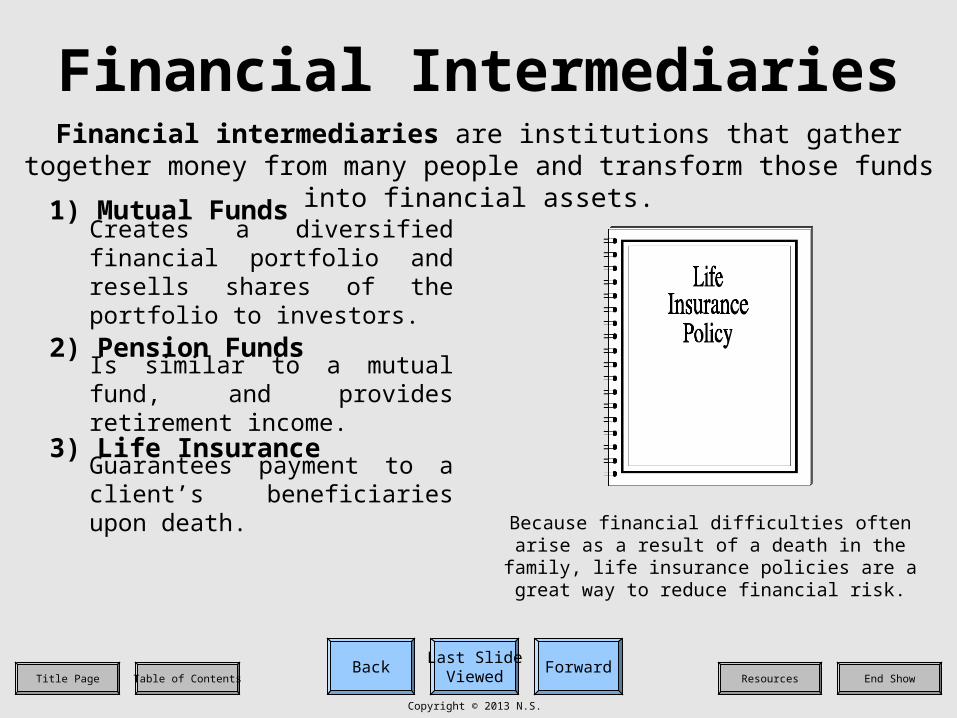
Because financial difficulties often arise as a result of a death in the family, life insurance policies are a
great way to reduce financial risk.
2) Pension FundsIs similar to a mutual fund, and provides retirement income.
3) Life InsuranceGuarantees payment to a client’s beneficiaries upon death.
Last SlideViewed
ForwardBackEnd ShowResourcesTitle Page Table of Contents
Copyright © 2013 N.S.
Financial IntermediariesFinancial intermediaries are institutions that gather together money from
many people and transform those funds into financial assets.
1) Mutual FundsCreates a diversified financial portfolio and resells shares of the portfolio to investors.
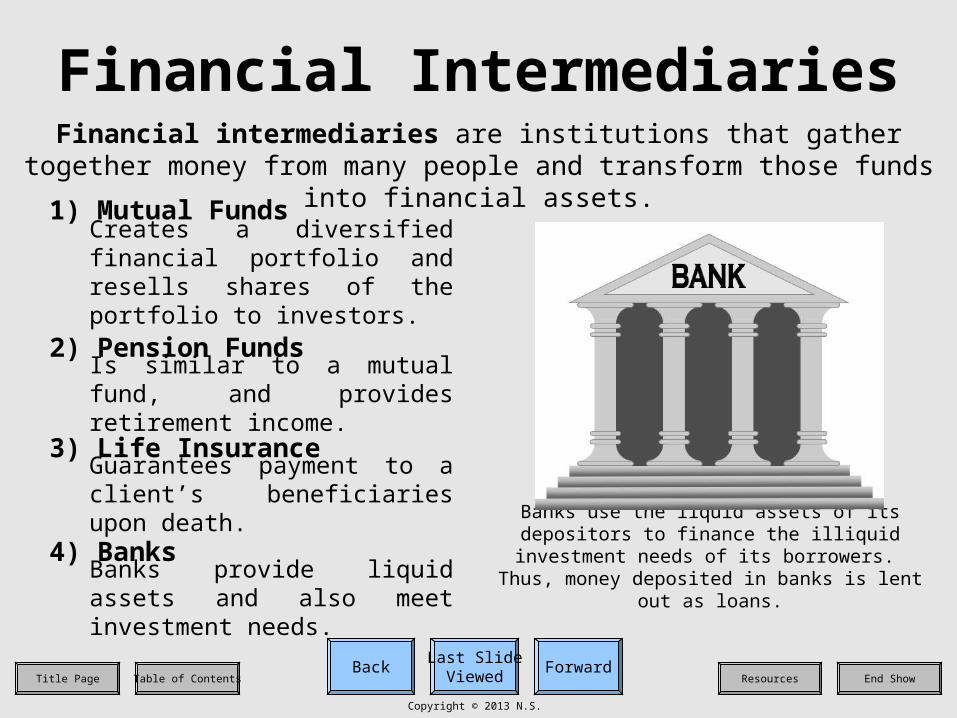
Banks use the liquid assets of its depositors to finance the illiquid investment needs of its borrowers. Thus, money deposited in banks is lent out as loans.
2) Pension FundsIs similar to a mutual fund, and provides retirement income.
3) Life InsuranceGuarantees payment to a client’s beneficiaries upon death.
4) BanksBanks provide liquid assets and also meet investment needs.
Last SlideViewed
ForwardBackEnd ShowResourcesTitle Page Table of Contents
Copyright © 2013 N.S.
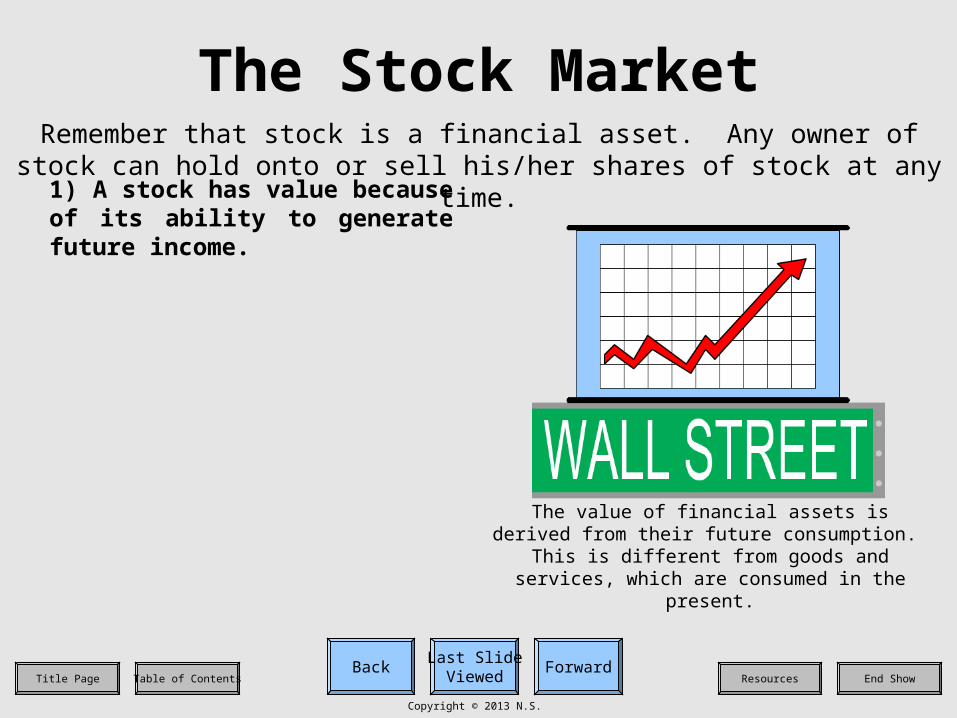
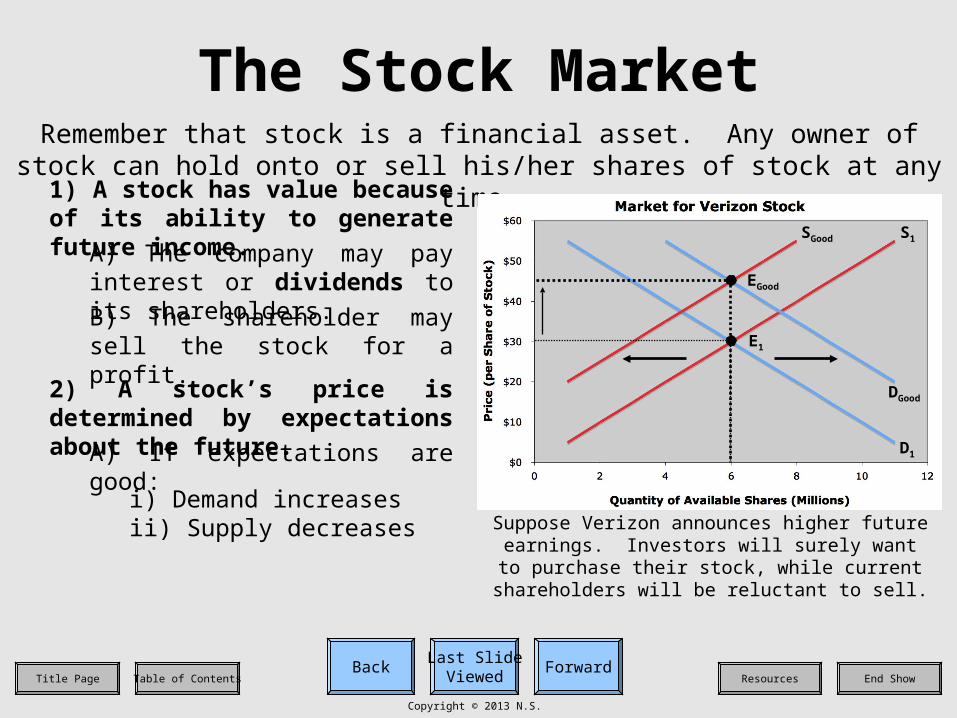
The Stock MarketRemember that stock is a financial asset. Any owner of stock can hold onto or
sell his/her shares of stock at any time.
Last SlideViewed
ForwardBackEnd ShowResourcesTitle Page Table of Contents
Copyright © 2013 N.S.
The Stock MarketRemember that stock is a financial asset. Any owner of stock can hold onto or
sell his/her shares of stock at any time.
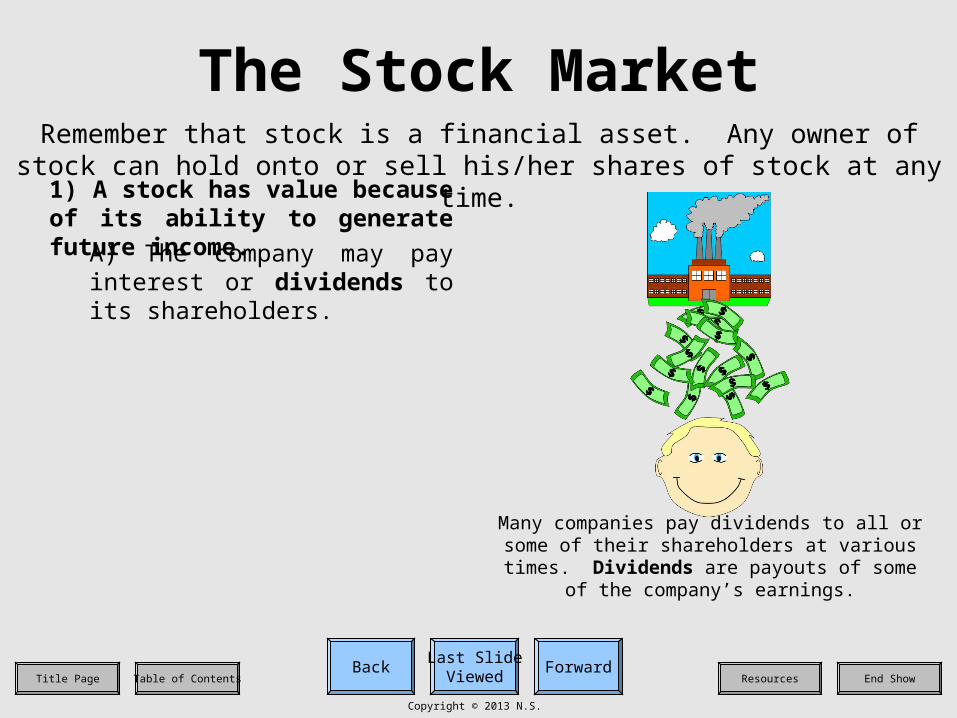
1) A stock has value because of its ability to generate future income.
The value of financial assets is derived from their future consumption. This is different from goods and
services, which are consumed in the present.
Last SlideViewed
ForwardBackEnd ShowResourcesTitle Page Table of Contents
Copyright © 2013 N.S.
The Stock MarketRemember that stock is a financial asset. Any owner of stock can hold onto or
sell his/her shares of stock at any time.
1) A stock has value because of its ability to generate future income.
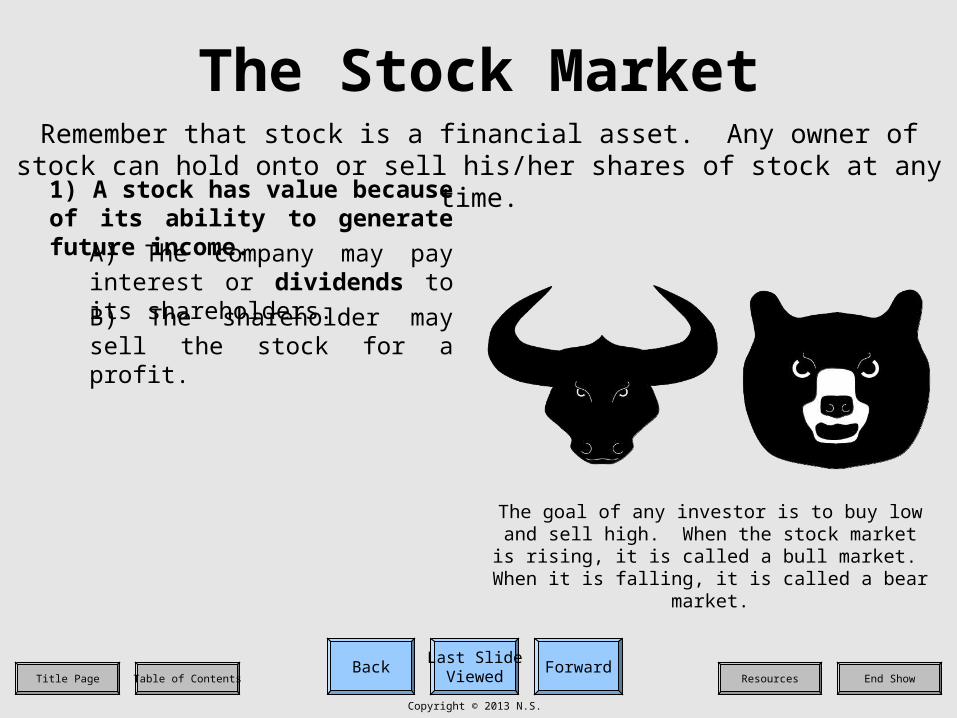
A) The company may pay interest or dividends to its shareholders.
Many companies pay dividends to all or some of their shareholders at various times. Dividends are payouts of some of the company’s earnings.
Last SlideViewed
ForwardBackEnd ShowResourcesTitle Page Table of Contents
Copyright © 2013 N.S.
The Stock MarketRemember that stock is a financial asset. Any owner of stock can hold onto or
sell his/her shares of stock at any time.
1) A stock has value because of its ability to generate future income.
A) The company may pay interest or dividends to its shareholders.
The goal of any investor is to buy low and sell high. When the stock market is rising, it is called a bull
market. When it is falling, it is called a bear market.
B) The shareholder may sell the stock for a profit.
Last SlideViewed
ForwardBackEnd ShowResourcesTitle Page Table of Contents
Copyright © 2013 N.S.
D1
S1
The Stock MarketRemember that stock is a financial asset. Any owner of stock can hold onto or
sell his/her shares of stock at any time.
1) A stock has value because of its ability to generate future income.
A) The company may pay interest or dividends to its shareholders.
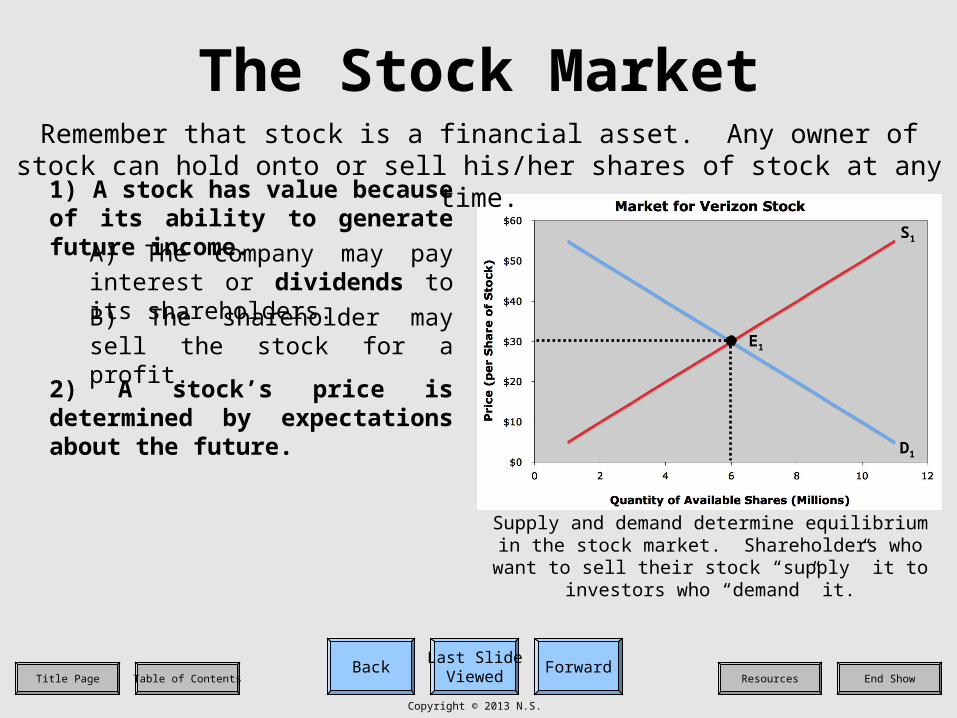
Supply and demand determine equilibrium in the stock market. Shareholders who want to sell their
stock “supply” it to investors who “demand” it.
B) The shareholder may sell the stock for a profit.
2) A stock’s price is determined by expectations about the future.
E1
Last SlideViewed
ForwardBackEnd ShowResourcesTitle Page Table of Contents
Copyright © 2013 N.S.
D1
S1
The Stock MarketRemember that stock is a financial asset. Any owner of stock can hold onto or
sell his/her shares of stock at any time.
1) A stock has value because of its ability to generate future income.
A) The company may pay interest or dividends to its shareholders.
Suppose Verizon announces higher future earnings. Investors will surely want to purchase their stock, while current shareholders will be reluctant to sell.
B) The shareholder may sell the stock for a profit.
D1
S1
DGood
SGood
2) A stock’s price is determined by expectations about the future.
A) If expectations are good:i) Demand increasesii) Supply decreases
EGood
E1

Last SlideViewed
ForwardBackEnd ShowResourcesTitle Page Table of Contents
Copyright © 2013 N.S.
The Stock MarketRemember that stock is a financial asset. Any owner of stock can hold onto or
sell his/her shares of stock at any time.
1) A stock has value because of its ability to generate future income.
A) The company may pay interest or dividends to its shareholders.
Suppose Verizon announces bankruptcy. Investors will purchase other stocks, while current
shareholders will sell in order to cut their losses.
B) The shareholder may sell the stock for a profit.
2) A stock’s price is determined by expectations about the future.
A) If expectations are good:i) Demand increasesii) Supply decreases
B) If expectations are bad:i) Demand decreasesii) Supply increases
D1
S1
D1
S1
DBad
SBad
EBad
E1
Last SlideViewed
ForwardBackEnd ShowResourcesTitle Page Table of Contents
Copyright © 2013 N.S.
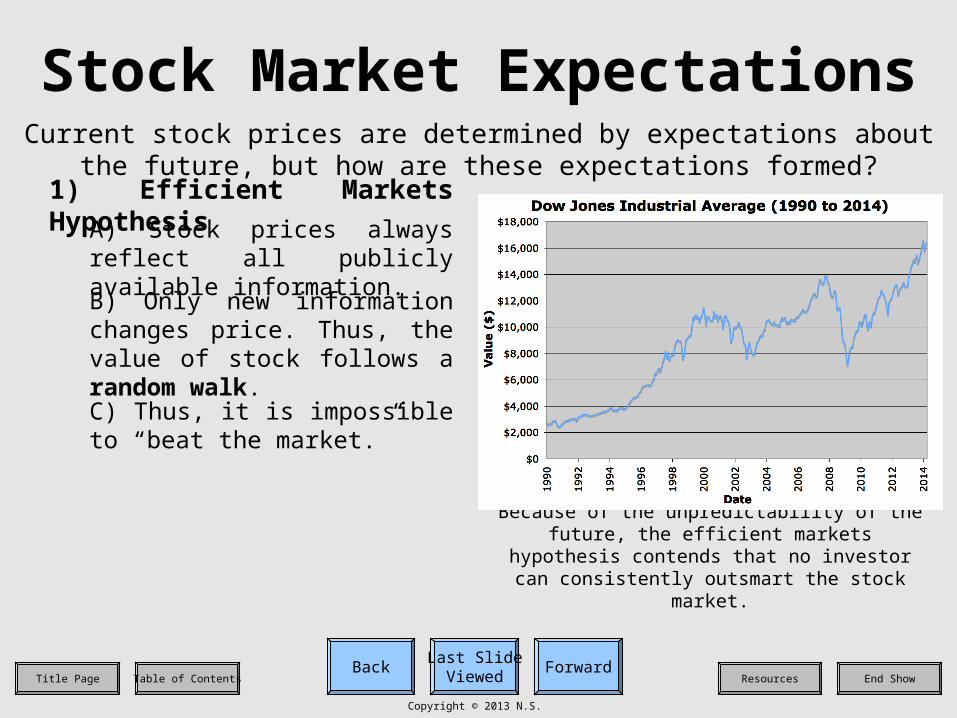
Stock Market ExpectationsCurrent stock prices are determined by expectations about the future, but how
are these expectations formed?
Last SlideViewed
ForwardBackEnd ShowResourcesTitle Page Table of Contents
Copyright © 2013 N.S.
Stock Market ExpectationsCurrent stock prices are determined by expectations about the future, but how
are these expectations formed?
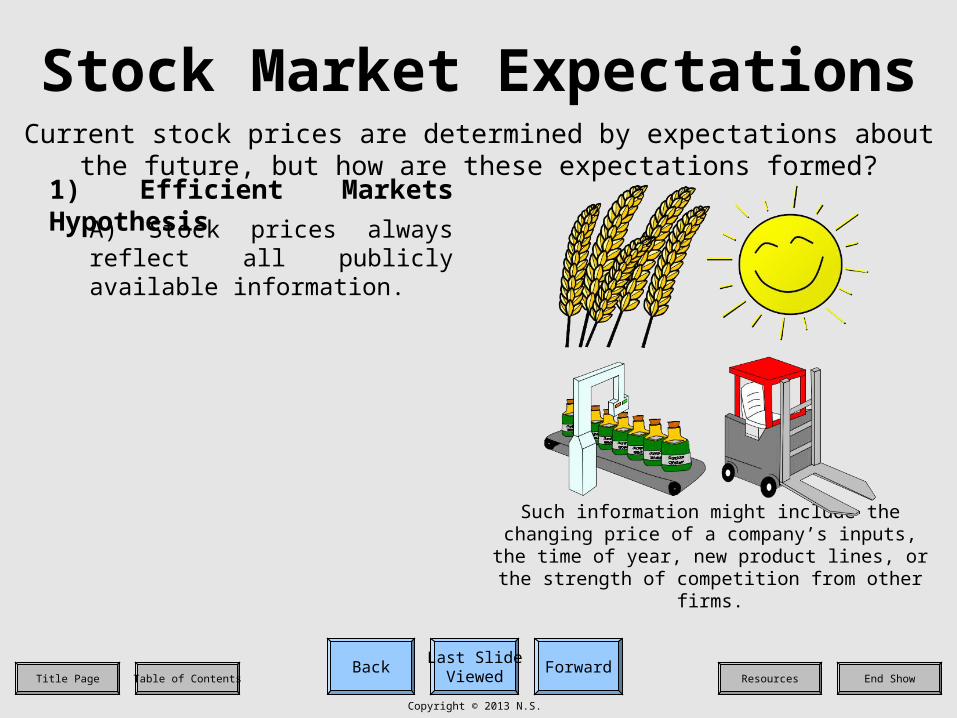
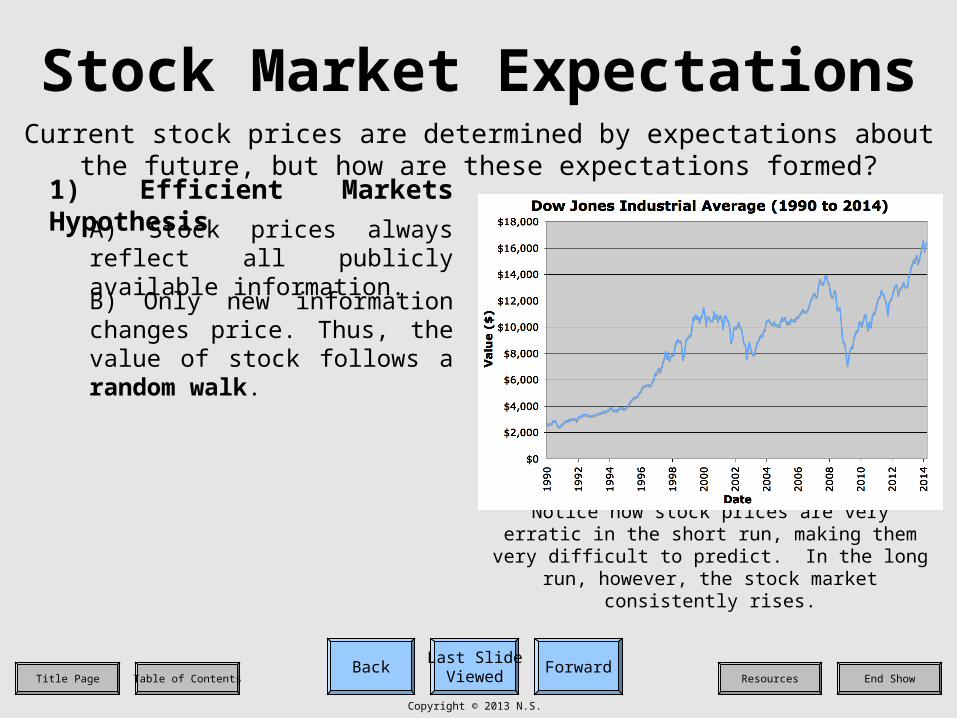
1) Efficient Markets Hypothesis
A) Stock prices always reflect all publicly available information.
Such information might include the changing price of a company’s inputs, the time of year, new product
lines, or the strength of competition from other firms.
Last SlideViewed
ForwardBackEnd ShowResourcesTitle Page Table of Contents
Copyright © 2013 N.S.
Stock Market ExpectationsCurrent stock prices are determined by expectations about the future, but how
are these expectations formed?
1) Efficient Markets Hypothesis
A) Stock prices always reflect all publicly available information.
Notice how stock prices are very erratic in the short run, making them very difficult to predict. In the long
run, however, the stock market consistently rises.
B) Only new information changes price. Thus, the value of stock follows a random walk.
Last SlideViewed
ForwardBackEnd ShowResourcesTitle Page Table of Contents
Copyright © 2013 N.S.
Stock Market ExpectationsCurrent stock prices are determined by expectations about the future, but how
are these expectations formed?
1) Efficient Markets Hypothesis
A) Stock prices always reflect all publicly available information.
Because of the unpredictability of the future, the efficient markets hypothesis contends that no
investor can consistently outsmart the stock market.
B) Only new information changes price. Thus, the value of stock follows a random walk.
C) Thus, it is impossible to “beat the market.”
Last SlideViewed
ForwardBackEnd ShowResourcesTitle Page Table of Contents
Copyright © 2013 N.S.
Stock Market ExpectationsCurrent stock prices are determined by expectations about the future, but how
are these expectations formed?
1) Efficient Markets Hypothesis
A) Stock prices always reflect all publicly available information.
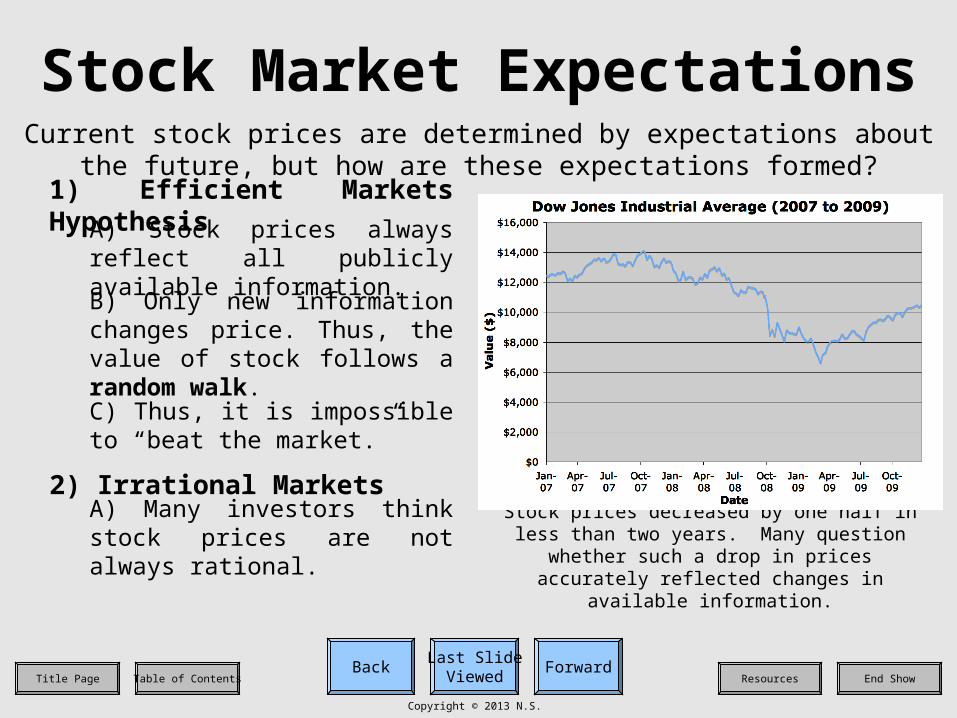
Stock prices decreased by one half in less than two years. Many question whether such a drop in prices accurately reflected changes in available information.
B) Only new information changes price. Thus, the value of stock follows a random walk.
C) Thus, it is impossible to “beat the market.”
2) Irrational Markets
A) Many investors think stock prices are not always rational.
Last SlideViewed
ForwardBackEnd ShowResourcesTitle Page Table of Contents
Copyright © 2013 N.S.
Stock Market ExpectationsCurrent stock prices are determined by expectations about the future, but how
are these expectations formed?
1) Efficient Markets Hypothesis
A) Stock prices always reflect all publicly available information.
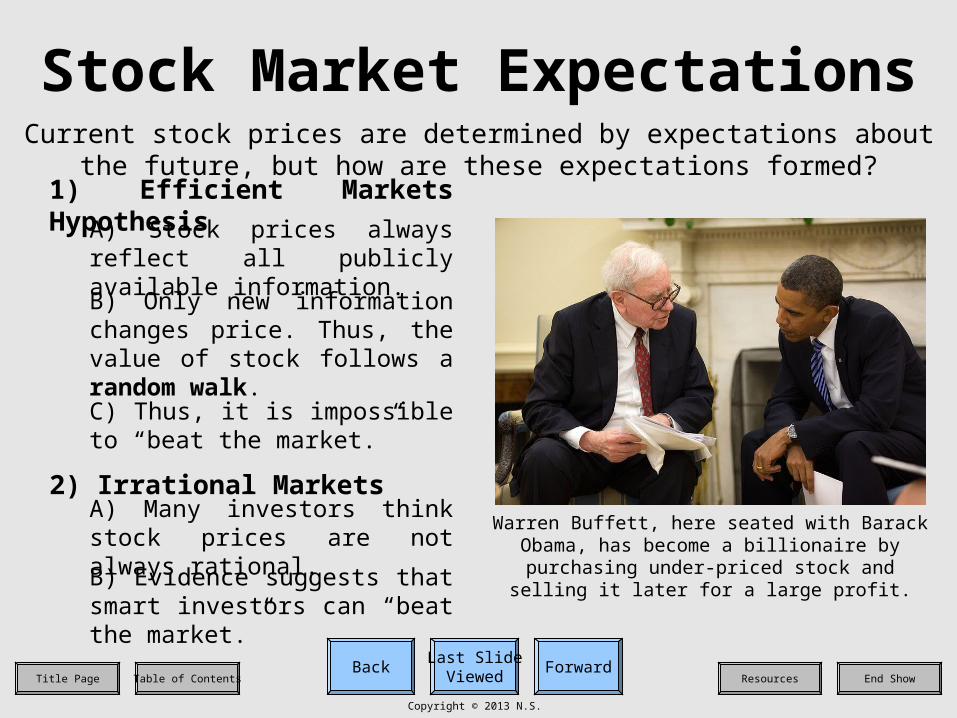
Warren Buffett, here seated with Barack Obama, has become a billionaire by purchasing under-priced
stock and selling it later for a large profit.
B) Only new information changes price. Thus, the value of stock follows a random walk.
C) Thus, it is impossible to “beat the market.”
2) Irrational Markets
A) Many investors think stock prices are not always rational.
B) Evidence suggests that smart investors can “beat the market.”
Last SlideViewed
ForwardBackEnd ShowResourcesTitle Page Table of Contents
Copyright © 2013 N.S.
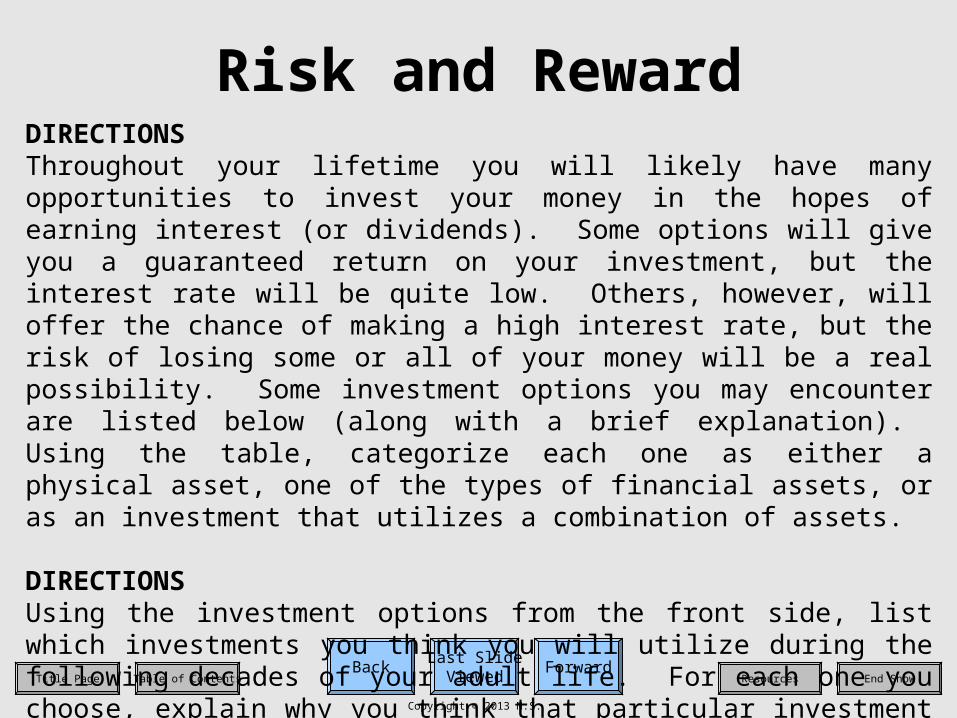
Risk and RewardDIRECTIONSThroughout your lifetime you will likely have many opportunities to invest your money in the hopes of earning interest (or dividends). Some options will give you a guaranteed return on your investment, but the interest rate will be quite low. Others, however, will offer the chance of making a high interest rate, but the risk of losing some or all of your money will be a real possibility. Some investment options you may encounter are listed below (along with a brief explanation). Using the table, categorize each one as either a physical asset, one of the types of financial assets, or as an investment that utilizes a combination of assets.
DIRECTIONSUsing the investment options from the front side, list which investments you think you will utilize during the following decades of your adult life. For each one you choose, explain why you think that particular investment will be a good choice for that time in your life.
Last SlideViewed
ForwardBackEnd ShowResourcesTitle Page Table of Contents
Copyright © 2013 N.S.
“The Financial System” Targets
KnowledgeUnderstand the importance and features of the financial system.
ReasoningExplain how supply and demand, risk, and expectations about the future determine the interest rate (and price) for financial assets.
Last SlideViewed
ForwardBackEnd ShowResourcesTitle Page Table of Contents
Copyright © 2013 N.S.
Resources
http://commons.wikimedia.org/wiki/File:EE_Savings_Bond.jpg - bond notehttp://finance.yahoo.com/q/hp?s=%5EDJI+Historical+Prices - Dow Jones Industrial datahttp://en.wikipedia.org/wiki/File:Buffett_%26_Obama.jpg - Picture of Warren Buffett with Barack Obama