Beggar-Thy-Neighbor or Beneficial Spillover: Effect of...
25
Beggar-Thy-Neighbor or Beneficial Spillover: Effect of Exchange Rates on GVC Trade 5 th IMF‐WB‐WTO Joint Trade Research Workshop November 30, 2016 Gee Hee Hong (IMF) (with Kevin Cheng, Dulani Seneviratne, Rachel van Elkan (all IMF)) 1
Transcript of Beggar-Thy-Neighbor or Beneficial Spillover: Effect of...

Beggar-Thy-Neighbor or Beneficial Spillover:Effect of Exchange Rates on GVC Trade
5th IMF‐WB‐WTOJointTradeResearchWorkshopNovember30,2016
GeeHeeHong(IMF)
(withKevinCheng,DulaniSeneviratne,RachelvanElkan(allIMF))
1
Motivation
2
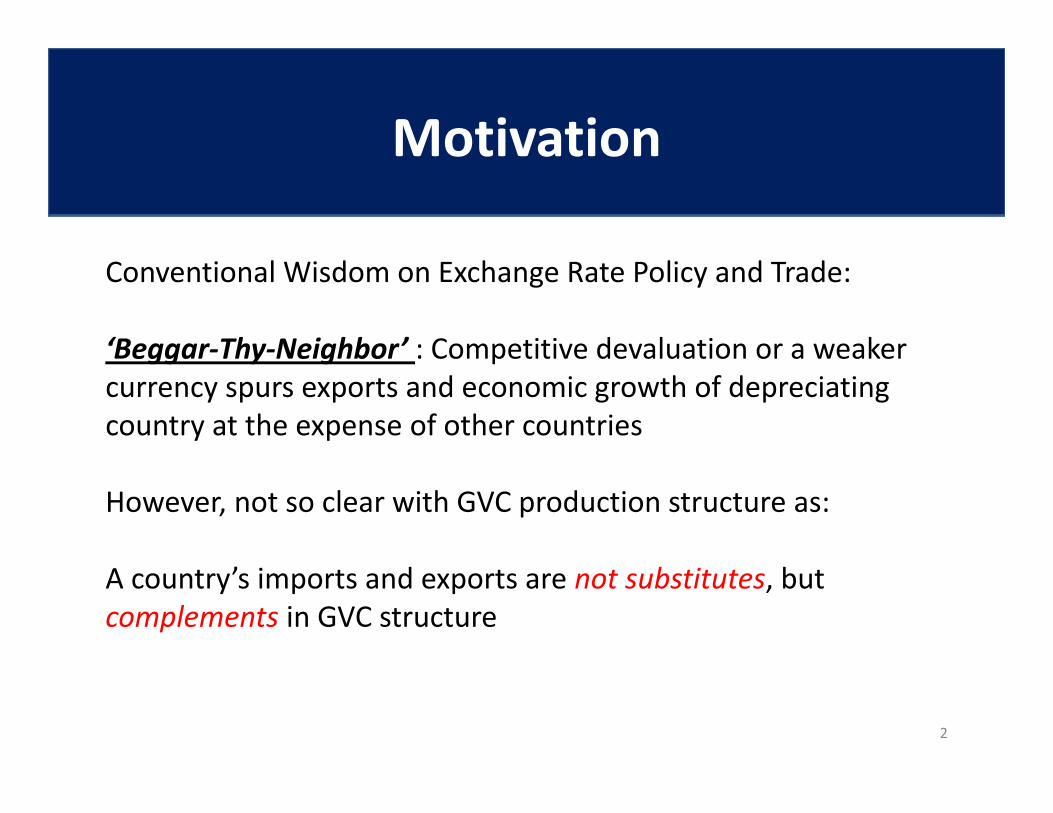
Conventional Wisdom on Exchange Rate Policy and Trade:
‘Beggar-Thy-Neighbor’ : Competitive devaluation or a weaker currency spurs exports and economic growth of depreciating country at the expense of other countries
However, not so clear with GVC production structure as:
A country’s imports and exports are not substitutes, but complements in GVC structure

International Fragmentation of Production Process
3
Main Questions
4
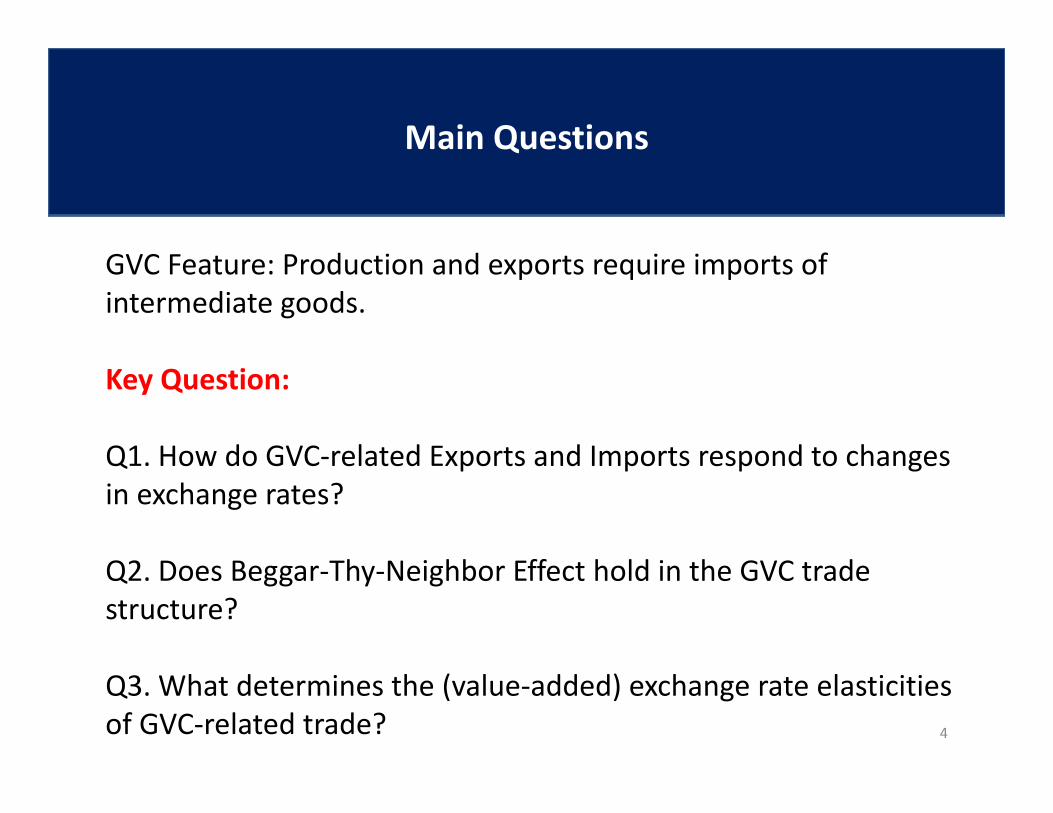
GVC Feature: Production and exports require imports of intermediate goods.
Key Question:
Q1. How do GVC-related Exports and Imports respond to changes in exchange rates?
Q2. Does Beggar-Thy-Neighbor Effect hold in the GVC trade structure?
Q3. What determines the (value-added) exchange rate elasticities of GVC-related trade?
Value-added of this paper
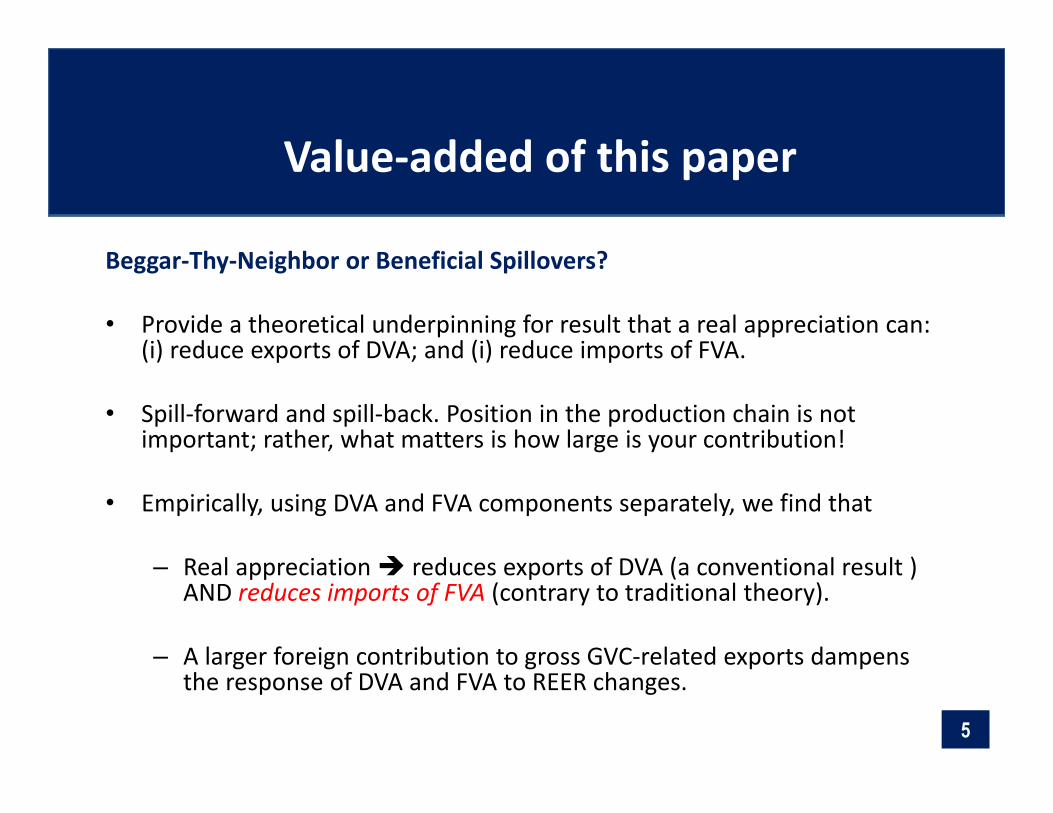
Beggar-Thy-Neighbor or Beneficial Spillovers?
• Provide a theoretical underpinning for result that a real appreciation can: (i) reduce exports of DVA; and (i) reduce imports of FVA.
• Spill-forward and spill-back. Position in the production chain is not important; rather, what matters is how large is your contribution!
• Empirically, using DVA and FVA components separately, we find that
– Real appreciation reduces exports of DVA (a conventional result ) AND reduces imports of FVA (contrary to traditional theory).
– A larger foreign contribution to gross GVC-related exports dampens the response of DVA and FVA to REER changes.
5
Model Set-Up
6
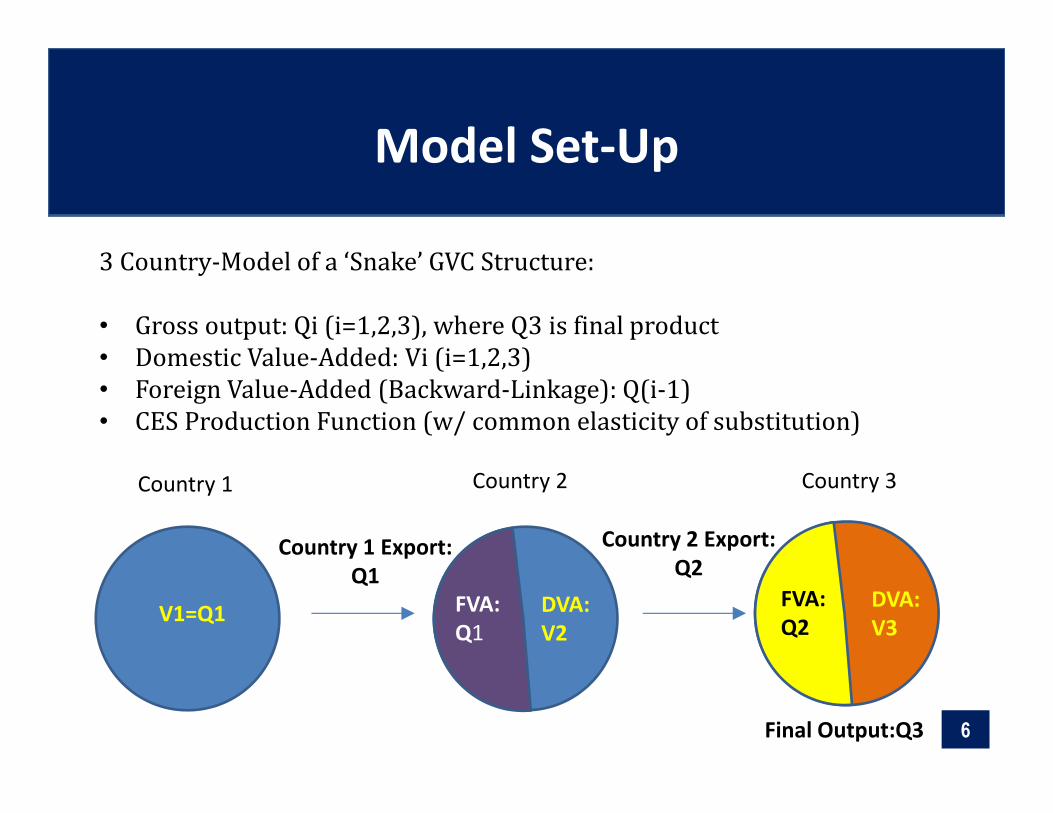
3Country‐Modelofa‘Snake’GVCStructure:
• Grossoutput:Qi(i=1,2,3),whereQ3isfinalproduct• DomesticValue‐Added:Vi(i=1,2,3)• ForeignValue‐Added(Backward‐Linkage):Q(i‐1)• CESProductionFunction(w/commonelasticityofsubstitution)
Country 1 Country 2 Country 3
V1=Q1 FVA:Q1
DVA:V2
Country 2 Export:Q2
Country 1 Export:Q1
FVA:Q2
DVA:V3
Final Output:Q3
Model
7
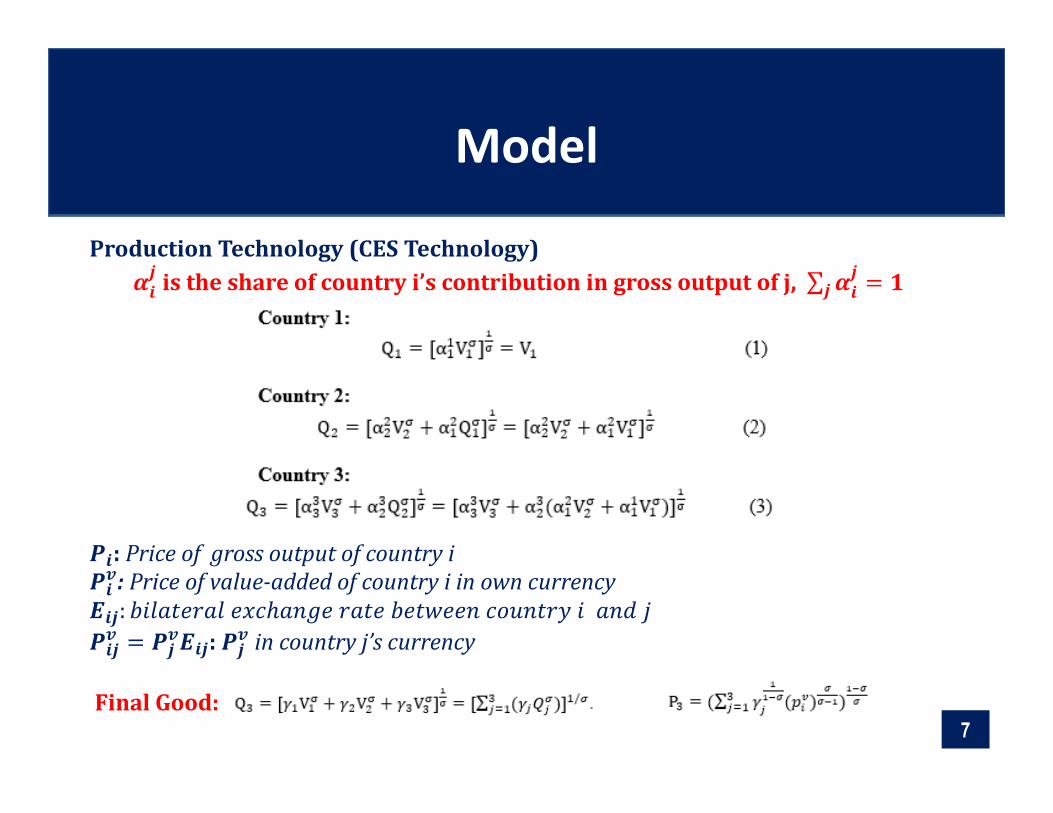
Production Technology (CES Technology) is the share of country i’s contribution in gross output of j, ∑
: Price of gross output of country i: Price of value-added of country i in own currency:
: in country j’s currency
Final Good:
Model: Real Depreciation and DVA
8
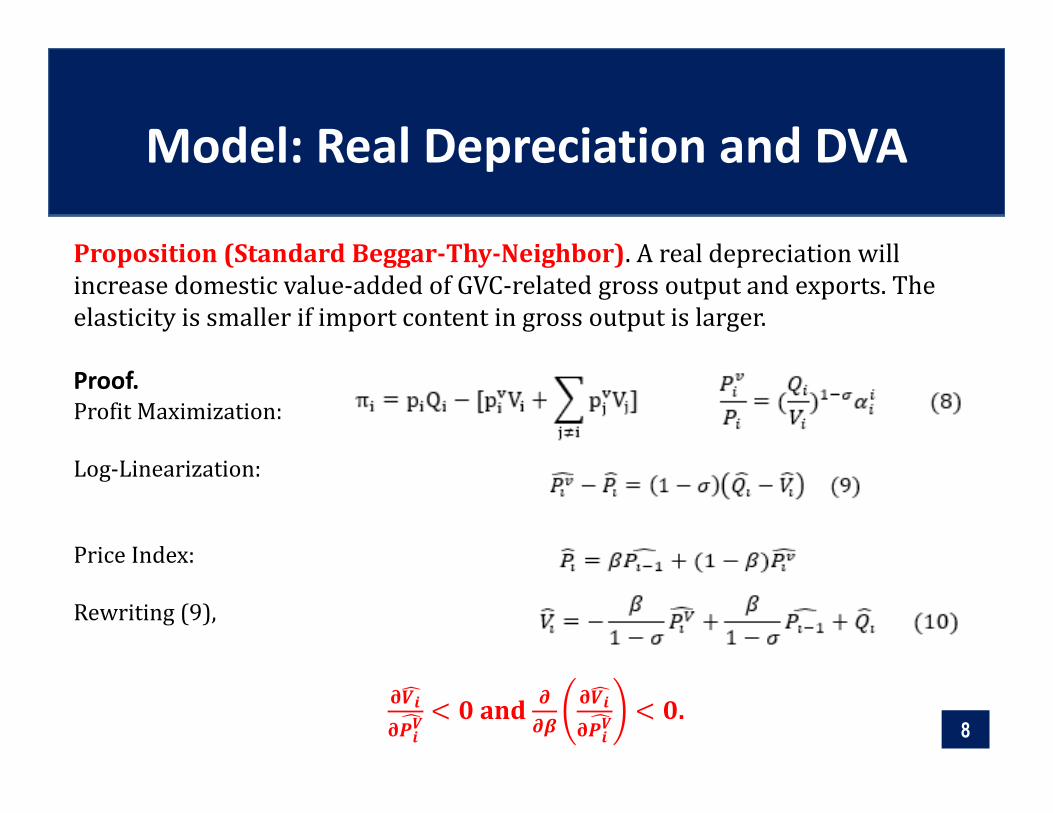
Proposition (Standard Beggar-Thy-Neighbor).Arealdepreciationwillincreasedomesticvalue‐addedofGVC‐relatedgrossoutputandexports.Theelasticityissmallerifimportcontentingrossoutputislarger.
Proof. ProfitMaximization:
Log‐Linearization:
PriceIndex:
Rewriting(9),
and .

Model: Real Depreciation and FVA
9
Proposition (Beneficial Spillover).Ifacountry’sownvalueaddedcontributiontogrossoutputissufficientlylarge,arealdepreciationinthatcountrywillraisetheamountofvalueaddedbyothercountriesinthechain.Therefore,adownstreamcountrythatexperiencesarealdepreciationwillimportmorefromtheupstreamcountry,eventhoughtheupstreamcountry’srealexchangeratehasappreciated—beneficial spillback.
Proof. ProfitMaximization:
ScaleEffect:
Own-price effect
Cross-price effect Scale effect

Model: Real Depreciation and FVA (Continued..)
10
Proof (continued….)
:
).

Model: Real Depreciation and FVA (Continued..)
11
Corollary (beneficial spill forward). If the contribution of the upstream country’s domestic value-added to the final product is sufficiently large, a real depreciation in the upstream country may raise the value-added produced by the downstream country, even though the downstream country has experienced a relative real appreciation.
Data Description
12
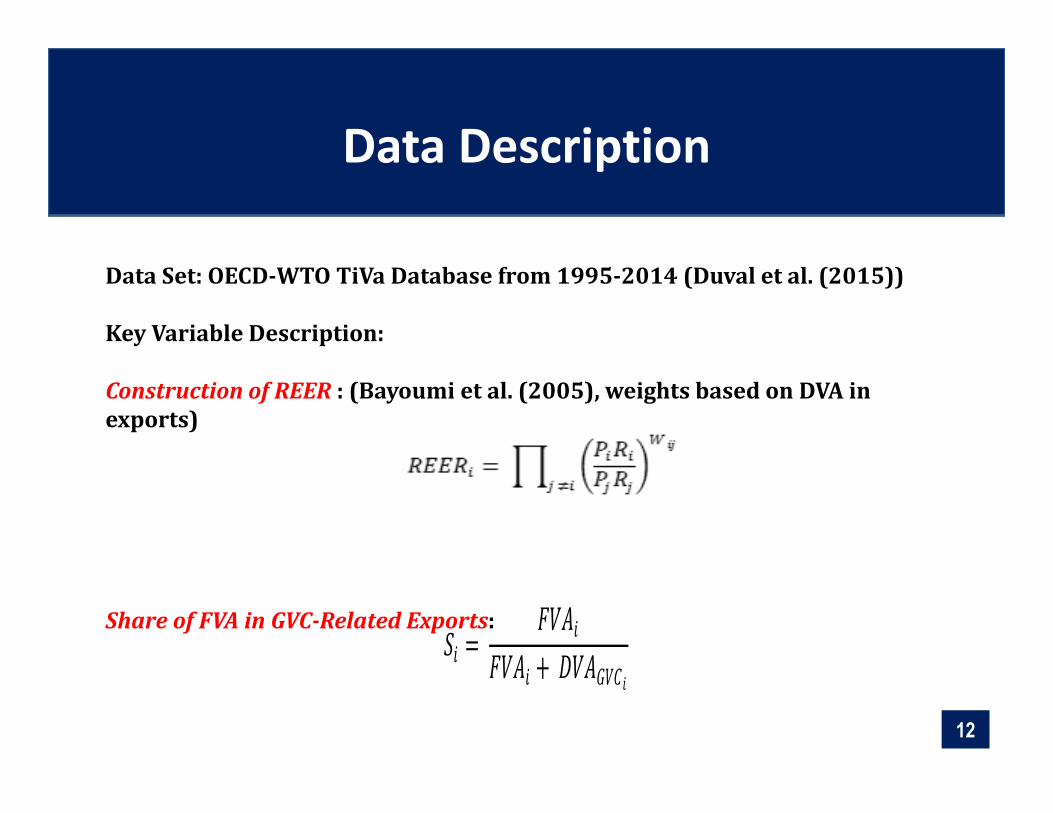
Data Set: OECD-WTO TiVa Database from 1995-2014 (Duval et al. (2015))
Key Variable Description:
Construction of REER : (Bayoumi et al. (2005), weights based on DVA in exports)
Share of FVA in GVC-Related Exports:
Empirical Strategy
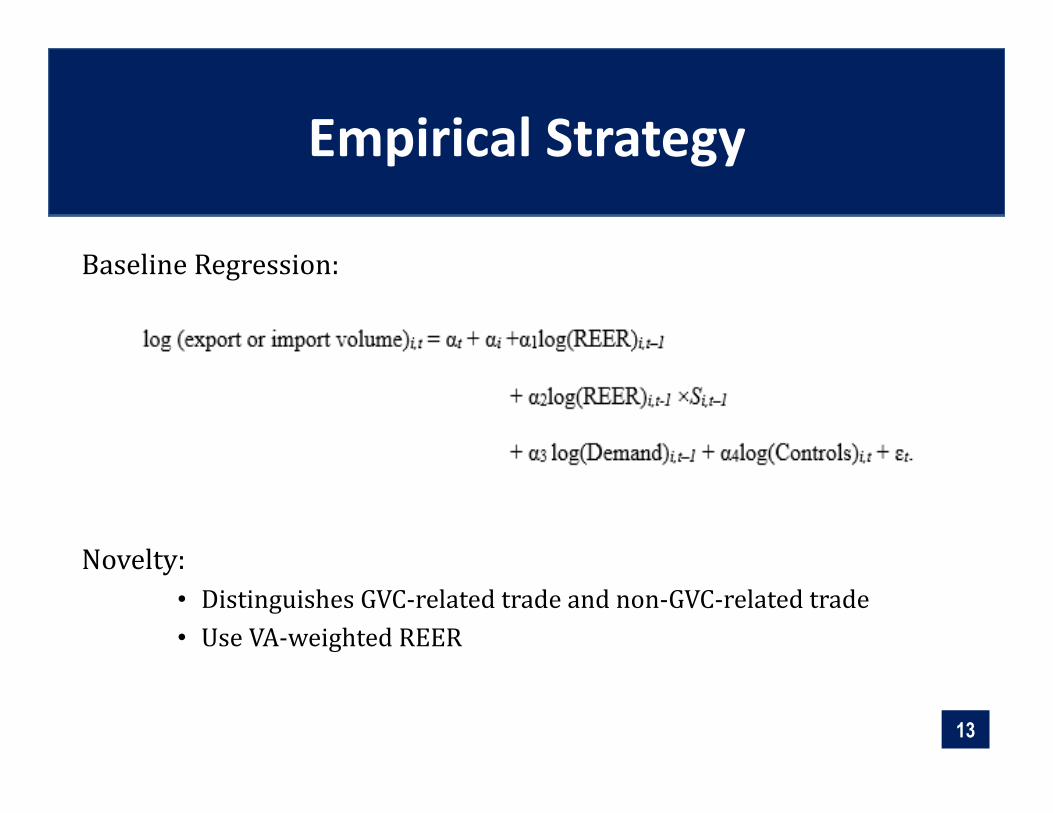
BaselineRegression:
Novelty:• DistinguishesGVC‐relatedtradeandnon‐GVC‐relatedtrade• UseVA‐weightedREER
13

Results
14
Table. Response of Trade to the Real Exchange Rate(1) (2) (3) (4) (5) (6)
VARIABLESGross
ImportsGross
ExportsImports
(FVADD)Exports
(DVANon-GVC)Imports(FVAX)
Exports(DVAGVC)
Lagged Log (REER-Value-added-based) 0.253 -0.604* 1.235** -1.102** -1.390*** -1.670***(0.663) (-1.841) (2.287) (-2.378) (-2.822) (-3.527)
lagged log(REER) x lagged (FVA/DVA+FVA) -0.003 0.013** 0.027*** 0.026***(-0.443) (2.150) (3.166) (3.330)
Lagged Log (Demand) 0.709*** 1.110*** 0.884*** 0.795*** 1.108*** 0.758***(4.716) (9.257) (3.089) (6.446) (5.961) (4.470)
Time FE Y Y Y Y Y YCountry FE Y Y Y Y Y YAdditional controls Y Y Y Y Y YClustering Country level Country level Country level Country level Country level Country levelObservations 690 690 690 690 699 699R-squared 0.909 0.846 0.451 0.689 0.733 0.681Source: IMF staff estimates.
*** p<0.01, ** p<0.05, * p<0.1
Gross Trade GVC-related exportsOther Trade
Note: REER stands for real effective exchange rate. Specification— log (Exports [Imports] volume)c,t = αt +αc + α1log(REER)c,t-1 +α2interaction term + α3log(Demand)c[w],t-1 + αilog(Controls)c,t + ɛt. Additional controls included in the specifications are log of real stock of FDI, FVA share, tariffs, output gap. Demand is prox ied by GDP. Robust t-statistics in parentheses.

Results
15
Table. Exchange Rate Competitiveness in GVCs(1) (2)
VARIABLES Gross imports Gross exports
Lagged Log (REER-Value-added-based) 0.253 -0.604*(0.663) (-1.841)
lagged log(REER) x lagged (FVA/DVA+FVA) -0.003 0.013**(-0.443) (2.150)
Lagged Log (Demand) 0.709*** 1.110***(4.716) (9.257)
Results
16
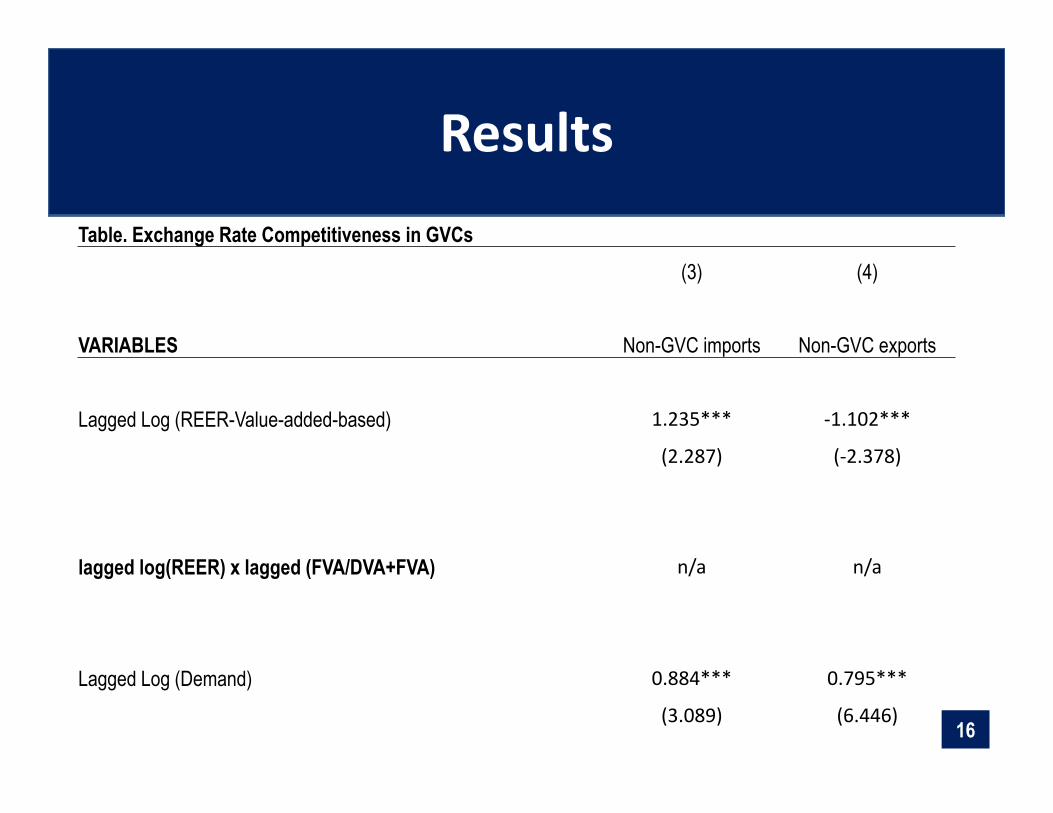
Table. Exchange Rate Competitiveness in GVCs(3) (4)
VARIABLES Non-GVC imports Non-GVC exports
Lagged Log (REER-Value-added-based) 1.235*** -1.102***
(2.287) (-2.378)
lagged log(REER) x lagged (FVA/DVA+FVA) n/a n/a
Lagged Log (Demand) 0.884*** 0.795***
(3.089) (6.446)
Results
17
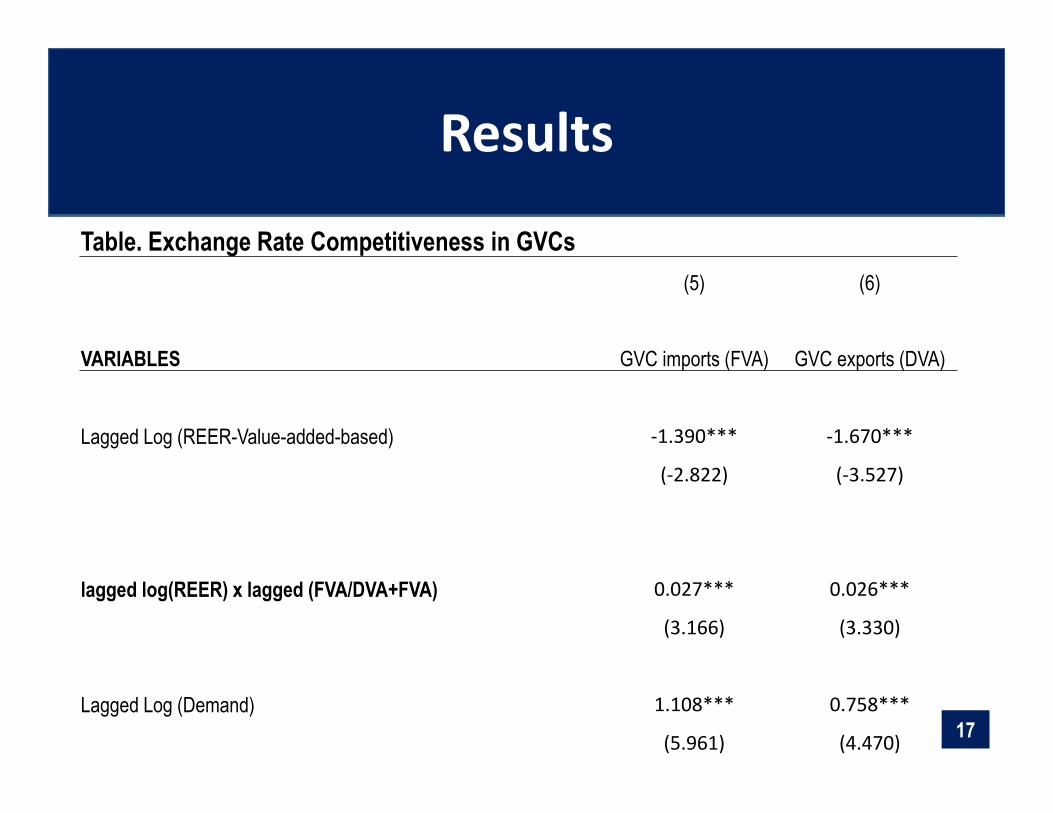
Table. Exchange Rate Competitiveness in GVCs(5) (6)
VARIABLES GVC imports (FVA) GVC exports (DVA)
Lagged Log (REER-Value-added-based) -1.390*** -1.670***
(-2.822) (-3.527)
lagged log(REER) x lagged (FVA/DVA+FVA) 0.027*** 0.026***
(3.166) (3.330)
Lagged Log (Demand) 1.108*** 0.758***
(5.961) (4.470)
Impact on GVC-trade elasticities
18
-2.0
-1.5
-1.0
-0.5
0.0
0.5
1.0
1.5
22 30 38 46 54 62 70 78
GVC T
rade E
lastici
ty
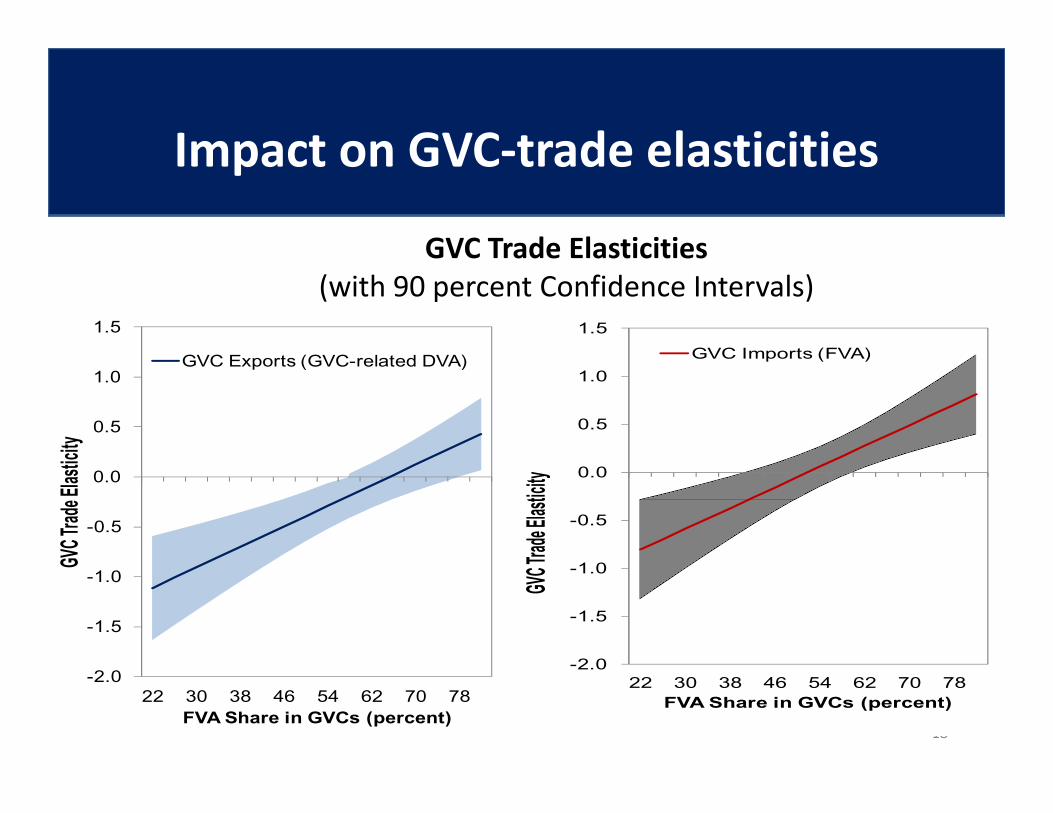
FVA Share in GVCs (percent)
GVC Exports (GVC-related DVA)
-2.0
-1.5
-1.0
-0.5
0.0
0.5
1.0
1.5
22 30 38 46 54 62 70 78
GVC Tra
de Elast
icity
FVA Share in GVCs (percent)
GVC Imports (FVA)
GVC Trade Elasticities (with 90 percent Confidence Intervals)
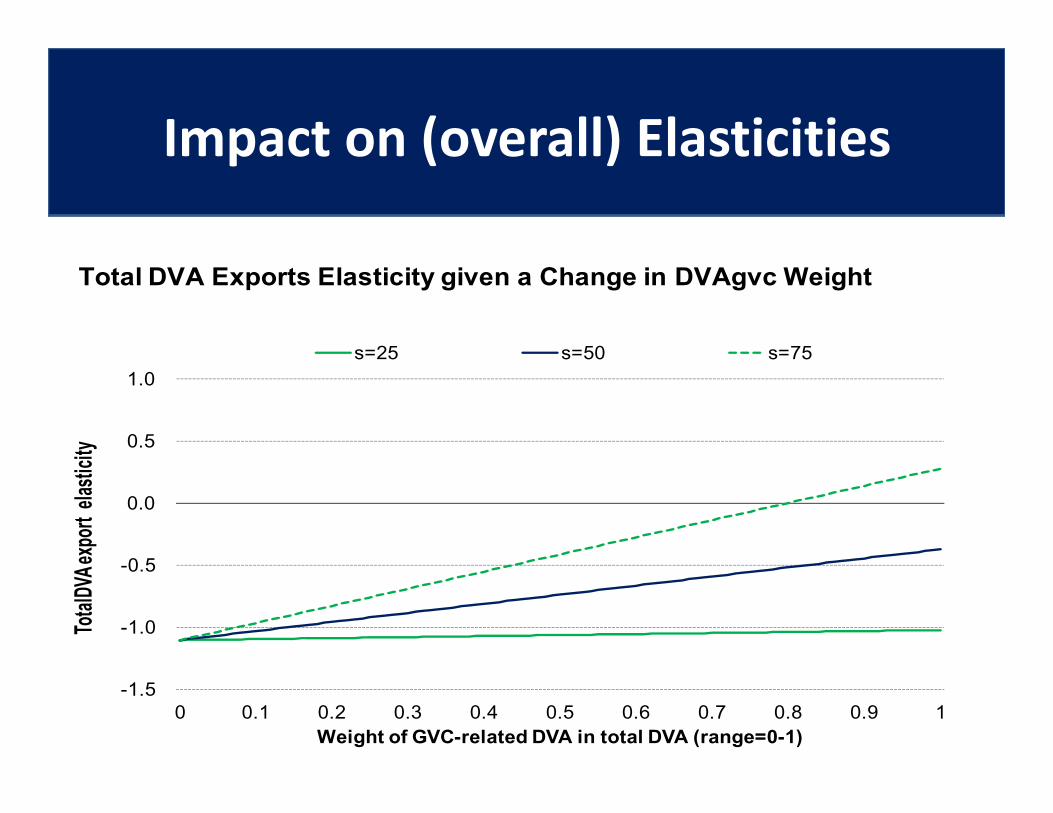
Impact on (overall) Elasticities
-1.5
-1.0
-0.5
0.0
0.5
1.0
0 0.1 0.2 0.3 0.4 0.5 0.6 0.7 0.8 0.9 1
Total
DVA e
xport
elast
icity
Weight of GVC-related DVA in total DVA (range=0-1)
s=25 s=50 s=75
Total DVA Exports Elasticity given a Change in DVAgvc Weight
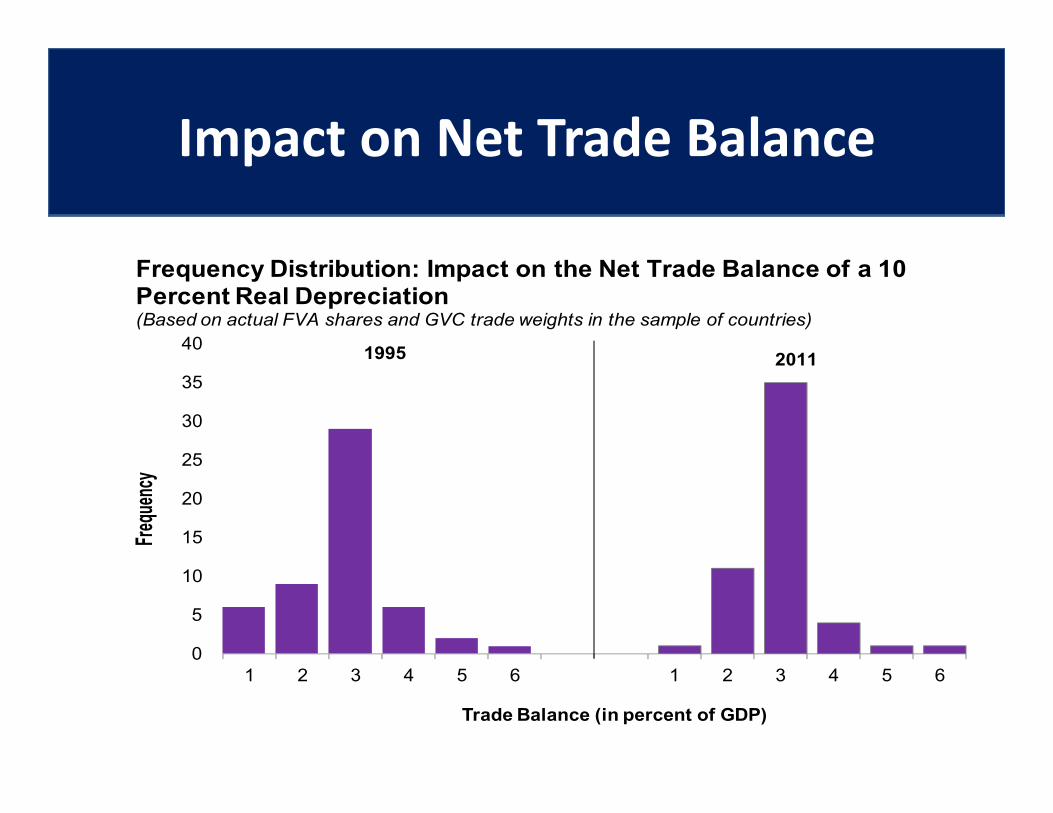
Impact on Net Trade Balance
0
5
10
15
20
25
30
35
40
1 2 3 4 5 6 1 2 3 4 5 6
Frequ
ency
Trade Balance (in percent of GDP)
Frequency Distribution: Impact on the Net Trade Balance of a 10Percent Real Depreciation(Based on actual FVA shares and GVC trade weights in the sample of countries)
1995 2011
Conclusion
21
• GVCs alter the responsiveness of trade to exchange rate changes;
• Responsiveness depends on a country’s contribution to the final GVC product.• Higher FVA in your exports dampening
• Complicate assessments of impact of exchange rate changes on trade.
• Beggar-Thy-Neighbor or Beneficial Spillover?-> A real depreciation may not be a bad thing for your GVC trading partner.

Supplementary Slides
22
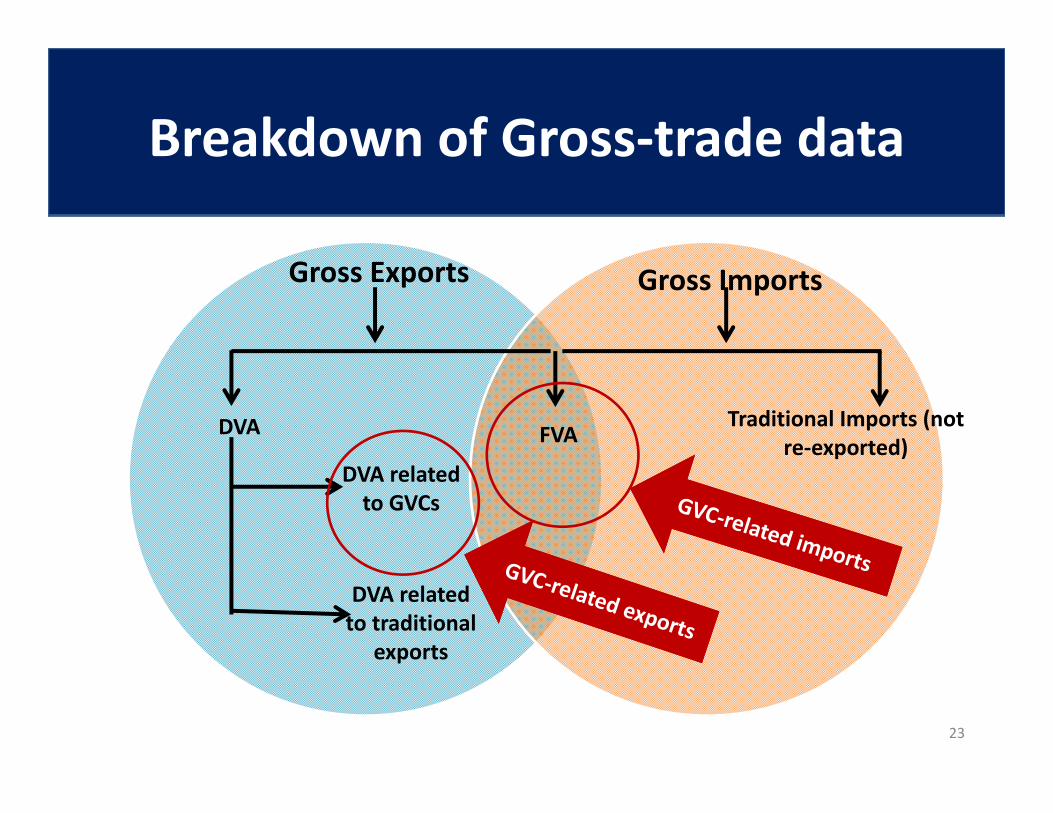
Breakdown of Gross-trade data
Gross Exports Gross Imports
DVA FVATraditional Imports (not
re-exported)DVA related
to GVCs
DVA related to traditional
exports
23

Decomposition
24
0
10
20
30
40
50
60
70
1995 2011 1995 2011 1995 2011 1995 2011 1995 2011 1995 2011 1995 2011 1995 2011
Asia ASEAN Euro area Full sample Asia ASEAN Euro area Full sample
Non-GVC-related imports Non-GVC-related DVA in exports GVC-related DVA in exports GVC-related FVA in exports
Decomposition of Gross Exports and Imports, 1995 vs. 2011(In percent of GDP)
DVAFVA
Gross Exports ImportsSources: OECD-WTO TiVA database; and IMF staff estimates.

Data Description
25
0
10
20
30
40
50
60
70
1995 2011 1995 2011 1995 2011 1995 2011 1995 2011 1995 2011 1995 2011 1995 2011
Asia ASEAN Euro area Full sample Asia ASEAN Euro area Full sample
Non-GVC-related imports Non-GVC-related DVA in exports GVC-related DVA in exports GVC-related FVA in exports
Decomposition of Gross Exports and Imports, 1995 vs. 2011(In percent of GDP)
DVAFVA
Gross Exports ImportsSources: OECD-WTO TiVA database; and IMF staff estimates.