


Before a form: Use predictive analytics for sales
49
Scott D. Meyer CEO/Brofounder 9 Clouds Sioux Falls, SD 855-925-6837 [email protected] 1 Your Photo Goes Here Before a Form: Predictive Analytics for Sales
-
Upload
scott-meyer -
Category
Automotive
-
view
445 -
download
0
Transcript of Before a form: Use predictive analytics for sales
Scott D. Meyer
CEO/Brofounder
9 Clouds
Sioux Falls, SD
855-925-6837
1
Your Photo
Goes Here
Before a Form:
Predictive Analytics for Sales
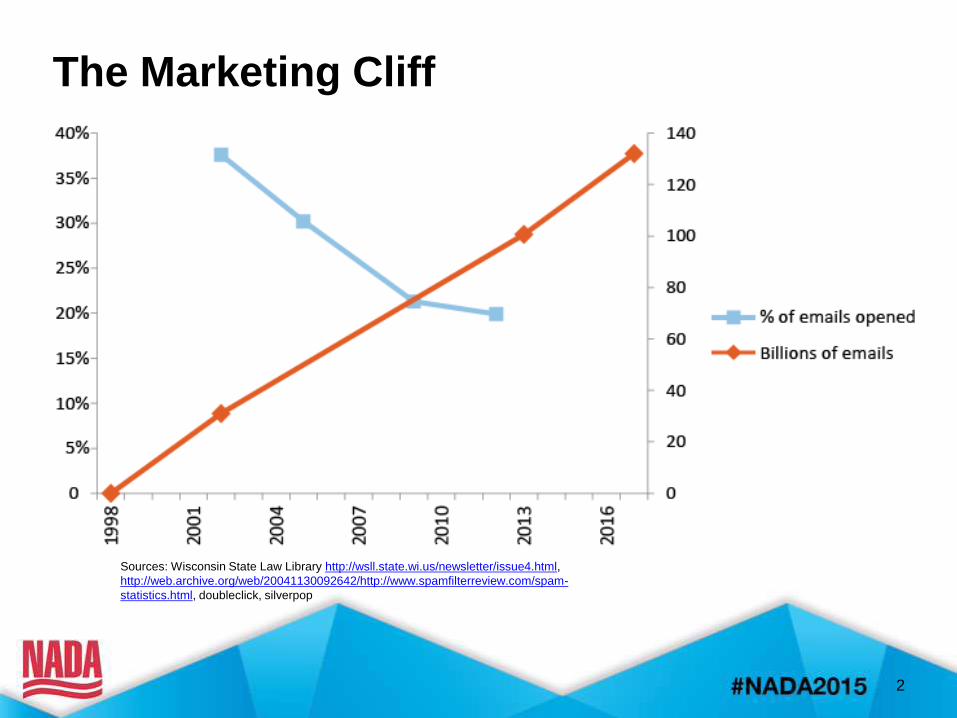
The Marketing Cliff
2
Sources: Wisconsin State Law Library http://wsll.state.wi.us/newsletter/issue4.html,
http://web.archive.org/web/20041130092642/http://www.spamfilterreview.com/spam-
statistics.html, doubleclick, silverpop
3
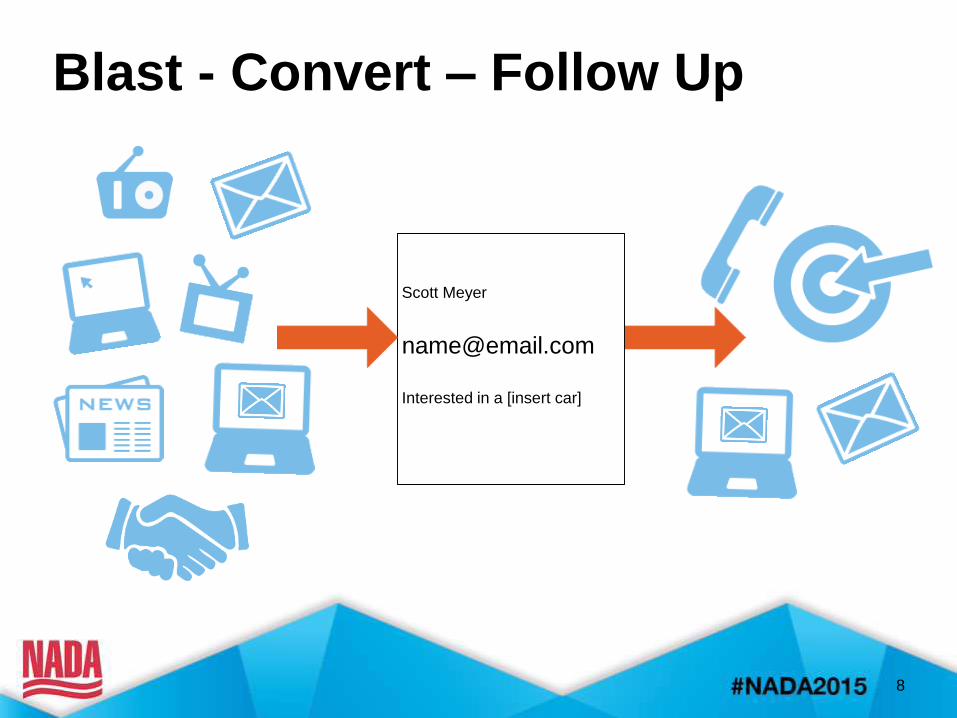
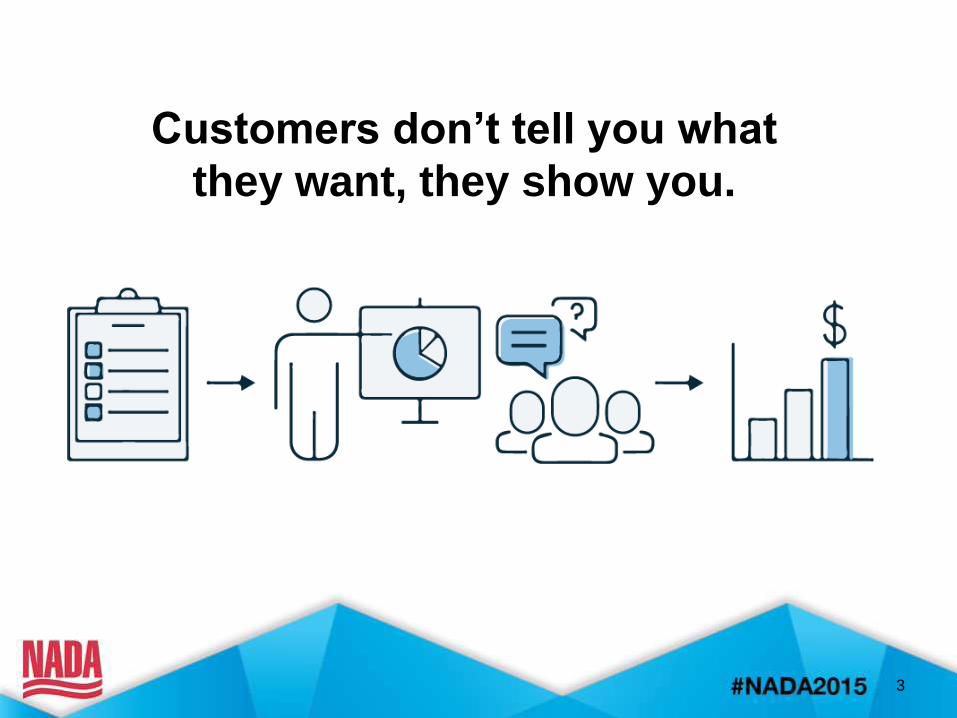
Customers don’t tell you what
they want, they show you.
The Solution
• Inbound Marketing
• Predictive Analytics
• Personalized Sales
4

The Solution
• Double email open and click rates
• Increase sale quota fulfillment 9.3
percent
• Know customers are ready to buy
before they tell you
5
6
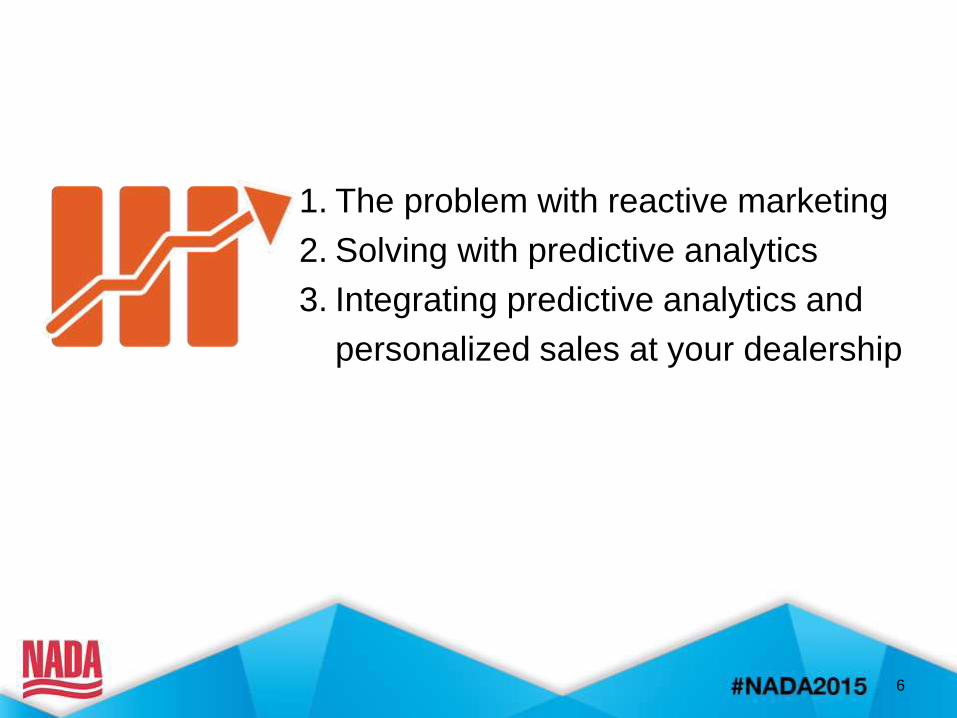
1. The problem with reactive marketing
2. Solving with predictive analytics
3. Integrating predictive analytics and
personalized sales at your dealership
7
The Problem With
Reactive Marketing
9
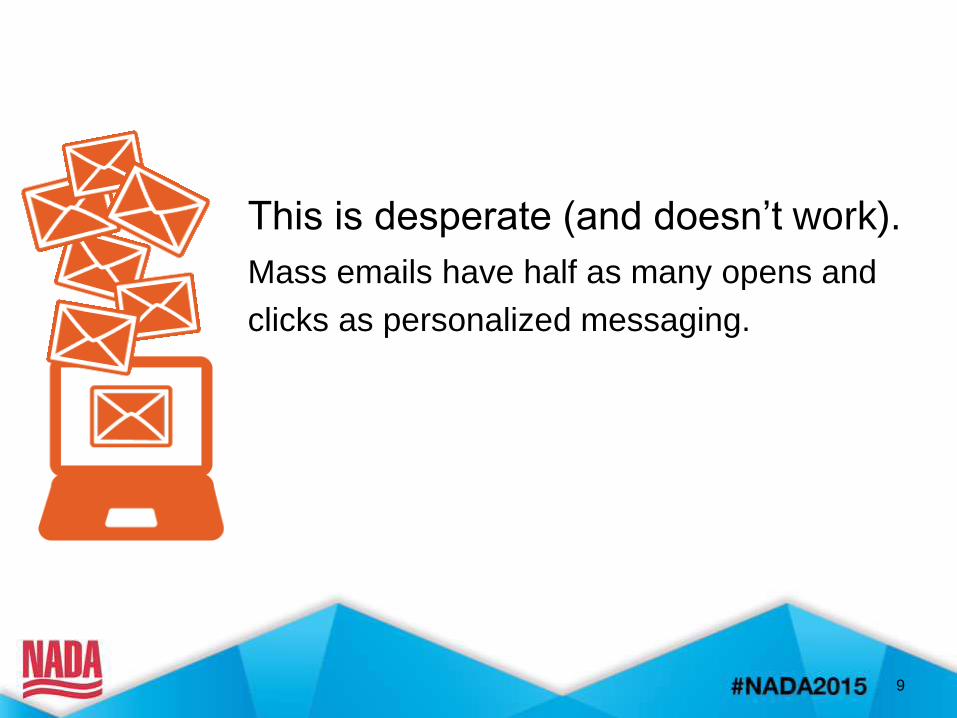
This is desperate (and doesn’t work).
Mass emails have half as many opens and
clicks as personalized messaging.
11
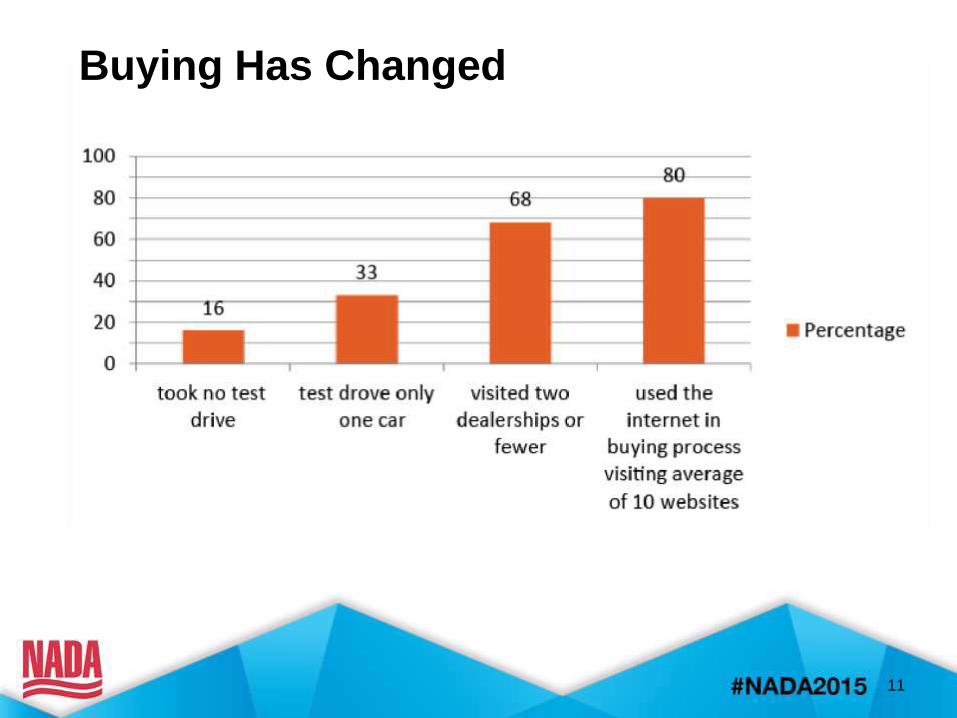
Buying Has Changed
12
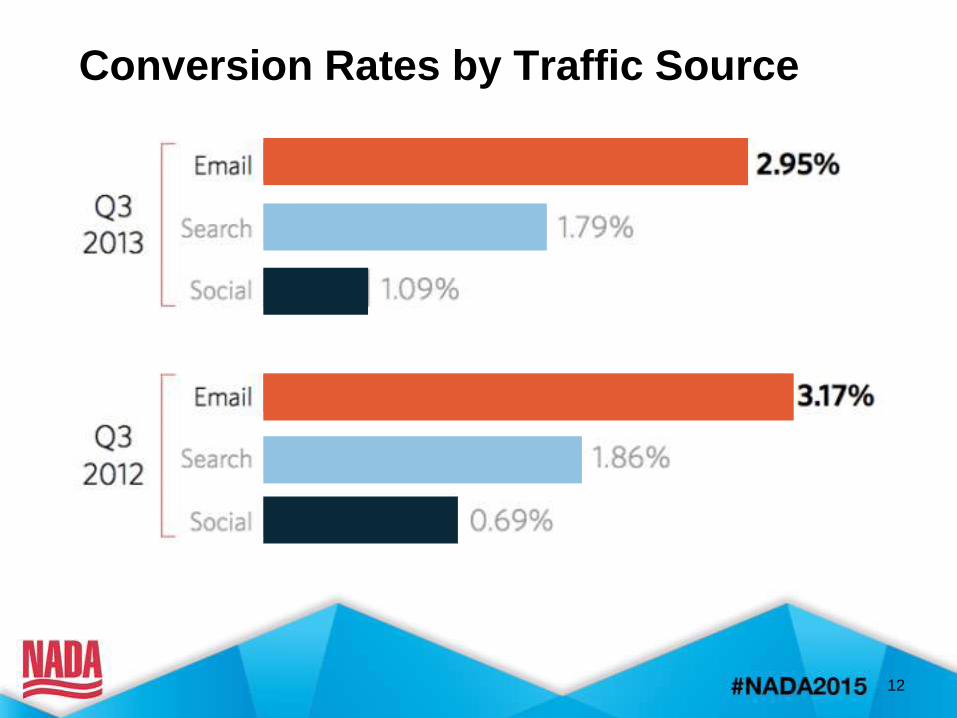
Conversion Rates by Traffic Source
14
Predictive Analytics
15
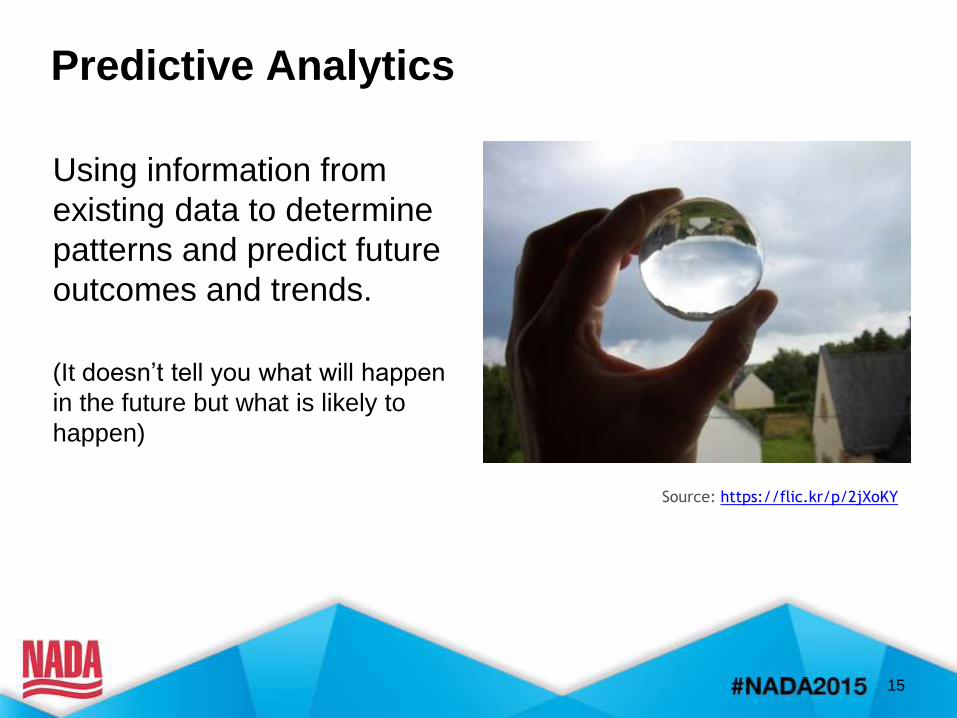
Using information from
existing data to determine
patterns and predict future
outcomes and trends.
(It doesn’t tell you what will happen
in the future but what is likely to
happen)
Source: https://flic.kr/p/2jXoKY
Predictive Analytics
17
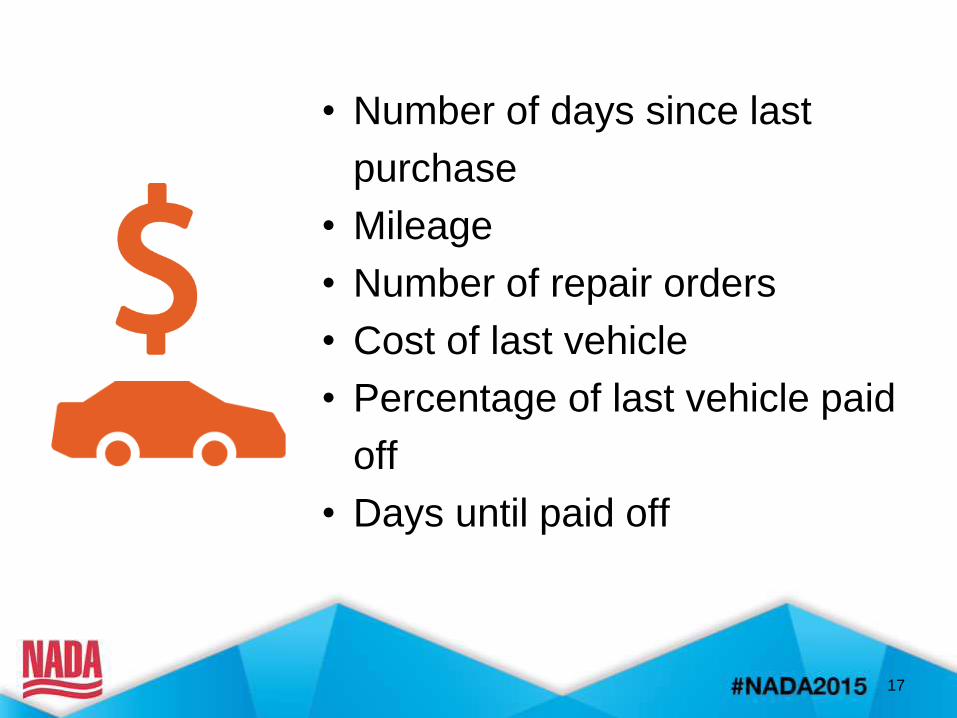
• Number of days since last
purchase
• Mileage
• Number of repair orders
• Cost of last vehicle
• Percentage of last vehicle paid
off
• Days until paid off
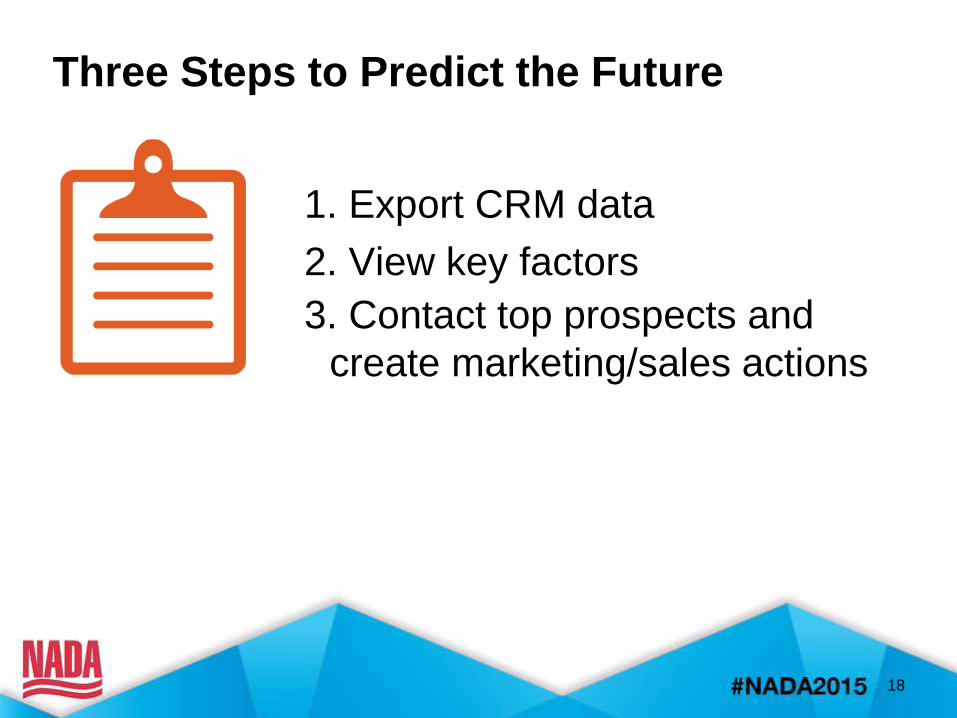
Three Steps to Predict the Future
18
1. Export CRM data
2. View key factors
3. Contact top prospects and
create marketing/sales actions
Export CRM Data
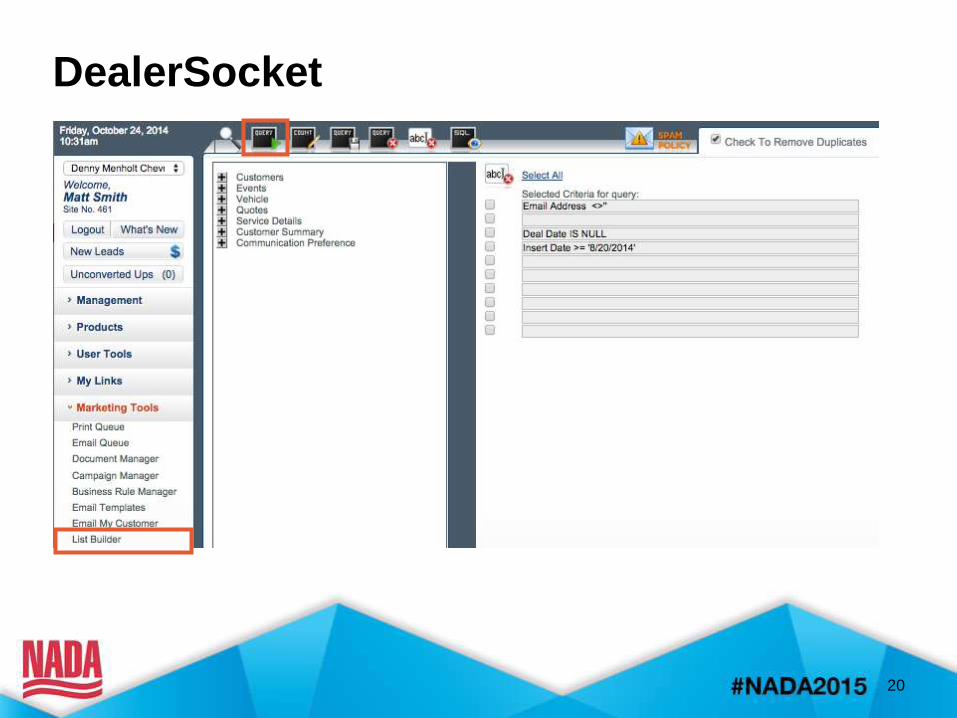
DealerSocket
20
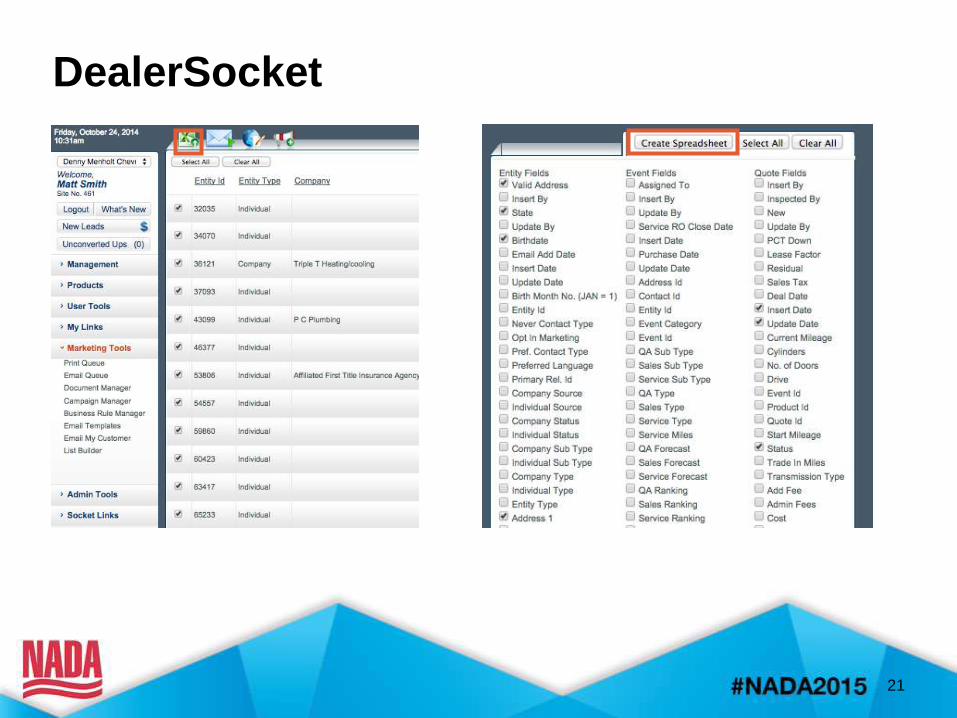
DealerSocket
21
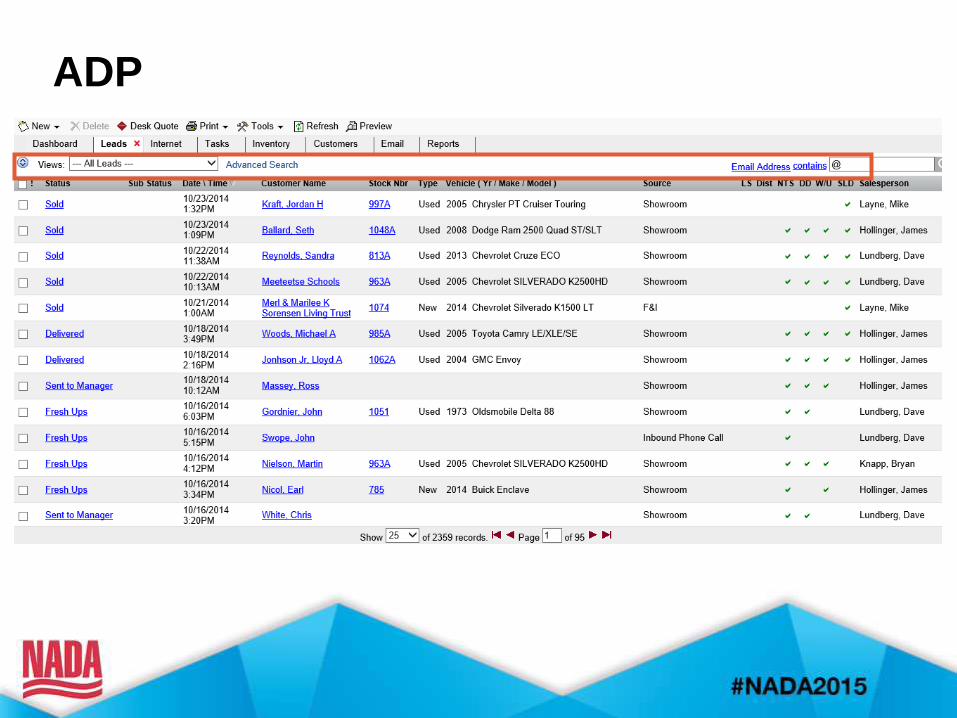
ADP
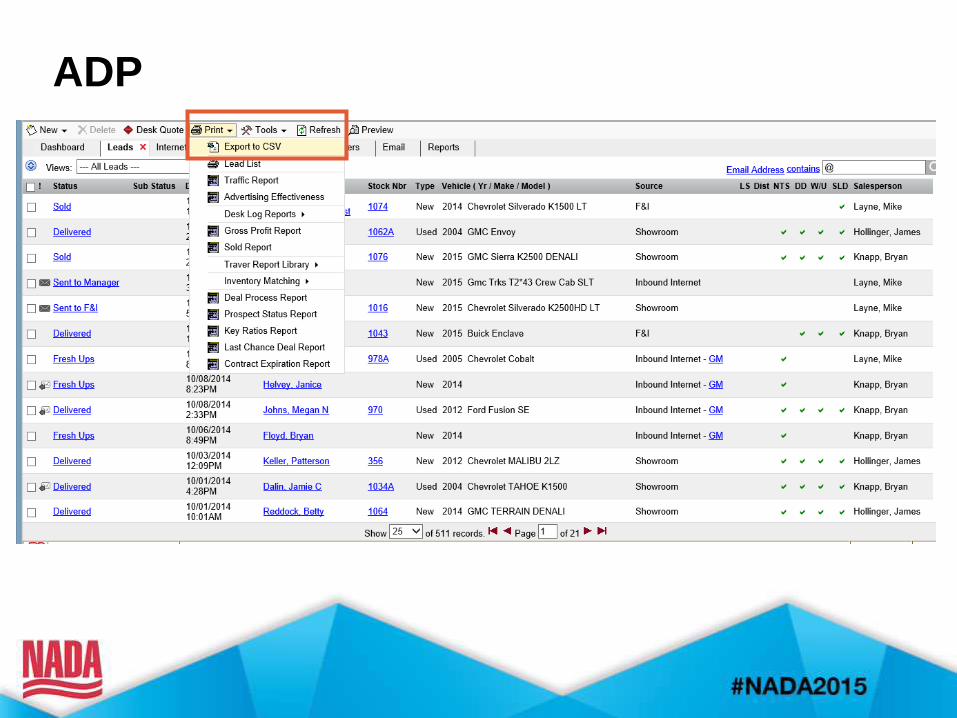
ADP
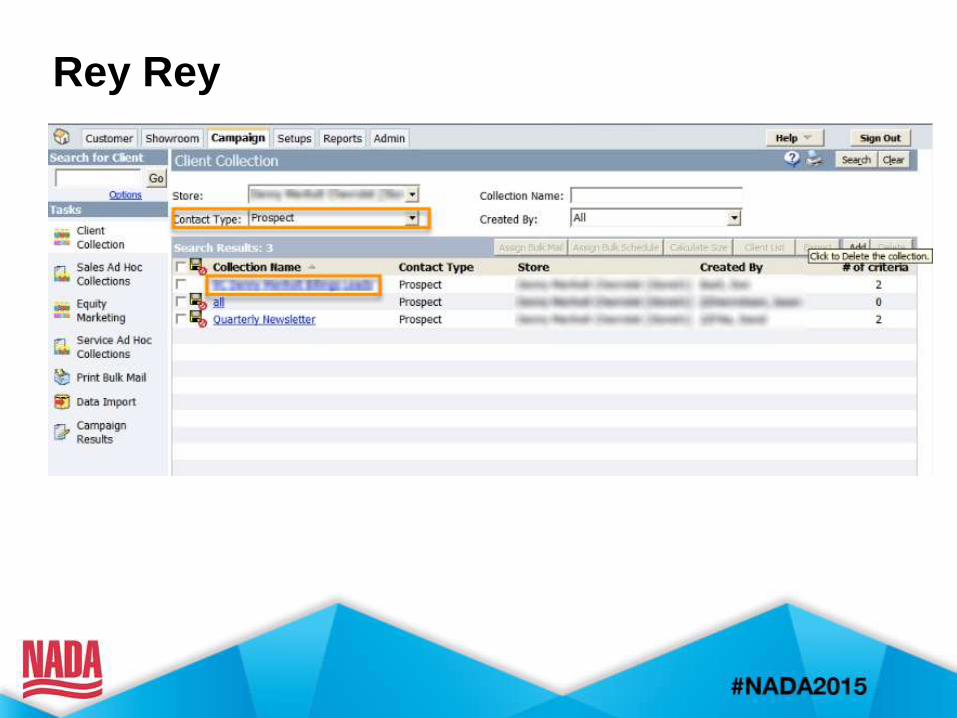
Rey Rey
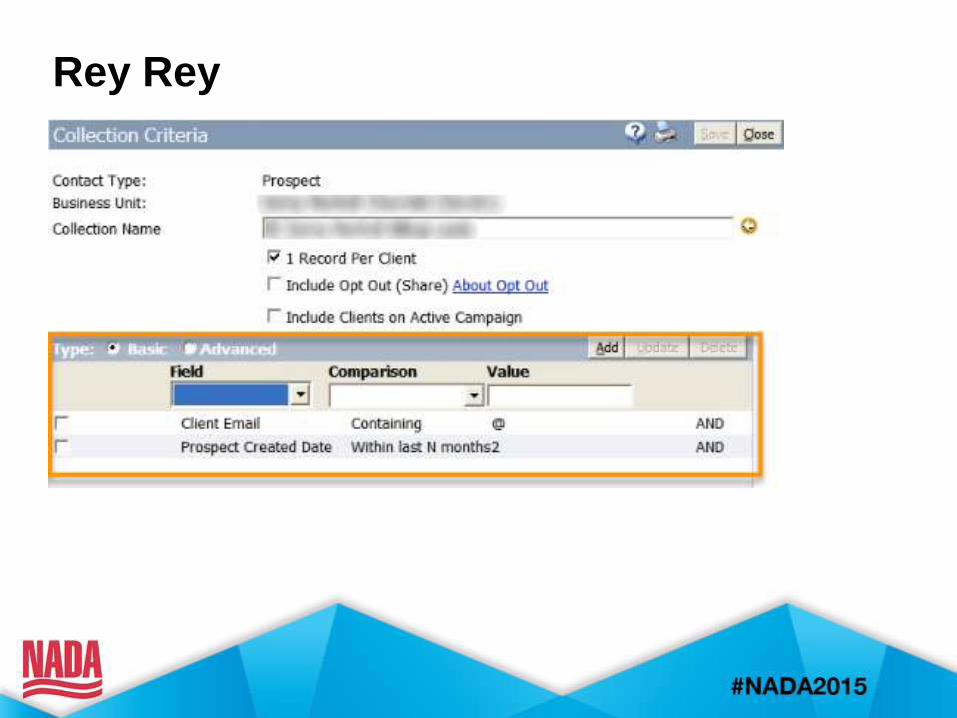
Rey Rey
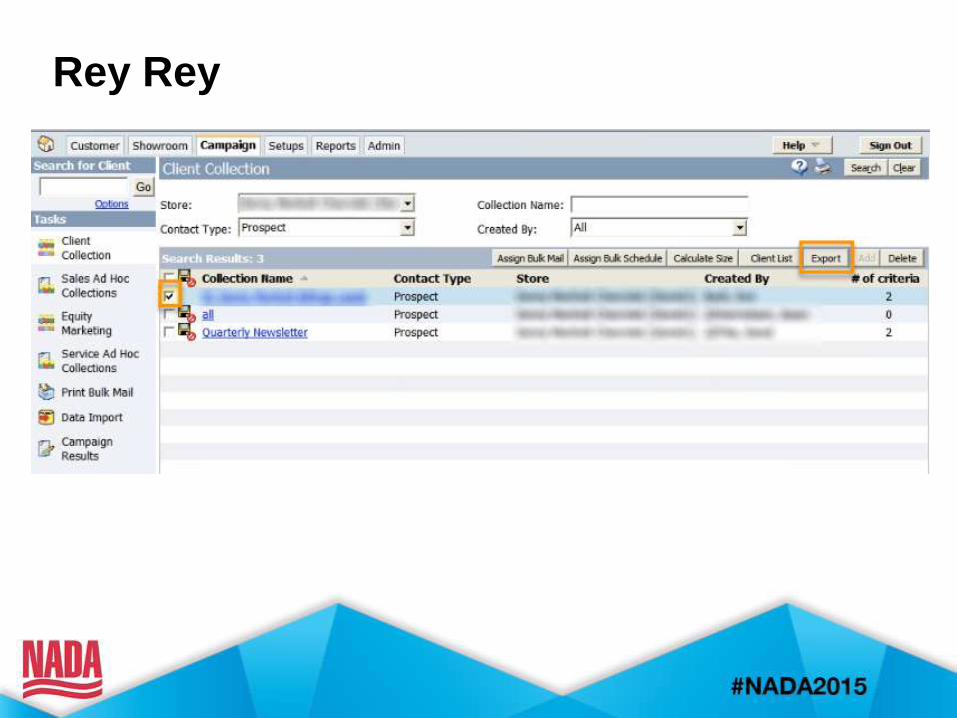
Rey Rey
View Key FactorsTime | Event | Forecast
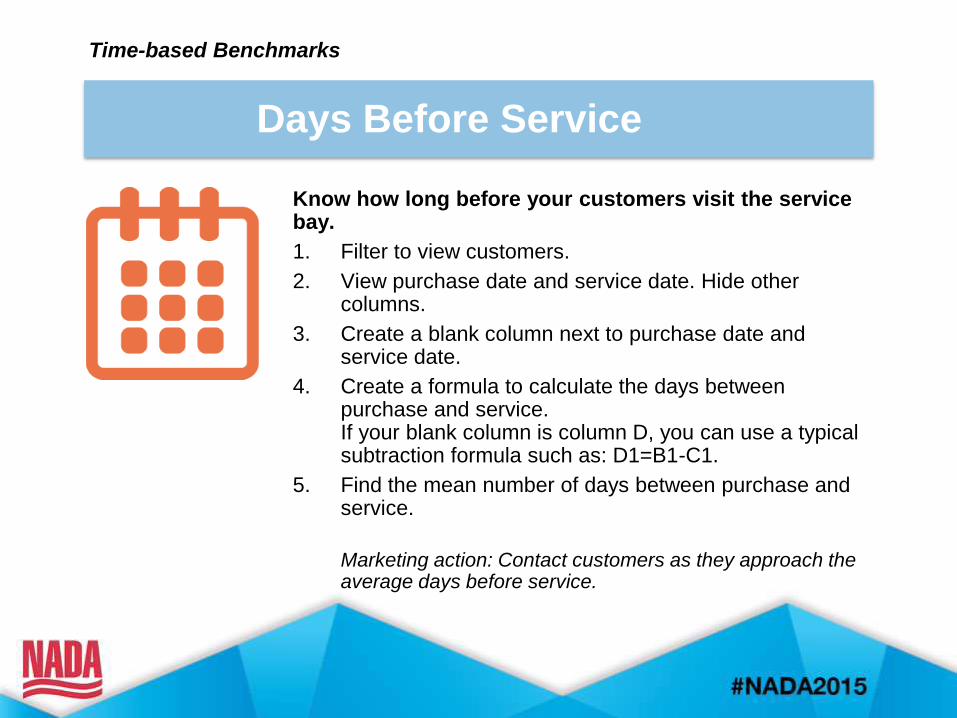
Days Before Service
Time-based Benchmarks
Know how long before your customers visit the service bay.
1. Filter to view customers.
2. View purchase date and service date. Hide other columns.
3. Create a blank column next to purchase date and service date.
4. Create a formula to calculate the days between purchase and service. If your blank column is column D, you can use a typical subtraction formula such as: D1=B1-C1.
5. Find the mean number of days between purchase and service.
Marketing action: Contact customers as they approach the average days before service.
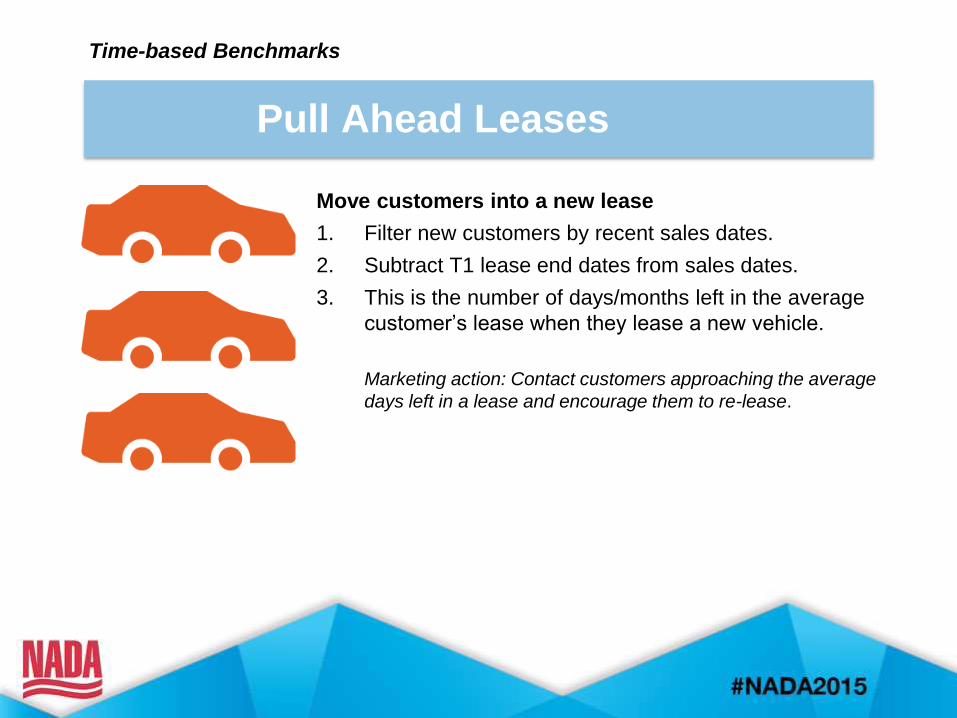
Move customers into a new lease
1. Filter new customers by recent sales dates.
2. Subtract T1 lease end dates from sales dates.
3. This is the number of days/months left in the average
customer’s lease when they lease a new vehicle.
Marketing action: Contact customers approaching the average
days left in a lease and encourage them to re-lease.
Pull Ahead Leases
Time-based Benchmarks
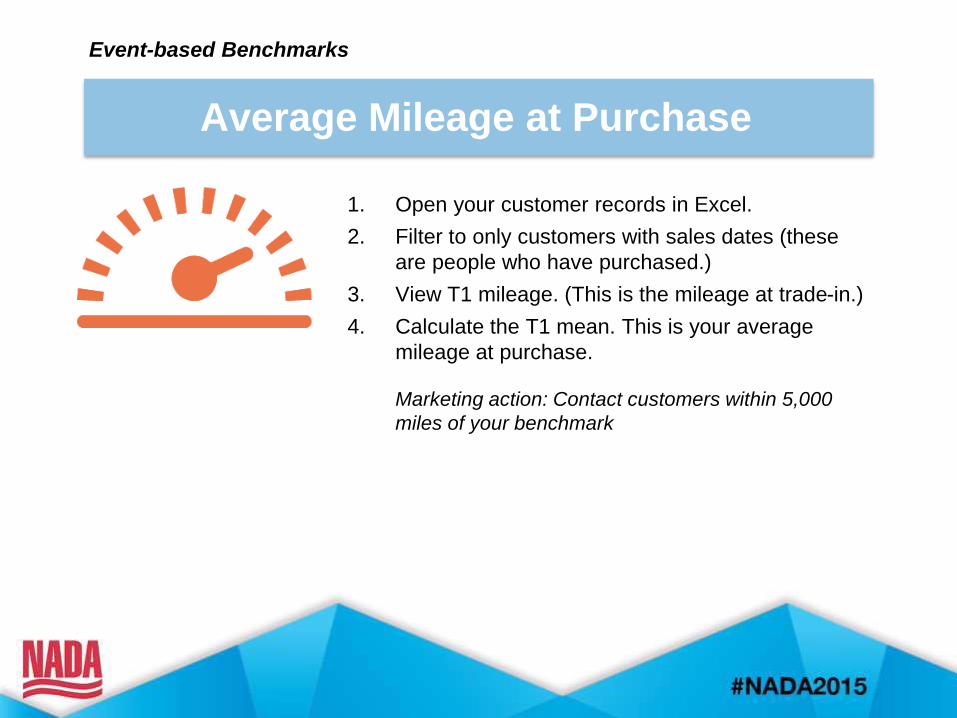
1. Open your customer records in Excel.
2. Filter to only customers with sales dates (these
are people who have purchased.)
3. View T1 mileage. (This is the mileage at trade-in.)
4. Calculate the T1 mean. This is your average
mileage at purchase.
Marketing action: Contact customers within 5,000
miles of your benchmark
Average Mileage at Purchase
Event-based Benchmarks
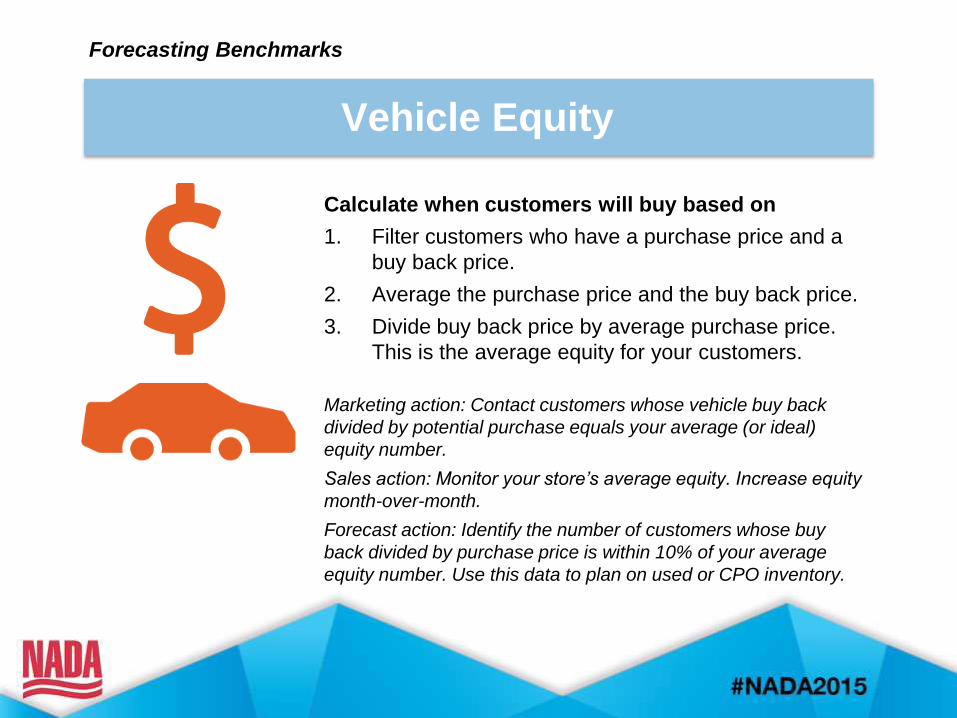
Calculate when customers will buy based on
1. Filter customers who have a purchase price and a
buy back price.
2. Average the purchase price and the buy back price.
3. Divide buy back price by average purchase price.
This is the average equity for your customers.
Marketing action: Contact customers whose vehicle buy back
divided by potential purchase equals your average (or ideal)
equity number.
Sales action: Monitor your store’s average equity. Increase equity
month-over-month.
Forecast action: Identify the number of customers whose buy
back divided by purchase price is within 10% of your average
equity number. Use this data to plan on used or CPO inventory.
Vehicle Equity
Forecasting Benchmarks
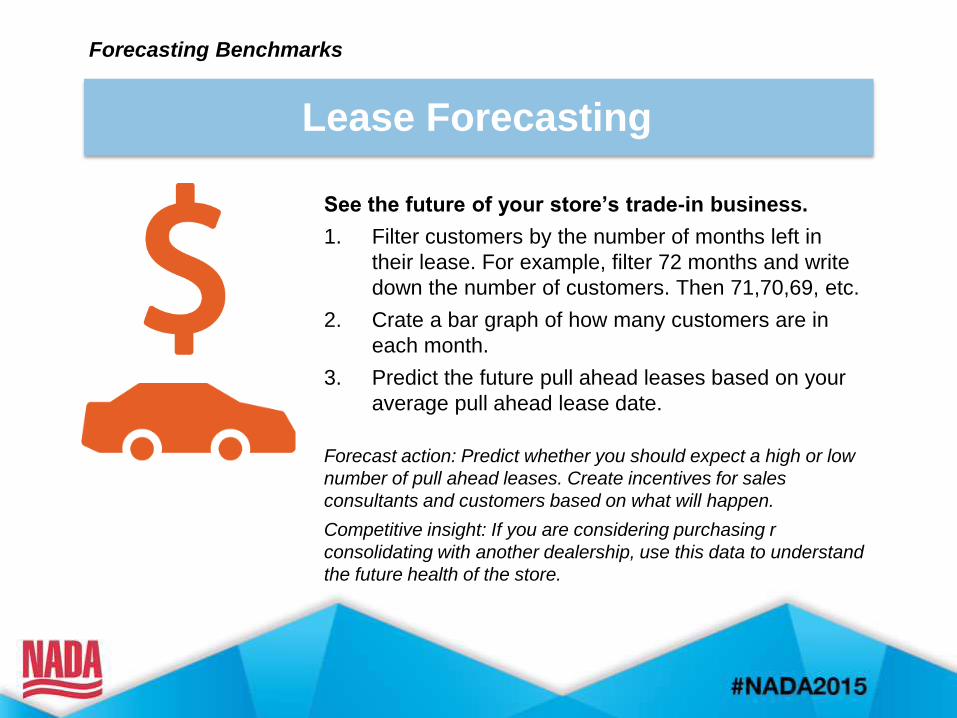
See the future of your store’s trade-in business.
1. Filter customers by the number of months left in
their lease. For example, filter 72 months and write
down the number of customers. Then 71,70,69, etc.
2. Crate a bar graph of how many customers are in
each month.
3. Predict the future pull ahead leases based on your
average pull ahead lease date.
Forecast action: Predict whether you should expect a high or low
number of pull ahead leases. Create incentives for sales
consultants and customers based on what will happen.
Competitive insight: If you are considering purchasing r
consolidating with another dealership, use this data to understand
the future health of the store.
Lease Forecasting
Forecasting Benchmarks
Contact Top Prospects
and Create
Marketing/Sales
Actions
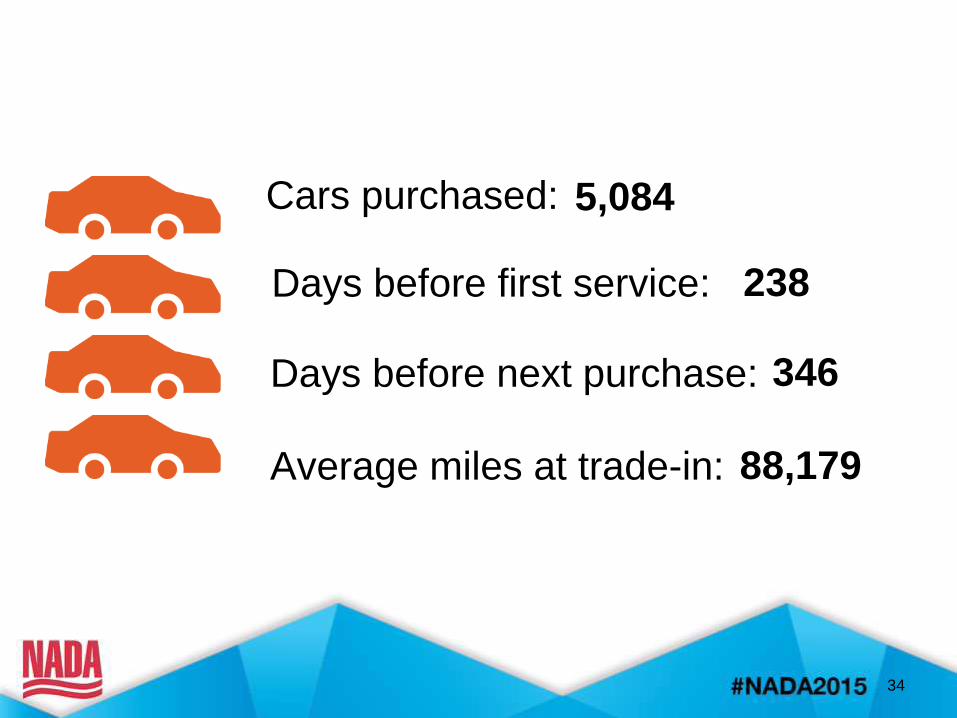
34
Cars purchased:
Days before first service:
Days before next purchase:
Average miles at trade-in:
5,084
238
346
88,179
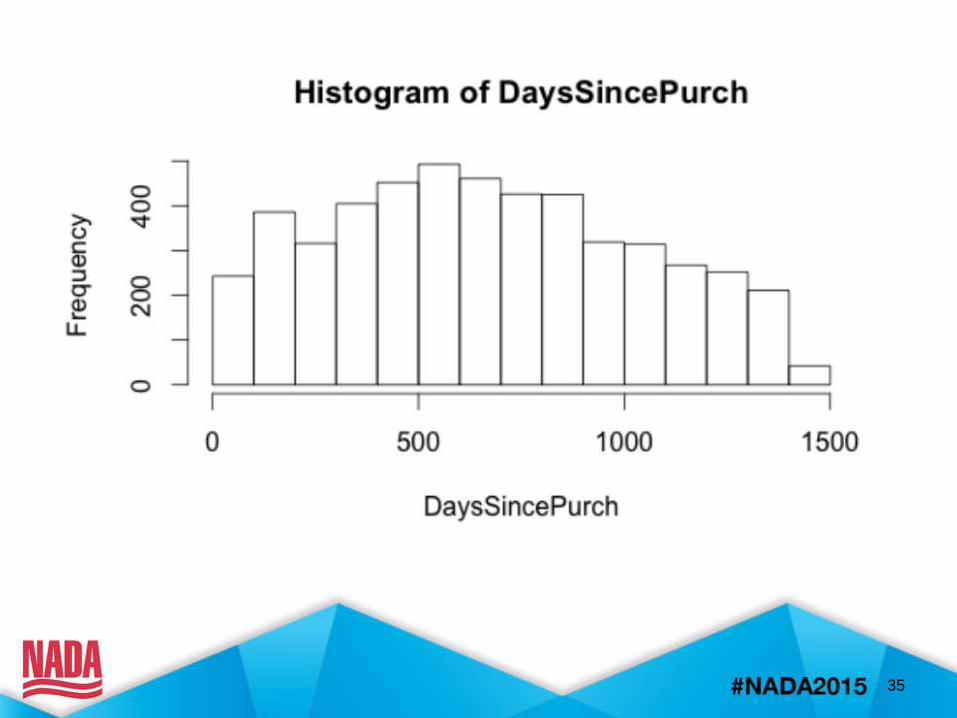
35
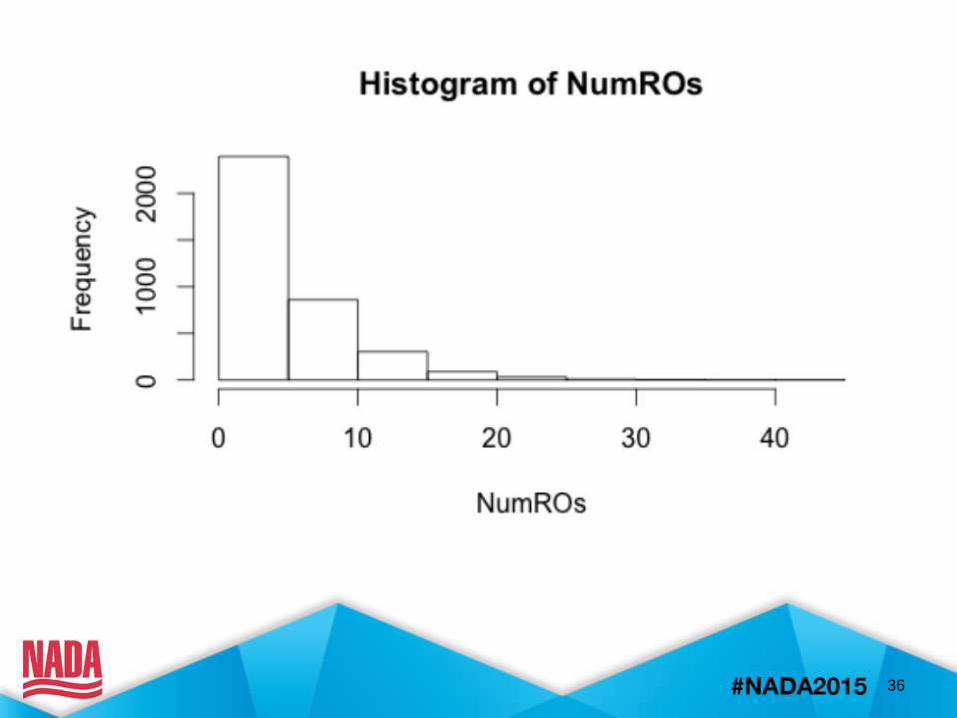
36
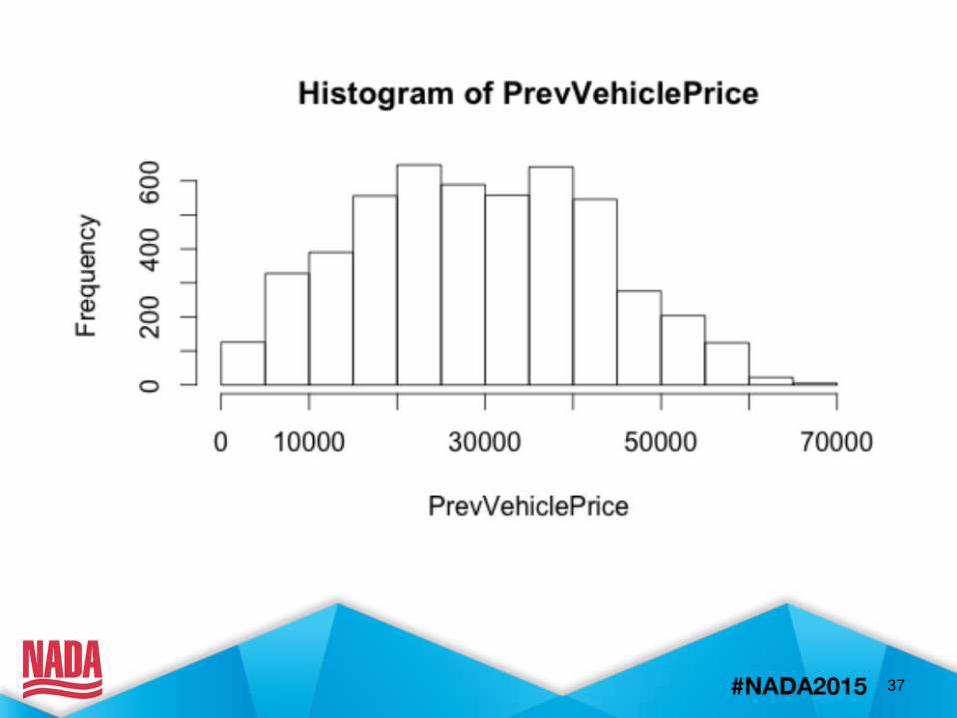
37
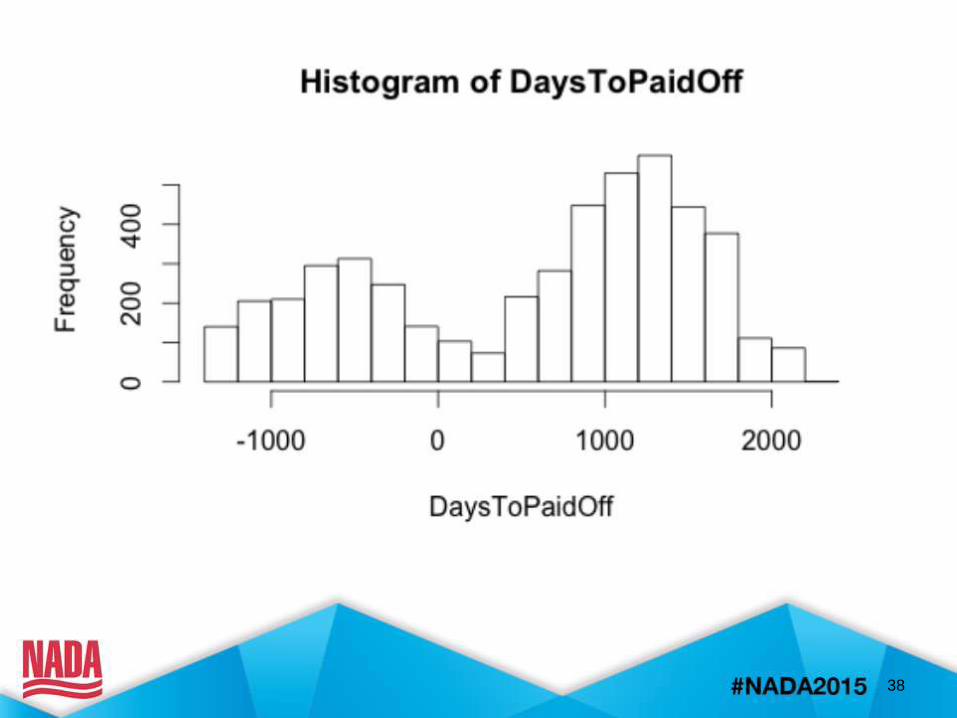
38
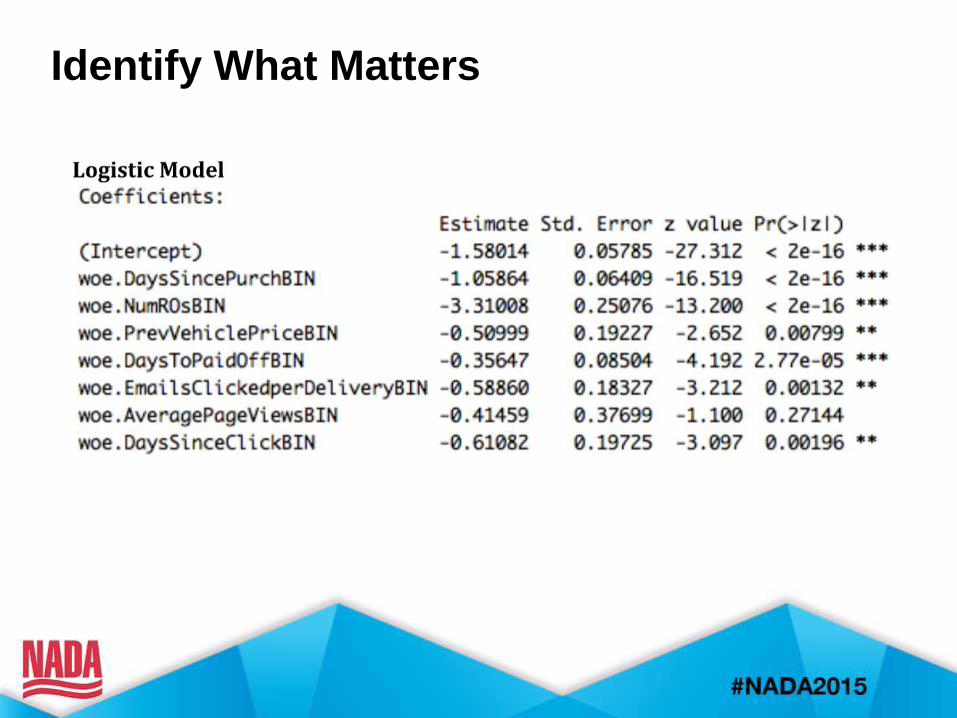
Identify What Matters
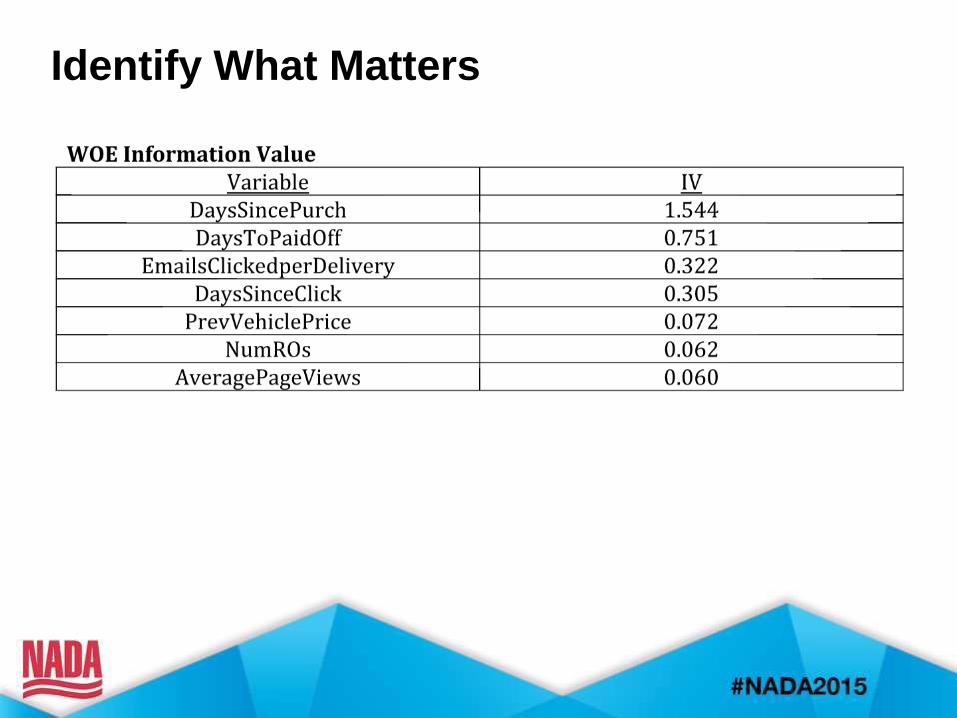
Identify What Matters
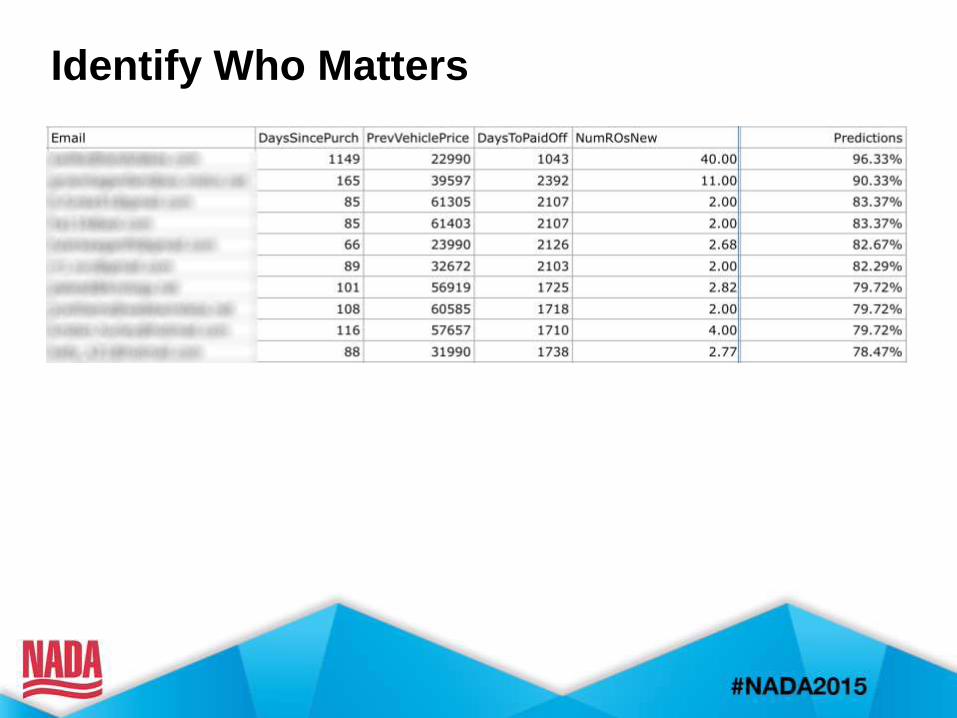
Identify Who Matters

42
Customers don’t tell you what
they want, they show you.
Personalized Sales
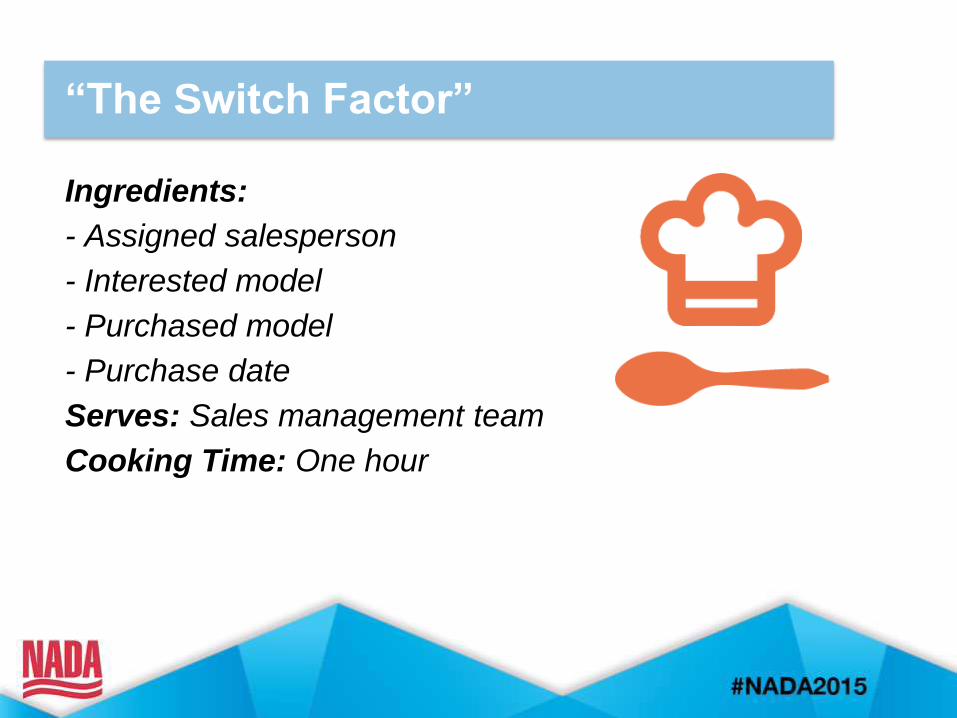
“The Switch Factor”
Ingredients:
- Assigned salesperson
- Interested model
- Purchased model
- Purchase date
Serves: Sales management team
Cooking Time: One hour
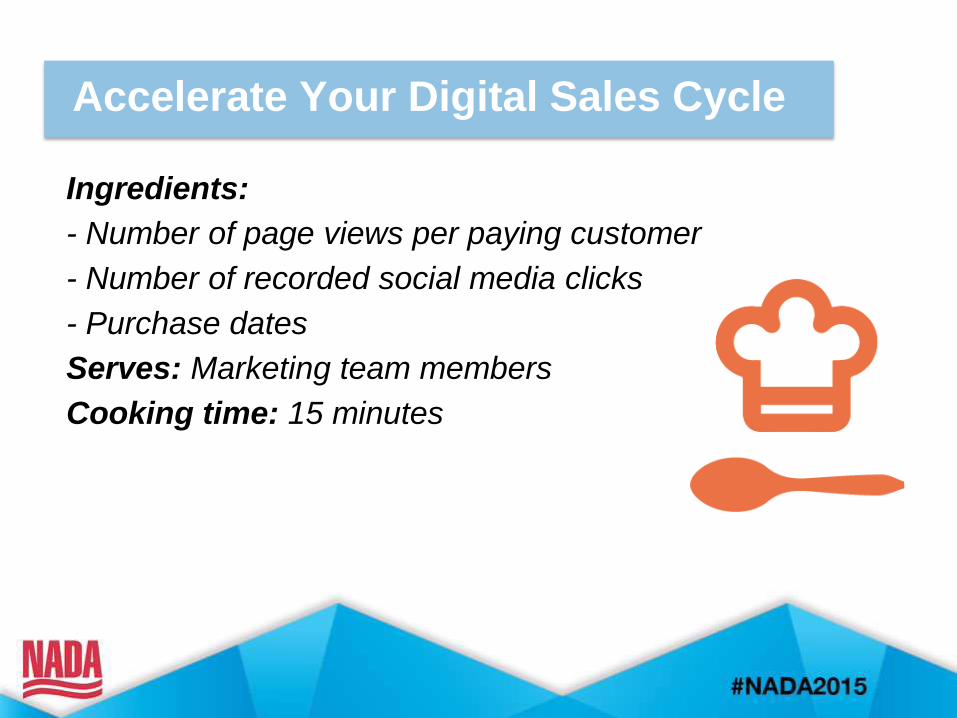
Accelerate Your Digital Sales Cycle
Ingredients:
- Number of page views per paying customer
- Number of recorded social media clicks
- Purchase dates
Serves: Marketing team members
Cooking time: 15 minutes
The Solution
• Double email open and click rates
• Increase sale quota fulfillment 9.3
percent
• Know customers are ready to buy
before they tell you
47
Questions?
48
Scott D. Meyer
CEO/Brofounder
9 Clouds
Sioux Falls, SD
855-925-6837
49
Before a Form:
Predictive Analytics for Sales
Your Photo
Goes Here
Please visit the NADA University Online booth in the Expo Hall for
information on accessing electronic versions of this slide presentation
and the accompanying handout material, and to order the workshop
video-recording.