
Use of predictive analytics in B2B sales lead generation
45
Use of predictive analytics in B2B sales lead generation Anna-Maria Lindberg Master’s Thesis Degree Programme in Information Systems Management 2018
Transcript of Use of predictive analytics in B2B sales lead generation

Use of predictive analytics in B2B sales lead generation
Anna-Maria Lindberg
Master’s Thesis
Degree Programme in
Information Systems Management
2018

Abstract
25.11.2018
Author(s) Anna-Maria Lindberg
Degree programme Information Systems Management
Report/thesis title Use of predictive analytics in B2B sales lead generation
Number of pages and appendix pages 41
The aim of this study is to investigate the possibilities of using predictive analytics as a part
of the B2B lead generation in the case company Fonecta. The target is to examine how
predictive analytics is used in the current lead process as well as identify areas of improve-
ment and new possibilities of using predictive analytics.
The theoretical framework of this study describes the two main domains related to this
study: B2B lead generation and predictive analytics. The theoretical framework covers in
more detail the different areas of predictive analytics, including the related machine learn-
ing algorithms as well as specific applications of predictive analytics in marketing.
The current lead generation process and the use of predictive analytics in the process was
examined based on documentation review and workshops with the stakeholders.
Pilot cases for testing new ways of using predictive analytics in the lead process were se-
lected based on discussions in the workshops that were held for the stakeholders. The pi-
lot cases were run for a two month period after which the results were analyzed and valida-
tion of the selected predictive model was carried out. No statistically significant results on
the pilot cases were achieved during the pilot period.
Main suggestions for future includes extending the selected pilots cases for a longer period
in order to gain significant results as well as the utilization of behavioural data as a part of
the predictive model.
Keywords predictive analytics, lead generation, B2B marketing, marketing automation, machine learning

Table of contents
1 Introduction ................................................................................................................... 1
2 Objectives and research questions ................................................................................ 2
3 Methodology ................................................................................................................. 3
3.1 Data collection ...................................................................................................... 3
3.2 Data analysis ........................................................................................................ 4
3.3 Validation .............................................................................................................. 5
4 Lead generation in B2B marketing ................................................................................ 6
4.1 B2B lead generation channels .............................................................................. 6
4.2 Inbound marketing model ...................................................................................... 7
4.3 Role of marketing automation ............................................................................... 9
4.4 Lead qualification ................................................................................................ 10
4.5 Cases ................................................................................................................. 11
5 Predictive analytics ..................................................................................................... 13
5.1 Supervised machine learning .............................................................................. 13
5.1.1 Bayesian networks ................................................................................... 14
5.1.2 Decision trees .......................................................................................... 15
5.1.3 Random forest ......................................................................................... 15
5.1.4 Support vector machines .......................................................................... 16
5.2 Unsupervised learning ........................................................................................ 17
5.2.1 Clustering ................................................................................................. 17
5.2.2 Association rules ...................................................................................... 18
5.3 Neural networks .................................................................................................. 19
5.4 Reinforcement learning ....................................................................................... 20
5.5 Testing predictive models ................................................................................... 21
6 Predictive analytics in marketing ................................................................................. 23
6.1 Clustering models ............................................................................................... 25
6.2 Propensity models .............................................................................................. 26
6.3 Reinforcement learning and collaborative filtering ............................................... 27
6.4 Case: Micro-segmentation of business mobile subscribers ................................. 28
7 Implementation............................................................................................................ 29
7.1 Current lead process and use of predictive analytics........................................... 29
7.1.1 Predictive analytics in lead generation channels ...................................... 30
7.1.2 Analytics solution ..................................................................................... 31
7.2 Creating the predictive model .............................................................................. 31
7.3 Pilot use cases .................................................................................................... 33
8 Results and validation ................................................................................................. 34
8.1 Recommendations for future ............................................................................... 35

9 Conclusions ................................................................................................................ 37
References ...................................................................................................................... 39

1
1 Introduction
Fonecta is a marketing partner for Finnish companies in digital marketing and data ser-
vices. The product offering covers a variety of different solutions for companies, including
solutions for web presence, digital advertisement as well as data and analytics services.
Fonecta offers solutions to companies of all sizes but majority of the current customer
base consists of small and medium sized companies (SMEs). Currently it has approxi-
mately 40 000 business customers.
Lead generation has been a fundamental part of Fonecta’s B2B marketing for the past
three years. In 2015 the company started to use and develop lead generation and market-
ing automation in a systematic way which have yielded promising results, especially with
the SME companies. Currently around 30-40 % of sales to SMEs are done based on
leads.
Focus has been on constant and iterative development of the lead process, until now it
has concentrated more on implementing cultural change which has been one of the key
aspects of successful adoption. As the process starts to be more mature the efficient use
of predictive analytics is increasing its importance for future success.
Predictive analytics offers possibilities in several ways when integrated into the lead gen-
eration process. It can help to identify and prioritize sales leads allowing personnel to fo-
cus on the most profitable customers – as unqualified leads cost valuable time and
money. Predictive analytics can also support implementing personalized messaging with
customers in order to deliver excellent customer experience which is more important than
ever in today’s digital world. (Hale 8 May 2018.)
Use of accurate business intelligence will be a differentiator for companies in the future.
Hale (8 May 2018) outlines a simple reason why every company should be using predic-
tive analytics: “Go beyond learning what happened and why to discovering insights about
the future, and you’ll better serve your customers today.”

2
2 Objectives and research questions
The purpose of this study is to investigate the current use and future possibilities of using
predictive analytics as part of the lead generation process.
The three main objectives of the study are to:
- Identify new ways of using predictive analytics in the lead process.
- Select use cases and pilot using predictive analytics in new parts of the lead pro-
cess.
- Analyze if using predictive analytics had any significant improvements in the se-
lected pilot use cases and make recommendations for future.
Based on the objectives the main research questions for this study are following:
- RQ1: How are predictive analytic methods used in different parts of the company’s
lead process at the moment?
- RQ2: How could use of predictive analytics in lead generation be improved?
- RQ3: How can the results of the pilot use case be analyzed and reported?
- RQ4: What are most promising use cases for future development?
The scope of the development project is to assess the suitability of using predictive analyt-
ics in the selected areas of Fonecta’s own lead generation process. More use cases and
development areas might be found during the study but those are out of the scope for this
thesis. Recommendations for future are constructed during the thesis but taking them into
production use is not in the scope.

3
3 Methodology
This study was carried out between March 2018 and November 2018. The related pilot
cases were run between September 2018 and October 2018. Study was conducted as a
case study and as an action research. The results from this study are specific for the tar-
get organization’s processed and cannot be generalized. The study aims to iteratively im-
prove the use of predictive analytics in lead generation. People involved in the study are
working closely with the lead generation activities which is why action research was se-
lected.
3.1 Data collection
Data was collected through workshops, literacy and documentation review and by gather-
ing data from CRM (Customer Relationship Management) and marketing automation sys-
tems.
Literacy review was conducted in the beginning of the study to find a suitable model or
models for using predictive analytics in the pilot cases of this study. The review covered
different areas of predictive analytics and machine learning as well as their possible appli-
cations in marketing.
Two workshops were held regarding the development project: first one in June 2018 and
second one in October 2018. Key persons involved in the lead generation process partici-
pated in both workshops: stakeholders from analytics, lead generation and marketing
functions. In workshops existing solutions for predictive analytics were opened up in detail
in order to gain mutual understanding of the current way of working. After that brainstorm-
ing was used in order to gain ideas for pilot cases or other future development ideas for
using predictive analytics.
After the selection of the pilot cases data from the CRM system was extracted as the ana-
lytic dataset for the selected predictive model. Leventhal (2018, 27) describes five steps of
data preparation for predictive models which were carried out also in data preparation part
in this study:
1. Data selection: selection of the leads and attributes to be included in the dataset.
2. Data cleansing: removal of lead data that could not be mapped to a certain prod-
uct or lead data that was not relevant for the model.
3. Constructing data: mapping of the lead data with existing attributes in the model.

4
4. Integrating data: merging of the lead dataset with the existing dataset containing
data of sales calls performed by the sales personnel.
5. Formatting data: formatting of the lead data so that it could be imported in to the
predictive modelling software.
As new relevant lead data was created in the CRM system also during the pilot period, the
data was automatically integrated as a part of the training data for the predictive model.
This allowed the model to learn and gather new training data also during the pilot period.
3.2 Data analysis
Results from the pilot cases were gathered from both marketing automation and CRM
systems. The response rates for the selected pilot cases were gathered from the market-
ing automation system: number of email deliveries, opens and clicks. Lead hit rates were
collected from the CRM system. Lead hit rates provided indication about the lead quality
in the pilot cases.
The quantitative data about the pilot cases was gathered from the CRM and marketing au-
tomation systems on November 8th, a week after the pilot period was over. One week pe-
riod before the result extraction was needed in order for most of the email opens and
clicks to accumulate.
Number of opened emails is a fairly unreliable metric for engagement as it is dependent
on the respondent downloading images in the email in order to trigger a tracking pixel.
Therefore the number of opens is reported in the results but it was not used for assess-
ment of the model. Number of clicks compared with the delivered emails was considered
as the most important indicator for customer’s engagement with the email content. For
that reason the click-rate in the emails was selected as the most important factor when
analysing the validity of the predictive model.
History data about the same campaigns during September 2017 and October 2017 was
extracted from the marketing automation and CRM systems for comparison and validation
of the predictive model.

5
3.3 Validation
The validity of the predictive model was assessed by comparing the results for each of the
pilot case campaigns with the results in the same campaign in 2017. Due to technical limi-
tations simultaneous tests with the previous and new versions of the predictive models
were not able to be carried out so the most relevant point of comparison was found to be
the same campaigns in 2017.
The assessed metrics included number of delivered emails, number of opens, number of
clicks and hit rate to leads. As stated earlier the click-rate in the emails was selected as
the key factor for analysing the validity of the predictive model. The results of each email
campaign were tested for statistical significance using 95 % confidence level and two-
tailed test in order to see if the new predictive model has caused changes in email en-
gagement to either direction. The statistical tests compared number of delivered emails
and number of email clicks for each of the campaigns in 2017 and 2018.
The lead hit rate for each of the campaigns was analysed and compared to results in
2017. As the data was extracted only one week after the pilot period it is possible that the
hit rate for the pilot campaigns will improve over time. Therefore the lead hit rate was only
used as an indicative metric in addition to the email metrics.
6
4 Lead generation in B2B marketing
There is no universal definition for a lead – appropriate definition for a lead depends on
the company’s processes. Most often a lead is defined as someone who has been identi-
fied to have shown interest in the company’s products or services. (Flaherty 7 June 2018.)
Lead generation is the process of converting interest to the company’s products or ser-
vices into actionable information: names and contact details that the sales team can pur-
sue (Fleming 1 June 2017). This is often seen as the main goal and measurement for B2B
marketing (Paul & Schwartzman 2010, 157).
Previously B2B marketers have been doing this for example by sales calls or attending
trade shows. Traditional outbound marketing has utilized mass communications like ad-
vertisements, events and direct mailings as lead generation tools to attract prospects.
(Paul & Schwartzman 2010, 157-158.)
In the digital world more methods are now available, for example through search engines
and social networks. These new digital lead generation channels are able to bring the
same results as traditional channels but often more cost effectively. (Paul & Schwartzman
2010, 157-158.)
4.1 B2B lead generation channels
According to Hillsberg (10 July 2018) the most important channels for B2B lead genera-
tion include social media, pay-per-click advertising, blogging and email.
Social media as a lead generation channel has fairly good reach but it has been estimated
that social media has often lower conversion rates compared to other digital channels for
B2B lead generation. Wide reach makes it a good channel for example for building aware-
ness by promoting an e-book. The most relevant B2B social media at this time is LinkedIn.
(Hillsberg 10 July 2018.)
Pay-per-click (PPC) lead generation campaigns can cover a number of different platforms,
most often used are Google AdWords and Google Display Network. PPC advertisement is
an efficient way to support the organic visibility when thinking of lead generation. (Hills-
berg 10 July 2018.)

7
Blogging can be used as a channel for creating interesting and valuable content for se-
lected audiences. It will help to attract people to the company website and convert that
traffic to high quality leads. (Hillsberg 10 July 2018.)
Email marketing is an essential part of lead generation: in 2014 it was selected as the best
digital marketing channel for B2B by Chief Marketer study. In 2016 in State of B2B Digital
Marketing Report it was top of digital channels for generating leads in US B2B market.
Predictive analytics and artificial intelligence algorithms that are available today enable the
use of email as targeted and personalized marketing channel. (Hillsberg 10 July 2018.)
All of these channels can be used in combination with inbound marketing to drive traffic at
the top of the inbound marketing funnel. Inbound marketing is covered more in-depth in
the next chapter.
4.2 Inbound marketing model
Inbound marketing model is based on observing the customer’s actions and generate lead
when those actions indicate that they are ready to buy (Paul & Schwartzman 2010, 158).
The key aspect is that the potential customer is exposed to company’s relevant content
when searching for information proactively. In order to get access to this relevant and val-
uable information (typically for example e-book or whitepaper) the prospect usually is
obliged give their contact information in return. Important aspect is that the prospect is
opting in to receive the information from the marketer. Inbound marketing model is based
on the company demonstrating know-how on the topic and building trust with the potential
customer. (Kurvinen & Seppä 2016, 189.)
When the potential customer has entered in the inbound marketing funnel the company
tries to predict potential customer’s needs and communicate them with messages tar-
geted for that specific stage in the buying process where the prospect is in. With the tar-
geted messaging the potential customers are being nurtured towards making a purchas-
ing decision. (Paul & Schwartzman 2010, 157-158.)
Often this can be more productive than traditional marketing channels, like advertising and
direct mail, which focus on broad reach and frequency to reach the potential buyer at the
right moment. Example of inbound marketing process is illustrated in the Figure 1. (Paul
& Schwartzman 2010, 157-158.)

8
Figure 1. Example content along buyer’s journey in inbound marketing lead generation
process (Paul & Schwartzman 2010, 157-158)
The information about the customer will typically transfer automatically to the marketing
automation system. Based on the downloaded content the lead can be categorized as a
sales ready lead or someone just indicating their interest in the topic. Lead nurturing pro-
cesses can be automated to further qualify or warm up the leads that are not yet consid-
ered to be ready for sales. (Kurvinen & Seppä 2016, 197; Halligan & Dharmesh 2014,
125-128.)
According to Kurvinen and Seppä (2016, 189) the marketing objectives in inbound market-
ing can be divided to four different stages: attract, convert, close and after care. Process
and typically used tactics are illustrated in Figure 2.

9
Figure 2. Inbound marketing process (Kurvinen & Seppä 2016, 189)
Interesting and high-quality content is one of the most effective ways to attract visitors to a
company’s website. Organic visitors generated through web searches are very interesting
from company’s point of view because they have an identified need. Other fairly used tac-
tic is also utilizing social media channels and be involved in the discussions in the social
media. (Kurvinen & Seppä 2016, 190-191.)
The goal is to convert the visitor into a lead by getting the customers contact information
and marketing permission. Landing pages and contact forms for downloading content usu-
ally include asking for the consent. (Kurvinen & Seppä 2016, 192.)
Closing stage is focused on identifying the most potential leads for turning into a cus-
tomer. This will help to allocate sales resources to right leads. (Kurvinen & Seppä 2016,
196.)
Last stage is after care. Often B2B companies are guilty for forgetting their customers af-
ter closing the sale: the next touchpoint is usually the invoice. Website personalization or
onboarding messages are effective ways to improve customer experience for exiting cus-
tomers. (Kurvinen & Seppä 2016, 200-201.)
4.3 Role of marketing automation
Lead generation and inbound marketing are often implemented with the help of marketing
automation which analyses data gathered from different digital touchpoints. Marketing au-
tomation solutions can provide useful insights about the potential customers: for example

10
about role in the company, consumed content, topics of interest or in which channels the
person is most active in. (Rubanovitsch 2018, 84; Kurvinen & Seppä 2016, 197.)
With the collected data, marketing can more accurately target the persons who show the
most potential for buying. Those can be for example people who have filled out a form in
the web page or subscribed to blog posts. Often marketing automation solutions offer also
a lead scoring solution which can help to identify the most potential leads. Data collected
into the marketing automation system also helps to target future messages to relevant
customers and through that also deliver value to the customer. (Rubanovitsch 2018, 84;
Kurvinen & Seppä 2016, 197; Halligan & Dharmesh 2014, 125-128.)
Marketing automation and automated workflows allow companies to effectively take po-
tential customers through the buying process. Often the process can be set up based on
predefined rules and is used to automate the communication to the leads. (Kurvinen &
Seppä 2016, 197.)
Sales ready leads can be transferred to the CRM system automatically with all the rele-
vant data about different touchpoints with the lead. Information will assist sales to modify
their sales approach based on the lead action. Keeping track of the lead source will ena-
ble to report return of investment on marketing activities. (Kurvinen & Seppä 2016, 197.)
4.4 Lead qualification
The quantity of leads is often seen as the most important measure in B2B marketing but it
is important to measure also the quality of the leads. Quality in this context means the
leads that are most likely to turn into good customers. Measuring quality in addition to
quantity will help to assess the effectiveness of the marketing efforts and focus sales re-
sources to the most potential leads. (Halligan & Dharmesh 2014, 125-128.)
Qualification process can use collected data, proprietary data as well as behavioral data
to measure the lead quality (Kurvinen & Seppä 2016, 269). According to Halligan and
Dharmesh (2014, 127-128), useful metrics to define lead quality include the following:
Referral channel
Data on lead referral channels should be analyzed to see which ones are the most effec-
tive and provide the most potential leads. Referral channels can be for example email
newsletter, social media page or Google search.

11
Website visits
The frequency and time of the website visits in addition to the information of the specific
pages visited is a good indicator for lead quality. For example a potential customer who
has visited website’s pricing page is most likely quite long in the buying process and
makes him/her a very promising lead.
Call-to-action taken
Typically becoming a lead requires completing a call-to-action in a website, for example
filling out a form. Type of the form and call-to-action can be an indicator of the lead quality:
requesting a call or a demo could generate higher quality leads than just downloading a
whitepaper.
Form responses
Often the forms include questions related to the company size and industry which can be
used to recognize high quality leads.
4.5 Cases
Case ServiceMaster Solutions: Local B2B marketing
The case was described by Kirkpatrick (15 August 2012) in Marketing Sherpa research
institute’s repository of case studies on lead generation.
ServiceMaster Solutions was one of the biggest commercial facility cleaning franchises in
the United States in 2012. As the company sells local services to businesses they had
reached limit in building relationships with the traditional methods.
Even for a local service provider digital channels were an effective way to find new cus-
tomers. When starting the digital initiative ServiceMaster had only basic web presence
without a strategy for digital marketing.
A new website for the company was launched and after that search engine optimization
and pay-per-click advertising were used as lead generation channels to attract visitors to
the site. The new digital marketing program generated new incoming leads to Service-
Master. Their website offered the visitor options to fill out a form or call to ServiceMaster
directly.
Due to nature of the industry people more often preferred to call than wait for the company

12
to respond after filling out the form. This required some special attention so that the leads
were handled correctly. Digital tracking could be implemented fairly easily but tracking
leads from the phone calls required manual work.
Results from the marketing program were very positive, including for example:
Lead generation increased 150 % from 2010 to 2011
Search engine optimization provided 1,500 % ROI in 2011
Pay-per-click advertisement provided 200 % ROI in 2011
Case Managed Maintenance: Marketing automation and CRM
The case was described by Kirkpatrick (29 May 2013) in Marketing Sherpa research insti-
tute’s repository of case studies on lead generation.
Managed Maintenance is a professional management services provider for technology as-
sets. The company had already taken digital channels in their marketing strategy and uti-
lized both marketing automation and CRM software. The challenge was that the solutions
were separate and not sharing data.
The problem was solved by replacing both solutions at the same time while ensuring the
new solutions were integrated and able perform the key tasks. This helped to align mar-
keting and sales operations for example by giving greater transparency and data visibility
to the salespersons.
The new solutions also provided marketing opportunities in the form of lead scoring and
lead nurturing programs. New lead scoring program used several different criteria, explicit
like industry and company size and implicit like email opens and clicks or website visits.
The different criteria are assigned a point value. When a prospect has reached a defined
lead score limit a sales opportunity is created directly in to the CRM system. In the CRM
solution the salesperson can indicate that he/she doesn’t think the lead is ready for sale
and lead is sent back to marketing for lead nurturing.
After the new solutions were taken into use, lead generation increased 75 % over the pre-
vious year while at the same time share of the technology solutions from the marketing
budget decreased. 30 % of new business in 2012 was run through the marketing automa-
tion solution.

13
5 Predictive analytics
Predictive analytics is a form of advanced analytics and can be defined as a blanket term
for predicting future trends, events and behavior by applying machine learning algorithms
and statistical analysis techniques. Predictive analytics process is based on an algorithm
that analyzes current and historical data in order to predict future behavior or activity. Typ-
ically the output is a score or code indicating the likelihood of future behavior or event.
(Leventhal 2018, 4-6; Kandarp 30 June 2017.)
Analytical modelling is usually split to two different types: prescriptive and descriptive. Pre-
scriptive model tries to predict predefined target variable for each object. Typical use case
of prescriptive model are campaign response models that can be used to predict if cus-
tomer will renew their order. (Leventhal 2018, 8-9.) On contrary to prescriptive models, de-
scriptive models are not restricted by any predefined outcome. Often these models are
more strategic, typical use case for descriptive model could be dividing customers into
segments. (Leventhal 2018, 11.)
There are many different machine learning algorithms that can be used in predictive mod-
els. The choice of algorithm should be made based on the required output from the model:
is the analytical model prescriptive or descriptive. Machine learning algorithms can be cat-
egorized similarly into three different categories: supervised machine learning, unsuper-
vised machine learning and reinforcement learning. (Bell 2014, 3.)
5.1 Supervised machine learning
Supervised learning algorithms use labelled training data to calculate output. Every data
set in the training data will have both input and output objects. (Bell 2014, 3.) Supervised
learning algorithms concentrate on finding a relationship between the output and input in
the training data. Using the findings from the training data the algorithm will use this to
predict output for new data sets. (Gollapudi 2016.)
Four widely used supervised learning algorithms are presented in more detail in this chap-
ter: Bayesian networks, decision tree, random forest and support vector machines.

14
5.1.1 Bayesian networks
Bayesian networks uses a graph containing nodes and arcs to define the relationships be-
tween causes and effects. Each of the nodes in the graph contains the probabilities of the
different outcomes and the arcs explain the relationships between them. When data is en-
tered into the network, outcomes can be predicted based on the nodes’ probabilities. As
the nodes are connected, the resulting value in one node will affect the output probability
of another node. (Bell 2014, 69; Leventhal 2018, 81.)
Practical example of Bayesian network can be seen in the Figure 3 where there are three
different diagnoses for a patient: tuberculosis, lung cancer or bronchitis. The probabilities
for the different diagnoses are recalculated as more insights on the patient are revealed.
Figure 3. Bayesian network in a diagnostic example (Vomlel 2005)

15
5.1.2 Decision trees
Decision tree is formed of nodes and each of the nodes is associated with one input varia-
ble. The edges going out from the nodes are the possible values of that node. Decision
trees start with a root node and end on a leaf (end node). End node illustrates the output
which is calculated using the values given from the input variable in the path from the root
node to the end node. (Bell 2014, 48.)
The decision tree algorithm uses the training data set to figure out which variables are the
most important. The most important variables are placed at the top and towards the end
nodes the variables come less significant. (Brink, Fetherolf & Richards 2016.)
Figure 4 displays a decision tree that is used in a loan decision. The root node in the tree
is “Age” and it has two edges coming from it, whether the customer is under 55 years or
older than that. The age of the customer impacts what happens after that. If the customer
is under 55 then the model is requiring the information is he/she is a home owner. If the
client is older than 55 then information about the customer’s credit rating is required. (Bell
2014, 49.)
Figure 4. Example of a decision tree for loan decision (Bell 2014, 48)
5.1.3 Random forest
Decision tree introduced in the previous chapter is also the basis of random forest algo-
rithm. Known issue with decision trees is that the top nodes of the tree have a very large
impact on the output. Especially if the new data does not have the same distribution as

16
the training data, the model’s ability to make generalizations might be limited. (Brink & al.
2016.)
Random forest algorithm solves this issue by creating a set of decision trees to reduce the
risks described earlier. Variables that are used in splitting are randomized in order to re-
duce correlation between the variables. The outputs of the decision trees are combined
and the final output from the random forest can be calculated either by majority vote (in
classification case) or mean (in regression case) of the decision tree outputs. (Brink & al.
2016; Dean 2014, 106.)
5.1.4 Support vector machines
Support vector machine is a technique for object classification. It is especially useful for
more challenging cases where there are many types of classes. Support vector machine
can be visualized as two or three dimensional plot with each object located within and
every object is a point in that space. (Bell 2014, 139-140.)
In two dimensional settings support vector machines work as classifiers that define a line
that separates the different classes in the best possible way. If there are more than two
dimensions, the separator is a hyperplane in that space dividing the objects to classes.
(Song 20 February 2018.)
Figure 5. Visualization of support vector machine (Song 20 February 2018.)

17
Support vector machines are utilized in many different classification tasks, typical exam-
ples are pattern and image recognition as well as text classification. Also other fields like
medical science are using support vector machines for example for classifying proteins.
(Bell 2014, 140.)
5.2 Unsupervised learning
Unsupervised learning is based on algorithm finding a pattern in the unlabelled input data
(Bell 2014, 3). This means that the algorithm learns from examples without any associated
responses allowing the algorithm to find out the data patterns on its own. Unsupervised
algorithms are able to provide useful insights into the meaning of data and also generate
new inputs that could be used in supervised machine learning algorithms. (Mueller & Mas-
saron 2016, 169.)
Two widely used supervised learning algorithms are presented in more detail in this chap-
ter: clustering and association rules.
5.2.1 Clustering
The goal of clustering is to organize a group of similar objects from the given data (Bell
2014, 161). Classified patterns are found without any prior classification and the results of
the clustering may vary depending on how the initial center points were selected. There
are two types of clustering algorithms: hierarchical and partitional algorithms. (Gollapudi
2016.)
Hierarchical clustering algorithms focus on finding clusters that are hierarchical: either by
dividing a large cluster to a smaller ones or combining small clusters into a larger one.
The hierarchy of clusters can be represented as a dendogram or a Venn diagram which
are shown in Figure 6. (Gollapudi 2016.)

18
Figure 6. Representations of hierarchical clustering: dendogram on the left and a Venn di-
agram on the right (Gollapudi 2016)
Partitional clustering algorithms use predefined domain specific criteria to generate the
clusters. There is no hierarchy between the clusters as they are mutually exclusive. Unlike
hierarchical clustering, partitional clustering algorithms require an input that defines the
number of required clusters. Commonly used partitional clustering algorithm is k-means
algorithm where k indicates the number of expected clusters. (Gollapudi 2016.)
Cluster analysis is used in several areas of our daily lives: in digital applications in the
form of social media network analysis in order to target advertising, in business they are
widely used by market research companies and even in law enforcement to predict future
crime locations and times. (Bell 2014, 162-163.)
5.2.2 Association rules
Association rules learning is used to find patterns and associations between objects as
well as the transactions that resulted in a correlated result. An association rule represents
a pattern that describes the probability of an event based on occurrence of another event,
helping to find out relationships between objects often used together. (Bell 2014, 117; Gol-
lapudi 2016.)
The aim is to find all the sets of objects that have greater support than minimum support
using the dataset to predict the rules that have confidence greater than the minimum con-
fidence. Typical example of the association rule is the market basket example: if a cus-
tomer buys product X, he or she is likely to buy product Y as well. (Gollapudi 2016.)
19
Typically association rules learning is used for examining transactions, like point-of-sales
systems data or web usage data. Web usage data can be used for example to suggest
pages to users that they might be interested in to keep a website more compelling. (Bell
2014, 117-118)
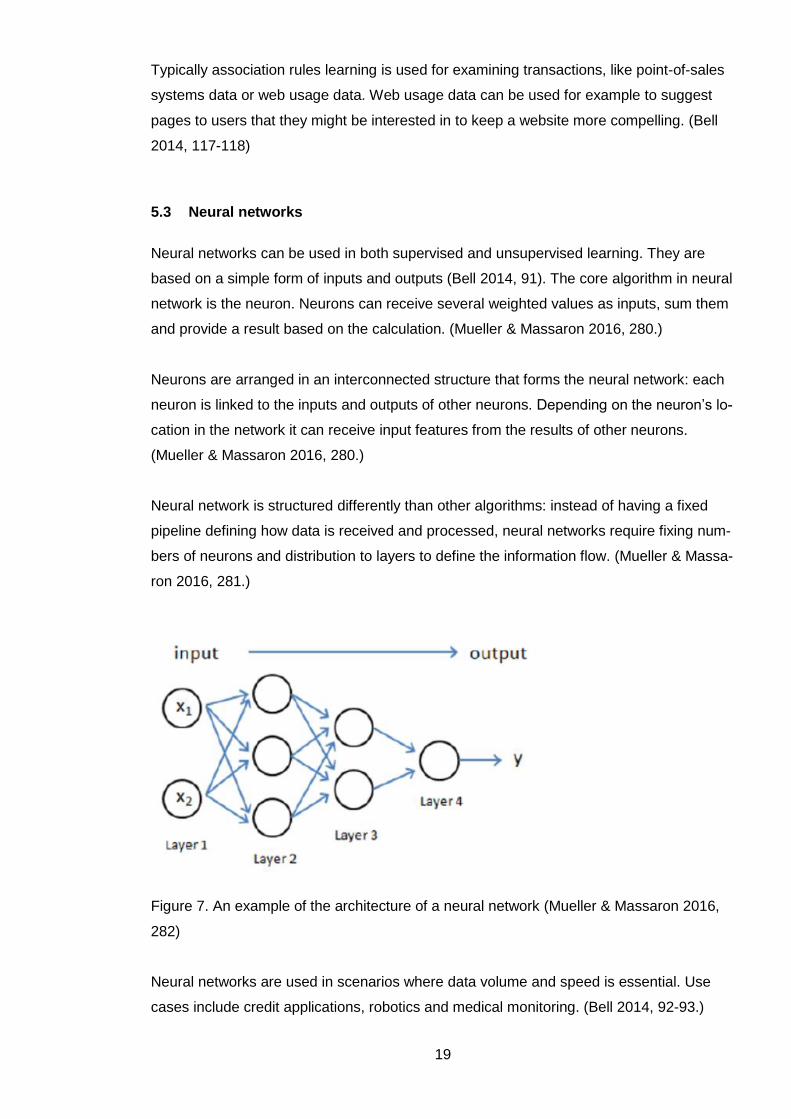
5.3 Neural networks
Neural networks can be used in both supervised and unsupervised learning. They are
based on a simple form of inputs and outputs (Bell 2014, 91). The core algorithm in neural
network is the neuron. Neurons can receive several weighted values as inputs, sum them
and provide a result based on the calculation. (Mueller & Massaron 2016, 280.)
Neurons are arranged in an interconnected structure that forms the neural network: each
neuron is linked to the inputs and outputs of other neurons. Depending on the neuron’s lo-
cation in the network it can receive input features from the results of other neurons.
(Mueller & Massaron 2016, 280.)
Neural network is structured differently than other algorithms: instead of having a fixed
pipeline defining how data is received and processed, neural networks require fixing num-
bers of neurons and distribution to layers to define the information flow. (Mueller & Massa-
ron 2016, 281.)
Figure 7. An example of the architecture of a neural network (Mueller & Massaron 2016,
282)
Neural networks are used in scenarios where data volume and speed is essential. Use
cases include credit applications, robotics and medical monitoring. (Bell 2014, 92-93.)

20
5.4 Reinforcement learning
Reinforcement learning process starts similarly to unsupervised learning: unlabeled data
is provided as an input into the algorithm. Based on what the algorithm proposes a posi-
tive or negative feedback is provided. (Mueller & Massaron 2016, 169.) Reinforcement
learning is commonly modeled as a Markov Decision Process as seen in Figure 8.
Figure 8. Markov Decision Process (Sutton & Barto 2018, 48)
Reinforcement learning focuses on maximizing the rewards from the provided results. The
algorithm receives a periodic reward based on the made decisions. The results from rein-
forcement learning may require several steps to be executed before a result. The goal is
that by exploring the data algorithm is able to generate a sequence of decisions to
achieve the highest reward. (Gollapudi 2016.)
Reinforcement learning faces the challenge of making a trade-off between exploration and
exploitation. The reinforcement learning algorithm prefers actions that it has found to be
successful in the past in order to achieve the highest reward. But in order to find those ac-
tions the algorithm needs to try actions that have not been tested before. So a balance be-
tween the two activities must be found in order to succeed. (Sutton & Barto 2018, 3.)
Applications of reinforcement learning can be seen in several domains: games, computer
cluster resource management, traffic light control, robotics as well as personal recommen-
dations and digital advertisement bidding. (Towards Data Science 2 August 2018.)

21
5.5 Testing predictive models
When using predictive models in real business cases testing is a controlled way to intro-
duce the different strategies: testing helps to understand the effects of the models and
manage the possible risks. Testing predictive models contains three stages:
1. Designing the experiment to test the changes.
2. Composing a test sample, running the experiment and measuring the results.
3. Interpreting the results and making conclusions.
(Leventhal 2018, 207.)
When testing requires composing a sample from a population, it is possible that the ob-
served change would have occurred only due to a sampling error. In statistical hypothesis
testing, the result from the test is statistically significant when it is very unlikely to have oc-
curred by chance. (Wikipedia 2018c.)
Statistical significance is used to determine if the null hypothesis should be rejected. The
hypothesis to be tested is null hypothesis H0 and the alternative hypothesis H1. Typically
null hypothesis is a statement that there is no effect or difference. Alternative hypothesis is
tested against that, stating that there is an effect or difference. (Wikipedia 2018a; Wikipe-
dia 2018c.)
P-value is the probability of observing an equal or more extreme effect or a difference as-
suming that the null hypothesis is true. If the p-value of the observed change is less than
the defined significance level for the test, a conclusion can be made that the results reflect
the whole population and the null hypothesis can be rejected. The significance level for a
test should be defined before data collection. Depending on the field, the significance level
is typically set to 5 % or less. Other commonly used levels are 1 % and 0,5 %. (Wikipedia
2018b; Wikipedia 2018c.)
The test for statistical significance can be computed either as one-tailed test or two-tailed
test. The one-tailed test is appropriate if the alternative hypothesis specifies that the pre-
dicted value difference to the reference value is directed to one direction. In two-tailed test
the difference with the reference can be in either direction. (Wikipedia 2018c.)
In a one-tailed test the region for the defined significance level is placed to one end of the
sampling distribution and in two-tailed test the defined significance level is split to both

22
ends of the distribution. Due to this on-tailed test is more powerful if the assumed direction
of the alternative hypothesis is correct. Differences in the one-tailed and two-tailed tests is
illustrated in Figure 9 and Figure 10. (Wikipedia 2018c.)
Figure 9. Example of a p-value computation in one-tailed-test (Wikipedia 2018b)
Figure 10. Example of a two-tailed test where the significance level of 0,05 is split to both
ends of the distribution (Wikipedia 2018c)

23
6 Predictive analytics in marketing
For the purpose of marketing, predictive analytics if often used to predict the behaviour of
an individual customer or group customers together so that they are actionable and mean-
ingful for marketing. Predictive analytics can be used for example to predict what and
when a customer is going to buy next or recognize different types of buyers based on the
purchase data. Marketers can use this data to recommend certain products to customers
proactively. (Artun & Dominique 2015, 24-25.)
Artun and Dominique (2015, 25) outline the following three use cases of predictive analyt-
ics in marketing:
1. Unsupervised learning is used to find hidden patterns in data. Unsupervised algorithms
are typically used expose the underlying segmentation of the data, for example by finding
groups of similar customers in the customer base without knowing in advance what kind of
segments exist.
2. Supervised learning is used to estimate an output when given an input, by training the
algorithm with sample inputs and target. Example of a use case of supervised learning is
predicting product or service a customer is most likely to buy next.
3. Reinforcement learning leverages hidden patterns and similarities in the data to predict
for example the best next steps or products for a customer. Reinforcement algorithms are
most typically used for recommendations. Reinforcement learning is an option for the su-
pervised learning case especially in cases where no labeled training data set is available.
Leventhal (2018, 9-11) uses slightly different categorizations to predictive and prescriptive
models. Predictive models are similar to supervised learning where the model is designed
to give out a particular output. Tables 1 provides examples of marketing applications of
predictive models and the related business questions.

24
Table 1. Examples of use cases of predictive models in marketing (Leventhal 2018, 9)
Application Question
Customer selection from prospects Which prospects are most likely to buy?
Cross-sell and up-sell campaigns Which existing customers of a particular prod-
uct are the most likely to buy another product
or buy more of the particular product?
Next Best Offer Which product customer is likely to buy next?
Customer retention Which customers have the highest likelihood of
lapsing?
Customer lifecycle management How long it will take for the customer to likely
lapse?
Win-back campaign Which of the former customers are most likely
respond to a win-back campaign?
Customer lifetime value What is the predicted future value of purchases
for customers?
Prescriptive models is an umbrella term covering unsupervised learning and reinforce-
ment learning where no output is designed beforehand. Examples of marketing applica-
tions of prescriptive models and the related business questions are listed in Table 2.
(Leventhal 2018, 11.)
Table 2. Examples of use cases of prescriptive models in marketing (Leventhal 2018, 11)
Application Question
Customer segmentation What are the factors explaining differences be-
tween customers?
Customer segmentation How can the customer base split into groups
that are relevant for marketing?
Product affinities What are the products that are more likely to be
bought together?
Product recommendations If a customer buys a particular product which
other products are the buyers of that product
also likely to buy?
25
6.1 Clustering models
Clustering models is an approach that uses unsupervised learning to find similarities in the
group of customers without defining any hypothesis of these groups beforehand. The pat-
tern of group of customers who behave in a similar way would emerge from the data using
a clustering algorithm. A simplified example of such cluster could be customers who only
buy when they receive a discount. (Artun & Dominique 2015, 25.)
Usually 8 to 15 different attributes are required to define a customer cluster. Relevant cus-
tomer attributes could be such as age, gender, location, time of purchase, type of pur-
chase, price sensitivity or if they buy from the store or online. Traditional methods for de-
fining customer segments have typically been based on assumptions and human intuition.
Using clustering algorithms can help to automatically find statistically significant groups of
customers. These findings from the clustering algorithm can be turned into buyer per-
sonas that can be utilized in different marketing strategies for these groups. (Artun &
Dominique 2015, 27-28.)
A clarifying example could be for example sunglass buyers. This segment can actually
consist of two clusters: one cluster could be women going for vacation and the other clus-
ter could be passionate runners. This knowledge would be valuable when defining the
marketing strategy and messages for these groups instead of approaching all sunglass
buyers with the same message. (Artun & Dominique 2015, 28.)
It is important to acknowledge that a person never belongs to only one segment – this is
often the biggest mistake made by marketers. The segment of the customer can depend
on the situation as segments are very contextual. (Artun & Dominique 2015, 100.)
Clustering can be used in marketing in different ways: some approaches are product
based clustering, brand based clustering and behaviour based clustering. Product based
clustering models define clusters based on the knowledge of the type of products they buy
and what are the products that are often bought together. (Artun & Dominique 2015, 95).
Brand based clusters predict the brands customers are most likely going to buy. Custom-
ers who prefer some brands more than others are group together. The brand based clus-
ters can also reveal customer’s interest to other related brands by comparing customer’s
preference with an existing brand cluster. In retail world brand clustering is especially rele-
vant as many retailers have discovered that customers’ affection with brand is often
stronger than with products. (Artun & Dominique 2015, 95.)

26
Behaviour based clustering model uses purchase behavior to group customers together.
Relevant data points could be for example the amount of money spent, how often the cus-
tomer buys, how frequently customer buys, order seasonality or if the customer is keen on
discounts. Different marketing approaches can be used with these above mentioned
groups. Customers who are after discounts can be targeted with marketing for inventory-
clearing sales or high spenders with preview of a new product line. (Artun & Dominique
2015, 97.)
6.2 Propensity models
Propensity models use historical data to make predictions about customer’s future behav-
iour. They can be used for example to predict how likely a customer is going to buy a par-
ticular product, how likely a customer is to engage with the company’s website or what is
the customer’s predicted lifetime value. Propensity models are very commonly used in di-
rect mailings to predict if customer is likely to buy after they have received a mailing.
(Artun & Dominique 2015, 29; Strickland 6 January 2015.)
Propensity models could also be used in retargeting campaigns for customers who had
visited the company website but did not convert to sale or a lead. The offer in the retarget-
ing campaign could be personalized based on the customers’ likelihood of buying: with
customers who have very low likelihood of buying might need a discount to be interested
and on the other hand customers’ with high likelihood of buying might just need a re-
minder of the product or the brand. (Artun & Dominique 2015, 30.)
For first-time buyers non-transactional data can be used to predict their likelihood to make
a first purchase. Non-transactional customer data can be for example how the customer
behaves on the website or how many times the customer clicked on an email. Also demo-
graphic data can be used to compare the prospective buyers with other likely buyers. In
consumer marketing these can be for example age or gender and in B2B marketing rele-
vant demographics could be geography, industry or the person’s job title. (Artun &
Dominique 2015, 124.)
The prospective buyers who behave similarly with the previous buyers can be identified
with high likelihood of buying and can marketed accordingly to help to close the sale.
Knowledge of customer’s likelihood of buying can also be used to prioritize marketing in-
vestments for the prospective customers. (Artun & Dominique 2015, 124.)

27
When a customer makes their first purchase already information about that purchase
combined with demographic, geographic and engagement data can give a prediction on
the customer’s lifetime value when compared with other historical customer data. The pre-
dicted lifetime value could be used for well-founded marketing decisions, for example to
focus investments on those marketing campaigns and channels which generate custom-
ers with the highest lifetime value. (Strickland 6 January 2015.)
Propensity model can also be used to analyze which customers should not be contacted -
one form of this is an unsubscribe model. With a propensity model it is possible to predict
how likely customer is to unsubscribe from a mailing list at any given time. This infor-
mation could be used to adjust the sending frequency based on the customer’s likelihood
to unsubscribe or choose another channel than email for the customers with high likeli-
hood of unsubscribing, especially if those are high value customers. (Strickland 6 January
2015.)
6.3 Reinforcement learning and collaborative filtering
In marketing applications reinforcement learning is often used together with collaborative
filtering models. Collaborative filtering models are typically used in recommender systems.
Recommendation models utilize collaborative filtering, Bayesian networks and frequent
item sets to make predictions. Also time-decay functions are utilized to give recent behav-
iour more weight than older behaviour. After customer recommendations are generated,
reinforcement learning is applied to teach the model about the customer’s preferences.
(Artun & Dominique 2015, 33.)
Recommendation models can be used in suggesting interesting products or content to the
customers. Product suggestions will help to increase value of the customer and drive rev-
enue. Content recommendations often have more indirect effect in form of increasing
brand engagement, loyalty and customer satisfaction. (Artun & Dominique 2015, 33.)
Presenting the recommendations in the right context is very important so that they don’t
feel disturbing or intrusive. They should also be used at the relevant time in the customer
journey. Before the purchase is completed often a recommendation of type “customers
who bought this, also bought…” is made to the customer in order to increase the order
value. Few days after the purchase a thank you mail could include some additional recom-
mendations based on the purchased products. (Artun & Dominique 2015, 33.)

28
It is recommended to be as transparent as possible with the customers about the recom-
mendations and offer explanations how they were calculated. This will help to reduce the
intrusive feeling some customers might get from receiving recommendations on products
or content. The recommendations should be updated as often as possible, ideally in real
time in order to stay relevant. Good recommendation model also allows manual tweaking
of the algorithm for example to exclude certain products that have bad reviews or products
that are out of stock. (Artun & Dominique 2015, 33-34.)
6.4 Case: Micro-segmentation of business mobile subscribers
Leventhal (2018, 178-179) describes a use case of predictive analytics in micro-segmen-
tation of business subscribers of a mobile phone operator. The mobile phone operator had
traditionally segmented their business customers based on the way the customers were
managed. The company wanted to have more understanding of the different types of mo-
bile users and their needs among their business subscribers.
The company made a hypothesis that the segmentation that was done on their consumer
subscribers would be a good foundation also for the business subscribers. To test the hy-
pothesis the same variables as in the consumer segmentation were assigned to the busi-
ness users and a clustering algorithm was used in order to map the business users to the
most relevant consumer cluster. Most of the business customers were a good fit for the
consumer cluster they were assigned to, yet some did not fit the existing consumer seg-
ments. Based on that additional segments were identified among the corporate and SME
companies.
The segmentation allowed the company to assign all business subscribers to usage seg-
ments and investigate the segments within industry, market segment or business ac-
counts. The usage segments could be utilized in several areas of the company’s opera-
tions, including channel and customer management, sales as well as proposition manage-
ment.

29
7 Implementation
7.1 Current lead process and use of predictive analytics
In Fonecta’s lead generation strategy several different touchpoints are used to generate
leads in the digital channels, including digital advertisements, social media, email market-
ing, search engine optimization and campaign landing pages.
The different channels are utilized to attract traffic to the company website or campaign
landing pages. The website or landing page visitors can be qualified as a sales lead
based on their actions: filling out a contact form, downloading an e-book or clicking on a
certain link in a marketing email.
When a visitor performs a specified action on the website or landing page a trigger is sent
to the marketing automation system with the details on the performed actions. Based on
predefined rules the marketing automation system can qualify the visitor as a lead.
If the visitor is qualified as a lead the details of the visitor and performed actions will be
sent to the CRM system which is used by the sales personnel. Predefined rules define if
the lead should go through the analytics solution which will make a prediction on the best
sales representative to handle the lead. A simplified presentation of the lead generation
process is illustrated in the Figure 11.
Figure 11. Fonecta’s lead generation process

30
7.1.1 Predictive analytics in lead generation channels
Three of the lead generation channels illustrated in Figure 11 utilize predictive analytics in
some form: email marketing, SMS and Facebook advertisements.
Email and SMS target groups are selected based on a predictive model used to define
Next Best Offer (NBO) for a particular customer. Based on the NBO predictions the cus-
tomers are assigned into target groups for email and SMS campaigns so that they can be
addressed with relevant product offerings. Some of the email target groups are defined
based on hard rules instead of NBO predictions. The actual NBO predictions are used in
email campaigns of three of Fonecta’s products: Google AdWords, Websites and Com-
pany Profile.
The model used in email and SMS campaigns uses supervised random forest algorithm in
order to find the most relevant variables from customer data which might indicate com-
pany’s willingness to buy the product. It uses several variables in the training data such as
firmographic information (e.g. revenue, personnel class and company type), Net Promoter
Score, customer care cases, use of Fonecta’s consumer services (Fonecta Caller) as well
as the technical website quality of the company.
Predictive analytics is used in Facebook advertisements in several ways for selecting cor-
rect audiences for the advertisements. Facebook does not disclose the algorithm they are
using in their advertisement solutions. The different use cases in include:
1. Email target groups containing the NBOs are loaded into Facebook and used for
targeting advertisement for people who also received the email.
2. Targeting advertisement to a lookalike audience of the people who have received
the email (described in the previous bullet).
3. Targeting advertisement to a lookalike audience of people who have visited
Fonecta’s B2B website.
4. Targeting advertisement to a lookalike audience of people who had completed the
advertised action (for example completed a test on the website or downloaded an
e-book).
5. Targeting advertisement to an audience based on the content and articles con-
sumed on Fonecta’s B2B website
Organic, Search Engine Marketing (SEM) and Display advertisement channels do not cur-
rently utilize predictive analytics methods.

31
7.1.2 Analytics solution
After the lead is created in the CRM system it is inserted into a workflow. The workflow
has predefined rules which define if the lead should be assigned to a salesperson manu-
ally or if it should go through the analytics solution.
The analytics solution uses a Multi-Armed Bandit algorithm to predict to which salesper-
son the lead should be assigned to. The algorithm uses historical data of the won and lost
leads for that salesperson for specific products. The purpose of the algorithm is to calcu-
late which salesperson from the available pool would be the most successful in closing a
sale for that lead.
7.2 Creating the predictive model
Email campaigns using the NBO modelling were selected as the pilot use cases for this
study. The reasoning behind this selection was mainly due to the large volume of the
email communications which made possible to gain relevant amount of data from the pi-
lots in a relative short time frame.
The NBO model used in the campaigns is based on random forest algorithm which is a
supervised machine learning method. The training data contains several types of varia-
bles (not just numerical) which makes random forest a good choice as it does not require
separate input preparation as it can take in also categorical data. Using random forest in-
stead of simple decision tree will also reduce the risk of overfitting the model. The NBO
predictions are run on a weekly basis for the whole customer base so the selected algo-
rithm needed to be fairly efficient and fast.
The training data of the existing NBO model was modified considering three different as-
pects:
- Freshness of the data. Old model used data starting from 2014. New model uses
data gathered 2016 onwards.
- Relevancy of the data. Old model used only data from sales calls. New model
combines sales call and lead data.
- Due to organisational restructuring data about calls to the directory assistance ser-
vice could not be used as an attribute in the new model.
Other aspects of the existing NBO model for the email campaigns were left as before.
32
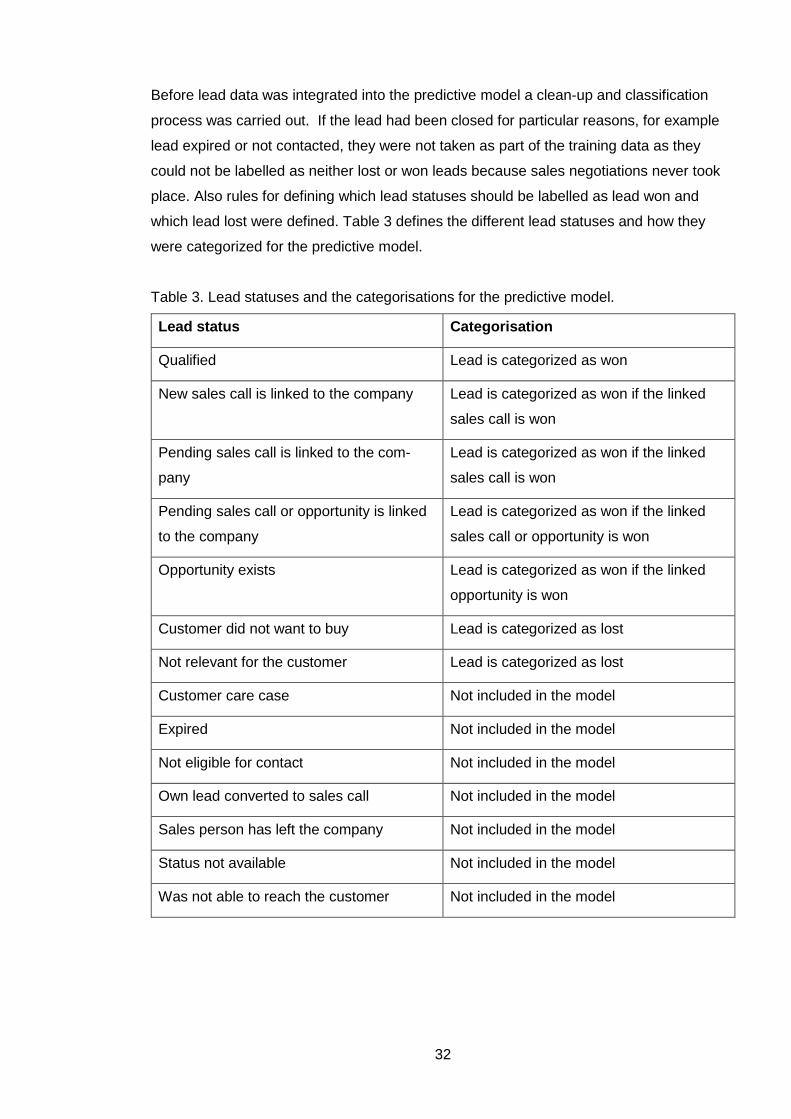
Before lead data was integrated into the predictive model a clean-up and classification
process was carried out. If the lead had been closed for particular reasons, for example
lead expired or not contacted, they were not taken as part of the training data as they
could not be labelled as neither lost or won leads because sales negotiations never took
place. Also rules for defining which lead statuses should be labelled as lead won and
which lead lost were defined. Table 3 defines the different lead statuses and how they
were categorized for the predictive model.
Table 3. Lead statuses and the categorisations for the predictive model.
Lead status Categorisation
Qualified Lead is categorized as won
New sales call is linked to the company Lead is categorized as won if the linked
sales call is won
Pending sales call is linked to the com-
pany
Lead is categorized as won if the linked
sales call is won
Pending sales call or opportunity is linked
to the company
Lead is categorized as won if the linked
sales call or opportunity is won
Opportunity exists Lead is categorized as won if the linked
opportunity is won
Customer did not want to buy Lead is categorized as lost
Not relevant for the customer Lead is categorized as lost
Customer care case Not included in the model
Expired Not included in the model
Not eligible for contact Not included in the model
Own lead converted to sales call Not included in the model
Sales person has left the company Not included in the model
Status not available Not included in the model
Was not able to reach the customer Not included in the model

33
Classification of the data to particular products was needed in order to map it to the exist-
ing attributes in the model. Classification of the lead data was carried out based on the
campaign codes and subject lines of the leads.
When starting the pilot with the new model the training dataset consisted of 250 000 sales
calls and 22 700 leads in the training dataset.
7.3 Pilot use cases
The new predictive model was used in target group selection for 5 different email cam-
paigns. The email campaigns featured three different products that utilize the NBO predic-
tion in the target group selection. The target groups for these campaigns contain compa-
nies from the SME segment. Some details on the campaigns are described below.
Campaign 1
Company profile campaign. Call-to-action in the email is to get the customer to check how
the company’s profile look in Fonecta’s services.
Campaign 2
Google AdWords campaign. Call-to-action in the email is to get the customer to ask for a
recommendation for the best search phrases in Google AdWords for his/her company.
Campaign 3
Website campaign. Call-to-action in the email is to get the customer to check the quality of
his/her company’s website and receive information on the average quality of websites in
that industry.
Campaign 4
Company profile campaign, targeted for customers who have been also assigned for
sales call. Call-to-action in the email is to get the customer to check how the company’s
profile look in Fonecta’s services.
Campaign 5
Google AdWords campaign, targeted for customers who have been also assigned for
sales call. Call-to-action in the email is to get the customer to ask for a recommendation
for the best search phrases for Google AdWords for his/her company.

34
8 Results and validation
Number of emails delivered and number of email clicks was used to run the significance
tests for the pilot case results. The number of opened emails is a fairly unreliable metric
for engagement as it is dependent on the respondent downloading images in the email in
order to trigger a tracking pixel.
Calculations for statistical significance were conducted with A/B testing significance calcu-
lator provided by AB Testguide. The test evaluation was done with two-sided hypothesis
and 95 % confidence. Two-sided test was selected in order to show evidence if the new
variation of the predictive model had improved or decreased the email engagement met-
rics when compared with the email engagement metrics with 2017 version of the model.
The email engagement metrics show that none of the pilot campaigns had any statistically
significant improvement in email engagement during the pilot period. The results are dis-
played in more detail in Table 4.
Table 4. Email statistics from the pilot campaigns (1 September – 31 October)
Campaign 2017 2018 P-value Signifi-cance
Deliv-ered
Opens Clicks Deliv-ered
Opens Clicks
Campaign 1
14692 4891 348 13209 4254 280 0.9197
No
Campaign 2
6977 2382 182 6126 2069 147 0.7778
No
Campaign 3
4853 1580 167 4361 1433 122 0.9624
No
Campaign 4
3012 969 69 2949 903 48 0.9678
No
Campaign 5
2291 793 47 3612 1169 87 0.1804
No
Possible reasons for not being able to get statistically significant results can be due to the
relatively short pilot period as well as the reason that the amount of lead data that was in-
tegrated into the predictive model was still relatively small compared to the amount of
sales call data. Probably it will take a longer time to gather enough lead data in the train-
ing set in order to get statistically significant results from the campaigns.

35
Also changes in the lead hit rate during the pilot period was analysed. No clear trend was
seen in the hit rate either, as the direction change varied from campaign to campaign. The
changes in the hit rates were relatively small, from 1,7 % to 6,1 %. Details of the results
can be seen in Table 5.
Table 5. Lead statistics from the pilot campaigns (1 September – 31 October)
Campaign 2017 2018
Total leads Hit rate Total leads Hit rate Change
Campaign 1 117 9,9 % 60 6,3 % -3,6 %
Campaign 2 158 3,0 % 136 9,1 % +6,1 %
Campaign 3 44 10,8 % 49 9,1 % -1,7 %
Campaign 4 18 12,5 % 15 15,4 % +2,9 %
Campaign 5 38 10,8 % 81 8,1 % -2,7 %
The largest change was seen in Campaign 2 where the hit rate increased 6,1 % from last
year. That might be a subtle indicator that this new model was able to generate more high
quality leads. Yet it is important to keep in mind that he hit rate is influenced by many
other variables (e.g. which products sales personnel is focusing on, number of sales rep-
resentatives etc.) so no conclusions should be drawn based solely on that.
8.1 Recommendations for future
When starting the pilot with the new predictive model the training data consisted of
250 000 sales calls and 22 700 leads in the training dataset. So the number of lead data is
still relatively small and therefore still has limited impact on the predictive model. Recom-
mendation would be to continue to run the pilot cases which monthly checks on the signifi-
cance of the results.
Another possibility would be to create a new model based solely on lead data to examine
if the customers converting to a sale from lead instead of a normal sales call are different
in some ways when considering predictive variables for the NBO model.
Based on the workshops some additional development ideas for use of predictive analyt-
ics were gathered. The most potential ideas for future development are described in short
below.

36
Integrating information on customer’s engagement with the emails to the current NBO
model. At the moment the model does not take into account if the user has opened or
clicked an email of that particular campaign or any campaign before. This kind of behav-
ioural data would be very valuable especially in cases when the customer has no previous
purchases.
Scoring customers based on if they had received ‘value for money’ for certain products.
Value for money means here that the customer has received good results when the mon-
etary investments on the product or service are considered. This could be from some as-
pect a similar indicator as the Net Promoter Score which is already included in the model,
as this data could possibly give an indication on the customer satisfaction but most im-
portantly it could also reveal which related products might be a good fit for the customer
based on the previous results.
Integrating information to the current NBO model on how much clicks the company and
the companies in the same industry have received in Fonecta’s search services. This
could be especially relevant for the NBO model for Company Profile product where the
above metrics are important KPIs.

37
9 Conclusions
Objective for this study was to identify new ways of using predictive analytics in the lead
generation process and study their impact in pilot use cases. This objective was partly
reached. New development ideas for predictive analytics were generated during this study
as stated in the objective.
The existing Next Best Offer (NBO) predictive model was modified for the selected pilot
cases. In addition to sales call data, lead data was added to the analytic dataset which is
used to teach the model. Lead data cleanup, preparation, categorization and formatting
were carried out in order to integrate the data in the modelling software.
The results from the selected pilot cases did not have any statistically significant results
that could have been used to evaluate the validity of the implemented predictive model.
Answers to the specific research questions are discussed below.
RQ1: How are predictive analytic methods used in different parts of the company’s
lead process at the moment?
The current lead process flow was documented during this study as well as the predictive
components in it. The documentation was done on quite high level as it does not go in
specifics into for example how our different email campaign target groups are selected.
One outcome of this study and the documentation of the current process was also that we
identified the parts of the process that would need to be documented in more detail.
RQ2: How could use of predictive analytics in lead generation be improved?
Several improvement ideas on the use of predictive analytics were gathered during the
study and one of them was selected to be implemented in the pilot cases. As email mar-
keting is the most important individual channel in Fonecta’s lead generation process, the
ideas focused heavily on better utilization of predictive marketing in the NBO model which
is used in the email channel.
RQ3: How can the results of the pilot use case be analyzed and reported?
The systems included in the lead process, marketing automation system and the CRM
system, allowed us to analyze the results from the delivered emails up to the closed sale.
All the results could be reported and analyzed in quantitative form and the statistical sig-
nificance could be evaluated for relevant parts to validate the results. The analysis of the

38
results was done focusing on the email statistics: customer engagement with the email
was analyzed based on click-delivered ratio for the pilot cases.
RQ4: What are most promising use cases for future development?
Some future development ideas were generated during the workshops, most potential and
relevant in the near future would be to include email engagement data (email opens, email
clicks) as part of the predictive model. As discussed in the theoretical part of this study
this type of non-transactional customer data can be valuable when building propensity
models.

39
References
AB Testguide. URL: https://abtestguide.com/calc/. Accessed: 8 November 2018.
Artun, O. and Dominique L. 2015. Predictive Marketing: Easy Ways Every Marketer Can
Use Customer Analytics and Big Data. Wiley. Hoboken, New Jersey.
Bell, J. 2014. Machine Learning: Hands-On for Developers and Technical Professionals.
Wiley. New York.
Brink, H., Fetherolf, M. & Richards, J. W. 2016. Real-world machine learning. Manning
Publications. Shelter Island.
Dean, J. 2014. Big Data, Data Mining, and Machine Learning: Value Creation for Business
Leaders and Practitioners. Wiley. Hoboken, New Jersey.
Flaherty, J. 7 June 2018. How to Define Leads and Opportunities within Your Organiza-
tion. Ledgeview Partners Blog. URL: https://ledgeviewpartners.com/blog/how-to-define-
leads-and-opportunities-within-your-organization/. Accessed: 25 September 2018.
Fleming, J. 1 June 2017. Demand generation vs lead generation for B2B marketing.
LinkedIn Sales and Marketing Solutions EMEA Blog. URL: https://busi-
ness.linkedin.com/en-uk/marketing-solutions/blog/posts/B2B-Marketing/2017/Demand-
generation-vs-lead-generation-for-B2B-marketing. Accessed: 25 September 2018.
Gollapudi, S. 2016. Practical Machine Learning. Packt Publishing.
Hale, K. 8 May 2018. Predictive Analytics for Marketing: What It Can Do and Why You
Should Be Using It. Towards Data Science Blog. URL: https://towardsdatasci-
ence.com/predictive-analytics-for-marketing-what-it-can-do-and-why-you-should-be-using-
it-afdbde131b36. Accessed: 11 November 2018.
Halligan, B. and Dharmesh S. 2014. Inbound Marketing: Attract, Engage, and Delight
Customers Online. John Wiley & Sons, Inc. Hoboken, New Jersey.

40
Hillsberg, A. 10 July 2018. The Best B2B Lead Gen Campaigns for Every Channel. Hub-
spot Blog. URL: https://blog.hubspot.com/marketing/b2b-lead-generation. Accessed: 13
November 2018.
Kandarp, S. 30 June 2017. Machine Learning Vs Predictive Analytics – Know the Differ-
ence. OBIEE Blog. URL: http://www.ascentt.com/machine-learning-vs-predictive-analyt-
ics-know-the-difference/. Accessed: 19 October 2018.
Kirkpatrick, D. 15 August 2012. Local B2B Marketing: 150% boost in lead generation.
URL: https://www.marketingsherpa.com/article/case-study/150-boost-in-lead-generation.
Accessed: 5 October 2018.
Kirkpatrick, D. 29 May 2013. Lead Generation: Revamped marketing automation and
CRM technology drives 75% more leads. URL: https://www.marketingsherpa.com/arti-
cle/case-study/revamped-marketing-automation-crm-technology. Accessed: 5 October
2018.
Kurvinen J. and Seppä M. 2016. B2B-markkinoinnin & myynnin pelikirja: yritysjohdon opas
myyntiin ja markkinointiin. 1. painos. Kauppakamari. Helsinki.
Leventhal, B. 2018. Predictive Analytics for Marketers: Using Data Mining for Business
Advantage. Kogan Page Limited. London, United Kingdom.
Mueller, J. P. & Massaron L. 2016. Machine Learning For Dummies. John Wiley & Sons,
Incorporated. Hoboken, New Jersey.
Paul G. and Schwartzman E. 2010. Social Marketing to the Business Customer: Listen to
Your B2B Market, Generate Major Account Leads, and Build Client Relationships. John
Wiley & Sons, Incorporated. Hoboken, New Jersey.
Rubanovitsch, M. D. 2018. Myyntikapina: Korvaako kone ihmisen myyntityössä. 1. painos.
OY Imperial Sales AB/Johtajatiimi. Espoo.
Song, C. 21 February 2018. Support Vector Machines (SVM) Tutorial. URL: https://me-
dium.com/nyu-a3sr-data-science-team/support-vector-machines-and-wine-cef59ad38b41.
Accessed: 23 October 2018.

41
Strickland, J. 6 January 2015. What is a Propensity Model? URL:
https://www.linkedin.com/pulse/what-propensity-model-jeffrey-strickland-ph-d-cmsp-asep.
Accessed: 25 September 2018.
Sutton, R. S. & Barto, A. G. 2018. Reinforcement Learning: An Introduction. 2nd edition.
The MIT Press. Cambridge, MA.
Towards Data Science 2 August 2018. Applications of Reinforcement Learning in Real
World. URL: https://towardsdatascience.com/applications-of-reinforcement-learning-in-
real-world-1a94955bcd12. Accessed: 25 October 2018.
Vomlel, J. 2005. Some applications of Bayesian networks. Institute of Information Theory
and Automation, Academy of Sciences of the Czech Republic. URL:
http://staff.utia.cas.cz/vomlel/slides/presentace-karny.pdf. Accessed: 22 October 2018.
Wikipedia 2018a. Null hypothesis. URL: https://en.wikipedia.org/wiki/Null_hypothesis. Ac-
cessed: 6 November 2018.
Wikipedia 2018b. P-value. URL: https://en.wikipedia.org/wiki/P-value. Accessed: 6 No-
vember 2018.
Wikipedia 2018c. Statistical significance. URL: https://en.wikipedia.org/wiki/Statistical_sig-
nificance. Accessed: 6 November 2018.