Bear Lake Salmon Enhancement Progress Report … Lake Salmon Enhancement Progress Report 2003...
60
Bear Lake Salmon Enhancement Progress Report 2003 Prepared by: Trenten T. Dodson, Biologist March 2004 This year's operation of the Bear Lake Sockeye and Coho Enhancement Project was made possible through enhancement taxes paid by the commercial fishermen in Area H, Cook Inlet and associated waters, through the harvest and sale of surplus fish, and through a grant from the Seward Camber of Commerce.
Transcript of Bear Lake Salmon Enhancement Progress Report … Lake Salmon Enhancement Progress Report 2003...

Bear Lake Salmon Enhancement
Progress Report 2003
Prepared by:
Trenten T. Dodson, Biologist March 2004
This year's operation of the Bear Lake Sockeye and Coho Enhancement Project was made possible through enhancement taxes paid by the commercial fishermen in Area H, Cook Inlet and associated waters, through the harvest and sale of surplus fish, and through a grant from the Seward Camber of Commerce.

ii
This page intentionally left blank

iii
DISCLAIMER
The Cook Inlet Aquaculture Association conducts salmon enhancement and restoration projects in area H, Cook Inlet and associated waters. As an integral part of these projects a variety of monitoring and evaluation studies are conducted. The following progress report is a synopsis of the monitoring and evaluation studies conducted for the Bear Lake salmon enhancement project. The purpose of the progress report is to provide a vehicle to distribute the information produced by the monitoring and evaluation studies. Data collected each year are presented with a summary of the information previously collected for comparative purposes. These reports are intended to provide a general description of project activity and are not an exhaustive evaluation of any restoration or enhancement project. The information presented in this report has not undergone an extensive review. As reviews are completed, the information may be updated and presented in later progress reports.
iv
This page intentionally left blank

v
ACKNOWLEDGEMENTS
The 2003 Bear Lake smolt migration, fry release, adult count, and gamete collection exercise were conducted by the Cook Inlet Aquaculture Association (CIAA). CIAA employees Terry Magee and Cathy Cline spent many hours in the field assisting with the 2003 field activities. Their efforts are appreciated. Sockeye salmon fry and coho salmon smolt stocked into Bear Lake were provided by Trail Lakes Hatchery. Appreciation is extended to the staff at Trail Lakes Hatchery: Robert Blankenship, Tom Prochazka, Mark Thomas, Mitch Johnson, and Carol Smith.

vi
This page intentionally left blank

vii
TABLE OF CONTENTS
DISCLAIMER............................................................................................................................................................. iii ACKNOWLEDGEMENTS...........................................................................................................................................v TABLE OF CONTENTS............................................................................................................................................ vii LIST OF FIGURES ......................................................................................................................................................ix LIST OF TABLES........................................................................................................................................................xi ABSTRACT .............................................................................................................................................................. xiii INTRODUCTION AND PURPOSE ...........................................................................................................................15 PROJECT AREA ........................................................................................................................................................17 PROJECT AREA ........................................................................................................................................................17 METHODS..................................................................................................................................................................19
Limnological Sampling and Environmental Conditions ..........................................................................................19 Lake Nutrient Enrichment........................................................................................................................................19 Smolt Enumeration ..................................................................................................................................................20 Smolt Characteristics and Enhanced Contribution...................................................................................................22 Adult Escapement....................................................................................................................................................26 Gamete Collection, Incubation and Rearing - Sockeye ...........................................................................................27 Gamete Collection, Incubation, and Rearing - Coho ...............................................................................................29 Fish Transport and Stocking ....................................................................................................................................29 Cost Recovery..........................................................................................................................................................31
RESULTS AND DISCUSSION ..................................................................................................................................32 Limnology and Environmental Conditions ..............................................................................................................32 Smolt Enumeration - Sockeye..................................................................................................................................35 Smolt Enumeration - Coho ......................................................................................................................................35 Adult Escapement - Sockeye ...................................................................................................................................36 Adult Escapement - Coho ........................................................................................................................................37 Cost Recovery..........................................................................................................................................................38 Stocking...................................................................................................................................................................38
RECOMMENDATIONS.............................................................................................................................................40 LITERATURE CITED................................................................................................................................................42 APPENDICES .............................................................................................................................................................44

viii
This page intentionally left blank

ix
LIST OF FIGURES
Figure 1. Map showing location of Bear Lake near Seward, Alaska. .........................................................................17 Figure 2. Bear Lake near Seward, Alaska...................................................................................................................18 Figure 3. The Bear Creek weir, smolt trap and adult counting complex (Top View). ................................................21
x
This page intentionally left blank

xi
LIST OF TABLES
Table 1. Fertilizer application at Bear Lake, 1981 to 2003.........................................................................................20 Table 2. Eggs collected for Bear Lake enhancement, 1989 to 2003. ..........................................................................27 Table 3. Coho and sockeye salmon releases at Bear Lake, 1986 to 2003. ..................................................................31 Table 4. Water quality characteristics of Bear Lake at 1 meter, 1979 to 2003. ..........................................................32 Table 5. Water quality characteristics of Bear Lake in the hypolimnion ,1979 to 2003. ............................................33 Table 6. Environmental conditions observed at Bear Lake, 1990 to 2003..................................................................34 Table 7. Sockeye smolt migrations: mean length and weight, by age class, for Bear Lake, 1980 to 2003. ................35 Table 8. Coho smolt migrations: mean length and weight, by age class, for Bear Lake, 1980 to 2003......................36 Table 9. Historic returns of Coho and Sockeye Salmon to Bear Lake weir, 1980 to 2003. ........................................37 Table 10. Bear Lake smolt production by brood years. ..............................................................................................39

xii
This page intentionally left blank

xiii
ABSTRACT
The Cook Inlet Aquaculture Association (CIAA) has been conducting sockeye salmon (Oncorhynchus nerka) and coho salmon (O. kisutch) enhancement activities at Bear Lake since 1988. Enhancement efforts have focused on sockeye and coho fry stocking and improvements to the fry rearing environment through nutrient enrichment. Associated assessment activities have involved smolt and adult enumeration and limnological sampling. In 2003, 1.467 million sockeye fry and 405,000 coho fry were released into Bear Lake. At the time of release, the sockeye fry averaged 0.42 grams and the coho fry averaged 1.37 grams. All released fry were of Bear Lake origin. In addition, 334,000 sockeye smolts averaging 11.8 grams were released to Bear Lake. The smolts were all of Bear Lake origin. Approximately 253,000, coho smolts were released into Bear Creek or Bear Lake. These fish averaged 13.7 grams Smolt migration monitoring began on 12 May and continued daily until 11 July. During this time a total of 1.326 million (± 24,100) sockeye and 208,100(± 10,800) coho smolts migrated from the lake. Most of the sockeye smolts migrated between 15 May and 15 June 2003. Most of the coho smolts migrated between 2 June and 27 June, 2003. Based on otolith marks, 92.4% (± 1.7%) of the emigrating sockeye smolts were enhanced. An estimated 98.5% smolts were age 1 and 1.5% were age 2. The average length and weight of the age 1 sockeye smolts was 92.3 mm ( ± 0.76 mm) and 7.50 g (± 0.19 g) respectively. The age 2 sockeye smolts were 139.5 mm (± 7.73 mm) and 30.40 g (± 4.86 g). Based on otolith marks, 86.9% (± 3.1%) of the emigrating coho smolts were enhanced. An estimated 80.6% of coho smolt were age 1, 15.3% were age 2, and 4.1% were age 3. The average length and weight of the age 1 coho smolts was 108.7 mm (± 4.89 mm) and 11.89g (± 0.30 g) and the age 2 coho smolts were 119.4 mm (± 2.48 mm) and 16.25g ( ± 1.62 g). A total of 16,010 adult sockeye returned to Bear Creek in 2003. The majority of the returning sockeye salmon was age 1.2 (45.1%) or age 1.3 (40.0%). Of the adult sockeye returning, 2,776 were sold for cost recovery or donated, one sockeye was found dead in the weir, and 13,233 were passed into Bear Lake. Of the fish passed into the lake, 3,735 were used for hatchery broodstock. A total of 3,506 adult coho returned to Bear Creek weir in 2003. The returning fish were age 1.1 (77.8%), age 2.1 (21.5%) or 3.1(0.8%). Of the adult coho returning, 2,065 were harvested and sold for cost recovery or donated, 1,021 were held and used as hatchery broodstock, 395 were passed into Bear Lake, and 25 remained in Bear Creek. From 30 July to 9 September 2003, 5,000,000 sockeye salmon eggs were collected for incubation, rearing, and release to Bear Lake. The eggs were obtained from Bear Lake broodstock, shipped to CIAA's Trail Lakes Hatchery, and fertilized using a delayed fertilization technique. Eggs from 1,854 females were fertilized with milt form 1,881 males.

xiv
From 15 to 26 October 2003, 1,250,000 coho eggs were collected from 299 females and fertilized with milt from 106 males. In addition, the Alaska Department of Fish and Game (ADF&G) collected gametes from 355 Bear Lake coho. One thousand fifty gallons of fertilizer was applied to Bear Lake in 2003. Limnological samples were collected monthly throughout the open-water season.

15
INTRODUCTION AND PURPOSE
Bear Lake is located on Alaska's Kenai Peninsula near the community of Seward, Alaska and has
been the site of salmon enhancement activities since 1962. Initial enhancement activities,
conducted by the Alaska Department of Fish and Game (ADF&G) Sport Fish Division, focused
on coho salmon (Oncorhynchus kisutch) and the control of predator and competitor species1.
In 1988, the Alaska Board of Fisheries revised the management plan for Bear Lake. The
revision allowed for the enhancement of sockeye salmon (O. nerka).
The revised Bear Lake management plan developed in 1988 was soon followed by a cooperative
agreement between ADF&G, Sport fish Division, ADF&G Fisheries Rehabilitation,
Enhancement and Development (FRED) Division, and the Cook Inlet Aquaculture Association
(CIAA). The cooperative agreement, which became effective in August 1989, allowed CIAA to
operate and maintain the Bear Lake coho salmon enhancement project and to begin sockeye
enhancement activities in the lake. The agreement also provided CIAA with the responsibility of
operating and maintaining the Bear Creek weir site.
Current enhancement activities at Bear Lake now target both sockeye and coho salmon with
control of predator and competitor species. The objectives are to create a commercial sockeye
fishery and to maintain the coho sport fishery enhancement program. To accomplish the
objectives CIAA will:
1) Maintain the level of coho salmon production; 2) Maintain sockeye and coho lake spawning escapement goals; 3) Annually describe the timing, abundance, size, and percent of wild and enhanced sockeye
and coho in smolt migrations; 4) Annually describe the timing, abundance, and size of sockeye and coho salmon in adult
migrations; 5) Monitor the number of marked fish resulting from fry, pre-smolt, and smolt releases in
sockeye and coho adult migrations and evaluate the success of enhancement through the recovery of marked fish.
1 ADF&G enhancement activities conducted prior to 1987 are reported by Vincent-Lang (1987).

16
This page intentionally left blank

17
PROJECT AREA
Bear Lake is located on Alaska's Kenai Peninsula 9 km north of Seward, Alaska. It is the largest
clear water lake in the Resurrection Bay drainage.
Bear Lake has a watershed area
of 15 km2 and one outlet,
which drains into Resurrection
Bay through Bear Creek,
Salmon Creek and the
Resurrection River. A weir
and fish passage complex,
located 0.5 km downstream of
the lake, provide a barrier to
fish migration and allow for
complete control of fish
movements into or out of the
lake (Figure 1).
Figure 1. Map showing location of Bear Lake near Seward, Alaska.
Bear Lake (Figure 2) is oligotrophic with a surface area of 180 hectares. It has a mean depth of
10 meters, a maximum depth of 20 meters, a lake volume of 18.7 X 10⁶ m3 and a water residence
time of 0.75 years. There is one small island located along the east shore. The shoreline is
heavily wooded and shoreline substrates vary from exposed bedrock, to large cobble, sand and
organic muck.

18
Figure 2. Bear Lake near Seward, Alaska

19
METHODS
In general, Bear Lake limnological sampling, salmon egg takes, hatchery incubation, fry rearing,
smolt enumeration and adult escapement monitoring follow procedures recommended by
ADF&G.
Limnological Sampling and Environmental Conditions
The limnological sampling and analysis procedures used in 2003 were consistent with previous
limnological sampling activities. These procedures are described by Koenings, et al. (1986).
During 2003, assessments of water quality were conducted 5 times throughout the open water
season of May through October. One primary site, site B (Figure 2) was sampled for dissolved
oxygen, temperature and light transmission profiles, Secchi disk transparency and zooplankton
densities. Samples for analysis of phosphorus, carbon, chlorophyll a, phaeophytin a, nitrogen,
calcium, magnesium, iron, conductivity, pH, alkalinity, turbidity and color were also collected
with a Kemmerer sampler 1 meter below the surface and from the hypolimnion. One secondary
site, site A, (Figure 2) was also sampled for Secchi disk transparency and zooplankton densities.
All water samples were collected by CIAA and analyses completed by ADF&G.
In addition to the water chemistry analysis, daily observations of other environmental conditions
at Bear Lake were made. These observations, completed at 5:00 P.M. throughout the summer
field season, included percent cloud cover, precipitation to the nearest millimeter, air
temperature, Bear Creek water temperature and Bear Creek stage.
Lake Nutrient Enrichment
Liquid fertilizer applied to Bear Lake has been an important element of the Bear Lake
enhancement project since 1981. The purpose of fertilizer application, applied throughout the

20
growing season to the pelagic area of the lake, is to stimulate algae growth and increase the
zooplankton community.
Liquid fertilizer has been applied to Bear Lake in 17 of the last 23 years. It was not applied in
1987-1989, 1994, 1995, and 2001. Applications levels are presented in Table 1.
Table 1. Fertilizer application at Bear Lake, 1981 to 2003
32-0-0 27-7-0 20-5-0 N P Year (gal) (gal) (gal) (Kg) (Kg) Dates Comments1981 2,760 -- -- 4,441 -- 9/01 - 10/31 Every 10 days1982 3,240 -- -- 5,213 -- 7/15 - 10/31 Every 10 days1983 4,080 -- -- 6,565 -- 6/01 - 10/04 Every 3 days1984 1,960 1,120 -- 4,760 181 6/01 - 9/15 Every 3 days1985 2,800 -- -- 4,505 -- 6/01 - 9/15 Every 3 days1986 1,680 1,120 -- 4,309 181 7/01 - 9/15 Every 3 days1987 -- -- -- -- -- -- No application1988 -- -- -- -- -- -- No application1989 -- -- -- -- -- -- No application1990 2,640 -- 420 4,644 43 6/05 - 8/28 Every 2 days, 20-5-0 first1991 2,340 -- 390 4,133 40 5/30 - 8/14 Daily, 20-5-0 first1992 3,264 -- 390 2,896 40 6/04 - 8/09 4 to 6 times/week1993 -- -- 960 906 99 5/25 - 8/07 3 times/week1994 -- -- -- -- -- -- No application1995 -- -- -- -- -- -- No Application1996 2,280 -- 600 4,235 62 6/03 - 9/01 Daily, 20-5-0 mid-summer1997 1,620 -- 540 3,116 55 6/01 - 8/4 2 bbl. a day 4 times a wk.1998 -- -- 990 934 101 6/24 - 8/10 Every day1999 -- -- 1,050 990 107 6/17 - 8/25 Every other day2000 840 792 86 6/12 - 8/26 Every other day2001 -- -- -- -- -- -- No application2002 -- -- 900 849 92 6/27 - 8/18 Every other day2003 -- -- 1050 990 107 6/26 - 8/8 Mon, Wed, Fri
Smolt Enumeration
A permanently installed weir, located approximately 0.5 km downstream of Bear Lake prevents
the uncontrolled migration of fish into or out of Bear Lake. This structure (Figure 3) was used in
2003 to identify, count and control the migration of all fish moving into or out of Bear Lake.
For smolt enumeration, fish migrating downstream were directed by the weir into a live box

21
where they were captured, temporarily held, identified to species, counted and released
downstream. Total counts of smolts migrating from the lake were made until the migration of
fish exceeded 2,000 to 3,000 fish per hour. When this occurred, a 10% sub-sampling procedure
was used to enumerate the migrating smolts.
Figure 3. The Bear Creek weir, smolt trap and adult counting complex (Top View).
To enumerate migrating smolts with the 10% sub-sampling procedure, the counting period was
divided into 20 minute intervals. During each 20 minute interval, migrating fish were directed
into the live-box for two minutes and then counted. During the remaining 18 minutes, migrating
smolts were passed through the weir structure uncounted. The two-minute smolt count was
multiplied by 10 to estimate the number of smolts migrating during the twenty minute interval.
Assuming the two minute sub-sampling intervals were randomly distributed throughout sub-
sampling2 and smolt moved through the weir randomly, the total smolt migration was estimated
as follows:
2 Predetermined randomly selected 2 minute subsampling intervals assured random distribution within each 20 minute period.

22
If:
Tc = number of fish counted with the total count procedure,
Ts = number of fish counted with the 10% sub-sampling
procedure,
T = the total smolt migration,
y = the number of fish counted in each two minute sub-
sampling interval,
n = the number of two minute sub-sampling intervals sampled,
and
N = the number of possible two minute sub-sampling intervals,
Then:
T T Tc s= +
and the variance is,
v ( ) ( )( ) ( ) ( )( )/ /T N N n N y y n ns i= − − −∑2 21
And:
C I. .α=95% for ( )T v Ts s= ±2
The variance about the estimated smolt migration, T , is equal to the variance about Ts , because
Tc is a total count with 0 variance.
In 2003, migrating smolts were enumerated from 12 May through 11 July. The 10% sub-
sampling procedure was used to count 49.0% of the sockeye migration and 6.9% of the coho
migration.
Smolt Characteristics and Enhanced Contribution
CIAA has released sockeye and coho salmon fry to Bear Lake since 1990. To evaluate this
enhancement procedure, CIAA has collected a sample of sockeye and coho smolts migrating

23
each year to determine age, weight, and length characteristics of the migrating populations. Since
1993, CIAA has also marked the otolith of all salmon fry released to Bear Lake with a thermal
mark3. The purpose of this mark is to determine the contribution of released hatchery fish to the
Bear Lake smolt population.
In 2003, smolts collected for measurement, age determination, and otolith removal were sampled
in proportion to the daily smolt migration. This was accomplished by collecting every 1,263rd
sockeye smolt and every 422nd coho smolt that passed through the smolt trap. The numbering
sequence began when the first fish passed through the trap and continued consecutively until the
smolt migration was complete. Age, weight and length measurements were taken on 1,050
sockeye smolts and 493 coho smolts.
Each smolt collected for evaluation was first measured to the nearest millimeter for fork length4
and weighed to the nearest 0.1 gram. Several scales were then removed from the primary growth
area5 and mounted on a glass slide for subsequent age determination. Finally, otoliths were
removed and placed in a labeled one dram vial. Ethanol was added to the vial to cover the
otoliths.
After the smolt migration was complete, the otolith samples were shipped to Trail Lakes
Hatchery; and CIAA staff processed the scales and otoliths.
Each otolith was checked each for a hatchery mark following procedures described by Glick and
Shields (1993). Of the 1,050 sockeye otoliths collected, 952 were readable; and of the 493 coho
otoliths were collected, 468 were readable.
Sockeye smolt characteristics, the proportion of enhanced sockeye smolt and the proportion of
age 1 and 2 sockeye smolt in the migrating population, were estimated with the following
notations and formulas provided by ADF&G.
3 The otolith mark is a hatchery induced thermal band produced by controlled temperature changes during incubation. 4 Standard fork length was measured from the tip of the snout to the fork of the tail.
5 The primary growth area is located above the lateral line on a diagonal from the posterior insertion of the dorsal fin to the anterior insertion of the anal fin.

24
If:
N = total number of migrating smolts,
Nh = number of smolts in stratum h, ( )N Nh= ∑ ,
n = total number of smolts sampled,
nh = number of smolts sampled in stratum h, ( )n nh= ∑ ,
a = total number of enhanced smolts sampled,
ah = number of enhanced smolts sampled in stratum h, ( )a ah= ∑ ,
p a nh h h= / , The proportion of enhanced smolts in stratum h,
q ph h= −1 , The proportion of wild smolts in stratum h,
ci = number of age= i smolts sampled,
chi = number of age= i smolts sampled in stratum h, ( )c ci hi= ∑ ,
l c nhi hi hi= / , The proportion of age= i smolts in stratum h,
m lhi hi= −1 , The proportion of other than age= i smolts in stratum h,
f n N= / , The sampling fraction (assumed equal in all strata),
W N Nh h= / , The stratum weight, and,
y = the weight or length of the smolt.
Then the proportion of enhanced smolts, P , was estimated as:
/P a n= ; with a variance of ( ) ( )( )v P f n W p qh h h/= − ∑1 1 ;
which, under proportional allocation, is like the usual simple random sample estimate.
The total number of enhanced smolts, A , was also estimated as:
( )/A N a n NP= = ;
with a variance of:
( ) ( )( ) ( )v A N f n W p q N v Ph h h/= − =∑2 21 1 .
Since samples sizes were fairly large and P was not extreme, the normal approximation,
without a correction for continuity, could be used to develop the relative error. Thus, the
95% confidence interval estimate for P and A is:

25
( ).P v P±196 and ( ).A v A±196 ;
and, the relative error is:
( ) ( )( )R E v P P. . .= 196 100 and ( ) ( )( )R E v A A. . .= 196 100 .
The proportion of age= i smolt in the smolt migration was also estimated as:
L cni
i= ; with a variance of v L fn
W l mi h hi hih( ) ( )= − ∑1 1 ;
and, the total number of age= i smolts was estimated as:
( )C N Li i= ; with a variance of v C N v Li i( ) ( )= 2 .
Confidence interval (95%) estimates for age-class proportion and abundance, assuming 2
age-classes, are:
( ). ( )L v Li i± 2 24 and ( ). ( )C v Ci i± 2 24 .
Mean weight or length of age= i smolt was also estimated as:
yy
cihijjh
i
=∑∑
;
with an approximate variance estimate of:
[ ]v yC
N fn n
y y c y yii
h
h hhij hi hi
cn hi ijh
hih
( ) ( )( )
( ) ( )( )≅−−
− + − −∑∑1 11
12
22 2 .
The confidence interval (95%) estimate for the mean weight and length is:
( )y v yi i±196. ( ) .
A detailed description of the weir and fish counting complex and the procedures used for
enumerating migrating salmon smolts is provided in the Bear Lake Procedures Manual (CIAA,
2001).

26
Adult Escapement
The weir structure that was used for enumerating the smolt migration was also used to identify,
count, and control the migration of adult fish returning to Bear Lake. In 2003, adult escapement
monitoring was conducted from 21 May through 30 October. The escapement enumeration
included the assessment of the sex, age, and standard fork length6 of the returning population of
fish.
To enumerate the adult migration, fish attempting to migrate upstream were directed by the weir
into a live box attached to a mechanical lift. Once in the live box, the fish were lifted above the
weir, identified, and counted. Counted fish were either passed into the Bear Lake system or
collected for other uses. Fish passed upstream to continue their migration to Bear Lake totaled
13,233 sockeye and 395 coho. Other uses of the weir included harvest and hatchery broodstock
collection.
In 2003, it was assumed that 27,600 adult sockeye and 10,700 adult coho would return to the
Bear Creek weir. Based on this assumption, it was calculated that a sample of 2.2% of the
returning sockeye and 5.6% of returning coho were needed to appropriately assess the sex, age
and length characteristics of the returning populations. Each day a representative sample of
sockeye and coho equal to 2.2% and 5.6% respectively, of the previous day's escapement were
captured for measurement. In 2003, less than the predicted number of salmon returned to the
weir and measurements were collected from 324 sockeye (1.2%) and 324 coho (3.0%).
A detailed description of the weir and fish counting complex and the procedures used for
enumerating migrating adult salmon is provided in the Bear Lake Procedures Manual (CIAA,
1993).
6 Standard fork length was defined as the measurement from mid-eye to the fork of the tail.

27
Gamete Collection, Incubation and Rearing - Sockeye
Since 1989, egg collection, incubation and rearing of sockeye salmon have been done to develop
a Bear Lake sockeye fishery. To date, a total of 45,389,600 sockeye salmon eggs have been
collected for incubation and rearing at Trail Lakes Hatchery. The number of eggs collected since
1989 is summarized in Table 2.
Table 2. Eggs collected for Bear Lake enhancement, 1989 to 2003.
Coho SockeyeBrood Brood Green Eyed Brood Green EyedYear Stock Eggs Eggs % Stock Eggs Eggs %1989 Bear L 932,300 711,800 76.3 SF Big R 3,119,300 2,713,700 87.0
U Russian L 57,400 47,700 83.11990 Bear L 798,200 669,300 83.9 SF Big R 134,000 100,700 75.1
U Russian L 2,602,800 1,721,500 66.11991 Bear L 695,600 533,400 76.7 SF Big R 2,534,500 1,794,500 70.8
U Russian L 1,441,800 974,400 67.61992 Bear L 802,700 749,900 93.4 SF Big R 3,428,100 2,976,000 86.8
Bear L 47,000 45,100 96.01993 Bear L 735,500 696,000 94.6 Bear L 276,700 172,800 62.51994 Bear L 847,000 739,600 87.3 Bear L 530,000 420,000 79.21995 Bear L 867,500 737,600 85.0 Bear L 2,040,000 1,672,000 82.01996 Bear L 968,000 829,000 85.6 Bear L 1,481,000 1,039,000 70.21997 Bear L 687,000 606,000 88.2 Bear L 502,000 363,000 72.31998 Bear L 805,000 727,000 90.3 Bear L 2,645,000 2,377,000 89.91999 Bear L 867,000 637,000 73.5 Bear L 2,436,000 1,902,000 78.12000 Bear L 972,300 785,800 80.8 Bear L 5,093,000 4,402,000 86.42001 Bear L 1,052,000 864,000 82.1 Bear L 6,017,000 5,127,000 85.22002 Bear L 1,237,500 1,085,700 87.7 Bear L 6,004,000 4,921,000 82.02003 Bear L 1,249,572 1,093,892 87.5 Bear L 5,000,000 4,398,000 88.0Total 13,517,172 11,465,992 45,389,600 37,167,400Ave 84.9 79.4
Prior to 1993 sockeye salmon returning to the Big River Lakes area on the west side of Cook
Inlet or to Upper Russian Lake on the Kenai Peninsula served as broodstock for the Bear Lake
sockeye stocking program. Fry from eggs collected from one or both of these broodstocks were
released into Bear Lake each spring from 1990 through 1993.
In 1993, adults resulting from the Bear Lake stocking program returned to Bear Lake in numbers

28
large enough (>5,000) to provide broodstock for the hatchery. Since 1993 all sockeye gametes
collected for the Bear Lake stocking program were collected from adults returning to Bear Lake.
Originally, it was believed returning adult sockeye would congregate in the spawning area
identified on Figure 2 and be susceptible to capture by beach seine. In 1993, fish were captured
here; but, most of the returning sockeye were found spawning at a depth of 40 feet or greater and
were not susceptible to beach seining. In 1993, the egg collection goal was not met primarily
because of the difficulty in capturing broodstock.
Since 1993 several methods have been employed to collect fish for hatchery broodstock. Efforts
included capturing fish at the weir and holding them in raceways or deepwater net pens for
ripening and purse seining or gill netting the fish from the deepwater spawning areas. Although
the number of eggs collected has increased, none of the fish capture methods has worked well.
In 1995, fry were released directly to a small tributary stream where it was expected returning
adults could be easily captured. Since 1999, adults have returned to this area and broodstock
collections have improved.
In 2003, field crews concentrated their broodstock capture efforts by beach seining in the near
shore spawning areas and seining fish from deepwater spawning areas. Between 30 July and 4
September, 3,735 adult sockeye were captured and 18 egg collection exercises were completed.
These efforts resulted in the collection of 5,000,000 eggs from 1,854 females.
Male and female adult sockeye salmon from the spawning areas were killed and stripped of their
gametes. The gametes were shipped to Trail Lakes Hatchery for fertilization7, incubation and
rearing. Fertilization was completed by mixing the eggs from each female with a portion of the
milt from 8 to 10 males and activating the sperm with a 0.7% saline solution. The sockeye eggs
were incubated at ambient Trail Lakes Hatchery water temperature. Incubation followed
standard hatchery procedures and water temperature was regulated to thermally mark all fry.
7 Sockeye salmon eggs collected for stocking follow the delayed fertilization technique outlined in the ADF&G's Sockeye Salmon Policy Manual (State Pathology Review
Committee, 1987).

29
For eggs collected in 2003, survival to the eyed stage was 88.0%.
Procedures for the removal of the gametes from the captured fish have remained the same since
1989 and are described in CIAA's "Egg-Take Procedures" manual (CIAA, 1993).
Gamete Collection, Incubation, and Rearing - Coho
Coho salmon eggs were collected by capturing adult fish as they attempted to migrate past the
weir. The fish were held in the raceways at the weir (Figure 3) until the females' eggs matured.
Coho were spawned at the Bear Creek weir site between 15 October and 26 October. A total of
1,249,572 eggs were collected from 299 females and shipped to CIAA's Trail Lakes Hatchery for
fertilization, incubation and rearing. The eggs were fertilized with the milt from 206 males.
Additional gametes from 355 fish were collected and shipped to ADF&G's Fort Richardson
Hatchery.
Once at Trail Lakes Hatchery, delayed fertilization was conducted following ADF&G sockeye
salmon protocol. Eggs were pooled in groups of approximately 10 females for fertilization. The
coho eggs were incubated at ambient Trail Lakes Hatchery water temperature. Incubation
followed standard hatchery procedures and water temperature was regulated to thermally mark
all resulting fry.
For eggs collected in 2003, survival to the eyed stage was 87.5%.
Fish Transport and Stocking
Sockeye fry have been stocked into Bear Lake since 1990. For stocking, all fry were transported
by truck from Trail Lakes Hatchery to Bear Lake in oxygenated transport tanks. Fry were either
transferred to a boat in oxygenated transport tanks then motored to the eastside of the lake, or

30
trucked to a small tributary stream and released less than 0.5 kilometers upstream of the lake
(Figure 2).
In 2003, fry were transported by truck in oxygenated tanks to a small tributary stream, 0.5
kilometers from Bear Lake (Figure 2). Fry were held in large containers and supplied with creek
water for four hours to imprint them to the stream. After imprinting the fry were released into
the tributary.
In 2003, 1,467,000 sockeye fry were released on 26 June thru 27 June (Table 3). All fry were
released to the small tributary stream. The fry weighed 0.42 grams at the time of release and all
were thermally marked (Rbr 1:1.6 Prehatch, Hatch Code 6H). Fry otolith samples were
processed prior to the fry release to document thermal marks and are on file at the Trail Lakes
Hatchery.
In 2003, 334,000 sockeye smolts were released between 1 May and 4 May (Table 3). All smolts
were released from the raceways at Bear Creek Wier. The smolts weighed 4.06 grams and all
were thermally marked (Rbr 1:1.5,2.4 Prehatch, Hatch Code 65, 4H). Smolt otoliths samples
were processed prior to release to document thermal marks and are on file at the Trail Lakes
Hatchery.
Coho fry have been stocked into Bear Lake since 1986. For stocking, all coho fry were
transported by truck in oxygenated transport tanks, transferred to a boat and motored to the north
end of the lake where they were released in the littoral zone (Figure 2).
In 2003, 405,000 coho fry were released on 24 June (Table 3). The fry weighed 1.37 grams at
the time of release and all were thermally marked (Rbr 1:1.3, 2.3; Hatch Code: 3, 3H).
Since 1990, coho smolts have been released into Bear Creek. In 2003, 253,800 coho smolt
weighing 13.6 grams were held in raceways for rearing and imprinting at Bear Creek From 4
March to 15 May days and released on 16 May. These fish were thermally marked (Rbr 1:1.3,
31
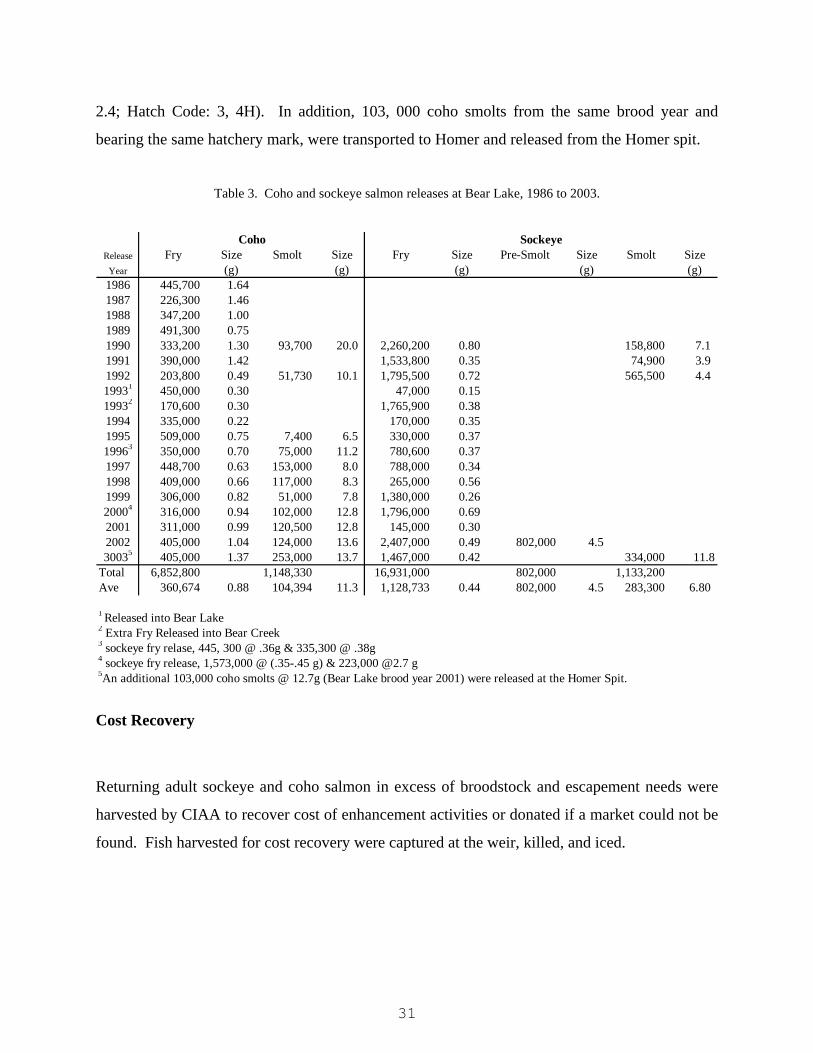
2.4; Hatch Code: 3, 4H). In addition, 103, 000 coho smolts from the same brood year and
bearing the same hatchery mark, were transported to Homer and released from the Homer spit.
Table 3. Coho and sockeye salmon releases at Bear Lake, 1986 to 2003.
Coho SockeyeRelease Fry Size Smolt Size Fry Size Pre-Smolt Size Smolt Size
Year (g) (g) (g) (g) (g)1986 445,700 1.641987 226,300 1.461988 347,200 1.001989 491,300 0.751990 333,200 1.30 93,700 20.0 2,260,200 0.80 158,800 7.11991 390,000 1.42 1,533,800 0.35 74,900 3.91992 203,800 0.49 51,730 10.1 1,795,500 0.72 565,500 4.419931 450,000 0.30 47,000 0.1519932 170,600 0.30 1,765,900 0.381994 335,000 0.22 170,000 0.351995 509,000 0.75 7,400 6.5 330,000 0.3719963 350,000 0.70 75,000 11.2 780,600 0.371997 448,700 0.63 153,000 8.0 788,000 0.341998 409,000 0.66 117,000 8.3 265,000 0.561999 306,000 0.82 51,000 7.8 1,380,000 0.2620004 316,000 0.94 102,000 12.8 1,796,000 0.692001 311,000 0.99 120,500 12.8 145,000 0.302002 405,000 1.04 124,000 13.6 2,407,000 0.49 802,000 4.530035 405,000 1.37 253,000 13.7 1,467,000 0.42 334,000 11.8
Total 6,852,800 1,148,330 16,931,000 802,000 1,133,200Ave 360,674 0.88 104,394 11.3 1,128,733 0.44 802,000 4.5 283,300 6.80
1 Released into Bear Lake2 Extra Fry Released into Bear Creek3 sockeye fry relase, 445, 300 @ .36g & 335,300 @ .38g 4 sockeye fry release, 1,573,000 @ (.35-.45 g) & 223,000 @2.7 g 5An additional 103,000 coho smolts @ 12.7g (Bear Lake brood year 2001) were released at the Homer Spit.
Cost Recovery
Returning adult sockeye and coho salmon in excess of broodstock and escapement needs were
harvested by CIAA to recover cost of enhancement activities or donated if a market could not be
found. Fish harvested for cost recovery were captured at the weir, killed, and iced.

32
RESULTS AND DISCUSSION
Limnology and Environmental Conditions
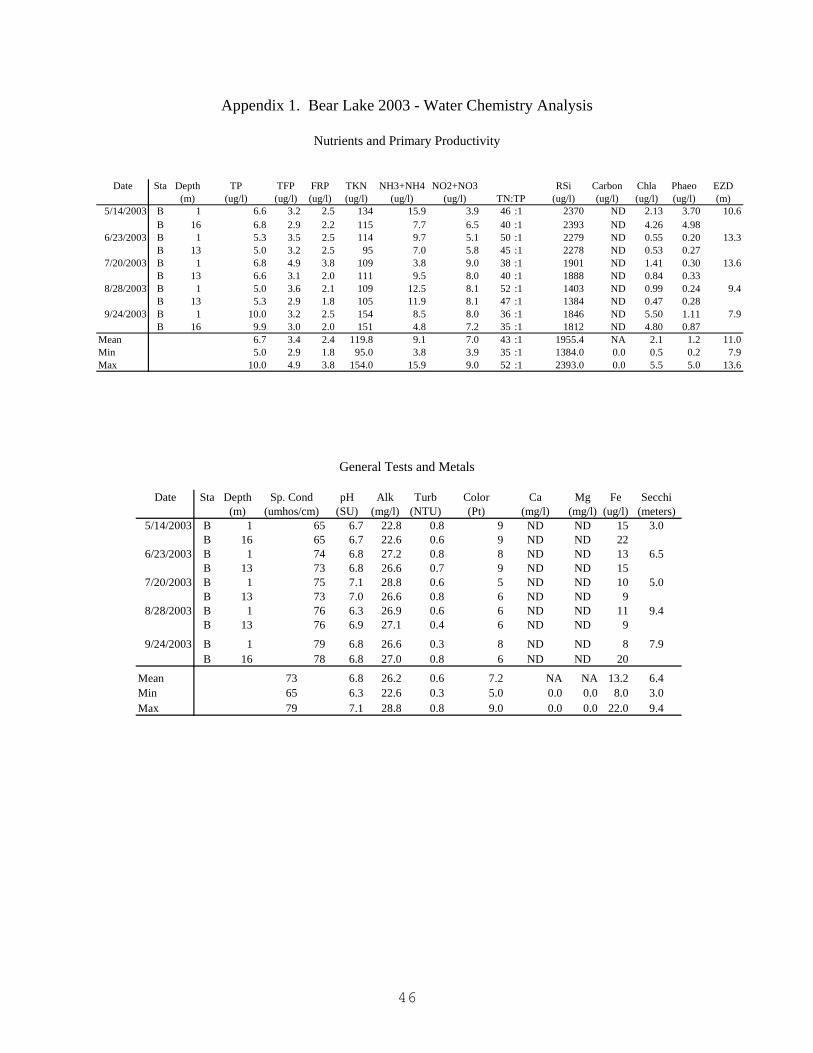
Bear Lake's limnological characteristics have been monitored for several years. The 2003
limnological data are presented in Appendix 1. This information has been summarized and is
presented as open water seasonal average concentrations in Table 4 (1 meter) and Table 5
(hypolimnion).
Table 4. Water quality characteristics of Bear Lake at 1 meter, 1979 to 2003.
Sp. Cond pH Alk Turb. TP TKN NO2+NO3 Chl a EZD Secchi ZooplanktonYear (umhos/cm) (SU) (mg/l) (NTU) (ug/l) (ug/l) (ug/l) TN:TP (ug/l) (m) (m) (mg/m2 )1979 76 7.4 30 8.0 8.31980 74 7.3 29 7.7 138 9.8 42 :1 3.41981 68 6.3 28 7.2 101 14.0 35 :1 3.4 7341982 77 7.6 29 9.9 149 47.0 44 :1 1.9 7041983 86 7.6 32 8.7 175 41.6 55 :1 2.0 9141984 88 7.4 32 2.5 10.6 204 24.0 48 :1 3.6 8361985 87 7.2 36 1.7 11.3 177 89.7 52 :1 2.6 4291986 82 7.3 32 2.3 12.3 188 12.4 36 :1 2.9 5831987 81 7.4 29 1.3 9.7 135 2.1 31 :1 1.6 401198819891990 78 7.4 29 1.6 6.5 170 54.1 76 :1 1.9 11.2 3.6 1,1341991 84 7.6 28 2.4 8.5 183 52.1 67 :1 2.8 7.4 3.2 4671992 80 7.2 26 1.7 7.5 166 89.1 85 :1 1.7 9.0 3.8 395
1993 82 7.1 27 1.2 7.3 134 37.4 58 :1 1.9 8.7 4.4 8041994 88 6.9 27 1.8 7.8 132 14.9 45 :1 2.1 11.4 5.0 7431995 80 7.2 27 1.9 7.6 116 12.0 37 :1 2.7 10.1 4.4 3771996 86 7.3 30 2.3 6.3 191 7.5 70 :1 3.1 9.0 3.8 9491997 89 7.5 33 2.3 7.4 161 17.8 56 :1 3.0 8.2 4.4 556
1998 79 7.2 29 1.2 7.6 176 18.7 66 :1 0.6 8.5 5.3 4851999 82 7.2 30 1.2 5.6 126 9.0 53 :1 0.9 9.7 5.6 6982000 80 7.0 28 2.2 6.8 125 3.4 42 :1 3.4 8.9 4.6 7112001 79 7.1 27 1.2 6.0 124 4.0 35 :1 2.0 9.2 5.0 8962002 78 7.1 29 0.7 7.0 117 12.4 42 :1 2.4 10.4 5.0 1,2712003 74 6.7 26 0.6 6.7 124 6.8 44 :1 2.1 11.0 6.4 345
Averages prior to 1992 compiled by ADF&G.EZD, Secchi and atomic ratio provided by CIAA.Open water season only.
1 meter depth

33
Table 5. Water quality characteristics of Bear Lake in the hypolimnion ,1979 to 2003.
Sp. Cond pH Alk Turb. TP TKN NO2+NO3 Chl aYear (umhos/cm) (SU) (mg/l) (NTU) (ug/l) (ug/l) (ug/l) TN:TP (ug/l)
1979 79 7.3 30 18.3 16.21980 81 7.2 31 13.9 168 14.3 29 :1 8.81981 69 6.3 29 11.3 124 19.3 28 :1 5.51982 78 7.4 28 16.6 177 37.6 29 :1 5.81983 88 7.3 32 14.7 259 43.1 46 :1 6.81984 96 7.1 34 6.3 13.9 269 29.9 48 :1 7.71985 90 6.9 36 2.8 11.6 253 76.6 63 :1 4.11986 89 6.7 32 4.1 14.4 244 34.1 43 :1 3.91987 85 7.1 29 2.1 15.2 222 20.8 35 :1198819891990 83 7.1 29 2.9 11.2 248 47.4 58 :1 5.41991 88 7.1 29 3.3 10.6 203 55.9 55 :1 3.41992 84 7.0 26 2.9 8.1 194 82.7 83 :1 3.21993 88 7.0 29 1.9 8.8 140 65.6 62 :1 1.11994 88 6.9 29 1.9 13.6 185 17.7 34 :1 5.61995 83 7.0 28 4.7 12.8 202 8.3 36 :1 8.11996 87 7.0 30 4.6 12.4 273 1.9 49 :1 7.61997 93 7.3 34 8.3 17.1 332 4.3 44 :1 9.71998 89 7.1 32 2.9 8.5 188 34.5 63 :1 1.61999 86 6.9 30 4.2 14.7 222 12.2 38 :1 3.82000 81 7.2 28 1.9 6.9 127 3.0 41 :1 4.62001 80 7.0 27 1.9 5.8 137 3.9 37 :1 3.22002 80 7.0 31 0.9 10.1 127 15.2 32 :1 2.42003 73 6.8 26 0.7 6.7 116 7.1 41 :1 2.2
Averages prior to 1992 compiled by ADF&G. EZD, Secchi and atomic ratio provided by CIAAOpen water season only
Hypolimnion
The environmental conditions recorded in 2003 are presented in Appendix 2. During the 2003
field season (1 May through 31 October 2003), 5:00 PM air temperature measurements ranged
from 3.0oC to 28.0oC with a seasonal average of 13.5oC. Bear Creek water temperatures ranged
from 1.0oC to 19.0oC and averaged 12.0oC. Precipitation recorded at the weir totaled 836 mm
(33.0 inches). The recorded stage level (lower gauge) ranged from 0.88 to 2.02 feet; and
averaged a level of 0.45 feet. The environmental conditions observed in 2003 are compared to
other years in Table 6.

34
Table 6. Environmental conditions observed at Bear Lake, 1990 to 2003.
May thru June 30No. of Days
<50% >50% Days Temperature (C)Total Cloud Cloud 100% Meas. Precip Air Water
Year Days Cover Cover Overcast Precip (mm) Avg Range Avg Range1990 44 ND ND ND ND ND ND ND 10 (3-15)1991 47 ND ND ND ND ND ND ND 7 (2-15)1992 49 24 20 13 11 48 IC IC 9 (3-14)1992 42 18 24 13 6 ND 14 (8-20) 13 (7-17)1994 47 16 31 20 18 IC 12 (5-22) 11 (5-16)1995 38 10 28 11 19 185 12 (6-22) 10 (6-14)1996 45 16 29 18 17 102 11 (5-16) 12 (8-15)1997 42 29 5 2 13 40 15 (9-22) 12 (5-20)1998 29 17 3 3 14 5 15 (8-24) 7 (4-14)1999 44 17 4 18 13 35 11 (4-20) 7 (0-14)2000 46 20 6 10 13 44 11 (2-16) 7 (2-12)2001 58 23 11 24 11 15 10 (1-18) 8 (0-15)2002 54 20 7 27 27 58 12 (6-24) 8 (1-16)2003 61 15 9 37 27 172 13 (6-23) 11 (1-16)
July thru Sept/Oct/NovNo. of Days
<50% >50% Days Temperature (C)Total Cloud Cloud 100% Meas. Precip Air Water
Year Days Cover Cover Overcast Precip (mm) Avg Range Avg Range1990 119 ND ND ND ND ND ND ND 10 (3-15)1991 100 ND ND ND ND ND ND ND 7 (2-15)1992 92 28 64 48 38 345 IC IC IC IC1992 109 40 69 57 38 ND 14 (6-24) 15 (8-20)1994 103 IC IC IC IC IC IC IC IC IC1995 105 42 63 36 67 728 13 (3-20) 13 (6-16)1996 101 28 73 42 50 308 10 (4-16) 14 (6-16)1997 107 45 25 6 48 616 14 (5-21) 15 (6-20)1998 117 43 13 36 72 627 12 (3-30) 11 (3-21)1999 113 38 10 38 44 509 12 (3-25) 10 (2-16)2000 125 44 14 12 68 443 9 (0-18) 10 (1-16)2001 121 26 18 77 79 718 11 (-3-19) 12 (1-18)2002 130 26 25 79 67 1084 12 (3-26) 11 (6-18)2003 123 40 22 60 56 661 14 (3-28) 13 (5-19)
*Sky condition data is calculated differently from 1997 onward. Rain days are counted as days with measurable precipitation and 100% overcast is measured as those days indicated as 100% overcast with or without measurable precipitation.

35
Smolt Enumeration - Sockeye
A total of 1,326,500 (± 24,100) sockeye smolts migrated from Bear Lake in 2002 (Appendix 3).
The 10% sub-sampling procedure was used to count 49.0% of the migration.
The age 1.0 smolts averaged 92.3 mm (± 0.76 mm) in length and 7.50 g (± 0.19 g) in weight.
The age 2.0 smolts averaged 139.5 mm (± 7.73 mm) in length and 30.40 g (± 4.86 g) in weight
(Table 7). Based on the presence of hatchery induced thermal marks in the otoliths of 952
smolts, it was estimated that 92.4% (± 1.7%) of the sockeye smolts were of hatchery origin.
Table 7. Sockeye smolt migrations: mean length and weight, by age class, for Bear Lake, 1980 to 2003.
Age Composition Average Length (mm)
%Year Number 95%CI Hatch. 95%CI 0.0 95% CI 1.0 95% CI 2.0 95% CI 3.0 95% CI 0.0 1.0 CI 2.0 CI 0.0 1.0 CI 2.0 CI1980 3,400 0 3,400 20 20 119 187 NA NA1981 3,500 0 2,800 700 0 117 158 16.2 41.61982 46,300 0 46,100 100 0 110 144 14.0 29.71983 13,000 0 11,000 2,000 40 112 149 13.5 32.91984 10,500 0 7,700 2,500 300 116 153 15.4 35.81985 1,600 0 1,300 300 30 126 176 20.2 51.41986 1,000 0 800 100 0 123 167 18.3 47.21987 18,200 0 17,800 300 100 112 172 12.8 46.51988 9,100 0 7,200 1,900 30 120 155 16.0 34.91989 5,100 0 3,700 1,300 200 122 152 18.8 35.619901 53,400 52,500 800 30 3 NA 113 125 NA 15.2 28.419912 122,000 0 119,900 1,600 600 125 164 18.7 40.419923 133,800 38,400 78,000 15,800 1,600 110 118 170 15 16.7 49.41993 345,800 54,600 285,500 4,900 0 115 123 152 18 18.7 35.31994 253,900 700 228,600 21,200 0 102 121 154 11.0 17.4 37.01995 73,500 1,900 70.2 8 0 6,800 1,600 4,800 1,000 0 122 156 17.9 37.21996 156,000 9,600 64.2 3.5 0 149,400 9,400 6,400 2,100 0 117 0.6 120 2.1 11.8 16.21997 276,000 64,000 74.6 3.6 0 270,500 64,000 5,500 3,500 0 104 0.5 143 7.6 10.1 0.2 26.7 4.41998 107,800 15,500 72.2 5.8 0 81,800 13,600 25,500 7,200 500 1,400 115 1.1 151 3.6 13.1 0.5 35.2 2.51999 75,800 6,800 74.5 5.5 0 59,800 5,400 15,400 4,000 700 900 132 1.2 163 6.3 20.3 0.6 31.4 2.12000 175,000 20,600 76.8 5.2 11,400 5,600 138,600 18,000 20,700 7,500 4,300 3,400 119 114 1.6 172 11.1 17 14.0 0.7 59.0 9.82001 387,500 15,700 88.2 2.2 0 346,600 12,900 28,600 7,400 12,200 4,900 103 0.8 131 0.4 10.1 6.5 28.9 11.92002 107,200 7,100 28.4 3.2 0 85,100 6,300 20,800 3,300 1,300 800 115 0.6 146 1.5 15.1 0.7 35.1 1.02003 1,326,500 24,100 92.4 1.7 0 1,306,200 22,000 23,000 10,000 0 92 0.8 140 7.7 7.5 0.2 30.4 4.9Avg.4 298,400 18,400 71.3 4.3 1,300 5,600 271,644 17,000 16,700 5,100 2,100 2,300 119 113 0.9 147 5.0 17 13.3 1.3 33.3 5.2Total 3,705,900 157,600 3,259,400 203,450 21,923
Average Length rounded to nearest mm, Average Weight rouinded to nearset 0.1 g. All other figures have been rounded to nearest 100 fish.
1In 1990, the migration of juvenile sockeye salmon consisted of three groups of fish: 870 wild smolts of age 1.0 or older, 227,906 age 0.0 fingerlings and 52, 491 age 0.0 smolts. Age, length and weight data for age 0.0 smolts have been lost. Summary statistics are based on the wild smolt migration.2In 1991 smolt migration monitoring may have terminated before age 0.0 smolt migration.3In 1992, an additional 68,505 sockeye fingerlings migrated from Bear Lake. These small fingerlings were expected to have low survivals and AWL data was not collected4Average values calculated from smolt year 1995 onward.
Average Weight (g)
Smolt Enumeration - Coho
A total of 208,100 (± 10,800) coho salmon smolts migrated from Bear Lake in 2003 (Appendix
3). The 10% sub-sampling procedure was used to count 6.5% of the migration.

36
The average size (Table 8) of the age 1.0 coho smolts was 108.7 mm (± 4.98) and 11.89 g
(± 0.30). Age 2.0 smolts were 119.4 (± 2.48) mm and 16.25 ( ± 1.62) g. Based on the presence
of hatchery induced thermal marks in the otoliths of 468 coho smolt, it was estimated that 86.9%
(± 3.1%) of the coho smolts were of hatchery origin.
Table 8. Coho smolt migrations: mean length and weight, by age class, for Bear Lake, 1980 to 2003.
%Year Number 95% CI Hatch. 95%CI 1 95% CI 2 95% CI 3 95% CI 4 95% CI 1 2 3 4 1 2 3 41980 75,000 54,600 20,300 100 122 135 19.3 24.01981 72,900 10,900 61,800 200 122 127 18.4 19.81982 143,700 134,000 9,600 100 116 127 15.0 20.41983 108,400 100,400 7,900 100 115 129 14.3 20.21984 93,800 78,300 15,200 300 116 134 15.0 22.41985 105,900 104,300 1,600 0 125 168 18.1 41.51986 72,700 60,900 11,500 300 126 137 19.5 24.91987 80,200 61,200 18,700 250 109 145 11.6 27.91988 63,800 50,500 13,300 0 118 133 16.4 22.31989 99,400 96,200 3,200 0 116 134 18.8 23.01990 83,400 67,500 14,800 1,000 119 139 15.7 24.11991 97,600 86,500 10,600 500 121 138 18.0 25.51992 112,900 107,500 4,700 600 120 137 17.1 25.71993 53,500 42,300 10,400 0 124 137 19.5 25.81994 54,400 6,000 43,700 0 115 128 14.4 20.71995 89,200 4,000 3,500 1,000 85,000 3,800 500 400 100 150 103 121 11.4 18.01996 154,900 15,300 16,100 4,700 137,300 14,400 1,400 1,400 0 95 112 8.4 13.51997 114,100 24,100 3,500 1,900 68,800 20,500 40,600 12,600 1,200 1,000 100 109 124 146 9.7 12.9 19.2 30.71998 92,200 7,200 8,200 2,500 73,000 6,000 10,900 2,800 600 700 100 114 140 168 8.4 13.6 26.2 40.51999 106,800 11,700 44,300 7,400 54,500 8,600 8,000 2,600 0 113 123 128 13.5 18.3 19.42000 70,900 4,600 55,600 3,300 13,500 2,900 1,800 1,200 0 109 128 144 13.0 20.4 28.920011 101,400 12,600 91.8 2.2 80,200 11,800 19,900 4,100 1,300 900 0 104 117 125 11.6 17.0 20.52002 94,200 11,700 84.5 3.0 82,400 11,300 11,500 3,000 300 500 0 109 119 148 11.9 16.2 36.52003 208,100 10,900 86.9 3.1 167,800 7,700 31,900 6,700 8,500 3,700 0 109 119 138 11.9 16.3 26.5Avg.2 97,892 11,300 87.7 2.8 63,400 5,700 30,900 7,800 3,200 2,900 200 600 114 130 135 157 15 22 25 36Total 2,349,400 1,522,700 710,800 68,250 1,900
Note: Averages for age 3.0 and 4.0 smolts are based on a small sample size.Average Length rounded to nearest mm, Average Weight rouinded to nearset 0.1 g. All other figures have been rounded to nearest 100 fish.1Percent Hatchery calculated for Age 1.0 smolts only21980 thru 1992 averages are arithmetic, 1993 and later are weighted averages.
Average Weight (g)Average Length (mm)Age Composition
Adult Escapement - Sockeye
Adult sockeye salmon began arriving at the weir on 21 May 2003 and continued to migrate until
31 July 2003 (Appendix 4). During this time, 16,010 adults were captured and counted at the
weir (Table 8). The peak of the migration occurred between 14 June and 24 June. The returning
major age groups for adult sockeye included ages 1.2 (45.1%), 1.3 (40.0%), and 2.3 (12.0%). Of
the 16,010 adult sockeye that migrated to Bear Creek in 2003, 2,776 were harvested for cost
recovery, 13,233 were passed to the lake, and 1 dead sockeye was found in the weir. An

37
additional 7,341 fish were harvested in the seine fishery for a total return to Resurrection Bay of
23,351 sockeye salmon.
A summary of mean age and weight, by age class, for adult salmon escapement to the Bear
Creek weir site for 2003 is presented in Appendix 6.
Table 9. Historic returns of Coho and Sockeye Salmon to Bear Lake weir, 1980 to 2003.
Weir Coho Salmon Weir Sockeye SalmonRetun Age Composition Retun Age Composition
Year Total 1.1 2.1 3.1 Total 0.2 1.1 0.3 1.2 0.4 1.3 2.1 2.2 2.3 3.2 3.31980 4,520 NA NA NA 1,462 0 0 0 1,447 0 0 15 0 0 01981 3,924 2,252 1,627 45 704 0 0 0 5 0 631 0 63 5 0 01982 2,122 NA NA NA 472 0 0 0 407 0 26 0 6 28 0 01983 5,797 5,261 510 25 627 0 0 0 275 0 316 0 25 11 0 01984 3,375 3,969 401 5 3,552 0 0 0 3,432 0 74 0 31 10 0 01985 4,825 4,222 603 0 1,235 0 0 0 245 0 935 0 52 3 0 01986 5,479 5,384 95 0 830 0 0 0 356 0 425 0 44 6 0 01987 6,021 5,888 133 0 212 0 0 0 75 0 102 0 26 5 0 01988 2,174 1,818 356 0 106 0 0 0 51 0 44 0 3 8 0 01989 5,106 4,174 932 0 185 0 0 0 174 0 11 0 0 0 0 01990 7,525 7,179 346 0 1,071 0 0 0 390 0 627 0 ---11--- 0 01991 7,331 6,328 1,003 0 741 0 0 0 232 0 409 0 90 5 0 01992 3,055 2,444 611 0 1,925 1,398 33 0 246 0 225 0 17 6 0 01993 8,671 8,136 535 0 6,708 84 17 4,068 2,336 0 135 0 17 17 0 01994 5,995 4,643 1,352 0 16,752 4,399 149 196 4,813 44 6,198 0 802 129 20 01995 3,295 883 2,346 66 29,203 29 380 4,877 4,877 117 17,317 29 876 672 0 01996 1,711 495 1,216 0 15,957 34 101 1,280 7,002 0 5,555 0 1,919 67 0 01997 3,569 618 2,883 68 17,965 0 663 26 4,849 0 10,080 0 1,123 1,174 26 261998 11,023 935 9,531 557 29,447 0 49 25 24,613 0 4,245 0 344 172 0 01999 3,811 529 2,991 291 17,439 0 0 0 9,004 0 6,802 25 1,534 74 0 02000 6,765 1,172 5,465 129 13,716 0 136 0 2,139 0 10,253 0 917 272 0 02001 2,913 1,515 1,265 133 16,364 0 0 0 5,187 0 9,705 0 736 736 0 02002 3,484 1,475 1,884 124 15,227 0 0 0 11,235 0 3,064 0 859 70 0 02003 3,506 2,727 752 27 16,010 0 58 0 7,219 0 6,404 0 1,921 408 0 0Avg1 4,607 1,499 2,968 140 18,808 446 154 640 8,094 16 7,962 5 1,103 377 5 3
% of Avg 100% 32.5% 64.4% 3.0% 100% 2.4% 0.8% 3.4% 43.0% 0.1% 42.3% 0.03% 5.9% 2.0% 0.02% 0.1%
1 Average calculation is based on 1994 data onward.
Adult Escapement - Coho
Adult coho salmon began arriving at the weir on 17 August 2003 and continued to migrate until
28 October (Appendix 5). During this time, 3,506 adults were captured and counted at the weir
(Table 10). The peak of the adult coho migration occurred between 29 September and 5
October. The returning major age groups for adult coho included ages 1.1 (77.8%), 2.1 (21.5%),
and 3.1 (0.8%).

38
Of the 3,506 adult coho that were counted at the Bear Creek weir site, 2,065 were harvested,
1,021 were captured and held for hatchery broodstock (505 for CIAA, 355 for ADF&G, and 161
mortalities), and 395 were passed into the lake. There were 25 coho observed in Bear Creek
below the weir; and no coho were estimated to remain in Salmon Creek when operations were
terminated on October 31.
A summary of mean age and weight, by age class for adult salmon escapement to the Bear Creek
weir site for 2003 is presented in Appendix 7.
Cost Recovery
In 2003, 2,776 sockeye were harvested and sold or donated; 2,065 coho were harvested and sold
or donated. For more detailed information on the Resurrection Bay cost recovery harvest
reference the Cook Inlet Aquaculture Association’s Cost Recovery Harvest Summary 2003. A
copy is available by calling 907-283-5761.
Stocking
Prior to brood year 1993, adult sockeye escapement to Bear Lake was small, wild smolt
production was considered negligible and hatchery survival rates were estimated from total smolt
production. The hatchery survival rates reported in Table 10 assume no wild smolt production
and represent maximum values. After brood year 1993, smolt production was based on the
recovery of otolith marks.
ADF&G considers a fry to smolt survival rate of 20% to be a reasonable sockeye stocking
program goal. The reported sockeye fry to smolt survival rates for brood years 1989 through
1992 were less than 20%. Since brood year 1992, reported survival rates have average slightly
more than 20%.

39
Coho salmon smolts produced from Bear Lake are the result of the coho fry stocking program
and natural production in the lake. Since brood year 1993, attempts have been made to
distinguish lake produced coho smolts from smolts resulting from the fry stocking program.
This assessment is based on the recovery of otolith marks during the smolt migration and is not
complete at this time.
The result of the fry stocking activity, in terms of smolt production and percent survival, is
presented in Table 10. Table 10. Bear Lake smolt production by brood years.
Brood No. Fry Size No. Hatch % Hatch. Brood No. Fry Size No. Hatch. % Hatch.Year Escap. Stocked (g) Smolt Smolt Survival Year Escap. Stocked (g) Smolt Smolt Survival1985 4,421 445,700 1.64 74,520 1985 1,235 19,7401986 5,115 226,300 1.46 54,700 1986 830 8,4501987 5,653 347,200 1.00 111,570 1987 212 4,3201988 1,640 491,300 0.75 78,680 1988 106 4,0301989 475 333,200 1.30 91,280 1989 185 2,260,000 0.80 188,1401990 919 390,600 1.42 118,000 1990 1,071 1,530,000 0.35 82,9201991 227 203,800 0.49 86,470 1991 741 1,796,000 0.72 345,0801992 332 450,000 0.30 91,950 1992 1,925 1,813,000 0.38 288,6801993 560 335,000 0.22 62,800 1993 5,045 170,000 0.15 67,960 47,710 28.11994 475 509,000 0.75 204,100 1994 8,430 330,000 0.37 155,700 101,020 30.61995 444 350,000 0.70 84,600 1995 8,334 781,000 0.37 296,500 220,541 28.21996 380 448,700 0.63 64,500 1996 8,012 788,000 0.34 101,395 70,311 8.91997 276 409,000 0.66 57,700 1997 7,945 265,000 0.56 92,532 70,857 26.71998 350 306,000 0.82 74,827 1998 8,427 1,380,000 0.25 168,449 134,508 9.71999 368 316,100 0.94 95,902 85,528 27.1 1999 7,815 1,796,400 0.80 378,915 320,644 17.82000 * 429 311,000 0.99 98,331 98,712 31.7 2000 11,828 144,500 0.30 105,367 44,121 30.52001 * 495 405,000 1.04 83,885 74,574 18.4 2001 * 12,801 2,407,000 0.49 368,171 287,357 11.92002 * 875 405,000 1.37 2002 * 12,504 1,467,000 0.422003 * 395 2003 * 13,233Ave1 459 379,500 0.81 92,845 86,271 NA Ave1 9,489 952,900 0.41 170,852 144,119 22.6
* Incomplete broodyear * Incomplete broodyear 1Average data is for 1993 onward. 1Average data is for 1993 to 2000Note: Number of Hatchery Smolt is based on otolith mark data.. Note: Number of Hachery Smolt is based on otolith mark data.
Coho Sockeye

40
RECOMMENDATIONS
There are no new recommendations regarding the Bear Lake Enhancement Project.

41
This page is intentionally left blank

42
LITERATURE CITED
Cook Inlet Aquaculture Association. 2001. Bear Lake Procedures Manual. Cook Inlet Aquaculture Association. Kenai, AK
Cook Inlet Aquaculture Association. 1993. Egg-take Procedures Manual. Cook Inlet
Aquaculture Association. Kenai, AK. Cooperative Agreement, ADF&G, FRED Division and ADF&G, Sport Fish Division and CIAA.
Operation of the Weir and Cooperative Use of On-site Housing for the Bear Creek Coho Enhancement Project in Resurrection Bay. Cook Inlet. August 1989.
Koenings, J.P., J.A. Edmundson, J.M. Edmundson, and G.B. Kyle. 1986. Limnology Field and
Laboratory Manual: Methods for Assessing Aquatic Production. ADF&G, FRED Division. Soldotna, Ak. 222 pages.
Koenings, J.P., and R.D. Burkett. 1987. Population Characteristics of Sockeye Salmon,
(Onchorynchus nerka), Smolts Relative to Temperature Regimes, Euphotic Volume, Fry Density and Forage Base Within Alaskan Lakes. pp 216-234. In H.D. Smith, L. Margolis, and C.C. Wood (ed.) Sockeye Salmon, (Onchorynchus nerka), Population Biology and Future Management. Can. Spec. Pub. of Fish. and Aquatic Sci. 96.
State Pathology Review Committee. 1987. Regulation Changes, Policies and Guidelines for
Alaska Fish and Shellfish Health and Disease Control. ADF&G, FRED Division. 69 pages.
Vincent-Lang, D. 1987. Biological statistics for coho (Onchorynchus kisutch) and sockeye
(Onchorynchus nerka) salmon in Resurrection Bay, Alaska, 1962-1986. Management Options for Bear Lake. A Summary of Past Performance and Evaluations of Future Options. ADF&G, Division of Sport Fish.

43
This page is intentionally left blank

44
APPENDICES

45
This page is intentionally left blank
46
Appendix 1. Bear Lake 2003 - Water Chemistry Analysis
Nutrients and Primary Productivity
Date Sta Depth TP TFP FRP TKN NH3+NH4 NO2+NO3 RSi Carbon Chla Phaeo EZD(m) (ug/l) (ug/l) (ug/l) (ug/l) (ug/l) (ug/l) (ug/l) (ug/l) (ug/l) (ug/l) (m)
5/14/2003 B 1 6.6 3.2 2.5 134 15.9 3.9 46 :1 2370 ND 2.13 3.70 10.6B 16 6.8 2.9 2.2 115 7.7 6.5 40 :1 2393 ND 4.26 4.98
6/23/2003 B 1 5.3 3.5 2.5 114 9.7 5.1 50 :1 2279 ND 0.55 0.20 13.3B 13 5.0 3.2 2.5 95 7.0 5.8 45 :1 2278 ND 0.53 0.27
7/20/2003 B 1 6.8 4.9 3.8 109 3.8 9.0 38 :1 1901 ND 1.41 0.30 13.6B 13 6.6 3.1 2.0 111 9.5 8.0 40 :1 1888 ND 0.84 0.33
8/28/2003 B 1 5.0 3.6 2.1 109 12.5 8.1 52 :1 1403 ND 0.99 0.24 9.4B 13 5.3 2.9 1.8 105 11.9 8.1 47 :1 1384 ND 0.47 0.28
9/24/2003 B 1 10.0 3.2 2.5 154 8.5 8.0 36 :1 1846 ND 5.50 1.11 7.9B 16 9.9 3.0 2.0 151 4.8 7.2 35 :1 1812 ND 4.80 0.87
Mean 6.7 3.4 2.4 119.8 9.1 7.0 43 :1 1955.4 NA 2.1 1.2 11.0Min 5.0 2.9 1.8 95.0 3.8 3.9 35 :1 1384.0 0.0 0.5 0.2 7.9Max 10.0 4.9 3.8 154.0 15.9 9.0 52 :1 2393.0 0.0 5.5 5.0 13.6
TN:TP
General Tests and Metals
Date Sta Depth Sp. Cond pH Alk Turb Color Ca Mg Fe Secchi(m) (umhos/cm) (SU) (mg/l) (NTU) (Pt) (mg/l) (mg/l) (ug/l) (meters)
5/14/2003 B 1 65 6.7 22.8 0.8 9 ND ND 15 3.0B 16 65 6.7 22.6 0.6 9 ND ND 22
6/23/2003 B 1 74 6.8 27.2 0.8 8 ND ND 13 6.5B 13 73 6.8 26.6 0.7 9 ND ND 15
7/20/2003 B 1 75 7.1 28.8 0.6 5 ND ND 10 5.0B 13 73 7.0 26.6 0.8 6 ND ND 9
8/28/2003 B 1 76 6.3 26.9 0.6 6 ND ND 11 9.4B 13 76 6.9 27.1 0.4 6 ND ND 9
9/24/2003 B 1 79 6.8 26.6 0.3 8 ND ND 8 7.9B 16 78 6.8 27.0 0.8 6 ND ND 20
Mean 73 6.8 26.2 0.6 7.2 NA NA 13.2 6.4Min 65 6.3 22.6 0.3 5.0 0.0 0.0 8.0 3.0Max 79 7.1 28.8 0.8 9.0 0.0 0.0 22.0 9.4

47
Appendix 1. (continued) Bear Lake 2003 - Zooplankton Analysis
Macrozooplankton Density - Site A(No/m2)
Mean Seasonal Mean14-May 23-Jun 20-Jul 26-Aug 24-Sep (No/m2) (No/m2)
Ergasilus 0 0Scapholeberis 0 0Epischura 21 18,684 16,136 6,369 8,242 8,242Diaptomus 4,246 1,274 0 0 1,104 1,104Ovig Diaptomus 212 42 42Cyclops 74 2,972 0 425 2,123 1,119 1,119Ovig Cyclops 212 425 127 127Bosmina 74 6,157 152,017 44,586 3,609 41,289 41,289Ovig Bosmina 2,972 2,548 1,699 637 1,571 1,571Daphnia l. 159 27,813 81,953 83,227 38,217 46,274 46,274Ovig Daphnia l. 11 14,225 18,684 14,013 3,185 10,024 10,024Ceriodaphnia sp. 0 0Holopedium 0 0Chydorinae 0 0Polyphemus 0 0Total: 339 77,493 273,037 150,319 47,771 109,792 109,792Ave: 68 8,610 34,130 21,474 7,962 14,449 14,449Stdev: 59 9,562 54,934 31,429 14,888 15,156 15,156
Macrozooplankton Density - Site B(No/m2)
Mean Seasonal Mean14-May 23-Jun 20-Jul 26-Aug 24-Sep (No/m2) (No/m2)
Ergasilus 0 0Scapholeberis 0 0Epischura 32 9,130 15,924 10,828 425 7,268 7,268Diaptomus 1,274 0 0 2,548 764 764Ovig Diaptomus 0 0Cyclops 255 5,732 2,548 6,369 1,274 3,236 3,236Ovig Cyclops 212 3,185 679 679Bosmina 96 2,760 124,841 42,038 7,219 35,391 35,391Ovig Bosmina 32 637 1,274 3,185 2,123 1,450 1,450Daphnia l. 764 26,539 135,669 159,873 68,365 78,242 78,242Ovig Daphnia l. 287 5,308 21,019 28,662 5,096 12,074 12,074Ceriodaphnia sp. 0 0Holopedium 0 0Chydorinae 0 0Polyphemus 0 0Total: 1,466 51,592 304,460 250,955 87,050 139,105 139,105Ave: 244 6,449 38,058 35,851 12,436 18,607 18,607Stdev: 277 8,666 57,468 56,744 24,773 21,207 21,207

48
Appendix 1 (continued). Bear Lake 2003 – Zooplankton Analysis
Mean Weighted WeightedLength Length Biomass Biomass
14-May 23-Jun 20-Jul 26-Aug 24-Sep (mm) (mm) (mg/m2) (mg/m2)Ergasilus Scapholeberis Epischura 0.61 0.98 1.83 1.14 1.20 54 62Diaptomus 0.70 1.32 1.31 1.22 1.14 0.84 7 3Ovig Diaptomus 1.36 1.36 1.36 0.43 0.43Cyclops 0.79 0.73 0.76 1.29 0.65 0.84 0.74 3 2Ovig Cyclops 1.24 1.20 1.22 1.21 1 1Bosmina 0.42 0.36 0.38 0.51 0.52 0.44 0.41 74 64Ovig Bosmina 0.51 0.40 0.61 0.53 0.51 0.50 4 4Daphnia l. 0.58 0.57 0.74 0.85 0.69 0.69 0.75 94 114Ovig Daphnia l. 0.80 0.86 1.03 1.18 0.87 0.95 1.01 41 47Ceriodaphnia sp.Holopedium ChydorinaePolyphemus TOTAL: 277 297
Mean Weighted WeightedLength Length Biomass Biomass
14-May 23-Jun 20-Jul 26-Aug 24-Sep (mm) (mm) (mg/m2) (mg/m2)Ergasilus Scapholeberis Epischura 0.50 1.13 1.20 1.75 1.54 1.22 1.35 58 77Diaptomus 1.16 1.28 1.32 1.34 1.28 1.28 7 7Ovig DiaptomusCyclops 0.91 0.88 1.08 1.05 0.65 0.91 0.96 10 11Ovig Cyclops 1.25 1.21 1.23 1.21 4 4Bosmina 0.39 0.41 0.37 0.43 0.46 0.41 0.39 56 49Ovig Bosmina 0.54 0.50 0.42 0.55 0.52 0.51 0.51 4 4Daphnia l. 0.63 0.58 0.69 0.80 0.69 0.68 0.73 155 180Ovig Daphnia l. 0.75 0.84 1.03 1.14 0.90 0.93 1.05 48 62Ceriodaphnia sp.HolopediumChydorinaePolyphemusTOTAL: 340 393
Body Size - Site B
Seasonal Means
Seasonal Means(mm)
Body Size - Site A (mm)

49
Appendix 2. Bear Lake 2003 - Environmental Conditions
Lower Upper Water Air Lower Upper Water AirPrecip. Gage Gage Temp. Temp. Precip. Gage Gage Temp. Temp.
Date Sky (mm) (ft) (ft) (C) (C) Date Sky (mm) (ft) (ft) (C) (C)1-May 1 0 0.76 1.39 5.0 13.0 1-Jun 5 2 1.20 1.28 13.0 9.02-May 1 0 0.72 1.38 5.0 16.0 2-Jun 3 2 1.20 1.28 13.0 12.03-May 1 0 0.68 1.38 5.0 18.0 3-Jun 2 0 1.97 1.25 14.0 16.04-May 5 0 0.96 1.38 7.0 9.0 4-Jun 5 0 1.97 1.25 14.0 13.05-May 5 11 0.79 1.40 7.0 11.0 5-Jun 5 2 1.97 1.28 13.0 11.06-May 3 1 1.06 1.38 7.0 12.0 6-Jun 5 10 1.04 1.30 13.0 10.07-May 1 0 1.20 1.37 7.0 13.0 7-Jun 5 2 1.04 1.31 13.0 11.08-May 4 0 0.96 1.36 7.0 11.0 8-Jun 4 0 1.05 1.32 13.0 16.09-May 5 44 1.20 1.40 7.0 7.0 9-Jun 4 0 1.05 1.32 13.0 16.010-May 4 45 0.80 1.85 7.0 8.0 10-Jun 5 0 1.05 1.32 13.0 15.011-May 5 4 0.82 1.82 7.0 6.0 11-Jun 4 2 0.96 1.22 13.0 13.012-May 5 8 0.96 1.82 7.0 9.0 12-Jun 1 2 0.96 1.22 14.0 16.013-May 4 1 0.92 1.82 8.0 9.0 13-Jun 5 0 1.06 1.26 14.0 16.014-May 3 0 0.88 1.82 8.0 10.0 14-Jun 4 0 1.04 1.30 14.0 15.015-May 3 0 0.92 1.82 8.0 11.0 15-Jun 4 1 0.97 1.32 14.0 13.016-May 3 0 0.92 1.82 8.0 12.0 16-Jun 3 0 1.01 1.32 15.0 17.017-May 4 0 0.90 1.52 8.0 10.0 17-Jun 5 0 1.05 1.32 15.0 16.018-May 5 0 0.92 1.50 8.0 10.0 18-Jun 3 0 1.01 1.28 15.0 16.019-May 1 1 1.00 1.48 8.0 11.0 19-Jun 3 0 1.01 1.28 15.0 15.020-May 1 2 0.90 1.42 9.0 14.0 20-Jun 4 0 1.01 1.28 15.0 16.021-May 1 0 0.90 1.30 1.0 12.0 21-Jun 5 3 1.01 1.28 15.0 13.022-May 4 0 0.92 1.30 1.0 12.0 22-Jun 1 0 1.08 1.28 15.0 16.023-May 4 0 0.94 1.30 1.0 12.0 23-Jun 4 0 1.08 1.28 14.0 13.024-May 5 0 0.96 1.30 1.0 15.0 24-Jun 5 3 1.08 1.28 14.0 12.025-May 2 1 0.96 1.30 12.0 16.0 25-Jun 5 8 2.02 1.28 13.0 12.026-May 4 1 1.00 1.36 12.0 13.0 26-Jun 5 3 2.02 1.28 13.0 12.027-May 3 2 0.97 1.35 13.0 13.0 27-Jun 4 4 2.02 1.26 13.0 12.028-May 1 0 0.93 1.35 13.0 13.0 28-Jun 1 4 0.98 1.26 15.0 20.029-May 4 0 0.92 1.35 13.0 16.0 29-Jun 2 0 0.98 1.30 15.0 17.030-May 4 0 0.92 1.35 13.0 15.0 30-Jun 1 0 1.40 1.30 16.0 23.031-May 5 2 0.85 1.28 13.0 9.0
Sky conditions 1 = Clear 2 = less than 50% cloud cover 3 = more than 50% cloud cover 4 = 100% overcast 5 = rain

50
Appendix 2 (continued). Bear Lake 2003 - Environmental Conditions
Lower Upper Water Air Lower Upper Water AirPrecip. Gage Gage Temp. Temp. Precip. Gage Gage Temp. Temp.
Date Sky (mm) (ft) (ft) (C) (C) Date Sky (mm) (ft) (ft) (C) (C)1-Jul 4 0 1.02 1.3 17.0 18.0 1-Aug 1 0 1.02 1.25 16.0 21.02-Jul 5 0.6 1.03 1.1 17.0 15.0 2-Aug 2 0 1.02 1.25 16.0 20.03-Jul 2 0 1.10 1.38 18.0 23.0 3-Aug 4 0 0.86 1.22 17.0 17.04-Jul 4 0 1.10 1.38 18.0 15.0 4-Aug 3 0 0.82 1.24 17.0 16.05-Jul 2 0 1.10 1.34 18.0 23.0 5-Aug 1 0 0.82 1.24 17.1 22.06-Jul 2 0 1.10 1.34 18.0 22.0 6-Aug 2 0 0.82 1.23 18.0 22.07-Jul 2 0 1.10 1.32 18.0 23.0 7-Aug 2 0 0.80 1.22 18.0 23.08-Jul 3 0 1.08 1.32 18.0 22.0 8-Aug 2 0 0.78 1.22 18.0 22.09-Jul 3 0 1.08 1.32 18.0 19.0 9-Aug 1 0 0.78 1.22 18.0 19.0
10-Jul 4 0 1.08 1.32 18.0 19.0 10-Aug 1 0 0.78 1.22 18.0 13.011-Jul 4 0 1.08 1.32 18.0 14.0 11-Aug 5 1 0.78 1.22 19.0 16.012-Jul 1 0 1.10 1.32 18.0 20.0 12-Aug 4 23 1.18 1.37 18.0 13.013-Jul 1 0 1.10 1.32 18.0 23.0 13-Aug 5 21 1.19 1.30 16.0 13.014-Jul 2 0 1.11 1.32 18.0 16.0 14-Aug 5 23 1.90 1.38 15.0 13.015-Jul 4 0 1.11 1.32 18.0 15.0 15-Aug 5 21 1.10 1.40 16.0 13.016-Jul 5 0 1.16 1.30 17.0 16.0 16-Aug 5 20 1.50 1.42 16.0 13.017-Jul 3 0 1.16 1.30 17.0 17.0 17-Aug 3 14 1.01 1.48 16.0 16.018-Jul 1 0 1.16 1.22 17.0 19.0 18-Aug 3 0 0.89 1.44 16.0 15.019-Jul 3 0 1.16 1.24 17.0 20.0 19-Aug 5 1 0.76 1.42 16.0 12.020-Jul 4 0 1.16 1.26 17.0 18.0 20-Aug 3 1 0.86 1.48 15.0 14.021-Jul 3 0 1.17 1.28 17.0 18.0 21-Aug 4 0 0.80 1.46 15.0 16.022-Jul 4 0.5 1.16 1.30 17.0 17.0 22-Aug 2 0 0.76 1.44 15.0 19.023-Jul 4 0 1.16 1.30 17.0 14.0 23-Aug 2 0 0.62 1.36 14.0 18.024-Jul 4 1.2 1.16 1.30 16.0 14.0 24-Aug 4 0 0.62 1.36 14.0 15.025-Jul 5 8.2 1.16 1.30 16.0 14.0 25-Aug 5 1 0.60 1.32 14.0 12.026-Jul 5 0 1.16 1.30 16.0 14.0 26-Aug 5 23 0.67 1.34 14.0 13.027-Jul 4 0 1.16 1.30 16.0 12.0 27-Aug 4 16 0.65 1.34 14.0 13.028-Jul 5 18 0.96 1.30 16.0 14.0 28-Aug 5 25 0.74 1.34 14.0 14.029-Jul 5 0 0.96 1.30 16.0 12.0 29-Aug 4 22 0.82 1.35 14.0 14.030-Jul 3 0 0.96 1.32 16.0 16.0 30-Aug 3 9 0.92 1.37 14.0 15.031-Jul 1 1 1.02 1.25 16.0 22.0 31-Aug 3 0 0.86 1.37 14.0 16.0
Sky conditions 1 = Clear 2 = less than 50% cloud cover 3 = more than 50% cloud cover 4 = 100% overcast 5 = rain

51
Appendix 2 (continued). Bear Lake 2003 - Environmental Conditions
Lower Upper Water Air Lower Upper Water Air
Precip. Gage Gage Temp. Temp. Precip. Gage Gage Temp. Temp.Date Sky (mm) (ft) (ft) (C) (C) Date Sky (mm) (ft) (ft) (C) (C)1-Sep 2 0 0.78 1.28 14.0 15.0 1-Oct 3 45 0.62 1.68 10.0 11.02-Sep 2 0 0.67 1.40 14.0 19.0 2-Oct 5 34 0.60 1.68 10.0 11.03-Sep 3 0 0.60 1.38 14.0 16.0 3-Oct 3 44 0.76 1.92 10.0 10.04-Sep 4 0 0.60 1.38 14.0 15.0 4-Oct 5 7 0.22 1.94 10.0 9.05-Sep 2 0 0.60 1.38 14.0 16.0 5-Oct 5 22 ND 1.98 10.0 9.06-Sep 2 0 0.60 1.38 14.0 16.0 6-Oct 5 42 ND 2.16 9.0 10.07-Sep 1 0 0.80 1.36 14.0 16.0 7-Oct 5 28 ND 2.62 9.0 10.08-Sep 5 0 0.78 1.36 14.0 14.0 8-Oct 4 7 ND 1.58 9.0 9.09-Sep 5 3 0.80 1.30 14.0 13.0 9-Oct 5 3 ND 2.38 8.0 7.0
10-Sep 2 0 0.80 1.30 14.0 28.0 10-Oct 3 7 ND 1.90 8.0 7.011-Sep 2 0 0.78 1.32 14.0 16.0 11-Oct 3 1 ND 1.84 8.0 9.012-Sep 4 0 0.70 1.30 14.0 15.0 12-Oct 4 0 ND 1.76 8.0 7.013-Sep 1 0 0.68 1.26 14.0 13.0 13-Oct 4 1 ND 1.76 8.0 7.014-Sep 1 0 0.68 1.24 14.0 10.0 14-Oct 5 1 ND 1.74 8.0 7.015-Sep 1 0 0.68 1.24 13.0 11.0 15-Oct 1 2 ND 1.68 7.0 6.016-Sep 1 0 0.66 1.22 12.0 12.0 16-Oct 1 0 ND 1.68 7.0 6.017-Sep 2 0 0.66 1.18 12.0 15.0 17-Oct 3 0 ND 1.68 6.0 7.018-Sep 1 0 0.66 1.18 12.0 9.0 18-Oct 4 1 ND 1.68 6.0 7.019-Sep 4 0 0.62 1.16 12.0 11.0 19-Oct 4 13 ND 1.52 6.0 6.020-Sep 4 22 0.82 1.32 9.0 5.0 20-Oct 3 1 ND 1.52 6.0 7.021-Sep 3 0 0.78 1.28 9.0 9.0 21-Oct 2 0 ND 1.50 6.0 8.022-Sep 2 0 0.60 1.20 9.0 11.0 22-Oct ND 2 ND 1.46 6.0 8.023-Sep 5 0 0.62 1.18 9.0 8.0 23-Oct 4 0 ND 1.42 6.0 9.024-Sep 4 1 0.46 1.18 9.0 9.0 24-Oct 4 13 ND 1.38 6.0 7.025-Sep 3 8 0.46 1.18 9.0 10.0 25-Oct 5 24 ND 1.36 6.0 8.026-Sep 4 1 0.46 1.18 9.0 11.0 26-Oct 5 22 ND 1.36 6.0 5.027-Sep 3 0 0.48 1.20 9.0 11.0 27-Oct 1 10 ND 1.34 6.0 3.028-Sep 5 8 0.48 1.18 9.0 12.0 28-Oct 1 0 ND 1.34 5.0 4.029-Sep 5 10 0.95 1.20 9.0 12.0 29-Oct 1 0 ND 1.34 5.0 4.030-Sep 5 35 1.42 1.40 9.0 12.0 30-Oct 4 0 ND 1.34 5.0 6.0
31-Oct 2 0 ND 1.46 5.0 6.0
Sky conditions 1 = Clear 2 = less than 50% cloud cover 3 = more than 50% cloud cover 4 = 100% overcast 5 = rain

52
Appendix 3. Bear Lake 2003 - Smolt Migration.
Sockeye CohoDate Daily Cumm Daily Cumm Daily Cumm Daily Cumm
01-May 0 0 0 0 0 0 0 002-May 0 0 0 0 0 0 0 003-May 0 0 0 0 0 0 0 004-May 0 0 0 0 0 0 0 005-May 0 0 0 0 0 0 0 006-May 0 0 0 0 0 0 0 007-May 0 0 0 0 0 0 0 008-May 0 0 0 0 0 0 0 009-May 0 0 0 0 0 0 0 010-May 0 0 0 0 0 0 0 011-May 0 0 0 0 0 0 0 012-May 15,766 15,766 106 106 0 0 5 513-May 20,350 36,116 126 232 0 0 1 614-May 13,944 50,060 255 487 0 0 0 615-May 53,329 103,389 514 1,001 2 2 0 616-May 43,548 146,937 494 1,495 2 4 0 617-May 48,145 195,082 1,182 2,677 36 40 0 618-May 14,478 209,560 410 3,087 0 40 0 619-May 127,349 336,909 1,689 4,776 10 50 0 620-May 53,036 389,945 735 5,511 40 90 0 621-May 118,955 508,900 2,229 7,740 50 140 0 622-May 78,983 587,883 1,966 9,706 21 161 0 623-May 106,140 694,023 3,653 13,359 0 161 0 624-May 66,060 760,083 2,417 15,776 20 181 0 625-May 74,176 834,259 5,053 20,829 20 201 0 626-May 63,276 897,535 3,737 24,566 10 211 0 627-May 27,257 924,792 1,282 25,848 0 211 0 628-May 50,154 974,946 1,883 27,731 0 211 0 629-May 26,247 1,001,193 1,773 29,504 0 211 0 630-May 17,383 1,018,576 2,015 31,519 0 211 0 631-May 12,921 1,031,497 3,072 34,591 1 212 0 601-Jun 21,040 1,052,537 9,499 44,090 2 214 0 602-Jun 21,662 1,074,199 8,393 52,483 0 214 0 603-Jun 32,772 1,106,971 8,945 61,428 2 216 0 604-Jun 30,805 1,137,776 5,199 66,627 3 219 0 605-Jun 12,536 1,150,312 9,877 76,504 3 222 0 606-Jun 7,233 1,157,545 6,052 82,556 1 223 0 607-Jun 15,433 1,172,978 7,922 90,478 0 223 0 608-Jun 26,048 1,199,026 6,106 96,584 3 226 0 609-Jun 5,271 1,204,297 7,532 104,116 0 226 0 610-Jun 720 1,205,017 1,523 105,639 0 226 0 611-Jun 7,281 1,212,298 7,175 112,814 3 229 0 612-Jun 14,115 1,226,413 11,890 124,704 1 230 0 613-Jun 19,354 1,245,767 7,371 132,075 1 231 0 614-Jun 6,126 1,251,893 6,095 138,170 0 231 0 615-Jun 340 1,252,233 1,862 140,032 0 231 0 616-Jun 3,702 1,255,935 9,015 149,047 0 231 0 617-Jun 3,062 1,258,997 6,125 155,172 0 231 0 618-Jun 1,061 1,260,058 3,231 158,403 0 231 0 619-Jun 1,122 1,261,180 3,587 161,990 0 231 0 620-Jun 2,421 1,263,601 3,494 165,484 0 231 0 621-Jun 4,053 1,267,654 5,325 170,809 0 231 0 622-Jun 1,789 1,269,443 4,562 175,371 0 231 0 623-Jun 9,641 1,279,084 6,587 181,958 0 231 0 624-Jun 3,341 1,282,425 3,069 185,027 0 231 0 625-Jun 5,544 1,287,969 3,746 188,773 0 231 0 626-Jun 3,191 1,291,160 3,440 192,213 0 231 0 627-Jun 3,355 1,294,515 2,713 194,926 0 231 0 628-Jun 2,673 1,297,188 2,421 197,347 0 231 0 629-Jun 1,209 1,298,397 1,155 198,502 0 231 0 630-Jun 3,546 1,301,943 1,827 200,329 0 231 0 601-Jul 4,521 1,306,464 2,310 202,639 0 231 0 602-Jul 4,440 1,310,904 1,680 204,319 0 231 0 603-Jul 5,057 1,315,961 1,231 205,550 0 231 0 604-Jul 3,505 1,319,466 189 205,739 0 231 0 605-Jul 1,502 1,320,968 22 205,761 0 231 0 606-Jul 1,241 1,322,209 853 206,614 0 231 0 607-Jul 1,023 1,323,232 168 206,782 0 231 0 608-Jul 989 1,324,221 587 207,369 0 231 0 609-Jul 1,277 1,325,498 410 207,779 0 231 0 610-Jul 697 1,326,195 274 208,053 0 231 0 611-Jul 281 1,326,476 67 208,120 0 231 0 6Totals 1,326,476 208,120 231 6
Dolly Varden Rainbow Trout

53
Appendix 4. Bear Lake 2003 - Adult Sockeye Salmon Migration.
Donate & Daily TotalDate Males Females Harvest Morts Total 2003
21-May 2 0 0 0 2 222-May 0 1 0 0 1 323-May 3 3 0 0 6 924-May 1 1 0 0 2 1125-May 0 0 0 0 0 1126-May 3 1 0 0 4 1527-May 17 9 0 0 26 4128-May 1 1 0 0 2 4329-May 4 2 0 0 6 4930-May 3 3 0 0 6 5531-May 4 3 0 0 7 6201-Jun 45 27 0 0 72 13402-Jun 104 33 0 0 137 27103-Jun 165 46 0 0 211 48204-Jun 111 40 0 0 151 63305-Jun 98 34 0 0 132 76506-Jun 110 36 0 0 146 91107-Jun 66 20 0 0 86 99708-Jun 189 63 0 0 252 1,24909-Jun 104 49 0 0 153 1,40210-Jun 92 67 0 1 160 1,56211-Jun 93 47 0 0 140 1,70212-Jun 41 36 0 0 77 1,77913-Jun 61 66 0 0 127 1,90614-Jun 70 54 0 0 124 2,03015-Jun 119 94 0 0 213 2,24316-Jun 149 92 0 0 241 2,48417-Jun 137 83 0 0 220 2,70418-Jun 310 307 0 0 617 3,32119-Jun 575 1,015 0 0 1,590 4,91120-Jun 326 923 0 0 1,249 6,16021-Jun 449 1,538 0 0 1,987 8,14722-Jun 303 819 0 0 1,122 9,26923-Jun 173 419 0 0 592 9,86124-Jun 204 667 7 0 878 10,73925-Jun 98 167 0 0 265 11,00426-Jun 86 14 71 0 171 11,17527-Jun 85 0 409 0 494 11,66928-Jun 116 4 0 0 120 11,78929-Jun 68 5 455 0 528 12,31730-Jun 15 7 0 0 22 12,339
Lake

54
Appendix 4 (continued) Bear Lake 2003 - Adult Sockeye Salmon Migration.
Donate & Daily TotalDate Males Females Harvest Morts Total 2003
01-Jul 114 7 382 0 503 12,84202-Jul 121 26 20 0 167 13,00903-Jul 91 13 477 0 581 13,59004-Jul 110 15 5 0 130 13,72005-Jul 37 5 53 0 95 13,81506-Jul 98 42 192 0 332 14,14707-Jul 51 14 27 0 92 14,23908-Jul 109 48 120 0 277 14,51609-Jul 83 41 100 0 224 14,74010-Jul 83 27 13 0 123 14,86311-Jul 74 34 140 0 248 15,11112-Jul 48 46 23 0 117 15,22813-Jul 54 25 22 0 101 15,32914-Jul 52 50 15 0 117 15,44615-Jul 28 16 8 0 52 15,49816-Jul 43 22 0 0 65 15,56317-Jul 24 17 9 0 50 15,61318-Jul 25 28 10 0 63 15,67619-Jul 27 14 12 0 53 15,72920-Jul 54 21 9 0 84 15,81321-Jul 0 0 14 0 14 15,82722-Jul 0 0 98 0 98 15,92523-Jul 0 0 13 0 13 15,93824-Jul 0 0 12 0 12 15,95025-Jul 0 0 0 0 0 15,95026-Jul 0 0 36 0 36 15,98627-Jul 0 0 0 0 0 15,98628-Jul 0 0 24 0 24 16,01029-Jul 0 0 0 0 0 16,01030-Jul 0 0 0 0 0 16,01031-Jul 0 0 0 0 0 16,010Total 5,926 7,307 2,776 1 16,010 16,010
Lake

55
Appendix 5. Bear Lake 2003 - Adult Coho Salmon Migration.
Raceway Daily CummDate Males Females Males Females Males Females Morts Total Total
25-Jul 0 0 0 026-Jul 0 0 0 027-Jul 0 0 0 028-Jul 0 0 0 029-Jul 0 0 0 030-Jul 0 0 0 031-Jul 0 0 0 0
01-Aug 0 0 0 0 0 002-Aug 0 0 0 0 0 003-Aug 0 0 0 0 0 004-Aug 0 0 0 0 0 005-Aug 0 0 0 0 0 006-Aug 0 0 0 0 0 007-Aug 0 0 0 0 0 008-Aug 0 0 0 0 0 009-Aug 0 0 0 0 0 010-Aug 0 0 0 0 0 011-Aug 0 0 0 0 0 012-Aug 0 0 0 0 0 013-Aug 0 0 0 0 0 014-Aug 0 0 0 0 0 015-Aug 0 0 0 0 0 016-Aug 0 0 0 0 0 017-Aug 0 1 0 1 1 118-Aug 2 0 2 0 2 319-Aug 0 0 0 0 0 320-Aug 3 4 3 4 7 1021-Aug 0 0 0 0 0 1022-Aug 0 0 0 0 0 1023-Aug 0 0 0 0 0 1024-Aug 0 0 0 0 0 1025-Aug 0 0 0 0 0 1026-Aug 1 0 1 0 1 1127-Aug 2 0 2 0 2 1328-Aug 8 5 8 5 13 2629-Aug 6 2 6 2 8 3430-Aug 11 8 11 8 19 5331-Aug 3 1 3 1 4 57
Broodstock TotalLake HarvestNot Sexed

56
Appendix 5 (continued). Bear Lake 2002 - Adult Coho Salmon Migration.
Raceway Daily CummDate Males Females Males Females Males Females Morts Total Total
01-Sep 11 4 11 4 15 7202-Sep 31 16 31 16 47 11903-Sep 17 4 17 4 21 14004-Sep 6 3 6 3 9 14905-Sep 4 3 4 3 7 15606-Sep 6 3 6 3 9 16507-Sep 14 11 14 11 25 19008-Sep 12 14 12 14 26 21609-Sep 11 8 11 8 19 23510-Sep 3 7 4 3 11 14 24911-Sep 0 0 2 0 2 2 25112-Sep 4 26 0 4 26 30 28113-Sep 7 9 34 7 43 50 33114-Sep 3 4 7 3 11 14 34515-Sep 1 2 8 1 10 11 35616-Sep 0 0 15 0 15 15 37117-Sep 1 5 24 1 29 30 40118-Sep 0 3 0 0 3 3 40419-Sep 0 0 0 0 0 0 40420-Sep 0 0 0 0 0 0 40421-Sep 0 0 24 0 24 24 42822-Sep 0 0 63 0 63 63 49123-Sep 0 0 15 35 4 35 19 54 54524-Sep 0 0 0 31 4 31 4 35 58025-Sep 0 0 18 48 7 48 25 73 65326-Sep 0 0 0 80 22 80 22 102 75527-Sep 0 0 3 55 10 55 13 68 82328-Sep 0 0 0 32 10 32 10 42 86529-Sep 0 0 30 44 7 44 37 81 94630-Sep 0 0 0 30 45 30 45 75 1,02101-Oct 0 0 84 7 23 7 107 114 1,13502-Oct 0 0 292 0 45 0 337 337 1,47203-Oct 0 0 65 0 76 0 141 141 1,61304-Oct 0 0 638 0 13 0 651 651 2,26405-Oct 0 0 110 0 39 0 149 149 2,41306-Oct 0 0 0 4 92 4 92 96 2,50907-Oct 0 0 0 0 58 0 58 58 2,56708-Oct 16 20 0 0 0 16 20 36 2,60309-Oct 0 0 0 10 87 10 87 97 2,70010-Oct 0 0 178 0 10 0 188 188 2,88811-Oct 0 0 117 11 25 11 142 153 3,04112-Oct 0 0 24 0 0 0 24 24 3,06513-Oct 0 0 0 13 18 13 18 31 3,09614-Oct 0 0 263 0 0 0 263 263 3,35915-Oct 0 0 0 0 0 0 0 0 3,35916-Oct 0 0 0 2 3 2 3 5 3,36417-Oct 0 0 47 0 0 0 47 47 3,41118-Oct 0 0 0 0 0 0 0 0 3,41119-Oct 0 0 0 0 0 0 0 0 3,41120-Oct 0 0 0 6 6 6 6 12 3,42321-Oct 0 0 0 4 2 4 2 6 3,42922-Oct 0 0 0 6 6 6 6 12 3,44123-Oct 0 0 0 3 4 3 4 7 3,44824-Oct 0 0 0 10 13 10 13 23 3,47125-Oct 0 0 0 0 1 0 1 1 3,47226-Oct 0 0 0 2 2 2 2 4 3,47627-Oct 2 3 0 0 0 2 3 5 3,48128-Oct 30 14 0 (30) (14) 0 0 0 3,48129-Oct 0 0 0 0 0 0 0 0 3,48130-Oct 0 0 0 0 0 0 0 0 3,48131-Oct 0 0 0 0 0 0 0 25 3,506Total 215 180 0 2,065 403 618 618 2,863 0 3,506
Broodstock TotalLake HarvestNot Sexed

57
Appendix 6. Bear Lake 2003 – Sockeye Adult Weir Return Summary
1.1 1.2 1.3 2.1 2.2 2.3 TotalSample Period: 38 May - 20 July 2003
Males (No.) 2,387 2,212 349 116 5,065 Percent 14.9% 13.8% 2.2% 0.7% 32.1% Aged Sample Size 41 38 6 2 87 Total Sample Size 104 Mean Length (mm) 495.0 557.5 526.5 560.0 525.3 Std. Deviation 33.90 34.94 22.77 14.14 43.4 Std. Error 5.29 5.67 2.00 10.00 4.26 Mean Weight (kg) 1.90 2.70 0.34 2.50 2.20 Std. Deviation 0.42 0.51 0.42 0.59 Std. Error 0.066 0.083 0.000 0.297 0.06
Females (No.) 58 4,832 4,192 1,572 291 10,887 Percent 0.4% 30.2% 26.2% 9.8% 1.8% 67.9% Aged Sample Size 1 83 72 27 5 188 Total Sample Size 220 Mean Length (mm) 374 501.5 543.3 505.9 533.4 516.0 Std. Deviation 0 24.59 27.22 19.46 10.71 35.1 Std. Error 0.00 2.70 3.21 3.75 4.79 2.37 Mean Weight (kg) 1 1.90 2.40 1.90 2.20 2.10 Std. Deviation 0 0.54 0.34 0.24 1.80 0.59 Std. Error 0.000 0.059 0.040 0.046 0.805 0.043
Both Sexes (No.) 58 7,219 6,404 1,921 408 16,010 Percent 0.4% 45.1% 40.0% 12.0% 2.5% 100% Total Aged Sample Size 1 124 110 33 7 275 Total Sample Size 324 Mean Length (mm) 374 499.3 548.2 509.4 542 520.7 Std. Deviation 0 28.04 30.71 21.03 16.33 37.4 Std. Error 499.300 2.518 2.928 3.661 6.172 2.258 Mean Weight (kg) 1 1.9 2.5 1.9 2.3 2.10 Std. Deviation 0 0.5 0.43 0.26 0.26 0.52 Std. Error 0.000 0.045 0.041 0.045 0.098 0.031

58
Appendix 7. Bear Lake 2003 – Coho Adult Weir Return Summary
Age1.1 2.1 3.1 Total
Sample Period: 28 August - 21 October 2003
Males (No.) 1,693 416 13 2,122 Percent 48% 12% 0.4% 61% Aged Sample Size 126 31 1 158Total Sample Size 197 Mean Length (mm) 574.0 574.5 599.0 573.3 Std. Error 4.94 9.35 3.75 Mean Weight (kg) 3.1 3.1 3.7 2.9 Std. Error 0.09 0.17 0.12
Females (No.) 954 296 13 1,263 Percent 27% 8% 0.4% 36% Sample Size 71 22 1 94Total Sample Size 115 Mean Length (mm) 595.3 597.8 590.0 591.6 Std. Error 5.25 8.25 3.95 Mean Weight (kg) 3.3 3.3 3.4 3.2 Std. Error 0.09 0.16 0.07
Both Sexes (No.) 2,727 752 27 3,506 Percent 77.8% 21.5% 0.8% 100% Sample Size 203 56 2 261Total Sample Size 320 Mean Length (mm) 581.6 584.3 594.5 580.1 Std. Error 3.7 4.50 4.50 2.77 Mean Weight (kg) 3.2 3.2 3.6 3.2 Std. Error 0.06 0.11 0.16 0.05
59 scales samples were unreadable (38 from males and 21 from females)Total means for males, females and both sexes are generated from the total sample size

59
Appendix 8. Bear Lake 2003 – Project Updates
Sockeye Salmon Project Stocking & Misc. Activities Egg Take
Crew on-site: Dates: 30-Jul to 4-SepIce-out: No. of broodstock used:Crew off-site: Green eggs:Fry stocking: 26-May to 27-May 1,467,000 0.42 g Fecundity:Smolt Stocking 1-May to 4-May 334,000 11.8 g Eyed eggs:Fertilizer application: 26-Jun to 8-Aug % Survival
Smolt Migration Adult MigrationDates: 12-May to 11-Jul Dates: 12-May to 31-JulSockeyes: 1,326,476 Total return: 23,351 Percent age 1: 98.5% Commercial harvest: 7,341 31% Percent age 2: 1.5% Creek return: 16,010 69% Percent age 3: 0.0% C.R. harvest: 2,776 12% Percent hatchery: 92.4% Mortalities: 1 0%Dolly Varden: 231 Lake: 13,233 57%
Hatchery broodstock: 3,735 16% Lake broodstock: 9,498 41%
3/22/2004
2,813
88.0%1050 gal.4,398,000
5,000,0001-Nov26-May1-May
3,735
Bear Lake
0
2,000
4,000
6,000
8,000
10,000
12,000
14,000
16,000
18,000
20,000
24-M
ay
28-M
ay
1-Ju
n
5-Ju
n
9-Ju
n
13-J
un
17-J
un
21-J
un
25-J
un
29-J
un
3-Ju
l
7-Ju
l
11-J
ul
15-J
ul
19-J
ul
23-J
ul
27-J
ul
31-J
ul
Sock
eye
Adu
lts
Avg
2003
Bear Lake
0
200,000
400,000
600,000
800,000
1,000,000
1,200,000
1,400,000
13-M
ay
18-M
ay
23-M
ay
28-M
ay
2-Ju
n
7-Ju
n
12-J
un
17-J
un
22-J
un
27-J
un
2-Ju
l
7-Ju
l
12-J
ul
17-J
ul
22-J
ul
Sock
eye
Smol
ts
Avg
2003

60
Appendix 8 (continued). Bear Lake 2003 – Project Updates
Coho Salmon Project
Stocking & Misc. Activities Egg TakeCrew on-site: Dates: toIce-out: No. of females used:Crew off-site: Green eggs:Fry stocking: 24-Jun to 24-Jun 405,000 1.37 g Fecundity:Smolt stocking: 4-Mar to 16-May 253,000 13.7 g Eyed eggs:Fertilizer application: 26-Jun to 18-Aug % Survival
Smolt Migration Adult MigrationDates: 12-May to 11-Jul Dates: 1-Aug to 14-OctCohos: 208,120 * Coho total creek return: 3,506 Percent age 1: 80.4% Weir return: 3,481 99% Percent age 2: 15.3% C.R. harvest: 2,065 59% Percent age 3: 4.1% Lake: 395 11% Percent hatchery: 86.9% Hatchery broodstock: 1,021 29%Dolly Varden: 231 Est. Remaining in Bear Ck: 25 1%*39.7% of the smolts were from smolt releases, 49.1% were from fry releases Est. Remaining in Salmon Ck: 0 0%
3/22/2004
1-Nov
87.5%
2061,249,572
4,1791,093,892
1050 gal.
26-May1-May
Bear Lake
0
1,000
2,000
3,000
4,000
5,000
6,000
8/1
8/6
8/11
8/16
8/21
8/26
8/31 9/
5
9/10
9/15
9/20
9/25
9/30
10/5
10/1
0
10/1
5
10/2
0
10/2
5
10/3
0
Coh
o A
dults
Avg2003
Bear Lake
0
50,000
100,000
150,000
200,000
250,000
13-M
ay
17-M
ay
21-M
ay
25-M
ay
29-M
ay
2-Ju
n
6-Ju
n
10-J
un
14-J
un
18-J
un
22-J
un
26-J
un
30-J
un
4-Ju
l
8-Ju
l
12-J
ul
16-J
ul
20-J
ul
Coh
o Sm
olt
Avg2003