English Bay Lakes Salmon Enhancement Progress Report 2013 BAY LAKES RPT 2013.pdf · English Bay...
47
English Bay Lakes Salmon Enhancement Progress Report 2013 Prepared by: Caroline Cherry, Hatchery Operations Coordinator January 2015 - Revision This year's operation of the English Bay Lakes Salmon Enhancement Project was made possible through enhancement taxes paid by the commercial fishermen in Area H, Cook Inlet and associated waters, through the harvest and sale of surplus fish and through an Alaska Sustainable Salmon Fund grant received from the Alaska Department of Fish and Game (Project Number 44717).
-
Upload
nguyennhan -
Category
Documents
-
view
214 -
download
0
Transcript of English Bay Lakes Salmon Enhancement Progress Report 2013 BAY LAKES RPT 2013.pdf · English Bay...

English Bay Lakes
Salmon Enhancement
Progress Report
2013
Prepared by:
Caroline Cherry, Hatchery Operations Coordinator
January 2015 - Revision
This year's operation of the English Bay Lakes Salmon Enhancement Project was made
possible through enhancement taxes paid by the commercial fishermen in Area H, Cook
Inlet and associated waters, through the harvest and sale of surplus fish and through an
Alaska Sustainable Salmon Fund grant received from the Alaska Department of Fish and
Game (Project Number 44717).

ii
This page intentionally left blank

iii
DISCLAIMER
The Cook Inlet Aquaculture Association (CIAA) conducts salmon enhancement and restoration
projects in area H, Cook Inlet and associated waters. As an integral part of these projects a
variety of monitoring and evaluation studies are conducted. The following progress report is a
synopsis of the monitoring and evaluation studies conducted for the English Bay Lake salmon
enhancement project.
The purpose of the progress report is to provide a vehicle to distribute the information produced
by the monitoring and evaluation studies. Data collected each year are presented with a
summary of the information previously collected for comparative purposes. These reports are
intended to provide a general description of project activity and are not an exhaustive evaluation
of any restoration or enhancement project. The information presented in this report has not
undergone an extensive review. As reviews are completed, the information may be updated and
presented in later progress reports.
CIAA maintains a strong policy of equal employment opportunity for all employees and
applicants for employment. We hire, train, promote, and compensate employees without regard
for race, color, religion, sex, sexual orientation, national origin, age, marital status, disability or
citizenship, as well as other classifications protected by applicable federal, state or local laws.
Our equal employment opportunity philosophy applies to all aspects of employment with CIAA
including recruiting, hiring, training, transfer, promotion, job benefits, pay, dismissal and
educational assistance.

iv
This page intentionally left blank
v
ACKNOWLEDGEMENTS
The 2013 English Bay Lakes smolt migration, fry release, adult count, and gamete collection was
conducted by the Cook Inlet Aquaculture Association in cooperation with the Nanwalek Village
Council. Appreciation is extended to the full-time and seasonal staff at English Bay Lakes and
Trail Lakes Hatchery. Appreciation is also extended to the Nanwalek Village Council and the
Alaska Department of Fish and Game for their continued support.

vi
This page intentionally left blank

vii
TABLE OF CONTENTS
DISCLAIMER ............................................................................................................................................................. iii
ACKNOWLEDGEMENTS ........................................................................................................................................... v
TABLE OF CONTENTS ........................................................................................................................................... vii
LIST OF FIGURES ......................................................................................................................................................ix
LIST OF TABLES........................................................................................................................................................ix
ABSTRACT .................................................................................................................................................................. 1
INTRODUCTION AND PURPOSE ............................................................................................................................. 3
PROJECT AREA .......................................................................................................................................................... 5
METHODS .................................................................................................................................................................... 9 Environmental Conditions ......................................................................................................................................... 9 Smolt Enumeration .................................................................................................................................................... 9 Smolt Characteristics and Enhanced Contribution .................................................................................................. 11 Adult Escapement .................................................................................................................................................... 14 Gamete Collection, Incubation and Rearing - Sockeye ........................................................................................... 16 Fish Transport and Stocking .................................................................................................................................... 16
RESULTS AND DISCUSSION .................................................................................................................................. 19 Environmental Conditions ....................................................................................................................................... 19 Smolt Enumeration - Sockeye ................................................................................................................................. 19 Adult Escapement - Sockeye ................................................................................................................................... 20
RECOMMENDATIONS ............................................................................................................................................. 25
LITERATURE CITED ................................................................................................................................................ 27
APPENDICES ............................................................................................................................................................. 29

viii
This page intentionally left blank

ix
LIST OF FIGURES
Figure 1. General location of English Bay Lakes System ............................................................................................. 5
Figure 2. Bathymetric overview of Second Lake .......................................................................................................... 6
Figure 3. Bathymetric overview of Third Lake ............................................................................................................ 7
Figure 3. The English Bay Lakes smolt traps. ............................................................................................................ 10
Figure 4. The English Bay Lakes adult weir. .............................................................................................................. 14
LIST OF TABLES
Table 1. Environmental conditions observed at English Bay Lakes, 2013. ................................................................ 19
Table 2. English Bay Lakes sockeye smolt characteristics. ........................................................................................ 20
Table 3. English Bay Lakes adult sockeye characteristics. ......................................................................................... 20
Table 4. English Bay Lake egg collection activities BY 2007 - 2013. ....................................................................... 22
Table 5. English Bay Lakes fry-to-smolt survival ...................................................................................................... 22
Table 6. Marine Survival for English Bay Lakes ....................................................................................................... 23

x
This page intentionally left blank

1
ABSTRACT
The English Bay Lakes (EBL) sockeye salmon (Oncorhynchus nerka) enhancement project has
been operating for over twenty years and has been modified several times. This project consists
of an eggtake from the EBL system, the incubation and rearing of the resultant fry/smolts and
their release back to the EBL system, Port Graham Bay and Tutka Bay Lagoon. Cook Inlet
Aquaculture Association (CIAA) began assisting with the project in 2004, when eggs from the
EBL system were transferred to Trail Lakes Hatchery (TLH) for incubation and rearing. In
2010, the EBL sockeye enhancement project was formally transferred from the Port Graham
Hatchery to Trail Lakes Hatchery. In 2012, CIAA also took over the project to enumerate and
characterize the smolt and adult sockeye migrations. In 2013, CIAA was awarded an Alaska
Sustainable Salmon Fund grant (AKSSF 44717) for the smolt and adult migrations. All hatchery
activities (incubation, rearing, stocking and gamete collections) were funded solely using CIAA
monies.
In 2013, 211,000 sockeye salmon fall fry brood year 2012 (BY12) were released into Second
Lake (EBL system). At the time of release, the sockeye fall fry averaged 2.7 grams. All released
fry were of English Bay Lake origin and were the progeny from non-enhanced (wild) parents as
determined by otolith collection during the 2012 eggtake.
Smolt migration monitoring began on 08 May and continued daily until 05 July. During this
time, a total of 113,905 sockeye smolts were counted through the traps. In addition to the
sockeye salmon smolts, 10,877 coho salmon smolts (Oncorhynchus kisutch), 69,000 pink salmon
fry (Oncorhynchus gorbusha), 1,143 Dolly Varden (Salvelinus malma) and 94 rainbow trout
(Oncorhynchus mykiss) migrated from the lake.
Based on otolith marks (n=557), 41.3% ( 3.9%) of the emigrating sockeye smolts were of
hatchery origin. An estimated 74.3% (± 3.7%) smolts were age 1 and 25.7% (± 3.7%) were age
2. The average length and weight of the age 1 sockeye smolt was 68 mm ( 0.7) and 2.5 g (
1.3) respectively. The age 2 sockeye smolt were 76 mm (± 3.8) and 4.1 g (± 0.6).
2
Adult migration monitoring began on 27 May and continued daily until 26 July. A total of
12,657 adult sockeye returned to English Bay Lakes in 2013. Based on otolith analysis (n=245),
the returning sockeye salmon were age 1.2 (9.0%), age 1.3 (57.6%), age 2.2 (13.9%) and age 2.3
(19.5%).
Between 05 September and 21 September, five separate eggtakes occurred. A total of 2,120,000
sockeye salmon eggs were collected and shipped to TLH where they were fertilized using a
delayed fertilization technique. Approximately 1,904,000 (89.8%) eggs survived to the eyed
stage. Only those eggs determined to be from non-enhanced parents will be reared to the fall fry
stage and released into English Bay Second Lake in October 2014. The remaining eggs will be
for stocking at Tutka Bay Lagoon (smolts) and Lower Cook Inlet lakes as spring fry.

3
INTRODUCTION AND PURPOSE
English Bay Lakes (EBL) is located on Alaska's Kenai Peninsula near the community of
Nanwalek, Alaska. The English Bay Lakes system is a chain of five small lakes with a total
surface area of approximately 200 hectares. The sockeye salmon (Oncorhynchus nerka)
enhancement project has been operating for over twenty years and has been modified several
times. Currently this project consists of an eggtake from the EBL system, the incubation and
rearing of the resulting fry/smolt and their release back to the EBL system, Port Graham Bay and
Tutka Bay Lagoon. Starting in 2012, Cook Inlet Aquaculture Association (CIAA) took over the
operation to enumerate and characterize the smolt and adult migrations. In 2013, CIAA was
awarded an Alaska Sustainable Salmon Fund grant (AKSSF 44717) for funding the smolt and
adult migration components. All hatchery activities (incubation, rearing, stocking and gamete
collection) were funded solely using CIAA monies.

4
This page intentionally left blank

5
PROJECT AREA
English Bay Lakes is located on Alaska's Kenai Peninsula near the community of Nanwalek,
Alaska (Figure 1). It is a system comprised of a chain of five small lakes with a total surface
area of approximately 200 hectares. Second and Third lakes are the two primary salmon
producers.
Figure 1. General location of English Bay Lakes System

6
Second Lake has a surface area of 0.70 x 10⁶ m
2 (150 acres), a mean lake depth of 10.9 m, a
maximum depth of 25.9 m and a total volume of 7.6 x 10⁶ m
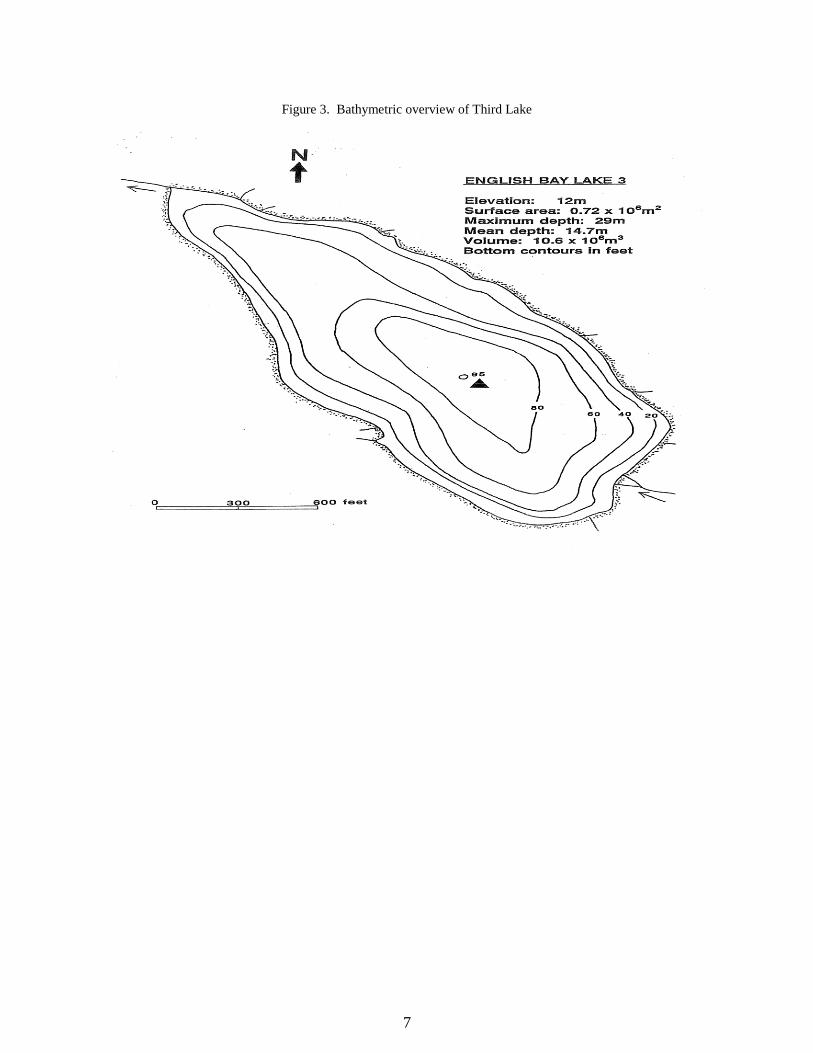
3 (Figure 2). Third Lake, drains into
Second Lake, has a surface area of 0.72 m x 106
m2
(166 acres), a mean lake depth of 14.7 m, a
maximum depth of 29 m, and a total volume of 10.6 x 10⁶ m
3 (Figure 3). The hydraulic
residence time is approximately 15 days for Second Lake and 35 days for Third Lake. Total
annual outflow of Second Lake is more than 20 times greater than its volume and for Third Lake
the outflow is nearly 10 times its volume (Edmundson et al. 1992).
Figure 2. Bathymetric overview of Second Lake
7
Figure 3. Bathymetric overview of Third Lake

8
This page intentionally left blank
9
METHODS
In general, English Bay Lake salmon egg take, hatchery incubation, fry rearing, smolt
enumeration and adult escapement monitoring follow procedures recommended by ADF&G.
Environmental Conditions
Daily observations completed at 5:00 P.M. throughout the summer field season, included percent
cloud cover, precipitation to the nearest millimeter, and stage height. Air and water temperature
were recorded every four hours using a Hobo data logger. All recordings in a 24 hour period
were averaged to provide a daily average air and water temperature.
Smolt Enumeration
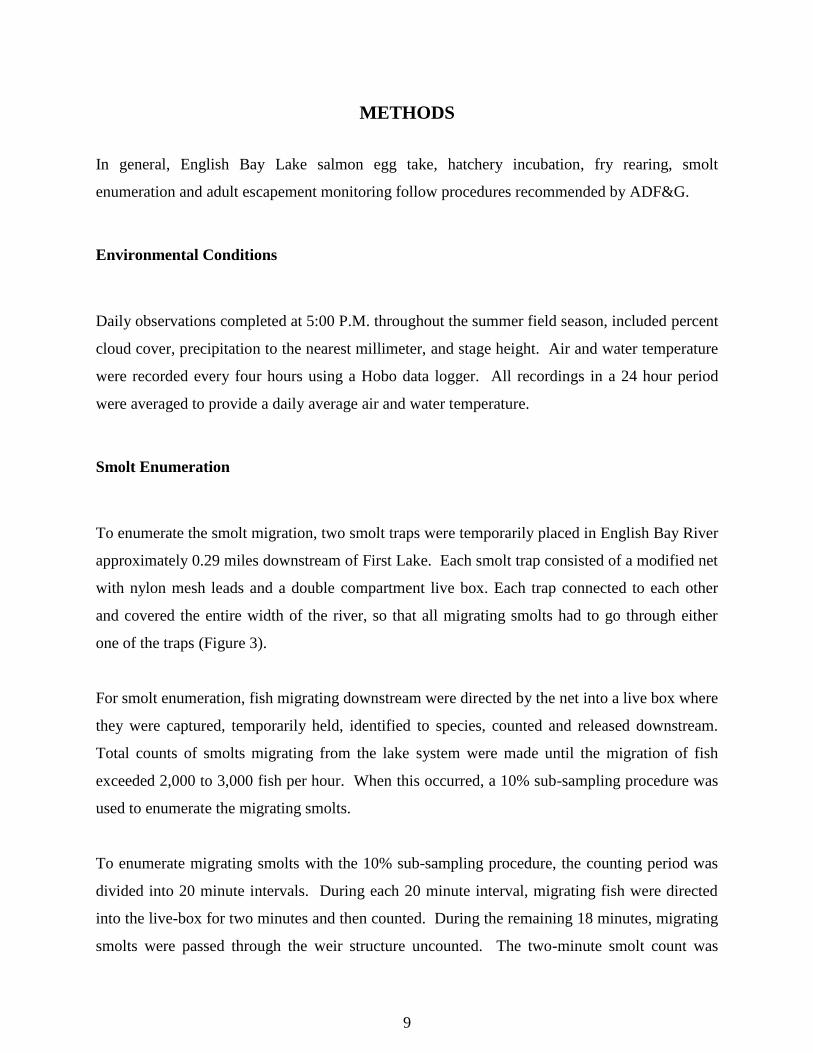
To enumerate the smolt migration, two smolt traps were temporarily placed in English Bay River
approximately 0.29 miles downstream of First Lake. Each smolt trap consisted of a modified net
with nylon mesh leads and a double compartment live box. Each trap connected to each other
and covered the entire width of the river, so that all migrating smolts had to go through either
one of the traps (Figure 3).
For smolt enumeration, fish migrating downstream were directed by the net into a live box where
they were captured, temporarily held, identified to species, counted and released downstream.
Total counts of smolts migrating from the lake system were made until the migration of fish
exceeded 2,000 to 3,000 fish per hour. When this occurred, a 10% sub-sampling procedure was
used to enumerate the migrating smolts.
To enumerate migrating smolts with the 10% sub-sampling procedure, the counting period was
divided into 20 minute intervals. During each 20 minute interval, migrating fish were directed
into the live-box for two minutes and then counted. During the remaining 18 minutes, migrating
smolts were passed through the weir structure uncounted. The two-minute smolt count was

10
multiplied by 10 to estimate the number of smolts migrating during the twenty minute interval.
Figure 3. The English Bay Lakes smolt traps.
Assuming the two minute sub-sampling intervals were randomly distributed throughout sub-
sampling1
and smolt moved through the weir randomly, the total smolt migration was estimated
as follows:
If:
Tc = number of fish counted with the total count procedure,
Ts = number of fish counted with the 10% sub-sampling
procedure,
T = the total smolt migration,
y = the number of fish counted in each two minute sub-
sampling interval,
n = the number of two minute sub-sampling intervals sampled,
1 Predetermined randomly selected 2 minute sub-sampling intervals assured random distribution within each 20 minute period.

11
and
N = the number of possible two minute sub-sampling intervals,
Then:
T T Tc s
and the variance is,
v / /T N N n N y y n ns i 2 2
1
And:
C I. .95% for T v Ts s 2
The variance about the estimated smolt migration, T , is equal to the variance about Ts , because
Tc is a total count with 0 variance.
Smolt Characteristics and Enhanced Contribution
To evaluate the success of the enhancement project, staff collected a sample of sockeye smolts
migrating to determine age, weight, and length characteristics of the population as well as the
number of hatchery and naturally produced smolt. All fish released by CIAA have been
thermally marked2.
In 2013, the smolt collected for measurement, age determination, and otolith removal were
sampled in proportion to the daily smolt migration. This was accomplished by collecting every
200th
sockeye smolt that passed through the smolt trap. The numbering sequence began when
the first fish passed through the trap and continued consecutively until the smolt migration was
complete. Age, weight and length measurements were collected from 575 sockeye smolt (0.5%).
Each smolt collected for evaluation was first measured to the nearest millimeter for fork length3
and weighed to the nearest 0.1 gram. Otoliths were removed and placed in a labeled one dram
vial filled with a 10% ethanol solution. At the CIAA office, each otolith was checked for a
2 The otolith mark is a hatchery induced thermal band produced by controlled temperature changes during incubation.
3 Standard fork length was measured from the tip of the snout to the fork of the tail.
12
hatchery mark following procedures described by Glick and Shields (1993). Otoliths were also
used for aging.
Sockeye smolt characteristics, the proportion of enhanced sockeye smolt and the proportion of
age 1 and 2 sockeye smolt in the migrating population, were estimated with the following
notations and formulas provided by ADF&G.
If:
N total number of migrating smolts,
Nh number of smolts in stratum h, N Nh ,
n total number of smolts sampled,
nh number of smolts sampled in stratum h, n nh ,
a total number of enhanced smolts sampled,
ah number of enhanced smolts sampled in stratum h, a ah ,
p a nh h h / , The proportion of enhanced smolts in stratum h,
q ph h 1 , The proportion of wild smolts in stratum h,
ci number of age i smolts sampled,
chi number of age i smolts sampled in stratum h, c ci hi ,
l c nhi hi hi / , The proportion of age i smolts in stratum h,
m lhi hi 1 , The proportion of other than age i smolts in stratum h,
f n N / , The sampling fraction (assumed equal in all strata),
W N Nh h / , The stratum weight, and,
y the weight or length of the smolt.
Then the proportion of enhanced smolts, P , was estimated as:
/P a n ; with a variance of v P f n W p qh h h / 1 1 ;
which, under proportional allocation, is like the usual simple random sample estimate.
The total number of enhanced smolts, A , was also estimated as:
/ A N a n NP ;

13
with a variance of:
PvNqpWnfNAv hhhˆ/11ˆ 22 .
Since samples sizes were fairly large and P was not extreme, the normal approximation,
without a correction for continuity, could be used to develop the relative error. Thus, the
95% confidence interval estimate for P and A is:
. P v P196 and AvA ˆ96.1ˆ ;
and, the relative error is:
R E v P P. . . 196 100 and R E v A A. . . 196 100 .
The proportion of age i smolt in the smolt migration was also estimated as:
L cni
i ; with a variance of v L fn
W l mi h hi hih( ) ( ) 1
1;
and, the total number of age i smolts was estimated as:
( )C N Li i ; with a variance of v C N v Li i( ) ( ) 2 .
Confidence interval (95%) estimates for age-class proportion and abundance, assuming 2
age-classes, are:
. ( )L v Li i 2 24 and . ( )C v Ci i 2 24 .
Mean weight or length of age i smolt was also estimated as:
yy
ci
hijjh
i
;
with an approximate variance estimate of:
v yC
N f
n ny y c y yi
i
h
h h
hij hi hic
n hi ijh
hi
h( )
( )
( )( ) ( )( )
1 1
11
2
22 2 .
The confidence interval (95%) estimate for the mean weight and length is:
y v yi i196. ( ) .

14
Adult Escapement
To enumerate and collect adult sockeye salmon returning to the English Bay Lakes, a counting
weir was temporarily installed. The weir was constructed of 1.9 cm galvanized pipe and 7.6 cm
aluminum channel spaced 2.54 cm apart (Figure 4).
Figure 4. The English Bay Lakes adult weir.
Field personnel visually identified by species and counted the adult fish as they ascended English
Bay River. By removing one or two pickets, fish were permitted to pass through the weir.
Initially counts were made at least twice a day. As the number of adult fish passing through the
weir increased, counts were made more frequently.

15
In addition to the enumeration of the adult sockeye salmon escapement, the sex, age and standard
fork length of the returning population was also assessed by collecting a sample in proportion to
the daily migration. This was accomplished by collecting every 50th
adult sockeye that passed
through the weir. The numbering sequence began when the first fish passed through the weir
and continued consecutively until the adult migration was complete. The sex of each adult
sockeye salmon was visually determined and the standard fork length measured to the nearest
millimeter. For age and hatchery contribution, field personnel removed the otoliths and placed
them into labeled one dram vials filled with 10% ethanol solution. Each otolith was checked for
a hatchery mark and aged following procedures described by Glick and Shields (1993). All adult
sockeye salmon sacrificed for otolith collection were donated to the Nanwalek Village.
The proportion of enhanced adult sockeye were estimated using the following notations and
formulae.
If:
N = total number of migrating adults,
n = total number of migrating adults sampled,
a = total number of enhanced migrating adults,
p = the proportion of enhanced migrating adults.
Then the proportion of enhanced adults, P , was estimated as:
/P a n ; with a variance of 1/)/1)(/(ˆ nnanaPv
The total number of enhanced adults, A , was also estimated as:
/ A N a n NP ; with a variance of: 2ˆˆ NPvAv .
Thus the 95% confidence interval estimate for
AvA ˆ96.1ˆ

16
A total of 253 otoliths were collected of which 247 could be read.
Gamete Collection, Incubation and Rearing - Sockeye
Five eggtakes in total were completed. The first eggtake was directed to the back-stocking
program at Second Lake while the remaining four eggtakes were for other stocking programs in
the Lower Cook Inlet.
Male and female adult sockeye salmon from the spawning areas were killed and stripped of their
gametes. For the first eggtake in which resulting progeny would be used for back-stocking
Second Lake (non-enhanced fish), each contributing parent was numbered and the mating
crosses recorded. The gametes were shipped to TLH for fertilization, incubation and rearing. In
addition to removing the gametes, staff also collected the otoliths from both the male and female
parents.
At TLH, each mating cross was recorded and the fertilized eggs were placed into heath stacks
until they reach the eyed stage. Otoliths were ground, polished and read. Any hatchery crossed
pairings were removed from the EBL back-stocking program at the eyed stage and placed into
production for stocking at Tutka Bay Lagoon (smolt) or Lower Cook Inlet lakes as spring fry.
Only those crossings in which both parents were determined to be wild (non-enhanced), were
kept for back-stocking into Second Lake as fall fry.
All other eggtakes followed the same procedures except mating crosses were not tracked (bulk
incubation) and otoliths were not collected.
Fish Transport and Stocking
Approximately, 139,000 eggs from BY12 were excess to the back-stocking program or were
from enhanced fish and designated for the Tutka smolt program. For stocking, all fry were
transported by truck from TLH to Trail Lakes in oxygenated transport tanks where they were
17
transferred to oxygenated tanks located in a fixed wing aircraft. Fry were flown to Second Lake
where they were released. Smolts will be released at Tutka Bay Lagoon in the spring of 2014.

18
This page intentionally left blank

19
RESULTS AND DISCUSSION
Environmental Conditions
The environmental conditions recorded in 2013 are presented in Appendix 1. Between 08 May
and 26 July, the average air temperature was 9.9oC (± 3.5
oC) while water temperature averaged
10.4oC (± 3.5
oC) (Table 1). Average stage height was 1.71 ft (± 0.66 ft).
Table 1. Environmental conditions observed at English Bay Lakes, 2013.
Smolt Enumeration - Sockeye
Enumeration of Bear Lake sockeye smolt occurred between 10 May and 05 July. A total of
113,905 sockeye smolt migrated from English Bay Lakes in 2013 (Appendix 2). The 10% sub-
sampling procedure was not used. In addition to the sockeye salmon smolt, 10,877 coho salmon
smolts (Oncorhynchus kisutch), 69,000 pink salmon fry (Oncorhynchus gorbusha), 1,143 Dolly
Varden (Salvelinus malma) and 94 rainbow trout (Oncorhynchus mykiss) migrated from the lake.
A total of 575 sockeye smolt otoliths were collected of which 557 were readable. Otolith samples
were collected from every 200th
sockeye smolt that went through the trap (0.5%). Of the
migrating smolts, 74.3% (± 3.7%) were age 1 and 25.7% (± 3.7%) were age 2. The age 1 smolts
averaged 68 mm ( 0.7 mm) in length and 2.5 g ( 1.3 g) in weight. The age 2 smolts averaged
76 mm (± 3.8 mm) in length and 4.1 g (± 0.55 g) in weight (Table 2). Based on the presence of
hatchery induced thermal marks in the otoliths of 557 smolt, it was estimated that 41.3% (
3.9%) of the sockeye smolt were of hatchery origin (Table 2).
No. of Days
<50% >50% Days Temperature (C)
Total Cloud Cloud 100% Meas. Precip Air
Year Days Clear Cover Cover Overcast Rain Precip (mm) Avg Range Avg Range
2012 57 17 17 9 10 4 21 152 10.4 (3-20) 7.6 (2-12)
2013 79 32 9 11 18 8 22 90 9.9 (2-20) 10.4 (5-16)
Water
Rain days are counted as days with measurable precipitation and 100% overcast is measured as those days indicated as 100% overcast with or
without measurable precipation.

20
Table 2. English Bay Lakes sockeye smolt characteristics.
Adult Escapement - Sockeye
Adult sockeye salmon began arriving at the weir on 27 May 2013 and continued to migrate until
26 July 2013 (Appendix 3). During this time, 12,657 adults were captured and counted at the
weir (Table 3). Otolith samples were collected from every 50th
fish that passed through the weir
(2%). A total of 253 otolith samples were collected of which 244 could be read. The returning
major age groups for adult sockeye included ages 1.2 (9.0%), 1.3 (57.6%), 2.2 (13.9%), 2.3 and
2.3 (19.5%).
A summary of mean age and length, by age class, for adult sockeye salmon escapement to
English Bay Lakes for 2013 is presented in Appendix 4.
Table 3. English Bay Lakes adult sockeye characteristics.
Based on the presence of thermal marks, it was estimated that 7.0% (± 4.3%) of the adults were
of hatchery origin. Furthermore, of the 889 fish which were determined to be of enhanced
origin, brood year contribution was determined to be as follows: BY07 = 17.7%; BY08 = 0.0%
and BY09 = 82.4%. Of the 11,768 fish which were determined to come from natural production,
Age Composition Average Length (mm)
% No.
Year Number 95%CI Hatch. 95%CI Wild 0.0 95% CI 1.0 95% CI 2.0 95% CI 3.0 95% CI 0.0 1.0 CI 2.0 CI 0.0 1.0 CI 2.0 CI
2012* 113,400 0 19.2 4.4 91,600 98,200 3,900 15,200 3,900 66 1.0 68 1.1 2.4 0.3 2.8 0.3
2013 113,900 0 41.3 3.9 66,900 84,700 4,200 29,200 4,184 68 0.7 76 3.8 2.5 1.3 4.1 0.6
Avg. 113,700 0 30.3 4.2 79,300 91,450 4,100 22,200 4,000 67 0.9 72 2.5 2.4 0.8 3.4 0.5
Total 227,300 0.0 182,900 44,400 0.0
Average Length rounded to nearest mm, Average Weight rouinded to nearset 0.1 g. All other figures have been rounded to nearest 100 fish.
*Care should be taken in interpreting results in 2012 as the sampling was not proportional to the daily migrations.
Average Weight (g)
Weir Sockeye Salmon
Retun Age Composition
Year Total 0.2 1.1 0.3 1.2 0.4 1.3 2.1 2.2 2.3 3.2 3.3
2012 3,700 0 0 0 1,017 0 1,526 0 145 1,017 0 0
2013 12,700 0 0 0 1,137 0 7,284 0 1,756 2,480 0 0
Avg 8,200 0 0 0 1,077 0 4,405 0 951 1,749 0 0
% of Avg 100% 0.0% 0.0% 0.0% 13.1% 0.0% 53.7% 0.00% 11.6% 21.3% 0.00% 0.0%

21
the brood year contribution was determined to be as follows: BY07 = 19.6%; BY08 = 76.4%
and BY09 = 4.0%.
Hatchery Activities
Stocking
In 2013, 211,000 sockeye fall fry (BY12; 2,4H) were released into English Bay Lake. These fish
will migrate in 2014/2015 as smolts. At the time of release, the sockeye fry averaged 2.7 g.
Eggtake
On 05 September, 2013, a total of 509,000 sockeye salmon eggs were collected. A total of 384
broodfish were used providing an average fecundity of 2,653 eggs/female. A total of 192 females
and 192 males were crossed at 1:1 ratio. All 384 broodfish were sampled for otoliths. Of the 384
otoliths, 1 fish (0.3%) was determined to have a thermal mark (enhanced fish) while the
remaining 383 (99.7%) did not. Once the eggs reached the eyed stage, those crosses which were
a) identified with a thermal mark, b) could not be read and c) age determination indicated that
they were jacks, were removed from the English Bay Lakes back-stocking group and moved into
general production (with the exception of the jacks which were culled) for stocking at either
Tutka Bay Lagoon (smolts) or Lower Cook Inlet lakes (spring fry).
Sockeye eggs were also collected on four other occasions for Tutka Bay Lagoon and Lower
Cook Inlet lakes stocking programs. An additional 1,611,000 eggs were collected. Including the
broodfish used for back-stocking a total of 1,753 adult salmon were used (includes broodstock,
mortalities and inviable). Overall average fecundity was 2,500 eggs/female. Overall survival to
the eyed stage was 89.8%.
Table 4 provides an overview of egg collection activities for enhancement at English Bay Lakes
since brood year 2007.

22
Table 4. English Bay Lake egg collection activities BY 2007 - 2013.
Fry-to-Smolt Survival
Migrating smolts in 2013 were stocked either as fry in 2011 (BY10 - Age 2) and 2012 (BY11 -
Age 1). Based on age classification from otoliths, the fry-to-smolt survival for each brood year of
fry stocking can be determined. Total smolt migration count (count plus fish sampled for otolith
and mortalities) was used to determine fry-to-smolt survival. While the fry stocked from BY09
are no longer part of the smolt migration, insufficient data in previous years (pre-2012) makes
the data set incomplete. Currently, BY10 is estimated at a 15.2% fry-to-smolt survival while
BY11 is at 16.4%. Both brood years are incomplete with additional smolts from these year
classes expected to migrate in 2014/2015. This information is summarized in Table 5.
Table 5. English Bay Lakes fry-to-smolt survival
Sockeye
Brood Brood Green Eyed
Year Stock Eggs Eggs %
2007 372 510,000 409,000 80.2
2008
2009 240 307,000 288,000 93.8
2010 1,023 1,113,000 1,013,000 91.0
2011 2,100 2,504,876 2,204,262 88.0
2012 412 432,022 383,597 88.8
2013 1,661 2,120,000 1,904,000 89.81
Total 6,986,898 6,201,859
Ave 973,380 859,572 88.4
Brood No. Fry Size No. Hatch. % Hatch.
Year Escap. Stocked (g) Smolt Smolt Survival
2007 ND 246,000 2.83
2008 ND 0
2009a ND 202,000 3.4 15,196 2,918 1.44%
2010 * ND 203,300 2.86 127,477 30,944 15.22%
2011 * ND 213,000 2.78 84,400 34,857 16.36%
2012 * 3,293 211,000 2.66
2013 * 10,904
Ave1 3,293 179,217 2.91 75,691 22,906 11.0%
a Age 1 smolts cannot be determined due to insufficient data. This year class
is incomplete
* indicates incomplete brood year.
Sockeye

23
Marine Survival
Based on information collected from migrating sockeye smolt and returning sockeye adults (total
return), it is possible to provide an estimate of the survival of hatchery fish in the marine
environment. BY09 is at 2.1% smolt-to-adult survival but this data set is incomplete due to
insufficient data for smolt migration. This information is summarize below in Table 6.
Table 6. Marine Survival for English Bay Lakes
BY
Marine Survivial
(%)
2009 ND
2010 0.0
2011 0.0
2012 0.0
AVE 0.0
Red and italics are incomplete.

24
This page is intentionally left blank

25
RECOMMENDATIONS
Monitoring of smolt and adult migration should continue thereby providing sufficient data to
determine the performance of both enhanced and naturally produced fish in the English Bay
Lakes system.
Based on the last two years of data (2012 - 2013), the size of the sockeye smolt at migration is
equal to or less than the size at stocking. This would seem to indicate that food source is a
limiting factor in salmon production or fish are not feeding during the winter months. Therefore,
it is important to ensure that the fall fry stocking into Second Lake are of the highest quality to
ensure their survival over the winter period.

26
This page is intentionally left blank

27
LITERATURE CITED
CIAA (2013). English Bay Lakes Adult Enumeration Procedures Manual.
CIAA (2013). English Bay Lakes Smolt Enumeration Procedures Manual.
Edmundson, J.A., Kyle, G.B. and Balland, T. (1992). Rearing Capacity, Escapement Level, and
Potential for Sockeye Salmon (Oncorhynchus nerka) Enhancement in English Bay Lakes.
Alaska Department of Fish and Game, Division of Fisheries Rehabilitation, Enhancement
and Development Number 120.
Glick, W., and Shields, P (1993). Juvenile Salmonid Otolith Extraction and Preparation
Techniques for Microscopic Examination. Soldotna: Alaska Department of Fish and
Game, Division of Commercial Fisheries Management and Development.

28
This page is intentionally left blank
29
APPENDICES

30
This page is intentionally left blank

31
Appendix 1. English Bay Lakes 2013 - Environmental Conditions
Date Sky
Precip.
(mm)
Upper
Gauge (ft)
Water
Temp (oC)
Air Temp
(oC) Date Sky
Precip.
(mm)
Upper
Gauge (ft)
Water
Temp (oC)
Air Temp
(oC)
1-May 1-Jun 5 0.00 2.30 9.2 9.3
2-May 2-Jun 33 2.50 2.00 9.1 8.7
3-May 3-Jun 5 0.25 2.00 9 8.7
4-May 4-Jun 5 1.00 1.90 8.9 7.8
5-May 5-Jun 3 11.00 1.80 8.8 8.3
6-May 6-Jun 1 2.00 1.70 9.1 8.1
7-May 7-Jun 3 0.00 1.70 9.5 11
8-May 5.6 6.4 8-Jun 1 0.00 1.70 10.2 13.5
9-May 4 4.7 4 9-Jun 2 0.25 1.70 10.4 12.6
10-May 4 0.00 1.40 4.8 4.7 10-Jun 1 0.00 1.80 10.6 13
11-May 4 0.00 1.40 4.9 5.8 11-Jun 1 0.00 1.80 11 12.4
12-May 3 0.00 1.40 5.1 6.2 12-Jun 1 0.00 1.80 11.5 10.8
13-May 3 0.00 1.40 5 5.7 13-Jun 1 0.00 1.70 11.8 10.6
14-May 1 0.00 1.40 5 4.9 14-Jun 1 0.00 1.60 12.3 13.2
15-May 4 0.00 1.40 5 4.8 15-Jun 1 0.00 1.50 12.7 9.4
16-May 5 0.00 1.40 4.9 4.2 16-Jun 4 0.00 1.50 12.8 10.4
17-May 3 6.00 1.60 5.3 4.1 17-Jun 1 0.00 1.40 13.3 14.3
18-May 2 3.00 1.60 5.2 1.9 18-Jun 4 0.00 1.40 14.2 20.2
19-May 1 0.00 1.40 5.6 2.6 19-Jun 4 1.75 1.40 13.8 11.5
20-May 4 0.00 1.20 5.5 3.3 20-Jun 4 0.00 1.30 13.7 11.7
21-May 3 0.00 1.10 5.8 6.7 21-Jun 5 1.50 1.30 13.3 10.2
22-May 4 0.00 1.10 6.3 8.1 22-Jun 4 0.25 1.20 12.8 10.7
23-May 3 0.00 1.10 7.4 8 23-Jun 4 0.00 1.20 12.7 10.5
24-May 1 0.25 1.30 6.9 7.4 24-Jun 2 3.50 1.10 13 11.1
25-May 1 0.00 1.50 7.5 7.6 25-Jun 4 0.00 1.00 13.3 12.4
26-May 3 0.00 1.80 7.7 7.2 26-Jun 5 0.00 1.00 13.6 13.6
27-May 2 0.00 1.90 7.6 7.7 27-Jun 2 0.75 1.00 14.1 12.3
28-May 1 0.50 2.00 8.1 8.8 28-Jun 4 0.00 1.00 14.3 14.9
29-May 1 0.00 2.20 8.7 11.5 29-Jun 4 0.00 1.00 14.5 13.2
30-May 2 0.00 2.30 9.2 8.9 30-Jun 2 0.00 1.00 14.4 12.1
31-May 4 0.00 2.40 9.2 8.7
Sky Conditions
1 = clear
2 = less than 50% cloud cover
3 = more than 50% cloud cover
4 = 100% overcast
5 = rain

32
Appendix 1 (continued). English Bay Lakes 2013 - Environmental Conditions
Date Sky
Precip.
(mm)
Upper
Gauge (ft)
Water
Temp (oC)
Air Temp
(oC)
1-Jul 5 37.00 1.50 13.7 10.5
2-Jul 3 1.25 1.80 13.6 10.8
3-Jul 2 0.00 2.00 13.5 11.5
4-Jul 4 1.25 2.10 13.1 11
5-Jul 3 0.50 2.30 12.9 10.7
6-Jul 4 4.50 2.50 12.8 11.7
7-Jul 5 10.00 2.80 12.6 10.2
8-Jul 3 1.25 3.00 12.6 10.6
9-Jul 2 0.00 3.10 13.1 11.4
10-Jul 1 0.00 3.20 13.3 13.3
11-Jul 1 0.00 3.30 13.8 13.5
12-Jul 1 0.00 3.30 14.3 13.8
13-Jul 1 0.00 3.20 15.1 13.1
14-Jul 1 0.00 3.10 15.2 13.6
15-Jul 1 0.00 2.80 15.6 15.2
16-Jul 1 0.00 2.60 16.2 14.9
17-Jul 1 0.00 2.10
18-Jul 1 0.00 1.90
19-Jul 1 0.00 1.60
20-Jul 1 0.00 1.10
21-Jul 1 0.00 0.90
22-Jul 1 0.00 0.90
23-Jul 1 0.00 0.80
24-Jul 1 0.00 0.80
25-Jul 1 0.00 0.70
26-Jul 1 0.00 0.70
27-Jul
28-Jul
29-Jul
30-Jul
31-Jul
Sky Conditions
1 = clear
2 = less than 50% cloud cover
3 = more than 50% cloud cover
4 = 100% overcast
5 = rain

33
Appendix 2. English Bay Lakes 2013 - Smolt Migration
Date Daily Otoliths Cumm % Smpl Daily Cumm Daily Cumm Daily Cumm
01-May 0 0
02-May 0 0
03-May 0 0
04-May 0 0
05-May 0 0
06-May 0 0
07-May 0 0
08-May 0 0
09-May 0 0
10-May 25 25 0.00% 21 21 37 37 1 1
11-May 74 99 0.00% 30 51 49 86 9 10
12-May 68 167 0.00% 41 92 46 132 0 10
13-May 134 1 301 0.75% 61 153 64 196 5 15
14-May 194 1 495 0.52% 88 241 246 442 3 18
15-May 169 1 664 0.59% 82 323 94 536 6 24
16-May 143 1 807 0.70% 60 383 58 594 1 25
17-May 372 1 1,179 0.27% 161 544 120 714 8 33
18-May 270 1 1,449 0.37% 122 666 5 719 2 35
19-May 307 1 1,756 0.33% 94 760 11 730 0 35
20-May 301 2 2,057 0.66% 85 845 0 730 0 35
21-May 384 3 2,441 0.78% 117 962 0 730 0 35
22-May 482 2 2,923 0.41% 128 1,090 5 735 0 35
23-May 684 2 3,607 0.29% 93 1,183 28 763 0 35
24-May 923 1 4,530 0.11% 156 1,339 6 769 0 35
25-May 2,195 7 6,725 0.32% 331 1,670 39 808 1 36
26-May 3,188 12 9,913 0.38% 388 2,058 64 872 0 36
27-May 3,670 19 13,583 0.52% 255 2,313 120 992 0 36
28-May 4,980 24 18,563 0.48% 365 2,678 46 1,038 1 37
29-May 6,594 48 25,157 0.73% 461 3,139 27 1,065 0 37
30-May 7,612 36 32,769 0.47% 464 3,603 22 1,087 0 37
31-May 9,205 30 41,974 0.33% 512 4,115 39 1,126 1 38
01-Jun 7,992 28 49,966 0.35% 437 4,552 1 1,127 2 40
02-Jun 7,423 17 57,389 0.23% 429 4,981 10 1,137 0 40
03-Jun 3,258 47 60,647 1.44% 352 5,333 0 1,137 0 40
04-Jun 2,977 32 63,624 1.07% 416 5,749 5 1,142 0 40
05-Jun 2,664 6 66,288 0.23% 380 6,129 0 1,142 1 41
06-Jun 3,406 25 69,694 0.73% 403 6,532 0 1,142 0 41
07-Jun 2,435 12 72,129 0.49% 320 6,852 0 1,142 0 41
08-Jun 3,573 22 75,702 0.62% 395 7,247 0 1,142 0 41
09-Jun 4,911 24 80,613 0.49% 382 7,629 0 1,142 0 41
10-Jun 3,834 20 84,447 0.52% 368 7,997 0 1,142 0 4111-Jun 2,355 12 86,802 0.51% 347 8,344 0 1,142 0 41
12-Jun 2,651 13 89,453 0.49% 292 8,636 0 1,142 0 41
13-Jun 2,745 13 92,198 0.47% 180 8,816 0 1,142 0 41
14-Jun 2,609 13 94,807 0.50% 196 9,012 1 1,143 1 42
15-Jun 1,783 9 96,590 0.50% 215 9,227 0 1,143 0 42
16-Jun 2,038 10 98,628 0.49% 186 9,413 0 1,143 0 42
17-Jun 1,309 10 99,937 0.76% 141 9,554 0 1,143 0 42
18-Jun 1,163 6 101,100 0.52% 116 9,670 0 1,143 0 42
19-Jun 1,107 6 102,207 0.54% 90 9,760 0 1,143 0 42
20-Jun 1,450 7 103,657 0.48% 141 9,901 0 1,143 0 42
21-Jun 965 5 104,622 0.52% 122 10,023 0 1,143 0 42
22-Jun 1,105 5 105,727 0.45% 96 10,119 0 1,143 0 42
23-Jun 818 4 106,545 0.49% 76 10,195 0 1,143 0 42
24-Jun 798 4 107,343 0.50% 92 10,287 0 1,143 14 56
25-Jun 703 4 108,046 0.57% 81 10,368 0 1,143 0 56
26-Jun 580 2 108,626 0.34% 58 10,426 0 1,143 0 56
27-Jun 528 2 109,154 0.38% 49 10,475 0 1,143 0 56
28-Jun 559 3 109,713 0.54% 77 10,552 0 1,143 0 56
29-Jun 620 3 110,333 0.48% 44 10,596 0 1,143 0 56
30-Jun 467 2 110,800 0.43% 40 10,636 0 1,143 0 56
01-Jul 516 2 111,316 0.39% 44 10,680 0 1,143 0 56
02-Jul 818 4 112,134 0.49% 57 10,737 0 1,143 15 71
03-Jul 653 4 112,787 0.61% 48 10,785 0 1,143 0 71
04-Jul 616 3 113,403 0.49% 43 10,828 0 1,143 0 71
05-Jul 502 3 113,905 0.60% 49 10,877 0 1,143 0 71
Totals 113,905 575 113,905 0.50% 10,877 10,877 1,143 1,143 71 71
Dolly VardenSockeye Coho Rainbow Trout

34
Appendix 3. English Bay Lakes 2013 - Adult Sockeye Salmon Migration.
Lake Escapement Daily Cumm.
Date Sockeye Otoliths % sampled Total Total
21-May 0 0
22-May 0 0
23-May 0 0
24-May 0 0
25-May 0 0
26-May 0 0
27-May 7 0.00% 7 7
28-May 0 0 7
29-May 7 0.00% 7 14
30-May 24 0.00% 24 38
31-May 9 0.00% 9 47
01-Jun 0 0 47
02-Jun 0 0 47
03-Jun 0 0 47
04-Jun 0 1 0 47
05-Jun 0 0 47
06-Jun 0 0 47
07-Jun 0 0 47
08-Jun 0 0 47
09-Jun 0 0 47
10-Jun 9 0.00% 9 56
11-Jun 76 1 1.32% 76 132
12-Jun 213 5 2.35% 213 345
13-Jun 296 6 2.03% 296 641
14-Jun 70 1 1.43% 70 711
15-Jun 242 5 2.07% 242 953
16-Jun 340 7 2.06% 340 1,293
17-Jun 198 3 1.52% 198 1,491
18-Jun 206 4 1.94% 206 1,697
19-Jun 205 5 2.44% 205 1,902
20-Jun 65 1 1.54% 65 1,967
21-Jun 16 0.00% 16 1,983
22-Jun 32 1 3.13% 32 2,015
23-Jun 50 1 2.00% 50 2,065
24-Jun 0 0 2,065
25-Jun 36 1 2.78% 36 2,101
26-Jun 755 15 1.99% 755 2,856
27-Jun 1212 24 1.98% 1,212 4,068
28-Jun 1518 30 1.98% 1,518 5,586
29-Jun 812 17 2.09% 812 6,398
30-Jun 762 15 1.97% 762 7,16001-Jul 632 12 1.90% 632 7,792
02-Jul 926 19 2.05% 926 8,718
03-Jul 223 4 1.79% 223 8,941
04-Jul 215 5 2.33% 215 9,156
05-Jul 204 4 1.96% 204 9,360
06-Jul 213 5 2.35% 213 9,573
07-Jul 204 4 1.96% 204 9,777
08-Jul 203 4 1.97% 203 9,980
09-Jul 104 2 1.92% 104 10,084
10-Jul 120 2 1.67% 120 10,204
11-Jul 258 5 1.94% 258 10,462
12-Jul 474 11 2.32% 474 10,936
13-Jul 210 4 1.90% 210 11,146
14-Jul 263 5 1.90% 263 11,409
15-Jul 265 4 1.51% 265 11,674
16-Jul 403 8 1.99% 403 12,077
17-Jul 153 3 1.96% 153 12,230
18-Jul 229 4 1.75% 229 12,459
19-Jul 39 39 12,498
20-Jul 56 3 5.36% 56 12,554
21-Jul 36 36 12,590
22-Jul 23 1 4.35% 23 12,613
23-Jul 16 0.00% 16 12,629
24-Jul 13 0.00% 13 12,642
25-Jul 9 0.00% 9 12,651
26-Jul 6 1 16.67% 6 12,657
27-Jul 0 12,657
28-Jul 0 12,657
29-Jul 0 12,657
30-Jul 0 12,657
31-Jul 0 12,657
Total 12,657 253 2.00% 12,657 12,657

35
Appendix 4. English Bay Lakes 2013 – Adult Sockeye Age and Sex Characteristics
1.1 1.2 1.3 2.1 2.2 2.3 Total
Sample Period: May 27 - July 26
Males (No.) 0 413 3,978 0 517 1,085 5,993
Percent 0.0% 6.9% 66.4% 0.0% 8.6% 18.1% 47.3%
Sample Size 0 8 77 0 10 21 116
Total Sample Size 122
Mean Length (mm) 534 569 560 572 566
Std. Deviation 43.2 27.4 39.3 34.5 32.7
Std. Error 15.3 3.1 12.4 7.5 3.0
Mean Weight (kg) 2.33 2.86 2.72 2.98 2.83
Std. Deviation 0.60 0.40 0.57 0.49 0.47
Std. Error 0.21 0.05 0.18 0.11 0.04
Females (No.) 0 620 3,255 0 1,240 1,395 6,509
Percent 0.0% 9.5% 50.0% 0.0% 19.0% 21.4% 51.4%
Sample Size 0 12 63 0 24 27 126
Total Sample Size 128
Mean Length (mm) 503 546 520 542 536
Std. Deviation 39.5 27.1 29.6 17.2 30.3
Std. Error 11.4 3.4 6.0 3.3 2.7
Mean Weight (kg) 1.88 2.36 2.08 2.40 2.27
Std. Deviation 0.41 0.28 0.35 0.23 0.34
Std. Error 0.12 0.04 0.07 0.04 0.03
Both Sexes (No.) 0 1,137 7,284 0 1,756 2,480 12,657
Percent 0.0% 9.0% 57.6% 0.0% 13.9% 19.6% 100.0%
Sample Size 0 22 141 0 34 48 245
Total Sample Size 250
Mean Length (mm) 515 559 532 555 551
Std. Deviation 42.8 29.6 37.0 30.0 34.9
Std. Error 9.1 2.5 6.4 4.3 2.2
Mean Weight (kg) 2.04 2.63 2.27 2.66 2.54
Std. Deviation 0.52 0.43 0.51 0.47 0.50
Std. Error 0.11 0.04 0.09 0.07 0.03
Total means for males, females and both sexes are generated from the total sample size
Age

36
Appendix 5. English Bay Lakes 2013 – Sockeye Smolt Hourly Counts
Sum of SockeyeTime
Date 12 AM 1 AM 2 AM 3 AM 4 AM 5 AM 6 AM 7 AM 8 AM 9 AM 10 AM 11 AM 12 PM 1 PM 2 PM 3 PM 4 PM 5 PM 6 PM 7 PM 8 PM 9 PM 10 PM 11 PM Grand Total
5/10/2013 0 3 4 2 3 5 0 0 0 1 0 1 0 2 1 0 0 1 1 0 0 0 0 1 25
5/11/2013 12 24 5 6 3 5 1 0 0 2 1 2 1 1 0 1 2 0 1 0 1 0 1 5 74
5/12/2013 8 13 14 3 2 1 4 2 1 1 1 1 0 0 4 1 2 0 2 0 0 0 3 5 68
5/13/2013 5 16 36 12 13 8 8 3 0 1 3 0 2 1 5 2 4 0 2 6 0 1 2 4 134
5/14/2013 7 40 30 17 15 10 8 2 4 3 1 3 1 2 8 7 7 3 6 1 2 3 4 10 194
5/15/2013 14 31 37 14 10 3 3 3 2 2 3 1 2 1 0 6 6 3 6 4 5 4 4 5 169
5/16/2013 10 17 39 25 8 1 1 1 0 2 0 2 2 1 4 3 5 3 2 2 1 3 5 6 143
5/17/2013 40 52 61 48 21 10 2 4 2 5 1 4 3 5 15 7 10 13 20 4 9 10 12 14 372
5/18/2013 15 26 39 54 41 11 1 2 5 4 11 3 3 4 6 4 4 3 7 7 5 8 3 4 270
5/19/2013 66 48 35 40 11 11 2 1 1 1 5 3 5 13 2 5 4 3 2 2 0 4 19 24 307
5/20/2013 33 80 41 7 11 14 2 15 2 3 2 1 1 3 2 4 3 5 9 6 6 4 15 32 301
5/21/2013 61 72 42 18 17 31 3 5 2 3 5 4 5 2 2 7 8 6 5 12 46 28 384
5/22/2013 61 140 73 41 24 10 5 15 2 2 3 1 2 8 11 26 5 3 1 1 3 4 7 34 482
5/23/2013 158 217 142 55 10 2 2 21 3 2 1 2 3 2 7 5 9 4 8 4 6 5 8 8 684
5/24/2013 223 170 96 83 92 15 5 15 4 1 4 9 5 2 11 20 8 9 10 11 65 23 13 29 923
5/25/2013 595 357 93 20 45 27 38 27 33 16 47 102 105 155 64 75 47 28 42 87 192 2,195
5/26/2013 334 521 129 85 40 66 101 115 68 32 79 74 87 50 270 280 124 102 61 105 104 153 62 146 3,188
5/27/2013 378 279 152 90 141 51 101 210 224 112 110 115 41 42 38 158 359 229 138 150 120 75 140 217 3,670
5/28/2013 141 593 196 214 69 142 42 153 115 205 350 140 130 347 396 462 188 289 177 87 94 137 148 165 4,980
5/29/2013 198 389 265 160 248 158 94 304 258 75 68 105 136 674 1,226 409 316 233 213 217 230 302 157 159 6,594
5/30/2013 353 331 209 221 216 333 418 758 877 498 287 473 676 325 298 208 171 147 278 117 82 94 60 182 7,612
5/31/2013 395 929 521 808 713 346 371 310 818 832 558 437 288 237 201 110 105 98 43 113 185 178 609 9,205
6/1/2013 198 503 526 508 373 211 1,093 807 745 456 423 221 103 89 137 137 87 108 131 107 140 311 388 190 7,992
6/2/2013 235 315 566 481 150 224 19 894 775 654 591 387 382 317 247 191 208 117 98 133 93 85 104 157 7,423
6/3/2013 195 297 212 121 198 216 374 214 112 181 154 112 106 85 80 71 74 73 69 58 52 53 55 96 3,258
6/4/2013 191 376 325 253 288 92 54 74 68 65 76 72 179 128 64 61 91 55 76 145 142 102 2,977
6/5/2013 223 141 210 123 121 111 96 104 89 147 160 99 85 101 101 103 76 81 104 92 91 54 42 110 2,664
6/6/2013 236 295 129 156 130 124 150 121 83 77 94 98 95 110 78 258 289 272 152 143 92 51 33 140 3,406
6/7/2013 153 322 138 215 214 145 196 54 36 24 35 62 55 71 75 64 69 117 129 69 30 29 63 70 2,435
6/8/2013 221 260 189 282 235 218 83 126 114 117 137 83 71 93 98 54 101 122 139 59 122 220 194 235 3,573
6/9/2013 241 259 190 210 201 88 139 159 126 109 123 164 217 162 337 270 285 271 358 237 156 221 189 199 4,911
6/10/2013 97 223 413 229 110 67 82 191 207 199 111 112 101 121 201 211 217 187 180 144 106 131 101 93 3,834
6/11/2013 137 161 202 263 179 136 94 60 63 51 74 41 77 93 96 63 67 88 106 51 46 44 60 103 2,355
6/12/2013 164 216 260 204 248 168 115 96 91 74 62 58 68 49 59 69 76 71 61 77 60 67 87 151 2,651
6/13/2013 203 289 554 90 82 105 90 81 83 80 84 45 55 50 52 48 50 51 53 91 105 85 122 197 2,745
6/14/2013 123 119 198 125 154 74 117 110 128 101 137 80 86 96 88 98 91 94 106 84 70 93 139 98 2,609
6/15/2013 146 220 120 92 62 90 44 40 43 46 43 42 45 69 71 63 64 65 93 91 72 61 101 1,783
6/16/2013 107 146 133 125 163 155 47 40 42 44 41 52 49 56 61 57 62 80 63 54 96 120 111 134 2,038
6/17/2013 91 107 84 56 41 60 80 44 40 47 53 42 46 41 48 51 42 49 42 30 39 53 50 73 1,309
6/18/2013 40 80 61 30 29 38 43 47 68 62 96 64 41 45 51 81 39 25 45 80 50 48 1,163
6/19/2013 66 61 75 56 75 48 28 39 43 41 38 40 44 41 54 49 32 46 42 34 36 29 38 52 1,107
6/20/2013 61 69 95 90 61 57 42 50 66 49 76 55 49 70 67 58 72 44 64 53 49 47 50 56 1,450
6/21/2013 67 33 38 15 18 21 51 31 36 41 59 67 55 51 48 42 47 43 39 25 31 36 41 30 965
6/22/2013 80 71 58 63 41 37 17 21 23 34 54 51 50 41 47 39 37 41 43 45 35 44 65 68 1,105
6/23/2013 42 30 21 19 18 49 19 21 34 42 57 51 47 50 49 43 39 43 47 46 51 818
6/24/2013 41 47 58 42 15 10 17 19 23 31 36 42 42 41 39 40 36 35 39 37 37 32 39 798
6/25/2013 32 30 43 51 47 45 25 17 16 19 21 27 33 35 38 41 32 27 29 8 10 21 29 27 703
6/26/2013 36 19 27 25 15 29 36 16 21 33 24 21 19 22 27 31 21 23 26 21 23 16 22 27 580
6/27/2013 17 19 20 27 24 17 27 16 15 19 24 21 18 16 17 29 33 23 25 15 26 20 31 29 528
6/28/2013 22 19 21 23 30 33 15 15 17 22 16 24 23 27 31 33 26 28 22 23 27 35 15 12 559
6/29/2013 31 19 45 31 27 24 19 24 27 32 21 19 25 31 28 31 26 23 25 19 20 23 26 24 620
6/30/2013 21 16 19 7 11 13 23 17 19 15 13 16 14 18 18 21 23 24 23 27 31 34 19 25 467
7/1/2013 14 18 40 45 43 57 12 14 17 18 13 16 22 19 18 18 23 20 15 12 14 21 16 11 516
7/2/2013 67 61 70 55 40 4 0 12 19 26 19 20 24 26 29 30 31 33 34 35 37 45 50 51 818
7/3/2013 35 51 40 23 24 29 23 25 28 29 24 27 30 31 28 26 23 22 17 20 33 23 17 25 653
7/4/2013 15 18 22 21 19 28 27 29 31 33 29 31 37 29 27 30 41 32 27 29 19 13 12 17 616
7/5/2013 19 22 31 19 25 17 19 21 17 23 27 29 35 33 31 27 22 13 13 11 10 11 13 14 502
Grand Total 6,774 9,280 7,399 6,129 5,299 4,038 4,528 5,625 5,742 4,856 4,511 3,837 3,685 4,130 5,078 4,404 4,040 3,625 3,615 2,830 2,858 3,462 3,527 4,633 113,905
37
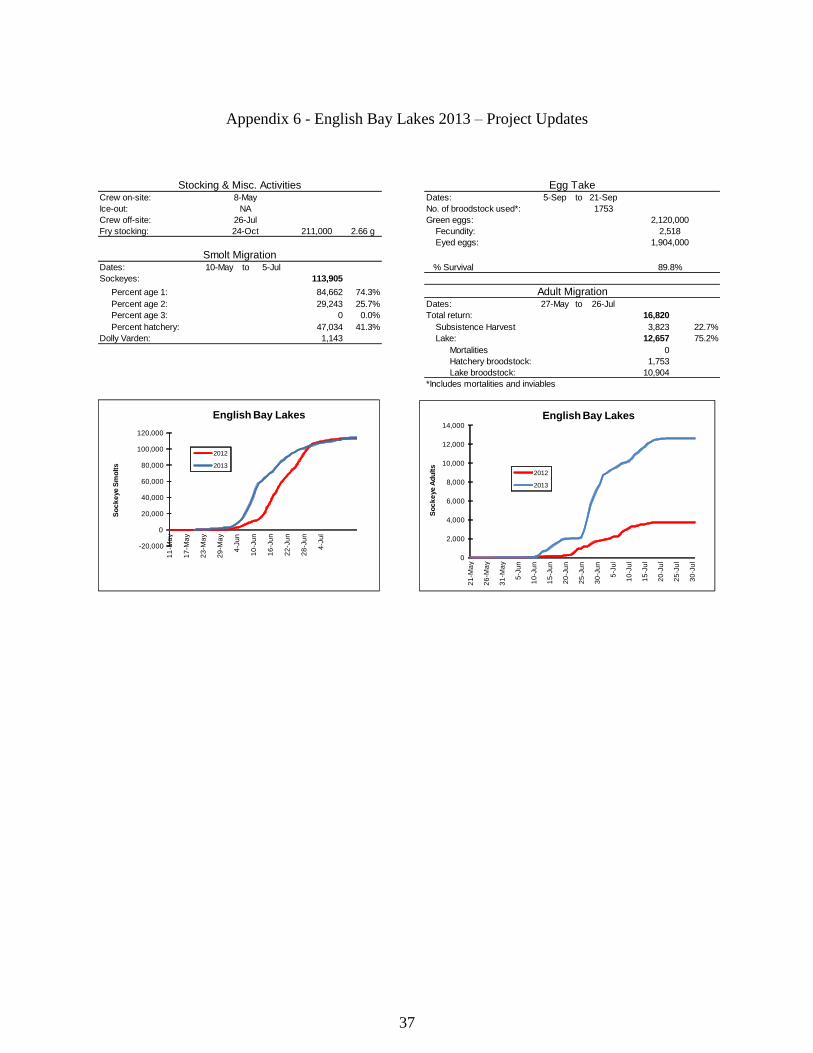
Appendix 6 - English Bay Lakes 2013 – Project Updates
Stocking & Misc. Activities Egg TakeCrew on-site: Dates: 5-Sep to 21-Sep
Ice-out: No. of broodstock used*: 1753
Crew off-site: Green eggs: 2,120,000
Fry stocking: 211,000 2.66 g Fecundity: 2,518
Eyed eggs: 1,904,000
Smolt MigrationDates: 10-May to 5-Jul % Survival
Sockeyes: 113,905
Percent age 1: 84,662 74.3% Adult Migration Percent age 2: 29,243 25.7% Dates: 27-May to 26-Jul
Percent age 3: 0 0.0% Total return: 16,820
Percent hatchery: 47,034 41.3% Subsistence Harvest 3,823 22.7%
Dolly Varden: 1,143 Lake: 12,657 75.2%
Mortalities 0
Hatchery broodstock: 1,753
Lake broodstock: 10,904
*Includes mortalities and inviables
89.8%
24-Oct
8-May
NA
26-Jul
0
2,000
4,000
6,000
8,000
10,000
12,000
14,000
21
-Ma
y
26
-Ma
y
31
-Ma
y
5-J
un
10
-Ju
n
15
-Ju
n
20
-Ju
n
25
-Ju
n
30
-Ju
n
5-J
ul
10
-Ju
l
15
-Ju
l
20
-Ju
l
25
-Ju
l
30
-Ju
l
So
ck
eye
Ad
ult
s
English Bay Lakes
2012
2013
-20,000
0
20,000
40,000
60,000
80,000
100,000
120,000
11
-Ma
y
17
-Ma
y
23
-Ma
y
29
-Ma
y
4-J
un
10
-Ju
n
16
-Ju
n
22
-Ju
n
28
-Ju
n
4-J
ul
So
ck
eye
Sm
olt
s
English Bay Lakes
2012
2013