Beam deflection measurement of bound- electronic and ...€¦ · Beam deflection measurement of...
14
Beam deflection measurement of bound- electronic and rotational nonlinear refraction in molecular gases Matthew Reichert, 1,3,5 Peng Zhao, 1,5 Jennifer M. Reed, 1,4 Trenton R. Ensley, 1 David J. Hagan, 1,2 and Eric W. Van Stryland 1,2,* 1 CREOL, College of Optics and Photonics, University of Central Florida, Orlando, Florida 32816, USA 2 Department of Physics, University of Central Florida, Orlando, Florida 32816, USA 3 Current address: Department of Electrical Engineering, Princeton University, Princeton, New Jersey 08455, USA 4 Current address: Air Force Research Laboratory/RXAP, Wright-Patterson Air Force Base, Ohio 45433, USA 5 These authors contributed equally to this work. *[email protected] Abstract: A polarization-resolved beam deflection technique is used to separate the bound-electronic and molecular rotational components of nonlinear refractive transients of molecular gases. Coherent rotational revivals from N 2 , O 2 , and two isotopologues of carbon disulfide (CS 2 ), are identified in gaseous mixtures. Dephasing rates, rotational and centrifugal distortion constants of each species are measured. Polarization at the magic angle allows unambiguous measurement of the bound-electronic nonlinear refractive index of air and second hyperpolarizability of CS 2 . Agreement between gas and liquid phase second hyperpolarizability measurements is found using the Lorentz-Lorenz local field correction. ©2015 Optical Society of America OCIS codes: (190.7110) Ultrafast nonlinear optics; (190.3270) Kerr effect; (190.5650) Raman effect; (350.3250) Isotope separation; (300.6240) Spectroscopy, coherent transient. References and links 1. R. A. Bartels, T. C. Weinacht, N. Wagner, M. Baertschy, C. H. Greene, M. M. Murnane, and H. C. Kapteyn, “Phase modulation of ultrashort light pulses using molecular rotational wave packets,” Phys. Rev. Lett. 88(1), 013903 (2001). 2. X. Zhou, R. Lock, W. Li, N. Wagner, M. M. Murnane, and H. C. Kapteyn, “Molecular recollision interferometry in high harmonic generation,” Phys. Rev. Lett. 100(7), 073902 (2008). 3. K. F. Lee, D. M. Villeneuve, P. B. Corkum, and E. A. Shapiro, “Phase control of rotational wave packets and quantum information,” Phys. Rev. Lett. 93(23), 233601 (2004). 4. O. Korech, U. Steinitz, R. J. Gordon, I. S. Averbukh, and Y. Prior, “Observing molecular spinning via the rotational Doppler effect,” Nat. Photonics 7(9), 711–714 (2013). 5. S. Varma, Y.-H. Chen, J. Palastro, A. Fallahkair, E. Rosenthal, T. Antonsen, and H. Milchberg, “Molecular quantum wake-induced pulse shaping and extension of femtosecond air filaments,” Phys. Rev. A 86(2), 023850 (2012). 6. C. Marceau, S. Ramakrishna, S. Génier, T.-J. Wang, Y. Chen, F. Théberge, M. Châteauneuf, J. Dubois, T. Seideman, and S. L. Chin, “Femtosecond filament induced birefringence in argon and in air: Ultrafast refractive index change,” Opt. Commun. 283(13), 2732–2736 (2010). 7. F. Calegari, C. Vozzi, and S. Stagira, “Optical propagation in molecular gases undergoing filamentation-assisted field-free alignment,” Phys. Rev. A 79(2), 023827 (2009). 8. S. Zahedpour, J. K. Wahlstrand, and H. M. Milchberg, “Quantum control of molecular gas hydrodynamics,” Phys. Rev. Lett. 112(14), 143601 (2014). 9. J. Floss, T. Grohmann, M. Leibscher, and T. Seideman, “Nuclear spin selective laser control of rotational and torsional dynamics,” J. Chem. Phys. 136(8), 084309 (2012). 10. C. H. Lin, J. P. Heritage, T. K. Gustafson, R. Y. Chiao, and J. P. McTague, “Birefringence arising from the reorientation of the polarizability anisotropy of molecules in collisionless gases,” Phys. Rev. A 13(2), 813–829 (1976). 11. U. Steinitz, Y. Prior, and I. Sh. Averbukh, “Optics of a gas of coherently spinning molecules,” Phys. Rev. Lett. 112(1), 013004 (2014). 12. G. Karras, E. Hertz, F. Billard, B. Lavorel, J. M. Hartmann, O. Faucher, E. Gershnabel, Y. Prior, and I. Sh. Averbukh, “Orientation and alignment echoes,” Phys. Rev. Lett. 114(15), 153601 (2015). #242671 Received 16 Jun 2015; revised 4 Aug 2015; accepted 6 Aug 2015; published 14 Aug 2015 (C) 2015 OSA 24 Aug 2015 | Vol. 23, No. 17 | DOI:10.1364/OE.23.022224 | OPTICS EXPRESS 22224
Transcript of Beam deflection measurement of bound- electronic and ...€¦ · Beam deflection measurement of...
Beam deflection measurement of bound-electronic and rotational nonlinear refraction in
molecular gases
Matthew Reichert,1,3,5 Peng Zhao,1,5 Jennifer M. Reed,1,4 Trenton R. Ensley,1 David J. Hagan,1,2 and Eric W. Van Stryland1,2,*
1CREOL, College of Optics and Photonics, University of Central Florida, Orlando, Florida 32816, USA 2Department of Physics, University of Central Florida, Orlando, Florida 32816, USA
3Current address: Department of Electrical Engineering, Princeton University, Princeton, New Jersey 08455, USA 4Current address: Air Force Research Laboratory/RXAP, Wright-Patterson Air Force Base, Ohio 45433, USA
5These authors contributed equally to this work. *[email protected]
Abstract: A polarization-resolved beam deflection technique is used to separate the bound-electronic and molecular rotational components of nonlinear refractive transients of molecular gases. Coherent rotational revivals from N2, O2, and two isotopologues of carbon disulfide (CS2), are identified in gaseous mixtures. Dephasing rates, rotational and centrifugal distortion constants of each species are measured. Polarization at the magic angle allows unambiguous measurement of the bound-electronic nonlinear refractive index of air and second hyperpolarizability of CS2. Agreement between gas and liquid phase second hyperpolarizability measurements is found using the Lorentz-Lorenz local field correction.
©2015 Optical Society of America
OCIS codes: (190.7110) Ultrafast nonlinear optics; (190.3270) Kerr effect; (190.5650) Raman effect; (350.3250) Isotope separation; (300.6240) Spectroscopy, coherent transient.
References and links
1. R. A. Bartels, T. C. Weinacht, N. Wagner, M. Baertschy, C. H. Greene, M. M. Murnane, and H. C. Kapteyn, “Phase modulation of ultrashort light pulses using molecular rotational wave packets,” Phys. Rev. Lett. 88(1), 013903 (2001).
2. X. Zhou, R. Lock, W. Li, N. Wagner, M. M. Murnane, and H. C. Kapteyn, “Molecular recollision interferometry in high harmonic generation,” Phys. Rev. Lett. 100(7), 073902 (2008).
3. K. F. Lee, D. M. Villeneuve, P. B. Corkum, and E. A. Shapiro, “Phase control of rotational wave packets and quantum information,” Phys. Rev. Lett. 93(23), 233601 (2004).
4. O. Korech, U. Steinitz, R. J. Gordon, I. S. Averbukh, and Y. Prior, “Observing molecular spinning via the rotational Doppler effect,” Nat. Photonics 7(9), 711–714 (2013).
5. S. Varma, Y.-H. Chen, J. Palastro, A. Fallahkair, E. Rosenthal, T. Antonsen, and H. Milchberg, “Molecular quantum wake-induced pulse shaping and extension of femtosecond air filaments,” Phys. Rev. A 86(2), 023850 (2012).
6. C. Marceau, S. Ramakrishna, S. Génier, T.-J. Wang, Y. Chen, F. Théberge, M. Châteauneuf, J. Dubois, T. Seideman, and S. L. Chin, “Femtosecond filament induced birefringence in argon and in air: Ultrafast refractive index change,” Opt. Commun. 283(13), 2732–2736 (2010).
7. F. Calegari, C. Vozzi, and S. Stagira, “Optical propagation in molecular gases undergoing filamentation-assisted field-free alignment,” Phys. Rev. A 79(2), 023827 (2009).
8. S. Zahedpour, J. K. Wahlstrand, and H. M. Milchberg, “Quantum control of molecular gas hydrodynamics,” Phys. Rev. Lett. 112(14), 143601 (2014).
9. J. Floss, T. Grohmann, M. Leibscher, and T. Seideman, “Nuclear spin selective laser control of rotational and torsional dynamics,” J. Chem. Phys. 136(8), 084309 (2012).
10. C. H. Lin, J. P. Heritage, T. K. Gustafson, R. Y. Chiao, and J. P. McTague, “Birefringence arising from the reorientation of the polarizability anisotropy of molecules in collisionless gases,” Phys. Rev. A 13(2), 813–829 (1976).
11. U. Steinitz, Y. Prior, and I. Sh. Averbukh, “Optics of a gas of coherently spinning molecules,” Phys. Rev. Lett. 112(1), 013004 (2014).
12. G. Karras, E. Hertz, F. Billard, B. Lavorel, J. M. Hartmann, O. Faucher, E. Gershnabel, Y. Prior, and I. Sh. Averbukh, “Orientation and alignment echoes,” Phys. Rev. Lett. 114(15), 153601 (2015).
#242671 Received 16 Jun 2015; revised 4 Aug 2015; accepted 6 Aug 2015; published 14 Aug 2015 (C) 2015 OSA 24 Aug 2015 | Vol. 23, No. 17 | DOI:10.1364/OE.23.022224 | OPTICS EXPRESS 22224

13. D. McMorrow, W. T. Lotshaw, and G. A. Kenney-Wallace, “Femtosecond optical Kerr studies on the origin of the nonlinear responses in simple liquids,” IEEE J. Quantum Electron. 24(2), 443–454 (1988).
14. J. P. Heritage, T. K. Gustafson, and C. H. Lin, “Observation of coherent transient birefringence in CS2 vapor,” Phys. Rev. Lett. 34(21), 1299–1302 (1975).
15. R. K. Raj, D. Bloch, J. J. Snyder, G. Camy, and M. Ducloy, “High-frequency optically heterodyned saturation spectroscopy via resonant degenerate four-wave mixing,” Phys. Rev. Lett. 44(19), 1251–1254 (1980).
16. D. S. Kummli, H. M. Frey, and S. Leutwyler, “Femtosecond degenerate four-wave mixing of carbon disulfide: High-accuracy rotational constants,” J. Chem Phys. 124(14), 144307 (2006).
17. N. A. Smith and S. R. Meech, “Optically-heterodyne-detected optical Kerr effect (OHD-OKE): Applications in condensed phase dynamics,” Int. Rev. Phys. Chem. 21(1), 75–100 (2002).
18. Y. H. Chen, S. Varma, A. York, and H. M. Milchberg, “Single-shot, space- and time-resolved measurement of rotational wavepacket revivals in H2, D2, N2, O2, and N2O,” Opt. Express 15(18), 11341–11357 (2007).
19. Y. Sato, R. Morita, and M. Yamashita, “Study on ultrafast dynamic behaviors of different nonlinear refractive index components in CS2 using a femtosecond interferometer,” Jpn. J. Appl. Phys. 36(Part 1, No. 4A), 2109–2115 (1997).
20. H. Stapelfeldt, E. Constant, H. Sakai, and P. B. Corkum, “Time-resolved Coulomb explosion imaging: A method to measure structure and dynamics of molecular nuclear wave packets,” Phys. Rev. A 58(1), 426–433 (1998).
21. A. Hishikawa and K. Yamanouchi, “Coulomb Explosion Imaging of Molecular Dynamics in Intense Laser Fields,” in Progress in Ultrafast Intense Laser Science II, S. L. Chin, P. Agostini, and G. Ferrante, eds. (Springer, 2007).
22. M. R. Ferdinandus, H. Hu, M. Reichert, D. J. Hagan, and E. W. Van Stryland, “Beam deflection measurement of time and polarization resolved ultrafast nonlinear refraction,” Opt. Lett. 38(18), 3518–3521 (2013).
23. M. Reichert, H. Hu, M. R. Ferdinandus, M. Seidel, P. Zhao, T. R. Ensley, D. Peceli, J. M. Reed, D. A. Fishman, S. Webster, D. J. Hagan, and E. W. Van Stryland, “Temporal, spectral, and polarization dependence of the nonlinear optical response of carbon disulfide,” Optica 1(6), 436–445 (2014).
24. M. Terazima, “Ultrafast transient Kerr lens in solution detected by the dual-beam thermal-lens method,” Opt. Lett. 20(1), 25–27 (1995).
25. A. Willetts, J. E. Rice, D. M. Burland, and D. P. Shelton, “Problems in the comparison of theoretical and experimental hyperpolarizabilities,” J. Chem. Phys. 97(10), 7590–7599 (1992).
26. D. P. Shelton and J. E. Rice, “Measurements and calculations of the hyperpolarizabilities of atoms and small molecules in the gas phase,” Chem. Rev. 94(1), 3–29 (1994).
27. J. A. Armstrong, N. Bloembergen, J. Ducuing, and P. S. Pershan, “Interactions between light waves in a nonlinear dielectric,” Phys. Rev. 127(6), 1918–1939 (1962).
28. R. W. Boyd, Nonlinear Optics (Academic, 2008). 29. G. I. Stegeman and R. A. Stegeman, Nonlinear Optics: Phenomena, Materials and Devices (John Wiley & Sons,
Inc., 2012). 30. C. H. Lin, J. P. Heritage, and T. K. Gustafson, “Susceptibility echoes in linear molecular gases,” Appl. Phys.
Lett. 19(10), 397–400 (1971). 31. L. C. Hoskins, “Pure rotational Raman spectroscopy of diatomic molecules,” J. Chem. Educ. 52(9), 568 (1975). 32. J. K. Wahlstrand, J. H. Odhner, E. T. McCole, Y. H. Cheng, J. P. Palastro, R. J. Levis, and H. M. Milchberg,
“Effect of two-beam coupling in strong-field optical pump-probe experiments,” Phys. Rev. A 87(5), 053801 (2013).
33. E. W. Van Stryland, A. L. Smirl, T. F. Boggess, M. J. Soileau, B. S. Wherrett, and F. A. Hopf, “Weak-Wave Retardation and Phase-Conjugate Self-Defousing in Si,” in Picosecond Phenomena III, K. B. Eisenthal, R. M. Hochstrasser, W. Kaiser, and A. Laubereau, eds. (Springer, 1982).
34. K. Ohta, T. Sakaguchi, K. Kamada, and T. Fukumi, “Ab initio molecular orbital calculation of the second hyperpolarizability of the carbon disulfide molecule: electron correlation and frequency dispersion,” Chem. Phys. Lett. 274(1–3), 306–314 (1997).
35. N. J. Bridge and A. D. Buckingham, “The polarization of laser light scattered by gases,” Proc. R. Soc. Lond. A Math. Phys. Sci. 295(1442), 334–349 (1966).
36. M. P. Bogaard, A. D. Buckingham, R. K. Pierens, and A. H. White, “Rayleigh scattering depolarization ratio and molecular polarizability anisotropy for gases,” J. Chem. Soc., Faraday Trans. 74(0), 3008–3015 (1978).
37. P. E. Ciddor, “Refractive index of air: new equations for the visible and near infrared,” Appl. Opt. 35(9), 1566–1573 (1996).
38. J. Ni, W. Chu, H. Zhang, B. Zeng, J. Yao, L. Qiao, G. Li, C. Jing, H. Xie, H. Xu, Y. Cheng, and Z. Xu, “Impulsive rotational Raman scattering of N2 by a remote “air laser” in femtosecond laser filament,” Opt. Lett. 39(8), 2250–2253 (2014).
39. J. K. Wahlstrand, Y. H. Cheng, Y. H. Chen, and H. M. Milchberg, “Optical nonlinearity in Ar and N2 near the ionization threshold,” Phys. Rev. Lett. 107(10), 103901 (2011).
40. D. R. William, “Earth Fact Sheet,” (NASA, 2013), http://nssdc.gsfc.nasa.gov/planetary/factsheet/earthfact.html, Accessed May 25, 2015.
41. A. Weber, “High-resolution rotational raman spectra of gases,” in Raman Spectroscopy of Gases and Liquids, A. Weber, ed. (Springer, 1979).
42. L. A. Rahn and R. E. Palmer, “Studies of nitrogen self-broadening at high temperature with inverse Raman spectroscopy,” J. Opt. Soc. Am. B 3(9), 1164–1169 (1986).
#242671 Received 16 Jun 2015; revised 4 Aug 2015; accepted 6 Aug 2015; published 14 Aug 2015 (C) 2015 OSA 24 Aug 2015 | Vol. 23, No. 17 | DOI:10.1364/OE.23.022224 | OPTICS EXPRESS 22225
43. D. S. Kummli, H. M. Frey, and S. Leutwyler, “Femtosecond degenerate four-wave mixing of carbon disulfide: high-accuracy rotational constants,” J. Chem. Phys. 124(14), 144307 (2006).
44. L. Martinsson, P. E. Bengtsson, M. Aldén, S. Kröll, and J. Bonamy, “A test of different rotational Raman linewidth models: Accuracy of rotational coherent anti‐Stokes Raman scattering thermometry in nitrogen from 295 to 1850 K,” J. Chem. Phys. 99(4), 2466–2477 (1993).
45. A. A. Milner, A. Korobenko, and V. Milner, “Coherent spin–rotational dynamics of oxygen superrotors,” New J. Phys. 16(9), 093038 (2014).
46. A. A. Milner, A. Korobenko, J. W. Hepburn, and V. Milner, “Effects of ultrafast molecular rotation on collisional decoherence,” Phys. Rev. Lett. 113(4), 043005 (2014).
47. A. M. Zheltikov, “Raman response function of atmospheric air,” Opt. Lett. 32(14), 2052–2054 (2007). 48. J. K. Wahlstrand, Y. H. Cheng, and H. M. Milchberg, “Absolute measurement of the transient optical
nonlinearity in N2, O2, N2O, and Ar,” Phys. Rev. A 85(4), 043820 (2012). 49. W. Liu and S. Chin, “Direct measurement of the critical power of femtosecond Ti:sapphire laser pulse in air,”
Opt. Express 13(15), 5750–5755 (2005). 50. G. Herzberg, “l-type doubling in linear polyatomic molecules,” Rev. Mod. Phys. 14(2–3), 219–223 (1942). 51. D. Agar, E. K. Plyler, and E. D. Tidwell, “High resolution investigation of some infrared bands of carbon
disulfide,” J. Res. Natl. Inst. Stan. A 66A(3), 259–268 (1962). 52. A. Samoc, “Dispersion of refractive properties of solvents: Chloroform, toluene, benzene, and carbon disulfide
in ultraviolet, visible, and near-infrared,” J. Appl. Phys. 94(9), 6167–6174 (2003). 53. S. Kedenburg, M. Vieweg, T. Gissibl, and H. Giessen, “Linear refractive index and absorption measurements of
nonlinear optical liquids in the visible and near-infrared spectral region,” Opt. Mater. Express 2(11), 1588–1611 (2012).
54. J. K. Wahlstrand, Y. H. Cheng, and H. M. Milchberg, “High Field Optical Nonlinearity and the Kramers-Kronig Relations,” Phys. Rev. Lett. 109(11), 113904 (2012).
55. H. M. Milchberg, Y.-H. Chen, Y.-H. Cheng, N. Jhajj, J. P. Palastro, E. W. Rosenthal, S. Varma, J. K. Wahlstrand, and S. Zahedpour, “The extreme nonlinear optics of gases and femtosecond optical filamentation,” Phys. Plasmas 21(10), 100901 (2014).
1. Introduction
The nonlinear optical (NLO) response of gases under intense laser fields has been extensively investigated and plays a critical role in applications of pulse compression [1], high harmonic generation [2], attosecond pulse shaping [3, 4], control of filamentation [5–8], and separation of molecular isotopologues [9]. A molecular gas with an anisotropic polarizability exhibits nonlinear refraction (NLR) that originates from the nearly instantaneous response of bound electrons and the delayed response from field induced molecular rotation. Coherent excitation of many rotational states via coherent Raman scattering with a femtosecond pulse results in periodic revivals in the degree of alignment of the molecular ensemble [10–12].
Various time-resolved techniques based on the typical pump-probe geometry have been applied to measure rotational revivals in molecular gases. An intense pump pulse induces rotation of the molecules towards its polarization direction and a variably delayed probe pulse experiences a phase shift from the subsequent refractive index change. The Optical Kerr Effect (OKE) [13] was the earliest method used to measure rotational revivals in gaseous CS2 [10, 14]. OKE only measures the induced birefringence and lacks the flexibility to measure the polarization dependence of the nonlinear response. Degenerate four wave mixing (DFWM) [15] has also been used to measure low density CS2 gas, precisely determining the rotational and centrifugal distortion constants [16]. However, without the implementation of more complicated optical-heterodyne-detection (OHD) [17], neither OKE nor DFWM are able to measure the sign of the refractive index change. Interferometric techniques have also been employed [18, 19], which use an additional reference pulse to interfere with the probe and the signal to give both the magnitude and sign of the phase shift. However, such methods may be highly sensitive to environmental perturbations, unless single-shot techniques are employed [18]. Alternatively, in time-resolved Coulomb explosion imaging an intense probe pulse initiates coulomb explosion and the velocities of the ions are angularly resolved to map out the molecular alignment [20, 21]. This technique does not provide information on the bound-electronic nonlinear response.
In this paper, we apply our recently developed beam deflection (BD) technique [22] to characterize the NLR response of ambient air and gas phase CS2. BD is an excite-probe
#242671 Received 16 Jun 2015; revised 4 Aug 2015; accepted 6 Aug 2015; published 14 Aug 2015 (C) 2015 OSA 24 Aug 2015 | Vol. 23, No. 17 | DOI:10.1364/OE.23.022224 | OPTICS EXPRESS 22226
technique capable of measuring the absolute magnitude, sign, temporal dynamics, and polarization dependence of NLR with high sensitivity. Measurable induced phase changes as small as 0.3 mrad (optical path length changes of λ/20,000) have been demonstrated. It is capable of measuring a variety of ultrafast nonlinear optical processes, including nearly instantaneous bound-electronic NLR and two-photon absorption, as well as noninstantaneous effects. We have previously performed absolutely calibrated BD measurements to fully characterize the NLR response of liquid CS2, unambiguously separating the four major nonlinear responses (bound-electronic plus three nuclear contributions) including their temporal and polarization dependences [23]. In principle, the BD technique is similar to other multi-beam nonlinear measurement techniques, such as OKE, DFWM, and interferometric methods, but has a number of distinct advantages. Unlike the OKE and DFWM, the measured signal in a BD measurement is directly proportional to the induced refractive index change, yielding both the magnitude and sign of the NLR without the requirement of OHD. It is therefore a simpler technique and may be more easily implemented than interferometric methods [19]. BD also allows complete freedom in selecting polarization of both the pump and probe beams, making it more flexible than OKE which measures only the induced birefringence. In gases, BD is also able to measure refractive index revivals over many periods, along with the dephasing rate, enabling determination of the rotational Raman spectrum. Measurement of air demonstrates the BD technique’s capability to identify and measure properties of individual constituents of a gaseous mixture. We utilize this in gaseous CS2, where different vibrational states and isotopologues are measured.
By investigating the polarization dependence, BD also measures the tensor symmetry of the third-order nonlinearity. With a probe polarized at the “magic angle” (54.7°) with respect to that of the excitation polarization, the rotational contribution is completely eliminated from the measurement [24]. This isolates the bound-electronic NLR and allows unambiguous determination of the nonlinear refractive index n2,el and the second hyperpolarizability γ [23]. Gas phase measurements of γ allow direct comparison to theoretical calculations [25, 26] and tests of local field effects in liquid phase measurements [27, 28]. We find agreement between gas phase measurements of γ of CS2, and our liquid phase measurements [23] when using Lorentz-Lorenz local field correction [28, 29]. The BD technique provides a thorough characterization of the nonlinear optical response of molecular gases and precise determination of n2,el, γ, rotational and centrifugal distortion constants, dephasing rates, and rotational Raman spectrum in a self-consistent quantitative measurement.
2. Theory
The major mechanisms that cause NLR in dilute gases of linear molecules are the nearly instantaneous bound-electronic response, and the noninstantaneous induced rotational response that originates from the net alignment of the molecular ensemble. At equilibrium, the molecules are oriented randomly and the ensemble has zero net alignment, meaning the linear refractive index n0 depends on the orientationally averaged polarizability. Changes in the degree of alignment lead to a refractive index change of [28, 29]
2
0 0
1( ) cos ( ) ,
2 3rot
Nn t t
n
α θεΔ Δ = −
(1)
where N is the number density of molecules, Δα = α∥ – α⊥ is the difference in polarizabilities parallel and perpendicular to the molecular axis, ε0 is the vacuum permittivity, n0 is the real linear refractive index of the probe, θ is the angle between the molecular axis and the field polarization, and the angle brackets indicate ensemble averaging. A strong excitation pulse causes a time-dependent change in the refractive index experienced by a weak probe due to both mechanisms (see, for example, Refs [10, 30]. and [18] for a derivation) given by
#242671 Received 16 Jun 2015; revised 4 Aug 2015; accepted 6 Aug 2015; published 14 Aug 2015 (C) 2015 OSA 24 Aug 2015 | Vol. 23, No. 17 | DOI:10.1364/OE.23.022224 | OPTICS EXPRESS 22227

( ) ( )( ) ( ), 22 '2, , 2
-
( ) 2 ( ) ( ') sin ' d ,4
J J
tt t
el e J e J JJ
cNn t n I t T I t t t e tα ω −−Γ −
−∞
′Δ = + Δ − (2)
where Ie(t) is the excitation (pump) irradiance, c is the speed of light in vacuum, ωJ,J-2 and ΓJ,J-
2 are the frequency difference and dephasing rate between rotational states J and J-2, respectively, and
( ) ( )( )0 0, 2, 2
2 ( 1)
15 2 1J J J J J
J JT
Jρ ρ − −
−= −−
(3)
is a weighting factor [10] that accounts for the initial occupation probability ρ(0) of the rotational states, which depends on both temperature and spin statistics of the atomic nuclei [31]. The relative occupation of even and odd rotational states is dictated by the spin of identical nuclei due to exchange symmetry, which is symmetric for integer spin, and antisymmetric for half integer spin [31].
The first term in Eq. (2) is the refractive index change due to the bound-electronic response, Δnel. The factor of 2 in the first term arises from interference of the two beams doubling the phase change [32], sometimes referred to as weak-wave retardation [33]. This does not appear in the second term since the rotational response is too slow to follow the rapidly moving irradiance grating in nondegenerate experiments [23]. The bound-electronic contribution to the NLR originates from the transition dipole coupling of electronic states. It is characterized by the purely electronic second hyperpolarizability γ defined by [25]
(0) 2 3μ μ αE βE γE ,= + + + (4)
where μ is the dipole moment, expanded as a power series of the total electric field E, which is a sum of the pump and probe fields of the form E0(ω)cos(k·r -ωt), where E0(ω) is the pulse envelope at central frequency ω, and k is the wavevector. μ(0) is the permanent dipole moment, α is the linear polarizability, and β is the first polarizability. In the symmetric molecules we investigate here, μ(0) and β are zero. In lossless media, γ is related to the nonlinear refractive index by
(3)2, 2
0 0 0,
3Re ,
4ele
Nn f
cn nγ
ε= (5)
where n0,e is the (real) linear refractive index of the excitation wavelength, f(3) = [(n02 +
2)/3]2[(n0,e2 + 2)/3]2 is the Lorentz-Lorenz local field correction factor for third-order
nonlinearities which is ~1 in dilute gases [28, 29], and angle brackets about γ indicate orientational averaging over the tensor elements [34].
The second term in Eq. (2) is the refractive index change due to the induced rotation of linear molecules, Δnrot, where (classically) the excitation field induces a dipole along the molecular axis, applies a torque, and causes the molecules to rotate. The density matrix approach is applied to calculate the degree of alignment, where the quantization of rotational energies is considered [10, 18, 30]. States of total angular quantum number J have rotational energy Erot = hcBJ(J + 1) - hcDJ2(J + 1)2, where h is Planck’s constant, and B and D are the rotational and centrifugal distortion constants, respectively [31]. Using ultrashort femtosecond pulses, with a bandwidth similar to the initial rotational energy distribution, many rotational eigenstates are coherently excited via two-photon stimulated Raman transitions, and the resulting rotational superpositions have well-established phase relationships which evolve coherently at their Raman frequencies ωJ,J-2. Quantum interference of the superposed rotational states leads to temporal recurrences in the degree of alignment of the molecular ensemble, which directly cause refractive index revivals (the second term in Eq. (2)). Because the frequencies ωJ,J-2 are almost equally spaced, the constant phase
#242671 Received 16 Jun 2015; revised 4 Aug 2015; accepted 6 Aug 2015; published 14 Aug 2015 (C) 2015 OSA 24 Aug 2015 | Vol. 23, No. 17 | DOI:10.1364/OE.23.022224 | OPTICS EXPRESS 22228
relationship imposed by the excitation results in periodic revivals. This is analogous to a mode locked laser, where the constant spectral phase across many longitudinal modes of a laser cavity results in a periodic pulsed output.
3. Beam deflection technique
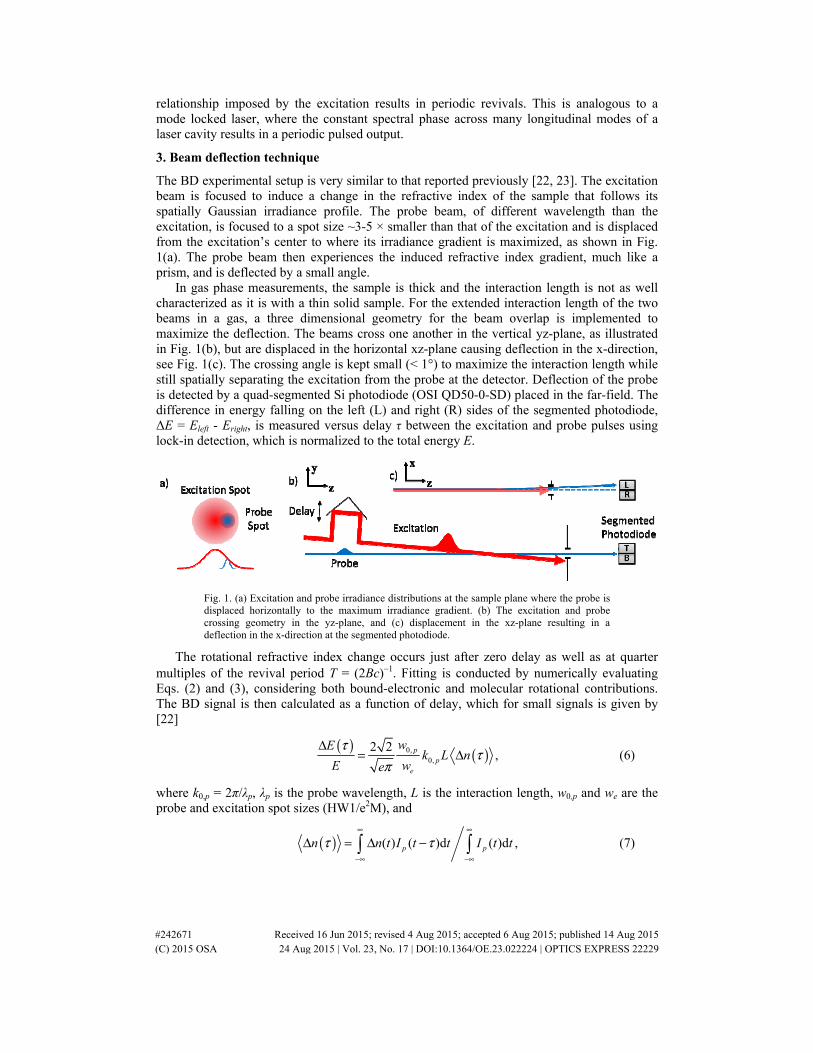
The BD experimental setup is very similar to that reported previously [22, 23]. The excitation beam is focused to induce a change in the refractive index of the sample that follows its spatially Gaussian irradiance profile. The probe beam, of different wavelength than the excitation, is focused to a spot size ~3-5 × smaller than that of the excitation and is displaced from the excitation’s center to where its irradiance gradient is maximized, as shown in Fig. 1(a). The probe beam then experiences the induced refractive index gradient, much like a prism, and is deflected by a small angle.
In gas phase measurements, the sample is thick and the interaction length is not as well characterized as it is with a thin solid sample. For the extended interaction length of the two beams in a gas, a three dimensional geometry for the beam overlap is implemented to maximize the deflection. The beams cross one another in the vertical yz-plane, as illustrated in Fig. 1(b), but are displaced in the horizontal xz-plane causing deflection in the x-direction, see Fig. 1(c). The crossing angle is kept small (< 1°) to maximize the interaction length while still spatially separating the excitation from the probe at the detector. Deflection of the probe is detected by a quad-segmented Si photodiode (OSI QD50-0-SD) placed in the far-field. The difference in energy falling on the left (L) and right (R) sides of the segmented photodiode, ΔE = Eleft - Eright, is measured versus delay τ between the excitation and probe pulses using lock-in detection, which is normalized to the total energy E.
Fig. 1. (a) Excitation and probe irradiance distributions at the sample plane where the probe is displaced horizontally to the maximum irradiance gradient. (b) The excitation and probe crossing geometry in the yz-plane, and (c) displacement in the xz-plane resulting in a deflection in the x-direction at the segmented photodiode.
The rotational refractive index change occurs just after zero delay as well as at quarter multiples of the revival period T = (2Bc)−1. Fitting is conducted by numerically evaluating Eqs. (2) and (3), considering both bound-electronic and molecular rotational contributions. The BD signal is then calculated as a function of delay, which for small signals is given by [22]
( ) ( )0,
0,
2 2,p
pe
wEk L n
E we
ττ
πΔ
= Δ (6)
where k0,p = 2π/λp, λp is the probe wavelength, L is the interaction length, w0,p and we are the probe and excitation spot sizes (HW1/e2M), and
( ) ( ) ( )d ( )d ,p pn n t I t t I t tτ τ∞ ∞
−∞ −∞
Δ = Δ − (7)
#242671 Received 16 Jun 2015; revised 4 Aug 2015; accepted 6 Aug 2015; published 14 Aug 2015 (C) 2015 OSA 24 Aug 2015 | Vol. 23, No. 17 | DOI:10.1364/OE.23.022224 | OPTICS EXPRESS 22229

is the refractive index change temporally averaged over the probe irradiance Ip(t). Equation (6), which is the same as Eq. (6) from [22], assumes a small interaction length such that the probe and excitation do not spatially walk off one another, and the phase change induced in the probe is uniform across the sample thickness. For our gaseous samples this assumption is no longer valid given the large thicknesses. To quantitatively measure the bound-electronic NLR of gases, we therefore perform relative measurements using the well-known values of Δα, which have been measured from gas phase Raman spectroscopy [35, 36], as a self-reference. The relative contributions from the second hyperpolarizability γ and Δα can be obtained by evaluating the magnitudes of the bound-electronic and molecular rotational contributions in the measurement. It can be shown from Eqs. (2) and (5) that
2
.( )
el
rot
n
n
γα
Δ∝
Δ Δ (8)
Within one self-consistent BD measurement, where Δnel and Δnrot are separated, γ can be precisely determined by using known values of Δα as a reference. In this case, experimental uncertainties in the interaction length, number density, and excitation irradiance that affect absolute measurements are eliminated.
4. Air measurements
We first perform experiments on N2 and O2 in ambient air. A commercial Ti:sapphire laser system (Coherent Legend Elite Duo HE + ) operating at 800 nm with 12 mJ output energy at a repetition rate of 1 kHz, is used for the excitation. A 30 cm motorized translation stage provides up to 2 ns of delay of the excitation pulse with respect to the probe pulse. The group velocity in air is accounted for in converting from stage position to temporal delay using n0,e = 1.000275 [37]. Approximately 0.8 μJ of the laser output is focused into a 1 cm cuvette filled with water to generate a white-light continuum (WLC), from which the probe is spectrally filtered at 650 nm with a 40 nm bandwidth (FWHM). A polarizer is used to ensure linear polarization of the probe, and a half-wave plate controls the angle of its polarization with respect to that of the excitation. The excitation and probe beams are focused to spot sizes we = 177 μm and w0,p = 60 μm, and have pulse widths τe = 83 fs and τp = 265 fs (FWHM), respectively, as determined by auto- and cross-correlation. The peak excitation irradiance is 10 TW/cm2, which is below the filamentation threshold [38, 39].
Figure 2(a) shows the measured BD signal (black) of ambient lab air for a probe polarized parallel to the excitation over the first 28 ps of delay. A numerical fit (violet) using Eqs. (2) and (6) includes both N2 and O2 weighted by their relative atmospheric concentrations at 1 atm [40]. Figures 2(b) and 2(c) show the individual fits for N2 (red) and O2 (blue), respectively. The amplitude of the fit was matched to the data by allowing the interaction length L to vary, since the interaction length was not characterized. The best agreement was found with L = 6.5 cm. We therefore obtain a relative fit, which gives a good determination of the ratio Δα(O2)/Δα(N2), that agrees well with the values in [35] (see Table 1). The full revival for O2 can be seen at 11.5 ps and for N2 at 8.5 ps. Due to the contributions of both molecules to the total measured signal, certain time delays display features from the sum of each constituent. For example, the circled feature at 6 ps in Fig. 2 shows the contribution from the ½ revival of O2 and ¾ revival of N2.
#242671 Received 16 Jun 2015; revised 4 Aug 2015; accepted 6 Aug 2015; published 14 Aug 2015 (C) 2015 OSA 24 Aug 2015 | Vol. 23, No. 17 | DOI:10.1364/OE.23.022224 | OPTICS EXPRESS 22230

Fig. 2. (a) (black) Measured BD signal from air and (violet) fit, which is a sum of both the contribution of N2 and O2. (b) and (c) show the first 12 ps of delay, which includes the first full revival periods, along with fits of N2 (red) and O2 (blue), respectively. The circled feature at about 6 ps highlights the combined effect of the ¾ revival of N2 and ½ revival of O2.
Nuclear spin statistics have an impact on the measured beam deflection signal. Both even and odd rotational states contribute equally to the ½ and full revivals, but have the opposite sign for the ¼ and ¾ revivals [18]. The spin statistics of 16O2 dictate that the rotational levels have only odd J values [31], and its ¼ and ½ revivals therefore have equal amplitudes. 14N2, however, has a 2:1 ratio of even and odd states [31], meaning the even states’ contribution to the ¼ and ¾ revivals are partially canceled by the odd states’. The ¼ and ¾ revivals from N2 therefore have half the amplitude of the ½ and full revivals, and the opposite sign of those from O2.
To obtain information about the dephasing rate, the BD measurement was performed out to 300 ps of delay, shown in Fig. 3(a) (where the initial signal just after zero delay is not shown). Additionally, the rotational Raman spectrum is provided by the Fourier transform as shown in Fig. 3(b) along with the fits for N2 (red) and O2 (blue). On top of the thermal distribution, the consequences of nuclear spin statistics can be seen in the amplitude of the rotational Raman peaks. For example, the 14N2 spectrum the intensity of adjacent peaks follows the 2:1 ratio of symmetric to anti-symmetric states [31].
The spectral lines for rotational transitions are evenly spaced until higher rotational levels where a centrifugal deformation lengthens the bond and decreases the rotational frequency. The resulting centrifugal distortion for higher rotational levels can be seen in Fig. 3(c). The fit for low rotational states with (solid lines) and without (dashed lines) D lie on top of each other. However, for higher rotational states there is significant discrepancy from the measurement when neglecting centrifugal distortion. The values of B and D found from fitting are given in Table 1 for each molecule, which shows a comparison to Raman scattering measurements [41].
#242671 Received 16 Jun 2015; revised 4 Aug 2015; accepted 6 Aug 2015; published 14 Aug 2015 (C) 2015 OSA 24 Aug 2015 | Vol. 23, No. 17 | DOI:10.1364/OE.23.022224 | OPTICS EXPRESS 22231
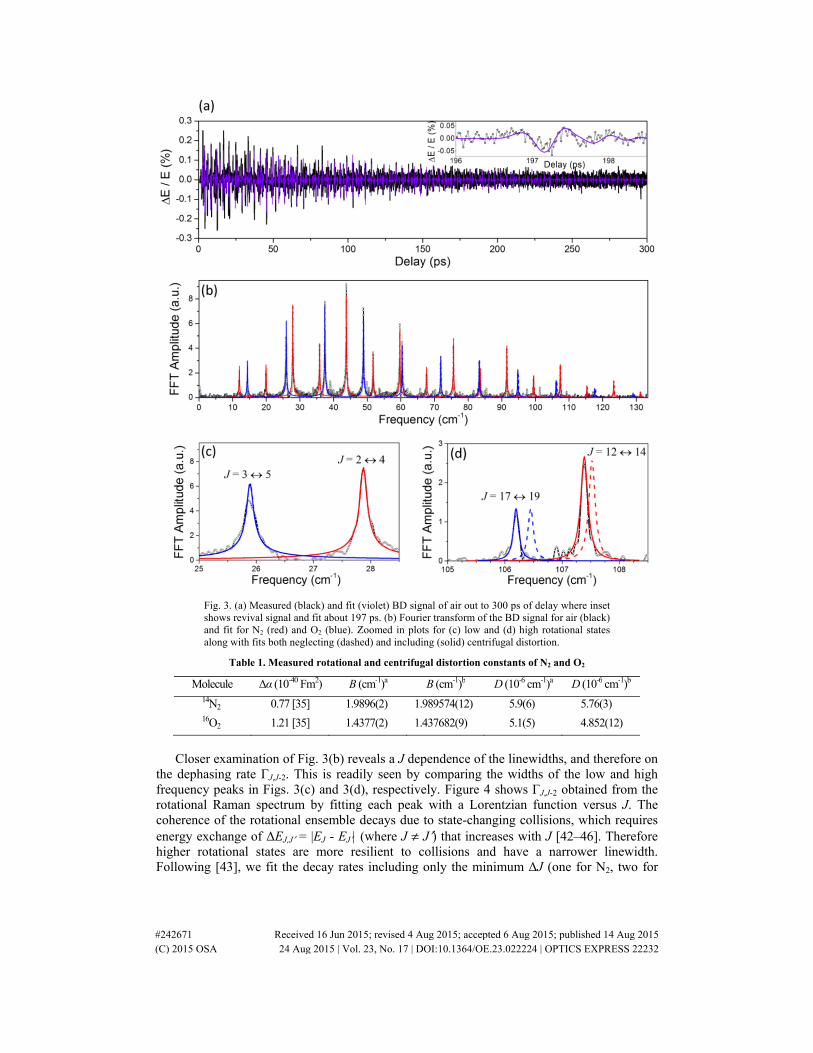
Fig. 3. (a) Measured (black) and fit (violet) BD signal of air out to 300 ps of delay where inset shows revival signal and fit about 197 ps. (b) Fourier transform of the BD signal for air (black) and fit for N2 (red) and O2 (blue). Zoomed in plots for (c) low and (d) high rotational states along with fits both neglecting (dashed) and including (solid) centrifugal distortion.
Table 1. Measured rotational and centrifugal distortion constants of N2 and O2
Molecule Δα (10-40 Fm2) B (cm-1)a B (cm-1)b D (10-6 cm-1)a D (10-6 cm-1)b
14N2 0.77 [35] 1.9896(2) 1.989574(12) 5.9(6) 5.76(3) 16O2 1.21 [35] 1.4377(2) 1.437682(9) 5.1(5) 4.852(12)
Closer examination of Fig. 3(b) reveals a J dependence of the linewidths, and therefore on
the dephasing rate ΓJ,J-2. This is readily seen by comparing the widths of the low and high frequency peaks in Figs. 3(c) and 3(d), respectively. Figure 4 shows ΓJ,J-2 obtained from the rotational Raman spectrum by fitting each peak with a Lorentzian function versus J. The coherence of the rotational ensemble decays due to state-changing collisions, which requires energy exchange of ΔEJ,J′ = |EJ - EJ′| (where J ≠ J′) that increases with J [42–46]. Therefore higher rotational states are more resilient to collisions and have a narrower linewidth. Following [43], we fit the decay rates including only the minimum ΔJ (one for N2, two for
#242671 Received 16 Jun 2015; revised 4 Aug 2015; accepted 6 Aug 2015; published 14 Aug 2015 (C) 2015 OSA 24 Aug 2015 | Vol. 23, No. 17 | DOI:10.1364/OE.23.022224 | OPTICS EXPRESS 22232

O2) transitions in the exponential gap law, where the probability of collision transition is PJ, J′ = ae-cBJ, where a and c are fitting parameters.
Fig. 4. Measurements (circles) of ΓJ,J-2 versus J, for both N2 (red) and O2 (blue), and with exponential fits (curves).
The net alignment of the molecular ensemble creates a birefringence with an increased refractive index in the direction of alignment and a decreased refractive index in perpendicular directions. For some angle φ in between, the BD signal must go to zero. This is
the “magic angle” (φ = arctan 2 ≈54.7°), where the rotational contribution to the BD signal is eliminated, leaving only the isotropic response which we attribute to the nearly instantaneous bound-electronic nonlinearity. We neglect the vibrational response since it is expected to be small [47], and our excitation pulse widths are too long (bandwidths too narrow) to excite vibrational modes, which we also do not observe in our experimental data. For the bound-electronic nonlinearity in the isotropic gas Δnel,⊥ = Δnel,∥/3, and for rotational revivals Δnrot,⊥ = –Δnrot,∥/2. We write the total index change as a sum of these two
contributions, which for the three probe polarizations yields [22, 23]
( ) , / / , / /0 ,el rotn n nΔ = Δ + Δ (9)
( ) , / / , / /
1 190 ,
3 2el rotn n nΔ = Δ − Δ (10)
( ) , / /
554.7 .
9 eln nΔ = Δ (11)
Using a half-wave plate, the probe polarization angle with respect to that of the excitation was set to φ = 0° (parallel), 90° (perpendicular), and 54.7° (magic angle). Figure 5 shows the BD data for these polarization angles and fits using Eqs. (9)-(11). Because the amplitude of the rotational revival signal depends on the well-known values of Δα, we use them as a self-reference and measure n2,el relative to Δα. The fit in Fig. 5 corresponds to n2,el(air) = (10 ± 2) × 10−24 m2/W which agrees well with other measurements available from Refs [48, 49]. (see Table 2). Because there are multiple species in the gaseous mixture, we are unable to extract the second hyperpolarizability γ of the individual molecules. Instead, the average value for air is calculated with Eq. (5) to give γ = (1.25 ± 0.10) × 10−62 C4m4/J3, and compared to the concentration weighted average value γ(air) = 0.78γ(N2) + 0.21γ(O2) + 0.01γ(Ar) (using N =
#242671 Received 16 Jun 2015; revised 4 Aug 2015; accepted 6 Aug 2015; published 14 Aug 2015 (C) 2015 OSA 24 Aug 2015 | Vol. 23, No. 17 | DOI:10.1364/OE.23.022224 | OPTICS EXPRESS 22233

2.5 × 1019 cm−3, see Table 2). We find agreement, to within measurement error, with values determined from Shelton and Rice [26] when including dispersion by their Eqs. (18) and (19).
Table 2. Measured n2,el and weighted average value γ of air.
This work Wahlstrand et al. [48] Liu and Chin [49] Shelton and Rice [26]
n2,el (10-24 m2/W) 10 ± 2 7.9 ± 1.0 9.6 9.1
γ (10-62 C4m4/J3) 1.25 ± 0.20 0.98 ± 0.10 1.2 1.14
γ (10-37 esu) 10.1 ± 2.0 7.9 ± 1.0 9.7 9.2
Fig. 5. (points) Measured and (curves) fit polarization dependence of NLR of air, including (black) parallel, (red) perpendicular, and (blue) magic angle polarizations. Inset shows zoomed in region about 6 ps of delay.
5. CS2 measurements
Measurements of gaseous CS2 are performed by filling a 10 cm borosilicate cell ~1/3 full with the liquid CS2 (Sigma-Aldrich, 270660, ≥99.9%) and heating the cell windows to approximately 50 °C with a cell heater (Thorlabs GCH25-75) to prevent condensation, such that the upper portion of the cell is filled with gaseous CS2. The sample cell is positioned such that the beams cross above the liquid CS2 surface. A 1250 nm wavelength excitation pulse is generated from an optical parametric amplifier (Light Conversion, HE-TOPAS) pumped by the same laser source, and a WLC is generated in a 5 mm sapphire plate and spectrally filtered to give a 950 nm wavelength (FWHM 10 nm) probe. The beams are focused to w0,p = 90 μm and we = 468 μm, and have pulse widths τp = 137 fs and τe = 120 fs. The excitation energy is 62 μJ, giving a peak irradiance of 140 GW/cm2. Equation (2) shows that Δn depends on (Δα)2, which for N2 and O2 is approximately two orders of magnitude less than that for CS2 [36]. Thus, we do not observe any contribution from air in the measurements of gaseous CS2, and an irradiance nearly two orders of magnitude greater was used for the air measurements.
Figure 6 shows BD measurements for CS2. The larger moment of inertia of CS2 compared to both N2 and O2 gives it a much longer revival period (152.4 ps). Only up to the first ¾ revival is shown, since the first full revival is below the noise floor, owing to the more rapid decay rate. Figure 6(c) shows the ½ revival of CS2 about 76 ps, plus an additional feature at a slightly longer delay (~79 ps), which is enlarged in Fig. 6(d). This feature is due to the sulfur isotopologue C32S34S, which has a greater moment of inertia than C32S2, and is the second
#242671 Received 16 Jun 2015; revised 4 Aug 2015; accepted 6 Aug 2015; published 14 Aug 2015 (C) 2015 OSA 24 Aug 2015 | Vol. 23, No. 17 | DOI:10.1364/OE.23.022224 | OPTICS EXPRESS 22234

most common sulfur isotopologue. Based on this feature we measure a relative abundance of (9 ± 3) %, which agrees with the natural abundance of 8.6% [43]. This additional feature only appears for the ½ revival, but is not observed at the ¼ or ¾ revivals. Because its two S isotopes are distinguishable, C32S34S lacks nuclear exchange symmetry, meaning even and odd rotational states J are equally weighted [43]. Even and odd J states contribute equal and opposite signals at the ¼T and ¾T times, which cancel one another.
Fig. 6. (a) Measured (circles) BD signal from gaseous CS2 and fit (red curve) including C32S34S and the ground and first excited rotational states of C32S2. (b) ¼, and (c) ½ revival C32S2. (d) shows the ½ revival from C32S34S. In (b) both the black and blue curves neglect centrifugal distortion, and the black curve also assumes only ground state C32S2.
Additionally, at room temperature 15% of the C32S2 molecules are in the first excited vibrational state, the doubly-degenerate bending mode at ν2 = 397 cm−1 [43]. The two modes oscillate in the plane either perpendicular or parallel to the axis of rotation, which are symmetric and antisymmetric upon nuclear interchange, respectively, and therefore have opposite spin statistics [50]. We treat the modes with a single rotational constant and equal weighting of even and odd J states. Therefore, only C32S2 in the ground vibrational state has unequal weighting of even and odd J states, and is the only species that contributes to the ¼ and ¾ revivals. This leads to a greater relative amplitude of the ½ revivals, since all molecules contribute. The impact of this can be seen in calculations of the ¼ revival shown in the black curve Fig. 6(b), which assumes all of the molecules are C32S2 in its ground vibrational state. The fit matches the amplitude of the signals at zero delay and at the ½ revival (same as red curve in Fig. 6(c)) but clearly overestimates the ¼ revival signal. The rotational constant of the first excited vibrational state was found by giving the best fit with the ½ revival. Centrifugal distortion is also included causing the asymmetries in the revival signals which can be seen, for example, in the ¼ revival where the peak at 38.8 ps is larger than the peak at 37.4 ps. For comparison, the blue curve in Fig. 6(b) neglects centrifugal distortion. With only knowledge of the energy and spin statistics of vibrational modes, the rotational and centrifugal distortion constants (given in Table 3) and relative abundance of isotopologues are found from the fit, which agree with Refs [14, 43, 51]. For comparison, Table 3 also shows values of B and D from Ref [43].
#242671 Received 16 Jun 2015; revised 4 Aug 2015; accepted 6 Aug 2015; published 14 Aug 2015 (C) 2015 OSA 24 Aug 2015 | Vol. 23, No. 17 | DOI:10.1364/OE.23.022224 | OPTICS EXPRESS 22235
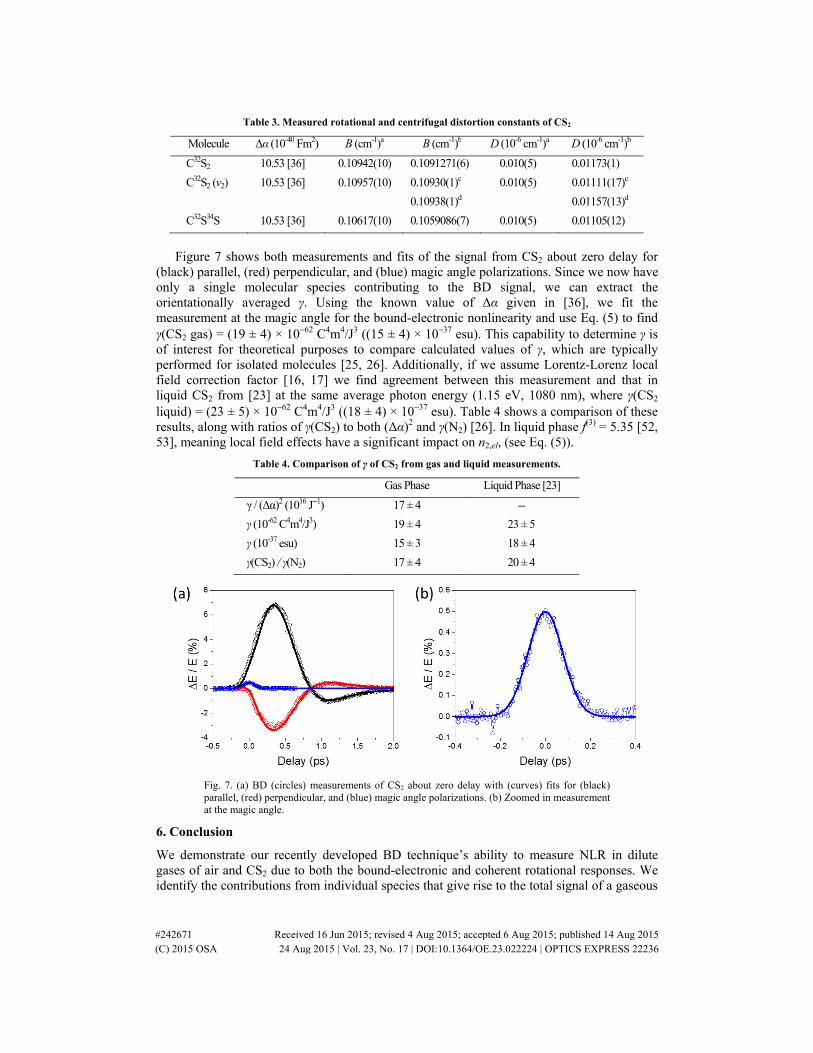
Table 3. Measured rotational and centrifugal distortion constants of CS2
Molecule Δα (10-40 Fm2) B (cm-1)a B (cm-1)b D (10-6 cm-1)a D (10-6 cm-1)b
C32S2 10.53 [36] 0.10942(10) 0.1091271(6) 0.010(5) 0.01173(1)
C32S2 (ν2) 10.53 [36] 0.10957(10) 0.10930(1)c
0.10938(1)d
0.010(5) 0.01111(17)c
0.01157(13)d
C32S34S 10.53 [36] 0.10617(10) 0.1059086(7) 0.010(5) 0.01105(12)
Figure 7 shows both measurements and fits of the signal from CS2 about zero delay for
(black) parallel, (red) perpendicular, and (blue) magic angle polarizations. Since we now have only a single molecular species contributing to the BD signal, we can extract the orientationally averaged γ. Using the known value of Δα given in [36], we fit the measurement at the magic angle for the bound-electronic nonlinearity and use Eq. (5) to find γ(CS2 gas) = (19 ± 4) × 10−62 C4m4/J3 ((15 ± 4) × 10−37 esu). This capability to determine γ is of interest for theoretical purposes to compare calculated values of γ, which are typically performed for isolated molecules [25, 26]. Additionally, if we assume Lorentz-Lorenz local field correction factor [16, 17] we find agreement between this measurement and that in liquid CS2 from [23] at the same average photon energy (1.15 eV, 1080 nm), where γ(CS2 liquid) = (23 ± 5) × 10−62 C4m4/J3 ((18 ± 4) × 10−37 esu). Table 4 shows a comparison of these results, along with ratios of γ(CS2) to both (Δα)2 and γ(N2) [26]. In liquid phase f(3) = 5.35 [52, 53], meaning local field effects have a significant impact on n2,el, (see Eq. (5)).
Table 4. Comparison of γ of CS2 from gas and liquid measurements.
Gas Phase Liquid Phase [23]
γ / (Δα)2 (1016 J--1) 17 ± 4 --
γ (10-62 C4m4/J3) 19 ± 4 23 ± 5
γ (10-37 esu) 15 ± 3 18 ± 4
γ(CS2) / γ(N2) 17 ± 4 20 ± 4
Fig. 7. (a) BD (circles) measurements of CS2 about zero delay with (curves) fits for (black) parallel, (red) perpendicular, and (blue) magic angle polarizations. (b) Zoomed in measurement at the magic angle.
6. Conclusion
We demonstrate our recently developed BD technique’s ability to measure NLR in dilute gases of air and CS2 due to both the bound-electronic and coherent rotational responses. We identify the contributions from individual species that give rise to the total signal of a gaseous
#242671 Received 16 Jun 2015; revised 4 Aug 2015; accepted 6 Aug 2015; published 14 Aug 2015 (C) 2015 OSA 24 Aug 2015 | Vol. 23, No. 17 | DOI:10.1364/OE.23.022224 | OPTICS EXPRESS 22236

mixture by separating the contributions to the air signal from N2 and O2. Since BD allows measurements out to long delays, collisional dephasing back to thermal equilibrium can be seen, and the Fourier transform of the measured signal yields the rotational Raman spectrum. From measurements of gaseous CS2, we identify the signal from two isotopologues, C32S2 and C32S34S, and the first excited vibrational state. Based on these measurements, we are able to determine the rotational and centrifugal distortion coefficients, J dependent dephasing rates, and relative isotopologue concentration.
The bound-electronic response is separated from rotational revivals by taking advantage of their different polarization dependencies using the magic angle. With well-known values of Δα, the signal from the coherent rotational revivals provides a self-reference, from which n2,el of air and orientationally averaged γ of CS2 are unambiguously determined. Determination of γ of N2 and O2 is also possible by measuring pure gases. Measurement of γ of isolated molecules is important for comparison to theoretical models which are typically compared to measurements preformed on liquids [34]. Furthermore, we have experimentally verified that Lorentz-Lorenz local field correction yields agreement between gas and liquid phase measurements of γ.
The BD technique may be applied to study the structure and dynamics of a variety of molecular species with anisotropic polarizabilities in gaseous mixtures. It may be further improved upon to provide absolutely calibrated measurements by fully characterizing the beam interaction geometry, or by incorporating a gas jet within a vacuum chamber such that the induced deflection is uniform over a well-defined interaction length. The latter has been implemented by Wahlstrand et al. in their single-shot spectral interferometry technique [39, 48, 54, 55], where measurement of a thin (~2 mm) laminar gas flow within a chamber at low background pressure allows absolutely calibrated measurements. Experimental investigations of other gases may help validate and improve theoretical models of γ and the limitations of the Lorentz-Lorenz local field correction.
Acknowledgments
This work was supported by the Air Force Office of Scientific Research MURI grant FA9550-10-1-0558 and the National Science Foundation grants ECCS-1202471 and ECCS-1229563.
#242671 Received 16 Jun 2015; revised 4 Aug 2015; accepted 6 Aug 2015; published 14 Aug 2015 (C) 2015 OSA 24 Aug 2015 | Vol. 23, No. 17 | DOI:10.1364/OE.23.022224 | OPTICS EXPRESS 22237