BE Group Q2 presentation.pptinvestors.begroup.com/files/BEGroup_Q2_presentation_2011.pdf ·...
23
BE GROUP INTERIM REPORT JANUARY – JUNE 2011 Roger Johansson, President & CEO Slide 1 Torbjörn Clementz, CFO & Executive Vice President
-
Upload
truongdien -
Category
Documents
-
view
214 -
download
1
Transcript of BE Group Q2 presentation.pptinvestors.begroup.com/files/BEGroup_Q2_presentation_2011.pdf ·...

BE GROUPINTERIM REPORTJANUARY – JUNE 2011
Roger Johansson, President & CEO
Slide 1
Torbjörn Clementz, CFO & Executive Vice President

Q2 – A quarter with continued growth
Financial HighlightsN t l i f 14%Net sales increase of 14%
Delivered tonnage increase of 7%
Operating result of 66 MSEK with an operating margin of 4.2%
Slide 2

Q2 – Good sales despite weakened steel market
Operational highlightsContinued phasing in of operational investments
Market highlightsOverall good demand on our productsSt ti it i i i t investments
Started transformation of Polish business with a unit for production service
Strong activity in engineering sectorImproved activity in construction sectorIncreased sales prices in all three
serviceHigh focus on inventory management to be well balanced for Q3S
business areasThe bullish price development from steel producers in Q1 turned to decline
Several internal initiatives launched to improve gross margin
Slide 3

FINANCIALS IN DETAIL
Slide 4

Continued growth in sold tonnage
125
150
500
600 Increased tonnage despite weak start of the quarter
Tonnage (‘000 tons)
75
100
125
300
400
500 q
Sold tonnage 7% higher than Q2 2010
25
50
75
100
200
300
In total tons best quarter since Q2 2008
0
25
Q1 Q2 Q3 Q4 Q1 Q2 Q3 Q4 Q1 Q2 Q3 Q40
100
2009 2010 2011
Slide 5
Quarterly Rolling 12 months
Price volatility not fully reflected in average sales prices
11,0012,0013,00 Q2 average sales price increase of 7%
Average sales price (SEK/kg)
7,008,009,00
10,0011,00
Increase of 3% compared to Q1
Adjusted for currency effects, average sales price increased by 3% vs last
2 003,004,005,006,00
p yyear and 2% vs Q1
0,001,002,00
Q1 Q2 Q3 Q4 Q1 Q2 Q3 Q4 Q1 Q2 Q3 Q42009 2010 2011
Slide 6
Quarterly Rolling 12 months
Q2 Q2 Ch Q1
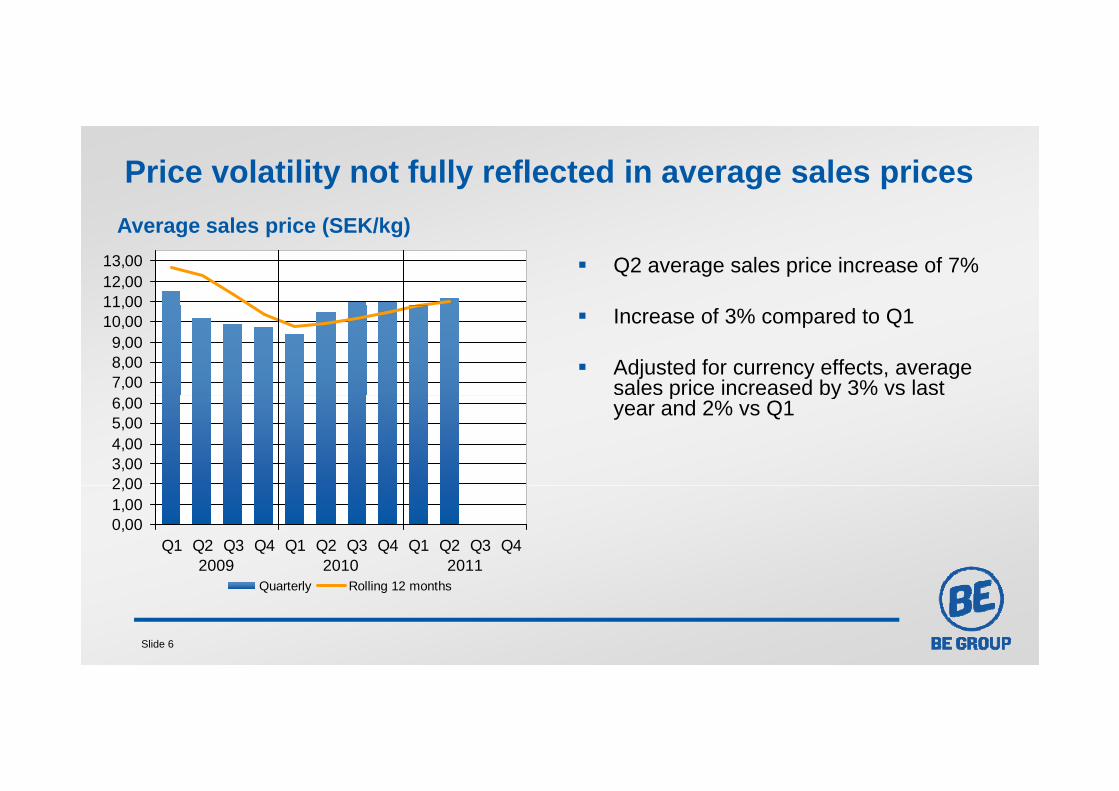
Q2: Higher sales with result not on par with last yearQ2 Q2 Change Q1
SEK M 2011 2010 2011
Net sales 1,597 1,399 +198 1,519
Underl ing EBIT 43 46 3 47Underlying EBIT 43 46 -3 47% of Sales 2.7% 3.3% -0.6% 3.1%
Inventory gain/loss 23 40 -17 2
EBIT 66 86 -20 45EBIT 66 86 20 45% of Sales 4.2% 6.2% -2.0% 2.9%
Earnings before tax 57 59 -2 36
Net earnings 44 46 -2 23
EPS (SEK) 0.89 0.92 -0.03 0.46
Cash-flow before change in net debt -52 -30 -22 63
Net debt 851 832 +19 783
Slide 7
e deb 85 83 9 83
Net debt / Equity 98% 104% -6% 96%

EBIT improved vs latest quarter
1 3831 519
1 597
1 3991 400
1 600
140
160EBIT of 66 MSEK below last year due to lower inventory gains
Underlying gross margin pressure by
Sales, EBIT and uEBIT (SEK M)Sales EBIT
1 2731 3831 399
66
86
800
1 000
1 200
80
100
120Underlying gross margin pressure by production ramp-up
Leverage from acquisitions not fully achieved
43474632 7
4548
200
400
600
20
40
60Inventory gains of 23 MSEK (40)
EBIT margin of 4.2% (6.2)
-8-200
0
Q2 10 Q3 10 Q4 10 Q1 11 Q2 11-20
0
S S S
Slide 8
Net sales, SEK M Underlying EBIT, SEK M EBIT, SEK M

Well managed working capital supports cash-flow
11,710,4
800Working capital increase due to higher business volume
Working capital (SEK M)
9,28,2 8,2
400
600 Tight working capital management contributes to positive YTD cash-flow
Cash-flow from investment activities 37 MSEK ( 10) d i th t
200
-37 MSEK (-10) during the quarter
Net debt of 851 MSEK (832)
Unused credit facilities and available557 632 519 478 569
0Q2 10 Q3 10 Q4 10 Q1 11 Q2 11
Period end working capital, SEK M
Unused credit facilities and available cash of 435 MSEK
Gearing of 98% (104)
Slide 9
Period end working capital, SEK MWorking capital tied up, %

H1 H1 Ch
H1: All in all an improvement vs last year H1 H1 Change
SEK M 2011 2010
Net sales 3,116 2,473 +643
Underl ing EBIT 90 36 +54Underlying EBIT 90 36 +54% of Sales 2.9% 1.4% +1.5%
Inventory gain/loss 25 22 +3
EBIT 111 58 +53EBIT 111 58 +53% of Sales 3.6% 2.3% +1.3%
Earnings before tax 93 27 +66
Net earnings 67 21 +46
EPS (SEK) 1.35 0.42 +0.93
Cash-flow before change in net debt 11 -90 +101
Net debt 851 832 +19
Slide 10
e deb 85 83 9
Net debt / Equity 98% 104% -6%

BUSINESS AREASSTATUS Q2 2011
Slide 11

BA Sweden – Improvement in demand
800 80 Strengthened demand during the quarter after weak start
Sales, EBIT and uEBIT (SEK M)Sales EBIT
573
668740 748
673
40500
600
700
50
60
70Improvement from customers in both engineering and construction sector
Net sales increase with 11%
2116
3240
28
200
300
400
20
30
40Net sales increase with 11%
Operating margin improvement vs Q1
Integration of Lecor Stålteknik and RTS 2423
18 1711
0
100
200
Q2 10 Q3 10 Q4 10 Q1 11 Q2 110
10
20 gProduktion ongoing
Ongoing investment in new production facility for Lecor Stålteknik
Slide 12
Q2 10 Q3 10 Q4 10 Q1 11 Q2 11
Net sales, SEK M Underlying EBIT, SEK M EBIT, SEK M

BA Finland – Good margins despite production capacity ramp-upp y p p
600 60Stable demand with certain weakening at the end of period
Sales, EBIT and uEBIT (SEK M)Sales EBIT
474 479
546574
507
4433
48400
500
40
50 Net sales increase of 13% with a tonnage increase of 7%
Operating margin of 7 7%
293333
2115
29
200
300
20
30Operating margin of 7.7%
Increased production capacity yet to have an impact on sales
70
100
Q2 10 Q3 10 Q4 10 Q1 11 Q2 110
10 Decision on extension of production facility in Lapua. Investment of 20 MSEK
Slide 13
Q2 10 Q3 10 Q4 10 Q1 11 Q2 11
Net sales, SEK M Underlying EBIT, SEK M EBIT, SEK M

BA CEE – Transformation in Poland started
400 40 Continued increase in demand from
Sales, EBIT and uEBIT (SEK M)Sales EBIT
265 258 264307
254200
300
20
30engineering sector with certain weakening at the end of the quarter
Increase in net sales of 21% due to increase in shipped tonnage
110
0 13
8
20
100
0
10increase in shipped tonnage
EBIT weakened to 1 MSEK (8) due to declining price trend
-14-2
-16-200
-100
Q2 10 Q3 10 Q4 10 Q1 11 Q2 11-20
-10 Investment of 15 MSEK in new production service center in Trebaczew started
Slide 14
Q2 10 Q3 10 Q4 10 Q1 11 Q2 11
Net sales, SEK M Underlying EBIT, SEK M EBIT, SEK M

OUTLOOK
Slide 15
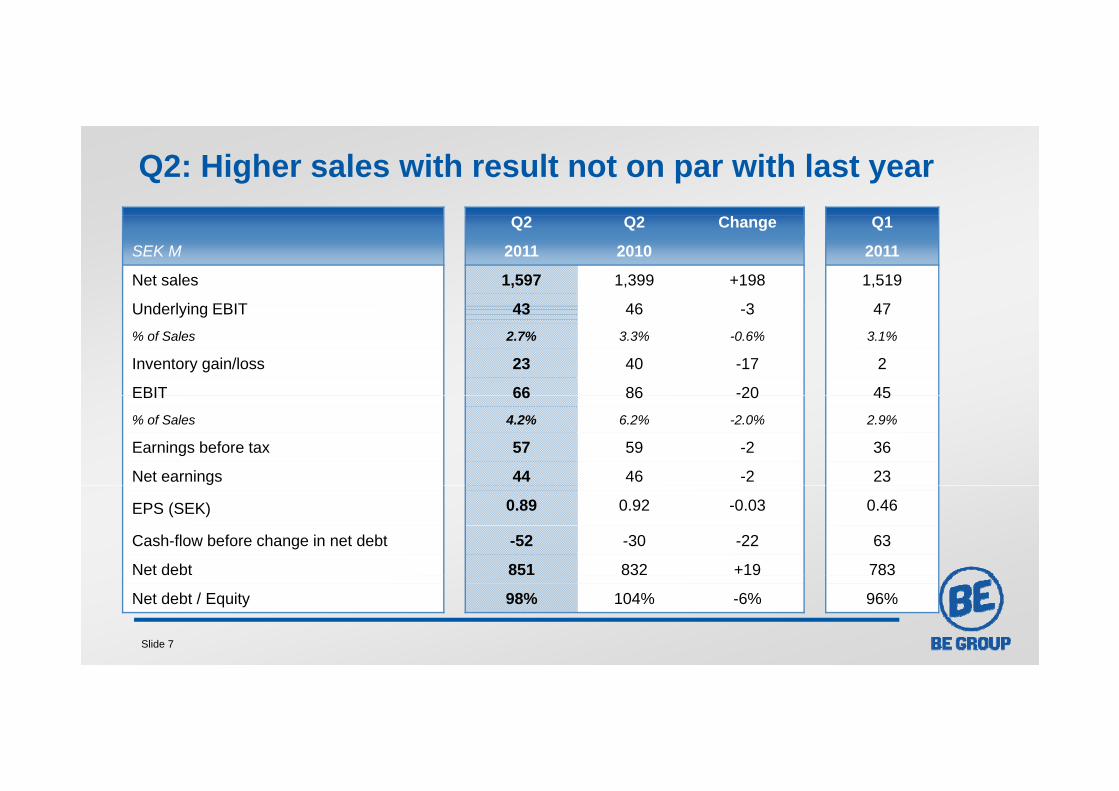
BE Group outlook
Signs of continued increase in demand during H2/11 based on customer forecasts
Pricing development to customers will vary depending on product
B i k t tl t bl ith j tBuying market currently stable with no major movements
Continued focus on improving margins and building the best modus operandi in the sectorin the sector
Slide 16

Business ambitions for the next few years
Profitable growth
Sustainable profitability in CEE
Service sales 50% of total sales
Follow customers internationally
Create leverage within the Groupg p
Slide 17

Slide 18

APPENDIXFINANCIAL INFORMATION
Slide 19

Appendix: Financial summary2010 2011 Full year2010 2011 Full year
Q1 Q2 Q3 Q4 Q1 Q2 Q3 Q4 2010 R12
Tonnage 114 133 116 126 140 143 489 525
Net Sales 1,074 1,399 1,273 1,383 1,519 1,597 5,129 5,772Net Sales 1,074 1,399 1,273 1,383 1,519 1,597 5,129 5,772
Underlying EBIT -10 46 32 7 47 43 75 129% of Sales -0.9% 3.3% 2.5% 0.5% 3.1% 2.7% 1.5% 2.2%
EBIT -28 86 48 -8 45 66 98 151% of Sales -2.6% 6.2% 3.8% -0.6% 2.9% 4.2% 1.9% 2.6%
Net earnings -25 46 26 -18 23 44 29 75
Earnings/share1 -0.50 0.92 0.52 -0.37 0.46 0.89 0.58 1.51
Cash flow2 -60 -30 -51 30 63 -52 -110 -9
Working Capital3 473 557 632 519 478 569 519 569
Underlying EBITA(%) -0.8 3.4 2.9 0.8 3.3 3.1 1.7 2.6
Slide 20
Underlying ROOC(%) -3.8 21.3 15.8 5.0 24.2 22.7 9.8 16.51 Earnings per share after dilution 3 Period end working capital2 Cash flow before change in Net Debt

Appendix: Sales per customer segment
5253
OEM &partners
January-June Q2
5253
OEM &partners
23
53
22Project 23
53
23Project
1716
Pre-processing 16
15
Pre-processing
89
0% 10% 20% 30% 40% 50% 60%
Retail 99
0% 10% 20% 30% 40% 50% 60%
Retail
Slide 21
0% 10% 20% 30% 40% 50% 60%
2011
0% 10% 20% 30% 40% 50% 60%
2010 2011 2010

Appendix: Sales per product area
450399+13Long
steel
January-June Q2
879716
Longsteel +23
575
134
489
130
+18
+3Reinforce-ment
Flatsteel
1 122
245
879
201Reinforce-
ment
Flatsteel +28
+22
271
86
130
245 +10
ment
Stainlesssteel
Al i
541
171
201
446
ment
Stainlesssteel
Al i
+21
8691
8145
-6Aluminum
Other
171167
15864
Aluminum
Other
+2
Slide 22
0% 5% 10% 15% 20% 25% 30% 35% 40%
2011 2010 Change %
0% 5% 10% 15% 20% 25% 30% 35% 40%
2011 2010 Change %

Appendix: Sales per channel
555
January-June Q2
283555
1 612
504Direct +10
283
830
286Direct -1
1 612
1 296Inventory
+24830
729
Inventory+14
904
643
0% 10% 20% 30% 40% 50%
Service+41
458
362
0% 10% 20% 30% 40% 50%
Service+27
Slide 23
2011 2010 Change %2011 2010 Change %
Sales outside scope of channels not included Sales outside scope of channels not included