BCF l A program to evaluate rock fragmentation in caving mines l The program models three processes:...
26
BCF A program to evaluate rock fragmentation in caving mines The program models three processes: Primary fragmentation - release of blocks from the cave back Secondary fragmentation - reduction of blocks in the draw column Hang-ups - blockages in draw bells
-
Upload
kathleen-dickerson -
Category
Documents
-
view
223 -
download
5
Transcript of BCF l A program to evaluate rock fragmentation in caving mines l The program models three processes:...

BCF
A program to evaluate rock fragmentation in caving mines
The program models three processes: Primary fragmentation - release of blocks
from the cave back Secondary fragmentation - reduction of
blocks in the draw column Hang-ups - blockages in draw bells

Method of operation
Input is rock mass data & cave data Uses rules/mechanics to produce
primary blocks and calculate secondary fragmentation in draw column
Uses Kear’s model (rule based) to predict hang-ups in draw bells using secondary blocks as input.

Example - rock mass dataRock mass
Joint sets

Example - cave data
Cave face
Stresses
Spalling

Example - primary results
Size distribution
Statistics

Example - Secondary data
Input files
Draw column
Draw bell

Example - Secondary results
Statistics
Primary & secondarysize distributions

Example - Batch run

Hang-up run results
High hangups
Low hangups
Oversize blockstatistics

Primary Fragmentation
Each in situ block is generated independently of other blocks
In situ fragmentation
Primary fragmentationCombined block

Primary fragmentation
Shearing along inclined joints
Primary fragmentation more slabby owing to stress fractures
Combined block
Stress fracturing and shearing along joints are considered
Stress fractures seen as additional joint set

Block generation
Relative joint densities used to select block corner
Block corner
Joints generated along each intersection line

Block generation
Block corner
Blocks are identified from corner
Potential block

Combination of blocks
Block corner
In compressive field stressesblocks may combine to
until strengthcriterion is exceeded or
end of jointis reached
Combined Block

Block generation
Writes volume, aspect ratio, joints to file
1
1
11
1
12
10
1
Aspect ratio = 1,0
Aspect ratio = 1,67
Aspect ratio = 7,0
Aspect ratio = (Area x L) / (6 xVol)

BCF SECONDARY FRAGMENTATION
Primary blocks are broken down into smaller fragments by repeatedly splitting in the draw column rounding of corners splitting when a temporary arch fails
Secondary fragmentation is based on concept that blocks with high aspect ratios will split more easilt than block with low aspect ratios
Fines generated by primary fragmentation reduce the effectiveness of the secondary fragmentation process by acting as a cushion

Flow chart for secondary fragmentation
Read input parametersfrom primary file
Calculate:- cave height & pressure - fines factor from rounding of corners- cushioning factor owing to primary fines
Read a block:- calc block strength- calc cycle height
Determine whether block splitsMove its products down the columnCalc fines generatedSee if products reached drawpointCalculate arching effects
Yes
No

Cave pressure
Cave pressure affected by “bin effects” based on Udec model
As width:height ratio of active draw zone increases dead weight loading of base increases
Width toheight ratioof activelydrawncolumn
Percentageof cavedweightacting onbottom ofcolumn
1 : 1 44%
1 : 2 30%
1 : 3 23%
1 : 4 20%
1 : 5 18%

Draw rate factor
Faster draw results in larger blocks:
0
0.5
1
1.5
2
2.5
3
3.5
4
4.5
0 20 40 60 80 1 00
Dr aw ra te (cm /da y)
Dra
w r
ate
fa
cto
r

Calculate cycle height
Cycle height is distance that block travels down column before splitting Cycle height depends on aspect ratio of block,
block strength, cave pressure, draw rate Block strength related to intact rock strength, block
volume, veinlets, whether block is combined (contains joints) and joint strength.
Progressive splitting of blocks increases their cycle height by reducing volume, aspect ratio and number of contained joints.

Hang-up analysis
Robin Kear’s model
Upper area
Lower area
If 25 blocks fill 40% of an area a hang-up is registered

Compare to BCF-DOS
For Parkes data set (three joint sets):
BCF-dos BCFV3%<2m 3 97 98Ave
volume0,30 0,13
Maxvolume
3,26 2,08
For PMC data set (five joint sets):
BCF-dos BCFV3%<2m 3 23% 17%Ave
volume1,46 1,69
Maxvolume
59 259
Stress free runs:

Runs with 5 MPa stress
For Parkes data set (three joint sets):
BCF-dos BCFV3%<2m3 51% 34%Avevolume
0,88 2,22
Maxvolume
15,4 25,8
For the PMC data set, the results were as follows:
BCF-dos BCFV3%<2m3 3,94 3,64Avevolume
8,11 9,0
Maxvolume
364 785

Secondary test runs
Using identical primary blocks:Cubic joints Parkes data PMC data
BCF-dos BCFV3 BCF-dos BCFV3 BCF-dos BCFV3%<2m3 16,0% 16,22% 86,7% 87,8% 22,13% 22,85%Ave vol 2,94 2,75 0,40 0,365 1,90 1,79Max vol 106,5 106,5 12,73 12,73 535 174
BCF-dos uses BCF-dos primary blocks, BCFV3 uses BCFV3 primary blocks –Cycle height halved
Cubic joints Parkes data PMC dataBCF-dos BCFV3 BCF-dos BCFV3 BCF-dos BCFV3
%<2m3 16,0% 28% 86,7% 65,6% 22,13% 21,7%Ave vol 2,94 2,46 0,40 0,54 1,90 2,35Max vol 106 78,2 12,7 78,7 535 762
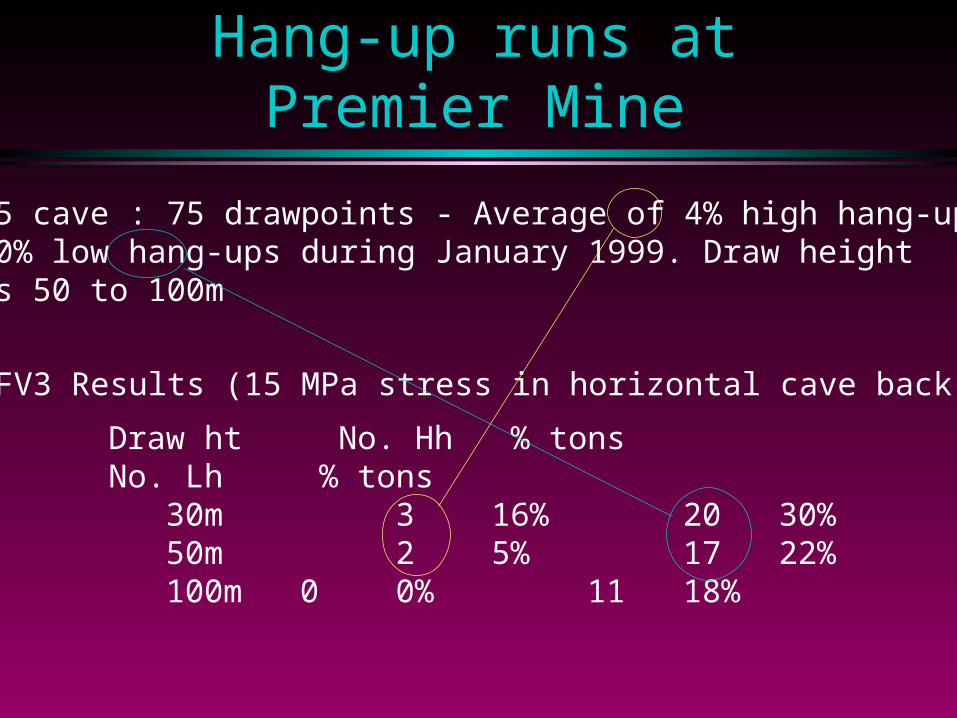
Hang-up runs at Premier Mine
Ba5 cave : 75 drawpoints - Average of 4% high hang-ups, 20% low hang-ups during January 1999. Draw heightwas 50 to 100m
BCFV3 Results (15 MPa stress in horizontal cave back):
Draw ht No. Hh % tons No. Lh % tons 30m 3 16% 20 30% 50m 2 5% 17 22% 100m 0 0% 11 18%

Future development
More data needed for validation Model method
base on tons rather than blocks allow mixing in draw column
Output present range of possible results Output as production rate/delays