
BCE Boletin agosto 2012
210
EUROPEAN CENTRAL BANK MONTHLY BULLETIN EN MONTHLY BULLETIN AUGUST 0812012 0112012 0212012 0312012 0412012 0512012 0612012 0712012 0812012 0912012 1012012 1112012 1212012
-
Upload
manfrednolte -
Category
Economy & Finance
-
view
544 -
download
3
description
Transcript of BCE Boletin agosto 2012

EURO
PEAN
CEN
TRAL
BAN
K
MO
NTH
LY B
ULL
ETI
NEN
MONTHLY BULLET INAUGUST
0812
012 0112012
02120120312012041201205120120612012071201208120120912012101201211120121212012
MONTHLY BULLET IN
AUGUST 2012
In 2012 all ECBpublications
feature a motiftaken from
the €50 banknote.

© European Central Bank, 2012
Address Kaiserstrasse 29
60311 Frankfurt am Main
Germany
Postal address Postfach 16 03 19
60066 Frankfurt am Main
Germany
Telephone +49 69 1344 0
Website http://www.ecb.europa.eu
Fax +49 69 1344 6000
This Bulletin was produced under the responsibility of the Executive Board of the ECB. Translations are prepared and published by the national central banks.
All rights reserved. Reproduction for educational and non-commercial purposes is permitted provided that the source is acknowledged.
The cut-off date for the statistics included in this issue was 1 August 2012.
ISSN 1561-0136 (print)
ISSN 1725-2822 (online)
3ECB
Monthly Bulletin
August 2012
EDITORIAL 5
ECONOMIC AND MONETARY
DEVELOPMENTS
The external environment of the euro area 9
Monetary and fi nancial developments 18
Prices and costs 45
Output, demand and the labour market 54
Boxes:
Recent developments in oil prices 1 13
The results of the euro area bank 2
lending survey for the second quarter
of 2012 21
Integrated euro area accounts for the 3
fi rst quarter of 2012 40
Results of the ECB Survey 4
of Professional Forecasters for the
third quarter of 2012 49
Adjustment processes within the euro 5
area: developments in Ireland, Greece,
Spain, Cyprus and Portugal 59
ARTICLES
Heterogeneity in euro area fi nancial
conditions and policy implications 63
Assessing the fi nancing conditions
of the euro area private sector during
the sovereign debt crisis 77
EURO AREA STATISTICS S1
ANNEXES
Chronology of monetary policy
measures of the Eurosystem I
Publications produced by the European
Central Bank V
Glossary V I I
CONTENTS
4ECB
Monthly Bulletin
August 2012
ABBREVIATIONS
COUNTRIES LU Luxembourg
BE Belgium HU Hungary
BG Bulgaria MT Malta
CZ Czech Republic NL Netherlands
DK Denmark AT Austria
DE Germany PL Poland
EE Estonia PT Portugal
IE Ireland RO Romania
GR Greece SI Slovenia
ES Spain SK Slovakia
FR France FI Finland
IT Italy SE Sweden
CY Cyprus UK United Kingdom
LV Latvia JP Japan
LT Lithuania US United States
OTHERS
BIS Bank for International Settlements
b.o.p. balance of payments
BPM5 IMF Balance of Payments Manual (5th edition)
CD certifi cate of deposit
c.i.f. cost, insurance and freight at the importer’s border
CPI Consumer Price Index
ECB European Central Bank
EER effective exchange rate
EMI European Monetary Institute
EMU Economic and Monetary Union
ESA 95 European System of Accounts 1995
ESCB European System of Central Banks
EU European Union
EUR euro
f.o.b. free on board at the exporter’s border
GDP gross domestic product
HICP Harmonised Index of Consumer Prices
HWWI Hamburg Institute of International Economics
ILO International Labour Organization
IMF International Monetary Fund
MFI monetary fi nancial institution
NACE statistical classifi cation of economic activities in the European Union
NCB national central bank
OECD Organisation for Economic Co-operation and Development
PPI Producer Price Index
SITC Rev. 4 Standard International Trade Classifi cation (revision 4)
ULCM unit labour costs in manufacturing
ULCT unit labour costs in the total economy
In accordance with EU practice, the EU countries are listed in this Bulletin using the alphabetical order of the country names in the national languages.
5ECB
Monthly Bulletin
August 2012
Based on its regular economic and monetary
analyses, the Governing Council decided at
its meeting on 2 August to keep the key ECB
interest rates unchanged, following the decrease
of 25 basis points in July. As stated in July,
infl ation should decline further in the course of
2012 and be below 2% again in 2013. Consistent
with this picture, the underlying pace of
monetary expansion remains subdued. Infl ation
expectations for the euro area economy continue
to be fi rmly anchored in line with the Governing
Council’s aim of maintaining infl ation rates
below, but close to, 2% over the medium term.
At the same time, economic growth in the euro
area remains weak, with the ongoing tensions
in fi nancial markets and heightened uncertainty
weighing on confi dence and sentiment. A further
intensifi cation of fi nancial market tensions has
the potential to affect the balance of risks for
both growth and infl ation on the downside.
The Governing Council extensively discussed
the policy options to address the severe
malfunctioning in the price formation process
in the bond markets of euro area countries.
Exceptionally high risk premia are observed
in government bond prices in several countries
and fi nancial fragmentation hinders the effective
working of monetary policy. Risk premia that are
related to fears of the reversibility of the euro are
unacceptable, and they need to be addressed in a
fundamental manner. The euro is irreversible.
In order to create the fundamental conditions
for such risk premia to disappear, policy-makers
in the euro area need to push ahead with fi scal
consolidation, structural reform and European
institution-building with great determination.
As implementation takes time and fi nancial
markets often only adjust once success becomes
clearly visible, governments must stand ready to
activate the EFSF/ESM in the bond market when
exceptional fi nancial market circumstances and
risks to fi nancial stability exist – with strict
and effective conditionality in line with the
established guidelines.
The adherence of governments to their
commitments and the fulfi lment by the EFSF/ESM
of their role are necessary conditions. The
Governing Council, within its mandate to
maintain price stability over the medium
term and in observance of its independence in
determining monetary policy, may undertake
outright open market operations of a size
adequate to reach its objective. In this context,
the concerns of private investors about seniority
will be addressed. Furthermore, the Governing
Council may consider undertaking further
non-standard monetary policy measures
according to what is required to repair monetary
policy transmission. Over the coming weeks,
the Eurosystem will design the appropriate
modalities for such policy measures.
With regard to the economic analysis, on a
quarterly basis, euro area real GDP growth
was fl at in the fi rst quarter of 2012, following
a decline of 0.3% in the previous quarter.
Economic indicators point to weak economic
activity in the second quarter of 2012 and at the
beginning of the third quarter, in an environment
of heightened uncertainty. Looking beyond
the short term, the Governing Council expects
the euro area economy to recover only very
gradually, with growth momentum being further
dampened by a number of factors. In particular,
tensions in some euro area sovereign debt
markets and their impact on fi nancing conditions,
the process of balance sheet adjustment in the
fi nancial and non-fi nancial sectors and high
unemployment are expected to weigh on the
underlying growth momentum, which is also
affected by the ongoing global slowdown.
The risks surrounding the economic outlook for
the euro area continue to be on the downside.
They relate, in particular, to the tensions
in several euro area fi nancial markets and
their potential spillover to the euro area real
economy. Downside risks also relate to possible
renewed increases in energy prices over the
medium term.
Euro area annual HICP infl ation was 2.4% in
July 2012, according to Eurostat’s fl ash estimate,
unchanged from the previous month. On the
basis of current futures prices for oil, infl ation
EDITORIAL
6ECB
Monthly Bulletin
August 2012
rates should decline further in the course of 2012
and be below 2% again in 2013. Over the policy-
relevant horizon, in an environment of modest
growth in the euro area and well-anchored long-
term infl ation expectations, underlying price
pressures should remain moderate.
Risks to the outlook for price developments
continue to be broadly balanced over the
medium term. Upside risks pertain to further
increases in indirect taxes, owing to the need for
fi scal consolidation, and higher than expected
energy prices over the medium term. The main
downside risks relate to the impact of weaker
than expected growth in the euro area, in
particular resulting from a further intensifi cation
of fi nancial market tensions. Such intensifi cation
has the potential to affect the balance of risks on
the downside.
Turning to the monetary analysis, the underlying
pace of monetary expansion remained subdued.
The annual growth rate of M3 stood at 3.2%
in June 2012, slightly higher than the 3.1%
observed in the previous month and close to
the rate observed at the end of the fi rst quarter.
Overall, infl ows into broad money in the second
quarter were weak. Annual growth in M1
increased further to 3.5% in June, in line with
the increased preference of investors for liquid
instruments in an environment of low interest
rates and high uncertainty.
The annual growth rate of loans to the private
sector (adjusted for loan sales and securitisation)
declined to 0.3% in June (from 0.5% in May).
As net redemptions of loans to non-fi nancial
corporations and households (both adjusted for
loan sales and securitisation) were observed in
June, the annual growth rates of loans to both
non-fi nancial corporations and households
(adjusted for loan sales and securitisation)
decreased further in June, to -0.3% and 1.1%
respectively. To a large extent, subdued loan
growth refl ects the current cyclical situation,
heightened risk aversion and the ongoing
adjustment in the balance sheets of households
and enterprises, all of which weigh on credit
demand. A considerable contribution of demand
factors to weak MFI loan growth is confi rmed
by the euro area bank lending survey for the
second quarter of 2012. This survey also shows
that the net tightening of banks’ credit standards
at the euro area level was broadly stable in the
second quarter of 2012, as compared with the
previous quarter, for loans to both enterprises
and households.
Looking ahead, it is essential for banks to
continue to strengthen their resilience where
this is needed. The soundness of banks’ balance
sheets will be a key factor in facilitating both an
appropriate provision of credit to the economy
and the normalisation of all funding channels.
To sum up, the economic analysis indicates
that price developments should remain in line
with price stability over the medium term. A
cross-check with the signals from the monetary
analysis confi rms this picture.
While signifi cant progress has been achieved
with fi scal consolidation over recent years,
further decisive and urgent steps need to be
taken to improve competitiveness. From 2009 to
2011, euro area countries, on average, reduced
the defi cit-to-GDP ratio by 2.3 percentage
points, and the primary defi cit improved by
about 2½ percentage points. Fiscal adjustment
in the euro area is continuing in 2012, and it
is indeed crucial that efforts are maintained
to restore sound fi scal positions. At the same
time, structural reforms are as essential as fi scal
consolidation efforts and the measures to repair
the fi nancial sector. Some progress has also
been made in this area. For example, unit labour
costs and current account developments have
started to undergo a correction process in most
of the countries strongly affected by the crisis.
However, further reform measures need to be
implemented swiftly and decisively. Product
market reforms to foster competitiveness and
the creation of effi cient and fl exible labour
markets are preconditions for the unwinding
of existing imbalances and the achievement of
robust, sustainable growth. It is now crucial that
Member States implement their country-specifi c
recommendations with determination.
7ECB
Monthly Bulletin
August 2012
EDITORIAL
This issue of the Monthly Bulletin contains
two articles. The fi rst article reviews the
sources of heterogeneity in fi nancial conditions,
discusses the related challenges for the single
monetary policy and clarifi es the role of other
policies in overcoming structural imbalances
and divergences. The second article assesses
the fi nancing conditions of the euro area private
sector during the sovereign debt crisis.

9ECB
Monthly Bulletin
August 2012
ECONOMIC AND MONETARYDEVELOPMENTS
The external
environment
of the euro area
ECONOMIC AND MONETARY DEVELOPMENTS
1 THE EXTERNAL ENVIRONMENT OF THE EURO AREA
The recovery in the global economy continues to proceed, albeit unevenly, gradually and subject to considerable fragilities. Having moderated in the second quarter of 2012, weak global growth momentum appears to have continued into the third quarter of the year, particularly in Europe. Global infl ation has continued to ease in recent months, mainly in response to receding commodity prices in the fi rst half of the year.
1.1 DEVELOPMENTS IN THE WORLD ECONOMY
Global growth remains gradual, diverse across regions and subject to considerable fragilities.
The recent release of real GDP growth data for the second quarter in some major economies has
corroborated the fl ow of economic data indicators which had been indicating a moderation in
the growth momentum in the global economy. According to the latest survey data, weak growth
dynamics have continued into the start of the third quarter of 2012, particularly in Europe.
In July the global manufacturing PMI for output posted a small decline to 48.9, from 49.6 in June
(see Chart 1). Europe remained the primary source of weakness, but the decrease in the PMI was
also associated with a decrease in the global PMI index excluding the euro area. Overall, persistent
structural impediments continue to restrain the pace of growth in most advanced economies.
In emerging markets, activity has continued to expand at a faster pace than in advanced economies,
although growth momentum has also been receding on account of past policy tightening and weaker
external demand.
Global infl ation has continued to ease in recent months. In the OECD area, consumer price infl ation
fell to 2.0% in the year to June, from 2.1% in May, compared with a peak of 3.3% recorded in
September last year (see Chart 2). Excluding food and energy, the annual rate of infl ation declined
to 1.8% in June, compared with 1.9% in May. In several emerging markets, annual rates of infl ation
have continued to decline in June.
Chart 1 Global PMI output
(diffusion index; seasonally adjusted; monthly data)
25
30
35
40
45
50
55
60
65
25
30
35
40
45
50
55
60
65
2004 2005 2006 2007 2008 2009 2010 2011 2012
PMI output: overall
PMI output: manufacturing
PMI output: services
Source: Markit.
Chart 2 International price developments
(monthly data; annual percentage changes)
-1
0
1
2
3
4
5
-1
0
1
2
3
4
5
2004 2005 2006 2007 2008 2009 2010 2011 2012
OECD consumer prices (all items)
OECD consumer prices (all items excluding food
and energy)
Source: OECD.
10ECB
Monthly Bulletin
August 2012
UNITED STATES
In the United States, economic growth slowed in the second quarter of 2012. According to the
advance estimate by the Bureau of Economic Analysis, real GDP increased at an annualised rate
of 1.5% (0.4% quarter on quarter) in the second quarter of 2012, down from 2% in the previous
quarter. The slowdown was primarily due to lower consumption growth – dragged down by a
decline in the durable goods component – but also to another decline in government spending and a
negative net trade contribution (although both exports and imports accelerated). On the other hand,
the contribution of inventories turned positive. Both non-residential and residential investment
increased substantially in the second quarter (albeit at a slower pace than in the fi rst quarter).
Real disposable personal income increased by 3.2% in the second quarter, thereby raising the
personal saving rate to 4%, from 3.6% in the fi rst quarter. The release included data revisions back
to 2009, which show that, for the period 2008-11, real GDP growth was, on average, lower (at an
annualised rate of 0.3%, compared with the 0.4% previously published). The percentage change
in real GDP was revised upwards by 0.4 percentage point for 2009, down by 0.6 percentage point
for 2010, and up by 0.1 percentage point for 2011, thus showing that the 2009 recession was less
pronounced, whereas the recovery in 2010 was weaker.
In June annual CPI infl ation remained unchanged at 1.7%. CPI infl ation continues to be held down
by the decline in energy prices, which fell by 3.9% in both May and June, compared with the same
months of last year. Also on a yearly basis, food price increases continued to ease further until June,
standing at 2.7% and down from a peak of 4.7% in October 2011. Excluding these components,
core infl ation declined to 2.2%, after remaining at 2.3% for the previous three months. The decline
in core infl ation is explained by lower price increases in apparel, cars and shelter. For the second
quarter of 2012 as a whole, annual CPI averaged 1.9%, down from 2.8% in the fi rst quarter.
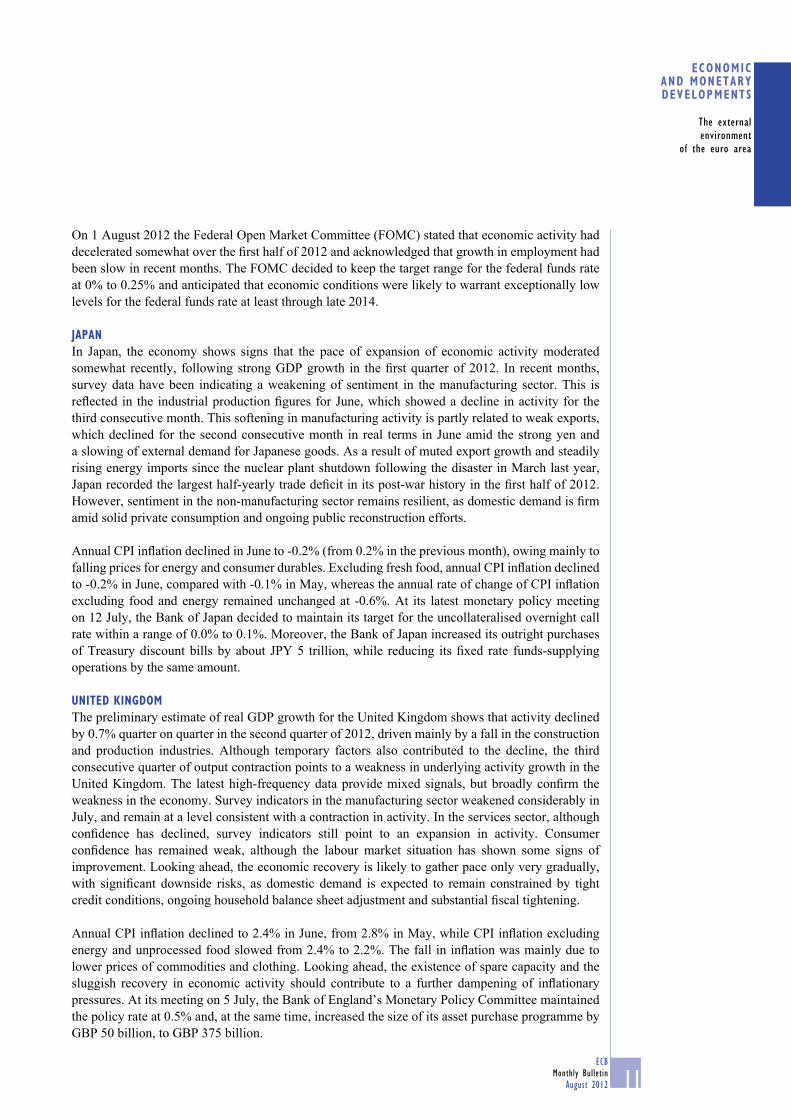
Chart 3 Main developments in major industrialised economies
euro area
United States
Japan
United Kingdom
Output growth 1)
(quarter-on-quarter percentage changes; quarterly data)
Inflation rates 2)
(consumer prices; annual percentage changes; monthly data)
-4
-3
-2
-1
0
1
2
-4
-3
-2
-1
0
1
2
2004 2005 2006 2007 2008 2009 2010 2011 2012-3
-2
-1
0
1
2
3
4
5
6
-3
-2
-1
0
1
2
3
4
5
6
2004 2005 2006 2007 2008 2009 2010 2011 2012
Sources: National data, BIS, Eurostat and ECB calculations.1) Eurostat data are used for the euro area and the United Kingdom; national data are used for the United States and Japan. GDP fi gures have been seasonally adjusted.2) HICP for the euro area and the United Kingdom; CPI for the United States and Japan.
11ECB
Monthly Bulletin
August 2012
ECONOMIC AND MONETARYDEVELOPMENTS
The external
environment
of the euro area
On 1 August 2012 the Federal Open Market Committee (FOMC) stated that economic activity had
decelerated somewhat over the fi rst half of 2012 and acknowledged that growth in employment had
been slow in recent months. The FOMC decided to keep the target range for the federal funds rate
at 0% to 0.25% and anticipated that economic conditions were likely to warrant exceptionally low
levels for the federal funds rate at least through late 2014.
JAPAN
In Japan, the economy shows signs that the pace of expansion of economic activity moderated
somewhat recently, following strong GDP growth in the fi rst quarter of 2012. In recent months,
survey data have been indicating a weakening of sentiment in the manufacturing sector. This is
refl ected in the industrial production fi gures for June, which showed a decline in activity for the
third consecutive month. This softening in manufacturing activity is partly related to weak exports,
which declined for the second consecutive month in real terms in June amid the strong yen and
a slowing of external demand for Japanese goods. As a result of muted export growth and steadily
rising energy imports since the nuclear plant shutdown following the disaster in March last year,
Japan recorded the largest half-yearly trade defi cit in its post-war history in the fi rst half of 2012.
However, sentiment in the non-manufacturing sector remains resilient, as domestic demand is fi rm
amid solid private consumption and ongoing public reconstruction efforts.
Annual CPI infl ation declined in June to -0.2% (from 0.2% in the previous month), owing mainly to
falling prices for energy and consumer durables. Excluding fresh food, annual CPI infl ation declined
to -0.2% in June, compared with -0.1% in May, whereas the annual rate of change of CPI infl ation
excluding food and energy remained unchanged at -0.6%. At its latest monetary policy meeting
on 12 July, the Bank of Japan decided to maintain its target for the uncollateralised overnight call
rate within a range of 0.0% to 0.1%. Moreover, the Bank of Japan increased its outright purchases
of Treasury discount bills by about JPY 5 trillion, while reducing its fi xed rate funds-supplying
operations by the same amount.
UNITED KINGDOM
The preliminary estimate of real GDP growth for the United Kingdom shows that activity declined
by 0.7% quarter on quarter in the second quarter of 2012, driven mainly by a fall in the construction
and production industries. Although temporary factors also contributed to the decline, the third
consecutive quarter of output contraction points to a weakness in underlying activity growth in the
United Kingdom. The latest high-frequency data provide mixed signals, but broadly confi rm the
weakness in the economy. Survey indicators in the manufacturing sector weakened considerably in
July, and remain at a level consistent with a contraction in activity. In the services sector, although
confi dence has declined, survey indicators still point to an expansion in activity. Consumer
confi dence has remained weak, although the labour market situation has shown some signs of
improvement. Looking ahead, the economic recovery is likely to gather pace only very gradually,
with signifi cant downside risks, as domestic demand is expected to remain constrained by tight
credit conditions, ongoing household balance sheet adjustment and substantial fi scal tightening.
Annual CPI infl ation declined to 2.4% in June, from 2.8% in May, while CPI infl ation excluding
energy and unprocessed food slowed from 2.4% to 2.2%. The fall in infl ation was mainly due to
lower prices of commodities and clothing. Looking ahead, the existence of spare capacity and the
sluggish recovery in economic activity should contribute to a further dampening of infl ationary
pressures. At its meeting on 5 July, the Bank of England’s Monetary Policy Committee maintained
the policy rate at 0.5% and, at the same time, increased the size of its asset purchase programme by
GBP 50 billion, to GBP 375 billion.
12ECB
Monthly Bulletin
August 2012
CHINA
In China, recent data releases confi rm that economic activity has slowed down. In the second quarter
of 2012, real GDP growth slowed from a year ago, to 7.6%, down from 8.1% in the fi rst quarter.
In quarter-on-quarter terms, growth accelerated slightly to 1.8%, from 1.6%, driven by consumption
and investment. The contribution of net exports remained slightly negative. HSBC’s manufacturing
PMI index rose from 48.2 in June to 49.3 in July, its highest level since February. For the fi rst time
since October 2011, the number of cities reporting house price increases in June, compared with
May, was larger than those reporting declines, suggesting that house prices could have bottomed
out. Sold fl oor space also seems to be close to stabilising. In June, exports rose by much more
than imports, compared with a year ago (11.3%, compared with 6.3%), leading to a sharply higher
trade balance. However, the 12-month rolling trade balance stayed within the range observed since
early 2010. Annual CPI infl ation continued to decline in June, to 2.2%. On 25 July the Hong Kong
Monetary Authority announced that Hong Kong banks could start offering a full range of renminbi
services to non-residents starting on 1 August, including the unlimited exchange of renminbi against
Hong Kong dollars and vice versa. This is part of a series of moves to establish Hong Kong as one
of the main off-shore trading centres for renminbi.
1.2 COMMODITY MARKETS
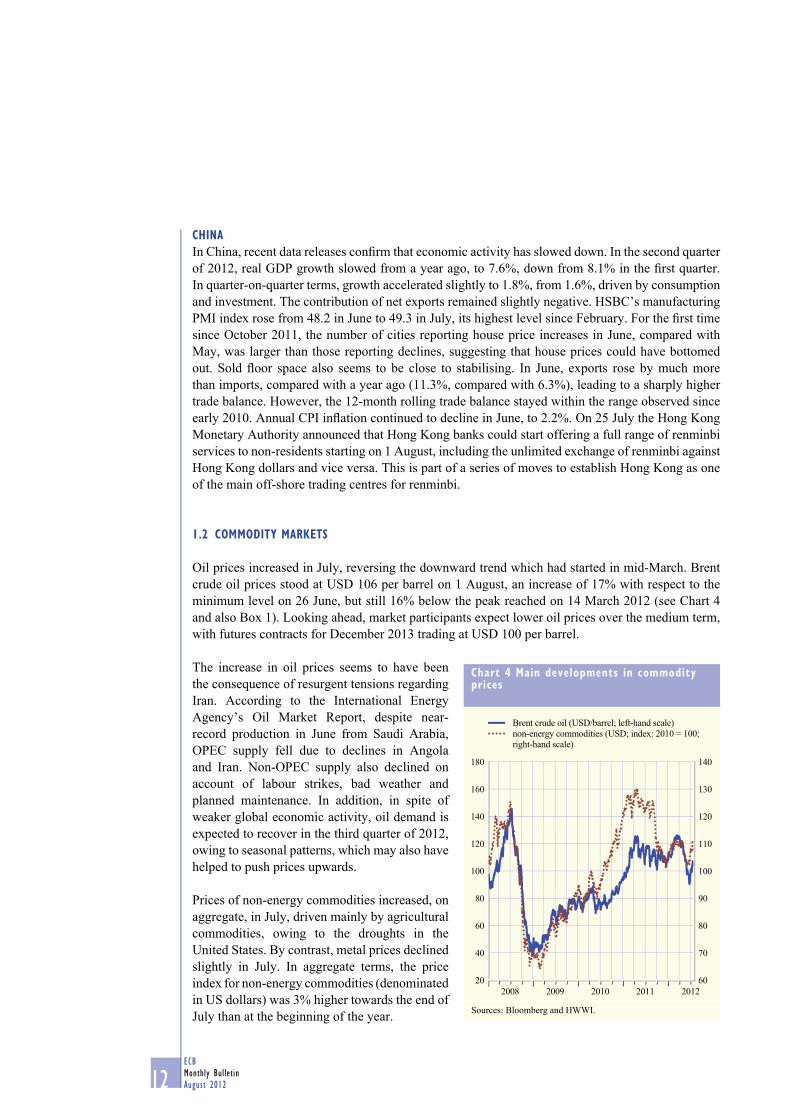
Oil prices increased in July, reversing the downward trend which had started in mid-March. Brent
crude oil prices stood at USD 106 per barrel on 1 August, an increase of 17% with respect to the
minimum level on 26 June, but still 16% below the peak reached on 14 March 2012 (see Chart 4
and also Box 1). Looking ahead, market participants expect lower oil prices over the medium term,
with futures contracts for December 2013 trading at USD 100 per barrel.
The increase in oil prices seems to have been
the consequence of resurgent tensions regarding
Iran. According to the International Energy
Agency’s Oil Market Report, despite near-
record production in June from Saudi Arabia,
OPEC supply fell due to declines in Angola
and Iran. Non-OPEC supply also declined on
account of labour strikes, bad weather and
planned maintenance. In addition, in spite of
weaker global economic activity, oil demand is
expected to recover in the third quarter of 2012,
owing to seasonal patterns, which may also have
helped to push prices upwards.
Prices of non-energy commodities increased, on
aggregate, in July, driven mainly by agricultural
commodities, owing to the droughts in the
United States. By contrast, metal prices declined
slightly in July. In aggregate terms, the price
index for non-energy commodities (denominated
in US dollars) was 3% higher towards the end of
July than at the beginning of the year.
Chart 4 Main developments in commodity prices
2008
20
40
60
80
100
120
140
160
180
60
70
80
90
100
110
120
130
140
2009 2010 2011 2012
Brent crude oil (USD/barrel; left-hand scale)
non-energy commodities (USD; index: 2010 = 100;
right-hand scale)
Sources: Bloomberg and HWWI.
13ECB
Monthly Bulletin
August 2012
ECONOMIC AND MONETARYDEVELOPMENTS
The external
environment
of the euro area
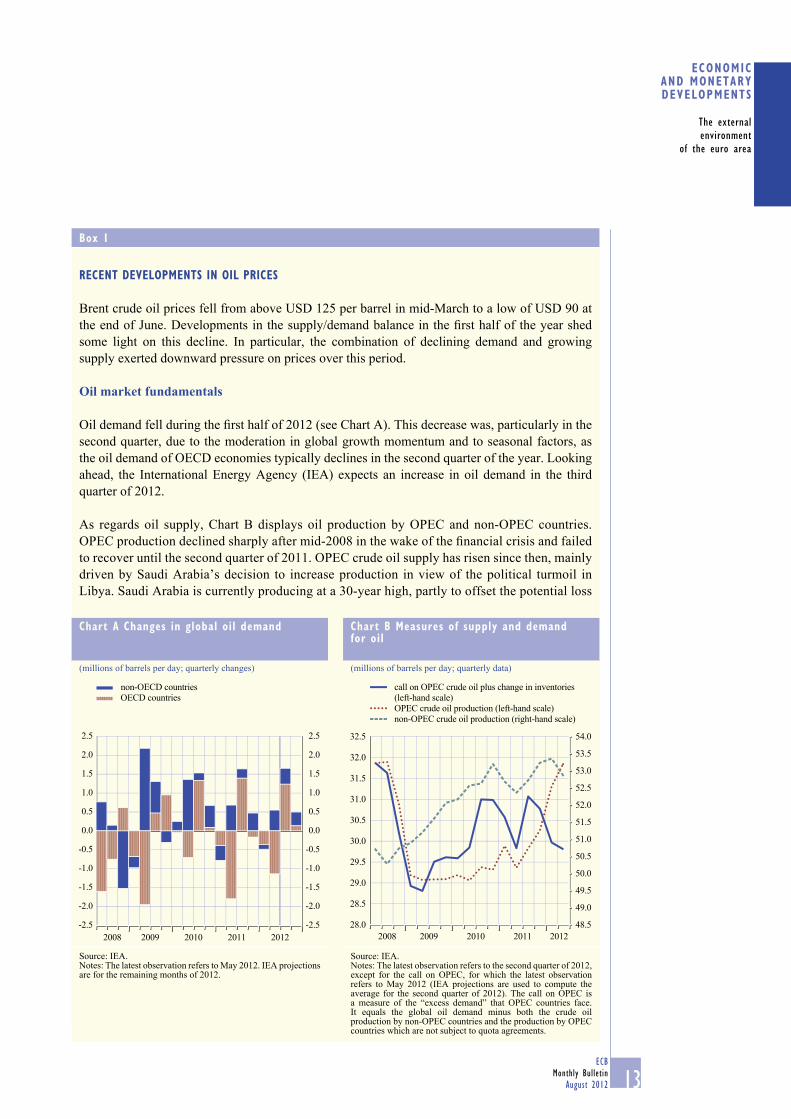
Box 1
RECENT DEVELOPMENTS IN OIL PRICES
Brent crude oil prices fell from above USD 125 per barrel in mid-March to a low of USD 90 at
the end of June. Developments in the supply/demand balance in the fi rst half of the year shed
some light on this decline. In particular, the combination of declining demand and growing
supply exerted downward pressure on prices over this period.
Oil market fundamentals
Oil demand fell during the fi rst half of 2012 (see Chart A). This decrease was, particularly in the
second quarter, due to the moderation in global growth momentum and to seasonal factors, as
the oil demand of OECD economies typically declines in the second quarter of the year. Looking
ahead, the International Energy Agency (IEA) expects an increase in oil demand in the third
quarter of 2012.
As regards oil supply, Chart B displays oil production by OPEC and non-OPEC countries.
OPEC production declined sharply after mid-2008 in the wake of the fi nancial crisis and failed
to recover until the second quarter of 2011. OPEC crude oil supply has risen since then, mainly
driven by Saudi Arabia’s decision to increase production in view of the political turmoil in
Libya. Saudi Arabia is currently producing at a 30-year high, partly to offset the potential loss
Chart A Changes in global oil demand
(millions of barrels per day; quarterly changes)
-2.5
-2.0
-1.5
-1.0
-0.5
0.0
0.5
1.0
1.5
2.0
2.5
-2.5
-2.0
-1.5
-1.0
-0.5
0.0
0.5
1.0
1.5
2.0
2.5
2008 2009 2010 2011 2012
non-OECD countries
OECD countries
Source: IEA.Notes: The latest observation refers to May 2012. IEA projections are for the remaining months of 2012.
Chart B Measures of supply and demand for oil
(millions of barrels per day; quarterly data)
48.5
49.0
49.5
50.0
50.5
51.0
51.5
52.0
52.5
53.0
53.5
54.0
28.0
2008 2009 2010 2011 2012
28.5
29.0
29.5
30.0
30.5
31.0
31.5
32.0
32.5
call on OPEC crude oil plus change in inventories
(left-hand scale)
OPEC crude oil production (left-hand scale)
non-OPEC crude oil production (right-hand scale)
Source: IEA.Notes: The latest observation refers to the second quarter of 2012, except for the call on OPEC, for which the latest observation refers to May 2012 (IEA projections are used to compute the average for the second quarter of 2012). The call on OPEC is a measure of the “excess demand” that OPEC countries face. It equals the global oil demand minus both the crude oil production by non-OPEC countries and the production by OPEC countries which are not subject to quota agreements.
14ECB
Monthly Bulletin
August 2012
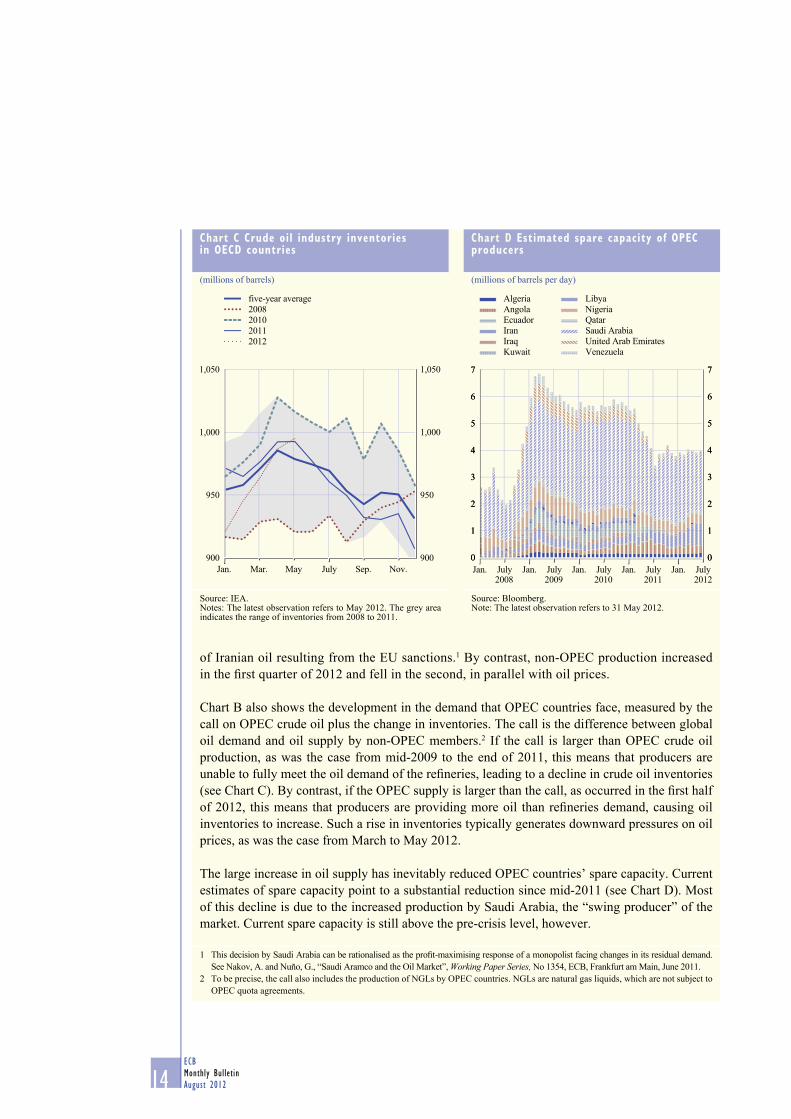
of Iranian oil resulting from the EU sanctions.1 By contrast, non-OPEC production increased
in the fi rst quarter of 2012 and fell in the second, in parallel with oil prices.
Chart B also shows the development in the demand that OPEC countries face, measured by the
call on OPEC crude oil plus the change in inventories. The call is the difference between global
oil demand and oil supply by non-OPEC members.2 If the call is larger than OPEC crude oil
production, as was the case from mid-2009 to the end of 2011, this means that producers are
unable to fully meet the oil demand of the refi neries, leading to a decline in crude oil inventories
(see Chart C). By contrast, if the OPEC supply is larger than the call, as occurred in the fi rst half
of 2012, this means that producers are providing more oil than refi neries demand, causing oil
inventories to increase. Such a rise in inventories typically generates downward pressures on oil
prices, as was the case from March to May 2012.
The large increase in oil supply has inevitably reduced OPEC countries’ spare capacity. Current
estimates of spare capacity point to a substantial reduction since mid-2011 (see Chart D). Most
of this decline is due to the increased production by Saudi Arabia, the “swing producer” of the
market. Current spare capacity is still above the pre-crisis level, however.
1 This decision by Saudi Arabia can be rationalised as the profi t-maximising response of a monopolist facing changes in its residual demand.
See Nakov, A. and Nuño, G., “Saudi Aramco and the Oil Market”, Working Paper Series, No 1354, ECB, Frankfurt am Main, June 2011.
2 To be precise, the call also includes the production of NGLs by OPEC countries. NGLs are natural gas liquids, which are not subject to
OPEC quota agreements.
Chart C Crude oil industry inventories in OECD countries
(millions of barrels)
900
950
1,000
1,050
900
950
1,000
1,050
Jan. Mar. May July Sep. Nov.
five-year average
2008
2010
2011
2012
Source: IEA.Notes: The latest observation refers to May 2012. The grey area indicates the range of inventories from 2008 to 2011.
Chart D Estimated spare capacity of OPEC producers
(millions of barrels per day)
00
11
22
33
44
55
66
77
00
11
22
33
44
55
66
77
Jan. July2008 2009 2010 2011 2012
Jan. July Jan. July Jan. July Jan. July
Algeria
Angola
Ecuador
Iran
Iraq
Kuwait
Libya
Nigeria
Qatar
Saudi Arabia
United Arab Emirates
Venezuela
Source: Bloomberg.Note: The latest observation refers to 31 May 2012.
15ECB
Monthly Bulletin
August 2012
ECONOMIC AND MONETARYDEVELOPMENTS
The external
environment
of the euro area
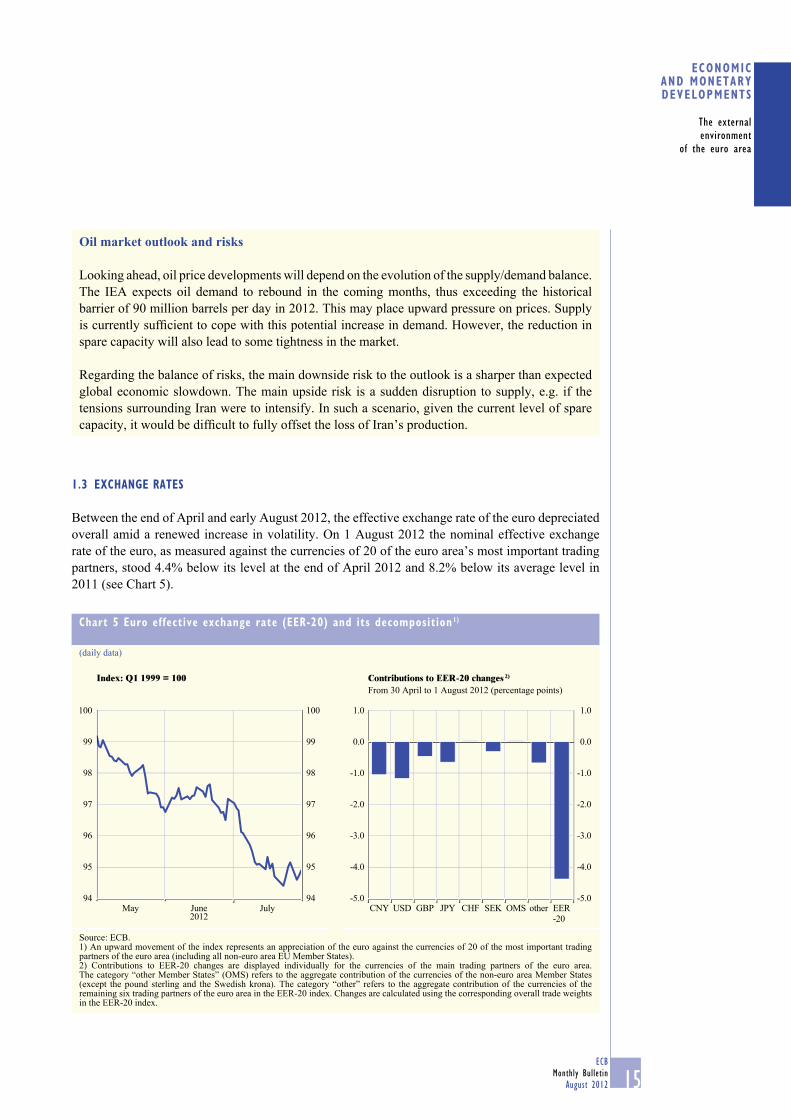
1.3 EXCHANGE RATES
Between the end of April and early August 2012, the effective exchange rate of the euro depreciated
overall amid a renewed increase in volatility. On 1 August 2012 the nominal effective exchange
rate of the euro, as measured against the currencies of 20 of the euro area’s most important trading
partners, stood 4.4% below its level at the end of April 2012 and 8.2% below its average level in
2011 (see Chart 5).
Oil market outlook and risks
Looking ahead, oil price developments will depend on the evolution of the supply/demand balance.
The IEA expects oil demand to rebound in the coming months, thus exceeding the historical
barrier of 90 million barrels per day in 2012. This may place upward pressure on prices. Supply
is currently suffi cient to cope with this potential increase in demand. However, the reduction in
spare capacity will also lead to some tightness in the market.
Regarding the balance of risks, the main downside risk to the outlook is a sharper than expected
global economic slowdown. The main upside risk is a sudden disruption to supply, e.g. if the
tensions surrounding Iran were to intensify. In such a scenario, given the current level of spare
capacity, it would be diffi cult to fully offset the loss of Iran’s production.
Chart 5 Euro effective exchange rate (EER-20) and its decomposition 1)
(daily data)
Index: Q1 1999 = 100 Contributions to EER-20 changes 2)
From 30 April to 1 August 2012 (percentage points)
94
95
96
97
98
99
100
94
95
96
97
98
99
100
May2012June July
-5.0
-4.0
-3.0
-2.0
-1.0
1.0
0.0
-5.0
-4.0
-3.0
-2.0
-1.0
1.0
0.0
CNY USD GBP JPY CHF SEK OMS other EER
-20
Source: ECB.1) An upward movement of the index represents an appreciation of the euro against the currencies of 20 of the most important trading partners of the euro area (including all non-euro area EU Member States).2) Contributions to EER-20 changes are displayed individually for the currencies of the main trading partners of the euro area. The category “other Member States” (OMS) refers to the aggregate contribution of the currencies of the non-euro area Member States (except the pound sterling and the Swedish krona). The category “other” refers to the aggregate contribution of the currencies of the remaining six trading partners of the euro area in the EER-20 index. Changes are calculated using the corresponding overall trade weights in the EER-20 index.
16ECB
Monthly Bulletin
August 2012
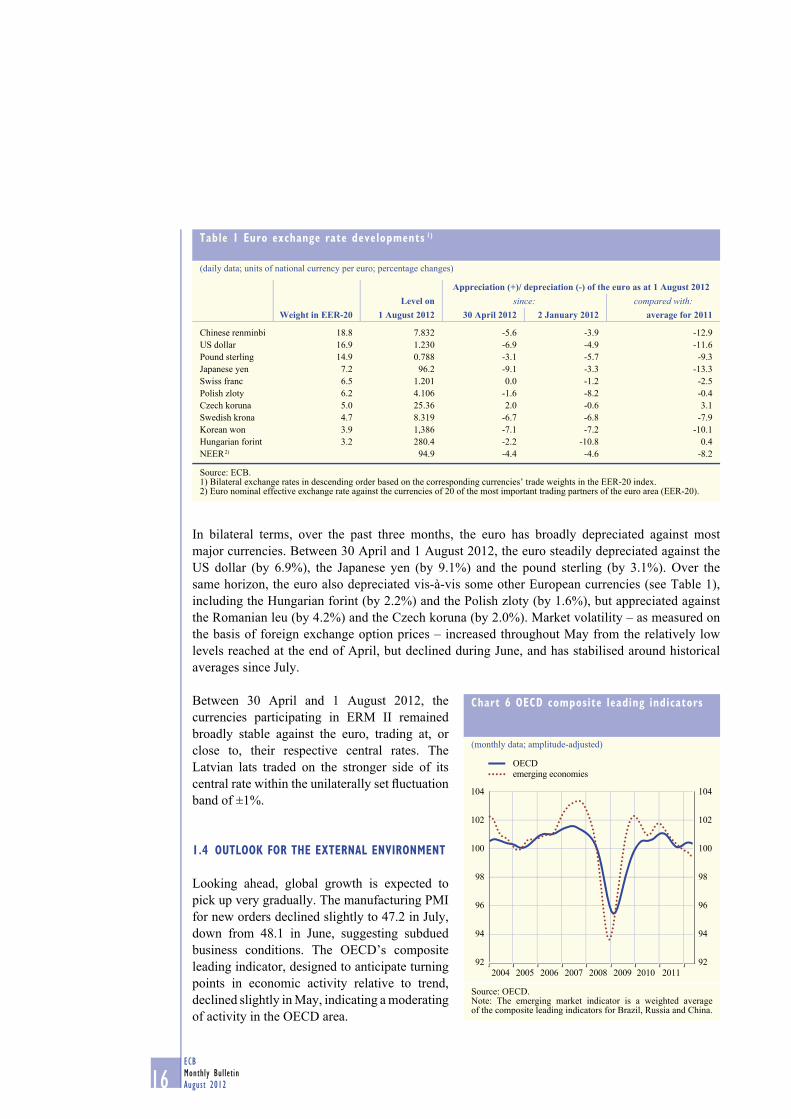
In bilateral terms, over the past three months, the euro has broadly depreciated against most
major currencies. Between 30 April and 1 August 2012, the euro steadily depreciated against the
US dollar (by 6.9%), the Japanese yen (by 9.1%) and the pound sterling (by 3.1%). Over the
same horizon, the euro also depreciated vis-à-vis some other European currencies (see Table 1),
including the Hungarian forint (by 2.2%) and the Polish zloty (by 1.6%), but appreciated against
the Romanian leu (by 4.2%) and the Czech koruna (by 2.0%). Market volatility – as measured on
the basis of foreign exchange option prices – increased throughout May from the relatively low
levels reached at the end of April, but declined during June, and has stabilised around historical
averages since July.
Between 30 April and 1 August 2012, the
currencies participating in ERM II remained
broadly stable against the euro, trading at, or
close to, their respective central rates. The
Latvian lats traded on the stronger side of its
central rate within the unilaterally set fl uctuation
band of ±1%.
1.4 OUTLOOK FOR THE EXTERNAL ENVIRONMENT
Looking ahead, global growth is expected to
pick up very gradually. The manufacturing PMI
for new orders declined slightly to 47.2 in July,
down from 48.1 in June, suggesting subdued
business conditions. The OECD’s composite
leading indicator, designed to anticipate turning
points in economic activity relative to trend,
declined slightly in May, indicating a moderating
of activity in the OECD area.
Table 1 Euro exchange rate developments 1)
(daily data; units of national currency per euro; percentage changes)
Weight in EER-20Level on
Appreciation (+)/ depreciation (-) of the euro as at 1 August 2012since: compared with:
1 August 2012 30 April 2012 2 January 2012 average for 2011
Chinese renminbi 18.8 7.832 -5.6 -3.9 -12.9
US dollar 16.9 1.230 -6.9 -4.9 -11.6
Pound sterling 14.9 0.788 -3.1 -5.7 -9.3
Japanese yen 7.2 96.2 -9.1 -3.3 -13.3
Swiss franc 6.5 1.201 0.0 -1.2 -2.5
Polish zloty 6.2 4.106 -1.6 -8.2 -0.4
Czech koruna 5.0 25.36 2.0 -0.6 3.1
Swedish krona 4.7 8.319 -6.7 -6.8 -7.9
Korean won 3.9 1,386 -7.1 -7.2 -10.1
Hungarian forint 3.2 280.4 -2.2 -10.8 0.4
NEER 2) 94.9 -4.4 -4.6 -8.2
Source: ECB. 1) Bilateral exchange rates in descending order based on the corresponding currencies’ trade weights in the EER-20 index. 2) Euro nominal effective exchange rate against the currencies of 20 of the most important trading partners of the euro area (EER-20).
Chart 6 OECD composite leading indicators
(monthly data; amplitude-adjusted)
92
94
96
98
100
102
104
92
94
96
98
100
102
104
2011
OECDemerging economies
2004 2005 2006 2007 2008 2009 2010
Source: OECD.Note: The emerging market indicator is a weighted average of the composite leading indicators for Brazil, Russia and China.
17ECB
Monthly Bulletin
August 2012
ECONOMIC AND MONETARYDEVELOPMENTS
The external
environment
of the euro area
The outlook for the external environment of the euro area remains subject to high uncertainty,
related to tensions in key fi nancial market segments as well as fi scal and global imbalances.
Moreover, geopolitical tensions in the Middle East pose an upside risk to oil prices and a downside
risk to the global economy.

18ECB
Monthly Bulletin
August 2012
2 MONETARY AND FINANCIAL DEVELOPMENTS
2.1 MONEY AND MFI CREDIT
June monetary data point to subdued underlying money and credit growth. M1 was the only subcomponent of M3 that recorded an infl ow in June, displaying the money-holding sectors’ preference for liquidity. As regards the asset side of the consolidated MFI balance sheet, much of the current weakness in MFI lending can be explained by demand conditions, although constraints on the supply side persist in a number of euro area countries. In order to ensure the appropriate fi nancing of the economy once demand picks up, progress will need to be made with the adjustment of credit institutions’ balance sheets in these countries.
THE BROAD MONETARY AGGREGATE M3
The annual growth rate of M3 in the euro area remained broadly stable at 3.2% in June 2012, after
3.1% in May (see Chart 7). This marginal increase refl ected a contained monthly infl ow. When
looking beyond the volatility of monthly M3 fl ows in the second quarter of 2012, developments
in June confi rmed the fading-out of the monetary growth impulses observed between January
and March 2012. In contrast to May, the volume of secured interbank transactions conducted via
central counterparties (CCPs) was small and only marginally affected the monthly fl ow of M3.
Adjusted for the impact of such transactions, the annual growth rate of M3 stood at 3.0% in June
and was broadly unchanged in comparison with May. Shifts within M3 favoured liquid instruments
contained in M1 in an environment of low interest rates and high uncertainty, confi rming the trend
observed in previous months.
Considering the counterparts of M3, the annual growth rate of MFI loans to both
non-fi nancial corporations and households continued to decline, in line with weak demand,
although the slowdown in some countries was also linked to supply constraints. By contrast, the
fl ow of credit to general government remained
strong in June. Furthermore, the shift towards
shorter maturities, as refl ected in, for example,
reductions in longer-term fi nancial liabilities,
continued to support M3 growth in June.
Altogether, the volume of euro area MFIs’ main
assets saw a marginal increase in June.
MAIN COMPONENTS OF M3
The most signifi cant contribution to the muted
monthly fl ow into M3 in June stemmed from the
most liquid monetary component M1, the annual
growth rate of which increased to 3.5%, up
from 3.3% in the previous month. In particular,
overnight deposits recorded notable infl ows,
refl ecting not only some temporary transactions
of non-monetary fi nancial intermediaries, but
also the shift of funds of non-fi nancial private
entities towards higher liquidity, mainly at
the expense of other components within M3.
Short-term deposits other than overnight
deposits (M2 minus M1) remained unchanged
in June, as infl ows in short-term saving deposits
Chart 7 M3 growth
(percentage changes; adjusted for seasonal and calendar effects)
-2
0
2
4
6
8
10
12
14
-2
0
2
4
6
8
10
12
14
1999 2001 2003 2005 2007 2009 2011
M3 (annual growth rate)
M3 (three-month centred moving average of the
annual growth rate)
M3 (six-month annualised growth rate)
Source: ECB.
19ECB
Monthly Bulletin
August 2012
ECONOMIC AND MONETARYDEVELOPMENTS
Monetary and
financial
developments
(redeemable at notice of up to three months) balanced outfl ows from short-term time deposits
(i.e. with an original maturity of up to two years) at the euro area level. As a consequence, the annual
growth rate of other short-term deposits remained at 2.3% in June, broadly unchanged from May.
Despite a stagnating monthly fl ow, the annual growth rate of marketable instruments (M3 minus
M2) increased to 5.1% in June, up from 4.5% in May. MFIs’ short-term debt securities (i.e. debt
securities with an original maturity of up to two years) was the only sub-component within
marketable instruments that recorded monthly infl ows in June, refl ecting purchases by investment
funds. This demand partly replaced the lower demand of money market funds (MMFs) for short-term
MFI debt securities. The lower demand by MMFs was due to the withdrawals of funds/shares from
MMFs in June. Repurchase agreements (repos) registered moderate withdrawals. The monthly fl ow
for secured interbank transactions conducted via CCPs was modest, but concealed heterogeneous
developments across countries. While heightened concerns about the banking systems in some
euro area Member States led to increasing volumes in collateralised interbank transactions, others
observed withdrawals from CCP repos as a result of lower needs for liquidity and collateral
considerations.
The annual growth rate of M3 deposits – which comprise short-term deposits and repurchase
agreements, and represent the broadest monetary aggregate for which a timely sectoral breakdown
is available – increased to 2.6% in June, up from 2.4% in May. In June, all sectors contributed
positively to the annual growth rate, most notably non-monetary fi nancial intermediaries other than
insurance corporations and pension funds (OFIs). At the same time, the household sector remained
the biggest contributor. Insurance corporations and pension funds, by contrast, registered a signifi cant
month-on-month reduction of relevant deposit holdings in June.
MAIN COUNTERPARTS OF M3
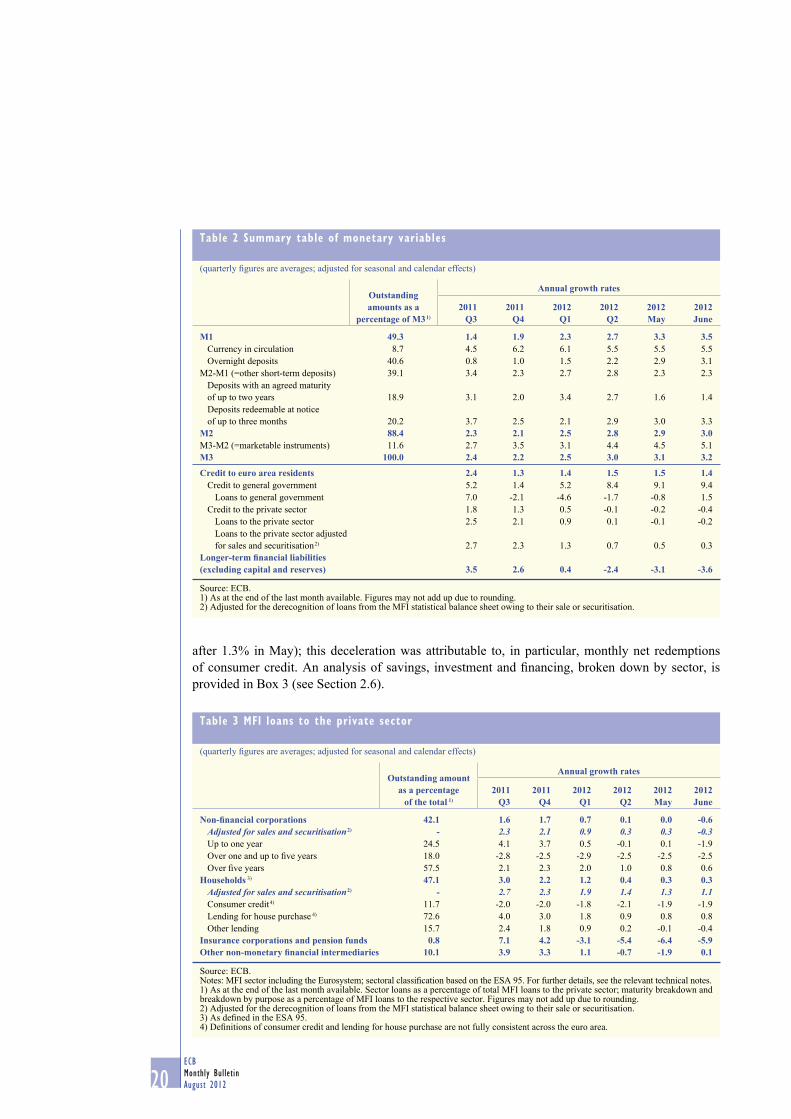
As regards the counterparts of M3, the annual growth rate of MFI credit to euro area residents
remained broadly unchanged at 1.4% in June, refl ecting, however, divergent developments in
its main components (see Table 2). On the one hand, the annual growth rate of credit to general
government increased in June, to 9.4%, up from 9.1% in May. This increase refl ected primarily
a positive monthly fl ow for loans to general government and, to a lesser extent, for purchases of
government securities by MFIs.
On the other hand, credit to the private sector continued to decline in June, with its annual growth
rate remaining in negative territory (standing at -0.4%, down from -0.2% in May) (see Chart 8).
The annual growth rate of MFI loans to the private sector (adjusted for sales and securitisation)
decreased further to 0.3% in June, down from 0.5% in May.
Private sector lending activity remained affected mainly by weak demand and low consumer and
business confi dence, as well as – in some euro area countries – by unfavourable bank balance sheet
developments. At the euro area level, the net tightening of banks’ credit standards for loans to both
enterprises and households was broadly stable in the second quarter of 2012 (see Box 2).
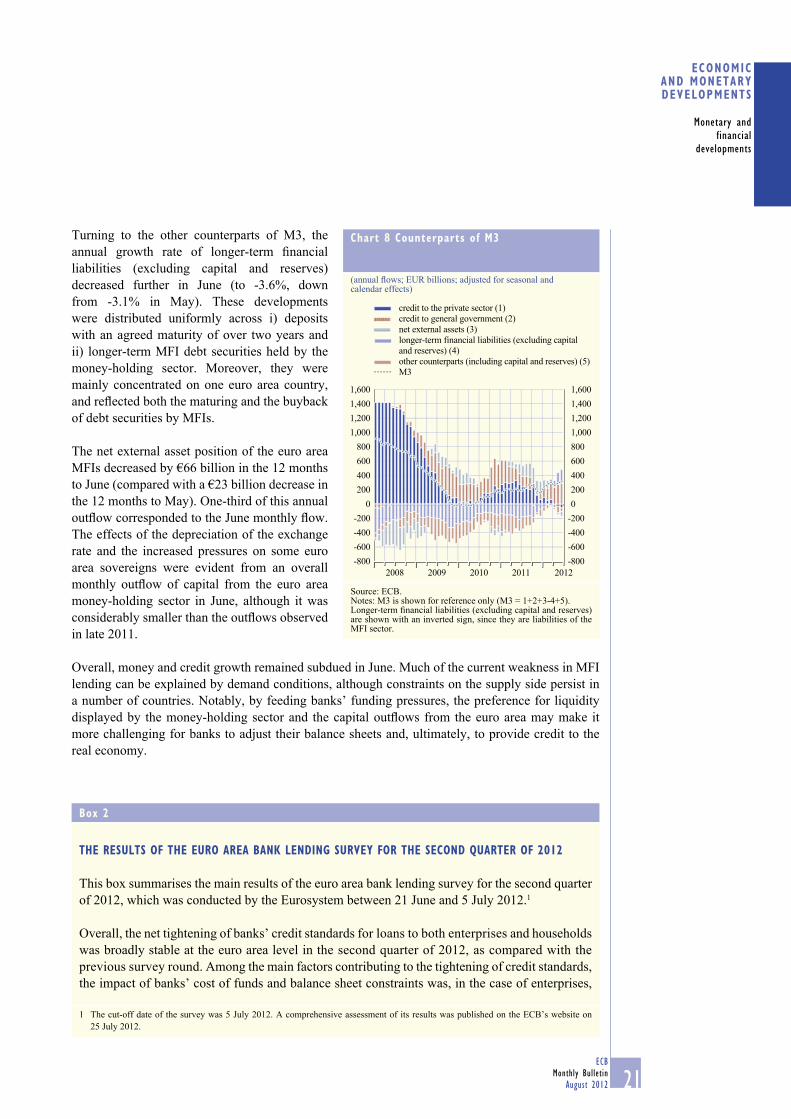
The annual growth rate of loans to non-fi nancial corporations originated by MFIs thus decreased
further in refl ection of both moderate net redemptions of loans and a base effect in June, becoming
negative at -0.3%, from 0.3% in May (see Table 3). Lending fl ows at all maturities at the euro area
level were modest, but concealed offsetting developments across countries, mainly in short-term
loans. The annual growth of loans to households, too, continued to decelerate in June (to 1.1%,
20ECB
Monthly Bulletin
August 2012
after 1.3% in May); this deceleration was attributable to, in particular, monthly net redemptions
of consumer credit. An analysis of savings, investment and fi nancing, broken down by sector, is
provided in Box 3 (see Section 2.6).
Table 2 Summary table of monetary variables
(quarterly fi gures are averages; adjusted for seasonal and calendar effects)
Outstanding amounts as a
percentage of M3 1)
Annual growth rates
2011 Q3
2011 Q4
2012 Q1
2012 Q2
2012 May
2012 June
M1 49.3 1.4 1.9 2.3 2.7 3.3 3.5 Currency in circulation 8.7 4.5 6.2 6.1 5.5 5.5 5.5
Overnight deposits 40.6 0.8 1.0 1.5 2.2 2.9 3.1
M2-M1 (=other short-term deposits) 39.1 3.4 2.3 2.7 2.8 2.3 2.3
Deposits with an agreed maturity
of up to two years 18.9 3.1 2.0 3.4 2.7 1.6 1.4
Deposits redeemable at notice
of up to three months 20.2 3.7 2.5 2.1 2.9 3.0 3.3
M2 88.4 2.3 2.1 2.5 2.8 2.9 3.0 M3-M2 (=marketable instruments) 11.6 2.7 3.5 3.1 4.4 4.5 5.1
M3 100.0 2.4 2.2 2.5 3.0 3.1 3.2
Credit to euro area residents 2.4 1.3 1.4 1.5 1.5 1.4 Credit to general government 5.2 1.4 5.2 8.4 9.1 9.4
Loans to general government 7.0 -2.1 -4.6 -1.7 -0.8 1.5
Credit to the private sector 1.8 1.3 0.5 -0.1 -0.2 -0.4
Loans to the private sector 2.5 2.1 0.9 0.1 -0.1 -0.2
Loans to the private sector adjusted
for sales and securitisation 2) 2.7 2.3 1.3 0.7 0.5 0.3
Longer-term fi nancial liabilities (excluding capital and reserves) 3.5 2.6 0.4 -2.4 -3.1 -3.6
Source: ECB.1) As at the end of the last month available. Figures may not add up due to rounding.2) Adjusted for the derecognition of loans from the MFI statistical balance sheet owing to their sale or securitisation.
Table 3 MFI loans to the private sector
(quarterly fi gures are averages; adjusted for seasonal and calendar effects)
Outstanding amount as a percentage
of the total 1)
Annual growth rates
2011 Q3
2011 Q4
2012 Q1
2012 Q2
2012 May
2012 June
Non-fi nancial corporations 42.1 1.6 1.7 0.7 0.1 0.0 -0.6 Adjusted for sales and securitisation 2) - 2.3 2.1 0.9 0.3 0.3 -0.3 Up to one year 24.5 4.1 3.7 0.5 -0.1 0.1 -1.9
Over one and up to fi ve years 18.0 -2.8 -2.5 -2.9 -2.5 -2.5 -2.5
Over fi ve years 57.5 2.1 2.3 2.0 1.0 0.8 0.6
Households 3) 47.1 3.0 2.2 1.2 0.4 0.3 0.3 Adjusted for sales and securitisation 2) - 2.7 2.3 1.9 1.4 1.3 1.1 Consumer credit 4) 11.7 -2.0 -2.0 -1.8 -2.1 -1.9 -1.9
Lending for house purchase 4) 72.6 4.0 3.0 1.8 0.9 0.8 0.8
Other lending 15.7 2.4 1.8 0.9 0.2 -0.1 -0.4
Insurance corporations and pension funds 0.8 7.1 4.2 -3.1 -5.4 -6.4 -5.9 Other non-monetary fi nancial intermediaries 10.1 3.9 3.3 1.1 -0.7 -1.9 0.1
Source: ECB.Notes: MFI sector including the Eurosystem; sectoral classifi cation based on the ESA 95. For further details, see the relevant technical notes.1) As at the end of the last month available. Sector loans as a percentage of total MFI loans to the private sector; maturity breakdown and breakdown by purpose as a percentage of MFI loans to the respective sector. Figures may not add up due to rounding.2) Adjusted for the derecognition of loans from the MFI statistical balance sheet owing to their sale or securitisation.3) As defi ned in the ESA 95.4) Defi nitions of consumer credit and lending for house purchase are not fully consistent across the euro area.
21ECB
Monthly Bulletin
August 2012
ECONOMIC AND MONETARYDEVELOPMENTS
Monetary and
financial
developments
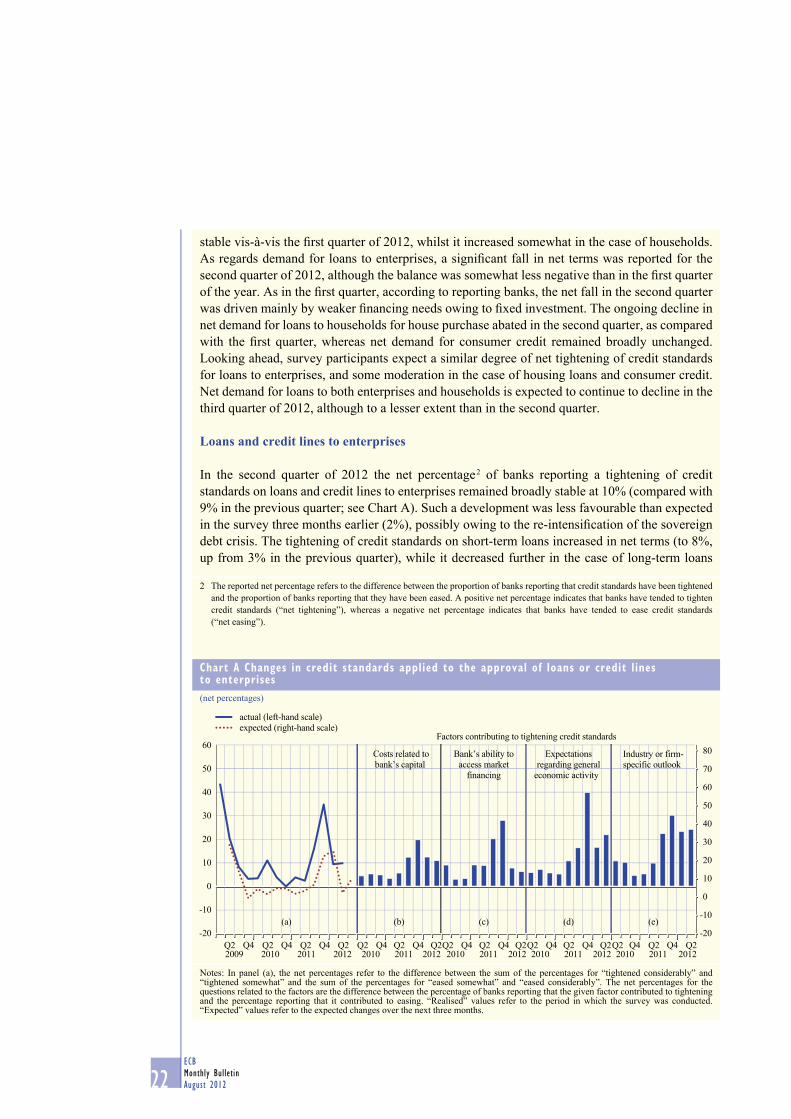
Turning to the other counterparts of M3, the
annual growth rate of longer-term fi nancial
liabilities (excluding capital and reserves)
decreased further in June (to -3.6%, down
from -3.1% in May). These developments
were distributed uniformly across i) deposits
with an agreed maturity of over two years and
ii) longer-term MFI debt securities held by the
money-holding sector. Moreover, they were
mainly concentrated on one euro area country,
and refl ected both the maturing and the buyback
of debt securities by MFIs.
The net external asset position of the euro area
MFIs decreased by €66 billion in the 12 months
to June (compared with a €23 billion decrease in
the 12 months to May). One-third of this annual
outfl ow corresponded to the June monthly fl ow.
The effects of the depreciation of the exchange
rate and the increased pressures on some euro
area sovereigns were evident from an overall
monthly outfl ow of capital from the euro area
money-holding sector in June, although it was
considerably smaller than the outfl ows observed
in late 2011.
Overall, money and credit growth remained subdued in June. Much of the current weakness in MFI
lending can be explained by demand conditions, although constraints on the supply side persist in
a number of countries. Notably, by feeding banks’ funding pressures, the preference for liquidity
displayed by the money-holding sector and the capital outfl ows from the euro area may make it
more challenging for banks to adjust their balance sheets and, ultimately, to provide credit to the
real economy.
Chart 8 Counterparts of M3
(annual fl ows; EUR billions; adjusted for seasonal and calendar effects)
-800
-600
-400
-200
0
200
400
600
800
1,000
1,200
1,400
1,600
-800
-600
-400
-200
0
200
400
600
800
1,000
1,200
1,400
1,600
2012
credit to the private sector (1)
credit to general government (2)
net external assets (3)
longer-term financial liabilities (excluding capital
and reserves) (4)
other counterparts (including capital and reserves) (5)
M3
2008 2009 2010 2011
Source: ECB.Notes: M3 is shown for reference only (M3 = 1+2+3-4+5).Longer-term fi nancial liabilities (excluding capital and reserves) are shown with an inverted sign, since they are liabilities of the MFI sector.
Box 2
THE RESULTS OF THE EURO AREA BANK LENDING SURVEY FOR THE SECOND QUARTER OF 2012
This box summarises the main results of the euro area bank lending survey for the second quarter
of 2012, which was conducted by the Eurosystem between 21 June and 5 July 2012.1
Overall, the net tightening of banks’ credit standards for loans to both enterprises and households
was broadly stable at the euro area level in the second quarter of 2012, as compared with the
previous survey round. Among the main factors contributing to the tightening of credit standards,
the impact of banks’ cost of funds and balance sheet constraints was, in the case of enterprises,
1 The cut-off date of the survey was 5 July 2012. A comprehensive assessment of its results was published on the ECB’s website on
25 July 2012.
22ECB
Monthly Bulletin
August 2012
stable vis-à-vis the fi rst quarter of 2012, whilst it increased somewhat in the case of households.
As regards demand for loans to enterprises, a signifi cant fall in net terms was reported for the
second quarter of 2012, although the balance was somewhat less negative than in the fi rst quarter
of the year. As in the fi rst quarter, according to reporting banks, the net fall in the second quarter
was driven mainly by weaker fi nancing needs owing to fi xed investment. The ongoing decline in
net demand for loans to households for house purchase abated in the second quarter, as compared
with the fi rst quarter, whereas net demand for consumer credit remained broadly unchanged.
Looking ahead, survey participants expect a similar degree of net tightening of credit standards
for loans to enterprises, and some moderation in the case of housing loans and consumer credit.
Net demand for loans to both enterprises and households is expected to continue to decline in the
third quarter of 2012, although to a lesser extent than in the second quarter.
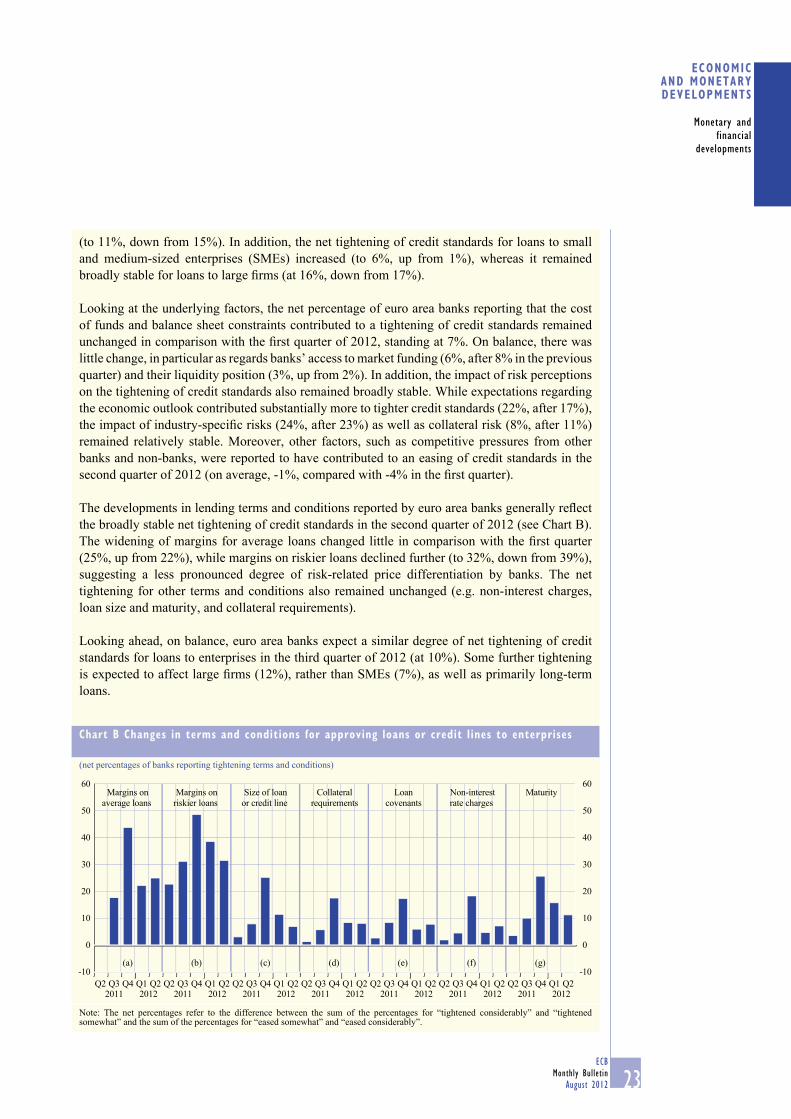
Loans and credit lines to enterprises
In the second quarter of 2012 the net percentage 2 of banks reporting a tightening of credit
standards on loans and credit lines to enterprises remained broadly stable at 10% (compared with
9% in the previous quarter; see Chart A). Such a development was less favourable than expected
in the survey three months earlier (2%), possibly owing to the re-intensifi cation of the sovereign
debt crisis. The tightening of credit standards on short-term loans increased in net terms (to 8%,
up from 3% in the previous quarter), while it decreased further in the case of long-term loans
2 The reported net percentage refers to the difference between the proportion of banks reporting that credit standards have been tightened
and the proportion of banks reporting that they have been eased. A positive net percentage indicates that banks have tended to tighten
credit standards (“net tightening”), whereas a negative net percentage indicates that banks have tended to ease credit standards
(“net easing”).
Chart A Changes in credit standards applied to the approval of loans or credit lines to enterprises
(net percentages)
-20
-10
0
10
20
30
40
50
60
70
80
-20
-10
0
10
20
30
40
50
60Costs related to
bank’s capital
Expectations
regarding general
economic activity
Industry or firm-
specific outlook
(a) (e)(d)(c)(b)
Factors contributing to tightening credit standards
Bank’s ability to
access market
financing
actual (left-hand scale)
expected (right-hand scale)
Q2 Q4 Q2 Q4 Q2 Q4 Q2 Q4 Q2 Q4 Q2 Q4 Q2 Q4 Q2 Q4 Q2 Q4 Q2 Q4 Q2 Q4 Q2Q2Q2Q2Q22009 2010 2011 2012 2010 2011 2012 2010 2011 2012 2010 2011 2012 2010 2011 2012
Notes: In panel (a), the net percentages refer to the difference between the sum of the percentages for “tightened considerably” and “tightened somewhat” and the sum of the percentages for “eased somewhat” and “eased considerably”. The net percentages for the questions related to the factors are the difference between the percentage of banks reporting that the given factor contributed to tightening and the percentage reporting that it contributed to easing. “Realised” values refer to the period in which the survey was conducted. “Expected” values refer to the expected changes over the next three months.
23ECB
Monthly Bulletin
August 2012
ECONOMIC AND MONETARYDEVELOPMENTS
Monetary and
financial
developments
(to 11%, down from 15%). In addition, the net tightening of credit standards for loans to small
and medium-sized enterprises (SMEs) increased (to 6%, up from 1%), whereas it remained
broadly stable for loans to large fi rms (at 16%, down from 17%).
Looking at the underlying factors, the net percentage of euro area banks reporting that the cost
of funds and balance sheet constraints contributed to a tightening of credit standards remained
unchanged in comparison with the fi rst quarter of 2012, standing at 7%. On balance, there was
little change, in particular as regards banks’ access to market funding (6%, after 8% in the previous
quarter) and their liquidity position (3%, up from 2%). In addition, the impact of risk perceptions
on the tightening of credit standards also remained broadly stable. While expectations regarding
the economic outlook contributed substantially more to tighter credit standards (22%, after 17%),
the impact of industry-specifi c risks (24%, after 23%) as well as collateral risk (8%, after 11%)
remained relatively stable. Moreover, other factors, such as competitive pressures from other
banks and non-banks, were reported to have contributed to an easing of credit standards in the
second quarter of 2012 (on average, -1%, compared with -4% in the fi rst quarter).
The developments in lending terms and conditions reported by euro area banks generally refl ect
the broadly stable net tightening of credit standards in the second quarter of 2012 (see Chart B).
The widening of margins for average loans changed little in comparison with the fi rst quarter
(25%, up from 22%), while margins on riskier loans declined further (to 32%, down from 39%),
suggesting a less pronounced degree of risk-related price differentiation by banks. The net
tightening for other terms and conditions also remained unchanged (e.g. non-interest charges,
loan size and maturity, and collateral requirements).
Looking ahead, on balance, euro area banks expect a similar degree of net tightening of credit
standards for loans to enterprises in the third quarter of 2012 (at 10%). Some further tightening
is expected to affect large fi rms (12%), rather than SMEs (7%), as well as primarily long-term
loans.
Chart B Changes in terms and conditions for approving loans or credit lines to enterprises
(net percentages of banks reporting tightening terms and conditions)
-10
0
10
20
30
40
50
60
-10
0
10
20
30
40
50
60
Q1Q3 Q2Q2 Q4 Q1Q3 Q2Q2 Q4 Q1Q3 Q2Q2 Q4 Q1Q3 Q2Q2 Q4 Q1Q3 Q2Q2 Q4 Q1Q3 Q2Q2 Q4 Q1Q3 Q2Q2 Q42011 2012 2011 2012 2011 2012 2011 2012 2011 2012 2011 2012 2011 2012
Collateral
requirements
Loan
covenants
Non-interest
rate charges
MaturityMargins on
average loans
Margins on
riskier loans
Size of loan
or credit line
(a) (e)(d)(c)(b) (g)(f)
Note: The net percentages refer to the difference between the sum of the percentages for “tightened considerably” and “tightened somewhat” and the sum of the percentages for “eased somewhat” and “eased considerably”.
24ECB
Monthly Bulletin
August 2012
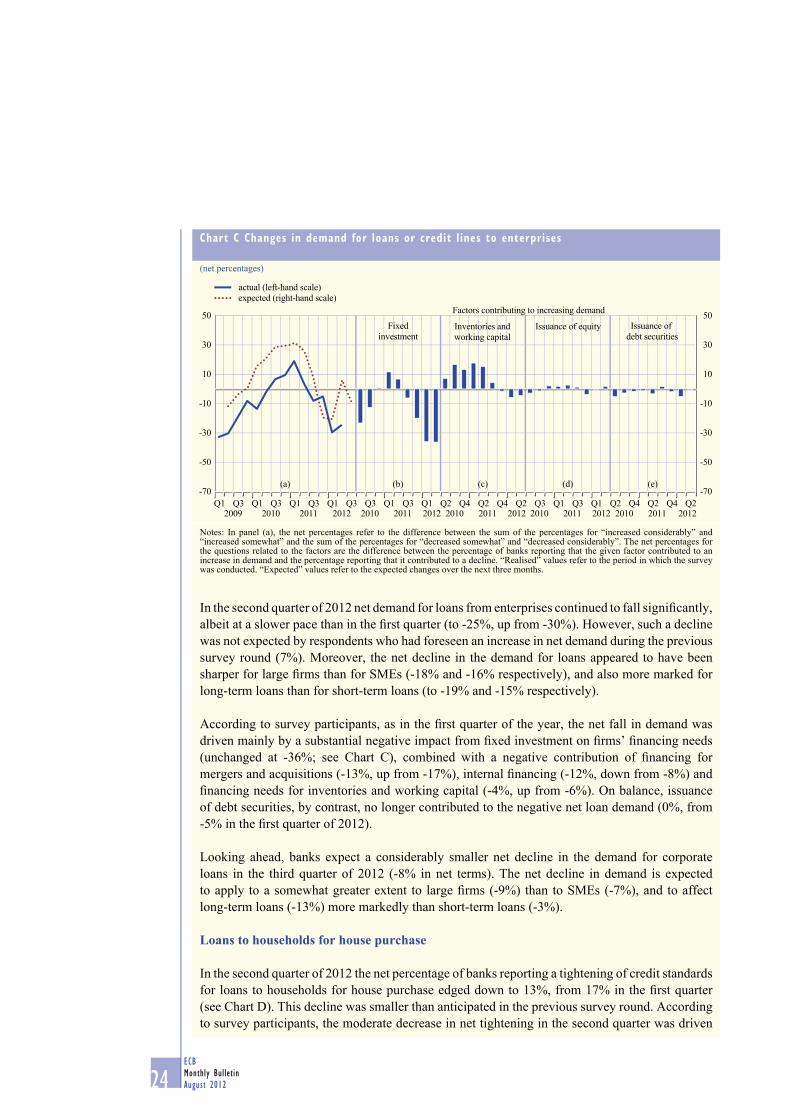
In the second quarter of 2012 net demand for loans from enterprises continued to fall signifi cantly,
albeit at a slower pace than in the fi rst quarter (to -25%, up from -30%). However, such a decline
was not expected by respondents who had foreseen an increase in net demand during the previous
survey round (7%). Moreover, the net decline in the demand for loans appeared to have been
sharper for large fi rms than for SMEs (-18% and -16% respectively), and also more marked for
long-term loans than for short-term loans (to -19% and -15% respectively).
According to survey participants, as in the fi rst quarter of the year, the net fall in demand was
driven mainly by a substantial negative impact from fi xed investment on fi rms’ fi nancing needs
(unchanged at -36%; see Chart C), combined with a negative contribution of fi nancing for
mergers and acquisitions (-13%, up from -17%), internal fi nancing (-12%, down from -8%) and
fi nancing needs for inventories and working capital (-4%, up from -6%). On balance, issuance
of debt securities, by contrast, no longer contributed to the negative net loan demand (0%, from
-5% in the fi rst quarter of 2012).
Looking ahead, banks expect a considerably smaller net decline in the demand for corporate
loans in the third quarter of 2012 (-8% in net terms). The net decline in demand is expected
to apply to a somewhat greater extent to large fi rms (-9%) than to SMEs (-7%), and to affect
long-term loans (-13%) more markedly than short-term loans (-3%).
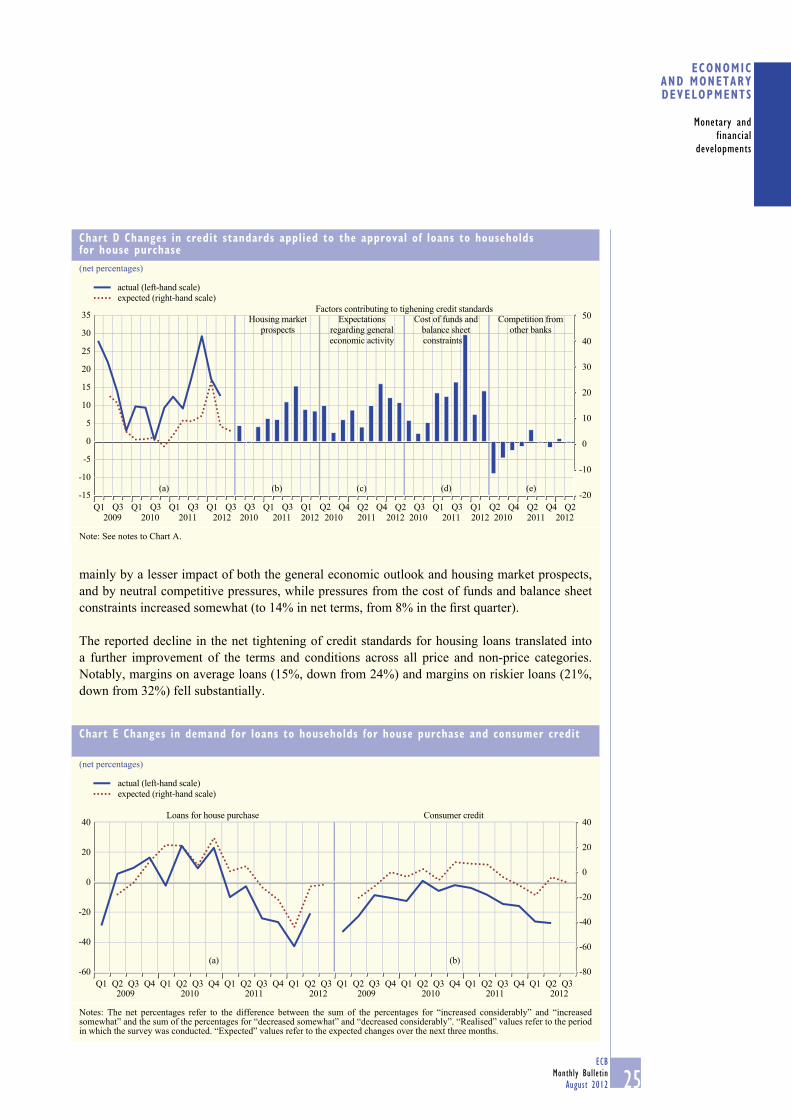
Loans to households for house purchase
In the second quarter of 2012 the net percentage of banks reporting a tightening of credit standards
for loans to households for house purchase edged down to 13%, from 17% in the fi rst quarter
(see Chart D). This decline was smaller than anticipated in the previous survey round. According
to survey participants, the moderate decrease in net tightening in the second quarter was driven
Chart C Changes in demand for loans or credit lines to enterprises
(net percentages)
-70
-50
-30
-10
10
30
50
-70
-50
-30
-10
10
30
50Factors contributing to increasing demand
Fixed
investmentInventories and
working capital
Issuance of equity Issuance of
debt securities
(a) (b) (c) (d) (e)
Q3Q1 Q3Q1 Q3Q1 Q3Q3Q1 Q1 Q3 Q1 Q2 Q4 Q2 Q4 Q2 Q3 Q1 Q3 Q1 Q2 Q4 Q2 Q2Q42009 2010 2011 2012 2010 2011 2012 2010 2011 2012 2010 2011 2012 2010 2011 2012
actual (left-hand scale)
expected (right-hand scale)
Notes: In panel (a), the net percentages refer to the difference between the sum of the percentages for “increased considerably” and “increased somewhat” and the sum of the percentages for “decreased somewhat” and “decreased considerably”. The net percentages for the questions related to the factors are the difference between the percentage of banks reporting that the given factor contributed to an increase in demand and the percentage reporting that it contributed to a decline. “Realised” values refer to the period in which the survey was conducted. “Expected” values refer to the expected changes over the next three months.
25ECB
Monthly Bulletin
August 2012
ECONOMIC AND MONETARYDEVELOPMENTS
Monetary and
financial
developments
mainly by a lesser impact of both the general economic outlook and housing market prospects,
and by neutral competitive pressures, while pressures from the cost of funds and balance sheet
constraints increased somewhat (to 14% in net terms, from 8% in the fi rst quarter).
The reported decline in the net tightening of credit standards for housing loans translated into
a further improvement of the terms and conditions across all price and non-price categories.
Notably, margins on average loans (15%, down from 24%) and margins on riskier loans (21%,
down from 32%) fell substantially.
Chart D Changes in credit standards applied to the approval of loans to households for house purchase
(net percentages)
-20
-10
0
10
20
30
40
50
-15
-10
-5
0
5
10
15
20
25
30
35
(a) (b) (c) (d) (e)
Q1 Q3 Q1 Q3 Q1 Q3 Q1 Q3 Q1 Q3 Q1 Q3 Q1 Q3 Q1Q3 Q4 Q2 Q4 Q2Q2 Q4 Q2 Q4 Q2Q22009 2010 2011 2012 2010 2011 2012 2010 2011 2012 2010 2011 2012 2010 2011 2012
actual (left-hand scale) expected (right-hand scale)
Factors contributing to tighening credit standardsExpectations
regarding general
economic activity
Housing market
prospects
Competition from
other banks
Cost of funds and
balance sheet
constraints
Note: See notes to Chart A.
Chart E Changes in demand for loans to households for house purchase and consumer credit
(net percentages)
-80
-60
-40
-20
0
20
40
-60
-40
-20
0
20
40
Q12009 2010 2011 2012 2009 2010 2011 2012
Q2 Q3 Q4 Q4 Q4 Q4 Q4 Q4Q3 Q3 Q3 Q3 Q3 Q3 Q3Q2 Q2 Q2 Q2 Q2 Q2 Q2Q1 Q1 Q1 Q1 Q1 Q1 Q1
Loans for house purchase Consumer credit
(a) (b)
actual (left-hand scale)
expected (right-hand scale)
Notes: The net percentages refer to the difference between the sum of the percentages for “increased considerably” and “increased somewhat” and the sum of the percentages for “decreased somewhat” and “decreased considerably”. “Realised” values refer to the period in which the survey was conducted. “Expected” values refer to the expected changes over the next three months.

26ECB
Monthly Bulletin
August 2012
Looking ahead, banks expect a somewhat lower degree of net tightening of credit standards in
the case of loans for house purchase (5%) in the third quarter of 2012.
Similar to the negative net loan demand by fi rms, euro area banks reported a further contraction,
in net terms, in the demand for housing loans (to -21%, up from -43%; see Chart E), while
the balance became signifi cantly less negative. This net decline appeared to be driven mainly
by the ongoing deterioration of housing market prospects (-25%, up from -31%) and consumer
confi dence (-27%, up from -37%).
Looking ahead, banks expect a further net decline in the demand for housing loans (-10% in net
terms) for the third quarter of 2012, albeit at a slower pace.
Consumer credit and other lending to households
For the second quarter of 2012, euro area banks reported a broadly stable net tightening of
credit standards (7%, up from 5%; see Chart F). Pressures from cost of funds and balance sheet
constraints on credit standards increased (to 8%, from 3% in the fi rst quarter of 2012), whereas
risk perceptions (related to the economic outlook and consumers’ creditworthiness) remained
broadly unchanged. With regard to the terms and conditions on consumer credit, banks reported,
on balance, that the widening of margins on riskier loans declined (to 13%, from 17% in the fi rst
quarter), whereas the widening of margins on average consumer loans remained broadly stable
(at 11%, compared with 10% in the fi rst quarter of 2012). The contribution of non-price terms
and conditions on consumer credit remained broadly neutral.
Looking ahead, in net terms, only 2% of banks expect a further tightening of credit standards for
consumer credit and other lending to households in the third quarter of 2012.
Chart F Changes in credit standards applied to the approval of consumer credit and other lending to households
(net percentages)
-10
0
10
20
30
40
50
-10
-5
0
5
10
15
20
25
30
Q3Q1 Q3Q1 Q3Q1 Q3Q3Q1 Q1 Q3 Q1 Q2 Q4 Q2 Q4 Q2 Q3 Q1 Q3 Q1 Q2 Q4 Q2 Q2Q42009 2010 2011 2012 2010 2011 2012 2010 2011 2012 2010 2011 2012 2010 2011 2012
Factors contributing to tightening credit standards
Expectations
regarding general
economic activity
Creditworthiness
of consumers
Risk on collateral
demanded
(d) (e)
actual (left-hand scale)
expected (right-hand scale)
Competition from
other banks
(a) (b) (c)
Note: See notes to Chart A.
27ECB
Monthly Bulletin
August 2012
ECONOMIC AND MONETARYDEVELOPMENTS
Monetary and
financial
developments
In the second quarter of 2012 net demand for consumer credit continued to decline markedly
(-27% in net terms, down from -26% in the previous quarter; see Chart E). This was mainly
due to lower spending on durable consumer goods (-28%, unchanged to the fi rst quarter) and a
decrease in consumer confi dence (-26%, up from -28% in the fi rst quarter).
Looking ahead, banks expect a smaller net decline in the demand for consumer credit in the third
quarter of 2012 (at -8% in net terms).
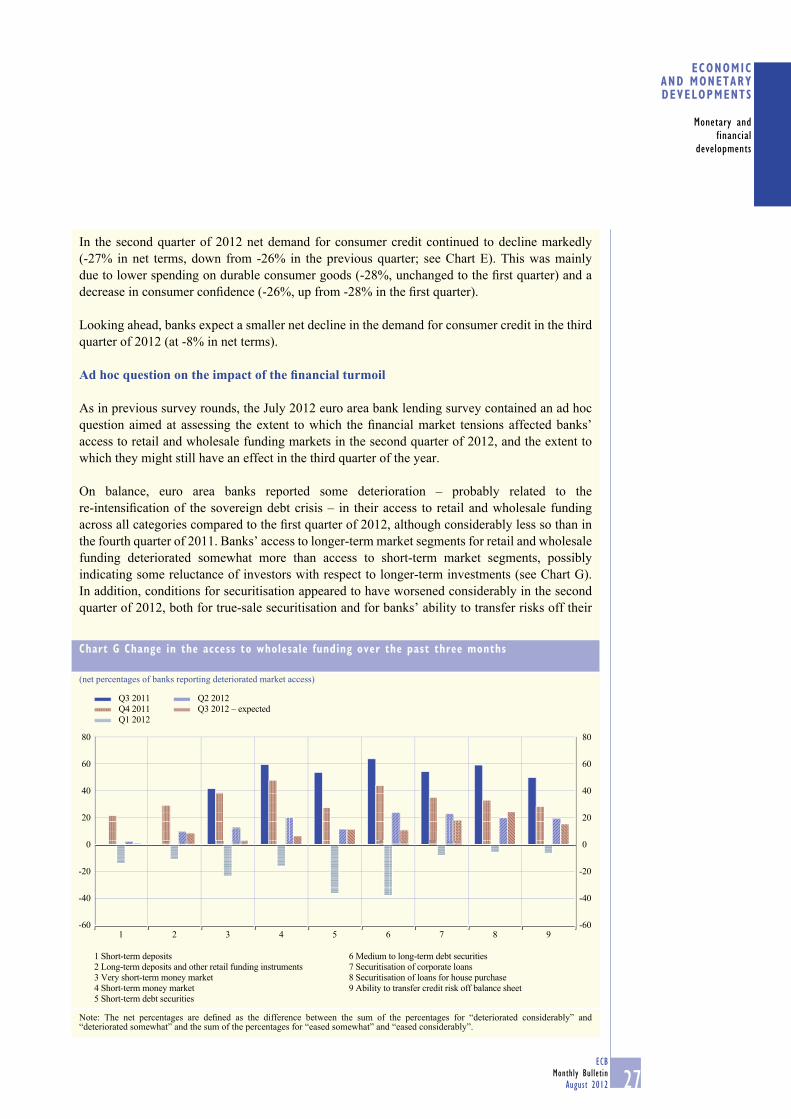
Ad hoc question on the impact of the fi nancial turmoil
As in previous survey rounds, the July 2012 euro area bank lending survey contained an ad hoc
question aimed at assessing the extent to which the fi nancial market tensions affected banks’
access to retail and wholesale funding markets in the second quarter of 2012, and the extent to
which they might still have an effect in the third quarter of the year.
On balance, euro area banks reported some deterioration – probably related to the
re-intensifi cation of the sovereign debt crisis – in their access to retail and wholesale funding
across all categories compared to the fi rst quarter of 2012, although considerably less so than in
the fourth quarter of 2011. Banks’ access to longer-term market segments for retail and wholesale
funding deteriorated somewhat more than access to short-term market segments, possibly
indicating some reluctance of investors with respect to longer-term investments (see Chart G).
In addition, conditions for securitisation appeared to have worsened considerably in the second
quarter of 2012, both for true-sale securitisation and for banks’ ability to transfer risks off their
Chart G Change in the access to wholesale funding over the past three months
(net percentages of banks reporting deteriorated market access)
-60
-40
-20
0
20
40
60
80
-60
-40
-20
0
20
40
60
80
1 Short-term deposits
2 Long-term deposits and other retail funding instruments
3 Very short-term money market
4 Short-term money market
5 Short-term debt securities
6 Medium to long-term debt securities
7 Securitisation of corporate loans
8 Securitisation of loans for house purchase
9 Ability to transfer credit risk off balance sheet
Q3 2011
Q4 2011
Q1 2012
Q2 2012
Q3 2012 – expected
1 2 3 4 5 6 7 8 9
Note: The net percentages are defi ned as the difference between the sum of the percentages for “deteriorated considerably” and “deteriorated somewhat” and the sum of the percentages for “eased somewhat” and “eased considerably”.
28ECB
Monthly Bulletin
August 2012
balance sheets (synthetic securitisation). Looking ahead, euro area banks expect a further – albeit
more moderate – deterioration in the conditions for access to both retail and wholesale funding
in the third quarter of 2012.
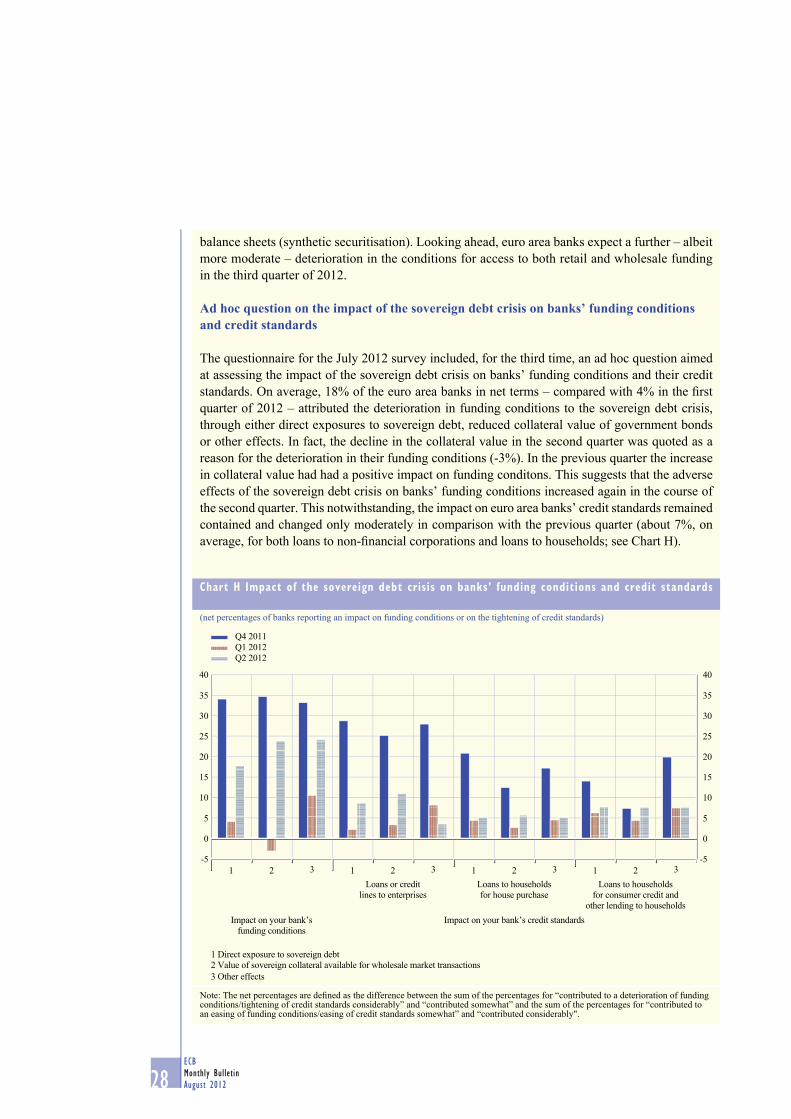
Ad hoc question on the impact of the sovereign debt crisis on banks’ funding conditions and credit standards
The questionnaire for the July 2012 survey included, for the third time, an ad hoc question aimed
at assessing the impact of the sovereign debt crisis on banks’ funding conditions and their credit
standards. On average, 18% of the euro area banks in net terms – compared with 4% in the fi rst
quarter of 2012 – attributed the deterioration in funding conditions to the sovereign debt crisis,
through either direct exposures to sovereign debt, reduced collateral value of government bonds
or other effects. In fact, the decline in the collateral value in the second quarter was quoted as a
reason for the deterioration in their funding conditions (-3%). In the previous quarter the increase
in collateral value had had a positive impact on funding conditons. This suggests that the adverse
effects of the sovereign debt crisis on banks’ funding conditions increased again in the course of
the second quarter. This notwithstanding, the impact on euro area banks’ credit standards remained
contained and changed only moderately in comparison with the previous quarter (about 7%, on
average, for both loans to non-fi nancial corporations and loans to households; see Chart H).
Chart H Impact of the sovereign debt crisis on banks’ funding conditions and credit standards
(net percentages of banks reporting an impact on funding conditions or on the tightening of credit standards)
-5
0
5
10
15
20
25
30
35
40
-5
0
5
10
15
20
25
30
35
40
Q4 2011
Q1 2012
Q2 2012
1 2 3 1 2 3 1 2 3 1 2 3
Loans or credit
lines to enterprises
Loans to households
for house purchase
Loans to households
for consumer credit and
other lending to households
Impact on your bank’s
funding conditions
Impact on your bank’s credit standards
1 Direct exposure to sovereign debt
2 Value of sovereign collateral available for wholesale market transactions
3 Other effects
Note: The net percentages are defi ned as the difference between the sum of the percentages for “contributed to a deterioration of fundingconditions/tightening of credit standards considerably” and “contributed somewhat” and the sum of the percentages for “contributed toan easing of funding conditions/easing of credit standards somewhat” and “contributed considerably".
29ECB
Monthly Bulletin
August 2012
ECONOMIC AND MONETARYDEVELOPMENTS
Monetary and
financial
developments
2.2 SECURITIES ISSUANCE
The annual growth rate of debt securities issuance by euro area residents stood at 4.0% in May 2012, down from 4.4% in the previous month. This slowdown was driven mainly by a lower growth rate of issuance of short-term debt securities, although issuance of long-term debt securities also decelerated. Overall, the weakening in issuance activity was broadly based across all but one sector. At the same time, the annual growth rate of quoted share issuance edged up slightly in May, to 1.5%.
Ad hoc questions on the impact of Basel III and other changes in bank regulation
The questionnaire for the July 2012 survey also included two ad hoc questions that aimed at
assessing the extent to which the new regulatory capital requirements set out in “Basel III” 3
(or any other specifi c national regulations concerning banks’ capital that have recently been
approved, or are expected to be approved in the near future) affect banks’ lending policies via
the potential impact on their capital positions and the credit standards they apply to loans.
The results of the July 2012 bank lending survey confi rmed that the adjustment shown in the
January 2012 survey is still ongoing. Banks reported, in net terms, a further decline in their
risk-weighted assets, albeit less strong than expected in January (-41% in the fi rst half of 2012
compared with -34% in the second half of 2011). This decline was and is expected to remain
focused on riskier, as opposed to average, loans. The increase in banks’ capital positions was
less marked than in January (35% versus 42%), but was slightly above expectations. On balance,
34% of the banks expect an increase in their capital position in the second half of 2012. Contrary
to the January survey results for the second half of 2011, however, in the fi rst half of 2012 the
increase in banks’ capital position was mainly achieved via retained earnings rather than via the
issue of new shares.
In net terms, about 25% of the participating euro area banks indicated that their credit standards
for loans to large enterprises were tightened as a result of adjustments implemented in view of the
new national regulations and/or capital requirements set out in “Basel III”. While credit standards
for loans to SMEs were affected to a lesser extent (8%), in the case of loans to households,
in net terms, 12% of euro area banks reported a tightening of credit standards owing to the new
regulatory capital requirements for housing loans, and 7% for consumer credit.
Overall, while the downsizing of risk-weighted assets generally progressed further in the fi rst
half of 2012, banks did not, on balance, speed up the improvement of their capital positions over
the same period. Looking ahead, a lower net percentage of euro area banks plan on reducing
their risk-weighted assets in the second half of 2012, as compared with the fi rst half of the year.
They would also continue to reinforce their capital base to the same extent as in the fi rst half
of the year. For the second half of 2012, banks expect an increase in net tightening of credit
standards owing to regulatory pressures which should affect primarily loans to enterprises, while
not much change is expected, on balance, in the case of loans to households.
3 See Basel Committee on Banking Supervision, Basel III: A global regulatory framework for more resilient banks and banking systems,
Bank for International Settlements, 16 December 2010 (available at http://www.bis.org/publ/bcbs189.pdf).
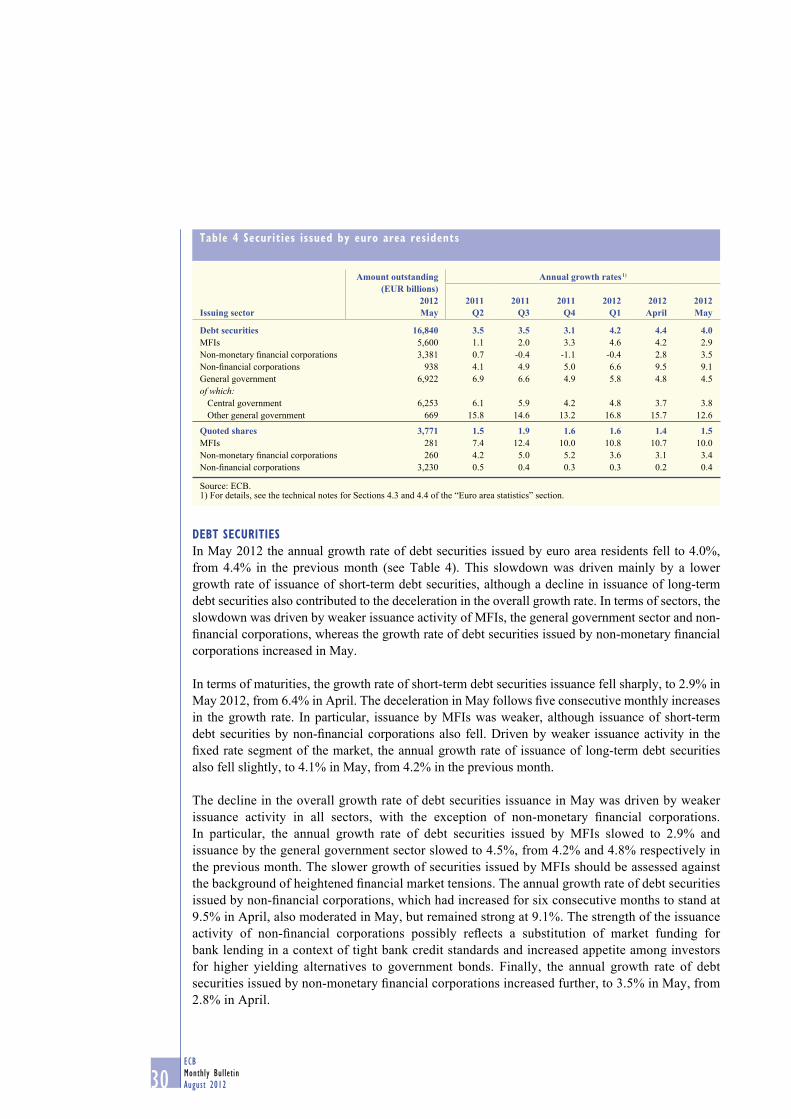
30ECB
Monthly Bulletin
August 2012
DEBT SECURITIES
In May 2012 the annual growth rate of debt securities issued by euro area residents fell to 4.0%,
from 4.4% in the previous month (see Table 4). This slowdown was driven mainly by a lower
growth rate of issuance of short-term debt securities, although a decline in issuance of long-term
debt securities also contributed to the deceleration in the overall growth rate. In terms of sectors, the
slowdown was driven by weaker issuance activity of MFIs, the general government sector and non-
fi nancial corporations, whereas the growth rate of debt securities issued by non-monetary fi nancial
corporations increased in May.
In terms of maturities, the growth rate of short-term debt securities issuance fell sharply, to 2.9% in
May 2012, from 6.4% in April. The deceleration in May follows fi ve consecutive monthly increases
in the growth rate. In particular, issuance by MFIs was weaker, although issuance of short-term
debt securities by non-fi nancial corporations also fell. Driven by weaker issuance activity in the
fi xed rate segment of the market, the annual growth rate of issuance of long-term debt securities
also fell slightly, to 4.1% in May, from 4.2% in the previous month.
The decline in the overall growth rate of debt securities issuance in May was driven by weaker
issuance activity in all sectors, with the exception of non-monetary fi nancial corporations.
In particular, the annual growth rate of debt securities issued by MFIs slowed to 2.9% and
issuance by the general government sector slowed to 4.5%, from 4.2% and 4.8% respectively in
the previous month. The slower growth of securities issued by MFIs should be assessed against
the background of heightened fi nancial market tensions. The annual growth rate of debt securities
issued by non-fi nancial corporations, which had increased for six consecutive months to stand at
9.5% in April, also moderated in May, but remained strong at 9.1%. The strength of the issuance
activity of non-fi nancial corporations possibly refl ects a substitution of market funding for
bank lending in a context of tight bank credit standards and increased appetite among investors
for higher yielding alternatives to government bonds. Finally, the annual growth rate of debt
securities issued by non-monetary fi nancial corporations increased further, to 3.5% in May, from
2.8% in April.
Table 4 Securities issued by euro area residents
Amount outstanding(EUR billions)
2012 May
Annual growth rates 1)
Issuing sector2011
Q2 2011
Q3 2011
Q4 2012
Q1 2012
April 2012May
Debt securities 16,840 3.5 3.5 3.1 4.2 4.4 4.0MFIs 5,600 1.1 2.0 3.3 4.6 4.2 2.9
Non-monetary fi nancial corporations 3,381 0.7 -0.4 -1.1 -0.4 2.8 3.5
Non-fi nancial corporations 938 4.1 4.9 5.0 6.6 9.5 9.1
General government 6,922 6.9 6.6 4.9 5.8 4.8 4.5
of which:Central government 6,253 6.1 5.9 4.2 4.8 3.7 3.8
Other general government 669 15.8 14.6 13.2 16.8 15.7 12.6
Quoted shares 3,771 1.5 1.9 1.6 1.6 1.4 1.5 MFIs 281 7.4 12.4 10.0 10.8 10.7 10.0
Non-monetary fi nancial corporations 260 4.2 5.0 5.2 3.6 3.1 3.4
Non-fi nancial corporations 3,230 0.5 0.4 0.3 0.3 0.2 0.4
Source: ECB. 1) For details, see the technical notes for Sections 4.3 and 4.4 of the “Euro area statistics” section.
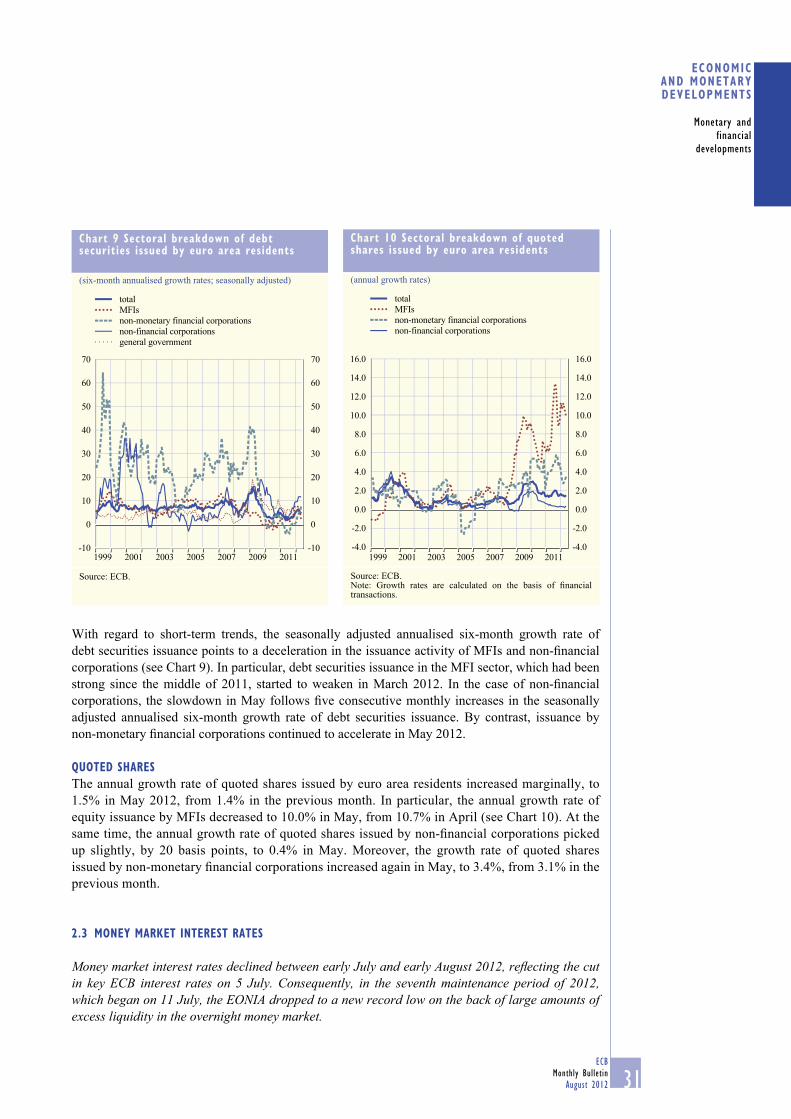
31ECB
Monthly Bulletin
August 2012
ECONOMIC AND MONETARYDEVELOPMENTS
Monetary and
financial
developments
With regard to short-term trends, the seasonally adjusted annualised six-month growth rate of
debt securities issuance points to a deceleration in the issuance activity of MFIs and non-fi nancial
corporations (see Chart 9). In particular, debt securities issuance in the MFI sector, which had been
strong since the middle of 2011, started to weaken in March 2012. In the case of non-fi nancial
corporations, the slowdown in May follows fi ve consecutive monthly increases in the seasonally
adjusted annualised six-month growth rate of debt securities issuance. By contrast, issuance by
non-monetary fi nancial corporations continued to accelerate in May 2012.
QUOTED SHARES
The annual growth rate of quoted shares issued by euro area residents increased marginally, to
1.5% in May 2012, from 1.4% in the previous month. In particular, the annual growth rate of
equity issuance by MFIs decreased to 10.0% in May, from 10.7% in April (see Chart 10). At the
same time, the annual growth rate of quoted shares issued by non-fi nancial corporations picked
up slightly, by 20 basis points, to 0.4% in May. Moreover, the growth rate of quoted shares
issued by non-monetary fi nancial corporations increased again in May, to 3.4%, from 3.1% in the
previous month.
2.3 MONEY MARKET INTEREST RATES
Money market interest rates declined between early July and early August 2012, refl ecting the cut in key ECB interest rates on 5 July. Consequently, in the seventh maintenance period of 2012, which began on 11 July, the EONIA dropped to a new record low on the back of large amounts of excess liquidity in the overnight money market.
Chart 10 Sectoral breakdown of quoted shares issued by euro area residents
(annual growth rates)
-4.0
-2.0
0.0
2.0
4.0
6.0
8.0
10.0
12.0
14.0
16.0
-4.0
-2.0
0.0
2.0
4.0
6.0
8.0
10.0
12.0
14.0
16.0
total
MFIs
non-monetary financial corporations
non-financial corporations
1999 2001 2003 2005 2007 2009 2011
Source: ECB.Note: Growth rates are calculated on the basis of fi nancial transactions.
Chart 9 Sectoral breakdown of debt securities issued by euro area residents
(six-month annualised growth rates; seasonally adjusted)
-10
0
10
20
30
40
50
60
70
-10
0
10
20
30
40
50
60
70
2001 2003 2005 2007 2009 20111999
total
MFIs
non-monetary financial corporations
non-financial corporations
general government
Source: ECB.
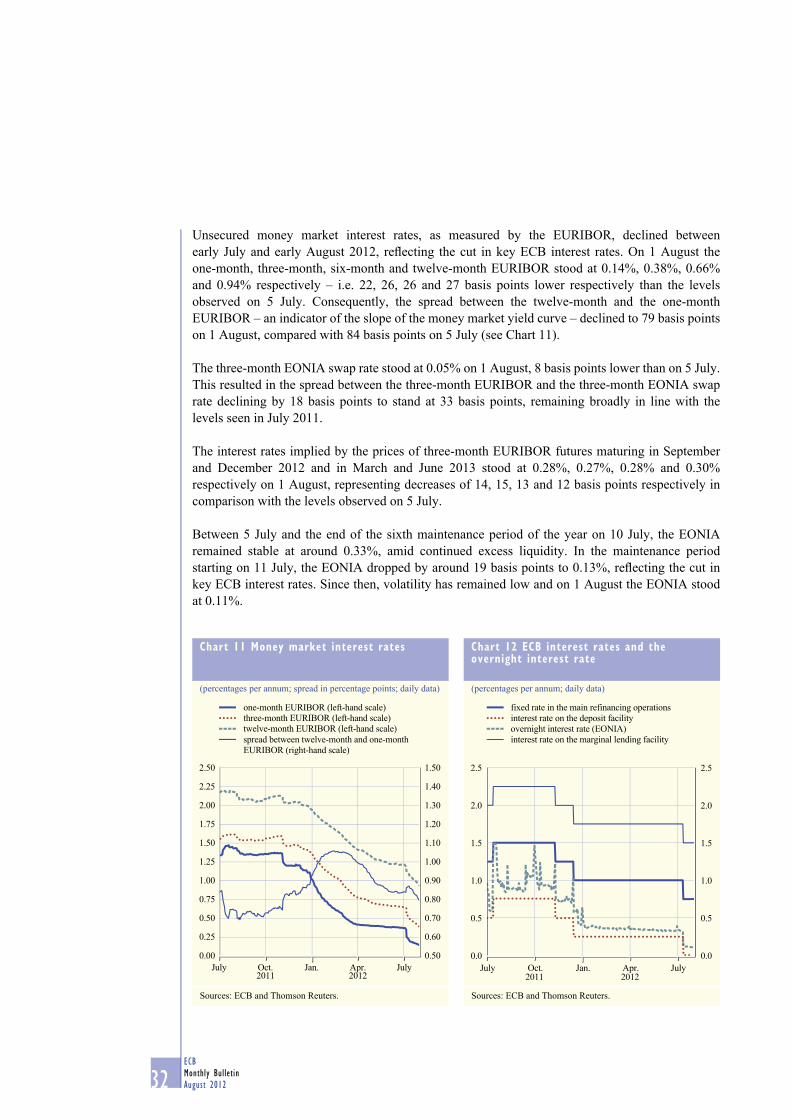
32ECB
Monthly Bulletin
August 2012
Unsecured money market interest rates, as measured by the EURIBOR, declined between
early July and early August 2012, refl ecting the cut in key ECB interest rates. On 1 August the
one-month, three-month, six-month and twelve-month EURIBOR stood at 0.14%, 0.38%, 0.66%
and 0.94% respectively – i.e. 22, 26, 26 and 27 basis points lower respectively than the levels
observed on 5 July. Consequently, the spread between the twelve-month and the one-month
EURIBOR – an indicator of the slope of the money market yield curve – declined to 79 basis points
on 1 August, compared with 84 basis points on 5 July (see Chart 11).
The three-month EONIA swap rate stood at 0.05% on 1 August, 8 basis points lower than on 5 July.
This resulted in the spread between the three-month EURIBOR and the three-month EONIA swap
rate declining by 18 basis points to stand at 33 basis points, remaining broadly in line with the
levels seen in July 2011.
The interest rates implied by the prices of three-month EURIBOR futures maturing in September
and December 2012 and in March and June 2013 stood at 0.28%, 0.27%, 0.28% and 0.30%
respectively on 1 August, representing decreases of 14, 15, 13 and 12 basis points respectively in
comparison with the levels observed on 5 July.
Between 5 July and the end of the sixth maintenance period of the year on 10 July, the EONIA
remained stable at around 0.33%, amid continued excess liquidity. In the maintenance period
starting on 11 July, the EONIA dropped by around 19 basis points to 0.13%, refl ecting the cut in
key ECB interest rates. Since then, volatility has remained low and on 1 August the EONIA stood
at 0.11%.
Chart 11 Money market interest rates
(percentages per annum; spread in percentage points; daily data)
0.50
0.60
0.70
0.80
0.90
1.00
1.10
1.20
1.30
1.40
1.50
0.00
0.25
0.50
0.75
1.00
1.25
1.50
1.75
2.00
2.25
2.50
July Oct. Jan. Apr. July2011 2012
one-month EURIBOR (left-hand scale)
three-month EURIBOR (left-hand scale)
twelve-month EURIBOR (left-hand scale)
spread between twelve-month and one-month
EURIBOR (right-hand scale)
Sources: ECB and Thomson Reuters.
Chart 12 ECB interest rates and the overnight interest rate
(percentages per annum; daily data)
0.0
0.5
1.0
1.5
2.0
2.5
0.0
0.5
1.0
1.5
2.0
2.5
fixed rate in the main refinancing operations
interest rate on the deposit facility
overnight interest rate (EONIA)
interest rate on the marginal lending facility
July Oct. Jan. Apr. July2011 2012
Sources: ECB and Thomson Reuters.

33ECB
Monthly Bulletin
August 2012
ECONOMIC AND MONETARYDEVELOPMENTS
Monetary and
financial
developments
The Eurosystem conducted several refi nancing operations between 5 July and 1 August. In the main
refi nancing operations of the seventh maintenance period, which were conducted on 10, 17, 24 and
31 July, the Eurosystem allotted €163.7 billion, €156.8 billion, €130.7 billion and €132.7 billion
respectively. The Eurosystem also conducted two longer-term refi nancing operations (LTROs) in
July, both as fi xed rate tender procedures with full allotment, namely a special-term refi nancing
operation with a maturity of one maintenance period on 10 July (in which €24.4 billion was allotted)
and a three-month LTRO on 25 July (in which €8.5 billion was allotted).
The Eurosystem also conducted four one-week liquidity-absorbing operations as variable rate tender
procedures on 10, 17 and 24 June and 31 July with a maximum bid rate of 0.75% and allotment
rates at 0.03%, 0.02%, 0.02% and 0.02% respectively. With these operations, the Eurosystem
fully absorbed the liquidity associated with purchases carried out under the Securities Markets
Programme.
The seventh maintenance period of the year, which began on 11 July, was characterised by high
levels of excess liquidity in the overnight money market, but average daily recourse to the deposit
facility declined to €352.4 billion, after €770.6 billion in the previous maintenance period. This
development is a consequence of the reduction of the deposit facility rate to 0.0%, which led to
a shift in holdings from the deposit facility to the respective current account. Consequently, the
average amount held on the current account increased to €501.5 billion, from €111.5 billion in the
previous maintenance period.
2.4 BOND MARKETS
Yields on AAA-rated long-term government bonds decreased by around 40 basis points in the euro area between the end of June and early August 2012, mainly as a result of concerns about growth, the cut in key ECB interest rates, and increased risk aversion. In the United States, long-term government bond yields declined by around 10 basis points over the same period. In the euro area, yields on bonds of AAA-rated issuers fell, while bond yields of most countries under fi nancial assistance programmes, as well as of Italy and Spain, increased. Uncertainty about future bond market developments in the euro area, as measured by implied bond market volatility, fell in the fi rst half of July before recording an increase at the end of the month. Market-based indicators show that infl ation expectations remain fully consistent with price stability.
Between the end of June and 1 August 2012 yields on AAA-rated long-term euro area government
bonds decreased by approximately 40 basis points, to around 1.8%. In the United States, long-term
government bond yields decreased somewhat less, falling by 10 basis points over the same period
to stand at around 1.5% on 1 August. Long-term yields in both economic areas fell sharply in the
period to 20 July, with the biggest decline recorded in the euro area. After 20 July long-term yields
increased in both the euro area and the United States (see Chart 13). Long-term bond yields in the
euro area and the United States reached all-time low levels during the reference period owing to
fl ight-to-safety fl ows, as well as a deterioration in growth prospects. In particular, the IMF lowered
its global growth forecast and pointed to downside risks related to insuffi cient political action in the
euro area, while in the United States the Federal Reserve System signalled its willingness to act to
accommodate low growth, but mentioned no specifi c policies. In addition, the cut in the key ECB
interest rates in early July contributed to the decline in yields on AAA-rated long-term euro area
government bonds.
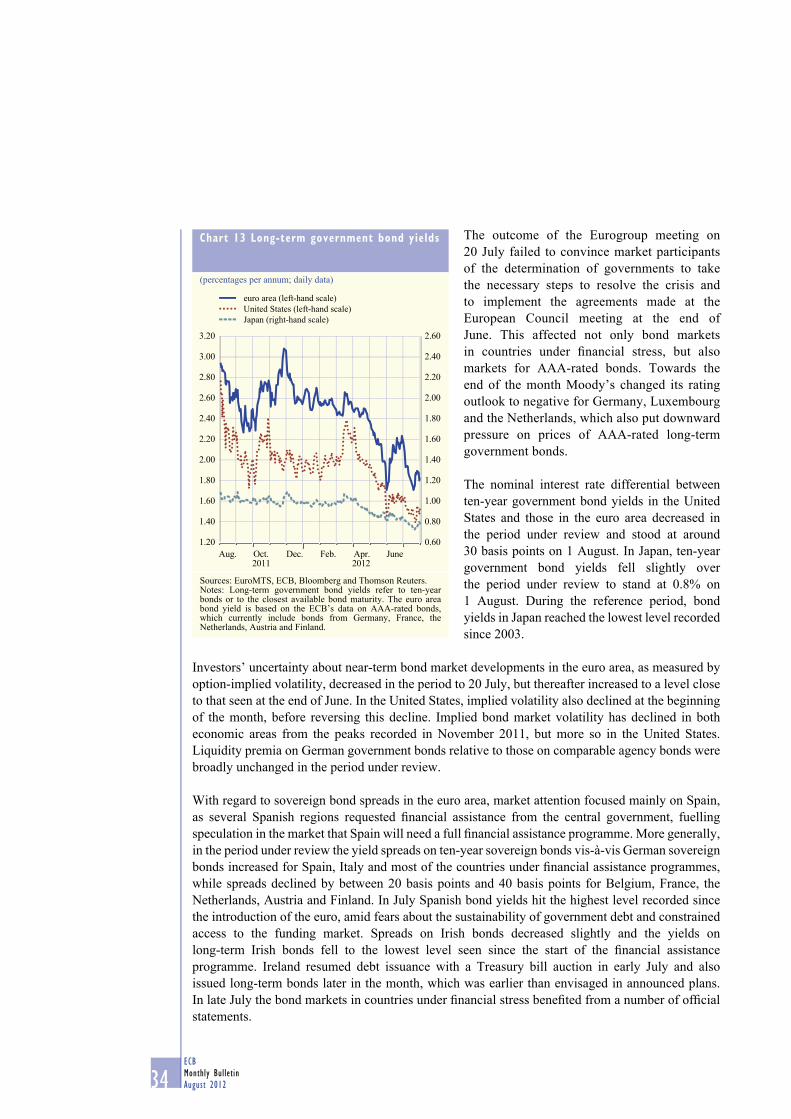
34ECB
Monthly Bulletin
August 2012
The outcome of the Eurogroup meeting on
20 July failed to convince market participants
of the determination of governments to take
the necessary steps to resolve the crisis and
to implement the agreements made at the
European Council meeting at the end of
June. This affected not only bond markets
in countries under fi nancial stress, but also
markets for AAA-rated bonds. Towards the
end of the month Moody’s changed its rating
outlook to negative for Germany, Luxembourg
and the Netherlands, which also put downward
pressure on prices of AAA-rated long-term
government bonds.
The nominal interest rate differential between
ten-year government bond yields in the United
States and those in the euro area decreased in
the period under review and stood at around
30 basis points on 1 August. In Japan, ten-year
government bond yields fell slightly over
the period under review to stand at 0.8% on
1 August. During the reference period, bond
yields in Japan reached the lowest level recorded
since 2003.
Investors’ uncertainty about near-term bond market developments in the euro area, as measured by
option-implied volatility, decreased in the period to 20 July, but thereafter increased to a level close
to that seen at the end of June. In the United States, implied volatility also declined at the beginning
of the month, before reversing this decline. Implied bond market volatility has declined in both
economic areas from the peaks recorded in November 2011, but more so in the United States.
Liquidity premia on German government bonds relative to those on comparable agency bonds were
broadly unchanged in the period under review.
With regard to sovereign bond spreads in the euro area, market attention focused mainly on Spain,
as several Spanish regions requested fi nancial assistance from the central government, fuelling
speculation in the market that Spain will need a full fi nancial assistance programme. More generally,
in the period under review the yield spreads on ten-year sovereign bonds vis-à-vis German sovereign
bonds increased for Spain, Italy and most of the countries under fi nancial assistance programmes,
while spreads declined by between 20 basis points and 40 basis points for Belgium, France, the
Netherlands, Austria and Finland. In July Spanish bond yields hit the highest level recorded since
the introduction of the euro, amid fears about the sustainability of government debt and constrained
access to the funding market. Spreads on Irish bonds decreased slightly and the yields on
long-term Irish bonds fell to the lowest level seen since the start of the fi nancial assistance
programme. Ireland resumed debt issuance with a Treasury bill auction in early July and also
issued long-term bonds later in the month, which was earlier than envisaged in announced plans.
In late July the bond markets in countries under fi nancial stress benefi ted from a number of offi cial
statements.
Chart 13 Long-term government bond yields
(percentages per annum; daily data)
0.60
0.80
1.00
1.20
1.40
1.60
1.80
2.00
2.20
2.40
2.60
1.20
1.40
1.60
1.80
2.00
2.20
2.40
2.60
2.80
3.00
3.20
euro area (left-hand scale)United States (left-hand scale)Japan (right-hand scale)
2011Aug. Oct. Dec. Feb. Apr. June
2012
Sources: EuroMTS, ECB, Bloomberg and Thomson Reuters.Notes: Long-term government bond yields refer to ten-year bonds or to the closest available bond maturity. The euro area bond yield is based on the ECB’s data on AAA-rated bonds, which currently include bonds from Germany, France, the Netherlands, Austria and Finland.
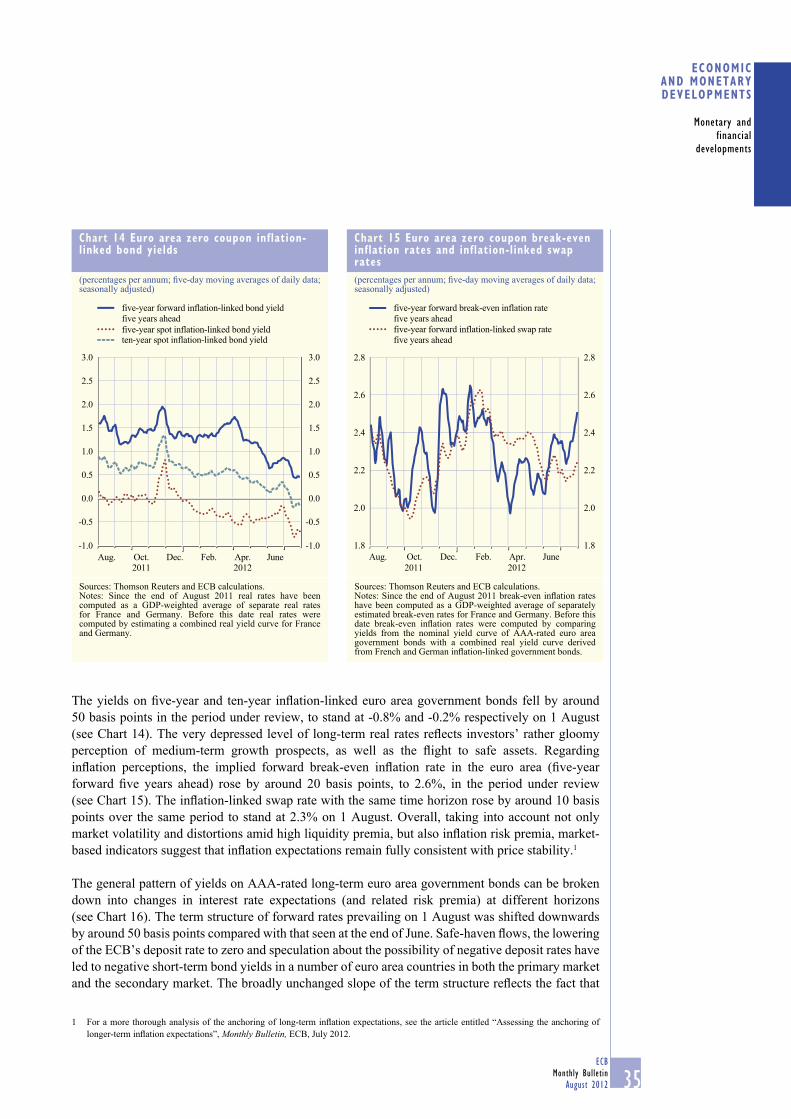
35ECB
Monthly Bulletin
August 2012
ECONOMIC AND MONETARYDEVELOPMENTS
Monetary and
financial
developments
The yields on fi ve-year and ten-year infl ation-linked euro area government bonds fell by around
50 basis points in the period under review, to stand at -0.8% and -0.2% respectively on 1 August
(see Chart 14). The very depressed level of long-term real rates refl ects investors’ rather gloomy
perception of medium-term growth prospects, as well as the fl ight to safe assets. Regarding
infl ation perceptions, the implied forward break-even infl ation rate in the euro area (fi ve-year
forward fi ve years ahead) rose by around 20 basis points, to 2.6%, in the period under review
(see Chart 15). The infl ation-linked swap rate with the same time horizon rose by around 10 basis
points over the same period to stand at 2.3% on 1 August. Overall, taking into account not only
market volatility and distortions amid high liquidity premia, but also infl ation risk premia, market-
based indicators suggest that infl ation expectations remain fully consistent with price stability.1
The general pattern of yields on AAA-rated long-term euro area government bonds can be broken
down into changes in interest rate expectations (and related risk premia) at different horizons
(see Chart 16). The term structure of forward rates prevailing on 1 August was shifted downwards
by around 50 basis points compared with that seen at the end of June. Safe-haven fl ows, the lowering
of the ECB’s deposit rate to zero and speculation about the possibility of negative deposit rates have
led to negative short-term bond yields in a number of euro area countries in both the primary market
and the secondary market. The broadly unchanged slope of the term structure refl ects the fact that
For a more thorough analysis of the anchoring of long-term infl ation expectations, see the article entitled “Assessing the anchoring of 1
longer-term infl ation expectations”, Monthly Bulletin, ECB, July 2012.
Chart 14 Euro area zero coupon inflation-linked bond yields
(percentages per annum; fi ve-day moving averages of daily data; seasonally adjusted)
-1.0
-0.5
0.0
0.5
1.0
1.5
2.0
2.5
3.0
-1.0
-0.5
0.0
0.5
1.0
1.5
2.0
2.5
3.0
Aug. Oct. Dec. Feb. Apr. June2011 2012
five-year forward inflation-linked bond yield
five years ahead
five-year spot inflation-linked bond yieldten-year spot inflation-linked bond yield
Sources: Thomson Reuters and ECB calculations.Notes: Since the end of August 2011 real rates have been computed as a GDP-weighted average of separate real rates for France and Germany. Before this date real rates were computed by estimating a combined real yield curve for France and Germany.
Chart 15 Euro area zero coupon break-even inflation rates and inflation-linked swap rates
(percentages per annum; fi ve-day moving averages of daily data; seasonally adjusted)
1.8
2.0
2.2
2.4
2.6
2.8
1.8
2.0
2.2
2.4
2.6
2.8
2011 2012
five-year forward break-even inflation rate
five years ahead
five-year forward inflation-linked swap rate
five years ahead
Aug. Oct. Dec. Apr. JuneFeb.
Sources: Thomson Reuters and ECB calculations.Notes: Since the end of August 2011 break-even infl ation rates have been computed as a GDP-weighted average of separately estimated break-even rates for France and Germany. Before this date break-even infl ation rates were computed by comparing yields from the nominal yield curve of AAA-rated euro area government bonds with a combined real yield curve derived from French and German infl ation-linked government bonds.
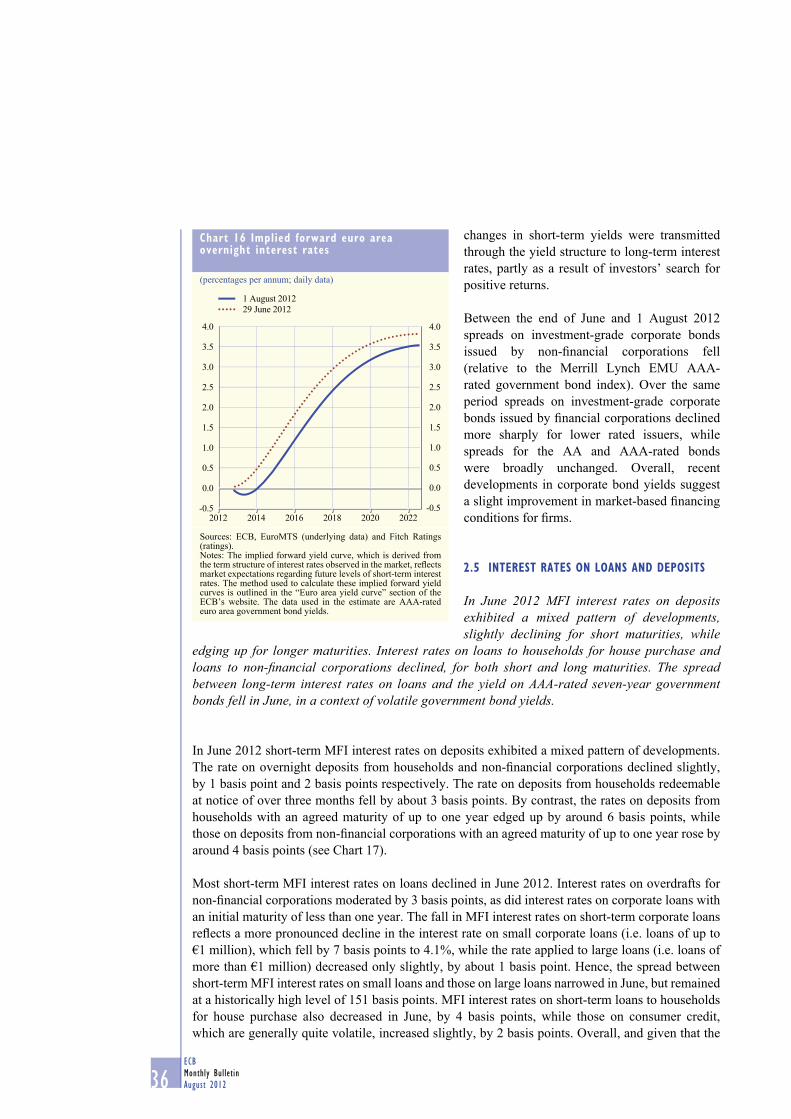
36ECB
Monthly Bulletin
August 2012
changes in short-term yields were transmitted
through the yield structure to long-term interest
rates, partly as a result of investors’ search for
positive returns.
Between the end of June and 1 August 2012
spreads on investment-grade corporate bonds
issued by non-fi nancial corporations fell
(relative to the Merrill Lynch EMU AAA-
rated government bond index). Over the same
period spreads on investment-grade corporate
bonds issued by fi nancial corporations declined
more sharply for lower rated issuers, while
spreads for the AA and AAA-rated bonds
were broadly unchanged. Overall, recent
developments in corporate bond yields suggest
a slight improvement in market-based fi nancing
conditions for fi rms.
2.5 INTEREST RATES ON LOANS AND DEPOSITS
In June 2012 MFI interest rates on deposits exhibited a mixed pattern of developments, slightly declining for short maturities, while
edging up for longer maturities. Interest rates on loans to households for house purchase and loans to non-fi nancial corporations declined, for both short and long maturities. The spread between long-term interest rates on loans and the yield on AAA-rated seven-year government bonds fell in June, in a context of volatile government bond yields.
In June 2012 short-term MFI interest rates on deposits exhibited a mixed pattern of developments.
The rate on overnight deposits from households and non-fi nancial corporations declined slightly,
by 1 basis point and 2 basis points respectively. The rate on deposits from households redeemable
at notice of over three months fell by about 3 basis points. By contrast, the rates on deposits from
households with an agreed maturity of up to one year edged up by around 6 basis points, while
those on deposits from non-fi nancial corporations with an agreed maturity of up to one year rose by
around 4 basis points (see Chart 17).
Most short-term MFI interest rates on loans declined in June 2012. Interest rates on overdrafts for
non-fi nancial corporations moderated by 3 basis points, as did interest rates on corporate loans with
an initial maturity of less than one year. The fall in MFI interest rates on short-term corporate loans
refl ects a more pronounced decline in the interest rate on small corporate loans (i.e. loans of up to
€1 million), which fell by 7 basis points to 4.1%, while the rate applied to large loans (i.e. loans of
more than €1 million) decreased only slightly, by about 1 basis point. Hence, the spread between
short-term MFI interest rates on small loans and those on large loans narrowed in June, but remained
at a historically high level of 151 basis points. MFI interest rates on short-term loans to households
for house purchase also decreased in June, by 4 basis points, while those on consumer credit,
which are generally quite volatile, increased slightly, by 2 basis points. Overall, and given that the
Chart 16 Implied forward euro area overnight interest rates
(percentages per annum; daily data)
-0.5
0.0
0.5
1.0
1.5
2.0
2.5
3.0
3.5
4.0
-0.5
0.0
0.5
1.0
1.5
2.0
2.5
3.0
3.5
4.0
1 August 2012
29 June 2012
2012 2014 2016 2018 2020 2022
Sources: ECB, EuroMTS (underlying data) and Fitch Ratings (ratings).Notes: The implied forward yield curve, which is derived from the term structure of interest rates observed in the market, refl ects market expectations regarding future levels of short-term interest rates. The method used to calculate these implied forward yield curves is outlined in the “Euro area yield curve” section of the ECB’s website. The data used in the estimate are AAA-rated euro area government bond yields.
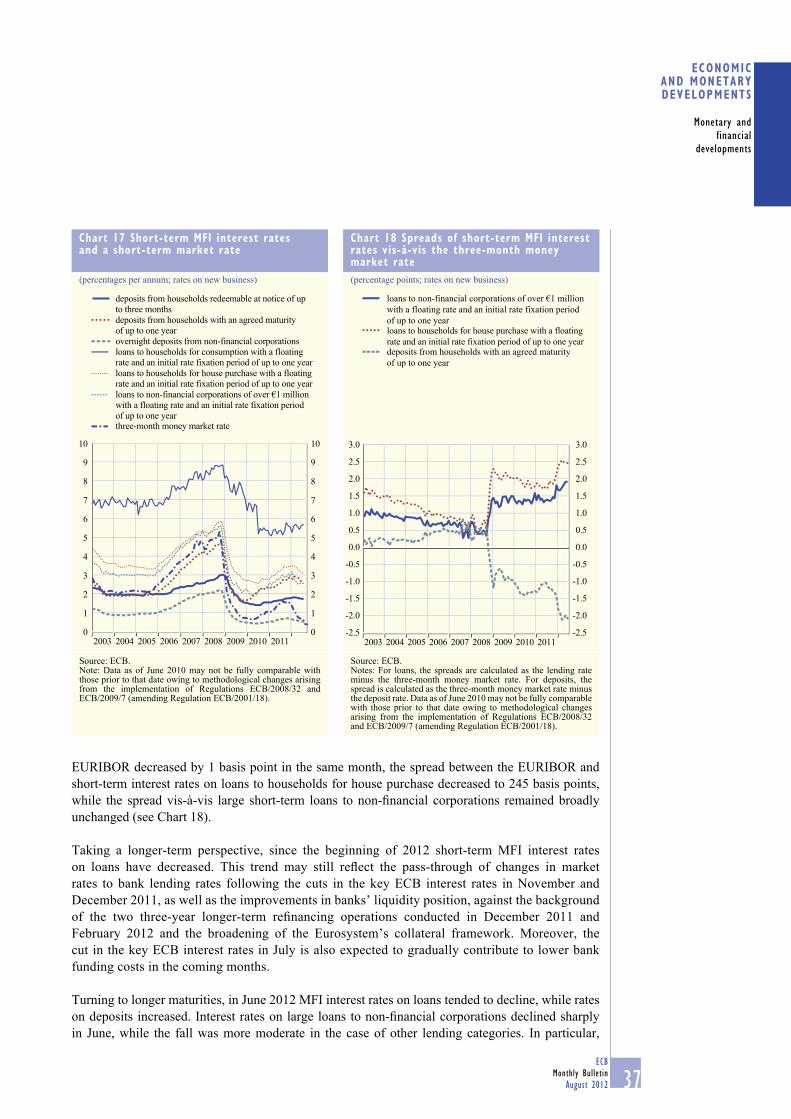
37ECB
Monthly Bulletin
August 2012
ECONOMIC AND MONETARYDEVELOPMENTS
Monetary and
financial
developments
EURIBOR decreased by 1 basis point in the same month, the spread between the EURIBOR and
short-term interest rates on loans to households for house purchase decreased to 245 basis points,
while the spread vis-à-vis large short-term loans to non-fi nancial corporations remained broadly
unchanged (see Chart 18).
Taking a longer-term perspective, since the beginning of 2012 short-term MFI interest rates
on loans have decreased. This trend may still refl ect the pass-through of changes in market
rates to bank lending rates following the cuts in the key ECB interest rates in November and
December 2011, as well as the improvements in banks’ liquidity position, against the background
of the two three-year longer-term refi nancing operations conducted in December 2011 and
February 2012 and the broadening of the Eurosystem’s collateral framework. Moreover, the
cut in the key ECB interest rates in July is also expected to gradually contribute to lower bank
funding costs in the coming months.
Turning to longer maturities, in June 2012 MFI interest rates on loans tended to decline, while rates
on deposits increased. Interest rates on large loans to non-fi nancial corporations declined sharply
in June, while the fall was more moderate in the case of other lending categories. In particular,
Chart 17 Short-term MFI interest rates and a short-term market rate
(percentages per annum; rates on new business)
0
1
2
3
4
5
6
7
8
9
10
0
1
2
3
4
5
6
7
8
9
10
deposits from households redeemable at notice of up
to three months
deposits from households with an agreed maturity
of up to one year
overnight deposits from non-financial corporations
loans to households for consumption with a floating
loans to households for house purchase with a floating
loans to non-financial corporations of over €1 million
three-month money market rate
2003 2004 2005 2006 2007 2008 2009 2010 2011
with a floating rate and an initial rate fixation period
of up to one year
rate and an initial rate fixation period of up to one year
rate and an initial rate fixation period of up to one year
Source: ECB.Note: Data as of June 2010 may not be fully comparable with those prior to that date owing to methodological changes arising from the implementation of Regulations ECB/2008/32 and ECB/2009/7 (amending Regulation ECB/2001/18).
Chart 18 Spreads of short-term MFI interest rates vis-à-vis the three-month money market rate
(percentage points; rates on new business)
-2.5
-2.0
-1.5
-1.0
-0.5
0.0
0.5
1.0
1.5
2.0
2.5
3.0
-2.5
-2.0
-1.5
-1.0
-0.5
0.0
0.5
1.0
1.5
2.0
2.5
3.0
2003 2004 2005 2006 2007 2008 2009 2010 2011
loans to non-financial corporations of over €1 millionwith a floating rate and an initial rate fixation period of up to one yearloans to households for house purchase with a floatingrate and an initial rate fixation period of up to one yeardeposits from households with an agreed maturity of up to one year
Source: ECB.Notes: For loans, the spreads are calculated as the lending rate minus the three-month money market rate. For deposits, the spread is calculated as the three-month money market rate minus the deposit rate. Data as of June 2010 may not be fully comparable with those prior to that date owing to methodological changes arising from the implementation of Regulations ECB/2008/32 and ECB/2009/7 (amending Regulation ECB/2001/18).
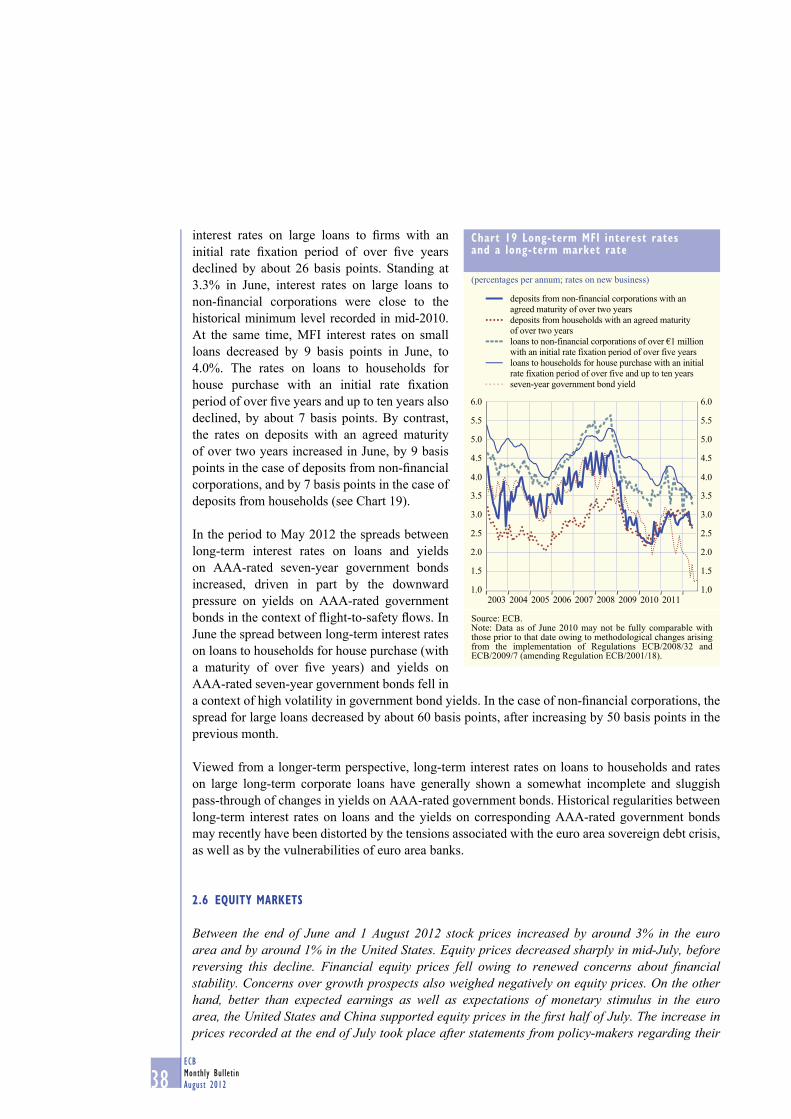
38ECB
Monthly Bulletin
August 2012
interest rates on large loans to fi rms with an
initial rate fi xation period of over fi ve years
declined by about 26 basis points. Standing at
3.3% in June, interest rates on large loans to
non-fi nancial corporations were close to the
historical minimum level recorded in mid-2010.
At the same time, MFI interest rates on small
loans decreased by 9 basis points in June, to
4.0%. The rates on loans to households for
house purchase with an initial rate fi xation
period of over fi ve years and up to ten years also
declined, by about 7 basis points. By contrast,
the rates on deposits with an agreed maturity
of over two years increased in June, by 9 basis
points in the case of deposits from non-fi nancial
corporations, and by 7 basis points in the case of
deposits from households (see Chart 19).
In the period to May 2012 the spreads between
long-term interest rates on loans and yields
on AAA-rated seven-year government bonds
increased, driven in part by the downward
pressure on yields on AAA-rated government
bonds in the context of fl ight-to-safety fl ows. In
June the spread between long-term interest rates
on loans to households for house purchase (with
a maturity of over fi ve years) and yields on
AAA-rated seven-year government bonds fell in
a context of high volatility in government bond yields. In the case of non-fi nancial corporations, the
spread for large loans decreased by about 60 basis points, after increasing by 50 basis points in the
previous month.
Viewed from a longer-term perspective, long-term interest rates on loans to households and rates
on large long-term corporate loans have generally shown a somewhat incomplete and sluggish
pass-through of changes in yields on AAA-rated government bonds. Historical regularities between
long-term interest rates on loans and the yields on corresponding AAA-rated government bonds
may recently have been distorted by the tensions associated with the euro area sovereign debt crisis,
as well as by the vulnerabilities of euro area banks.
2.6 EQUITY MARKETS
Between the end of June and 1 August 2012 stock prices increased by around 3% in the euro area and by around 1% in the United States. Equity prices decreased sharply in mid-July, before reversing this decline. Financial equity prices fell owing to renewed concerns about fi nancial stability. Concerns over growth prospects also weighed negatively on equity prices. On the other hand, better than expected earnings as well as expectations of monetary stimulus in the euro area, the United States and China supported equity prices in the fi rst half of July. The increase in prices recorded at the end of July took place after statements from policy-makers regarding their
Chart 19 Long-term MFI interest rates and a long-term market rate
(percentages per annum; rates on new business)
1.0
1.5
2.0
2.5
3.0
3.5
4.0
4.5
5.0
5.5
6.0
1.0
1.5
2.0
2.5
3.0
3.5
4.0
4.5
5.0
5.5
6.0
2003 2004 2005 2006 2007 2008 2009 2010 2011
deposits from non-financial corporations with an
agreed maturity of over two years
deposits from households with an agreed maturity
of over two years
loans to non-financial corporations of over €1 million
with an initial rate fixation period of over five years
loans to households for house purchase with an initial
rate fixation period of over five and up to ten years
seven-year government bond yield
Source: ECB.Note: Data as of June 2010 may not be fully comparable with those prior to that date owing to methodological changes arising from the implementation of Regulations ECB/2008/32 and ECB/2009/7 (amending Regulation ECB/2001/18).
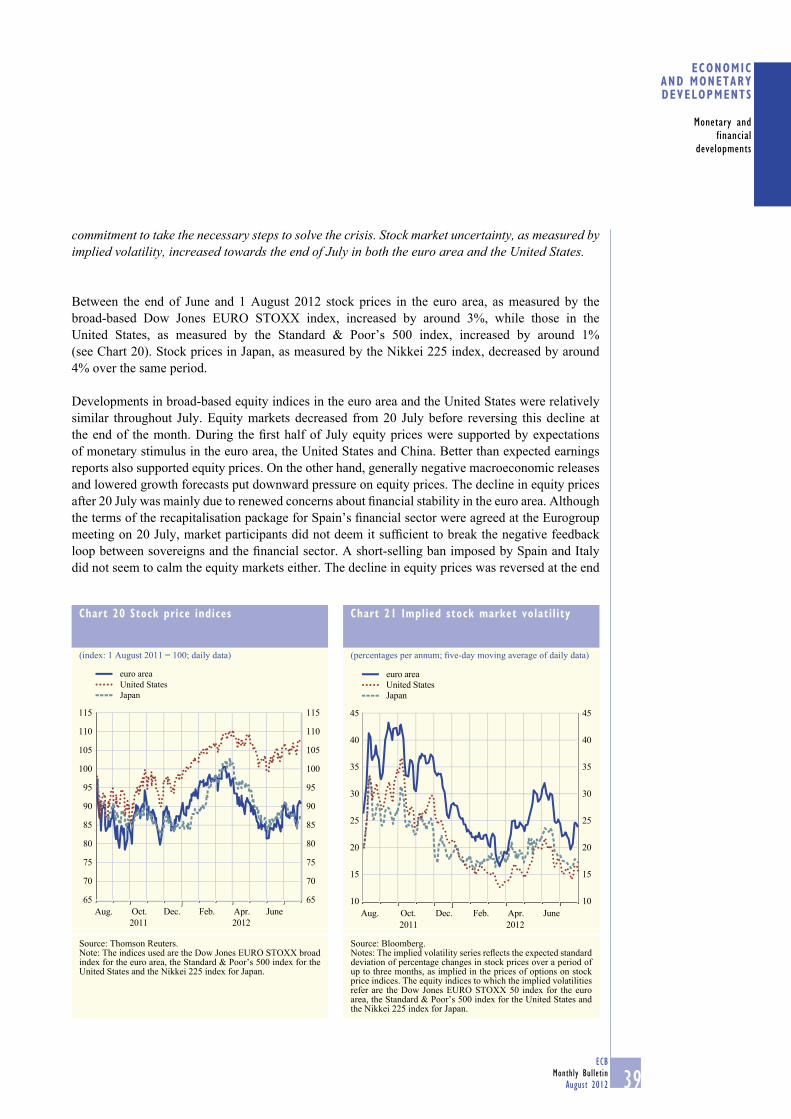
39ECB
Monthly Bulletin
August 2012
ECONOMIC AND MONETARYDEVELOPMENTS
Monetary and
financial
developments
commitment to take the necessary steps to solve the crisis. Stock market uncertainty, as measured by implied volatility, increased towards the end of July in both the euro area and the United States.
Between the end of June and 1 August 2012 stock prices in the euro area, as measured by the
broad-based Dow Jones EURO STOXX index, increased by around 3%, while those in the
United States, as measured by the Standard & Poor’s 500 index, increased by around 1%
(see Chart 20). Stock prices in Japan, as measured by the Nikkei 225 index, decreased by around
4% over the same period.
Developments in broad-based equity indices in the euro area and the United States were relatively
similar throughout July. Equity markets decreased from 20 July before reversing this decline at
the end of the month. During the fi rst half of July equity prices were supported by expectations
of monetary stimulus in the euro area, the United States and China. Better than expected earnings
reports also supported equity prices. On the other hand, generally negative macroeconomic releases
and lowered growth forecasts put downward pressure on equity prices. The decline in equity prices
after 20 July was mainly due to renewed concerns about fi nancial stability in the euro area. Although
the terms of the recapitalisation package for Spain’s fi nancial sector were agreed at the Eurogroup
meeting on 20 July, market participants did not deem it suffi cient to break the negative feedback
loop between sovereigns and the fi nancial sector. A short-selling ban imposed by Spain and Italy
did not seem to calm the equity markets either. The decline in equity prices was reversed at the end
Chart 20 Stock price indices
(index: 1 August 2011 = 100; daily data)
65
70
75
80
85
90
95
100
105
110
115
65
70
75
80
85
90
95
100
105
110
115
euro areaUnited StatesJapan
2011 2012
Aug. Oct. Dec. Feb. Apr. June
Source: Thomson Reuters.Note: The indices used are the Dow Jones EURO STOXX broad index for the euro area, the Standard & Poor’s 500 index for the United States and the Nikkei 225 index for Japan.
Chart 21 Implied stock market volatility
(percentages per annum; fi ve-day moving average of daily data)
10
15
20
25
30
35
40
45
10
15
20
25
30
35
40
45
euro area
United States
Japan
Aug. Oct. Dec. Feb. Apr. June
2011 2012
Source: Bloomberg.Notes: The implied volatility series refl ects the expected standard deviation of percentage changes in stock prices over a period of up to three months, as implied in the prices of options on stock price indices. The equity indices to which the implied volatilities refer are the Dow Jones EURO STOXX 50 index for the euro area, the Standard & Poor’s 500 index for the United States and the Nikkei 225 index for Japan.
40ECB
Monthly Bulletin
August 2012
of July after statements from policy-makers regarding their commitment to take the necessary steps
to solve the crisis.
Equity price developments diverged across the euro area in July. Until 20 July Spanish and
Italian equity prices fell while equity prices rose in most other countries. Thereafter all equity
markets declined, with Spanish and Italian equity prices recording the sharpest decline. Spanish
and Italian equities also led the subsequent recovery. Overall, in the reference period Spanish
and Italian equity prices declined by 4% and 2% respectively, while, for example, German equity
prices recorded an increase of 5%. In the euro area as a whole, fi nancial equity prices declined
by around 1% in the period under review, whereas non-fi nancial equity prices recorded a
3% increase.
Stock market uncertainty, as measured by implied volatility, fell in the fi rst half of July before
increasing from 20 July. Implied volatility in the euro area stood at 24% on 1 August. In the
United States, implied stock market volatility also declined in the fi rst half of July, before increasing
at the end of the reference period. Implied volatility in the United States, standing at 16%, continues
to be lower than that recorded in the euro area. In both economic areas, the levels of stock market
uncertainty in the middle of July were close to the lowest levels recorded so far this year. However,
after increasing again, the implied volatilities in the two economic areas returned to the average
level for 2012 at the end of July (see Chart 21).
Box 3
INTEGRATED EURO AREA ACCOUNTS FOR THE FIRST QUARTER OF 20121
The integrated euro area accounts released on 1 August 2012, covering data up to the fi rst
quarter of 2012, offer comprehensive information on the income, spending, fi nancing and
portfolio decisions of institutional sectors in the euro area. In the fi rst quarter of 2012, the further
weakening of economic activity kept the correction of imbalances that had begun during the
recovery phase at a standstill, as was the case in the previous quarter. The household saving ratio
stabilised close to historically low levels and household net worth declined, while government
defi cits decreased only slightly. The net borrowing of non-fi nancial corporations (NFCs)
returned to positive territory, but this was due to declining retained earnings, while gross capital
formation contracted and inventories were reduced at a higher rate. At the same time, the euro
area’s external balance remained in surplus for the second consecutive quarter.
Euro area income and net lending/net borrowing
Annual growth in euro area nominal disposable income fell further in the fi rst quarter of 2012,
to 1.7%, after the signifi cant decrease of 1 percentage point, to 1.8%, in the previous quarter
(see Chart A). As income growth slowed down, euro area gross saving growth also fell from
3.8% to 1.4% on an annual basis. This was refl ected across sectors in a sharp decline in NFCs’
retained earnings (savings), a slower growth of fi nancial corporations’ retained earnings and,
in contrast to what was observed in previous quarters, no further correction of government
1 Detailed data can be found on the ECB’s website at http://sdw.ecb.europa.eu/browse.do?node=2019181
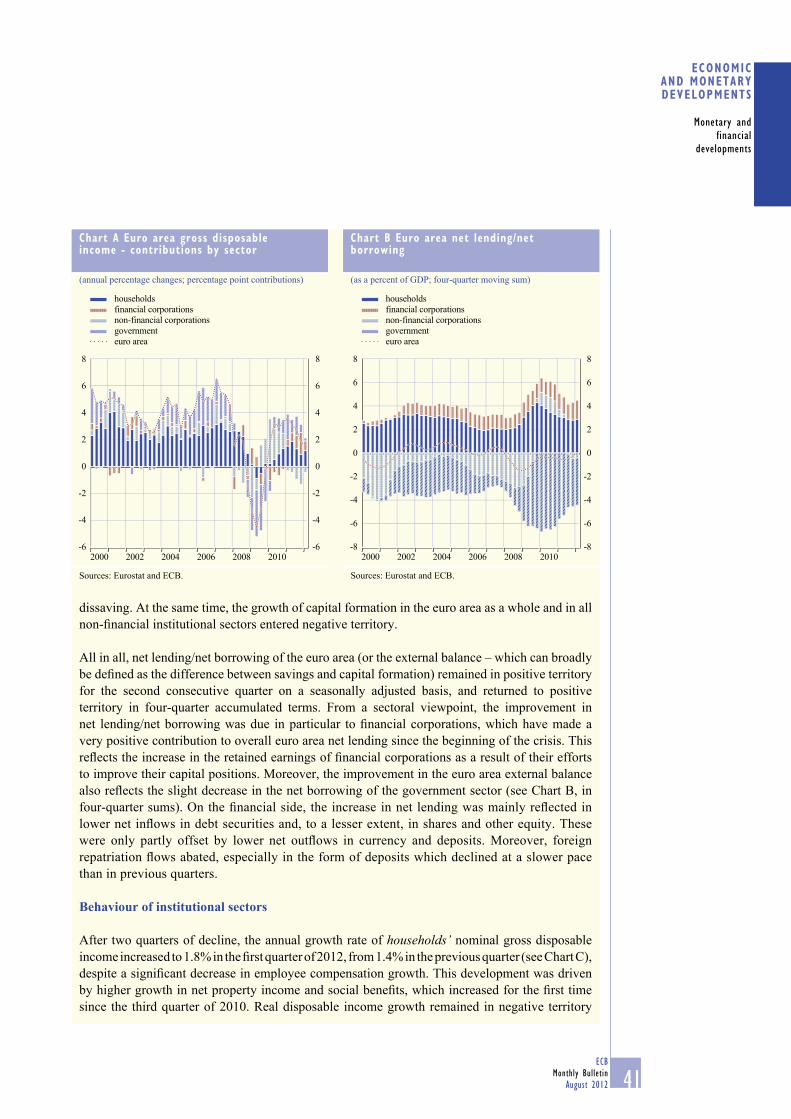
41ECB
Monthly Bulletin
August 2012
ECONOMIC AND MONETARYDEVELOPMENTS
Monetary and
financial
developments
dissaving. At the same time, the growth of capital formation in the euro area as a whole and in all
non-fi nancial institutional sectors entered negative territory.
All in all, net lending/net borrowing of the euro area (or the external balance – which can broadly
be defi ned as the difference between savings and capital formation) remained in positive territory
for the second consecutive quarter on a seasonally adjusted basis, and returned to positive
territory in four-quarter accumulated terms. From a sectoral viewpoint, the improvement in
net lending/net borrowing was due in particular to fi nancial corporations, which have made a
very positive contribution to overall euro area net lending since the beginning of the crisis. This
refl ects the increase in the retained earnings of fi nancial corporations as a result of their efforts
to improve their capital positions. Moreover, the improvement in the euro area external balance
also refl ects the slight decrease in the net borrowing of the government sector (see Chart B, in
four-quarter sums). On the fi nancial side, the increase in net lending was mainly refl ected in
lower net infl ows in debt securities and, to a lesser extent, in shares and other equity. These
were only partly offset by lower net outfl ows in currency and deposits. Moreover, foreign
repatriation fl ows abated, especially in the form of deposits which declined at a slower pace
than in previous quarters.
Behaviour of institutional sectors
After two quarters of decline, the annual growth rate of households’ nominal gross disposable
income increased to 1.8% in the fi rst quarter of 2012, from 1.4% in the previous quarter (see Chart C),
despite a signifi cant decrease in employee compensation growth. This development was driven
by higher growth in net property income and social benefi ts, which increased for the fi rst time
since the third quarter of 2010. Real disposable income growth remained in negative territory
Chart A Euro area gross disposable income - contributions by sector
(annual percentage changes; percentage point contributions)
-6
-4
-2
0
2
4
6
8
-6
-4
-2
0
2
4
6
8
2000 2002 2004 2006 2008 2010
households
non-financial corporations
financial corporations
government
euro area
Sources: Eurostat and ECB.
Chart B Euro area net lending/net borrowing
(as a percent of GDP; four-quarter moving sum)
-8
-6
-4
-2
0
2
4
6
8
-8
-6
-4
-2
0
2
4
6
8
2000 2002 2004 2006 2008 2010
households
non-financial corporations
financial corporations
government
euro area
Sources: Eurostat and ECB.
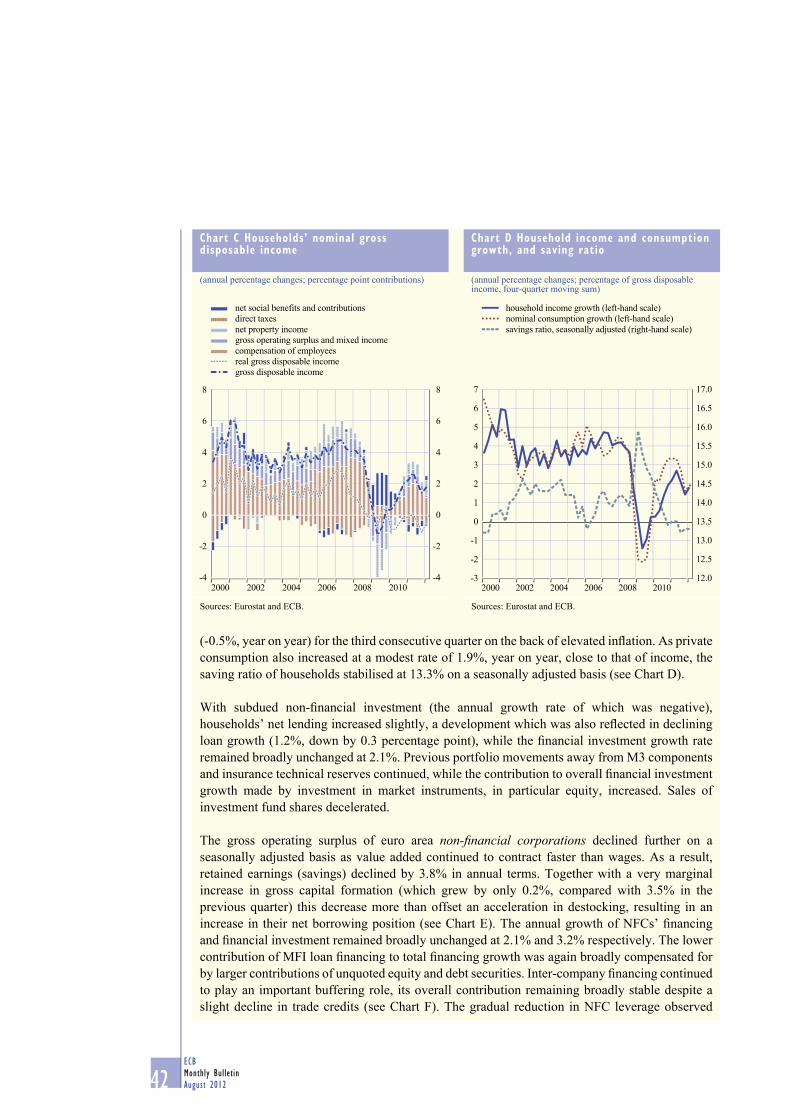
42ECB
Monthly Bulletin
August 2012
(-0.5%, year on year) for the third consecutive quarter on the back of elevated infl ation. As private
consumption also increased at a modest rate of 1.9%, year on year, close to that of income, the
saving ratio of households stabilised at 13.3% on a seasonally adjusted basis (see Chart D).
With subdued non-fi nancial investment (the annual growth rate of which was negative),
households’ net lending increased slightly, a development which was also refl ected in declining
loan growth (1.2%, down by 0.3 percentage point), while the fi nancial investment growth rate
remained broadly unchanged at 2.1%. Previous portfolio movements away from M3 components
and insurance technical reserves continued, while the contribution to overall fi nancial investment
growth made by investment in market instruments, in particular equity, increased. Sales of
investment fund shares decelerated.
The gross operating surplus of euro area non-fi nancial corporations declined further on a
seasonally adjusted basis as value added continued to contract faster than wages. As a result,
retained earnings (savings) declined by 3.8% in annual terms. Together with a very marginal
increase in gross capital formation (which grew by only 0.2%, compared with 3.5% in the
previous quarter) this decrease more than offset an acceleration in destocking, resulting in an
increase in their net borrowing position (see Chart E). The annual growth of NFCs’ fi nancing
and fi nancial investment remained broadly unchanged at 2.1% and 3.2% respectively. The lower
contribution of MFI loan fi nancing to total fi nancing growth was again broadly compensated for
by larger contributions of unquoted equity and debt securities. Inter-company fi nancing continued
to play an important buffering role, its overall contribution remaining broadly stable despite a
slight decline in trade credits (see Chart F). The gradual reduction in NFC leverage observed
Chart C Households’ nominal gross disposable income
(annual percentage changes; percentage point contributions)
-4
-2
0
2
4
6
8
-4
-2
0
2
4
6
8
2000 2002 2004 2006 2008 2010
net social benefits and contributions
direct taxes
net property income
gross operating surplus and mixed income
compensation of employees
real gross disposable income
gross disposable income
Sources: Eurostat and ECB.
Chart D Household income and consumption growth, and saving ratio
(annual percentage changes; percentage of gross disposable income, four-quarter moving sum)
12.0
12.5
13.0
13.5
14.0
14.5
15.0
15.5
16.0
16.5
17.0
-3
-2
-1
0
1
2
3
4
5
6
7
2000 2002 2004 2006 2008 2010
household income growth (left-hand scale)
nominal consumption growth (left-hand scale)
savings ratio, seasonally adjusted (right-hand scale)
Sources: Eurostat and ECB.
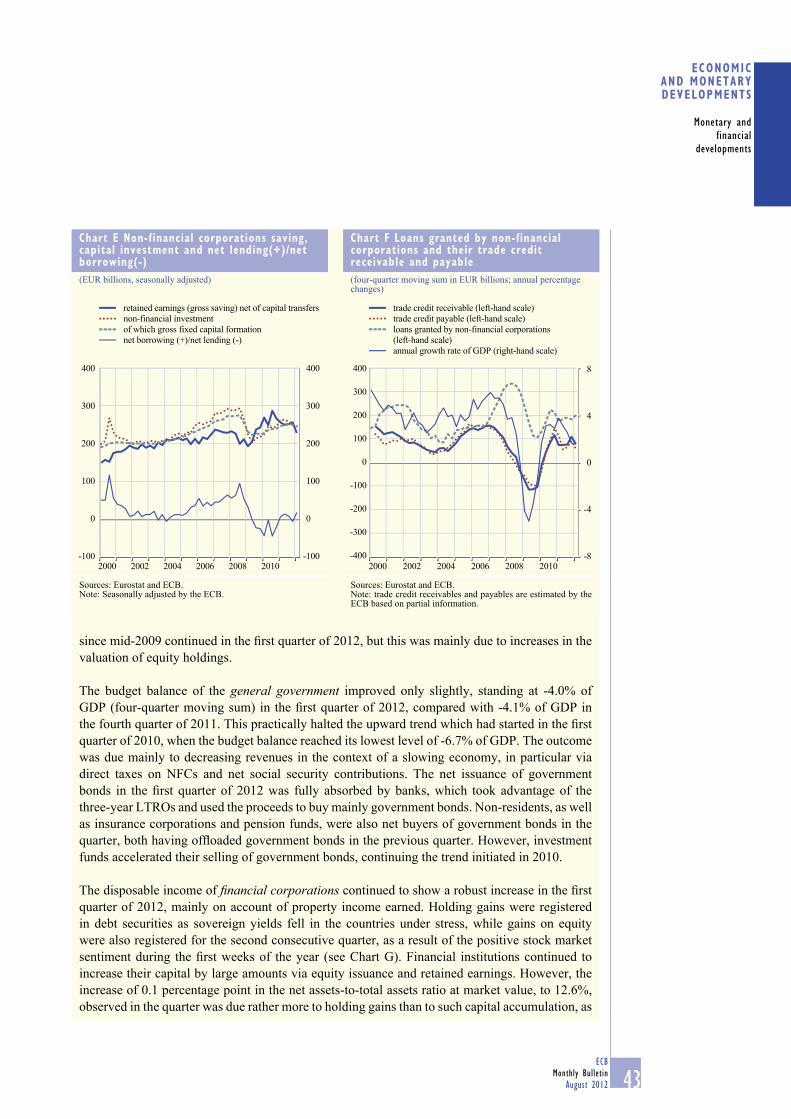
43ECB
Monthly Bulletin
August 2012
ECONOMIC AND MONETARYDEVELOPMENTS
Monetary and
financial
developments
since mid-2009 continued in the fi rst quarter of 2012, but this was mainly due to increases in the
valuation of equity holdings.
The budget balance of the general government improved only slightly, standing at -4.0% of
GDP (four-quarter moving sum) in the fi rst quarter of 2012, compared with -4.1% of GDP in
the fourth quarter of 2011. This practically halted the upward trend which had started in the fi rst
quarter of 2010, when the budget balance reached its lowest level of -6.7% of GDP. The outcome
was due mainly to decreasing revenues in the context of a slowing economy, in particular via
direct taxes on NFCs and net social security contributions. The net issuance of government
bonds in the fi rst quarter of 2012 was fully absorbed by banks, which took advantage of the
three-year LTROs and used the proceeds to buy mainly government bonds. Non-residents, as well
as insurance corporations and pension funds, were also net buyers of government bonds in the
quarter, both having offl oaded government bonds in the previous quarter. However, investment
funds accelerated their selling of government bonds, continuing the trend initiated in 2010.
The disposable income of fi nancial corporations continued to show a robust increase in the fi rst
quarter of 2012, mainly on account of property income earned. Holding gains were registered
in debt securities as sovereign yields fell in the countries under stress, while gains on equity
were also registered for the second consecutive quarter, as a result of the positive stock market
sentiment during the fi rst weeks of the year (see Chart G). Financial institutions continued to
increase their capital by large amounts via equity issuance and retained earnings. However, the
increase of 0.1 percentage point in the net assets-to-total assets ratio at market value, to 12.6%,
observed in the quarter was due rather more to holding gains than to such capital accumulation, as
Chart E Non-financial corporations saving, capital investment and net lending(+)/net borrowing(-)
(EUR billions, seasonally adjusted)
-100
0
100
200
300
400
-100
0
100
200
300
400
2000 2002 2004 2006 2008 2010
retained earnings (gross saving) net of capital transfers
non-financial investment
of which gross fixed capital formation
net borrowing (+)/net lending (-)
Sources: Eurostat and ECB.Note: Seasonally adjusted by the ECB.
Chart F Loans granted by non-financial corporations and their trade credit receivable and payable
(four-quarter moving sum in EUR billions; annual percentage changes)
-8
-4
0
4
8
-400
-300
-200
-100
0
100
200
300
400
2000 2002 2004 2006 2008 2010
trade credit receivable (left-hand scale)
trade credit payable (left-hand scale)
loans granted by non-financial corporations
(left-hand scale)
annual growth rate of GDP (right-hand scale)
Sources: Eurostat and ECB.Note: trade credit receivables and payables are estimated by the ECB based on partial information.
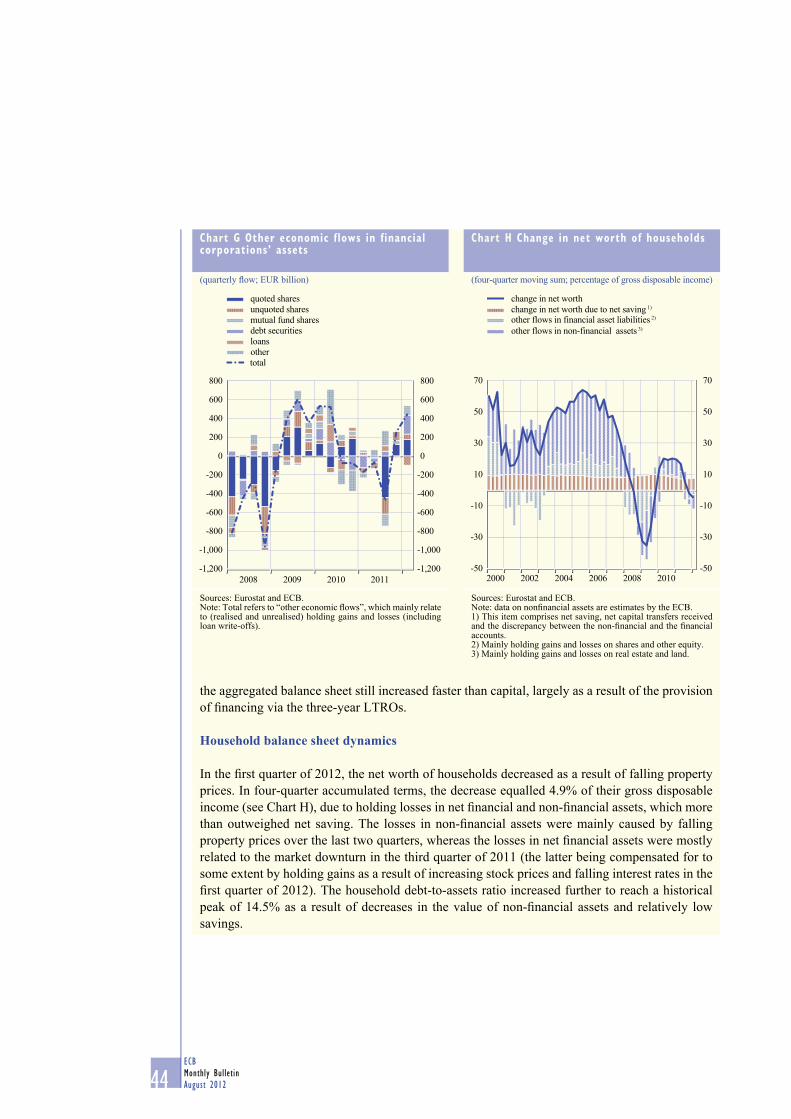
44ECB
Monthly Bulletin
August 2012
the aggregated balance sheet still increased faster than capital, largely as a result of the provision
of fi nancing via the three-year LTROs.
Household balance sheet dynamics
In the fi rst quarter of 2012, the net worth of households decreased as a result of falling property
prices. In four-quarter accumulated terms, the decrease equalled 4.9% of their gross disposable
income (see Chart H), due to holding losses in net fi nancial and non-fi nancial assets, which more
than outweighed net saving. The losses in non-fi nancial assets were mainly caused by falling
property prices over the last two quarters, whereas the losses in net fi nancial assets were mostly
related to the market downturn in the third quarter of 2011 (the latter being compensated for to
some extent by holding gains as a result of increasing stock prices and falling interest rates in the
fi rst quarter of 2012). The household debt-to-assets ratio increased further to reach a historical
peak of 14.5% as a result of decreases in the value of non-fi nancial assets and relatively low
savings.
Chart G Other economic flows in financial corporations’ assets
(quarterly fl ow; EUR billion)
-1,200
-1,000
-800
-600
-400
-200
0
200
400
600
800
-1,200
-1,000
-800
-600
-400
-200
0
200
400
600
800
2008 2009 2010 2011
other
loans
mutual fund shares
debt securities
unquoted shares
quoted shares
total
Sources: Eurostat and ECB.Note: Total refers to “other economic fl ows”, which mainly relate to (realised and unrealised) holding gains and losses (including loan write-offs).
Chart H Change in net worth of households
(four-quarter moving sum; percentage of gross disposable income)
-50
-30
-10
10
30
50
70
-50
-30
-10
10
30
50
70
2000 2002 2004 2006 2008 2010
other flows in non-financial assets 3)
other flows in financial asset liabilities 2)
change in net worth due to net saving 1)
change in net worth
Sources: Eurostat and ECB. Note: data on nonfi nancial assets are estimates by the ECB.1) This item comprises net saving, net capital transfers received and the discrepancy between the non-fi nancial and the fi nancial accounts.2) Mainly holding gains and losses on shares and other equity.3) Mainly holding gains and losses on real estate and land.
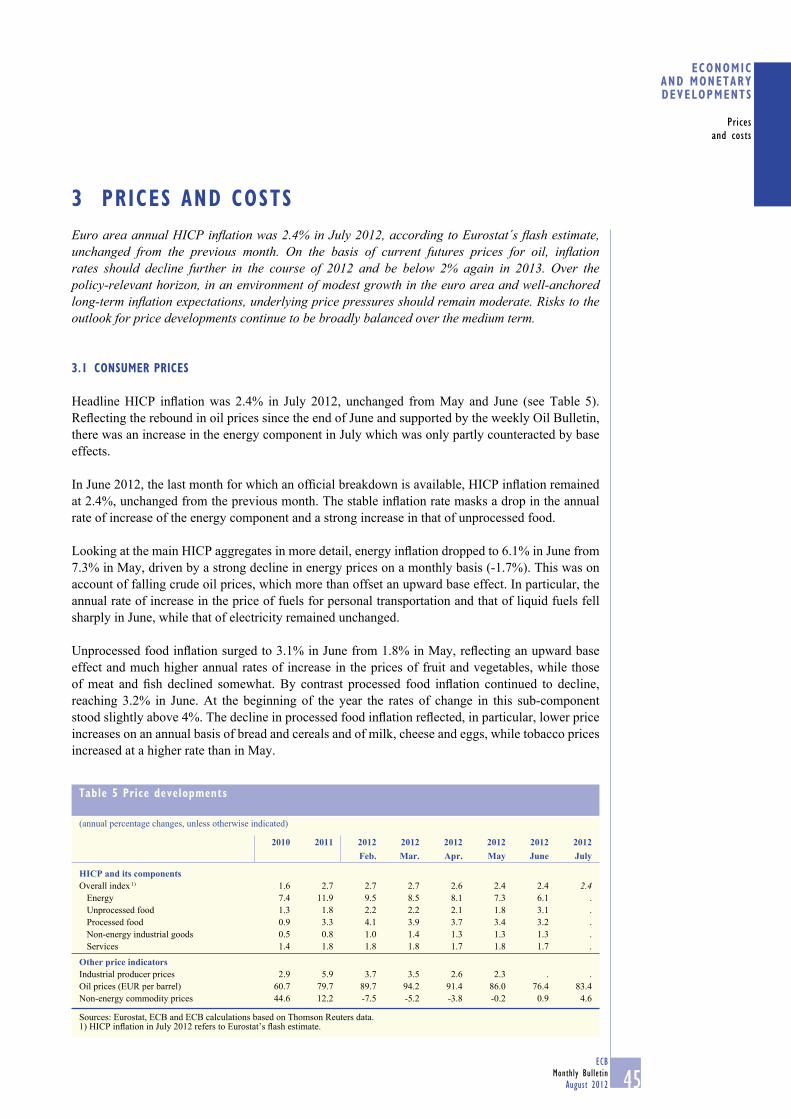
45ECB
Monthly Bulletin
August 2012
ECONOMIC AND MONETARYDEVELOPMENTS
Prices
and costs
Euro area annual HICP infl ation was 2.4% in July 2012, according to Eurostat´s fl ash estimate, unchanged from the previous month. On the basis of current futures prices for oil, infl ation rates should decline further in the course of 2012 and be below 2% again in 2013. Over the policy-relevant horizon, in an environment of modest growth in the euro area and well-anchored long-term infl ation expectations, underlying price pressures should remain moderate. Risks to the outlook for price developments continue to be broadly balanced over the medium term.
3.1 CONSUMER PRICES
Headline HICP infl ation was 2.4% in July 2012, unchanged from May and June (see Table 5).
Refl ecting the rebound in oil prices since the end of June and supported by the weekly Oil Bulletin,
there was an increase in the energy component in July which was only partly counteracted by base
effects.
In June 2012, the last month for which an offi cial breakdown is available, HICP infl ation remained
at 2.4%, unchanged from the previous month. The stable infl ation rate masks a drop in the annual
rate of increase of the energy component and a strong increase in that of unprocessed food.
Looking at the main HICP aggregates in more detail, energy infl ation dropped to 6.1% in June from
7.3% in May, driven by a strong decline in energy prices on a monthly basis (-1.7%). This was on
account of falling crude oil prices, which more than offset an upward base effect. In particular, the
annual rate of increase in the price of fuels for personal transportation and that of liquid fuels fell
sharply in June, while that of electricity remained unchanged.
Unprocessed food infl ation surged to 3.1% in June from 1.8% in May, refl ecting an upward base
effect and much higher annual rates of increase in the prices of fruit and vegetables, while those
of meat and fi sh declined somewhat. By contrast processed food infl ation continued to decline,
reaching 3.2% in June. At the beginning of the year the rates of change in this sub-component
stood slightly above 4%. The decline in processed food infl ation refl ected, in particular, lower price
increases on an annual basis of bread and cereals and of milk, cheese and eggs, while tobacco prices
increased at a higher rate than in May.
3 PRICES AND COSTS
Table 5 Price developments
(annual percentage changes, unless otherwise indicated)
2010 2011 2012 2012 2012 2012 2012 2012Feb. Mar. Apr. May June July
HICP and its componentsOverall index 1) 1.6 2.7 2.7 2.7 2.6 2.4 2.4 2.4
Energy 7.4 11.9 9.5 8.5 8.1 7.3 6.1 .
Unprocessed food 1.3 1.8 2.2 2.2 2.1 1.8 3.1 .
Processed food 0.9 3.3 4.1 3.9 3.7 3.4 3.2 .
Non-energy industrial goods 0.5 0.8 1.0 1.4 1.3 1.3 1.3 .
Services 1.4 1.8 1.8 1.8 1.7 1.8 1.7 .
Other price indicatorsIndustrial producer prices 2.9 5.9 3.7 3.5 2.6 2.3 . .
Oil prices (EUR per barrel) 60.7 79.7 89.7 94.2 91.4 86.0 76.4 83.4
Non-energy commodity prices 44.6 12.2 -7.5 -5.2 -3.8 -0.2 0.9 4.6
Sources: Eurostat, ECB and ECB calculations based on Thomson Reuters data.1) HICP infl ation in July 2012 refers to Eurostat’s fl ash estimate.
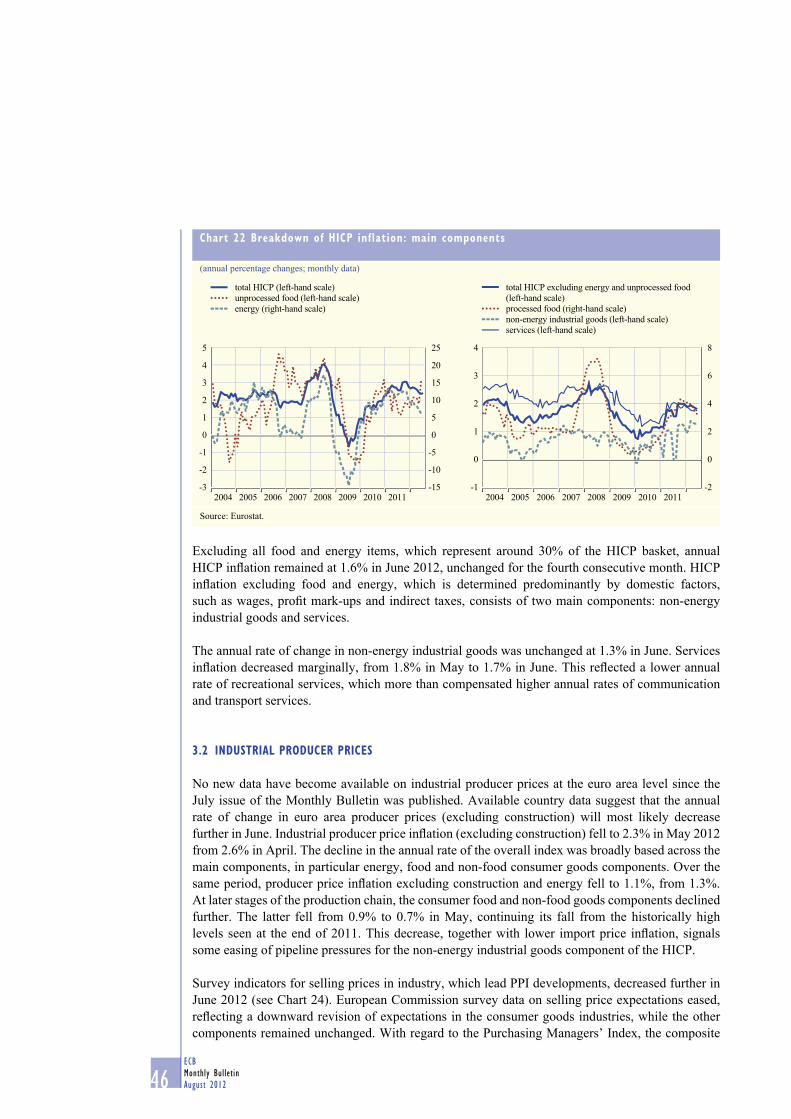
46ECB
Monthly Bulletin
August 2012
Excluding all food and energy items, which represent around 30% of the HICP basket, annual
HICP infl ation remained at 1.6% in June 2012, unchanged for the fourth consecutive month. HICP
infl ation excluding food and energy, which is determined predominantly by domestic factors,
such as wages, profi t mark-ups and indirect taxes, consists of two main components: non-energy
industrial goods and services.
The annual rate of change in non-energy industrial goods was unchanged at 1.3% in June. Services
infl ation decreased marginally, from 1.8% in May to 1.7% in June. This refl ected a lower annual
rate of recreational services, which more than compensated higher annual rates of communication
and transport services.
3.2 INDUSTRIAL PRODUCER PRICES
No new data have become available on industrial producer prices at the euro area level since the
July issue of the Monthly Bulletin was published. Available country data suggest that the annual
rate of change in euro area producer prices (excluding construction) will most likely decrease
further in June. Industrial producer price infl ation (excluding construction) fell to 2.3% in May 2012
from 2.6% in April. The decline in the annual rate of the overall index was broadly based across the
main components, in particular energy, food and non-food consumer goods components. Over the
same period, producer price infl ation excluding construction and energy fell to 1.1%, from 1.3%.
At later stages of the production chain, the consumer food and non-food goods components declined
further. The latter fell from 0.9% to 0.7% in May, continuing its fall from the historically high
levels seen at the end of 2011. This decrease, together with lower import price infl ation, signals
some easing of pipeline pressures for the non-energy industrial goods component of the HICP.
Survey indicators for selling prices in industry, which lead PPI developments, decreased further in
June 2012 (see Chart 24). European Commission survey data on selling price expectations eased,
refl ecting a downward revision of expectations in the consumer goods industries, while the other
components remained unchanged. With regard to the Purchasing Managers’ Index, the composite
Chart 22 Breakdown of HICP inflation: main components
(annual percentage changes; monthly data)
-3
-2
-1
0
1
2
3
4
5
-15
-10
-5
0
5
10
15
20
25
total HICP (left-hand scale)
unprocessed food (left-hand scale)
energy (right-hand scale)
2004 2006 20072005 2008 2009 2010 2011-1
0
1
2
3
4
-2
0
2
4
6
8
total HICP excluding energy and unprocessed food
(left-hand scale)
processed food (right-hand scale)
non-energy industrial goods (left-hand scale)
services (left-hand scale)
2004 2005 2006 2007 2008 2009 2010 2011
Source: Eurostat.
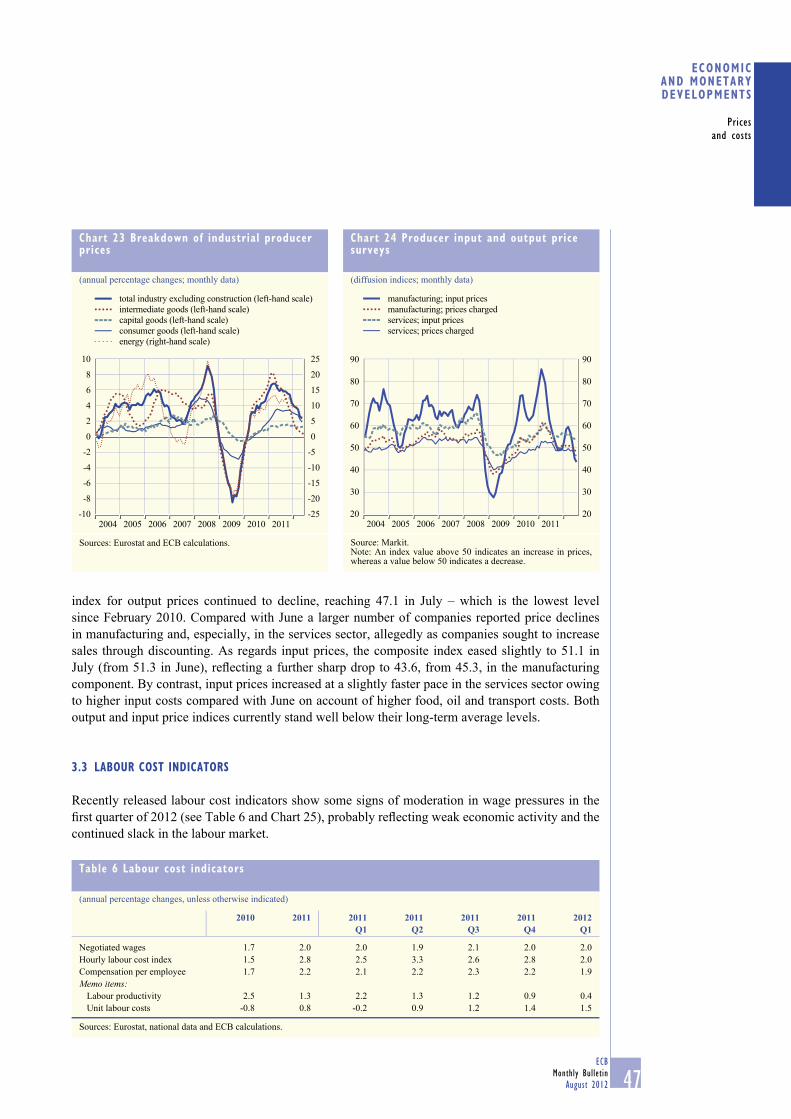
47ECB
Monthly Bulletin
August 2012
ECONOMIC AND MONETARYDEVELOPMENTS
Prices
and costs
index for output prices continued to decline, reaching 47.1 in July – which is the lowest level
since February 2010. Compared with June a larger number of companies reported price declines
in manufacturing and, especially, in the services sector, allegedly as companies sought to increase
sales through discounting. As regards input prices, the composite index eased slightly to 51.1 in
July (from 51.3 in June), refl ecting a further sharp drop to 43.6, from 45.3, in the manufacturing
component. By contrast, input prices increased at a slightly faster pace in the services sector owing
to higher input costs compared with June on account of higher food, oil and transport costs. Both
output and input price indices currently stand well below their long-term average levels.
3.3 LABOUR COST INDICATORS
Recently released labour cost indicators show some signs of moderation in wage pressures in the
fi rst quarter of 2012 (see Table 6 and Chart 25), probably refl ecting weak economic activity and the
continued slack in the labour market.
Chart 23 Breakdown of industrial producer prices
(annual percentage changes; monthly data)
-10
-8
-6
-4
-2
0
2
4
6
8
10
-25
-20
-15
-10
-5
0
5
10
15
20
25
2004 2005 2006 2007 2008 2009 2010 2011
total industry excluding construction (left-hand scale)
intermediate goods (left-hand scale)
capital goods (left-hand scale)
consumer goods (left-hand scale)
energy (right-hand scale)
Sources: Eurostat and ECB calculations.
Chart 24 Producer input and output price surveys
(diffusion indices; monthly data)
20
30
40
50
60
70
80
90
20
30
40
50
60
70
80
90
2004
manufacturing; input prices
manufacturing; prices charged
services; input prices
services; prices charged
20062005 2007 2008 2009 2010 2011
Source: Markit.Note: An index value above 50 indicates an increase in prices, whereas a value below 50 indicates a decrease.
Table 6 Labour cost indicators
(annual percentage changes, unless otherwise indicated)
2010 2011 2011 Q1
2011 Q2
2011 Q3
2011 Q4
2012 Q1
Negotiated wages 1.7 2.0 2.0 1.9 2.1 2.0 2.0
Hourly labour cost index 1.5 2.8 2.5 3.3 2.6 2.8 2.0
Compensation per employee 1.7 2.2 2.1 2.2 2.3 2.2 1.9
Memo items:Labour productivity 2.5 1.3 2.2 1.3 1.2 0.9 0.4
Unit labour costs -0.8 0.8 -0.2 0.9 1.2 1.4 1.5
Sources: Eurostat, national data and ECB calculations.
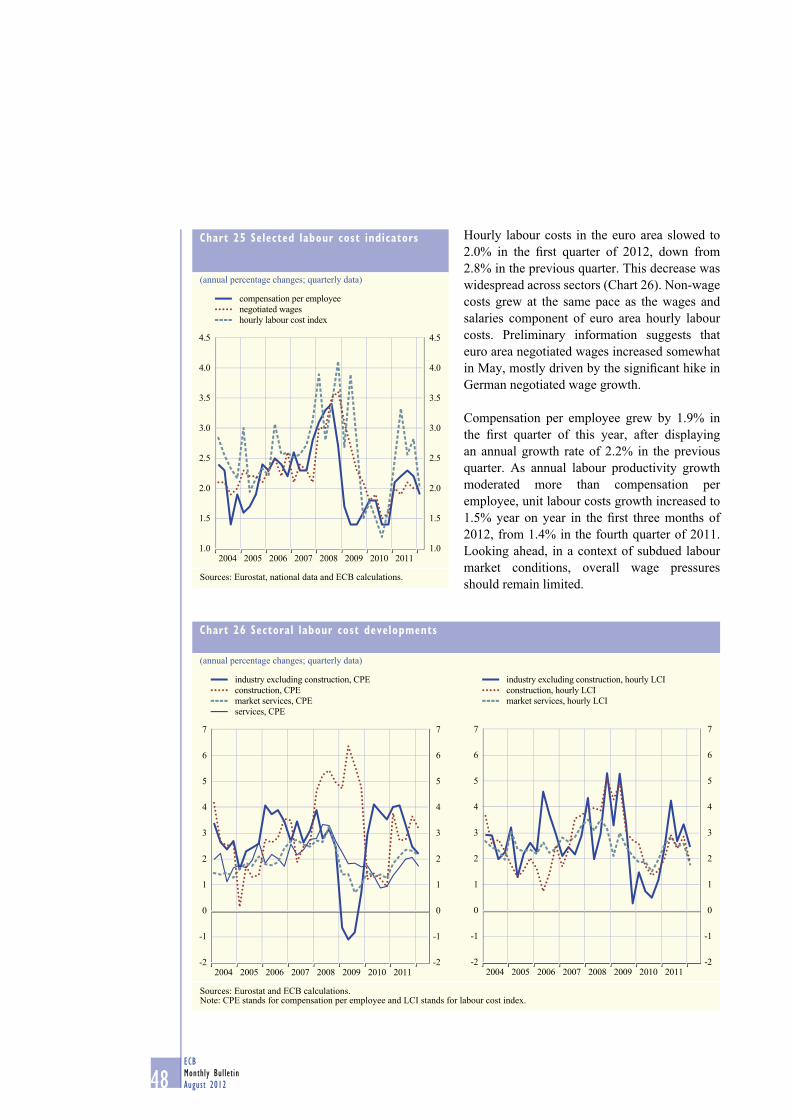
48ECB
Monthly Bulletin
August 2012
Hourly labour costs in the euro area slowed to
2.0% in the fi rst quarter of 2012, down from
2.8% in the previous quarter. This decrease was
widespread across sectors (Chart 26). Non-wage
costs grew at the same pace as the wages and
salaries component of euro area hourly labour
costs. Preliminary information suggests that
euro area negotiated wages increased somewhat
in May, mostly driven by the signifi cant hike in
German negotiated wage growth.
Compensation per employee grew by 1.9% in
the fi rst quarter of this year, after displaying
an annual growth rate of 2.2% in the previous
quarter. As annual labour productivity growth
moderated more than compensation per
employee, unit labour costs growth increased to
1.5% year on year in the fi rst three months of
2012, from 1.4% in the fourth quarter of 2011.
Looking ahead, in a context of subdued labour
market conditions, overall wage pressures
should remain limited.
Chart 25 Selected labour cost indicators
(annual percentage changes; quarterly data)
1.0
1.5
2.0
2.5
3.0
3.5
4.0
4.5
1.0
1.5
2.0
2.5
3.0
3.5
4.0
4.5
2004 20062005 20082007 2009 2010 2011
compensation per employee
negotiated wages
hourly labour cost index
Sources: Eurostat, national data and ECB calculations.
Chart 26 Sectoral labour cost developments
(annual percentage changes; quarterly data)
-2
-1
0
1
2
3
4
5
6
7
-2
-1
0
1
2
3
4
5
6
7
2004 2005
industry excluding construction, CPE
construction, CPE
market services, CPE
services, CPE
2006 2008 20092007 20112010-2
-1
0
1
2
3
4
5
6
7
-2
-1
0
1
2
3
4
5
6
7
2004 2005
industry excluding construction, hourly LCI
construction, hourly LCI
market services, hourly LCI
2006 2008 20092007 20112010
Sources: Eurostat and ECB calculations.Note: CPE stands for compensation per employee and LCI stands for labour cost index.

49ECB
Monthly Bulletin
August 2012
ECONOMIC AND MONETARYDEVELOPMENTS
Prices
and costs
3.4 THE OUTLOOK FOR INFLATION
Euro area annual HICP infl ation was 2.4% in July 2012, according to Eurostat´s fl ash estimate,
unchanged from the previous month. On the basis of current futures prices for oil, infl ation
rates should decline further in the course of 2012 and be below 2% again in 2013. Over the
policy-relevant horizon, in an environment of modest growth in the euro area and well-anchored
long-term infl ation expectations, underlying price pressures should remain moderate.
The latest ECB Survey of Professional Forecasters (see Box 4) shows that respondents’ outlook for
infl ation stands at 2.3% for 2012 and 1.7% for 2013. Compared with the previous round, this implies
no revision for 2012 and a downward revision of 0.1 percentage point for 2013. These forecasts are
well within the ranges reported in the June 2012 Eurosystem staff macroeconomic projections for the
euro area. Longer-term infl ation expectations (for 2017) remain unchanged at 2.0 %.
Risks to the outlook for price developments continue to be broadly balanced over the medium
term. Upside risks pertain to further increases in indirect tax increases, owing to the need for fi scal
consolidation, and higher than expected energy prices over the medium term. The main downside
risks relate to the impact of weaker than expected growth in the euro area, in particular resulting from
a further intensifi cation of fi nancial market tensions. Such intensifi cation has the potential to affect the
balance of risks on the downside.
Box 4
RESULTS OF THE ECB SURVEY OF PROFESSIONAL FORECASTERS FOR THE THIRD QUARTER OF 2012
This box reports the results of the ECB Survey of Professional Forecasters (SPF) for the
third quarter of 2012. The survey was conducted between 16 and 19 July 2012 and received
50 responses.1 The results imply broadly unchanged infl ation expectations for 2012 and 2013
compared with the previous survey round, while GDP growth expectations have been revised
downwards for both years. As regards longer-term infl ation expectations, the average point
forecast remains unchanged at 2.0%.
Shorter-term infl ation expectations broadly unchanged
The SPF infl ation expectations for 2012 and 2013 stand at 2.3% and 1.7% respectively (see table).
This implies no revision for 2012 and a downward revision of 0.1 percentage point for 2013.
Principally, participants explained this revision as owing to the decline in energy and commodity
prices, weaker growth prospects and more limited wage pressures. Infl ation expectations for 2014
(the additional year comes in with the third-quarter survey) stand at 1.9%.
The SPF infl ation expectations for 2012 and 2013 are within the ranges reported in the June 2012
Eurosystem staff macroeconomic projections and are very similar to those published in the Euro
1 The survey collects information on expectations for euro area infl ation, real GDP growth and unemployment from experts
affi liated with fi nancial or non-fi nancial institutions that are based in the EU. Data are available on the ECB’s website at
www.ecb.europa.eu/stats/prices/indic/forecast/html/index.en.html
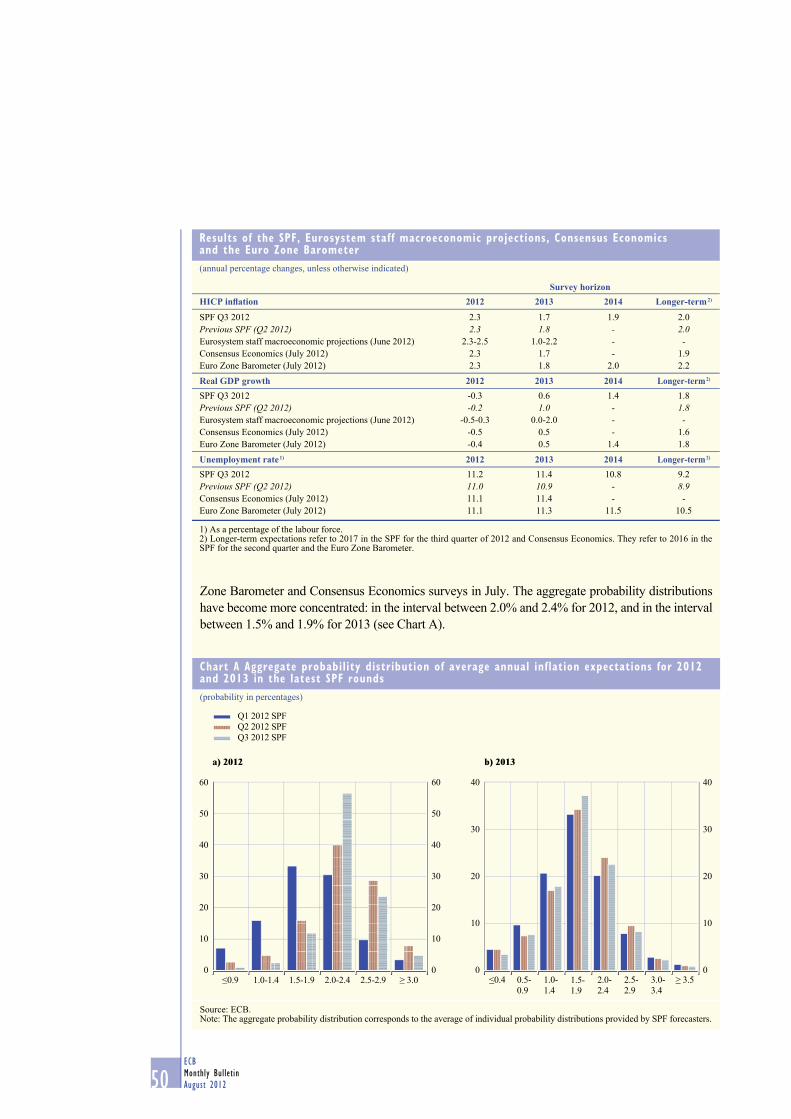
50ECB
Monthly Bulletin
August 2012
Zone Barometer and Consensus Economics surveys in July. The aggregate probability distributions
have become more concentrated: in the interval between 2.0% and 2.4% for 2012, and in the interval
between 1.5% and 1.9% for 2013 (see Chart A).
Chart A Aggregate probability distribution of average annual inflation expectations for 2012 and 2013 in the latest SPF rounds
(probability in percentages)
Q1 2012 SPF
Q2 2012 SPF
Q3 2012 SPF
a) 2012 b) 2013
0
10
20
30
40
50
60
0
10
20
30
40
50
60
≤0.9 1.0-1.4 1.5-1.9 2.0-2.4 2.5-2.9 ≥ 3.00
10
20
30
40
0
10
20
30
40
≤0.4 0.5-
0.9
1.0-
1.41.5-1.9
2.0-
2.4
2.5-
2.9
3.0-
3.4
≥ 3.5
Source: ECB.Note: The aggregate probability distribution corresponds to the average of individual probability distributions provided by SPF forecasters.
Results of the SPF, Eurosystem staff macroeconomic projections, Consensus Economics and the Euro Zone Barometer
(annual percentage changes, unless otherwise indicated)
Survey horizonHICP infl ation 2012 2013 2014 Longer-term 2)
SPF Q3 2012 2.3 1.7 1.9 2.0
Previous SPF (Q2 2012) 2.3 1.8 - 2.0Eurosystem staff macroeconomic projections (June 2012) 2.3-2.5 1.0-2.2 - -
Consensus Economics (July 2012) 2.3 1.7 - 1.9
Euro Zone Barometer (July 2012) 2.3 1.8 2.0 2.2
Real GDP growth 2012 2013 2014 Longer-term 2)
SPF Q3 2012 -0.3 0.6 1.4 1.8
Previous SPF (Q2 2012) -0.2 1.0 - 1.8Eurosystem staff macroeconomic projections (June 2012) -0.5-0.3 0.0-2.0 - -
Consensus Economics (July 2012) -0.5 0.5 - 1.6
Euro Zone Barometer (July 2012) -0.4 0.5 1.4 1.8
Unemployment rate 1) 2012 2013 2014 Longer-term 2)
SPF Q3 2012 11.2 11.4 10.8 9.2
Previous SPF (Q2 2012) 11.0 10.9 - 8.9Consensus Economics (July 2012) 11.1 11.4 - -
Euro Zone Barometer (July 2012) 11.1 11.3 11.5 10.5
1) As a percentage of the labour force.2) Longer-term expectations refer to 2017 in the SPF for the third quarter of 2012 and Consensus Economics. They refer to 2016 in the SPF for the second quarter and the Euro Zone Barometer.
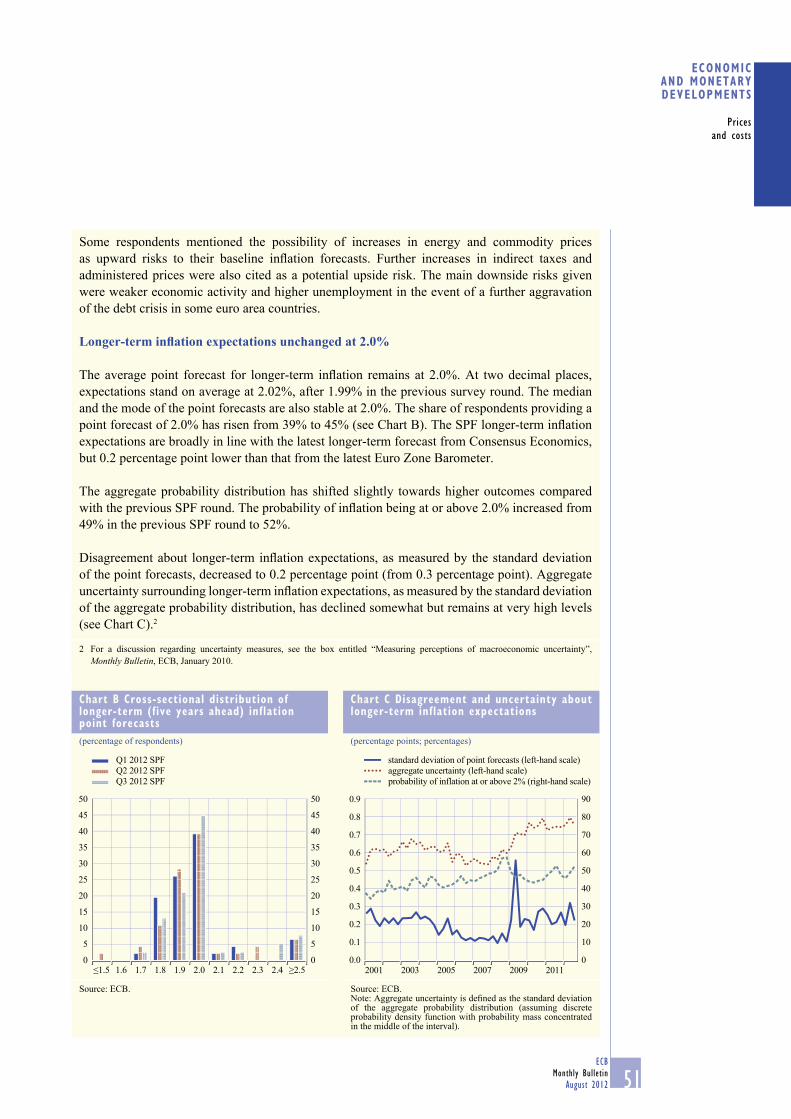
51ECB
Monthly Bulletin
August 2012
ECONOMIC AND MONETARYDEVELOPMENTS
Prices
and costs
Some respondents mentioned the possibility of increases in energy and commodity prices
as upward risks to their baseline infl ation forecasts. Further increases in indirect taxes and
administered prices were also cited as a potential upside risk. The main downside risks given
were weaker economic activity and higher unemployment in the event of a further aggravation
of the debt crisis in some euro area countries.
Longer-term infl ation expectations unchanged at 2.0%
The average point forecast for longer-term infl ation remains at 2.0%. At two decimal places,
expectations stand on average at 2.02%, after 1.99% in the previous survey round. The median
and the mode of the point forecasts are also stable at 2.0%. The share of respondents providing a
point forecast of 2.0% has risen from 39% to 45% (see Chart B). The SPF longer-term infl ation
expectations are broadly in line with the latest longer-term forecast from Consensus Economics,
but 0.2 percentage point lower than that from the latest Euro Zone Barometer.
The aggregate probability distribution has shifted slightly towards higher outcomes compared
with the previous SPF round. The probability of infl ation being at or above 2.0% increased from
49% in the previous SPF round to 52%.
Disagreement about longer-term infl ation expectations, as measured by the standard deviation
of the point forecasts, decreased to 0.2 percentage point (from 0.3 percentage point). Aggregate
uncertainty surrounding longer-term infl ation expectations, as measured by the standard deviation
of the aggregate probability distribution, has declined somewhat but remains at very high levels
(see Chart C).2
2 For a discussion regarding uncertainty measures, see the box entitled “Measuring perceptions of macroeconomic uncertainty”,
Monthly Bulletin, ECB, January 2010.
Chart B Cross-sectional distribution of longer-term (five years ahead) inflation point forecasts
(percentage of respondents)
0
5
10
15
20
25
30
35
40
45
50
0
5
10
15
20
25
30
35
40
45
50
≤1.5 1.6 1.7 1.8 1.9 2.0 2.1 2.2 2.3 2.4 ≥2.5
Q1 2012 SPF
Q2 2012 SPF
Q3 2012 SPF
Source: ECB.
Chart C Disagreement and uncertainty about longer-term inflation expectations
(percentage points; percentages)
0
10
20
30
40
50
60
70
80
90
0.0
0.1
0.2
0.3
0.4
0.5
0.6
0.7
0.8
0.9
standard deviation of point forecasts (left-hand scale)
aggregate uncertainty (left-hand scale)
probability of inflation at or above 2% (right-hand scale)
2001 2003 2005 2007 2009 2011
Source: ECB.Note: Aggregate uncertainty is defi ned as the standard deviation of the aggregate probability distribution (assuming discrete probability density function with probability mass concentrated in the middle of the interval).
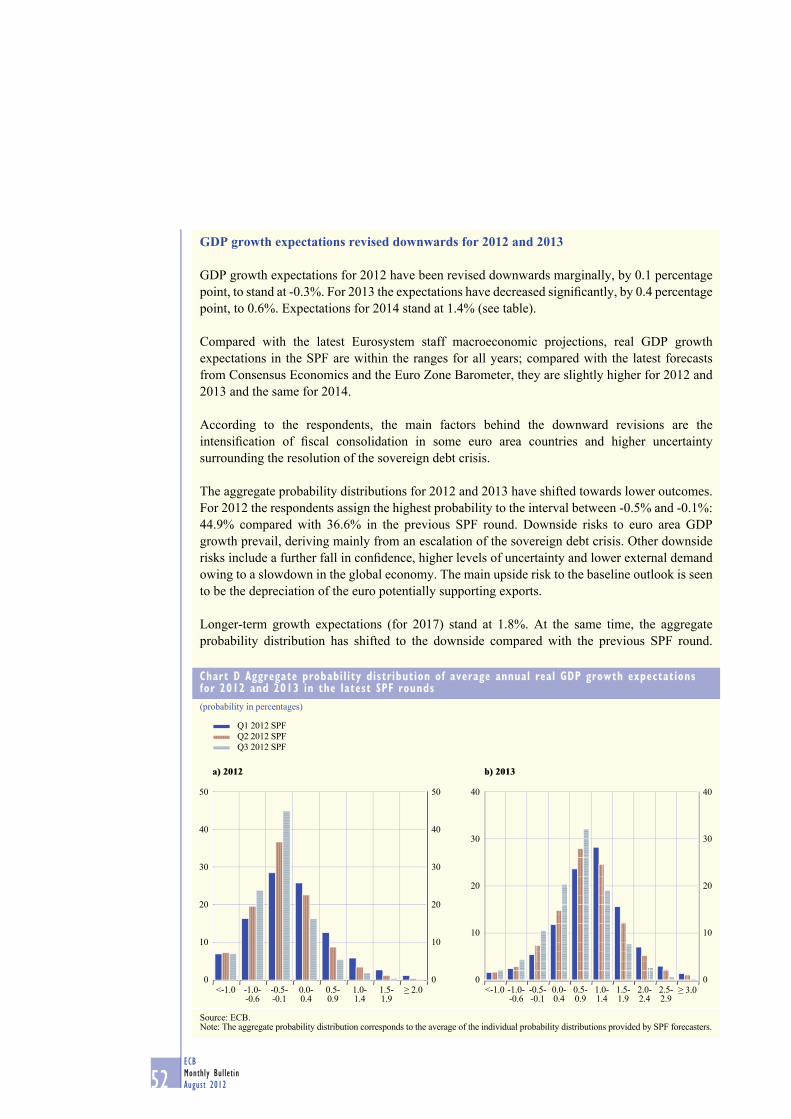
52ECB
Monthly Bulletin
August 2012
GDP growth expectations revised downwards for 2012 and 2013
GDP growth expectations for 2012 have been revised downwards marginally, by 0.1 percentage
point, to stand at -0.3%. For 2013 the expectations have decreased signifi cantly, by 0.4 percentage
point, to 0.6%. Expectations for 2014 stand at 1.4% (see table).
Compared with the latest Eurosystem staff macroeconomic projections, real GDP growth
expectations in the SPF are within the ranges for all years; compared with the latest forecasts
from Consensus Economics and the Euro Zone Barometer, they are slightly higher for 2012 and
2013 and the same for 2014.
According to the respondents, the main factors behind the downward revisions are the
intensifi cation of fi scal consolidation in some euro area countries and higher uncertainty
surrounding the resolution of the sovereign debt crisis.
The aggregate probability distributions for 2012 and 2013 have shifted towards lower outcomes.
For 2012 the respondents assign the highest probability to the interval between -0.5% and -0.1%:
44.9% compared with 36.6% in the previous SPF round. Downside risks to euro area GDP
growth prevail, deriving mainly from an escalation of the sovereign debt crisis. Other downside
risks include a further fall in confi dence, higher levels of uncertainty and lower external demand
owing to a slowdown in the global economy. The main upside risk to the baseline outlook is seen
to be the depreciation of the euro potentially supporting exports.
Longer-term growth expectations (for 2017) stand at 1.8%. At the same time, the aggregate
probability distribution has shifted to the downside compared with the previous SPF round.
Chart D Aggregate probability distribution of average annual real GDP growth expectations for 2012 and 2013 in the latest SPF rounds
(probability in percentages)
Q1 2012 SPF
Q2 2012 SPF
Q3 2012 SPF
a) 2012 b) 2013
0
10
20
30
40
50
0
10
20
30
40
50
<-1.0 -1.0--0.6
-0.5--0.1
0.0-0.4
0.5-0.9
1.0-1.4
1.5-1.9
≥ 2.00
10
20
30
40
0
10
20
30
40
<-1.0 -1.0--0.6
-0.5--0.1
0.0-0.4
0.5-0.9
1.0-1.4
1.5-1.9
2.0-2.4
2.5-2.9
≥ 3.0
Source: ECB.Note: The aggregate probability distribution corresponds to the average of the individual probability distributions provided by SPF forecasters.
53ECB
Monthly Bulletin
August 2012
ECONOMIC AND MONETARYDEVELOPMENTS
Prices
and costs
Forecasters now assign around 29% probability to longer-term real GDP growth being within
the interval between 1.5% and 1.9% (up from 28%), while the cumulative probability of GDP
growth being higher than 1.9% has decreased by 2 percentage points to 38%.
Further increase in unemployment rate expectations for 2012 and 2013
Unemployment rate expectations stand currently at 11.2% for 2012, 11.4% for 2013 and
10.8% for 2014 (see table). This implies upward revisions of 0.2 percentage point for 2012 and
0.5 percentage point for 2013 compared with the previous SPF round. According to the
forecasters’ comments, these further revisions were mainly due to the continuing deterioration in
the economic outlook and the impact of additional austerity measures in some euro area countries.
The forecasters expect the unemployment rate to peak in 2013. The subsequent decrease is seen
as likely to be slow, however, as the expected recovery of economic activity is considered to be
too weak to have a substantial downward impact on the unemployment rate.
The latest SPF forecasts for 2012 and 2013 are slightly higher than the forecasts given in the
latest Consensus Economics and Euro Zone Barometer issues; however, the SPF forecast for
2014 is considerably (0.7 percentage point) lower than that of the latest Euro Zone Barometer,
which foresees a further increase in 2014.
Longer-term unemployment rate expectations (for 2017) stand at 9.2%, 0.3 percentage point
higher than in the previous round. The entire aggregate probability distribution has also clearly
shifted towards higher outcomes.
Risks to the unemployment outlook in the SPF are assessed to be on the upside. A greater than
currently foreseen weakening of economic activity and an increase in structural unemployment
are considered to be the main risk factors. Downside risks are mentioned mainly in the context of
the longer-term horizon and are mostly associated with the further implementation of structural
reforms and with the success of reforms already implemented.
Other variables and conditioning assumptions
According to other information provided by the respondents, all assumptions covered by the
survey have been revised downwards. In particular, oil price assumptions for 2012 have been
revised downwards from below USD 120 per barrel in the previous SPF round to around USD
102 per barrel in the current round. Oil prices are then assumed to increase gradually to around
USD 109 per barrel in 2014. Growth in compensation per employee is assumed to stand at
1.8% in 2012 and (after a small decline in 2013) to increase to 2.4% in the long term (2017).
The EUR/USD exchange rate is expected to be stable at around 1.24 up to 2013 and then appreciate
marginally in 2014. The interest rate on the main refi nancing operations of the Eurosystem is on
average expected to be at around 0.7% until 2013 and then increase to 1.0% in 2014.
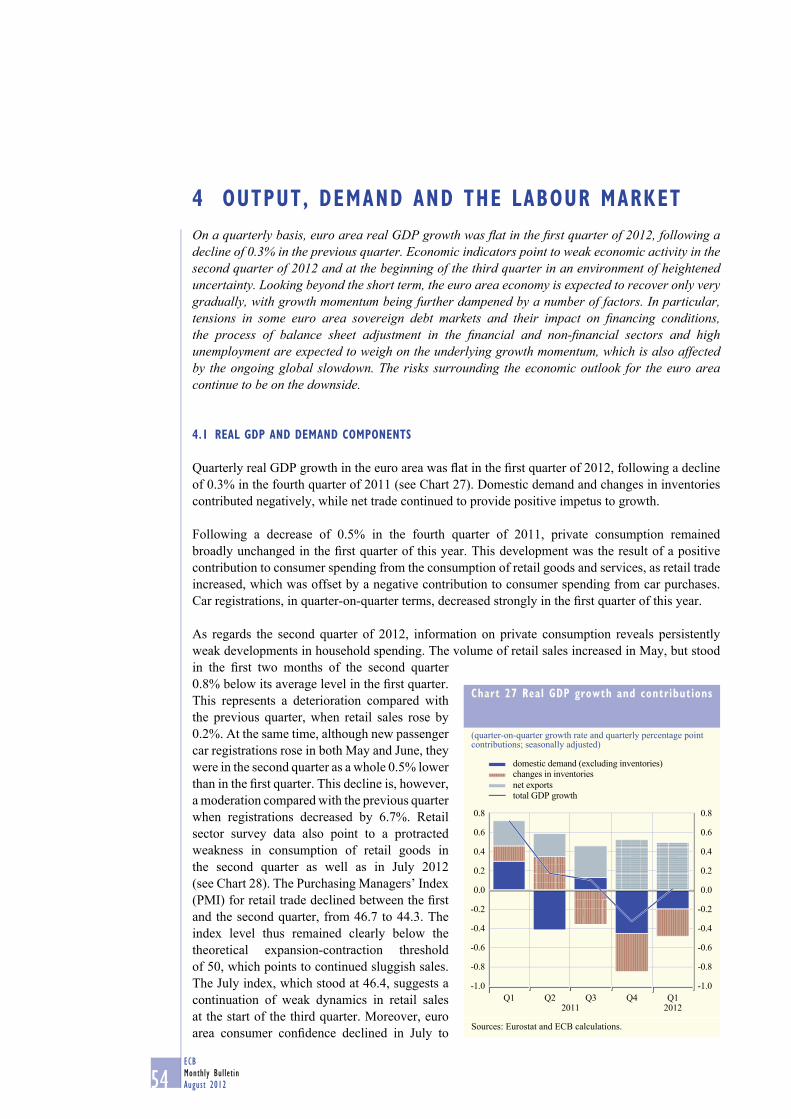
54ECB
Monthly Bulletin
August 2012
On a quarterly basis, euro area real GDP growth was fl at in the fi rst quarter of 2012, following a decline of 0.3% in the previous quarter. Economic indicators point to weak economic activity in the second quarter of 2012 and at the beginning of the third quarter in an environment of heightened uncertainty. Looking beyond the short term, the euro area economy is expected to recover only very gradually, with growth momentum being further dampened by a number of factors. In particular, tensions in some euro area sovereign debt markets and their impact on fi nancing conditions, the process of balance sheet adjustment in the fi nancial and non-fi nancial sectors and high unemployment are expected to weigh on the underlying growth momentum, which is also affected by the ongoing global slowdown. The risks surrounding the economic outlook for the euro area continue to be on the downside.
4.1 REAL GDP AND DEMAND COMPONENTS
Quarterly real GDP growth in the euro area was fl at in the fi rst quarter of 2012, following a decline
of 0.3% in the fourth quarter of 2011 (see Chart 27). Domestic demand and changes in inventories
contributed negatively, while net trade continued to provide positive impetus to growth.
Following a decrease of 0.5% in the fourth quarter of 2011, private consumption remained
broadly unchanged in the fi rst quarter of this year. This development was the result of a positive
contribution to consumer spending from the consumption of retail goods and services, as retail trade
increased, which was offset by a negative contribution to consumer spending from car purchases.
Car registrations, in quarter-on-quarter terms, decreased strongly in the fi rst quarter of this year.
As regards the second quarter of 2012, information on private consumption reveals persistently
weak developments in household spending. The volume of retail sales increased in May, but stood
in the fi rst two months of the second quarter
0.8% below its average level in the fi rst quarter.
This represents a deterioration compared with
the previous quarter, when retail sales rose by
0.2%. At the same time, although new passenger
car registrations rose in both May and June, they
were in the second quarter as a whole 0.5% lower
than in the fi rst quarter. This decline is, however,
a moderation compared with the previous quarter
when registrations decreased by 6.7%. Retail
sector survey data also point to a protracted
weakness in consumption of retail goods in
the second quarter as well as in July 2012
(see Chart 28). The Purchasing Managers’ Index
(PMI) for retail trade declined between the fi rst
and the second quarter, from 46.7 to 44.3. The
index level thus remained clearly below the
theoretical expansion-contraction threshold
of 50, which points to continued sluggish sales.
The July index, which stood at 46.4, suggests a
continuation of weak dynamics in retail sales
at the start of the third quarter. Moreover, euro
area consumer confi dence declined in July to
4 OUTPUT, DEMAND AND THE LABOUR MARKET
Chart 27 Real GDP growth and contributions
(quarter-on-quarter growth rate and quarterly percentage point contributions; seasonally adjusted)
-1.0
-0.8
-0.6
-0.4
-0.2
0.0
0.2
0.4
0.6
0.8
-1.0
-0.8
-0.6
-0.4
-0.2
0.0
0.2
0.4
0.6
0.8
Q1
domestic demand (excluding inventories) changes in inventories
net exports total GDP growth
Q1 Q2 Q3 Q420122011
Sources: Eurostat and ECB calculations.
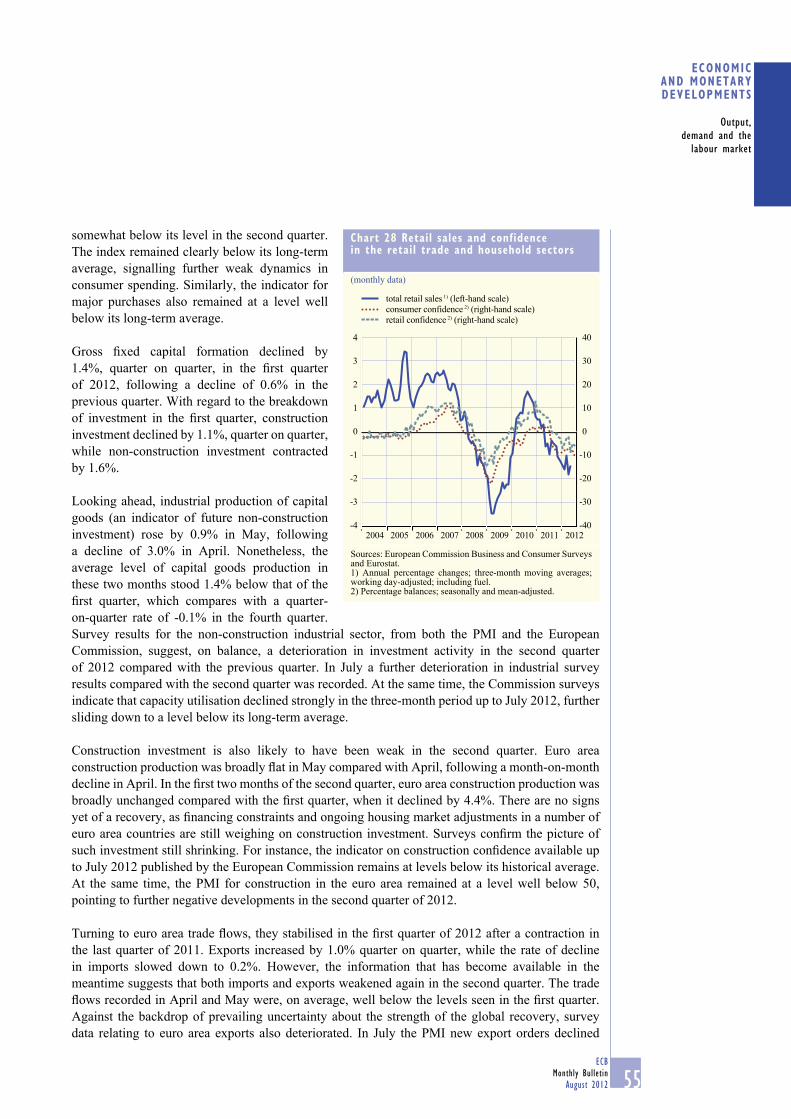
55ECB
Monthly Bulletin
August 2012
ECONOMIC AND MONETARYDEVELOPMENTS
Output,
demand and the
labour market
somewhat below its level in the second quarter.
The index remained clearly below its long-term
average, signalling further weak dynamics in
consumer spending. Similarly, the indicator for
major purchases also remained at a level well
below its long-term average.
Gross fi xed capital formation declined by
1.4%, quarter on quarter, in the fi rst quarter
of 2012, following a decline of 0.6% in the
previous quarter. With regard to the breakdown
of investment in the fi rst quarter, construction
investment declined by 1.1%, quarter on quarter,
while non-construction investment contracted
by 1.6%.
Looking ahead, industrial production of capital
goods (an indicator of future non-construction
investment) rose by 0.9% in May, following
a decline of 3.0% in April. Nonetheless, the
average level of capital goods production in
these two months stood 1.4% below that of the
fi rst quarter, which compares with a quarter-
on-quarter rate of -0.1% in the fourth quarter.
Survey results for the non-construction industrial sector, from both the PMI and the European
Commission, suggest, on balance, a deterioration in investment activity in the second quarter
of 2012 compared with the previous quarter. In July a further deterioration in industrial survey
results compared with the second quarter was recorded. At the same time, the Commission surveys
indicate that capacity utilisation declined strongly in the three-month period up to July 2012, further
sliding down to a level below its long-term average.
Construction investment is also likely to have been weak in the second quarter. Euro area
construction production was broadly fl at in May compared with April, following a month-on-month
decline in April. In the fi rst two months of the second quarter, euro area construction production was
broadly unchanged compared with the fi rst quarter, when it declined by 4.4%. There are no signs
yet of a recovery, as fi nancing constraints and ongoing housing market adjustments in a number of
euro area countries are still weighing on construction investment. Surveys confi rm the picture of
such investment still shrinking. For instance, the indicator on construction confi dence available up
to July 2012 published by the European Commission remains at levels below its historical average.
At the same time, the PMI for construction in the euro area remained at a level well below 50,
pointing to further negative developments in the second quarter of 2012.
Turning to euro area trade fl ows, they stabilised in the fi rst quarter of 2012 after a contraction in
the last quarter of 2011. Exports increased by 1.0% quarter on quarter, while the rate of decline
in imports slowed down to 0.2%. However, the information that has become available in the
meantime suggests that both imports and exports weakened again in the second quarter. The trade
fl ows recorded in April and May were, on average, well below the levels seen in the fi rst quarter.
Against the backdrop of prevailing uncertainty about the strength of the global recovery, survey
data relating to euro area exports also deteriorated. In July the PMI new export orders declined
Chart 28 Retail sales and confidence in the retail trade and household sectors
(monthly data)
-4
-3
-2
-1
0
1
2
3
4
-40
-30
-20
-10
0
10
20
30
40
2004 2005 2006 2007 2008 2009 2010 2011 2012
total retail sales 1) (left-hand scale)
consumer confidence 2) (right-hand scale)
retail confidence 2) (right-hand scale)
Sources: European Commission Business and Consumer Surveys and Eurostat.1) Annual percentage changes; three-month moving averages; working day-adjusted; including fuel.2) Percentage balances; seasonally and mean-adjusted.
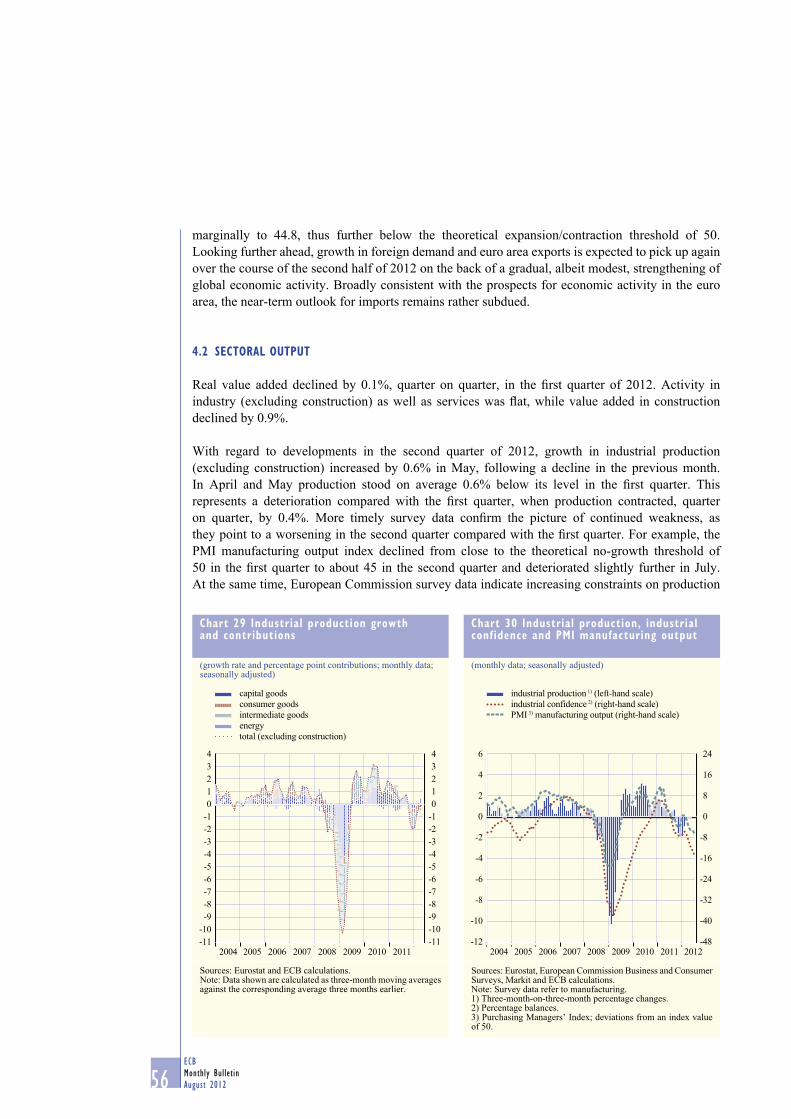
56ECB
Monthly Bulletin
August 2012
marginally to 44.8, thus further below the theoretical expansion/contraction threshold of 50.
Looking further ahead, growth in foreign demand and euro area exports is expected to pick up again
over the course of the second half of 2012 on the back of a gradual, albeit modest, strengthening of
global economic activity. Broadly consistent with the prospects for economic activity in the euro
area, the near-term outlook for imports remains rather subdued.
4.2 SECTORAL OUTPUT
Real value added declined by 0.1%, quarter on quarter, in the fi rst quarter of 2012. Activity in
industry (excluding construction) as well as services was fl at, while value added in construction
declined by 0.9%.
With regard to developments in the second quarter of 2012, growth in industrial production
(excluding construction) increased by 0.6% in May, following a decline in the previous month.
In April and May production stood on average 0.6% below its level in the fi rst quarter. This
represents a deterioration compared with the fi rst quarter, when production contracted, quarter
on quarter, by 0.4%. More timely survey data confi rm the picture of continued weakness, as
they point to a worsening in the second quarter compared with the fi rst quarter. For example, the
PMI manufacturing output index declined from close to the theoretical no-growth threshold of
50 in the fi rst quarter to about 45 in the second quarter and deteriorated slightly further in July.
At the same time, European Commission survey data indicate increasing constraints on production
Chart 29 Industrial production growth and contributions
(growth rate and percentage point contributions; monthly data; seasonally adjusted)
-11
-10
-9
-8
-7
-6
-5
-4
-3
-2
-1
0
1
2
3
4
-11
-10
-9
-8
-7
-6
-5
-4
-3
-2
-1
0
1
2
3
4
2004 2005 2006 2007 2008 2009 2010 2011
capital goods
consumer goods
intermediate goods
energy
total (excluding construction)
Sources: Eurostat and ECB calculations.Note: Data shown are calculated as three-month moving averages against the corresponding average three months earlier.
Chart 30 Industrial production, industrial confidence and PMI manufacturing output
(monthly data; seasonally adjusted)
-12
-10
-8
-6
-4
-2
0
2
4
6
-48
-40
-32
-24
-16
-8
0
8
16
24
2004 2005 2006 2007 2008 2009 2010 2011 2012
industrial production 1) (left-hand scale)
industrial confidence 2) (right-hand scale)
PMI 3) manufacturing output (right-hand scale)
Sources: Eurostat, European Commission Business and Consumer Surveys, Markit and ECB calculations.Note: Survey data refer to manufacturing.1) Three-month-on-three-month percentage changes.2) Percentage balances.3) Purchasing Managers’ Index; deviations from an index value of 50.
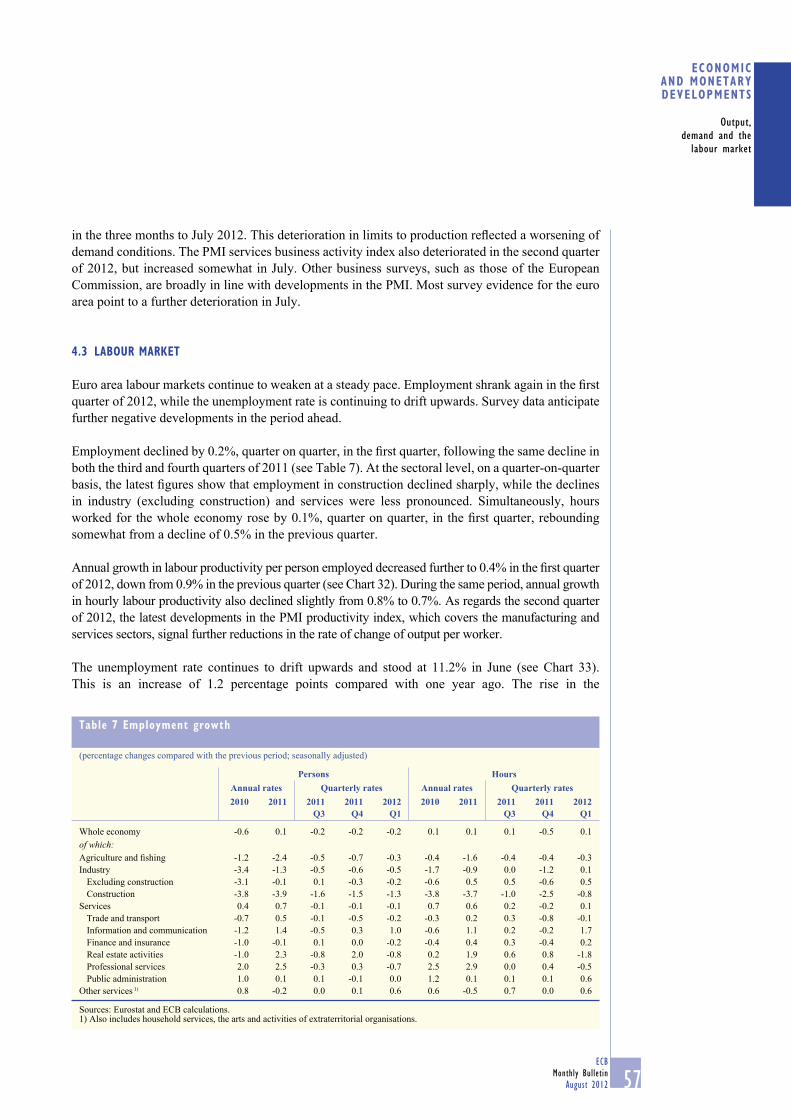
57ECB
Monthly Bulletin
August 2012
ECONOMIC AND MONETARYDEVELOPMENTS
Output,
demand and the
labour market
in the three months to July 2012. This deterioration in limits to production refl ected a worsening of
demand conditions. The PMI services business activity index also deteriorated in the second quarter
of 2012, but increased somewhat in July. Other business surveys, such as those of the European
Commission, are broadly in line with developments in the PMI. Most survey evidence for the euro
area point to a further deterioration in July.
4.3 LABOUR MARKET
Euro area labour markets continue to weaken at a steady pace. Employment shrank again in the fi rst
quarter of 2012, while the unemployment rate is continuing to drift upwards. Survey data anticipate
further negative developments in the period ahead.
Employment declined by 0.2%, quarter on quarter, in the fi rst quarter, following the same decline in
both the third and fourth quarters of 2011 (see Table 7). At the sectoral level, on a quarter-on-quarter
basis, the latest fi gures show that employment in construction declined sharply, while the declines
in industry (excluding construction) and services were less pronounced. Simultaneously, hours
worked for the whole economy rose by 0.1%, quarter on quarter, in the fi rst quarter, rebounding
somewhat from a decline of 0.5% in the previous quarter.
Annual growth in labour productivity per person employed decreased further to 0.4% in the fi rst quarter
of 2012, down from 0.9% in the previous quarter (see Chart 32). During the same period, annual growth
in hourly labour productivity also declined slightly from 0.8% to 0.7%. As regards the second quarter
of 2012, the latest developments in the PMI productivity index, which covers the manufacturing and
services sectors, signal further reductions in the rate of change of output per worker.
The unemployment rate continues to drift upwards and stood at 11.2% in June (see Chart 33).
This is an increase of 1.2 percentage points compared with one year ago. The rise in the
Table 7 Employment growth
(percentage changes compared with the previous period; seasonally adjusted)
Persons HoursAnnual rates Quarterly rates Annual rates Quarterly rates2010 2011 2011
Q32011
Q42012
Q12010 2011 2011
Q32011
Q42012
Q1
Whole economy -0.6 0.1 -0.2 -0.2 -0.2 0.1 0.1 0.1 -0.5 0.1
of which:Agriculture and fi shing -1.2 -2.4 -0.5 -0.7 -0.3 -0.4 -1.6 -0.4 -0.4 -0.3
Industry -3.4 -1.3 -0.5 -0.6 -0.5 -1.7 -0.9 0.0 -1.2 0.1
Excluding construction -3.1 -0.1 0.1 -0.3 -0.2 -0.6 0.5 0.5 -0.6 0.5
Construction -3.8 -3.9 -1.6 -1.5 -1.3 -3.8 -3.7 -1.0 -2.5 -0.8
Services 0.4 0.7 -0.1 -0.1 -0.1 0.7 0.6 0.2 -0.2 0.1
Trade and transport -0.7 0.5 -0.1 -0.5 -0.2 -0.3 0.2 0.3 -0.8 -0.1
Information and communication -1.2 1.4 -0.5 0.3 1.0 -0.6 1.1 0.2 -0.2 1.7
Finance and insurance -1.0 -0.1 0.1 0.0 -0.2 -0.4 0.4 0.3 -0.4 0.2
Real estate activities -1.0 2.3 -0.8 2.0 -0.8 0.2 1.9 0.6 0.8 -1.8
Professional services 2.0 2.5 -0.3 0.3 -0.7 2.5 2.9 0.0 0.4 -0.5
Public administration 1.0 0.1 0.1 -0.1 0.0 1.2 0.1 0.1 0.1 0.6
Other services 1) 0.8 -0.2 0.0 0.1 0.6 0.6 -0.5 0.7 0.0 0.6
Sources: Eurostat and ECB calculations.1) Also includes household services, the arts and activities of extraterritorial organisations.
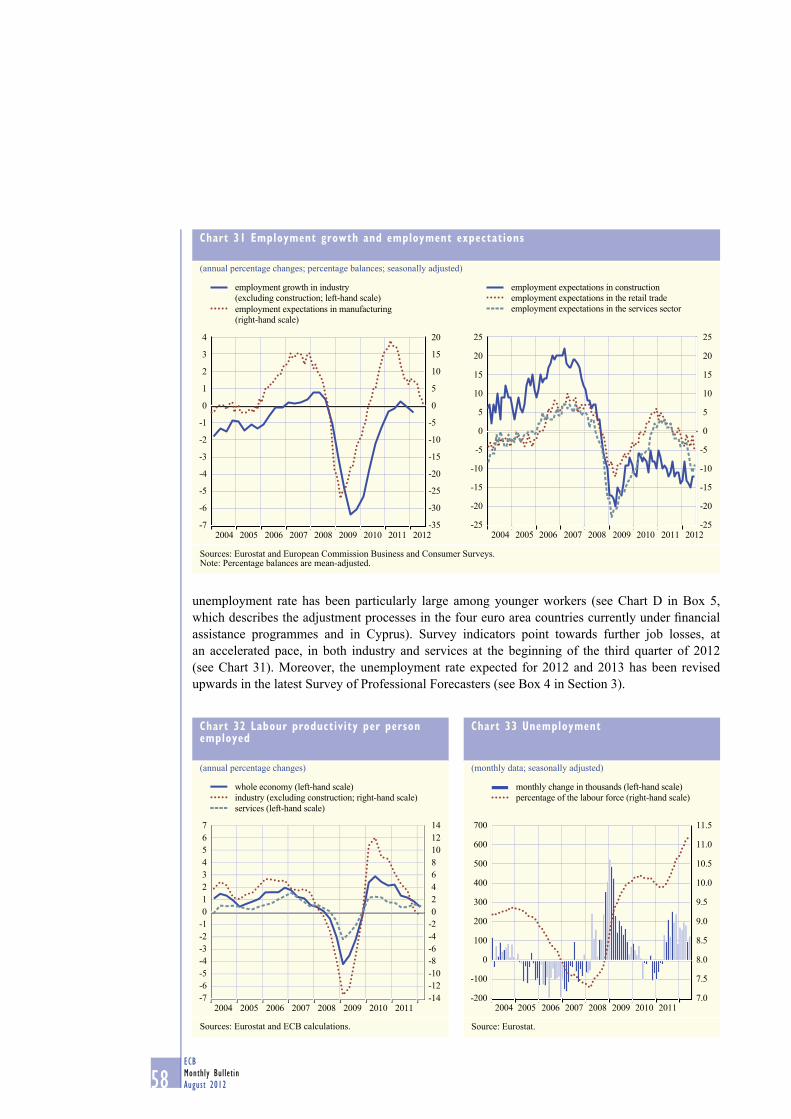
58ECB
Monthly Bulletin
August 2012
unemployment rate has been particularly large among younger workers (see Chart D in Box 5,
which describes the adjustment processes in the four euro area countries currently under fi nancial
assistance programmes and in Cyprus). Survey indicators point towards further job losses, at
an accelerated pace, in both industry and services at the beginning of the third quarter of 2012
(see Chart 31). Moreover, the unemployment rate expected for 2012 and 2013 has been revised
upwards in the latest Survey of Professional Forecasters (see Box 4 in Section 3).
Chart 31 Employment growth and employment expectations
(annual percentage changes; percentage balances; seasonally adjusted)
-7
-6
-5
-4
-3
-2
-1
0
1
2
3
4
-35
-30
-25
-20
-15
-10
-5
0
5
10
15
20
employment growth in industry
(excluding construction; left-hand scale)
employment expectations in manufacturing
(right-hand scale)
2004 2005 2006 2007 2008 2009 2010 2011 2012-25
-20
-15
-10
-5
0
5
10
15
20
25
-25
-20
-15
-10
-5
0
5
10
15
20
25
2004 2005 2006 2007 2008 2009 2010 2011 2012
employment expectations in construction
employment expectations in the retail trade
employment expectations in the services sector
Sources: Eurostat and European Commission Business and Consumer Surveys.Note: Percentage balances are mean-adjusted.
Chart 32 Labour productivity per person employed
(annual percentage changes)
-7
-6
-5
-4
-3
-2
-1
0
1
2
3
4
5
6
7
-14
-12
-10
-8
-6
-4
-2
0
2
4
6
8
10
12
14
2010 2011
whole economy (left-hand scale)
industry (excluding construction; right-hand scale)
services (left-hand scale)
2004 2005 2006 2007 20092008
Sources: Eurostat and ECB calculations.
Chart 33 Unemployment
(monthly data; seasonally adjusted)
-200
-100
0
100
200
300
400
500
600
700
7.0
7.5
8.0
8.5
9.0
9.5
10.0
10.5
11.0
11.5
2004 2005 2006 2007 2008 2009 2010 2011
monthly change in thousands (left-hand scale)
percentage of the labour force (right-hand scale)
Source: Eurostat.
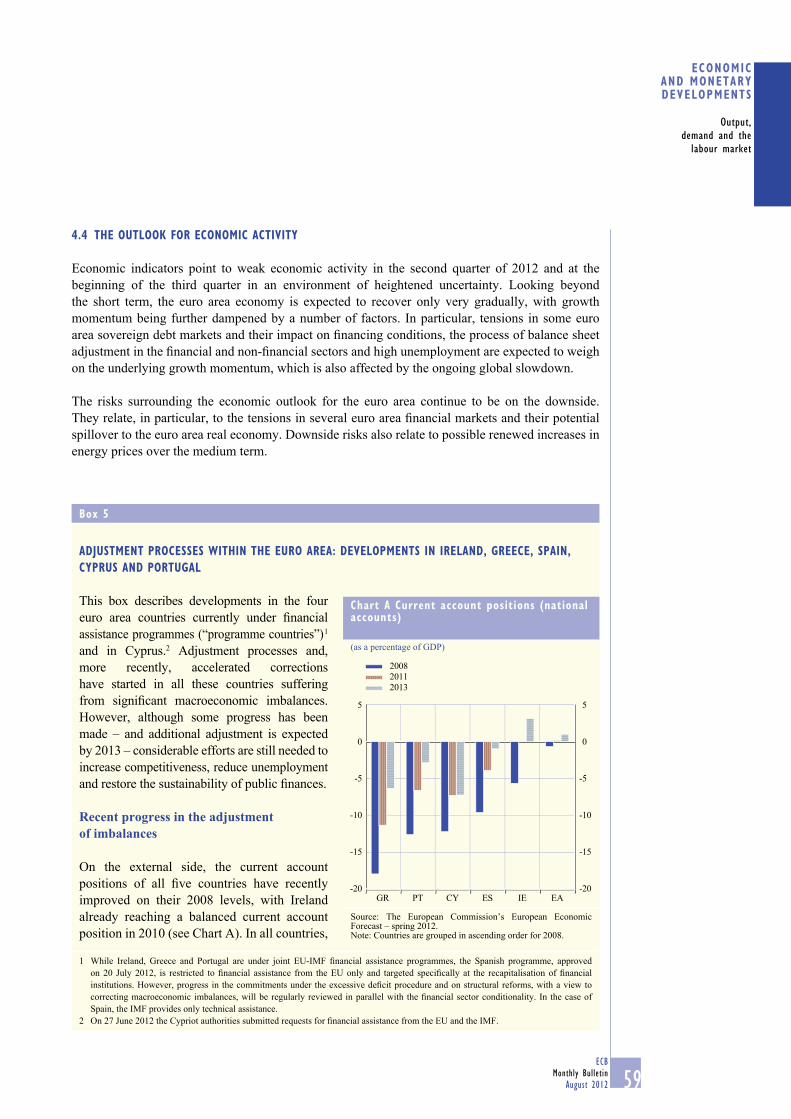
59ECB
Monthly Bulletin
August 2012
ECONOMIC AND MONETARYDEVELOPMENTS
Output,
demand and the
labour market
4.4 THE OUTLOOK FOR ECONOMIC ACTIVITY
Economic indicators point to weak economic activity in the second quarter of 2012 and at the
beginning of the third quarter in an environment of heightened uncertainty. Looking beyond
the short term, the euro area economy is expected to recover only very gradually, with growth
momentum being further dampened by a number of factors. In particular, tensions in some euro
area sovereign debt markets and their impact on fi nancing conditions, the process of balance sheet
adjustment in the fi nancial and non-fi nancial sectors and high unemployment are expected to weigh
on the underlying growth momentum, which is also affected by the ongoing global slowdown.
The risks surrounding the economic outlook for the euro area continue to be on the downside.
They relate, in particular, to the tensions in several euro area fi nancial markets and their potential
spillover to the euro area real economy. Downside risks also relate to possible renewed increases in
energy prices over the medium term.
Box 5
ADJUSTMENT PROCESSES WITHIN THE EURO AREA: DEVELOPMENTS IN IRELAND, GREECE, SPAIN,
CYPRUS AND PORTUGAL
This box describes developments in the four
euro area countries currently under fi nancial
assistance programmes (“programme countries”) 1
and in Cyprus.2 Adjustment processes and,
more recently, accelerated corrections
have started in all these countries suffering
from signifi cant macroeconomic imbalances.
However, although some progress has been
made – and additional adjustment is expected
by 2013 – considerable efforts are still needed to
increase competitiveness, reduce unemployment
and restore the sustainability of public fi nances.
Recent progress in the adjustment of imbalances
On the external side, the current account
positions of all fi ve countries have recently
improved on their 2008 levels, with Ireland
already reaching a balanced current account
position in 2010 (see Chart A). In all countries,
1 While Ireland, Greece and Portugal are under joint EU-IMF fi nancial assistance programmes, the Spanish programme, approved
on 20 July 2012, is restricted to fi nancial assistance from the EU only and targeted specifi cally at the recapitalisation of fi nancial
institutions. However, progress in the commitments under the excessive defi cit procedure and on structural reforms, with a view to
correcting macroeconomic imbalances, will be regularly reviewed in parallel with the fi nancial sector conditionality. In the case of
Spain, the IMF provides only technical assistance.
2 On 27 June 2012 the Cypriot authorities submitted requests for fi nancial assistance from the EU and the IMF.
Chart A Current account positions (national accounts)
(as a percentage of GDP)
-20
-15
-10
-5
0
5
-20
-15
-10
-5
0
5
GR PT CY ES IE EA
2008
2011
2013
Source: The European Commission’s European Economic Forecast – spring 2012.Note: Countries are grouped in ascending order for 2008.
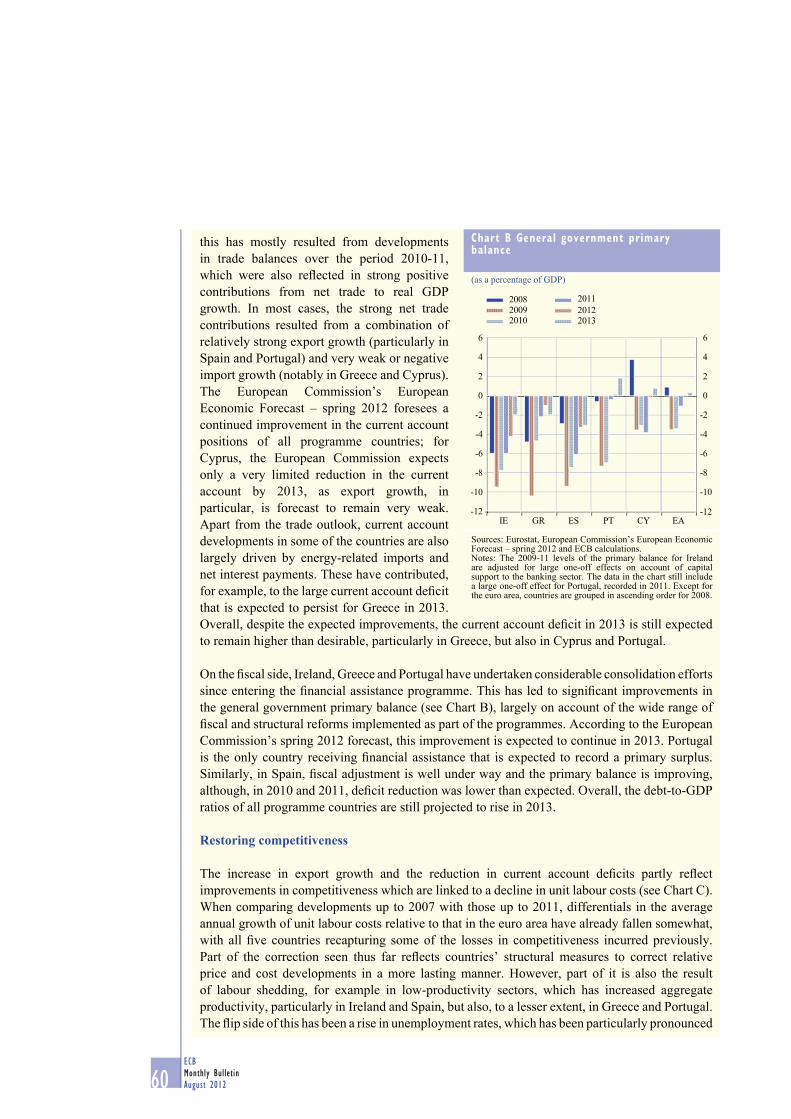
60ECB
Monthly Bulletin
August 2012
this has mostly resulted from developments
in trade balances over the period 2010-11,
which were also refl ected in strong positive
contributions from net trade to real GDP
growth. In most cases, the strong net trade
contributions resulted from a combination of
relatively strong export growth (particularly in
Spain and Portugal) and very weak or negative
import growth (notably in Greece and Cyprus).
The European Commission’s European
Economic Forecast – spring 2012 foresees a
continued improvement in the current account
positions of all programme countries; for
Cyprus, the European Commission expects
only a very limited reduction in the current
account by 2013, as export growth, in
particular, is forecast to remain very weak.
Apart from the trade outlook, current account
developments in some of the countries are also
largely driven by energy-related imports and
net interest payments. These have contributed,
for example, to the large current account defi cit
that is expected to persist for Greece in 2013.
Overall, despite the expected improvements, the current account defi cit in 2013 is still expected
to remain higher than desirable, particularly in Greece, but also in Cyprus and Portugal.
On the fi scal side, Ireland, Greece and Portugal have undertaken considerable consolidation efforts
since entering the fi nancial assistance programme. This has led to signifi cant improvements in
the general government primary balance (see Chart B), largely on account of the wide range of
fi scal and structural reforms implemented as part of the programmes. According to the European
Commission’s spring 2012 forecast, this improvement is expected to continue in 2013. Portugal
is the only country receiving fi nancial assistance that is expected to record a primary surplus.
Similarly, in Spain, fi scal adjustment is well under way and the primary balance is improving,
although, in 2010 and 2011, defi cit reduction was lower than expected. Overall, the debt-to-GDP
ratios of all programme countries are still projected to rise in 2013.
Restoring competitiveness
The increase in export growth and the reduction in current account defi cits partly refl ect
improvements in competitiveness which are linked to a decline in unit labour costs (see Chart C).
When comparing developments up to 2007 with those up to 2011, differentials in the average
annual growth of unit labour costs relative to that in the euro area have already fallen somewhat,
with all fi ve countries recapturing some of the losses in competitiveness incurred previously.
Part of the correction seen thus far refl ects countries’ structural measures to correct relative
price and cost developments in a more lasting manner. However, part of it is also the result
of labour shedding, for example in low-productivity sectors, which has increased aggregate
productivity, particularly in Ireland and Spain, but also, to a lesser extent, in Greece and Portugal.
The fl ip side of this has been a rise in unemployment rates, which has been particularly pronounced
Chart B General government primary balance
(as a percentage of GDP)
-12
-10
-8
-6
-4
-2
2
4
6
-12
-10
-8
-6
-4
-2
00
2
4
6
IE GR ES PT CY EA
2008
20092010
2011
20122013
Sources: Eurostat, European Commission’s European Economic Forecast – spring 2012 and ECB calculations.Notes: The 2009-11 levels of the primary balance for Ireland are adjusted for large one-off effects on account of capital support to the banking sector. The data in the chart still include a large one-off effect for Portugal, recorded in 2011. Except for the euro area, countries are grouped in ascending order for 2008.

61ECB
Monthly Bulletin
August 2012
ECONOMIC AND MONETARYDEVELOPMENTS
Output,
demand and the
labour market
among younger workers (see Chart D). As
Chart E suggests, this may also have been partly
due to delayed actions by the wage bargaining
partners, both in the private and the public
sector. In particular, in the case of Spain, the
authorities fi nally approved in February 2012
a far-reaching and comprehensive labour
market reform that could have proved very
benefi cial in avoiding labour shedding if it had
been passed some years ago. After the onset
of the global fi nancial crisis in 2008, with the
exception of Ireland, wage moderation only set
in with a signifi cant delay (in Portugal in 2010)
or has remained very limited (in Spain and
Cyprus, at the end of 2011). Going forward, a
strong decline in compensation per employee
is expected: (i) for Spain, as a result of further
cuts in public sector wages and the impact of
labour market reforms in moderating private
sector wage claims; and (ii) for Greece, as a
result of the recent reforms in private sector
wage-setting.
Chart C Average annual increase in unit labour costs relative to the euro area
(in percentage points)
-1.0
-0.5
0.0
0.5
1.0
1.5
2.0
2.5
-1.0
-0.5
0.0
0.5
1.0
1.5
2.0
2.5
IE ES CY PT GR
1999-2007
1999-2011
1999-2013
Sources: Eurostat and the European Commission’s European Economic Forecast – spring 2012.Notes: Countries are grouped in descending order for the period 1999-2007. Data for Greece and Spain are only available from 2001.
Chart D Total and youth unemployment
(as a percentage of the labour force)
0
20
10
30
40
50
60
0
20
10
30
40
50
60
2008
2011
2013
ES PT GR IE CY EA ES PT GR IE CY EA
total under the age of 25
Sources: Eurostat and the European Commission’s European Economic Forecast – spring 2012.Note: Except for the euro area, countries are grouped in descending order according to the total unemployment rate in 2008.
Chart E Compensation per employee relative to the euro area
(indices: 2002 = 100, euro area = 100)
90
95
100
105
110
115
120
125
90
95
100
105
110
115
120
125
2002 2004 2006 2008 2010 2012
IrelandGreece
Spain
Cyprus
Portugal
Sources: Eurostat and the European Commission’s European Economic Forecast – spring 2012.

62ECB
Monthly Bulletin
August 2012
Need for further structural and fi scal reforms
As there is still a substantial need for rebalancing, all countries will need to undertake further
far-reaching reforms and introduce appropriate measures to increase both price and non-price
competitiveness, reduce unemployment and restore the sustainability of public fi nances.
Regarding competitiveness, given the low level of competition, further signifi cant reductions in
unit labour costs and excess profi t margins are particularly urgent, especially in countries where
unemployment is very high. To achieve this, fi rst, fl exibility in the wage determination process has
to be strengthened, for example, where relevant, by relaxing employment protection legislation,
abolishing wage indexation schemes, lowering minimum wages and permitting wage bargaining
at the fi rm level. And second, the competitiveness adjustment must be strengthened through
permanent increases in labour productivity, for example through privatisation, innovations in
processes and the development of new products, measures to boost the skills of the labour force,
and initiatives to create a more favourable business environment. This calls for courageous policy
action on structural reforms (e.g. the liberalisation of closed professions and immigration, a
reorientation of spending towards education and R&D, and reforms of key framework conditions,
such as amending judicial and regulatory frameworks to enhance their business friendliness)
and boldness in the face of lobbying by privileged groups and vested interests. Excessive profi t
margins are particularly prevalent in domestically-oriented sectors (predominantly the services
sectors). Structural reform measures can address the issue of excessive rents by removing
obstacles to (international) competition, particularly in the sheltered professions, for example by
lowering entry barriers for new fi rms and, more generally, by reducing red tape.
On the fi scal side, ensuring strict adherence to the agreed fi scal consolidation paths remains
essential in order to lock in the benefi ts of the consolidation efforts undertaken so far and credibly
anchor fi nancial market expectations.
63ECB
Monthly Bulletin
August 2012
1 INTRODUCTION
The current crisis has been associated with
signifi cant heterogeneity in fi nancial conditions.
This poses a particular challenge for the conduct
and transmission of monetary policy in a
currency union such as EMU. More broadly,
it raises questions about the appropriateness of
the fi scal, structural and fi nancial architecture in
the euro area.
The fi nancial system is the primary channel
through which monetary policy affects the
economy. Stable, effi cient and integrated
fi nancial markets are the basis for the smooth
transmission of monetary policy across
countries. Thus, the current heterogeneity in
fi nancial conditions poses a major challenge for
the single monetary policy.
Although some degree of national differentiation
in fi nancial developments is a normal feature
of a monetary union, heterogeneity in fi nancial
conditions across the euro area has increased
signifi cantly, as some countries have been
affected more substantially by the fi nancial
The current crisis has been associated with signifi cant heterogeneity in fi nancial conditions, following a period of low and more homogeneous fi nancing costs. Money markets have become impaired, especially across national borders, and sovereign bond yields have diverged signifi cantly. Overall, there is increased evidence that country-specifi c effects have become more important in driving fi nancial conditions.
The fi nancial system is the primary channel through which monetary policy affects the economy and ultimately prices. Stable, effi cient and integrated fi nancial markets are the basis for a smooth transmission of monetary policy across countries. The current degree of heterogeneity in fi nancial conditions therefore poses a major challenge for the single monetary policy.
The underlying causes of the increase in heterogeneity originate in the accumulation of fi scal, macroeconomic and fi nancial imbalances in several euro area countries prior to the crisis, fuelled in particular by decreasing interest rates around the start of EMU and by inadequate national and European policy responses. When the crisis erupted, the unsustainable nature of these imbalances became evident. The repricing of risks caused the real imbalances to spill over to fi nancial developments. Financial integration halted as fi nancial fl ows across euro area countries reversed. Destabilising and self-reinforcing linkages between the deterioration in public fi nances, the severe economic recession and the fragility of banks’ balance sheets triggered a negative feedback loop between fi scal, real and fi nancial developments in certain countries. The lack of a credible backstop mechanism made it diffi cult to break this negative spiral in a monetary union characterised by decentralised economic policies.
With a view to maintaining price stability in the euro area, the ECB has introduced a number of measures to ensure a more homogeneous pass-through of its key interest rates to the economy. However, these measures cannot provide a structural solution to the underlying causes of heterogeneous fi nancial conditions. Rather, this involves governments acting at the national and the euro area/European levels in the various policy areas where the appropriate policies and mechanisms have to be put in place. Such action is needed, in particular with regard to public fi nances, structural economic reforms and fi nancial stability. It includes the need to move towards a “fi nancial union”, with the further transfer of competences to the European level as regards euro area fi nancial sector crisis management and resolution. Such policies would also create better conditions to support a smooth transmission of monetary policy across countries.
ART ICLES
HETEROGENEITY IN EURO AREA FINANCIAL CONDITIONS AND POLICY IMPLICATIONS
64ECB
Monthly Bulletin
August 2012
crisis. Money markets have become increasingly
impaired, especially across national borders, and
yields in sovereign bond markets have diverged
signifi cantly.
The ECB has introduced a number of measures
to ensure a more homogeneous pass-through of
its key interest rates to the economy. It cannot,
however, provide a structural solution to the
underlying causes of heterogeneous fi nancial
conditions. For that, national governments
must put in place the appropriate policies and
mechanisms at the national and euro area/European
levels. Such policies would also create better
conditions for supporting a smooth transmission of
monetary policy across countries.
Against this background, this article reviews the
causes of heterogeneity in fi nancial conditions
in recent years and examines how they relate
to macroeconomic imbalances and policy
failures before the crisis. It explains the ECB’s
monetary policy response and discusses the role
of other policies – notably fi scal, structural and
prudential policies – in overcoming structural
imbalances and divergences. Section 2 describes
developments in fi nancial conditions over time
and relates the return of heterogeneous fi nancial
conditions to the sudden repricing of risks after
years of accumulated imbalances in public
fi nances, in the macroeconomy and in banking.
Section 3 reviews the impact on monetary
policy of this renewed heterogeneity, as well
as the main actions that the ECB has taken to
promote a more homogeneous transmission of
monetary policy across the euro area. Section 4
focuses on the need to address the institutional
shortcomings of EMU that contributed to the
emergence of heterogeneity in order to tackle
the crisis. Section 5 draws some conclusions.
2 HETEROGENEITY IN EURO AREA FINANCIAL
CONDITIONS OVER TIME
The two decades preceding the crisis witnessed
a substantial decline in nominal interest rates
and fi nancing costs in all euro area countries.
The completion of the Single Market in fi nancial
services and deeper fi nancial integration
were associated with a strong convergence in
fi nancial conditions across euro area countries.
In addition to policy initiatives to foster fi nancial
integration – for example, the Financial Services
Action Plan (FSAP) – other factors contributed
to the decline in nominal interest rates: in
particular, a more stable and benign economic
and fi nancial environment, and a price stability-
oriented monetary policy created the conditions
for lower interest rates.
The fi nancial market segment closest to the
single monetary policy, i.e. the euro area money
market, was highly integrated from the start of
EMU. The cross-sectional standard deviation
of the EONIA lending rates across euro area
countries fell to close to zero following the
introduction of the euro. A considerable degree
of convergence was also seen in government
and corporate bond markets. Charts 1 to 3
illustrate the low level of dispersion in the rates
charged by banks to households for residential
mortgages and to non-fi nancial corporations
for new loans, as well as in sovereign bond
yields. The overall result was a low level of
heterogeneity in fi nancial conditions across euro
area countries.
The fi nancial crisis that erupted in
September 2008 with the default of
Lehman Brothers, following a period of
fi nancial turmoil from August 2007, marked
a halt in the trend towards more homogenous
fi nancial conditions. Secured and unsecured
money markets became increasingly impaired,
especially across national borders. Sovereign
bond yields also started to diverge at that time,
but this became more pronounced following the
onset of the sovereign debt crisis in May 2010.
This spilled over into corporate bond markets,
with effects at the country level becoming a
more important driving factor behind yield
developments. The return of differentiated
fi nancial conditions is also illustrated in
Charts 1 to 3.
The resuming heterogeneity in fi nancial
conditions mainly refl ects differences in the
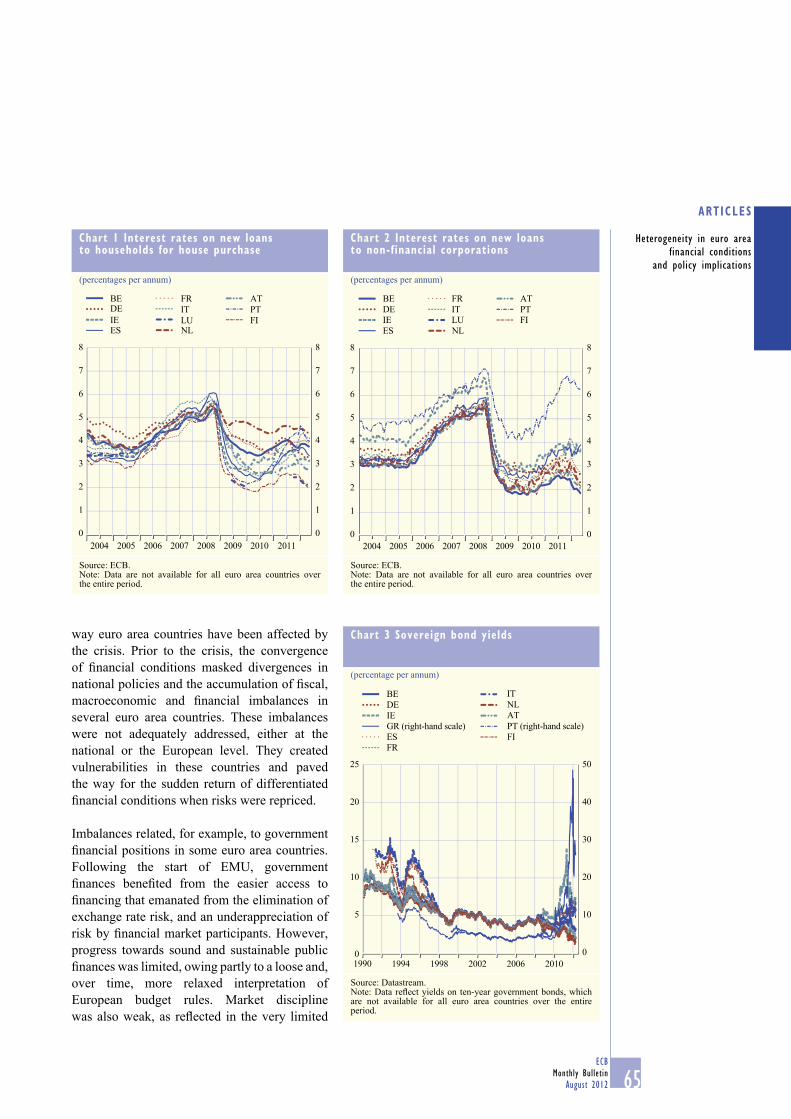
65ECB
Monthly Bulletin
August 2012
ARTICLES
Heterogeneity in euro area
financial conditions
and policy implications
way euro area countries have been affected by
the crisis. Prior to the crisis, the convergence
of fi nancial conditions masked divergences in
national policies and the accumulation of fi scal,
macroeconomic and fi nancial imbalances in
several euro area countries. These imbalances
were not adequately addressed, either at the
national or the European level. They created
vulnerabilities in these countries and paved
the way for the sudden return of differentiated
fi nancial conditions when risks were repriced.
Imbalances related, for example, to government
fi nancial positions in some euro area countries.
Following the start of EMU, government
fi nances benefi ted from the easier access to
fi nancing that emanated from the elimination of
exchange rate risk, and an underappreciation of
risk by fi nancial market participants. However,
progress towards sound and sustainable public
fi nances was limited, owing partly to a loose and,
over time, more relaxed interpretation of
European budget rules. Market discipline
was also weak, as refl ected in the very limited
Chart 1 Interest rates on new loans to households for house purchase
(percentages per annum)
0
1
2
3
4
5
6
7
8 8
0
1
2
3
4
5
6
7
2004 2005 2006 2007 2008 2009 2010 2011
BEDE
IEES
FR
IT
LUNL
AT
PT
FI
Source: ECB.Note: Data are not available for all euro area countries over the entire period.
Chart 2 Interest rates on new loans to non-financial corporations
(percentages per annum)
0
1
2
3
4
5
6
7
8
0
1
2
3
4
5
6
7
8
BE
DE
IE
ES
FR
IT
LU
NL
AT
PT
FI
2004 2005 2006 2007 2008 2009 2010 2011
Source: ECB.Note: Data are not available for all euro area countries over the entire period.
Chart 3 Sovereign bond yields
(percentage per annum)
0
10
20
30
40
50
0
5
10
15
20
25
1990 1994 1998 2002 2006 2010
BE
DE
IE
ES
FR
IT
NL
AT
FI
GR (right-hand scale) PT (right-hand scale)
Source: Datastream.Note: Data refl ect yields on ten-year government bonds, which are not available for all euro area countries over the entire period.
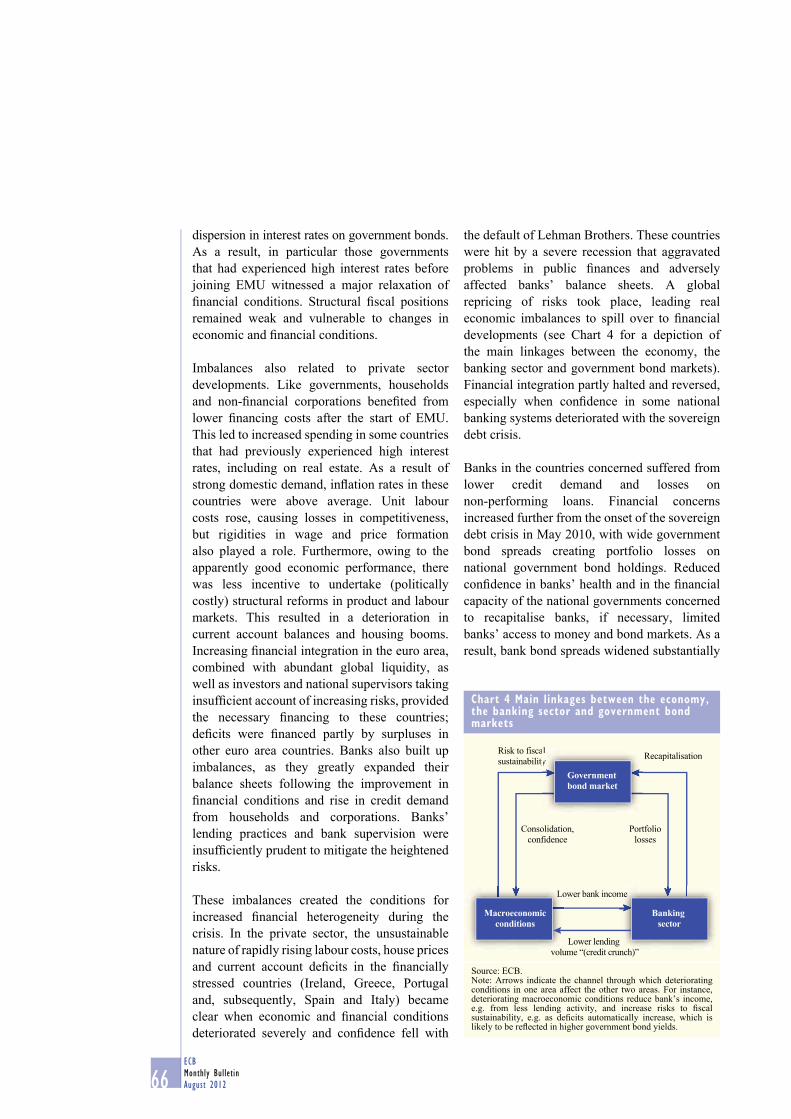
66ECB
Monthly Bulletin
August 2012
dispersion in interest rates on government bonds.
As a result, in particular those governments
that had experienced high interest rates before
joining EMU witnessed a major relaxation of
fi nancial conditions. Structural fi scal positions
remained weak and vulnerable to changes in
economic and fi nancial conditions.
Imbalances also related to private sector
developments. Like governments, households
and non-fi nancial corporations benefi ted from
lower fi nancing costs after the start of EMU.
This led to increased spending in some countries
that had previously experienced high interest
rates, including on real estate. As a result of
strong domestic demand, infl ation rates in these
countries were above average. Unit labour
costs rose, causing losses in competitiveness,
but rigidities in wage and price formation
also played a role. Furthermore, owing to the
apparently good economic performance, there
was less incentive to undertake (politically
costly) structural reforms in product and labour
markets. This resulted in a deterioration in
current account balances and housing booms.
Increasing fi nancial integration in the euro area,
combined with abundant global liquidity, as
well as investors and national supervisors taking
insuffi cient account of increasing risks, provided
the necessary fi nancing to these countries;
defi cits were fi nanced partly by surpluses in
other euro area countries. Banks also built up
imbalances, as they greatly expanded their
balance sheets following the improvement in
fi nancial conditions and rise in credit demand
from households and corporations. Banks’
lending practices and bank supervision were
insuffi ciently prudent to mitigate the heightened
risks.
These imbalances created the conditions for
increased fi nancial heterogeneity during the
crisis. In the private sector, the unsustainable
nature of rapidly rising labour costs, house prices
and current account defi cits in the fi nancially
stressed countries (Ireland, Greece, Portugal
and, subsequently, Spain and Italy) became
clear when economic and fi nancial conditions
deteriorated severely and confi dence fell with
the default of Lehman Brothers. These countries
were hit by a severe recession that aggravated
problems in public fi nances and adversely
affected banks’ balance sheets. A global
repricing of risks took place, leading real
economic imbalances to spill over to fi nancial
developments (see Chart 4 for a depiction of
the main linkages between the economy, the
banking sector and government bond markets).
Financial integration partly halted and reversed,
especially when confi dence in some national
banking systems deteriorated with the sovereign
debt crisis.
Banks in the countries concerned suffered from
lower credit demand and losses on
non-performing loans. Financial concerns
increased further from the onset of the sovereign
debt crisis in May 2010, with wide government
bond spreads creating portfolio losses on
national government bond holdings. Reduced
confi dence in banks’ health and in the fi nancial
capacity of the national governments concerned
to recapitalise banks, if necessary, limited
banks’ access to money and bond markets. As a
result, bank bond spreads widened substantially
Chart 4 Main linkages between the economy, the banking sector and government bond markets
Banking sector
Recapitalisation
Lower bank income
Lower lending
volume “(credit crunch)”
Risk to fiscal
sustainability
Consolidation,
confidence
Portfolio
losses
Lo
volu
Macroeconomicconditions
al
y
Government bond market
Source: ECB.Note: Arrows indicate the channel through which deteriorating conditions in one area affect the other two areas. For instance, deteriorating macroeconomic conditions reduce bank’s income, e.g. from less lending activity, and increase risks to fi scal sustainability, e.g. as defi cits automatically increase, which is likely to be refl ected in higher government bond yields.
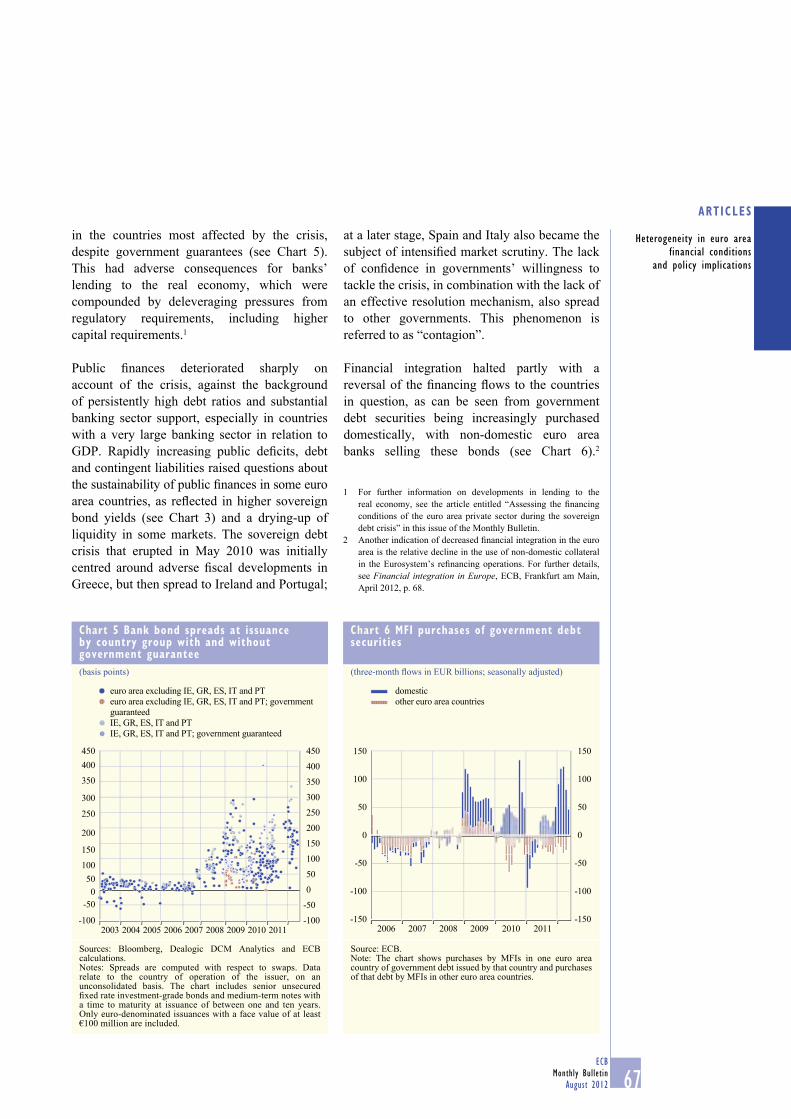
67ECB
Monthly Bulletin
August 2012
ARTICLES
Heterogeneity in euro area
financial conditions
and policy implications
in the countries most affected by the crisis,
despite government guarantees (see Chart 5).
This had adverse consequences for banks’
lending to the real economy, which were
compounded by deleveraging pressures from
regulatory requirements, including higher
capital requirements.1
Public fi nances deteriorated sharply on
account of the crisis, against the background
of persistently high debt ratios and substantial
banking sector support, especially in countries
with a very large banking sector in relation to
GDP. Rapidly increasing public defi cits, debt
and contingent liabilities raised questions about
the sustainability of public fi nances in some euro
area countries, as refl ected in higher sovereign
bond yields (see Chart 3) and a drying-up of
liquidity in some markets. The sovereign debt
crisis that erupted in May 2010 was initially
centred around adverse fi scal developments in
Greece, but then spread to Ireland and Portugal;
at a later stage, Spain and Italy also became the
subject of intensifi ed market scrutiny. The lack
of confi dence in governments’ willingness to
tackle the crisis, in combination with the lack of
an effective resolution mechanism, also spread
to other governments. This phenomenon is
referred to as “contagion”.
Financial integration halted partly with a
reversal of the fi nancing fl ows to the countries
in question, as can be seen from government
debt securities being increasingly purchased
domestically, with non-domestic euro area
banks selling these bonds (see Chart 6).2
For further information on developments in lending to the 1
real economy, see the article entitled “Assessing the fi nancing
conditions of the euro area private sector during the sovereign
debt crisis” in this issue of the Monthly Bulletin.
Another indication of decreased fi nancial integration in the euro 2
area is the relative decline in the use of non-domestic collateral
in the Eurosystem’s refi nancing operations. For further details,
see Financial integration in Europe, ECB, Frankfurt am Main,
April 2012, p. 68.
Chart 5 Bank bond spreads at issuance by country group with and without government guarantee
(basis points)
-100
-50
0
50
100
150
200
250
300
350
400
450
-100
-50
0
50
100
150
200
250
300
350
400
450
2003 2004 2006 2008 20102005 2007 2009 2011
euro area excluding IE, GR, ES, IT and PT
euro area excluding IE, GR, ES, IT and PT; government
guaranteed
IE, GR, ES, IT and PT
IE, GR, ES, IT and PT; government guaranteed
Sources: Bloomberg, Dealogic DCM Analytics and ECB calculations.Notes: Spreads are computed with respect to swaps. Data relate to the country of operation of the issuer, on an unconsolidated basis. The chart includes senior unsecured fi xed rate investment-grade bonds and medium-term notes with a time to maturity at issuance of between one and ten years. Only euro-denominated issuances with a face value of at least €100 million are included.
Chart 6 MFI purchases of government debt securities
(three-month fl ows in EUR billions; seasonally adjusted)
-150
-100
-50
0
50
100
150
-150
-100
-50
0
50
100
150
domestic
other euro area countries
2006 2007 2008 2009 2010 2011
Source: ECB.Note: The chart shows purchases by MFIs in one euro area country of government debt issued by that country and purchases of that debt by MFIs in other euro area countries.
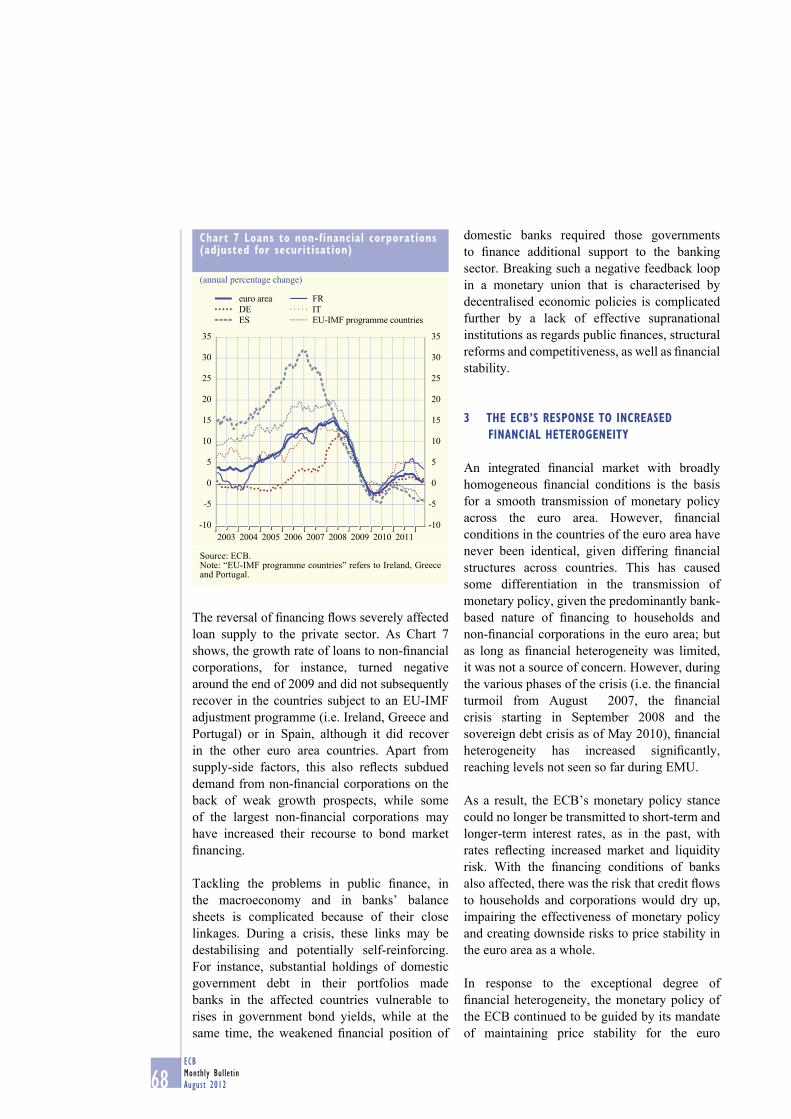
68ECB
Monthly Bulletin
August 2012
The reversal of fi nancing fl ows severely affected
loan supply to the private sector. As Chart 7
shows, the growth rate of loans to non-fi nancial
corporations, for instance, turned negative
around the end of 2009 and did not subsequently
recover in the countries subject to an EU-IMF
adjustment programme (i.e. Ireland, Greece and
Portugal) or in Spain, although it did recover
in the other euro area countries. Apart from
supply-side factors, this also refl ects subdued
demand from non-fi nancial corporations on the
back of weak growth prospects, while some
of the largest non-fi nancial corporations may
have increased their recourse to bond market
fi nancing.
Tackling the problems in public fi nance, in
the macroeconomy and in banks’ balance
sheets is complicated because of their close
linkages. During a crisis, these links may be
destabilising and potentially self-reinforcing.
For instance, substantial holdings of domestic
government debt in their portfolios made
banks in the affected countries vulnerable to
rises in government bond yields, while at the
same time, the weakened fi nancial position of
domestic banks required those governments
to fi nance additional support to the banking
sector. Breaking such a negative feedback loop
in a monetary union that is characterised by
decentralised economic policies is complicated
further by a lack of effective supranational
institutions as regards public fi nances, structural
reforms and competitiveness, as well as fi nancial
stability.
3 THE ECB’S RESPONSE TO INCREASED
FINANCIAL HETEROGENEITY
An integrated fi nancial market with broadly
homogeneous fi nancial conditions is the basis
for a smooth transmission of monetary policy
across the euro area. However, fi nancial
conditions in the countries of the euro area have
never been identical, given differing fi nancial
structures across countries. This has caused
some differentiation in the transmission of
monetary policy, given the predominantly bank-
based nature of fi nancing to households and
non-fi nancial corporations in the euro area; but
as long as fi nancial heterogeneity was limited,
it was not a source of concern. However, during
the various phases of the crisis (i.e. the fi nancial
turmoil from August 2007, the fi nancial
crisis starting in September 2008 and the
sovereign debt crisis as of May 2010), fi nancial
heterogeneity has increased signifi cantly,
reaching levels not seen so far during EMU.
As a result, the ECB’s monetary policy stance
could no longer be transmitted to short-term and
longer-term interest rates, as in the past, with
rates refl ecting increased market and liquidity
risk. With the fi nancing conditions of banks
also affected, there was the risk that credit fl ows
to households and corporations would dry up,
impairing the effectiveness of monetary policy
and creating downside risks to price stability in
the euro area as a whole.
In response to the exceptional degree of
fi nancial heterogeneity, the monetary policy of
the ECB continued to be guided by its mandate
of maintaining price stability for the euro
Chart 7 Loans to non-financial corporations (adjusted for securitisation)
(annual percentage change)
-10
-5
0
5
10
15
20
25
30
35 35
30
25
20
15
10
5
0
-5
-10
DE
ES
FR
IT
EU-IMF programme countries
euro area
2003 2004 2005 2006 2007 2008 2009 2010 2011
Source: ECB.Note: “EU-IMF programme countries” refers to Ireland, Greece and Portugal.
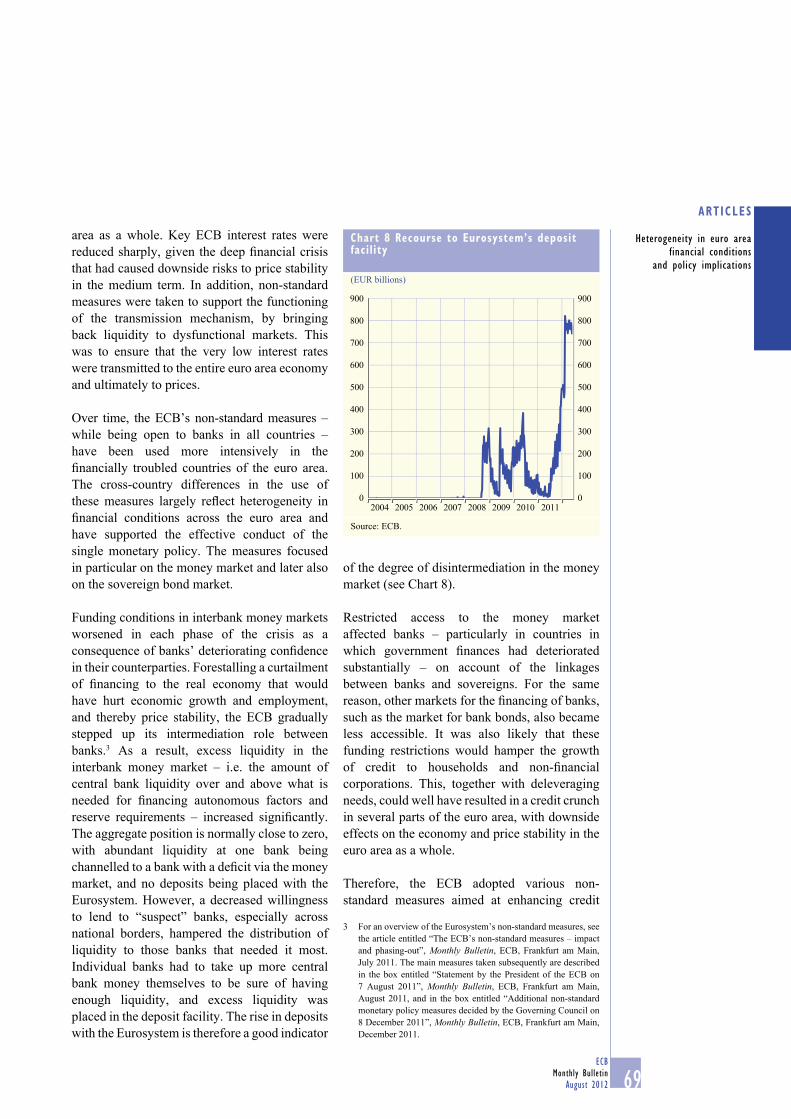
69ECB
Monthly Bulletin
August 2012
ARTICLES
Heterogeneity in euro area
financial conditions
and policy implications
area as a whole. Key ECB interest rates were
reduced sharply, given the deep fi nancial crisis
that had caused downside risks to price stability
in the medium term. In addition, non-standard
measures were taken to support the functioning
of the transmission mechanism, by bringing
back liquidity to dysfunctional markets. This
was to ensure that the very low interest rates
were transmitted to the entire euro area economy
and ultimately to prices.
Over time, the ECB’s non-standard measures –
while being open to banks in all countries –
have been used more intensively in the
fi nancially troubled countries of the euro area.
The cross-country differences in the use of
these measures largely refl ect heterogeneity in
fi nancial conditions across the euro area and
have supported the effective conduct of the
single monetary policy. The measures focused
in particular on the money market and later also
on the sovereign bond market.
Funding conditions in interbank money markets
worsened in each phase of the crisis as a
consequence of banks’ deteriorating confi dence
in their counterparties. Forestalling a curtailment
of fi nancing to the real economy that would
have hurt economic growth and employment,
and thereby price stability, the ECB gradually
stepped up its intermediation role between
banks.3 As a result, excess liquidity in the
interbank money market – i.e. the amount of
central bank liquidity over and above what is
needed for fi nancing autonomous factors and
reserve requirements – increased signifi cantly.
The aggregate position is normally close to zero,
with abundant liquidity at one bank being
channelled to a bank with a defi cit via the money
market, and no deposits being placed with the
Eurosystem. However, a decreased willingness
to lend to “suspect” banks, especially across
national borders, hampered the distribution of
liquidity to those banks that needed it most.
Individual banks had to take up more central
bank money themselves to be sure of having
enough liquidity, and excess liquidity was
placed in the deposit facility. The rise in deposits
with the Eurosystem is therefore a good indicator
of the degree of disintermediation in the money
market (see Chart 8).
Restricted access to the money market
affected banks – particularly in countries in
which government fi nances had deteriorated
substantially – on account of the linkages
between banks and sovereigns. For the same
reason, other markets for the fi nancing of banks,
such as the market for bank bonds, also became
less accessible. It was also likely that these
funding restrictions would hamper the growth
of credit to households and non-fi nancial
corporations. This, together with deleveraging
needs, could well have resulted in a credit crunch
in several parts of the euro area, with downside
effects on the economy and price stability in the
euro area as a whole.
Therefore, the ECB adopted various non-
standard measures aimed at enhancing credit
For an overview of the Eurosystem’s non-standard measures, see 3
the article entitled “The ECB’s non-standard measures – impact
and phasing-out”, Monthly Bulletin, ECB, Frankfurt am Main,
July 2011. The main measures taken subsequently are described
in the box entitled “Statement by the President of the ECB on
7 August 2011”, Monthly Bulletin, ECB, Frankfurt am Main,
August 2011, and in the box entitled “Additional non-standard
monetary policy measures decided by the Governing Council on
8 December 2011”, Monthly Bulletin, ECB, Frankfurt am Main,
December 2011.
Chart 8 Recourse to Eurosystem’s deposit facility
(EUR billions)
0
100
200
300
400
500
600
700
800
900
0
100
200
300
400
500
600
700
800
900
2004 2005 2006 2007 2008 2009 2010 2011
Source: ECB.
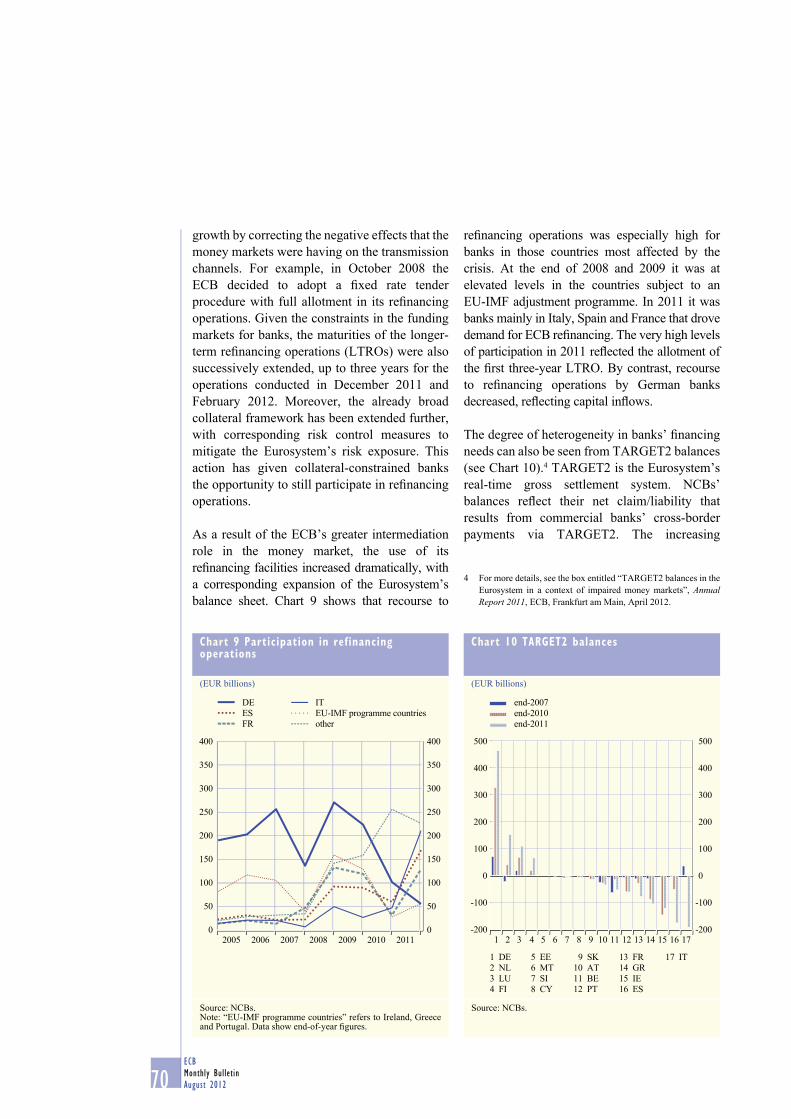
70ECB
Monthly Bulletin
August 2012
growth by correcting the negative effects that the
money markets were having on the transmission
channels. For example, in October 2008 the
ECB decided to adopt a fi xed rate tender
procedure with full allotment in its refi nancing
operations. Given the constraints in the funding
markets for banks, the maturities of the longer-
term refi nancing operations (LTROs) were also
successively extended, up to three years for the
operations conducted in December 2011 and
February 2012. Moreover, the already broad
collateral framework has been extended further,
with corresponding risk control measures to
mitigate the Eurosystem’s risk exposure. This
action has given collateral-constrained banks
the opportunity to still participate in refi nancing
operations.
As a result of the ECB’s greater intermediation
role in the money market, the use of its
refi nancing facilities increased dramatically, with
a corresponding expansion of the Eurosystem’s
balance sheet. Chart 9 shows that recourse to
refi nancing operations was especially high for
banks in those countries most affected by the
crisis. At the end of 2008 and 2009 it was at
elevated levels in the countries subject to an
EU-IMF adjustment programme. In 2011 it was
banks mainly in Italy, Spain and France that drove
demand for ECB refi nancing. The very high levels
of participation in 2011 refl ected the allotment of
the fi rst three-year LTRO. By contrast, recourse
to refi nancing operations by German banks
decreased, refl ecting capital infl ows.
The degree of heterogeneity in banks’ fi nancing
needs can also be seen from TARGET2 balances
(see Chart 10).4 TARGET2 is the Eurosystem’s
real-time gross settlement system. NCBs’
balances refl ect their net claim/liability that
results from commercial banks’ cross-border
payments via TARGET2. The increasing
For more details, see the box entitled “TARGET2 balances in the 4
Eurosystem in a context of impaired money markets”, Annual Report 2011, ECB, Frankfurt am Main, April 2012.
Chart 9 Participation in refinancing operations
(EUR billions)
0
50
100
150
200
250
300
350
400
0
50
100
150
200
250
300
350
400
DE
ES
FR
IT
EU-IMF programme countries
other
2005 2006 2007 2008 2009 2010 2011
Source: NCBs.Note: “EU-IMF programme countries” refers to Ireland, Greece and Portugal. Data show end-of-year fi gures.
Chart 10 TARGET2 balances
(EUR billions)
500
400
300
200
100
0
-100
-200
500
400
300
200
100
0
-100
-2001 2 3 4 5 6 7 8 9 10 11 12 13 14 15 16 17
end-2007
end-2010
end-2011
1 DE
2 NL
3 LU
4 FI
5 EE
6 MT
7 SI
8 CY
9 SK
10 AT
11 BE
12 PT
17 IT
16 ES
13 FR
14 GR
15 IE
Source: NCBs.
71ECB
Monthly Bulletin
August 2012
ARTICLES
Heterogeneity in euro area
financial conditions
and policy implications
TARGET2 liabilities of some NCBs mainly
refl ect funding stress in their respective banking
systems, with fi nancial outfl ows being
compensated by increased recourse to the
Eurosystem’s refi nancing operations.
From May 2010 government bond markets
became adversely affected alongside a sudden
and sometimes excessive repricing of risks.
Malfunctioning in some government bond
markets was refl ected in the drying-up of
liquidity. Changes in the key ECB interest rates
are normally transmitted via short-term market
rates along the yield curve to longer-term
rates and to the economy, but this process was
hampered in those countries with malfunctioning
government bond markets. These markets
play an important role in the transmission
process (e.g. by generally setting a fl oor for
corporate bonds and acting as a primary source
of collateral in repo transactions). Without
further action, more bond markets would have
been likely to be affected via contagion, with
negative repercussions on the funding of the
economy, economic growth, employment and
price stability.
Therefore, in May 2010 the ECB started to
purchase bonds of some governments outright
in the secondary market under its Securities
Markets Programme (SMP). After a period of
relative calm at the beginning of 2011,
interventions increased again in the second half
of that year. The ECB acted in markets where
liquidity was at very low levels, thus helping to
repair the usual transmission process.5 In
addition, the refi nancing operations, and in
particular the three-year LTROs, have supported
sovereign bond markets, as some banks decided
to use part of the liquidity to buy government
bonds.
4 THE ROLE OF FISCAL, MACROECONOMIC
AND FINANCIAL POLICIES IN ADDRESSING
THE INSTITUTIONAL SHORTCOMINGS OF EMU
The linkages between fi scal, structural and
fi nancial imbalances that led to the sovereign
debt crisis and the fragmentation of fi nancial
markets, as described in the previous sections,
have revealed several shortcomings in the
institutional set-up of EMU. This section fi rst
reviews the weaknesses in the institutional
design prior to the crisis; second, it describes
the progress achieved so far in addressing said
shortcomings; and third, it looks at what still
remains to be done.
The crisis has highlighted two major
weaknesses in the institutional set-up of EMU.
First, the policy framework in place to ensure
economic and fi nancial convergence across
euro area countries and foster fl exibility of their
economies is not fully effective. Incentives and
rules to support sound national fi scal, fi nancial
and macroeconomic policies were not suffi cient
to prevent imbalances from building up prior
to the crisis. Furthermore, the absence of an
explicit mechanism for correcting imbalances
has led to a delay in necessary adjustments in
several countries. Structural rigidities, in turn,
caused these adjustments to be more costly once
the crisis erupted.
Second, the pre-crisis fi nancial stability
framework was characterised by a limited
degree of harmonisation and coordination
across euro area countries. The absence of any
euro area-wide fi nancial stability and crisis
management made it challenging to identify
and correct systemic risk prior to the crisis;
and it was equally challenging to contain
the spread of fi nancial instabilities across
countries and markets when this risk actually
materialised. The crisis management and
fi nancial sector repair, such as the rescue and
resolution of fi nancial institutions, was left to
national authorities, despite large cross-border
activities in the fi nancial sector. This resulted
in the retrenchment of the fi nancial system
within national borders, sowing the seeds for
the subsequent adverse feedback loop between
sovereigns’ and banks’ fi nancial conditions.
To preserve the effectiveness of these monetary policy 5
operations, the Eurosystem does not provide information on the
country distribution of SMP interventions.
72ECB
Monthly Bulletin
August 2012
Heterogeneity manifested itself not only
through increased divergence, but also through
greater contagion in the absence of a credible
institutional backstop. Powerful propagation
and amplifi cation mechanisms emerged – from
the sovereign market to the banking sector,
from the fi nancial to the real sphere, and across
borders – so that deteriorating conditions in one
particular country had the potential to affect the
euro area as a whole.
Addressing these shortcomings is necessary to
restore more homogenous fi nancial conditions
and eliminate fi nancial imbalances. This will
be crucial for monetary policy to operate more
effectively and ensure its smooth transmission
to the euro area economy as a whole. As already
discussed in Section 3, although the ECB’s
non-standard measures can bring temporary
relief, they do not tackle the underlying causes
of the prevailing fi nancial imbalances. This
can only be achieved through policy measures
at the national and euro area/European levels.
In particular, macroeconomic policies need to
address general fi nancial imbalances, whereas
fi nancial policies should aim to achieve more
homogenous fi nancial conditions.
Recognising the need to address these
shortcomings has led to a series of overarching
reforms relating to the overall economic
governance framework, fi nancial supervision
and regulation, and crisis management.
First, some measures have been taken at the
European level to enhance fi scal discipline and
the competitiveness of euro area economies.
Almost all EU Member States have signed the
Treaty on Stability, Coordination and Governance
in the Economic and Monetary Union, which
includes the “fi scal compact”, featuring
the adoption of budget rules and correction
mechanisms within national legislation. Euro
area-wide macroeconomic surveillance has
also been strengthened through the adoption of
different measures, such as the “six pack” and
the “two pack”, which are intended to enhance
the prevention and correction of fi scal and
macroeconomic imbalances.6 Besides greater
peer pressure, the reformed framework is also
intended to reinforce market discipline by making
it easier for markets to monitor national policies.
Second, progress has been made regarding the
euro area fi nancial framework. The need to
detect and address systemic risk led to the
creation of the European Systemic Risk Board
(ESRB) for macro-prudential policy, whereas
the coordination of micro-prudential supervision
was reinforced by the establishment of three
different European authorities. The aim of the
reform of the supervision framework was to
improve the quality and consistency of
supervision, reinforce the supervision of cross-
border groups, strengthen crisis prevention and
management across the euro area, and establish
a set of common standards applicable to all
fi nancial institutions (i.e. a “single rulebook”).
Regarding fi nancial regulation, the current
overhaul of the regulatory framework and the
capital adequacy targets set at the European
level should help to strengthen the banking
system, prevent excessive leverage and foster
the provision of credit to the economy. Other
important regulatory reforms are also under
way, in areas such as short selling, credit rating
agencies’ regulation, the “shadow banking
system”, and the establishment of an appropriate
regulatory framework for over-the-counter
derivatives.7 Moreover, another non-crisis-
related project, namely TARGET2-Securities,
should contribute to safer processing, improved
effi ciency and lower costs for cross-border
transactions, thereby supporting more integrated
euro area fi nancial markets.
Third, and lastly, the need to tackle contagion
was addressed through the establishment of the
These issues have been dealt with in more detail in the article 6
entitled “Monetary and fi scal policy interactions in a monetary
union”, Monthly Bulletin, ECB, Frankfurt am Main, July 2012,
and in the article entitled “A fi scal compact for a stronger
Economic and Monetary Union”, Monthly Bulletin, ECB,
Frankfurt am Main, May 2012. The remainder of this section
therefore focuses primarily on supervision issues.
These issues have been dealt with in detail in the Special 7
Feature D entitled “Institutional reform in the European Union
and fi nancial integration”, Financial Integration in Europe,
ECB, Frankfurt am Main, April 2012.
73ECB
Monthly Bulletin
August 2012
ARTICLES
Heterogeneity in euro area
financial conditions
and policy implications
European Financial Stability Facility (EFSF)
and its successor, the European Stability
Mechanism (ESM). The ESM will provide
temporary fi nancial support to euro area
countries, with the aim of providing bridge
funding for the period of time needed to
implement a deep adjustment programme to
correct imbalances and regain market access,
thus avoiding contagion through destabilising
cross-country spillovers.8
Looking ahead, it is important that governments
deliver on the agreed measures. These measures
constitute a signifi cant improvement to the
institutional framework, and, if implemented,
should reinforce the resilience of the euro
area fi nancial system and help to mitigate the
risks of the vicious spirals of instability and
heterogeneity seen during the crisis. That being
said, further policy actions may be needed, such
as structural fi nancial sector policies, further
policies to address macro-fi nancial imbalances,
and policies aimed at achieving better crisis
management and resolution. In particular, a
harmonised bank recovery and resolution regime
at the European level would help to break the
link between sovereigns and banks that has
contributed signifi cantly to the development of
substantial fi nancial heterogeneity in the euro
area, including the build-up of contagion risks.
At the same time, it would also help to reduce the
heterogeneity in interbank activity and fi nancial
fl ows, as refl ected in the TARGET2 balances.
Generally speaking, policies need to be directed
towards more integrated euro area fi nancial
markets that are both more effi cient and more
resilient. In this regard, the benefi ts of integrated
fi nancial markets are manifold. They support
balanced monetary and fi nancial conditions
and thereby foster a smooth transmission of
monetary policy within the euro area. They
also improve the resilience of the fi nancial
system through increased competition, more
liquid markets and better diversifi cation and
risk sharing. At the same time, as evidenced by
the crisis, an incomplete process of fi nancial
integration – with increased cross-border
interactions, but no safeguards in place to
address systemic risk – can pose substantial
threats to fi nancial stability and economic
growth.
With respect to supervision, crisis management
and resolution policies, the need for adequate
instruments to deal with fi nancial crises in a
monetary union can be illustrated by means of
two polar cases. In the fi rst case, regulation,
supervision and crisis management would
continue to be organised along national lines,
with some elements of cross-border cooperation.
Such a framework would, however, require much
more stringent rules and closer cooperation –
especially to deal with systemic institutions,
i.e. the “too big to fail” problem – than has
been the case in the euro area so far. In the
second case, regulation, supervision and crisis
management are centralised, and the pooling of
risks across countries would de facto create a
fi nancial union. Resources to rescue the fi nancial
system, from private or public sources, would
be pooled into a single central mechanism,
increasing effi ciency compared with a situation
in which each country has its own authority.
Against this background, several proposals
have been made for an EU framework for bank
recovery and resolution (see the box). The
latest proposal by the European Commission
represents progress towards a fi nancial union
and a step forward compared with the pre-crisis
situation, in which national regimes were not
harmonised and lacked resolution authorities.
The euro area summit of 29 June 2012, which
laid the foundations for an effective single
supervisory mechanism, is an important step in
the right direction. Further progress, however,
needs to be made, especially with regard to a
euro area deposit insurance scheme and the
setting-up of a truly integrated resolution regime
to address the issue of cross-border systemically
important fi nancial institutions.
See the article entitled “The European Stability Mechanism”, 8
Monthly Bulletin, ECB, Frankfurt am Main, July 2011.
74ECB
Monthly Bulletin
August 2012
Box
TOWARDS A NEW EU FRAMEWORK FOR BANK RECOVERY AND RESOLUTION
The fi nancial crisis has highlighted the need for an EU framework for bank recovery and
resolution, ideally based on the new international standard on resolution regimes (Key Attributes
of Effective Resolution Regimes for Financial Institutions), published by the Financial Stability
Board (FSB) in October 2011. The new framework should pursue two equally important and
interrelated objectives: i) reducing the risks of taxpayers by ensuring that banks can be allowed to
fail in an orderly way; and ii) breaking the link between banks and sovereigns which has created
a vicious circle in some EU Member States. To satisfy these two goals, the EU’s resolution
regime needs to ensure that the fi nancial industry bears the costs of resolution by means of a
credible, effi cient resolution fi nancing arrangement, using resolution tools that allow for losses
to be imposed on shareholders and creditors.
On 6 June 2012 the European Commission presented its proposal for a new EU framework
on bank recovery and resolution, which includes elements for prevention (e.g. resolution and
recovery plans) as well as for early intervention and resolution. In accordance with the FSB’s
Key Attributes, the Commission’s proposal provides the resolution authorities with a common
toolkit, consisting of a series of powers and tools (i.e. the bridge bank, the sale of business, the
asset separation and bail-in) that would allow them to deal with banks in diffi culty – as a going
concern (i.e. through bail-in) or as a gone concern (i.e. through a bridge bank or a combination
of resolution tools). The directive also introduces a European system of fi nancing arrangements
composed of: i) national fi nancing arrangements; ii) the borrowing between national fi nancing
arrangements; and (iii) the mutualisation of national fi nancing arrangements in the case of a
group resolution. Such fi nancing arrangements would be supported by contributions from banks,
so that in a period of no longer than ten years after the entry into force of the directive, the
available fi nancial means of the fi nancing arrangements amount to at least 1% of the value of the
covered deposits.
The European Commission’s proposal represents a signifi cant step forward from the current
situation, in which national regimes lack the necessary resolution powers and there is an
insuffi cient level of harmonisation. The initiative to create a common EU language for resolution
that is very close to the international standard will not only facilitate the handling of future
crises, but also improve cooperation between the relevant authorities across jurisdictions. A key
priority, therefore, for the near future is the consistent implementation of the directive among
the EU Member States and the FSB’s Key Attributes at the international level. However, how
all this will work in practice for large cross-border banks in the EU’s Single Market remains an
open question.
The fi nancial crisis has highlighted the complexity of resolution for the cross-border systemically
important fi nancial institutions. In this respect, the EU needs to make further progress towards a
truly integrated resolution regime that adequately refl ects the cross-border nature of its banking
sector. Such an integrated resolution regime would enhance market discipline by mitigating
moral hazard, maintain stability by ensuring the continuity of basic services of institutions being
wound up, allocate losses effi ciently and protect taxpayers.

75ECB
Monthly Bulletin
August 2012
ARTICLES
Heterogeneity in euro area
financial conditions
and policy implications
The medium-term vision for such an integrated resolution regime could ultimately be the
establishment of an EU-level resolution authority responsible for all the major cross-border banks
in the EU. Such an authority would work on the basis of a single crisis management, resolution
and insolvency framework for EU banks. Developments along these lines are already taking
place in the fi eld of prudential regulation. The decision taken at the euro area summit of 29 June
2012 to introduce a single supervisory mechanism on the basis of Article 127(6) of the Treaty on
the Functioning of the European Union represents an important step towards a fi nancial union.
This will be coupled with the implementation of the new Basel rules, which will partly take the
form of an EU regulation, thereby eliminating the room for national differences in transposition.
Such an integrated resolution system should be based on robust arrangements to fi nance the
measures of the EU resolution authority. These arrangements should be shaped in such a
way that the thorny issue of public burden-sharing is replaced, insofar as possible, by private
burden-sharing. To this end, resources could be pooled in a single pan-EU resolution fund. This
would help to break the link between the creditworthiness of banks and that of their sovereigns
and, at the same time, ensure a level playing fi eld and consistent application of the relevant rules
throughout the EU.
5 CONCLUSION
The fi nancial and sovereign debt crisis has greatly
increased the degree of heterogeneity in fi nancial
conditions in the euro area. Unsustainable public
fi nances, large macroeconomic imbalances
and impaired domestic banking systems have
led to a deterioration in fi nancial conditions in
some parts of the euro area where the fi nancial
benefi ts of entering EMU had been particularly
large and rising imbalances were not contained
by appropriate policies.
This high degree of heterogeneity posed
challenges for the conduct of the single monetary
policy. Nevertheless, the ECB’s monetary policy
has contributed to alleviating heterogeneity in
fi nancial conditions. Throughout the crisis, the
ECB’s measures have continued to be guided
by its mandate of maintaining price stability
in the euro area as a whole, helping to reduce
uncertainty and related risk premia in interest
rates. The ECB’s non-standard monetary policy
measures, such as the three-year LTROs and
the SMP, supported money market and bond
market conditions in the fi nancially troubled
countries, and contributed to ensuring a more
homogeneous transmission of the euro area’s
monetary policy.
However, the ECB’s non-standard measures are
only temporary in nature and cannot tackle the
underlying causes of fi nancial imbalances and
heterogeneous fi nancial conditions. Structural
corrections are needed as regards public
fi nances, macroeconomic imbalances and
fi nancial stability, which are the responsibility
of the national governments of the euro area
countries. Appropriate policies are already being
implemented, in part, at both the national and
euro area/European levels, but these may require
faster implementation than is currently foreseen,
as well as additional decisive steps. These
include the further transfer of competences to
the European level as regards euro area fi nancial
sector crisis management and resolution, hence
a move towards a fi nancial union. The decision
taken at the euro area summit of 29 June 2012
to introduce a single supervisory mechanism on
the basis of Article 127(6) of the Treaty on the
Functioning of the European Union represents
an important step in the right direction.

77ECB
Monthly Bulletin
August 2012
ARTICLES
Assessing the financing
conditions for the
euro area private
sector during the
sovereign debt crisis
1 INTRODUCTION
The fi nancial crisis, which started in August 2007,
impaired several segments of the global fi nancial
system, affecting the fi nancing conditions of both
the fi nancial and non-fi nancial sectors. In the
period since the beginning of 2010 tensions in
the fi nancial system have reignited as a result of
concerns about the fi nancing of some euro area
sovereigns. The euro area has been particularly
affected and fi nancing conditions have on the
whole remained tight over the period. Moreover,
they have become increasingly diverse across
euro area countries.
This situation has occurred despite the fact
that the key ECB interest rates are at very low
levels. The ECB has implemented various
non-standard measures to address the impairments
in the monetary policy transmission mechanism
that affect several segments of the euro area
fi nancial system. Such measures have often
provided governments with more time to put
in place structural measures that are required to
address the fundamental causes of the crisis.
To assess the impact of the sovereign debt
crisis on the fi nancing conditions of the euro
area private sector, several interrelated aspects
must be considered. First and foremost,
funding and balance sheet conditions in the
banking system warrant careful scrutiny.
There are strong interdependencies between
banks and governments, through both balance
sheet and contingent claim exposures. These
interdependencies mutually reinforce the
macroeconomic propagation of banking or
sovereign market tensions. Second, given the
fragmentation of some market segments and the
setback to European banking sector integration,
persistent cross-country heterogeneity needs to
be considered. Third, a proper assessment of
fi nancing conditions hinges on the distinction
between demand and supply-side factors in
credit intermediation. Finally, the impact of
non-standard measures adopted by the ECB
and the Eurosystem as a whole needs to be
identifi ed. The impact of some measures that
have prevented the materialisation of tail risks
may not be immediate or direct.
The article analyses developments in the fi nancing
of banks, NFCs and households, primarily at the
euro area level, since the start of the sovereign
debt crisis in 2010. While the primary focus is
on the fi nancing of the euro area non-fi nancial
private sector, particular attention is paid to
the transmission of changes in banks’ funding
conditions to the fi nancing of the non-fi nancial
private sector. To this end, a framework is
described in which the various dimensions of
fi nancing conditions, such as fi nancing volumes,
fi nancial prices, bank retail rates and lending
standards, are considered together.
ASSESSING THE FINANCING CONDITIONS OF THE EURO AREA PRIVATE SECTOR DURING THE SOVEREIGN DEBT CRISIS
Maintaining access to external fi nancing for the euro area non-fi nancial private sector is essential for the functioning of the economy. To monitor developments that have a bearing on this access to fi nancing, a proper assessment of fi nancing conditions is necessary and, thus, a framework that can be used to understand the channels through which fi nancial shocks, particularly emanating from the sovereign debt markets, propagate from the fi nancial system to the real economy. This article describes such a framework and uses it to analyse how the fi nancing conditions of euro area fi rms and households have evolved since the start of the sovereign debt crisis.
While the ECB’s policy response has, to a signifi cant extent, sheltered the non-fi nancial private sector from the sovereign debt crisis, and has avoided major disruptions in the fi nancing of the economy, the fi nancing environment of both banks and the non-fi nancial private sector of countries affected by the sovereign debt crisis remains challenging. This is particularly refl ected in persistent cross-country heterogeneity as well as in the strong link between sovereign market tensions, the funding and balance sheet conditions of banks, and the fi nancing of non-fi nancial corporations (NFCs) and households in the euro area.
78ECB
Monthly Bulletin
August 2012
The article consists of six sections. Section 2
presents a framework that can be used to
understand how tensions in the fi nancial system
propagate to the economy as a whole. The key
role played by banks in the fi nancing of the euro
area economy is discussed. Recent developments
in the euro area banking sector are then analysed
in detail in Section 3. It is shown that banks’
access to funding has become a major concern
in terms of their potential to constrain loan
supply to the non-fi nancial private sector and,
ultimately, to weigh negatively on economic
activity. However, at times of high stress and
funding problems, standard and non-standard
measures taken by the Eurosystem have enabled
euro area banks to continue to provide credit to
the economy. Section 4 describes the external
fi nancing of NFCs, its determinants and its
linkages with banks’ funding. It highlights
the transmission of changes in banks’ funding
conditions to the prices and terms applied to
credit supplied to fi rms, and provides some
evidence of asymmetries across corporations,
in particular across large and small fi rms. At the
same time, the subdued movements recorded
in loans over the period are shown to refl ect
mainly weak demand. Section 5 examines the
fi nancing of households, with a particular focus
on loans for house purchase, which constitute
the lion’s share of credit to households.
Section 6 concludes with a discussion of the
extent to which the policy response has so far
alleviated some of the tensions and a review of
the remaining challenges.
2 A FRAMEWORK FOR THE ANALYSIS OF
FINANCING CONDITIONS IN THE EURO AREA
AND THE IMPACT OF THE SOVEREIGN DEBT
CRISIS
This section provides an overview of the
components and linkages forming the fi nancing
conditions of the private sector in the euro area
and their interaction with the sovereign debt
crisis. It fi rst distinguishes different components
that infl uence the fi nancing conditions of
bank-based and market-based debt fi nancing.
Next, it highlights the effects of the sovereign
debt crisis on these components and details
distinct channels of propagation of sovereign
debt tensions to the fi nancing conditions of the
private sector.
Central to these conditions are developments
in benchmark interest rates. These comprise
mainly the key ECB interest rates, money
market rates and government bond yields,
with the latter containing the term structure of
risk-free rates, domestic sovereign credit risk
and liquidity premia (see Chart 1). These rates
are the main determinants of the conditions of
direct fi nancing in fi nancial markets for both
non-fi nancial and fi nancial corporations and,
consequently, for the wholesale market funding
and deposit funding of banks. In the euro area,
bank-based fi nancing is the predominant source
of external debt fi nancing for the non-fi nancial
private sector. Therefore, factors that have an
impact on credit intermediation through banks
also exert a particularly strong infl uence on the
fi nancing conditions of fi rms and households.
More specifi cally, the effects of the sovereign
debt crisis on banks’ funding and liquidity
positions, as well as on their balance sheet
structures and capital positions, have
had an impact on banks’ lending rates,
non-price conditions and lending volumes to the
non-fi nancial private sector. In addition, in the
case of market-based fi nancing, the sovereign
debt crisis has affected the external fi nance
premium for borrowers via its impact on their
credit risk, as well as via its overall impact on
the market pricing of risk.
Broadly speaking, there are three propagation
channels for the sovereign debt crisis through
which tensions and disruptions in government
bond markets can affect private sector fi nancing
conditions and have an impact on the monetary
policy transmission mechanism: a price channel,
a balance sheet channel and a liquidity channel.1
In part, this classifi cation departs from standard classifi cations of 1
the monetary policy transmission mechanism as they typically
assume a perfect functioning of government bond markets.

79ECB
Monthly Bulletin
August 2012
ARTICLES
Assessing the financing
conditions for the
euro area private
sector during the
sovereign debt crisis
The most direct effects are exerted via the price
channel, through which substantial increases in
government bond yields – and more specifi cally
in domestic sovereign credit risk – can lead
directly to higher fi nancing costs for the private
sector via capital markets as well as via bank
lending rates. Most prominently and directly,
government bond yields affect fi nancing
conditions as they typically function as benchmark
interest rates, particularly in that they refl ect the
term structure of risk-free rates, but to some
extent also in that they contain the domestic
sovereign credit risk and the liquidity premium
(see the middle of Chart 1). In the case of capital
markets, the correlation of government bond
yields with yields on bonds issued by fi nancial
institutions is expected to be higher than with
yields on bonds issued by NFCs, as the credit risk
of banks and sovereigns is – particularly in
periods of severe fi nancial market tensions –
more closely and directly connected than they are
with the credit risk of the non-fi nancial sector.
Via a change in the refi nancing costs of banks
associated with changes in bank bond spreads,
such increases in government bond yields have a
strong impact on banks’ funding conditions
(represented by the arrow to “Banks’ funding and
liquidity positions” in Chart 1), which may be
passed through to bank lending rates.2
As regards the balance sheet channel, revaluations
of government bonds may directly entail changes
in the size of the balance sheet, both for banks
and for their customers. These changes may
additionally be amplifi ed by regulatory responses
to banks’ sovereign exposures, posing a threat to
the stability of the banking system. For banks, if
the market valuation of sovereign bond holdings
falls below the book value, this may imply an
erosion of their capital base both directly, via
revaluation effects on the banks’ own government
bond holdings, and indirectly, via a deterioration
in the creditworthiness of their borrowers
(represented by the arrow to “Banks’ balance sheet
In addition, increases in government bond yields may directly 2
affect bank lending rates through variable rate agreements on
loans or mortgages. However, such agreements are usually
linked or indexed to money market rates.
Chart 1 A stylised illustration of credit intermediation and debt financing conditions of the non-financial private sector, as well as the interaction with developments in sovereign debt
Firms’ debt securities issuance conditions
Lending conditions for firms and households
Market-based financing
External finance premium
Benchmark interest rates Bank-based financing
Borrowers’credit risk
Market price of risk
Banks’balance sheetand capitalpositions
Borrowers’credit risk
Banks’funding and
liquidity positions
Key ECB interest rates
Money market rates
Government bond yields
Bank lending rates Non-price terms and conditions
- Term structure- Domestic credit risk- Liquidity premia
Source: ECB.Notes: The brown shaded areas indicate parts of the credit intermediation process affected by developments in sovereign debt markets. The darker shading signifi es stronger effects.
80ECB
Monthly Bulletin
August 2012
and capital positions” in Chart 1). The resulting
higher leverage negatively affects banks’ market
funding conditions and may force them to shrink
their balance sheets, with adverse effects on their
capacity to extend loans to the private sector. This
revaluation effect may be amplifi ed by effects
transmitted through the price channel, given
that changes in government bond yields affect
the prices of other privately issued securities to
some extent. In addition, banks’ deposit base may
deteriorate if households and NFCs withdraw
funds in response to banks’ weaker fi nancial
soundness. Likewise, such revaluations affect
the non-fi nancial private sector’s holdings of
government bonds and other affected securities,
which has a negative impact on the credit risk of
households and fi rms (represented by the arrows
to “Borrowers’ credit risk” in both the bank-based
and market-based fi nancing panels of Chart 1).
This implies a higher external fi nance premium
for the non-fi nancial private sector and further
tightening of the fi nancing conditions applied by
banks and fi nancial markets.
Finally, changes in government bond yields
indirectly affect banks’ funding conditions via
the liquidity channel. As euro area banks have
increasingly relied on wholesale market funding,
their exposure to changes in conditions applied
to market fi nancing has likewise increased.
Given their high liquidity in normal times,
government bonds are prime collateral used
in European repo markets and may serve as a
benchmark for determining the haircut for other
assets used in such transactions. Disruptions
in the government bond market can thus spill
over to other market segments, leading to a
deterioration in banks’ market access to liquidity
(represented by the arrow to “Banks’ funding
and liquidity positions” in Chart 1). If the
ratings of sovereign bonds in a collateral pool
are downgraded, it can lead to a review of the
pool’s eligibility for use as collateral, triggering
margin calls and a reduction in the volume of
accessible collateralised credit. This, in turn,
could have repercussions on banks’ ability to
use government bonds as collateral for secured
interbank lending and to issue their own bonds,
ultimately resulting in an increase in banks’
funding costs. The box provides a synthesised
view of fi nancing conditions indices for the
euro area.
Box
FINANCING CONDITIONS INDICES FOR THE EURO AREA
Several international organisations and large fi nancial institutions have developed fi nancing
conditions indices (FCIs).1 Isolating fi nancing conditions from monetary conditions is especially
useful at the current juncture, which is characterised by low monetary policy rates but substantial
stress in the fi nancial system. This box reviews briefl y the methodology used to construct such
FCIs and looks at some results obtained for the euro area as a whole.
As discussed in the article, fi nancing conditions are multifaceted and are therefore characterised
by a large set of indicators. With a view to assessing the impact of fi nancing conditions on
economic activity, it may be useful to synthesise these indicators in a single measure of the
overall fi nancing environment. This will often result in an extreme simplifi cation, as changes in
FCIs can result from various factors, such as supply conditions in parts of the fi nancial system,
risk aversion or market sentiment.
1 See, for instance, the indices of the IMF, the OECD (regularly used in the “Economic Outlook”) and Goldman Sachs (systematically
used in the “Global FX Monthly Analyst”).
81ECB
Monthly Bulletin
August 2012
ARTICLES
Assessing the financing
conditions for the
euro area private
sector during the
sovereign debt crisis
Research on fi nancing conditions was preceded by extensive analysis of the impact of monetary
conditions on the economy. The original idea behind the development of monetary conditions
indices (MCIs) was that interest rates set by central banks may give an incomplete picture of the
impulses imparted by monetary policy to economic activity. A number of authors later extended
the idea of MCIs to other asset prices relevant for the analysis of economic activity (such as
long-term interest rates, equity prices and house prices, among others) as well as to variables
that provide signals regarding the various dimensions of the fi nancing situation in the economy
considered. The resulting measures were called FCIs. Extensive work has been done to analyse
fi nancing conditions in the United States and, to a lesser extent, in the euro area.
Hence, FCIs are intended to provide a broader measure of fi nancing conditions than is provided
by MCIs, which usually focus on the short-term interest rate and the exchange rate. In the same
way as MCIs, FCIs are computed as a weighted sum of deviations of certain variables from their
long-run trends:
FCIt = Σ ai (xi,t− xi)⎯i =1
p
(1)
where xi is a set of variables characterising the fi nancial system, such as the short-term interest
rate, the ten-year government bond yield, the real effective exchange rate, stock prices and credit
conditions.2 For each variable, the deviation from the average is incorporated in the FCI with
a weight ai . By construction, the sum of the weights is equal to one. Also by construction, the
FCI has no meaning in absolute terms, as the index is normalised at some period. FCIs differ in
several respects. The three most important differences across FCIs lie in the methodology used
to compute the weights attached to the variables, the control for endogeneity of the fi nancial
variables, and whether or not the policy interest rate is included among the fi nancial indicators.
The weights can be computed using various models and estimation techniques. For instance,
they can be estimated such that a given change in the index is indicative of an impact on overall
GDP over a certain horizon. In this case, the weights are generated from simulations using
large-scale macroeconomic models or econometric models (such as vector autoregression models
or reduced-form demand equations). Because the analysis requires an econometric estimation of
the impact of fi nancial conditions on macroeconomic outcomes, the number of variables has to
be kept low under this approach.3
A pitfall of such an approach is that, while it does not account for the shock driving the change,
the source of the shock has a bearing. For instance, a decline in stock prices can refl ect either
weaker demand prospects or an unexpected tightening of monetary policy – neither of which
should affect the FCI – or higher risk aversion or more diffi cult access to external fi nancing –
both of which should be refl ected in a tightening in the FCI. Recent research proposes more
complex FCIs, using econometric techniques which allow a more structural decomposition
of each variable included in the index so as to interpret the original source of a change while
retaining the ability to consider a large number of signals.
2 See Guichard, S., Haugh, D. and Turner, D. (2009), “Quantifying the Effect of Financial Conditions in the Euro Area, Japan, United
Kingdom and United States”, OECD Economics Department Working Papers, No 677; or Matheson, T. (2011), “Financial Conditions
Indexes for the United States and Euro Area”, IMF Working Paper No 11/93.
3 For an illustration based on the US economy, see, for instance, Swiston, A. (2008), “A U.S. Financial Conditions Index: Putting Credit
Where Credit is Due”, IMF Working Paper No 164.
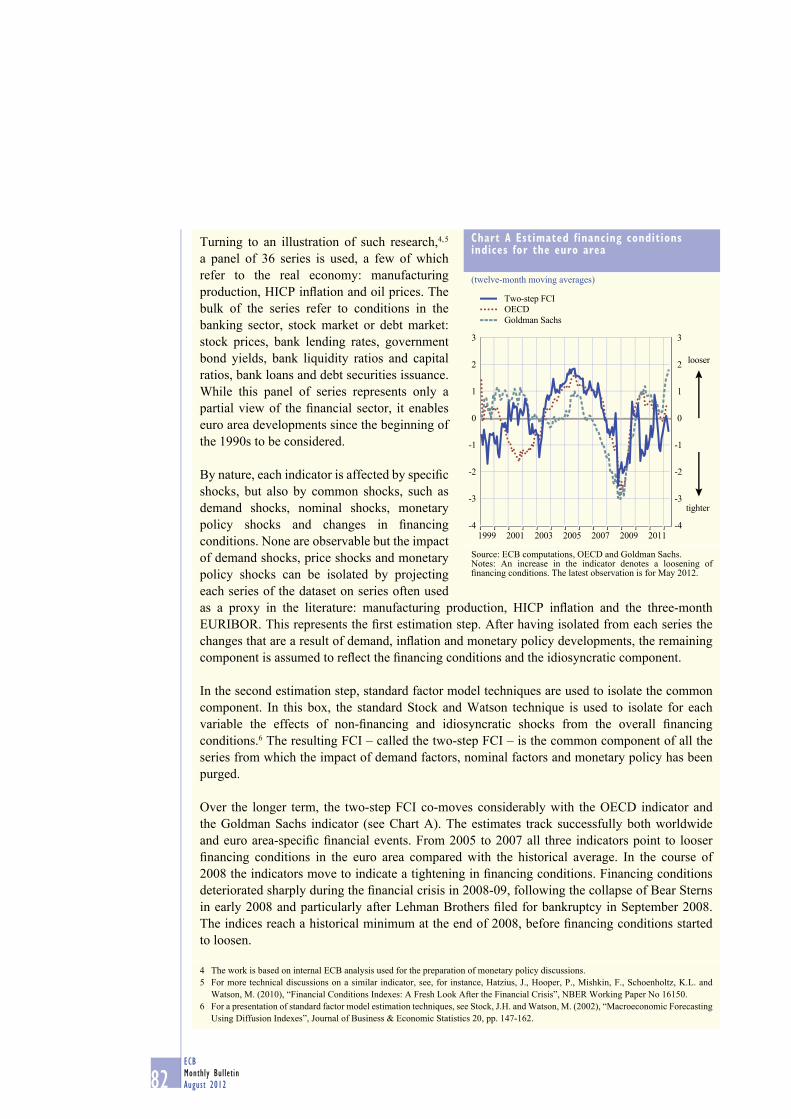
82ECB
Monthly Bulletin
August 2012
Turning to an illustration of such research,4, 5
a panel of 36 series is used, a few of which
refer to the real economy: manufacturing
production, HICP infl ation and oil prices. The
bulk of the series refer to conditions in the
banking sector, stock market or debt market:
stock prices, bank lending rates, government
bond yields, bank liquidity ratios and capital
ratios, bank loans and debt securities issuance.
While this panel of series represents only a
partial view of the fi nancial sector, it enables
euro area developments since the beginning of
the 1990s to be considered.
By nature, each indicator is affected by specifi c
shocks, but also by common shocks, such as
demand shocks, nominal shocks, monetary
policy shocks and changes in fi nancing
conditions. None are observable but the impact
of demand shocks, price shocks and monetary
policy shocks can be isolated by projecting
each series of the dataset on series often used
as a proxy in the literature: manufacturing production, HICP infl ation and the three-month
EURIBOR. This represents the fi rst estimation step. After having isolated from each series the
changes that are a result of demand, infl ation and monetary policy developments, the remaining
component is assumed to refl ect the fi nancing conditions and the idiosyncratic component.
In the second estimation step, standard factor model techniques are used to isolate the common
component. In this box, the standard Stock and Watson technique is used to isolate for each
variable the effects of non-fi nancing and idiosyncratic shocks from the overall fi nancing
conditions.6 The resulting FCI – called the two-step FCI – is the common component of all the
series from which the impact of demand factors, nominal factors and monetary policy has been
purged.
Over the longer term, the two-step FCI co-moves considerably with the OECD indicator and
the Goldman Sachs indicator (see Chart A). The estimates track successfully both worldwide
and euro area-specifi c fi nancial events. From 2005 to 2007 all three indicators point to looser
fi nancing conditions in the euro area compared with the historical average. In the course of
2008 the indicators move to indicate a tightening in fi nancing conditions. Financing conditions
deteriorated sharply during the fi nancial crisis in 2008-09, following the collapse of Bear Sterns
in early 2008 and particularly after Lehman Brothers fi led for bankruptcy in September 2008.
The indices reach a historical minimum at the end of 2008, before fi nancing conditions started
to loosen.
4 The work is based on internal ECB analysis used for the preparation of monetary policy discussions.
5 For more technical discussions on a similar indicator, see, for instance, Hatzius, J., Hooper, P., Mishkin, F., Schoenholtz, K.L. and
Watson, M. (2010), “Financial Conditions Indexes: A Fresh Look After the Financial Crisis”, NBER Working Paper No 16150.
6 For a presentation of standard factor model estimation techniques, see Stock, J.H. and Watson, M. (2002), “Macroeconomic Forecasting
Using Diffusion Indexes”, Journal of Business & Economic Statistics 20, pp. 147-162.
Chart A Estimated financing conditions indices for the euro area
(twelve-month moving averages)
-4
-3
-2
-1
0
1
2
3
-4
-3
-2
-1
0
1
2
3
1999 2001 2003 2005 2007 2009 2011
looser
tighter
Goldman Sachs
OECD
Two-step FCI
Source: ECB computations, OECD and Goldman Sachs.Notes: An increase in the indicator denotes a loosening of fi nancing conditions. The latest observation is for May 2012.
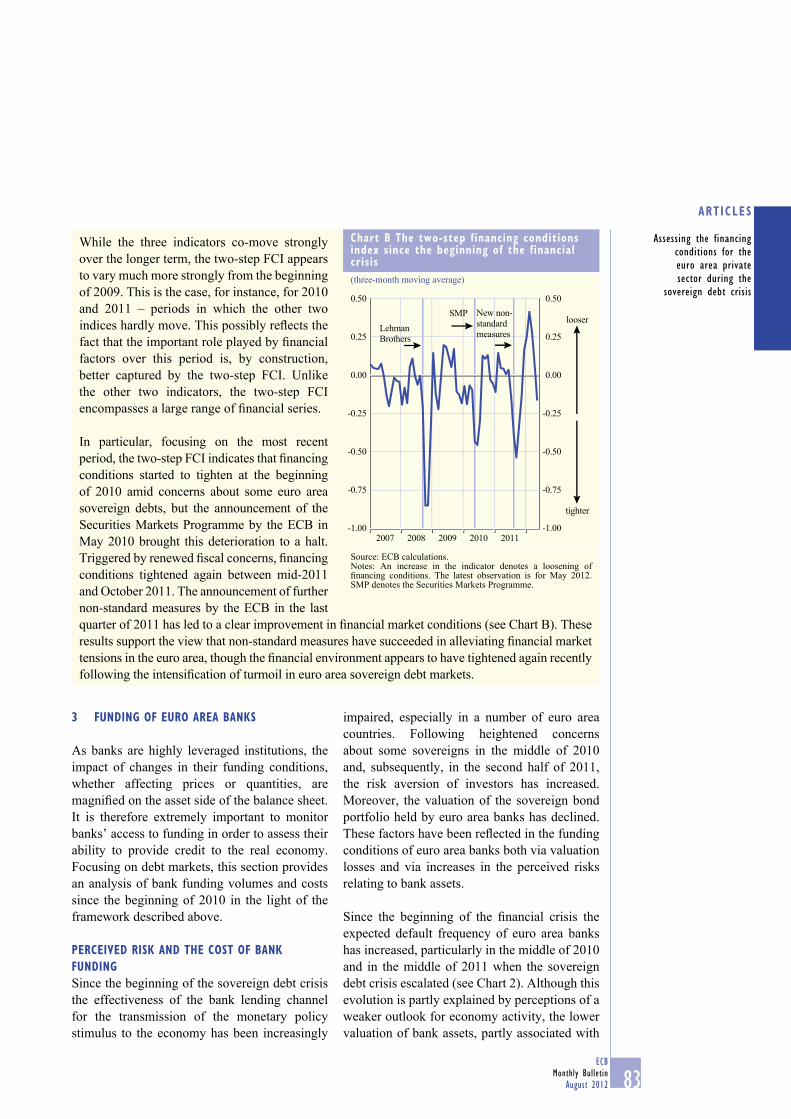
83ECB
Monthly Bulletin
August 2012
ARTICLES
Assessing the financing
conditions for the
euro area private
sector during the
sovereign debt crisis
3 FUNDING OF EURO AREA BANKS
As banks are highly leveraged institutions, the
impact of changes in their funding conditions,
whether affecting prices or quantities, are
magnifi ed on the asset side of the balance sheet.
It is therefore extremely important to monitor
banks’ access to funding in order to assess their
ability to provide credit to the real economy.
Focusing on debt markets, this section provides
an analysis of bank funding volumes and costs
since the beginning of 2010 in the light of the
framework described above.
PERCEIVED RISK AND THE COST OF BANK
FUNDING
Since the beginning of the sovereign debt crisis
the effectiveness of the bank lending channel
for the transmission of the monetary policy
stimulus to the economy has been increasingly
impaired, especially in a number of euro area
countries. Following heightened concerns
about some sovereigns in the middle of 2010
and, subsequently, in the second half of 2011,
the risk aversion of investors has increased.
Moreover, the valuation of the sovereign bond
portfolio held by euro area banks has declined.
These factors have been refl ected in the funding
conditions of euro area banks both via valuation
losses and via increases in the perceived risks
relating to bank assets.
Since the beginning of the fi nancial crisis the
expected default frequency of euro area banks
has increased, particularly in the middle of 2010
and in the middle of 2011 when the sovereign
debt crisis escalated (see Chart 2). Although this
evolution is partly explained by perceptions of a
weaker outlook for economy activity, the lower
valuation of bank assets, partly associated with
While the three indicators co-move strongly
over the longer term, the two-step FCI appears
to vary much more strongly from the beginning
of 2009. This is the case, for instance, for 2010
and 2011 – periods in which the other two
indices hardly move. This possibly refl ects the
fact that the important role played by fi nancial
factors over this period is, by construction,
better captured by the two-step FCI. Unlike
the other two indicators, the two-step FCI
encompasses a large range of fi nancial series.
In particular, focusing on the most recent
period, the two-step FCI indicates that fi nancing
conditions started to tighten at the beginning
of 2010 amid concerns about some euro area
sovereign debts, but the announcement of the
Securities Markets Programme by the ECB in
May 2010 brought this deterioration to a halt.
Triggered by renewed fi scal concerns, fi nancing
conditions tightened again between mid-2011
and October 2011. The announcement of further
non-standard measures by the ECB in the last
quarter of 2011 has led to a clear improvement in fi nancial market conditions (see Chart B). These
results support the view that non-standard measures have succeeded in alleviating fi nancial market
tensions in the euro area, though the fi nancial environment appears to have tightened again recently
following the intensifi cation of turmoil in euro area sovereign debt markets.
Chart B The two-step financing conditions index since the beginning of the financial crisis
(three-month moving average)
-1.00
-0.50
-0.25
0.00
0.25
0.50
-1.00
-0.75 -0.75
-0.50
-0.25
0.00
0.25
0.50
Lehman
Brothers
SMP New non-
standard
measures
looser
tighter
2007 2008 2009 2010 2011
Source: ECB calculations. Notes: An increase in the indicator denotes a loosening of fi nancing conditions. The latest observation is for May 2012. SMP denotes the Securities Markets Programme.
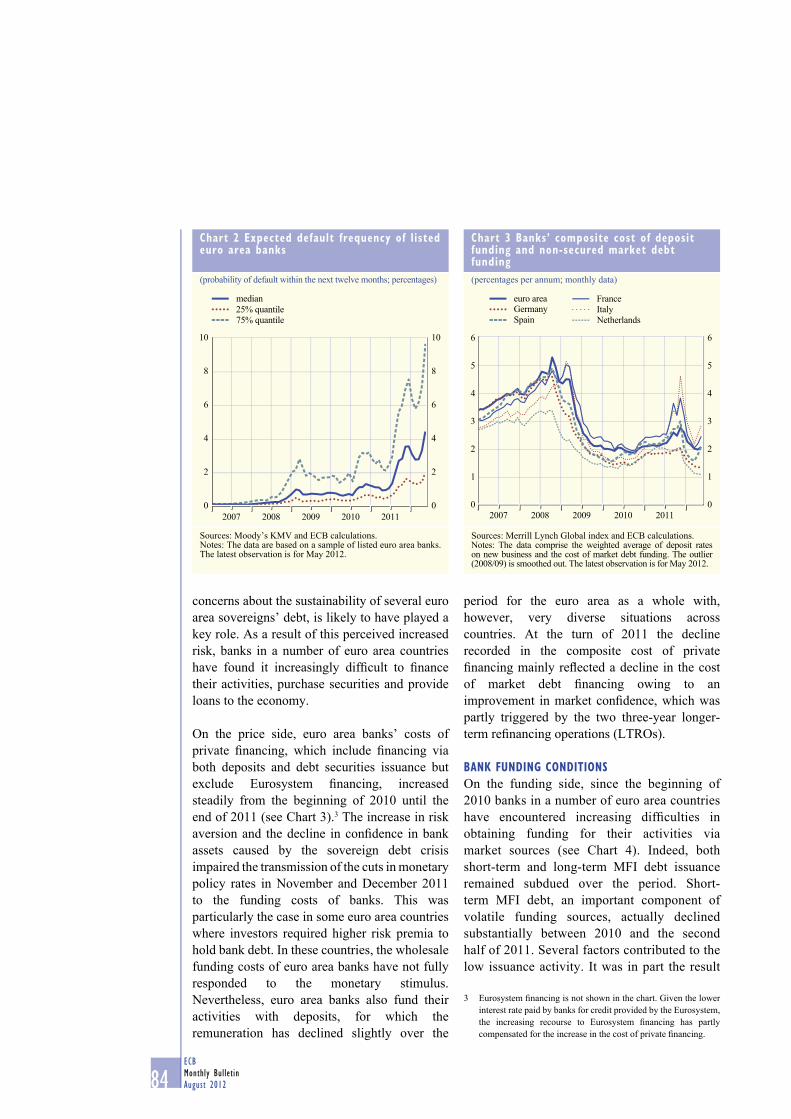
84ECB
Monthly Bulletin
August 2012
concerns about the sustainability of several euro
area sovereigns’ debt, is likely to have played a
key role. As a result of this perceived increased
risk, banks in a number of euro area countries
have found it increasingly diffi cult to fi nance
their activities, purchase securities and provide
loans to the economy.
On the price side, euro area banks’ costs of
private fi nancing, which include fi nancing via
both deposits and debt securities issuance but
exclude Eurosystem fi nancing, increased
steadily from the beginning of 2010 until the
end of 2011 (see Chart 3).3 The increase in risk
aversion and the decline in confi dence in bank
assets caused by the sovereign debt crisis
impaired the transmission of the cuts in monetary
policy rates in November and December 2011
to the funding costs of banks. This was
particularly the case in some euro area countries
where investors required higher risk premia to
hold bank debt. In these countries, the wholesale
funding costs of euro area banks have not fully
responded to the monetary stimulus.
Nevertheless, euro area banks also fund their
activities with deposits, for which the
remuneration has declined slightly over the
period for the euro area as a whole with,
however, very diverse situations across
countries. At the turn of 2011 the decline
recorded in the composite cost of private
fi nancing mainly refl ected a decline in the cost
of market debt fi nancing owing to an
improvement in market confi dence, which was
partly triggered by the two three-year longer-
term refi nancing operations (LTROs).
BANK FUNDING CONDITIONS
On the funding side, since the beginning of
2010 banks in a number of euro area countries
have encountered increasing diffi culties in
obtaining funding for their activities via
market sources (see Chart 4). Indeed, both
short-term and long-term MFI debt issuance
remained subdued over the period. Short-
term MFI debt, an important component of
volatile funding sources, actually declined
substantially between 2010 and the second
half of 2011. Several factors contributed to the
low issuance activity. It was in part the result
Eurosystem fi nancing is not shown in the chart. Given the lower 3
interest rate paid by banks for credit provided by the Eurosystem,
the increasing recourse to Eurosystem fi nancing has partly
compensated for the increase in the cost of private fi nancing.
Chart 2 Expected default frequency of listed euro area banks
(probability of default within the next twelve months; percentages)
0
2
4
6
10
8
0
2
4
6
10
8
2007 2008 2009 2010 2011
median
75% quantile
25% quantile
Sources: Moody’s KMV and ECB calculations. Notes: The data are based on a sample of listed euro area banks. The latest observation is for May 2012.
Chart 3 Banks’ composite cost of deposit funding and non-secured market debt funding
(percentages per annum; monthly data)
0
1
2
3
4
5
6
0
1
2
3
4
5
6
2007 2008 2009 2010 2011
Spain
euro areaGermany Italy
Netherlands
France
Sources: Merrill Lynch Global index and ECB calculations. Notes: The data comprise the weighted average of deposit rates on new business and the cost of market debt funding. The outlier (2008/09) is smoothed out. The latest observation is for May 2012.
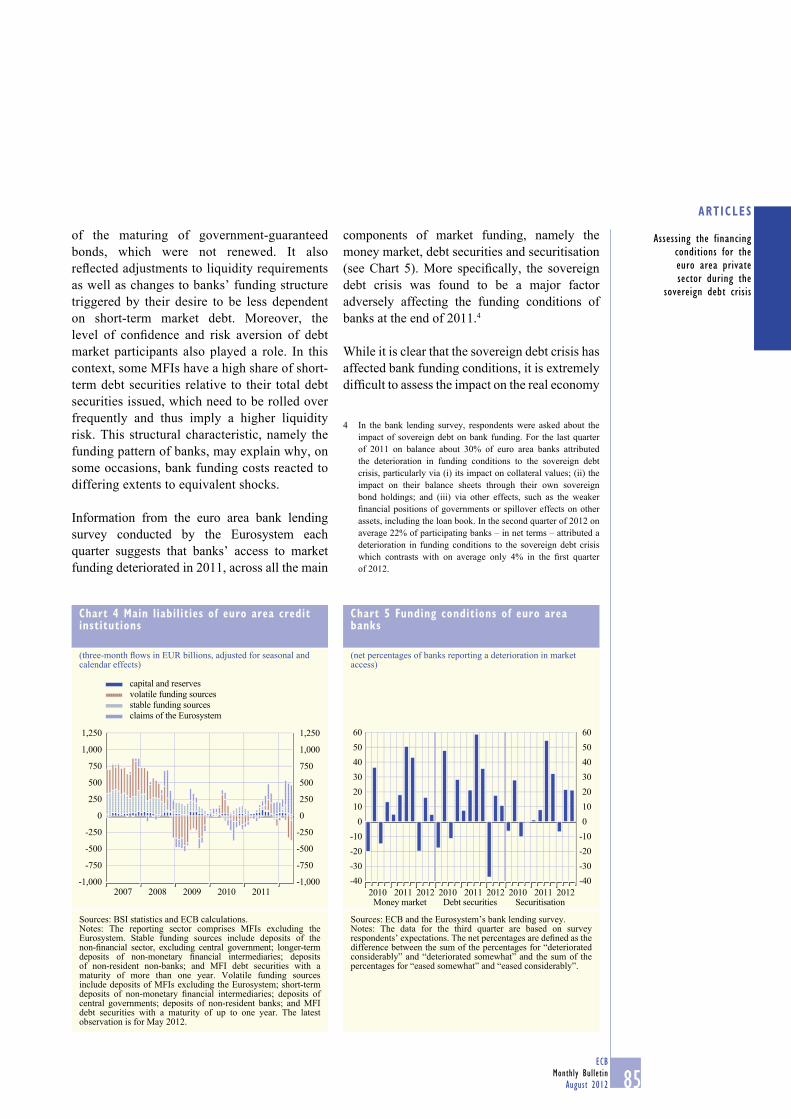
85ECB
Monthly Bulletin
August 2012
ARTICLES
Assessing the financing
conditions for the
euro area private
sector during the
sovereign debt crisis
of the maturing of government-guaranteed
bonds, which were not renewed. It also
refl ected adjustments to liquidity requirements
as well as changes to banks’ funding structure
triggered by their desire to be less dependent
on short-term market debt. Moreover, the
level of confi dence and risk aversion of debt
market participants also played a role. In this
context, some MFIs have a high share of short-
term debt securities relative to their total debt
securities issued, which need to be rolled over
frequently and thus imply a higher liquidity
risk. This structural characteristic, namely the
funding pattern of banks, may explain why, on
some occasions, bank funding costs reacted to
differing extents to equivalent shocks.
Information from the euro area bank lending
survey conducted by the Eurosystem each
quarter suggests that banks’ access to market
funding deteriorated in 2011, across all the main
components of market funding, namely the
money market, debt securities and securitisation
(see Chart 5). More specifi cally, the sovereign
debt crisis was found to be a major factor
adversely affecting the funding conditions of
banks at the end of 2011.4
While it is clear that the sovereign debt crisis has
affected bank funding conditions, it is extremely
diffi cult to assess the impact on the real economy
In the bank lending survey, respondents were asked about the 4
impact of sovereign debt on bank funding. For the last quarter
of 2011 on balance about 30% of euro area banks attributed
the deterioration in funding conditions to the sovereign debt
crisis, particularly via (i) its impact on collateral values; (ii) the
impact on their balance sheets through their own sovereign
bond holdings; and (iii) via other effects, such as the weaker
fi nancial positions of governments or spillover effects on other
assets, including the loan book. In the second quarter of 2012 on
average 22% of participating banks – in net terms – attributed a
deterioration in funding conditions to the sovereign debt crisis
which contrasts with on average only 4% in the fi rst quarter
of 2012.
Chart 4 Main liabilities of euro area credit institutions
(three-month fl ows in EUR billions, adjusted for seasonal and calendar effects)
-1,000
-750
-500
-250
0
250
500
750
1,000
1,250
-1,000
-750
-500
-250
0
250
500
750
1,000
1,250
2007 2008 2009 2010 2011
capital and reserves
stable funding sources
volatile funding sources
claims of the Eurosystem
Sources: BSI statistics and ECB calculations. Notes: The reporting sector comprises MFIs excluding the Eurosystem. Stable funding sources include deposits of the non-fi nancial sector, excluding central government; longer-term deposits of non-monetary fi nancial intermediaries; deposits of non-resident non-banks; and MFI debt securities with a maturity of more than one year. Volatile funding sources include deposits of MFIs excluding the Eurosystem; short-term deposits of non-monetary fi nancial intermediaries; deposits of central governments; deposits of non-resident banks; and MFI debt securities with a maturity of up to one year. The latest observation is for May 2012.
Chart 5 Funding conditions of euro area banks
(net percentages of banks reporting a deterioration in market access)
-40
-30
-20
-10
0
10
20
30
40
50
60
-40
-30
-20
-10
0
10
20
30
40
50
60
Money market Debt securities Securitisation2010 2011 2012 2012 20122010 2011 2010 2011
Sources: ECB and the Eurosystem’s bank lending survey.Notes: The data for the third quarter are based on survey respondents’ expectations. The net percentages are defi ned as the difference between the sum of the percentages for “deteriorated considerably” and “deteriorated somewhat” and the sum of the percentages for “eased somewhat” and “eased considerably”.
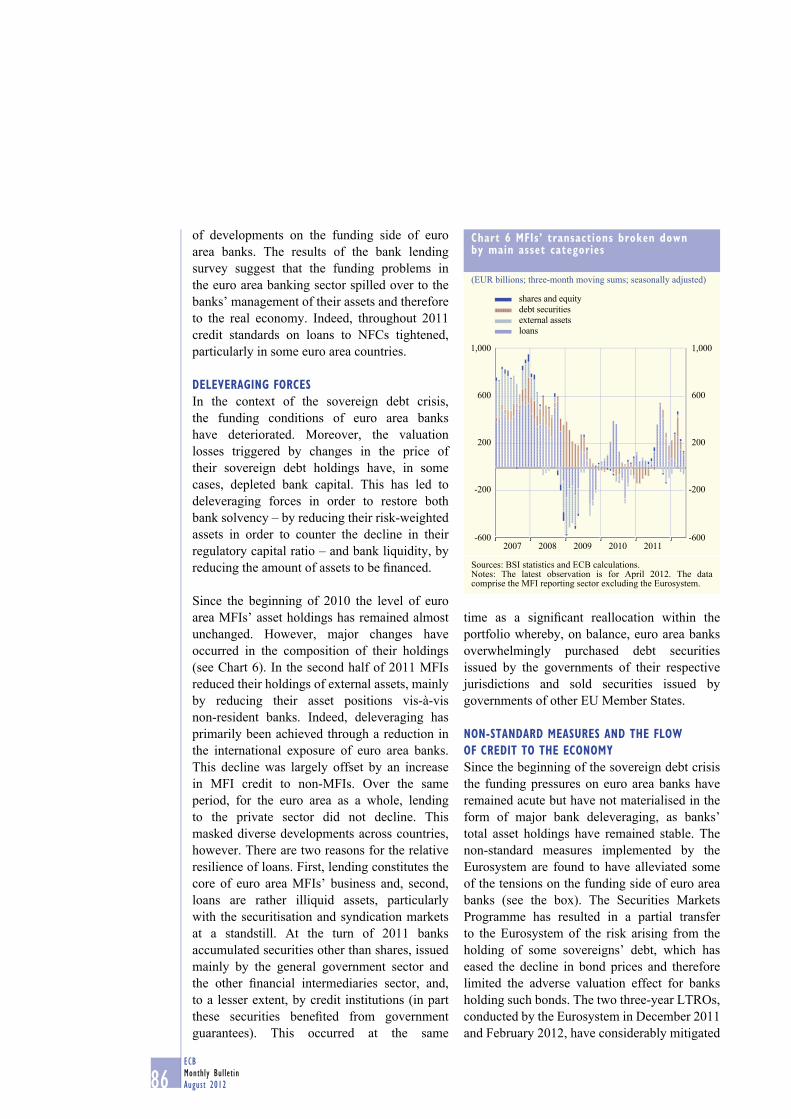
86ECB
Monthly Bulletin
August 2012
of developments on the funding side of euro
area banks. The results of the bank lending
survey suggest that the funding problems in
the euro area banking sector spilled over to the
banks’ management of their assets and therefore
to the real economy. Indeed, throughout 2011
credit standards on loans to NFCs tightened,
particularly in some euro area countries.
DELEVERAGING FORCES
In the context of the sovereign debt crisis,
the funding conditions of euro area banks
have deteriorated. Moreover, the valuation
losses triggered by changes in the price of
their sovereign debt holdings have, in some
cases, depleted bank capital. This has led to
deleveraging forces in order to restore both
bank solvency – by reducing their risk-weighted
assets in order to counter the decline in their
regulatory capital ratio – and bank liquidity, by
reducing the amount of assets to be fi nanced.
Since the beginning of 2010 the level of euro
area MFIs’ asset holdings has remained almost
unchanged. However, major changes have
occurred in the composition of their holdings
(see Chart 6). In the second half of 2011 MFIs
reduced their holdings of external assets, mainly
by reducing their asset positions vis-à-vis
non-resident banks. Indeed, deleveraging has
primarily been achieved through a reduction in
the international exposure of euro area banks.
This decline was largely offset by an increase
in MFI credit to non-MFIs. Over the same
period, for the euro area as a whole, lending
to the private sector did not decline. This
masked diverse developments across countries,
however. There are two reasons for the relative
resilience of loans. First, lending constitutes the
core of euro area MFIs’ business and, second,
loans are rather illiquid assets, particularly
with the securitisation and syndication markets
at a standstill. At the turn of 2011 banks
accumulated securities other than shares, issued
mainly by the general government sector and
the other fi nancial intermediaries sector, and,
to a lesser extent, by credit institutions (in part
these securities benefi ted from government
guarantees). This occurred at the same
time as a signifi cant reallocation within the
portfolio whereby, on balance, euro area banks
overwhelmingly purchased debt securities
issued by the governments of their respective
jurisdictions and sold securities issued by
governments of other EU Member States.
NON-STANDARD MEASURES AND THE FLOW
OF CREDIT TO THE ECONOMY
Since the beginning of the sovereign debt crisis
the funding pressures on euro area banks have
remained acute but have not materialised in the
form of major bank deleveraging, as banks’
total asset holdings have remained stable. The
non-standard measures implemented by the
Eurosystem are found to have alleviated some
of the tensions on the funding side of euro area
banks (see the box). The Securities Markets
Programme has resulted in a partial transfer
to the Eurosystem of the risk arising from the
holding of some sovereigns’ debt, which has
eased the decline in bond prices and therefore
limited the adverse valuation effect for banks
holding such bonds. The two three-year LTROs,
conducted by the Eurosystem in December 2011
and February 2012, have considerably mitigated
Chart 6 MFIs’ transactions broken down by main asset categories
(EUR billions; three-month moving sums; seasonally adjusted)
-600
-200
200
600
1,000
-600
-200
200
600
1,000
shares and equity
external assets
debt securities
loans
2007 2008 2009 2010 2011
Sources: BSI statistics and ECB calculations. Notes: The latest observation is for April 2012. The data comprise the MFI reporting sector excluding the Eurosystem.
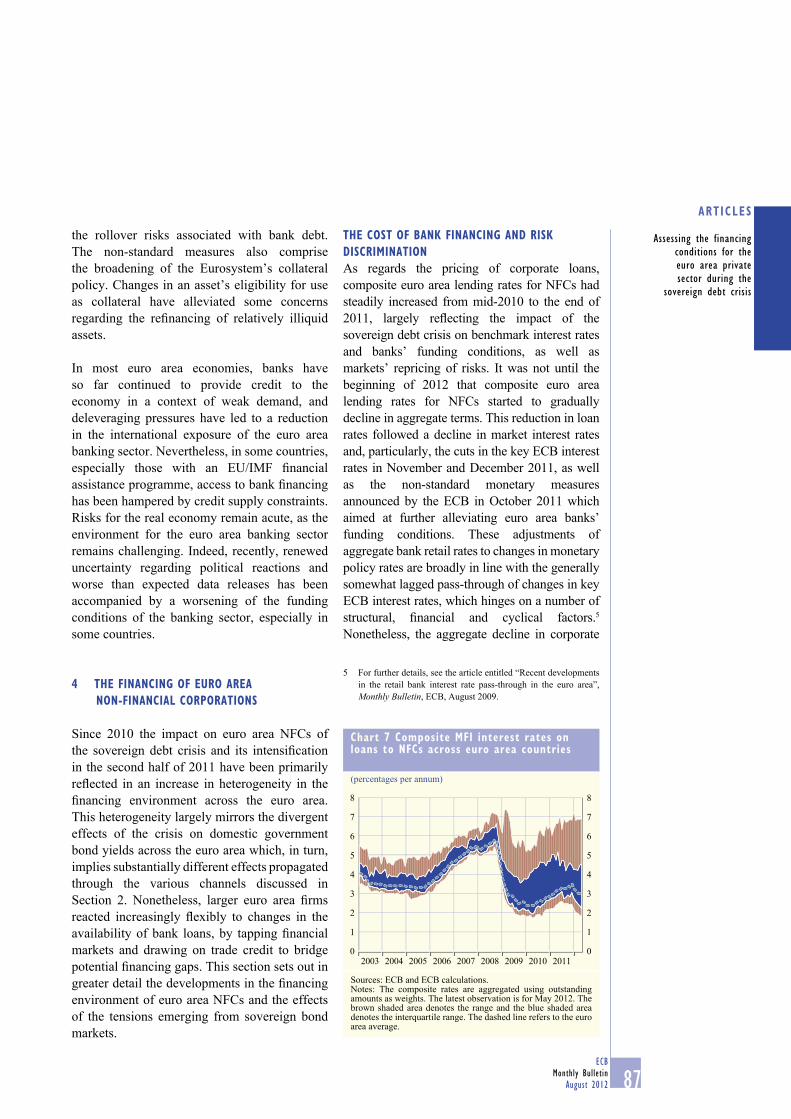
87ECB
Monthly Bulletin
August 2012
ARTICLES
Assessing the financing
conditions for the
euro area private
sector during the
sovereign debt crisis
the rollover risks associated with bank debt.
The non-standard measures also comprise
the broadening of the Eurosystem’s collateral
policy. Changes in an asset’s eligibility for use
as collateral have alleviated some concerns
regarding the refi nancing of relatively illiquid
assets.
In most euro area economies, banks have
so far continued to provide credit to the
economy in a context of weak demand, and
deleveraging pressures have led to a reduction
in the international exposure of the euro area
banking sector. Nevertheless, in some countries,
especially those with an EU/IMF fi nancial
assistance programme, access to bank fi nancing
has been hampered by credit supply constraints.
Risks for the real economy remain acute, as the
environment for the euro area banking sector
remains challenging. Indeed, recently, renewed
uncertainty regarding political reactions and
worse than expected data releases has been
accompanied by a worsening of the funding
conditions of the banking sector, especially in
some countries.
4 THE FINANCING OF EURO AREA
NON-FINANCIAL CORPORATIONS
Since 2010 the impact on euro area NFCs of
the sovereign debt crisis and its intensifi cation
in the second half of 2011 have been primarily
refl ected in an increase in heterogeneity in the
fi nancing environment across the euro area.
This heterogeneity largely mirrors the divergent
effects of the crisis on domestic government
bond yields across the euro area which, in turn,
implies substantially different effects propagated
through the various channels discussed in
Section 2. Nonetheless, larger euro area fi rms
reacted increasingly fl exibly to changes in the
availability of bank loans, by tapping fi nancial
markets and drawing on trade credit to bridge
potential fi nancing gaps. This section sets out in
greater detail the developments in the fi nancing
environment of euro area NFCs and the effects
of the tensions emerging from sovereign bond
markets.
THE COST OF BANK FINANCING AND RISK
DISCRIMINATION
As regards the pricing of corporate loans,
composite euro area lending rates for NFCs had
steadily increased from mid-2010 to the end of
2011, largely refl ecting the impact of the
sovereign debt crisis on benchmark interest rates
and banks’ funding conditions, as well as
markets’ repricing of risks. It was not until the
beginning of 2012 that composite euro area
lending rates for NFCs started to gradually
decline in aggregate terms. This reduction in loan
rates followed a decline in market interest rates
and, particularly, the cuts in the key ECB interest
rates in November and December 2011, as well
as the non-standard monetary measures
announced by the ECB in October 2011 which
aimed at further alleviating euro area banks’
funding conditions. These adjustments of
aggregate bank retail rates to changes in monetary
policy rates are broadly in line with the generally
somewhat lagged pass-through of changes in key
ECB interest rates, which hinges on a number of
structural, fi nancial and cyclical factors.5
Nonetheless, the aggregate decline in corporate
For further details, see the article entitled “Recent developments 5
in the retail bank interest rate pass-through in the euro area”,
Monthly Bulletin, ECB, August 2009.
Chart 7 Composite MFI interest rates on loans to NFCs across euro area countries
(percentages per annum)
00
1
2
3
4
5
6
7
8
1
2
3
4
5
6
7
8
20042003 2005 2006 2007 2008 2009 2010 2011
Sources: ECB and ECB calculations.Notes: The composite rates are aggregated using outstanding amounts as weights. The latest observation is for May 2012. The brown shaded area denotes the range and the blue shaded area denotes the interquartile range. The dashed line refers to the euro area average.
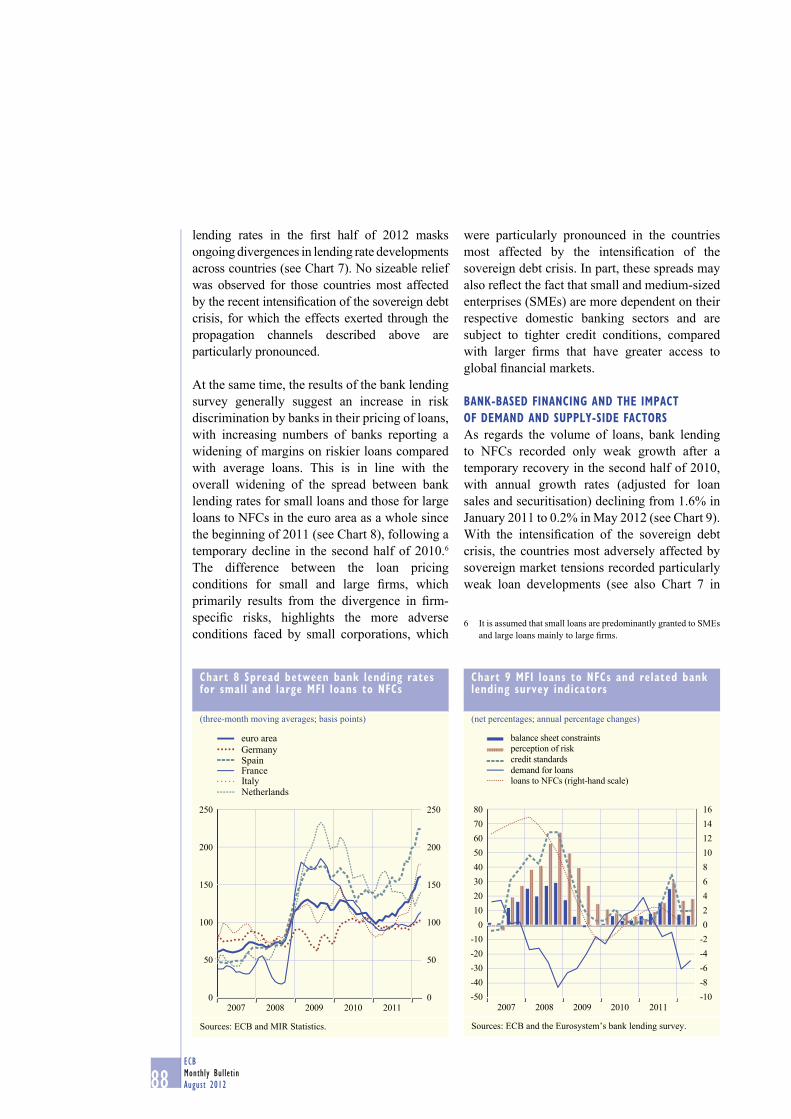
88ECB
Monthly Bulletin
August 2012
lending rates in the fi rst half of 2012 masks
ongoing divergences in lending rate developments
across countries (see Chart 7). No sizeable relief
was observed for those countries most affected
by the recent intensifi cation of the sovereign debt
crisis, for which the effects exerted through the
propagation channels described above are
particularly pronounced.
At the same time, the results of the bank lending
survey generally suggest an increase in risk
discrimination by banks in their pricing of loans,
with increasing numbers of banks reporting a
widening of margins on riskier loans compared
with average loans. This is in line with the
overall widening of the spread between bank
lending rates for small loans and those for large
loans to NFCs in the euro area as a whole since
the beginning of 2011 (see Chart 8), following a
temporary decline in the second half of 2010.6
The difference between the loan pricing
conditions for small and large fi rms, which
primarily results from the divergence in fi rm-
specifi c risks, highlights the more adverse
conditions faced by small corporations, which
were particularly pronounced in the countries
most affected by the intensifi cation of the
sovereign debt crisis. In part, these spreads may
also refl ect the fact that small and medium-sized
enterprises (SMEs) are more dependent on their
respective domestic banking sectors and are
subject to tighter credit conditions, compared
with larger fi rms that have greater access to
global fi nancial markets.
BANK-BASED FINANCING AND THE IMPACT
OF DEMAND AND SUPPLY-SIDE FACTORS
As regards the volume of loans, bank lending
to NFCs recorded only weak growth after a
temporary recovery in the second half of 2010,
with annual growth rates (adjusted for loan
sales and securitisation) declining from 1.6% in
January 2011 to 0.2% in May 2012 (see Chart 9).
With the intensifi cation of the sovereign debt
crisis, the countries most adversely affected by
sovereign market tensions recorded particularly
weak loan developments (see also Chart 7 in
It is assumed that small loans are predominantly granted to SMEs 6
and large loans mainly to large fi rms.
Chart 8 Spread between bank lending rates for small and large MFI loans to NFCs
(three-month moving averages; basis points)
0
50
100
150
200
250
0
50
100
150
200
250
2007 2008 2009 2010 2011
euro areaGermanySpainFranceItalyNetherlands
Sources: ECB and MIR Statistics.
Chart 9 MFI loans to NFCs and related bank lending survey indicators
(net percentages; annual percentage changes)
2007 2008 2009 2010 2011-10
-8
-6
-4
-2
0
2
4
6
8
10
12
14
16
-50
-40
-30
-20
-10
0
10
20
30
40
50
60
70
80
perception of risk
credit standards
demand for loans
loans to NFCs (right-hand scale)
balance sheet constraints
Sources: ECB and the Eurosystem’s bank lending survey.
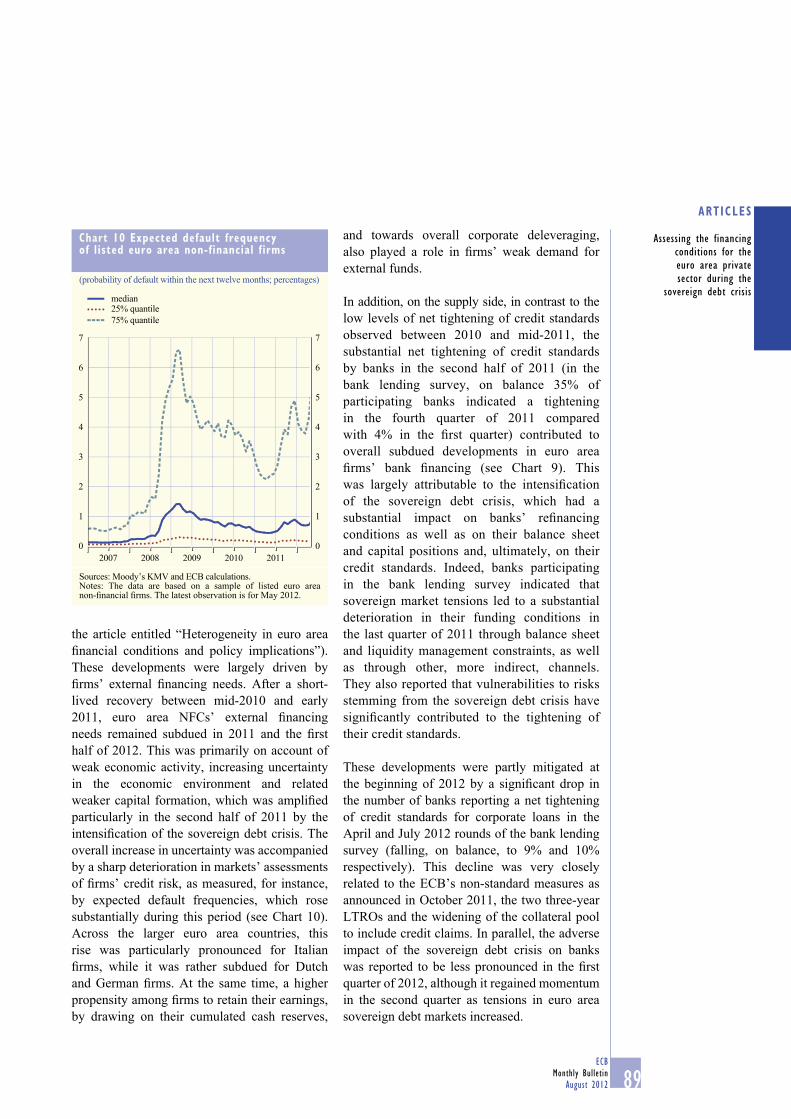
89ECB
Monthly Bulletin
August 2012
ARTICLES
Assessing the financing
conditions for the
euro area private
sector during the
sovereign debt crisis
the article entitled “Heterogeneity in euro area
fi nancial conditions and policy implications”).
These developments were largely driven by
fi rms’ external fi nancing needs. After a short-
lived recovery between mid-2010 and early
2011, euro area NFCs’ external fi nancing
needs remained subdued in 2011 and the fi rst
half of 2012. This was primarily on account of
weak economic activity, increasing uncertainty
in the economic environment and related
weaker capital formation, which was amplifi ed
particularly in the second half of 2011 by the
intensifi cation of the sovereign debt crisis. The
overall increase in uncertainty was accompanied
by a sharp deterioration in markets’ assessments
of fi rms’ credit risk, as measured, for instance,
by expected default frequencies, which rose
substantially during this period (see Chart 10).
Across the larger euro area countries, this
rise was particularly pronounced for Italian
fi rms, while it was rather subdued for Dutch
and German fi rms. At the same time, a higher
propensity among fi rms to retain their earnings,
by drawing on their cumulated cash reserves,
and towards overall corporate deleveraging,
also played a role in fi rms’ weak demand for
external funds.
In addition, on the supply side, in contrast to the
low levels of net tightening of credit standards
observed between 2010 and mid-2011, the
substantial net tightening of credit standards
by banks in the second half of 2011 (in the
bank lending survey, on balance 35% of
participating banks indicated a tightening
in the fourth quarter of 2011 compared
with 4% in the fi rst quarter) contributed to
overall subdued developments in euro area
fi rms’ bank fi nancing (see Chart 9). This
was largely attributable to the intensifi cation
of the sovereign debt crisis, which had a
substantial impact on banks’ refi nancing
conditions as well as on their balance sheet
and capital positions and, ultimately, on their
credit standards. Indeed, banks participating
in the bank lending survey indicated that
sovereign market tensions led to a substantial
deterioration in their funding conditions in
the last quarter of 2011 through balance sheet
and liquidity management constraints, as well
as through other, more indirect, channels.
They also reported that vulnerabilities to risks
stemming from the sovereign debt crisis have
signifi cantly contributed to the tightening of
their credit standards.
These developments were partly mitigated at
the beginning of 2012 by a signifi cant drop in
the number of banks reporting a net tightening
of credit standards for corporate loans in the
April and July 2012 rounds of the bank lending
survey (falling, on balance, to 9% and 10%
respectively). This decline was very closely
related to the ECB’s non-standard measures as
announced in October 2011, the two three-year
LTROs and the widening of the collateral pool
to include credit claims. In parallel, the adverse
impact of the sovereign debt crisis on banks
was reported to be less pronounced in the fi rst
quarter of 2012, although it regained momentum
in the second quarter as tensions in euro area
sovereign debt markets increased.
Chart 10 Expected default frequency of listed euro area non-financial firms
(probability of default within the next twelve months; percentages)
0
1
2
3
4
5
6
7
0
1
2
3
4
5
6
7
25% quantilemedian
75% quantile
2007 2008 2009 2010 2011
Sources: Moody’s KMV and ECB calculations.Notes: The data are based on a sample of listed euro area non-fi nancial fi rms. The latest observation is for May 2012.
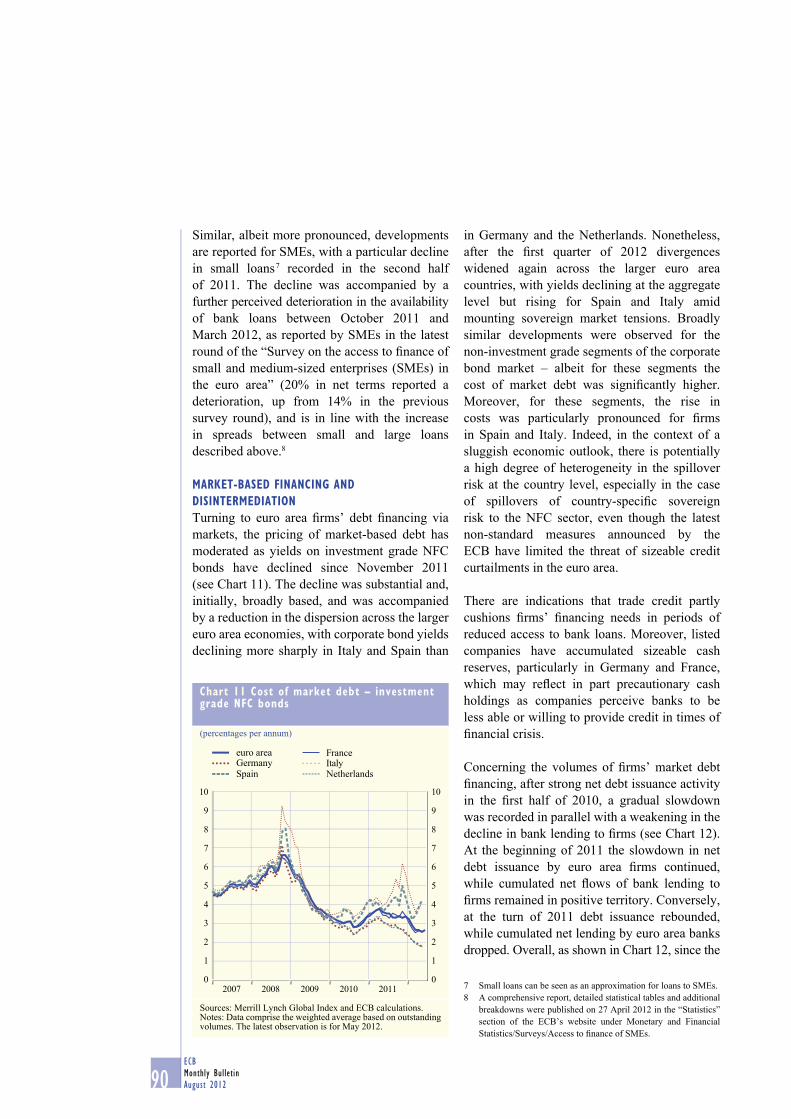
90ECB
Monthly Bulletin
August 2012
Similar, albeit more pronounced, developments
are reported for SMEs, with a particular decline
in small loans 7 recorded in the second half
of 2011. The decline was accompanied by a
further perceived deterioration in the availability
of bank loans between October 2011 and
March 2012, as reported by SMEs in the latest
round of the “Survey on the access to fi nance of
small and medium-sized enterprises (SMEs) in
the euro area” (20% in net terms reported a
deterioration, up from 14% in the previous
survey round), and is in line with the increase
in spreads between small and large loans
described above.8
MARKET-BASED FINANCING AND
DISINTERMEDIATION
Turning to euro area fi rms’ debt fi nancing via
markets, the pricing of market-based debt has
moderated as yields on investment grade NFC
bonds have declined since November 2011
(see Chart 11). The decline was substantial and,
initially, broadly based, and was accompanied
by a reduction in the dispersion across the larger
euro area economies, with corporate bond yields
declining more sharply in Italy and Spain than
in Germany and the Netherlands. Nonetheless,
after the fi rst quarter of 2012 divergences
widened again across the larger euro area
countries, with yields declining at the aggregate
level but rising for Spain and Italy amid
mounting sovereign market tensions. Broadly
similar developments were observed for the
non-investment grade segments of the corporate
bond market – albeit for these segments the
cost of market debt was signifi cantly higher.
Moreover, for these segments, the rise in
costs was particularly pronounced for fi rms
in Spain and Italy. Indeed, in the context of a
sluggish economic outlook, there is potentially
a high degree of heterogeneity in the spillover
risk at the country level, especially in the case
of spillovers of country-specifi c sovereign
risk to the NFC sector, even though the latest
non-standard measures announced by the
ECB have limited the threat of sizeable credit
curtailments in the euro area.
There are indications that trade credit partly
cushions fi rms’ fi nancing needs in periods of
reduced access to bank loans. Moreover, listed
companies have accumulated sizeable cash
reserves, particularly in Germany and France,
which may refl ect in part precautionary cash
holdings as companies perceive banks to be
less able or willing to provide credit in times of
fi nancial crisis.
Concerning the volumes of fi rms’ market debt
fi nancing, after strong net debt issuance activity
in the fi rst half of 2010, a gradual slowdown
was recorded in parallel with a weakening in the
decline in bank lending to fi rms (see Chart 12).
At the beginning of 2011 the slowdown in net
debt issuance by euro area fi rms continued,
while cumulated net fl ows of bank lending to
fi rms remained in positive territory. Conversely,
at the turn of 2011 debt issuance rebounded,
while cumulated net lending by euro area banks
dropped. Overall, as shown in Chart 12, since the
Small loans can be seen as an approximation for loans to SMEs.7
A comprehensive report, detailed statistical tables and additional 8
breakdowns were published on 27 April 2012 in the “Statistics”
section of the ECB’s website under Monetary and Financial
Statistics/Surveys/Access to fi nance of SMEs.
Chart 11 Cost of market debt – investment grade NFC bonds
(percentages per annum)
0
1
2
3
4
5
6
7
8
9
10
0
1
2
3
4
5
6
7
8
9
10
euro areaGermanySpain
FranceItalyNetherlands
2007 2008 2009 2010 2011
Sources: Merrill Lynch Global Index and ECB calculations.Notes: Data comprise the weighted average based on outstanding volumes. The latest observation is for May 2012.
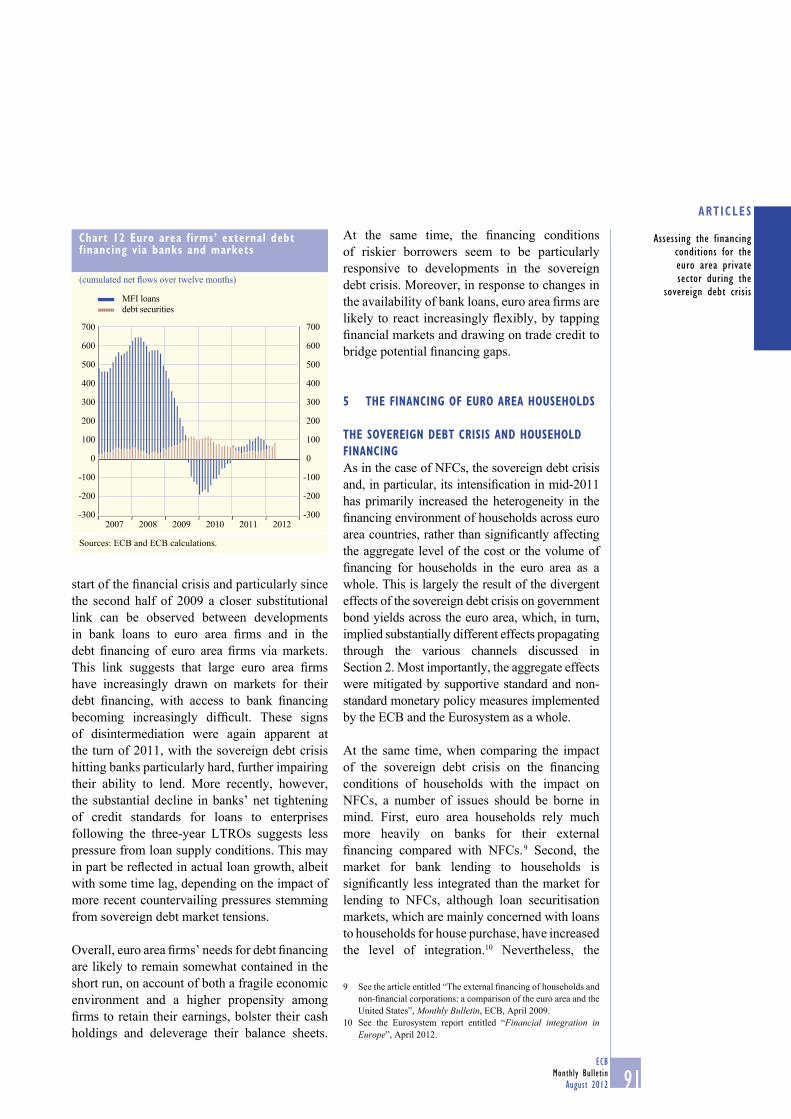
91ECB
Monthly Bulletin
August 2012
ARTICLES
Assessing the financing
conditions for the
euro area private
sector during the
sovereign debt crisis
start of the fi nancial crisis and particularly since
the second half of 2009 a closer substitutional
link can be observed between developments
in bank loans to euro area fi rms and in the
debt fi nancing of euro area fi rms via markets.
This link suggests that large euro area fi rms
have increasingly drawn on markets for their
debt fi nancing, with access to bank fi nancing
becoming increasingly diffi cult. These signs
of disintermediation were again apparent at
the turn of 2011, with the sovereign debt crisis
hitting banks particularly hard, further impairing
their ability to lend. More recently, however,
the substantial decline in banks’ net tightening
of credit standards for loans to enterprises
following the three-year LTROs suggests less
pressure from loan supply conditions. This may
in part be refl ected in actual loan growth, albeit
with some time lag, depending on the impact of
more recent countervailing pressures stemming
from sovereign debt market tensions.
Overall, euro area fi rms’ needs for debt fi nancing
are likely to remain somewhat contained in the
short run, on account of both a fragile economic
environment and a higher propensity among
fi rms to retain their earnings, bolster their cash
holdings and deleverage their balance sheets.
At the same time, the fi nancing conditions
of riskier borrowers seem to be particularly
responsive to developments in the sovereign
debt crisis. Moreover, in response to changes in
the availability of bank loans, euro area fi rms are
likely to react increasingly fl exibly, by tapping
fi nancial markets and drawing on trade credit to
bridge potential fi nancing gaps.
5 THE FINANCING OF EURO AREA HOUSEHOLDS
THE SOVEREIGN DEBT CRISIS AND HOUSEHOLD
FINANCING
As in the case of NFCs, the sovereign debt crisis
and, in particular, its intensifi cation in mid-2011
has primarily increased the heterogeneity in the
fi nancing environment of households across euro
area countries, rather than signifi cantly affecting
the aggregate level of the cost or the volume of
fi nancing for households in the euro area as a
whole. This is largely the result of the divergent
effects of the sovereign debt crisis on government
bond yields across the euro area, which, in turn,
implied substantially different effects propagating
through the various channels discussed in
Section 2. Most importantly, the aggregate effects
were mitigated by supportive standard and non-
standard monetary policy measures implemented
by the ECB and the Eurosystem as a whole.
At the same time, when comparing the impact
of the sovereign debt crisis on the fi nancing
conditions of households with the impact on
NFCs, a number of issues should be borne in
mind. First, euro area households rely much
more heavily on banks for their external
fi nancing compared with NFCs. 9 Second, the
market for bank lending to households is
signifi cantly less integrated than the market for
lending to NFCs, although loan securitisation
markets, which are mainly concerned with loans
to households for house purchase, have increased
the level of integration.10 Nevertheless, the
See the article entitled “The external fi nancing of households and 9
non-fi nancial corporations: a comparison of the euro area and the
United States”, Monthly Bulletin, ECB, April 2009.
See the Eurosystem report entitled “10 Financial integration in Europe”, April 2012.
Chart 12 Euro area firms’ external debt financing via banks and markets
(cumulated net fl ows over twelve months)
-300
-200
-100
0
100
200
300
400
500
600
700
-300
-200
-100
0
100
200
300
400
500
600
700
MFI loans
debt securities
2007 2008 2009 2010 2011 2012
Sources: ECB and ECB calculations.
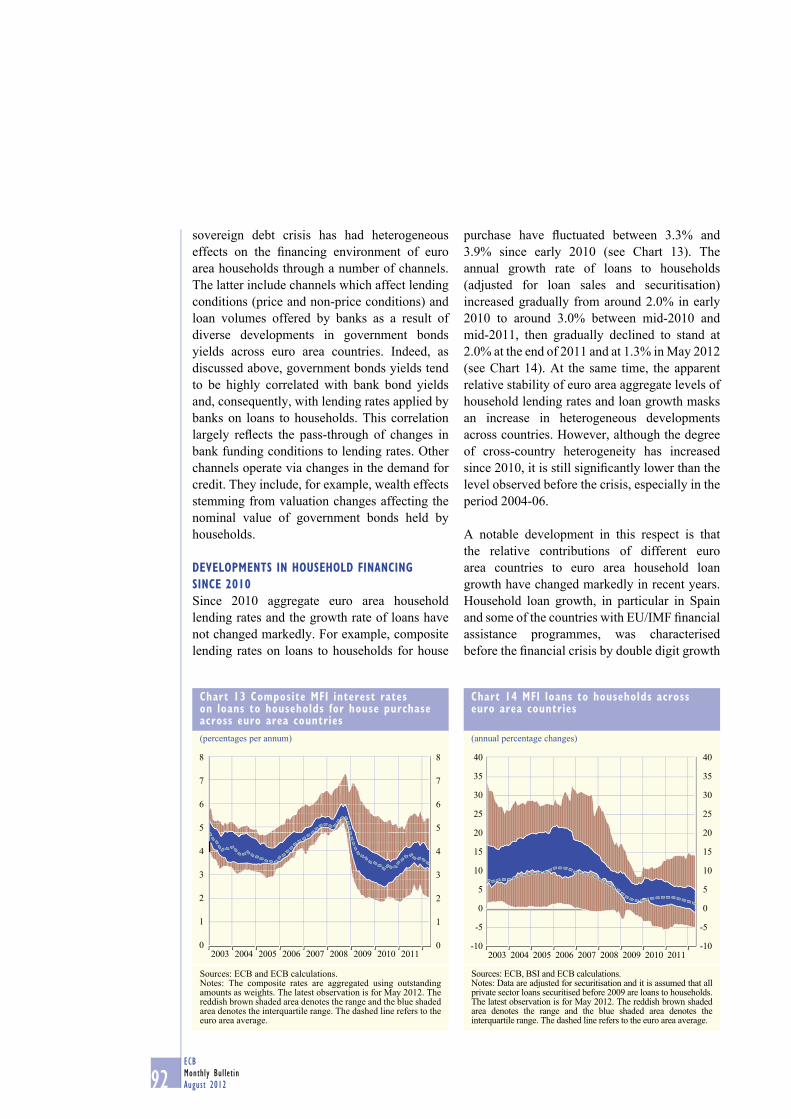
92ECB
Monthly Bulletin
August 2012
sovereign debt crisis has had heterogeneous
effects on the fi nancing environment of euro
area households through a number of channels.
The latter include channels which affect lending
conditions (price and non-price conditions) and
loan volumes offered by banks as a result of
diverse developments in government bonds
yields across euro area countries. Indeed, as
discussed above, government bonds yields tend
to be highly correlated with bank bond yields
and, consequently, with lending rates applied by
banks on loans to households. This correlation
largely refl ects the pass-through of changes in
bank funding conditions to lending rates. Other
channels operate via changes in the demand for
credit. They include, for example, wealth effects
stemming from valuation changes affecting the
nominal value of government bonds held by
households.
DEVELOPMENTS IN HOUSEHOLD FINANCING
SINCE 2010
Since 2010 aggregate euro area household
lending rates and the growth rate of loans have
not changed markedly. For example, composite
lending rates on loans to households for house
purchase have fl uctuated between 3.3% and
3.9% since early 2010 (see Chart 13). The
annual growth rate of loans to households
(adjusted for loan sales and securitisation)
increased gradually from around 2.0% in early
2010 to around 3.0% between mid-2010 and
mid-2011, then gradually declined to stand at
2.0% at the end of 2011 and at 1.3% in May 2012
(see Chart 14). At the same time, the apparent
relative stability of euro area aggregate levels of
household lending rates and loan growth masks
an increase in heterogeneous developments
across countries. However, although the degree
of cross-country heterogeneity has increased
since 2010, it is still signifi cantly lower than the
level observed before the crisis, especially in the
period 2004-06.
A notable development in this respect is that
the relative contributions of different euro
area countries to euro area household loan
growth have changed markedly in recent years.
Household loan growth, in particular in Spain
and some of the countries with EU/IMF fi nancial
assistance programmes, was characterised
before the fi nancial crisis by double digit growth
Chart 13 Composite MFI interest rates on loans to households for house purchase across euro area countries
(percentages per annum)
0
1
2
3
4
5
6
7
8
0
1
2
3
4
5
6
7
8
2003 2004 2005 2006 2007 2008 2009 2010 2011
Sources: ECB and ECB calculations.Notes: The composite rates are aggregated using outstanding amounts as weights. The latest observation is for May 2012. The reddish brown shaded area denotes the range and the blue shaded area denotes the interquartile range. The dashed line refers to the euro area average.
Chart 14 MFI loans to households across euro area countries
(annual percentage changes)
-10
-5
0
5
10
15
20
25
30
35
40
-10
-5
0
5
10
15
20
25
30
35
40
2003 2004 2005 2006 2007 2008 2009 2010 2011
Sources: ECB, BSI and ECB calculations.Notes: Data are adjusted for securitisation and it is assumed that all private sector loans securitised before 2009 are loans to households. The latest observation is for May 2012. The reddish brown shaded area denotes the range and the blue shaded area denotes the interquartile range. The dashed line refers to the euro area average.
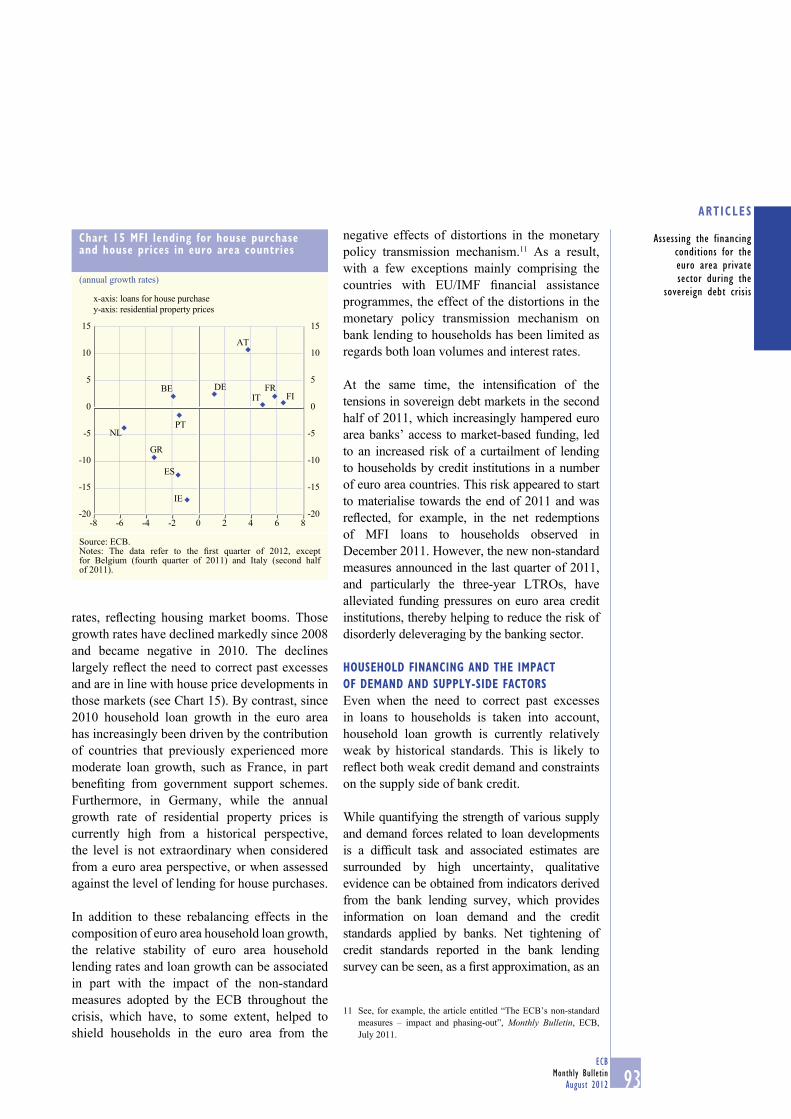
93ECB
Monthly Bulletin
August 2012
ARTICLES
Assessing the financing
conditions for the
euro area private
sector during the
sovereign debt crisis
rates, refl ecting housing market booms. Those
growth rates have declined markedly since 2008
and became negative in 2010. The declines
largely refl ect the need to correct past excesses
and are in line with house price developments in
those markets (see Chart 15). By contrast, since
2010 household loan growth in the euro area
has increasingly been driven by the contribution
of countries that previously experienced more
moderate loan growth, such as France, in part
benefi ting from government support schemes.
Furthermore, in Germany, while the annual
growth rate of residential property prices is
currently high from a historical perspective,
the level is not extraordinary when considered
from a euro area perspective, or when assessed
against the level of lending for house purchases.
In addition to these rebalancing effects in the
composition of euro area household loan growth,
the relative stability of euro area household
lending rates and loan growth can be associated
in part with the impact of the non-standard
measures adopted by the ECB throughout the
crisis, which have, to some extent, helped to
shield households in the euro area from the
negative effects of distortions in the monetary
policy transmission mechanism.11 As a result,
with a few exceptions mainly comprising the
countries with EU/IMF fi nancial assistance
programmes, the effect of the distortions in the
monetary policy transmission mechanism on
bank lending to households has been limited as
regards both loan volumes and interest rates.
At the same time, the intensifi cation of the
tensions in sovereign debt markets in the second
half of 2011, which increasingly hampered euro
area banks’ access to market-based funding, led
to an increased risk of a curtailment of lending
to households by credit institutions in a number
of euro area countries. This risk appeared to start
to materialise towards the end of 2011 and was
refl ected, for example, in the net redemptions
of MFI loans to households observed in
December 2011. However, the new non-standard
measures announced in the last quarter of 2011,
and particularly the three-year LTROs, have
alleviated funding pressures on euro area credit
institutions, thereby helping to reduce the risk of
disorderly deleveraging by the banking sector.
HOUSEHOLD FINANCING AND THE IMPACT
OF DEMAND AND SUPPLY-SIDE FACTORS
Even when the need to correct past excesses
in loans to households is taken into account,
household loan growth is currently relatively
weak by historical standards. This is likely to
refl ect both weak credit demand and constraints
on the supply side of bank credit.
While quantifying the strength of various supply
and demand forces related to loan developments
is a diffi cult task and associated estimates are
surrounded by high uncertainty, qualitative
evidence can be obtained from indicators derived
from the bank lending survey, which provides
information on loan demand and the credit
standards applied by banks. Net tightening of
credit standards reported in the bank lending
survey can be seen, as a fi rst approximation, as an
See, for example, the article entitled “The ECB’s non-standard 11
measures – impact and phasing-out”, Monthly Bulletin, ECB,
July 2011.
Chart 15 MFI lending for house purchase and house prices in euro area countries
(annual growth rates)
-20
-15
-10
-5
0
5
10
15
-20
-15
-10
-5
0
5
10
15
FRIT
NL
AT
FIDE
PT
BE
GR
ES
IE
x-axis: loans for house purchase
y-axis: residential property prices
-8 -6 -4 -2 0 2 4 6 8
Source: ECB.Notes: The data refer to the fi rst quarter of 2012, except for Belgium (fourth quarter of 2011) and Italy (second half of 2011).
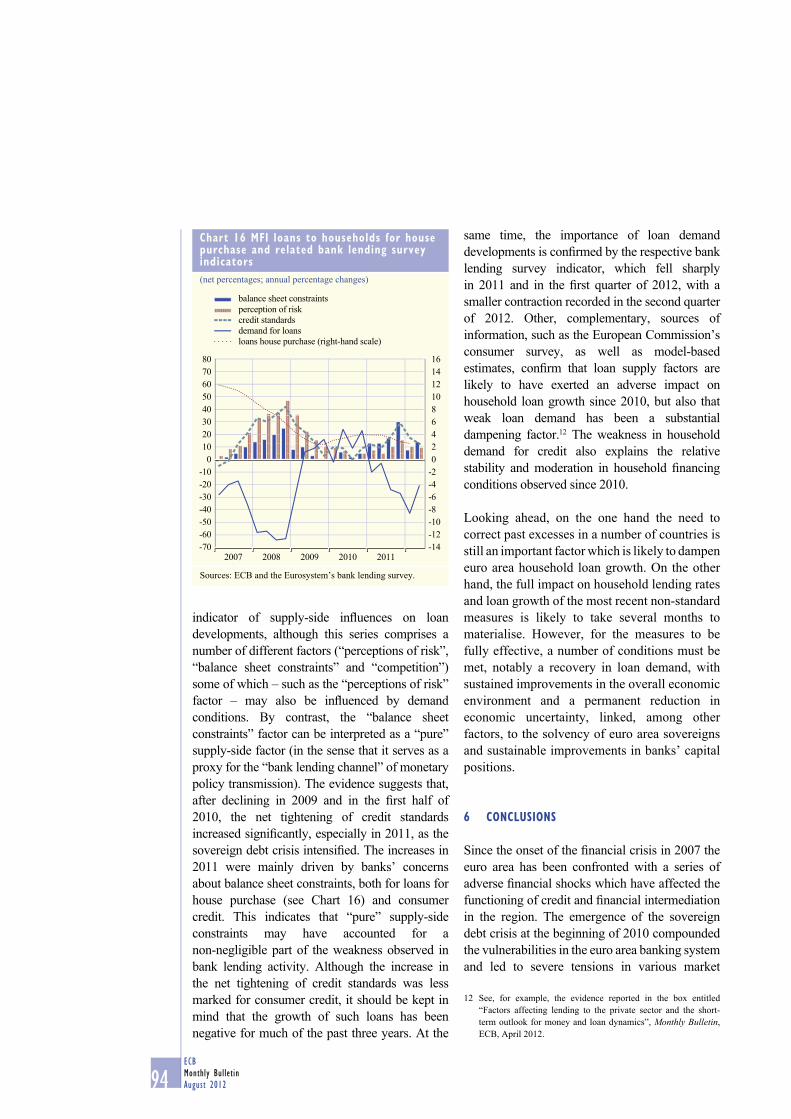
94ECB
Monthly Bulletin
August 2012
indicator of supply-side infl uences on loan
developments, although this series comprises a
number of different factors (“perceptions of risk”,
“balance sheet constraints” and “competition”)
some of which – such as the “perceptions of risk”
factor – may also be infl uenced by demand
conditions. By contrast, the “balance sheet
constraints” factor can be interpreted as a “pure”
supply-side factor (in the sense that it serves as a
proxy for the “bank lending channel” of monetary
policy transmission). The evidence suggests that,
after declining in 2009 and in the fi rst half of
2010, the net tightening of credit standards
increased signifi cantly, especially in 2011, as the
sovereign debt crisis intensifi ed. The increases in
2011 were mainly driven by banks’ concerns
about balance sheet constraints, both for loans for
house purchase (see Chart 16) and consumer
credit. This indicates that “pure” supply-side
constraints may have accounted for a
non-negligible part of the weakness observed in
bank lending activity. Although the increase in
the net tightening of credit standards was less
marked for consumer credit, it should be kept in
mind that the growth of such loans has been
negative for much of the past three years. At the
same time, the importance of loan demand
developments is confi rmed by the respective bank
lending survey indicator, which fell sharply
in 2011 and in the fi rst quarter of 2012, with a
smaller contraction recorded in the second quarter
of 2012. Other, complementary, sources of
information, such as the European Commission’s
consumer survey, as well as model-based
estimates, confi rm that loan supply factors are
likely to have exerted an adverse impact on
household loan growth since 2010, but also that
weak loan demand has been a substantial
dampening factor.12 The weakness in household
demand for credit also explains the relative
stability and moderation in household fi nancing
conditions observed since 2010.
Looking ahead, on the one hand the need to
correct past excesses in a number of countries is
still an important factor which is likely to dampen
euro area household loan growth. On the other
hand, the full impact on household lending rates
and loan growth of the most recent non-standard
measures is likely to take several months to
materialise. However, for the measures to be
fully effective, a number of conditions must be
met, notably a recovery in loan demand, with
sustained improvements in the overall economic
environment and a permanent reduction in
economic uncertainty, linked, among other
factors, to the solvency of euro area sovereigns
and sustainable improvements in banks’ capital
positions.
6 CONCLUSIONS
Since the onset of the fi nancial crisis in 2007 the
euro area has been confronted with a series of
adverse fi nancial shocks which have affected the
functioning of credit and fi nancial intermediation
in the region. The emergence of the sovereign
debt crisis at the beginning of 2010 compounded
the vulnerabilities in the euro area banking system
and led to severe tensions in various market
See, for example, the evidence reported in the box entitled 12
“Factors affecting lending to the private sector and the short-
term outlook for money and loan dynamics”, Monthly Bulletin,
ECB, April 2012.
Chart 16 MFI loans to households for house purchase and related bank lending survey indicators
(net percentages; annual percentage changes)
-14
-12
-10
-8
-6
-4
-2
0
2
4
6
8
10
12
14
16
-70
-60
-50
-40
-30
-20
-10
0
10
20
30
40
50
60
70
80
2007 2008 2009 2010 2011
perception of risk
credit standards
demand for loans
loans house purchase (right-hand scale)
balance sheet constraints
Sources: ECB and the Eurosystem’s bank lending survey.
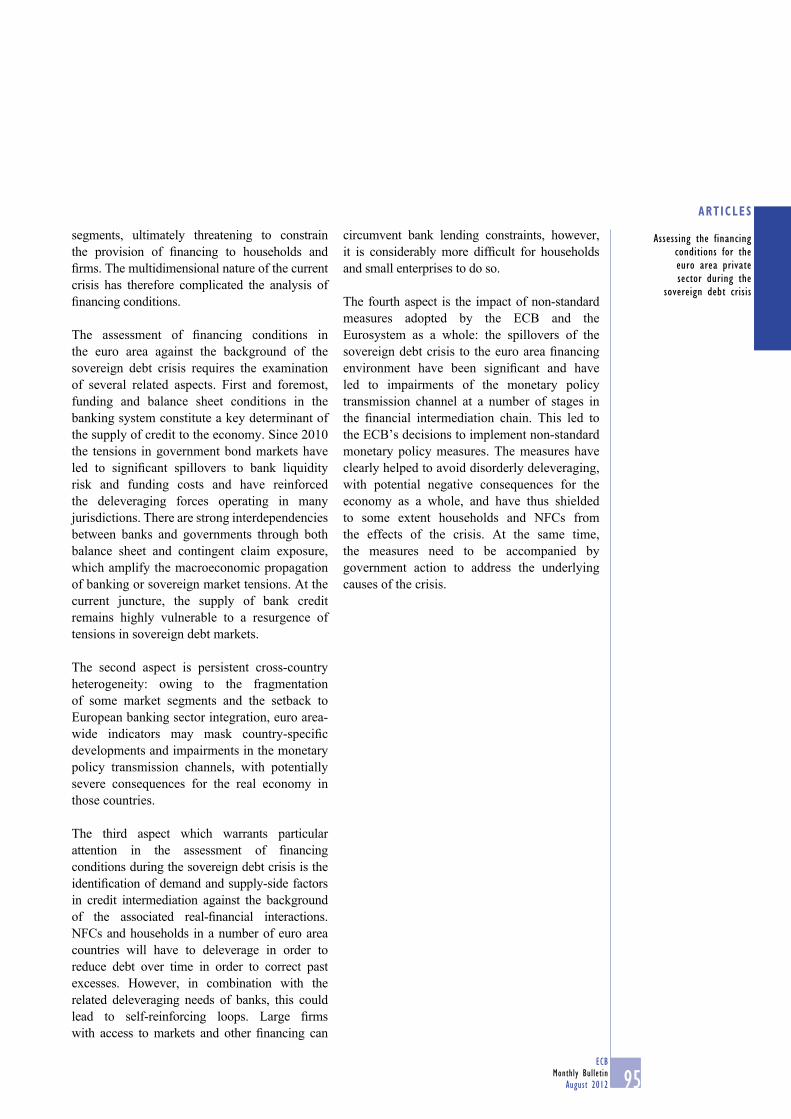
95ECB
Monthly Bulletin
August 2012
ARTICLES
Assessing the financing
conditions for the
euro area private
sector during the
sovereign debt crisis
segments, ultimately threatening to constrain
the provision of fi nancing to households and
fi rms. The multidimensional nature of the current
crisis has therefore complicated the analysis of
fi nancing conditions.
The assessment of fi nancing conditions in
the euro area against the background of the
sovereign debt crisis requires the examination
of several related aspects. First and foremost,
funding and balance sheet conditions in the
banking system constitute a key determinant of
the supply of credit to the economy. Since 2010
the tensions in government bond markets have
led to signifi cant spillovers to bank liquidity
risk and funding costs and have reinforced
the deleveraging forces operating in many
jurisdictions. There are strong interdependencies
between banks and governments through both
balance sheet and contingent claim exposure,
which amplify the macroeconomic propagation
of banking or sovereign market tensions. At the
current juncture, the supply of bank credit
remains highly vulnerable to a resurgence of
tensions in sovereign debt markets.
The second aspect is persistent cross-country
heterogeneity: owing to the fragmentation
of some market segments and the setback to
European banking sector integration, euro area-
wide indicators may mask country-specifi c
developments and impairments in the monetary
policy transmission channels, with potentially
severe consequences for the real economy in
those countries.
The third aspect which warrants particular
attention in the assessment of fi nancing
conditions during the sovereign debt crisis is the
identifi cation of demand and supply-side factors
in credit intermediation against the background
of the associated real-fi nancial interactions.
NFCs and households in a number of euro area
countries will have to deleverage in order to
reduce debt over time in order to correct past
excesses. However, in combination with the
related deleveraging needs of banks, this could
lead to self-reinforcing loops. Large fi rms
with access to markets and other fi nancing can
circumvent bank lending constraints, however,
it is considerably more diffi cult for households
and small enterprises to do so.
The fourth aspect is the impact of non-standard
measures adopted by the ECB and the
Eurosystem as a whole: the spillovers of the
sovereign debt crisis to the euro area fi nancing
environment have been signifi cant and have
led to impairments of the monetary policy
transmission channel at a number of stages in
the fi nancial intermediation chain. This led to
the ECB’s decisions to implement non-standard
monetary policy measures. The measures have
clearly helped to avoid disorderly deleveraging,
with potential negative consequences for the
economy as a whole, and have thus shielded
to some extent households and NFCs from
the effects of the crisis. At the same time,
the measures need to be accompanied by
government action to address the underlying
causes of the crisis.


S 1ECB
Monthly Bulletin
August 2012
EURO AREA STATISTICS

S 3ECB
Monthly Bulletin
August 2012
CONTENTS1
For further information, please contact us at: [email protected]. See the ECB’s Statistical Data Warehouse in the “Statistics” section of the ECB’s website 1
(http://sdw.ecb.europa.eu) for longer runs and more detailed data.
EURO AREA OVERVIEW
Summary of economic indicators for the euro area S5
1 MONETARY POLICY STATISTICS
1.1 Consolidated fi nancial statement of the Eurosystem S6
1.2 Key ECB interest rates S7
1.3 Eurosystem monetary policy operations allotted through tender procedures S8
1.4 Minimum reserve and liquidity statistics S9
2 MONEY, BANKING AND OTHER FINANCIAL CORPORATIONS
2.1 Aggregated balance sheet of euro area MFIs S10
2.2 Consolidated balance sheet of euro area MFIs S11
2.3 Monetary statistics S12
2.4 MFI loans: breakdown S14
2.5 Deposits held with MFIs: breakdown S17
2.6 MFI holdings of securities: breakdown S20
2.7 Currency breakdown of selected MFI balance sheet items S21
2.8 Aggregated balance sheet of euro area investment funds S22
2.9 Securities held by investment funds broken down by issuer of securities S23
2.10 Aggregated balance sheet of euro area fi nancial vehicle corporations S24
2.11 Aggregated balance sheet of euro area insurance corporations and pension funds S25
3 EURO AREA ACCOUNTS
3.1 Integrated economic and fi nancial accounts by institutional sector S26
3.2 Euro area non-fi nancial accounts S30
3.3 Households S32
3.4 Non-fi nancial corporations S33
3.5 Insurance corporations and pension funds S34
4 FINANCIAL MARKETS
4.1 Securities other than shares by original maturity, residency of the issuer and currency S35
4.2 Securities other than shares issued by euro area residents, by sector of the issuer and instrument type S36
4.3 Growth rates of securities other than shares issued by euro area residents S38
4.4 Quoted shares issued by euro area residents S40
4.5 MFI interest rates on euro-denominated deposits from and loans to euro area residents S42
4.6 Money market interest rates S44
4.7 Euro area yield curves S45
4.8 Stock market indices S46
5 PRICES, OUTPUT, DEMAND AND LABOUR MARKETS
5.1 HICP, other prices and costs S47
5.2 Output and demand S50
5.3 Labour markets S54
6 GOVERNMENT FINANCE
6.1 Revenue, expenditure and defi cit/surplus S56
6.2 Debt S57
6.3 Change in debt S58
S 4ECB
Monthly Bulletin
August 2012
6.4 Quarterly revenue, expenditure and defi cit/surplus S59
6.5 Quarterly debt and change in debt S60
7 EXTERNAL TRANSACTIONS AND POSITIONS
7.1 Summary balance of payments S61
7.2 Current and capital accounts S62
7.3 Financial account S64
7.4 Monetary presentation of the balance of payments S70
7.5 Trade in goods S71
8 EXCHANGE RATES
8.1 Effective exchange rates S73
8.2 Bilateral exchange rates S74
9 DEVELOPMENTS OUTSIDE THE EURO AREA
9.1 Economic and fi nancial developments other EU Member States S75
9.2 Economic and fi nancial developments in the United States and Japan S76
LIST OF CHARTS S77
TECHNICAL NOTES S79
GENERAL NOTES S85
Conventions used in the tables
“-” data do not exist/data are not applicable
“.” data are not yet available
“…” nil or negligible
“billion” 109
(p) provisional
s.a. seasonally adjusted
n.s.a. non-seasonally adjusted
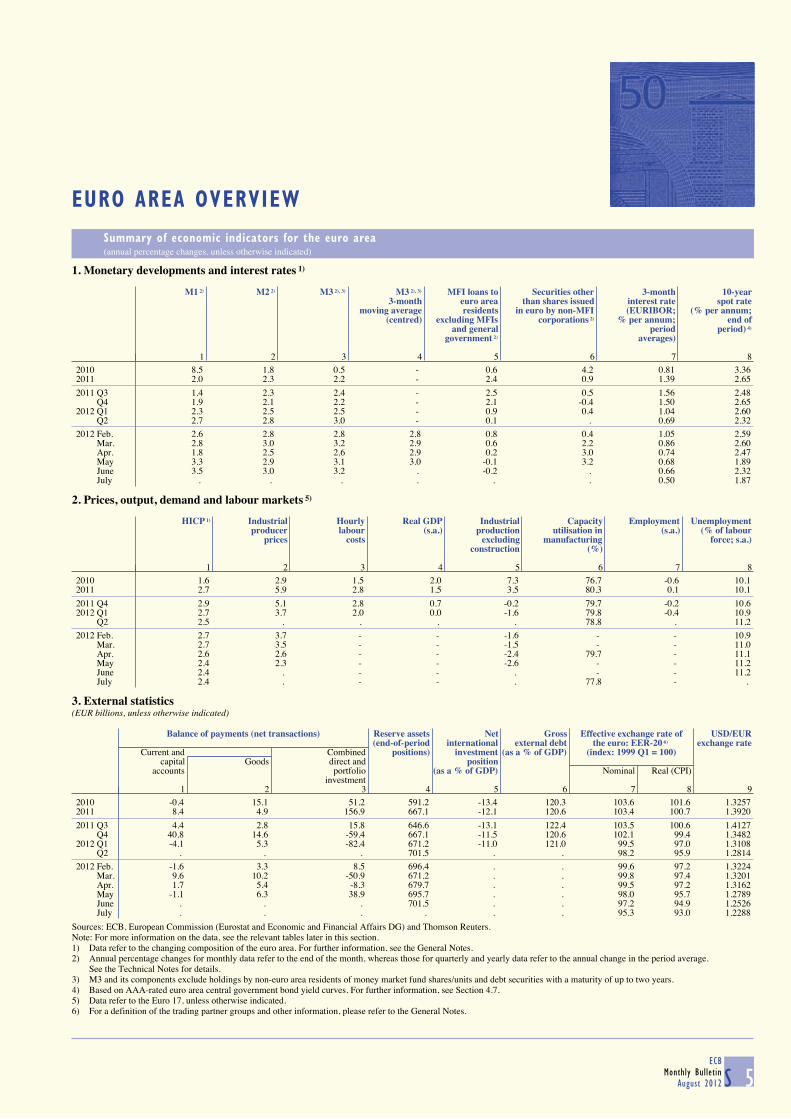
EURO AREA OVERVIEW
Summary of economic indicators for the euro area (annual percentage changes, unless otherwise indicated)
S 5ECB
Monthly BulletinAugust 2012
1. Monetary developments and interest rates 1)
M1 2) M2 2) M3 2), 3) M3 2), 3) MFI loans to Securities other 3-month 10-year3-month euro area than shares issued interest rate spot rate
moving average residents in euro by non-MFI (EURIBOR; (% per annum;(centred) excluding MFIs corporations 2) % per annum; end of
and general period period) 4)
government 2) averages)
1 2 3 4 5 6 7 8
2010 8.5 1.8 0.5 - 0.6 4.2 0.81 3.362011 2.0 2.3 2.2 - 2.4 0.9 1.39 2.65
2011 Q3 1.4 2.3 2.4 - 2.5 0.5 1.56 2.48 Q4 1.9 2.1 2.2 - 2.1 -0.4 1.50 2.652012 Q1 2.3 2.5 2.5 - 0.9 0.4 1.04 2.60 Q2 2.7 2.8 3.0 - 0.1 . 0.69 2.32
2012 Feb. 2.6 2.8 2.8 2.8 0.8 0.4 1.05 2.59 Mar. 2.8 3.0 3.2 2.9 0.6 2.2 0.86 2.60 Apr. 1.8 2.5 2.6 2.9 0.2 3.0 0.74 2.47 May 3.3 2.9 3.1 3.0 -0.1 3.2 0.68 1.89 June 3.5 3.0 3.2 . -0.2 . 0.66 2.32 July . . . . . . 0.50 1.87
2. Prices, output, demand and labour markets 5)
HICP 1) Industrial Hourly Real GDP Industrial Capacity Employment Unemploymentproducer labour (s.a.) production utilisation in (s.a.) (% of labour
prices costs excluding manufacturing force; s.a.)construction (%)
1 2 3 4 5 6 7 8
2010 1.6 2.9 1.5 2.0 7.3 76.7 -0.6 10.12011 2.7 5.9 2.8 1.5 3.5 80.3 0.1 10.1
2011 Q4 2.9 5.1 2.8 0.7 -0.2 79.7 -0.2 10.62012 Q1 2.7 3.7 2.0 0.0 -1.6 79.8 -0.4 10.9 Q2 2.5 . . . . 78.8 . 11.2
2012 Feb. 2.7 3.7 - - -1.6 - - 10.9 Mar. 2.7 3.5 - - -1.5 - - 11.0 Apr. 2.6 2.6 - - -2.4 79.7 - 11.1 May 2.4 2.3 - - -2.6 - - 11.2 June 2.4 . - - . - - 11.2 July 2.4 . - - . 77.8 - .
3. External statistics(EUR billions, unless otherwise indicated)
Balance of payments (net transactions) Reserve assets Net Gross Effective exchange rate of USD/EUR
(end-of-period international external debt the euro: EER-20 6) exchange rateCurrent and Combined positions) investment (as a % of GDP) (index: 1999 Q1 = 100)
capital Goods direct and positionaccounts portfolio (as a % of GDP) Nominal Real (CPI)
investment1 2 3 4 5 6 7 8 9
2010 -0.4 15.1 51.2 591.2 -13.4 120.3 103.6 101.6 1.32572011 8.4 4.9 156.9 667.1 -12.1 120.6 103.4 100.7 1.3920
2011 Q3 4.4 2.8 15.8 646.6 -13.1 122.4 103.5 100.6 1.4127 Q4 40.8 14.6 -59.4 667.1 -11.5 120.6 102.1 99.4 1.34822012 Q1 -4.1 5.3 -82.4 671.2 -11.0 121.0 99.5 97.0 1.3108 Q2 . . . 701.5 . . 98.2 95.9 1.2814
2012 Feb. -1.6 3.3 8.5 696.4 . . 99.6 97.2 1.3224 Mar. 9.6 10.2 -50.9 671.2 . . 99.8 97.4 1.3201 Apr. 1.7 5.4 -8.3 679.7 . . 99.5 97.2 1.3162 May -1.1 6.3 38.9 695.7 . . 98.0 95.7 1.2789 June . . . 701.5 . . 97.2 94.9 1.2526 July . . . . . . 95.3 93.0 1.2288
Sources: ECB, European Commission (Eurostat and Economic and Financial Affairs DG) and Thomson Reuters.Note: For more information on the data, see the relevant tables later in this section.1) Data refer to the changing composition of the euro area. For further information, see the General Notes.2) Annual percentage changes for monthly data refer to the end of the month, whereas those for quarterly and yearly data refer to the annual change in the period average.
See the Technical Notes for details.3) M3 and its components exclude holdings by non-euro area residents of money market fund shares/units and debt securities with a maturity of up to two years.4) Based on AAA-rated euro area central government bond yield curves. For further information, see Section 4.7.5) Data refer to the Euro 17, unless otherwise indicated.6) For a definition of the trading partner groups and other information, please refer to the General Notes.
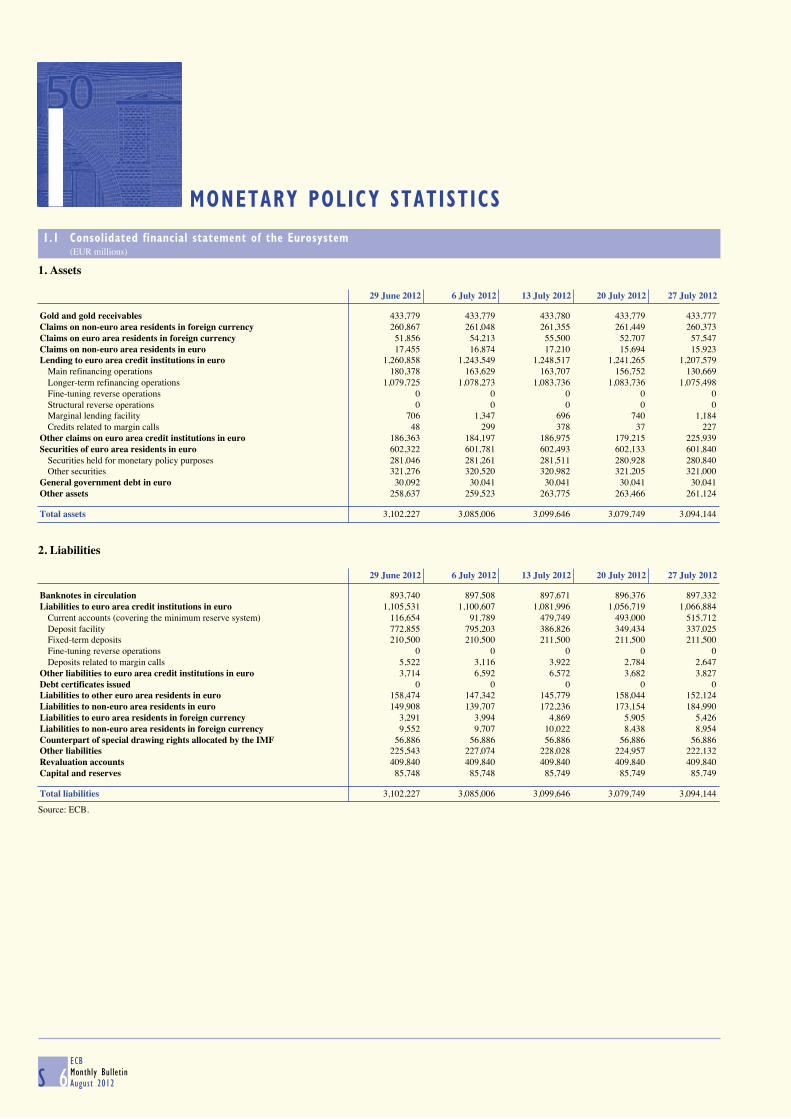
1 MONETARY POLICY STATISTICS
1.1 Consolidated financial statement of the Eurosystem (EUR millions)
S 6ECBMonthly BulletinAugust 2012
1. Assets
29 June 2012 6 July 2012 13 July 2012 20 July 2012 27 July 2012
Gold and gold receivables 433,779 433,779 433,780 433,779 433,777 Claims on non-euro area residents in foreign currency 260,867 261,048 261,355 261,449 260,373 Claims on euro area residents in foreign currency 51,856 54,213 55,500 52,707 57,547 Claims on non-euro area residents in euro 17,455 16,874 17,210 15,694 15,923 Lending to euro area credit institutions in euro 1,260,858 1,243,549 1,248,517 1,241,265 1,207,579 Main refinancing operations 180,378 163,629 163,707 156,752 130,669 Longer-term refinancing operations 1,079,725 1,078,273 1,083,736 1,083,736 1,075,498 Fine-tuning reverse operations 0 0 0 0 0 Structural reverse operations 0 0 0 0 0 Marginal lending facility 706 1,347 696 740 1,184 Credits related to margin calls 48 299 378 37 227 Other claims on euro area credit institutions in euro 186,363 184,197 186,975 179,215 225,939 Securities of euro area residents in euro 602,322 601,781 602,493 602,133 601,840 Securities held for monetary policy purposes 281,046 281,261 281,511 280,928 280,840 Other securities 321,276 320,520 320,982 321,205 321,000 General government debt in euro 30,092 30,041 30,041 30,041 30,041 Other assets 258,637 259,523 263,775 263,466 261,124
Total assets 3,102,227 3,085,006 3,099,646 3,079,749 3,094,144
2. Liabilities
29 June 2012 6 July 2012 13 July 2012 20 July 2012 27 July 2012
Banknotes in circulation 893,740 897,508 897,671 896,376 897,332 Liabilities to euro area credit institutions in euro 1,105,531 1,100,607 1,081,996 1,056,719 1,066,884 Current accounts (covering the minimum reserve system) 116,654 91,789 479,749 493,000 515,712 Deposit facility 772,855 795,203 386,826 349,434 337,025 Fixed-term deposits 210,500 210,500 211,500 211,500 211,500 Fine-tuning reverse operations 0 0 0 0 0 Deposits related to margin calls 5,522 3,116 3,922 2,784 2,647 Other liabilities to euro area credit institutions in euro 3,714 6,592 6,572 3,682 3,827 Debt certificates issued 0 0 0 0 0 Liabilities to other euro area residents in euro 158,474 147,342 145,779 158,044 152,124 Liabilities to non-euro area residents in euro 149,908 139,707 172,236 173,154 184,990 Liabilities to euro area residents in foreign currency 3,291 3,994 4,869 5,905 5,426 Liabilities to non-euro area residents in foreign currency 9,552 9,707 10,022 8,438 8,954 Counterpart of special drawing rights allocated by the IMF 56,886 56,886 56,886 56,886 56,886 Other liabilities 225,543 227,074 228,028 224,957 222,132 Revaluation accounts 409,840 409,840 409,840 409,840 409,840 Capital and reserves 85,748 85,748 85,749 85,749 85,749
Total liabilities 3,102,227 3,085,006 3,099,646 3,079,749 3,094,144
Source: ECB.
1

EURO AREASTATISTICS
Monetarypolicy
statistics
1.2 Key ECB interest rates (levels in percentages per annum; changes in percentage points)
S 7ECB
Monthly BulletinAugust 2012
With effect from: 1) Deposit facility Main refinancing operations Marginal lending facility
Fixed rate tenders Variable rate tenders Fixed rate Minimum bid rate
Level Change Level Level Change Level Change
1 2 3 4 5 6 7
1999 1 Jan. 2.00 - 3.00 - - 4.50 - 4 2) 2.75 0.75 3.00 - ... 3.25 -1.25
22 2.00 -0.75 3.00 - ... 4.50 1.259 Apr. 1.50 -0.50 2.50 - -0.50 3.50 -1.005 Nov. 2.00 0.50 3.00 - 0.50 4.00 0.50
2000 4 Feb. 2.25 0.25 3.25 - 0.25 4.25 0.2517 Mar. 2.50 0.25 3.50 - 0.25 4.50 0.2528 Apr. 2.75 0.25 3.75 - 0.25 4.75 0.25
9 June 3.25 0.50 4.25 - 0.50 5.25 0.5028 3) 3.25 ... - 4.25 ... 5.25 ...
1 Sep. 3.50 0.25 - 4.50 0.25 5.50 0.256 Oct. 3.75 0.25 - 4.75 0.25 5.75 0.25
2001 11 May 3.50 -0.25 - 4.50 -0.25 5.50 -0.2531 Aug. 3.25 -0.25 - 4.25 -0.25 5.25 -0.2518 Sep. 2.75 -0.50 - 3.75 -0.50 4.75 -0.50
9 Nov. 2.25 -0.50 - 3.25 -0.50 4.25 -0.50
2002 6 Dec. 1.75 -0.50 - 2.75 -0.50 3.75 -0.50
2003 7 Mar. 1.50 -0.25 - 2.50 -0.25 3.50 -0.256 June 1.00 -0.50 - 2.00 -0.50 3.00 -0.50
2005 6 Dec. 1.25 0.25 - 2.25 0.25 3.25 0.25
2006 8 Mar. 1.50 0.25 - 2.50 0.25 3.50 0.2515 June 1.75 0.25 - 2.75 0.25 3.75 0.25
9 Aug. 2.00 0.25 - 3.00 0.25 4.00 0.2511 Oct. 2.25 0.25 - 3.25 0.25 4.25 0.2513 Dec. 2.50 0.25 - 3.50 0.25 4.50 0.25
2007 14 Mar. 2.75 0.25 - 3.75 0.25 4.75 0.2513 June 3.00 0.25 - 4.00 0.25 5.00 0.25
2008 9 July 3.25 0.25 - 4.25 0.25 5.25 0.258 Oct. 2.75 -0.50 - - - 4.75 -0.509 4) 3.25 0.50 - - - 4.25 -0.50
15 5) 3.25 ... 3.75 - -0.50 4.25 ... 12 Nov. 2.75 -0.50 3.25 - -0.50 3.75 -0.5010 Dec. 2.00 -0.75 2.50 - -0.75 3.00 -0.75
2009 21 Jan. 1.00 -1.00 2.00 - -0.50 3.00 ... 11 Mar. 0.50 -0.50 1.50 - -0.50 2.50 -0.50
8 Apr. 0.25 -0.25 1.25 - -0.25 2.25 -0.2513 May 0.25 ... 1.00 - -0.25 1.75 -0.50
2011 13 Apr. 0.50 0.25 1.25 - 0.25 2.00 0.2513 July 0.75 0.25 1.50 - 0.25 2.25 0.25
9 Nov. 0.50 -0.25 1.25 - -0.25 2.00 -0.2514 Dec. 0.25 -0.25 1.00 - -0.25 1.75 -0.25
2012 11 July 0.00 -0.25 0.75 - -0.25 1.50 -0.25
Source: ECB.1) From 1 January 1999 to 9 March 2004, the date refers to the deposit and marginal lending facilities. For main refinancing operations, changes in the rate are effective from the
first operation following the date indicated. The change on 18 September 2001 was effective on that same day. From 10 March 2004 onwards, the date refers both to the depositand marginal lending facilities and to the main refinancing operations (with changes effective from the first main refinancing operation following the Governing Councildecision), unless otherwise indicated.
2) On 22 December 1998 the ECB announced that, as an exceptional measure between 4 and 21 January 1999, a narrow corridor of 50 basis points would be applied between theinterest rates for the marginal lending facility and the deposit facility, aimed at facilitating the transition to the new monetary regime by market participants.
3) On 8 June 2000 the ECB announced that, starting from the operation to be settled on 28 June 2000, the main refinancing operations of the Eurosystem would be conducted asvariable rate tenders. The minimum bid rate refers to the minimum interest rate at which counterparties may place their bids.
4) As of 9 October 2008 the ECB reduced the standing facilities corridor from 200 basis points to 100 basis points around the interest rate on the main refinancing operations.The standing facilities corridor was restored to 200 basis points as of 21 January 2009.
5) On 8 October 2008 the ECB announced that, starting from the operation to be settled on 15 October, the weekly main refinancing operations would be carried out through afixed rate tender procedure with full allotment at the interest rate on the main refinancing operations. This change overrode the previous decision (made on the same day)to cut by 50 basis points the minimum bid rate on the main refinancing operations conducted as variable rate tenders.
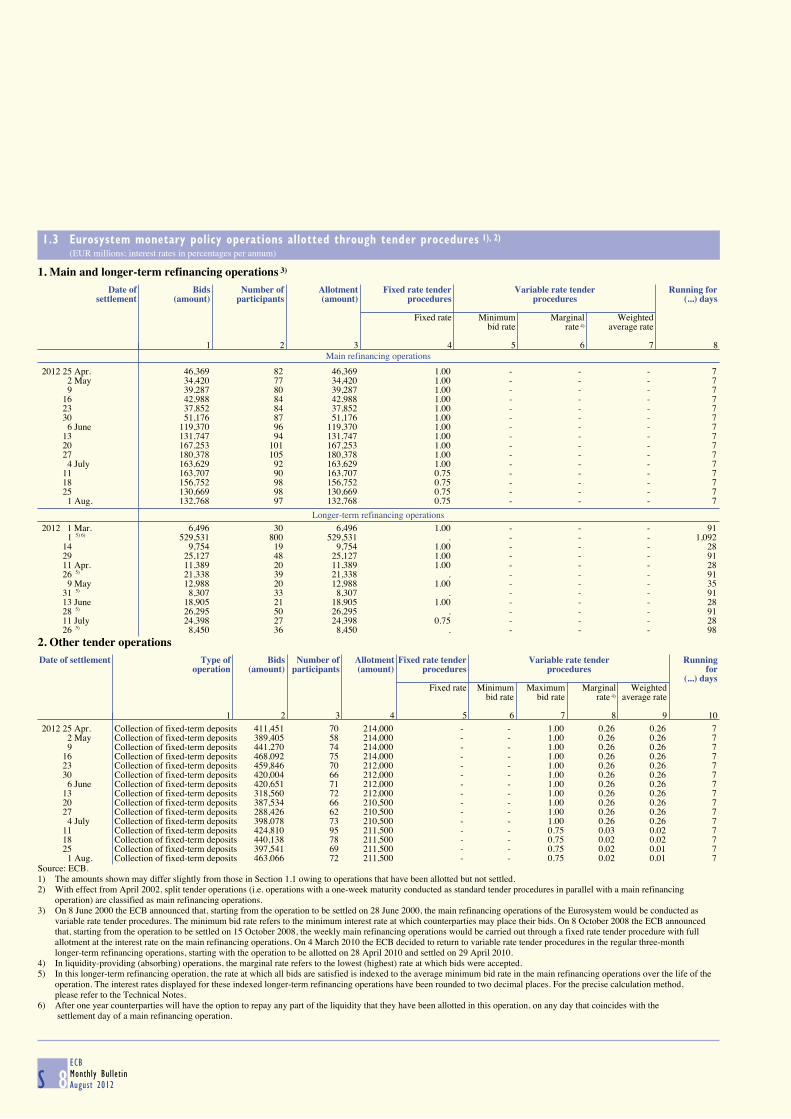
1.3 Eurosystem monetary policy operations allotted through tender procedures 1), 2) (EUR millions; interest rates in percentages per annum)
S 8ECBMonthly BulletinAugust 2012
1. Main and longer-term refinancing operations 3)
Main refinancing operations
Date of Bids Number of Allotment Fixed rate tender Variable rate tender Running for
settlement (amount) participants (amount) procedures procedures (...) days
Fixed rate Minimum Marginal Weightedbid rate rate 4) average rate
1 2 3 4 5 6 7 8
2012 25 Apr. 46,369 82 46,369 1.00 - - - 72 May 34,420 77 34,420 1.00 - - - 79 39,287 80 39,287 1.00 - - - 7
16 42,988 84 42,988 1.00 - - - 723 37,852 84 37,852 1.00 - - - 730 51,176 87 51,176 1.00 - - - 7
6 June 119,370 96 119,370 1.00 - - - 713 131,747 94 131,747 1.00 - - - 720 167,253 101 167,253 1.00 - - - 727 180,378 105 180,378 1.00 - - - 7
4 July 163,629 92 163,629 1.00 - - - 711 163,707 90 163,707 0.75 - - - 718 156,752 98 156,752 0.75 - - - 725 130,669 98 130,669 0.75 - - - 7
1 Aug. 132,768 97 132,768 0.75 - - - 7
Longer-term refinancing operations
2012 1 Mar. 6,496 30 6,496 1.00 - - - 911 5) 6) 529,531 800 529,531 . - - - 1,092
14 9,754 19 9,754 1.00 - - - 2829 25,127 48 25,127 1.00 - - - 9111 Apr. 11,389 20 11,389 1.00 - - - 2826 5) 21,338 39 21,338 . - - - 91
9 May 12,988 20 12,988 1.00 - - - 3531 5) 8,307 33 8,307 . - - - 9113 June 18,905 21 18,905 1.00 - - - 2828 5) 26,295 50 26,295 . - - - 9111 July 24,398 27 24,398 0.75 - - - 2826 5) 8,450 36 8,450 . - - - 98
2. Other tender operations
Date of settlement Type of Bids Number of Allotment Fixed rate tender Variable rate tender Running
operation (amount) participants (amount) procedures procedures for(...) days
Fixed rate Minimum Maximum Marginal Weightedbid rate bid rate rate 4) average rate
1 2 3 4 5 6 7 8 9 10
2012 25 Apr. Collection of fixed-term deposits 411,451 70 214,000 - - 1.00 0.26 0.26 72 May Collection of fixed-term deposits 389,405 58 214,000 - - 1.00 0.26 0.26 79 Collection of fixed-term deposits 441,270 74 214,000 - - 1.00 0.26 0.26 7
16 Collection of fixed-term deposits 468,092 75 214,000 - - 1.00 0.26 0.26 723 Collection of fixed-term deposits 459,846 70 212,000 - - 1.00 0.26 0.26 730 Collection of fixed-term deposits 420,004 66 212,000 - - 1.00 0.26 0.26 7
6 June Collection of fixed-term deposits 420,651 71 212,000 - - 1.00 0.26 0.26 713 Collection of fixed-term deposits 318,560 72 212,000 - - 1.00 0.26 0.26 720 Collection of fixed-term deposits 387,534 66 210,500 - - 1.00 0.26 0.26 727 Collection of fixed-term deposits 288,426 62 210,500 - - 1.00 0.26 0.26 7
4 July Collection of fixed-term deposits 398,078 73 210,500 - - 1.00 0.26 0.26 711 Collection of fixed-term deposits 424,810 95 211,500 - - 0.75 0.03 0.02 718 Collection of fixed-term deposits 440,138 78 211,500 - - 0.75 0.02 0.02 725 Collection of fixed-term deposits 397,541 69 211,500 - - 0.75 0.02 0.01 7
1 Aug. Collection of fixed-term deposits 463,066 72 211,500 - - 0.75 0.02 0.01 7 Source: ECB.1) The amounts shown may differ slightly from those in Section 1.1 owing to operations that have been allotted but not settled.2) With effect from April 2002, split tender operations (i.e. operations with a one-week maturity conducted as standard tender procedures in parallel with a main refinancing
operation) are classified as main refinancing operations.3) On 8 June 2000 the ECB announced that, starting from the operation to be settled on 28 June 2000, the main refinancing operations of the Eurosystem would be conducted as
variable rate tender procedures. The minimum bid rate refers to the minimum interest rate at which counterparties may place their bids. On 8 October 2008 the ECB announcedthat, starting from the operation to be settled on 15 October 2008, the weekly main refinancing operations would be carried out through a fixed rate tender procedure with fullallotment at the interest rate on the main refinancing operations. On 4 March 2010 the ECB decided to return to variable rate tender procedures in the regular three-monthlonger-term refinancing operations, starting with the operation to be allotted on 28 April 2010 and settled on 29 April 2010.
4) In liquidity-providing (absorbing) operations, the marginal rate refers to the lowest (highest) rate at which bids were accepted.5) In this longer-term refinancing operation, the rate at which all bids are satisfied is indexed to the average minimum bid rate in the main refinancing operations over the life of the
operation. The interest rates displayed for these indexed longer-term refinancing operations have been rounded to two decimal places. For the precise calculation method,please refer to the Technical Notes.
6) After one year counterparties will have the option to repay any part of the liquidity that they have been allotted in this operation, on any day that coincides with the settlement day of a main refinancing operation.
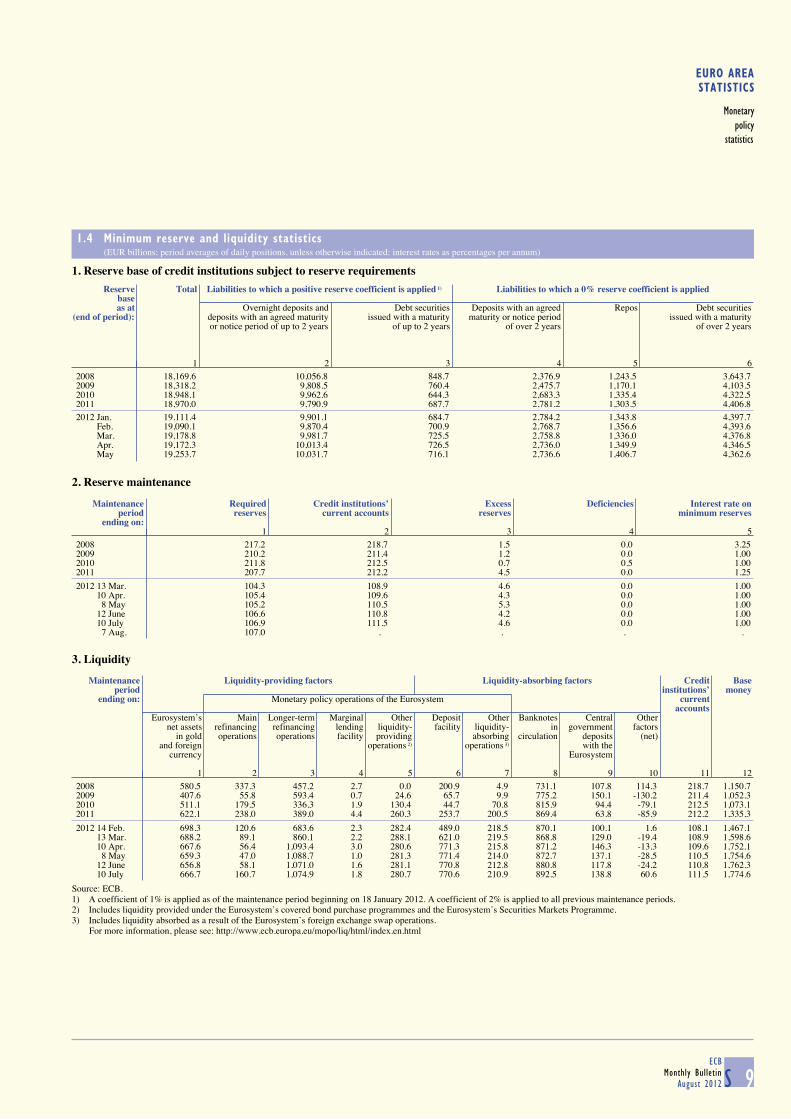
EURO AREASTATISTICS
Monetarypolicy
statistics
1.4 Minimum reserve and liquidity statistics (EUR billions; period averages of daily positions, unless otherwise indicated; interest rates as percentages per annum)
S 9ECB
Monthly BulletinAugust 2012
1. Reserve base of credit institutions subject to reserve requirements
Reserve Total Liabilities to which a positive reserve coefficient is applied 1) Liabilities to which a 0% reserve coefficient is applied
baseas at Overnight deposits and Debt securities Deposits with an agreed Repos Debt securities
(end of period): deposits with an agreed maturity issued with a maturity maturity or notice period issued with a maturityor notice period of up to 2 years of up to 2 years of over 2 years of over 2 years
1 2 3 4 5 6
2008 18,169.6 10,056.8 848.7 2,376.9 1,243.5 3,643.72009 18,318.2 9,808.5 760.4 2,475.7 1,170.1 4,103.52010 18,948.1 9,962.6 644.3 2,683.3 1,335.4 4,322.52011 18,970.0 9,790.9 687.7 2,781.2 1,303.5 4,406.8
2012 Jan. 19,111.4 9,901.1 684.7 2,784.2 1,343.8 4,397.7 Feb. 19,090.1 9,870.4 700.9 2,768.7 1,356.6 4,393.6 Mar. 19,178.8 9,981.7 725.5 2,758.8 1,336.0 4,376.8 Apr. 19,172.3 10,013.4 726.5 2,736.0 1,349.9 4,346.5 May 19,253.7 10,031.7 716.1 2,736.6 1,406.7 4,362.6
2. Reserve maintenance
Maintenance Required Credit institutions’ Excess Deficiencies Interest rate onperiod reserves current accounts reserves minimum reserves
ending on:1 2 3 4 5
2008 217.2 218.7 1.5 0.0 3.252009 210.2 211.4 1.2 0.0 1.002010 211.8 212.5 0.7 0.5 1.002011 207.7 212.2 4.5 0.0 1.25
2012 13 Mar. 104.3 108.9 4.6 0.0 1.0010 Apr. 105.4 109.6 4.3 0.0 1.00
8 May 105.2 110.5 5.3 0.0 1.0012 June 106.6 110.8 4.2 0.0 1.0010 July 106.9 111.5 4.6 0.0 1.00
7 Aug. 107.0 . . . .
3. Liquidity
Maintenance Liquidity-providing factors Liquidity-absorbing factors Credit Base
period institutions’ moneyending on: Monetary policy operations of the Eurosystem current
accountsEurosystem’s Main Longer-term Marginal Other Deposit Other Banknotes Central Other
net assets refinancing refinancing lending liquidity- facility liquidity- in government factorsin gold operations operations facility providing absorbing circulation deposits (net)
and foreign operations 2) operations 3) with thecurrency Eurosystem
1 2 3 4 5 6 7 8 9 10 11 12
2008 580.5 337.3 457.2 2.7 0.0 200.9 4.9 731.1 107.8 114.3 218.7 1,150.72009 407.6 55.8 593.4 0.7 24.6 65.7 9.9 775.2 150.1 -130.2 211.4 1,052.32010 511.1 179.5 336.3 1.9 130.4 44.7 70.8 815.9 94.4 -79.1 212.5 1,073.12011 622.1 238.0 389.0 4.4 260.3 253.7 200.5 869.4 63.8 -85.9 212.2 1,335.3
2012 14 Feb. 698.3 120.6 683.6 2.3 282.4 489.0 218.5 870.1 100.1 1.6 108.1 1,467.113 Mar. 688.2 89.1 860.1 2.2 288.1 621.0 219.5 868.8 129.0 -19.4 108.9 1,598.610 Apr. 667.6 56.4 1,093.4 3.0 280.6 771.3 215.8 871.2 146.3 -13.3 109.6 1,752.1
8 May 659.3 47.0 1,088.7 1.0 281.3 771.4 214.0 872.7 137.1 -28.5 110.5 1,754.612 June 656.8 58.1 1,071.0 1.6 281.1 770.8 212.8 880.8 117.8 -24.2 110.8 1,762.310 July 666.7 160.7 1,074.9 1.8 280.7 770.6 210.9 892.5 138.8 60.6 111.5 1,774.6
Source: ECB.1) A coefficient of 1% is applied as of the maintenance period beginning on 18 January 2012. A coefficient of 2% is applied to all previous maintenance periods.2) Includes liquidity provided under the Eurosystem’s covered bond purchase programmes and the Eurosystem’s Securities Markets Programme.3) Includes liquidity absorbed as a result of the Eurosystem’s foreign exchange swap operations.
For more information, please see: http://www.ecb.europa.eu/mopo/liq/html/index.en.html
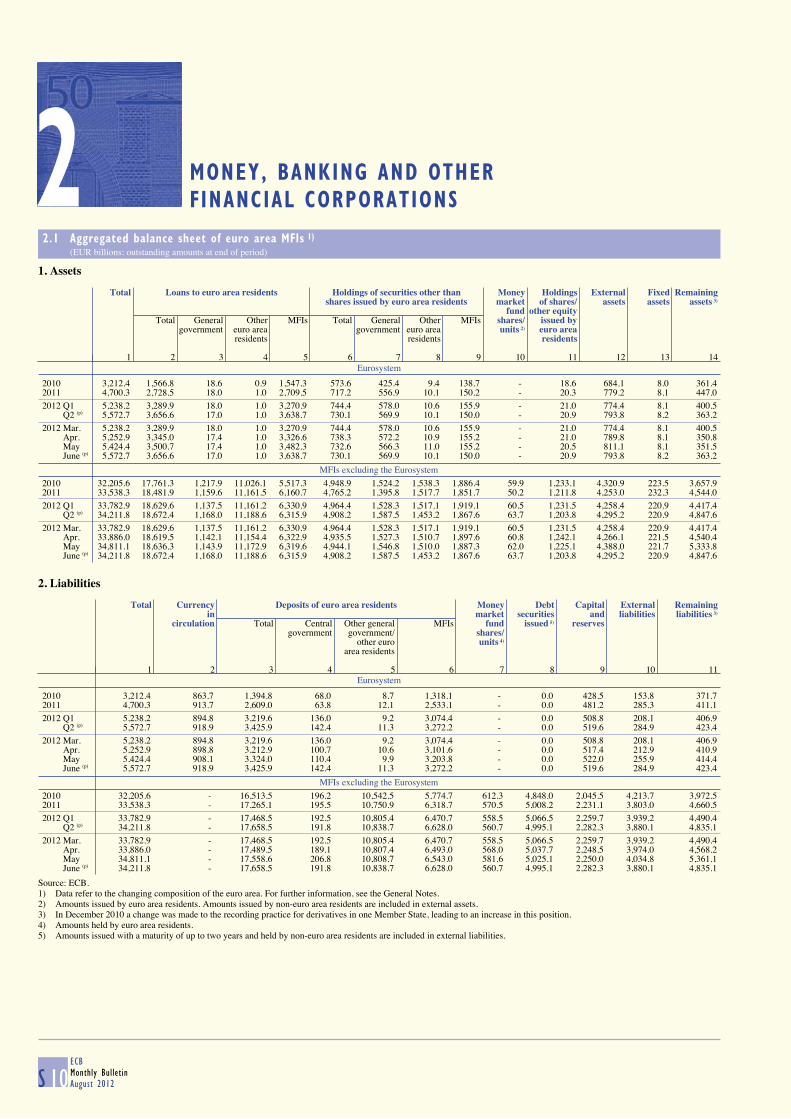
FINANCIAL CORPORATIONS2 MONEY, BANKING AND OTHER
2.1 Aggregated balance sheet of euro area MFIs 1) (EUR billions; outstanding amounts at end of period)
S 10ECBMonthly BulletinAugust 2012
1. Assets
Eurosystem
Total Loans to euro area residents Holdings of securities other than Money Holdings External Fixed Remaining
shares issued by euro area residents market of shares/ assets assets assets 3)
fund other equityTotal General Other MFIs Total General Other MFIs shares/ issued by
government euro area government euro area units 2) euro arearesidents residents residents
1 2 3 4 5 6 7 8 9 10 11 12 13 14
2010 3,212.4 1,566.8 18.6 0.9 1,547.3 573.6 425.4 9.4 138.7 - 18.6 684.1 8.0 361.42011 4,700.3 2,728.5 18.0 1.0 2,709.5 717.2 556.9 10.1 150.2 - 20.3 779.2 8.1 447.0
2012 Q1 5,238.2 3,289.9 18.0 1.0 3,270.9 744.4 578.0 10.6 155.9 - 21.0 774.4 8.1 400.5 Q2 (p) 5,572.7 3,656.6 17.0 1.0 3,638.7 730.1 569.9 10.1 150.0 - 20.9 793.8 8.2 363.2
2012 Mar. 5,238.2 3,289.9 18.0 1.0 3,270.9 744.4 578.0 10.6 155.9 - 21.0 774.4 8.1 400.5 Apr. 5,252.9 3,345.0 17.4 1.0 3,326.6 738.3 572.2 10.9 155.2 - 21.0 789.8 8.1 350.8 May 5,424.4 3,500.7 17.4 1.0 3,482.3 732.6 566.3 11.0 155.2 - 20.5 811.1 8.1 351.5 June (p) 5,572.7 3,656.6 17.0 1.0 3,638.7 730.1 569.9 10.1 150.0 - 20.9 793.8 8.2 363.2
MFIs excluding the Eurosystem
2010 32,205.6 17,761.3 1,217.9 11,026.1 5,517.3 4,948.9 1,524.2 1,538.3 1,886.4 59.9 1,233.1 4,320.9 223.5 3,657.92011 33,538.3 18,481.9 1,159.6 11,161.5 6,160.7 4,765.2 1,395.8 1,517.7 1,851.7 50.2 1,211.8 4,253.0 232.3 4,544.0
2012 Q1 33,782.9 18,629.6 1,137.5 11,161.2 6,330.9 4,964.4 1,528.3 1,517.1 1,919.1 60.5 1,231.5 4,258.4 220.9 4,417.4 Q2 (p) 34,211.8 18,672.4 1,168.0 11,188.6 6,315.9 4,908.2 1,587.5 1,453.2 1,867.6 63.7 1,203.8 4,295.2 220.9 4,847.6
2012 Mar. 33,782.9 18,629.6 1,137.5 11,161.2 6,330.9 4,964.4 1,528.3 1,517.1 1,919.1 60.5 1,231.5 4,258.4 220.9 4,417.4 Apr. 33,886.0 18,619.5 1,142.1 11,154.4 6,322.9 4,935.5 1,527.3 1,510.7 1,897.6 60.8 1,242.1 4,266.1 221.5 4,540.4 May 34,811.1 18,636.3 1,143.9 11,172.9 6,319.6 4,944.1 1,546.8 1,510.0 1,887.3 62.0 1,225.1 4,388.0 221.7 5,333.8 June (p) 34,211.8 18,672.4 1,168.0 11,188.6 6,315.9 4,908.2 1,587.5 1,453.2 1,867.6 63.7 1,203.8 4,295.2 220.9 4,847.6
2. Liabilities
Eurosystem
Total Currency Deposits of euro area residents Money Debt Capital External Remaining
in market securities and liabilities liabilities 3)
circulation Total Central Other general MFIs fund issued 5) reservesgovernment government/ shares/
other euro units 4)
area residents
1 2 3 4 5 6 7 8 9 10 11
2010 3,212.4 863.7 1,394.8 68.0 8.7 1,318.1 - 0.0 428.5 153.8 371.72011 4,700.3 913.7 2,609.0 63.8 12.1 2,533.1 - 0.0 481.2 285.3 411.1
2012 Q1 5,238.2 894.8 3,219.6 136.0 9.2 3,074.4 - 0.0 508.8 208.1 406.9 Q2 (p) 5,572.7 918.9 3,425.9 142.4 11.3 3,272.2 - 0.0 519.6 284.9 423.4
2012 Mar. 5,238.2 894.8 3,219.6 136.0 9.2 3,074.4 - 0.0 508.8 208.1 406.9 Apr. 5,252.9 898.8 3,212.9 100.7 10.6 3,101.6 - 0.0 517.4 212.9 410.9 May 5,424.4 908.1 3,324.0 110.4 9.9 3,203.8 - 0.0 522.0 255.9 414.4 June (p) 5,572.7 918.9 3,425.9 142.4 11.3 3,272.2 - 0.0 519.6 284.9 423.4
MFIs excluding the Eurosystem
2010 32,205.6 - 16,513.5 196.2 10,542.5 5,774.7 612.3 4,848.0 2,045.5 4,213.7 3,972.52011 33,538.3 - 17,265.1 195.5 10,750.9 6,318.7 570.5 5,008.2 2,231.1 3,803.0 4,660.5
2012 Q1 33,782.9 - 17,468.5 192.5 10,805.4 6,470.7 558.5 5,066.5 2,259.7 3,939.2 4,490.4 Q2 (p) 34,211.8 - 17,658.5 191.8 10,838.7 6,628.0 560.7 4,995.1 2,282.3 3,880.1 4,835.1
2012 Mar. 33,782.9 - 17,468.5 192.5 10,805.4 6,470.7 558.5 5,066.5 2,259.7 3,939.2 4,490.4 Apr. 33,886.0 - 17,489.5 189.1 10,807.4 6,493.0 568.0 5,037.7 2,248.5 3,974.0 4,568.2 May 34,811.1 - 17,558.6 206.8 10,808.7 6,543.0 581.6 5,025.1 2,250.0 4,034.8 5,361.1 June (p) 34,211.8 - 17,658.5 191.8 10,838.7 6,628.0 560.7 4,995.1 2,282.3 3,880.1 4,835.1
Source: ECB.1) Data refer to the changing composition of the euro area. For further information, see the General Notes.2) Amounts issued by euro area residents. Amounts issued by non-euro area residents are included in external assets.3) In December 2010 a change was made to the recording practice for derivatives in one Member State, leading to an increase in this position.4) Amounts held by euro area residents.5) Amounts issued with a maturity of up to two years and held by non-euro area residents are included in external liabilities.
2
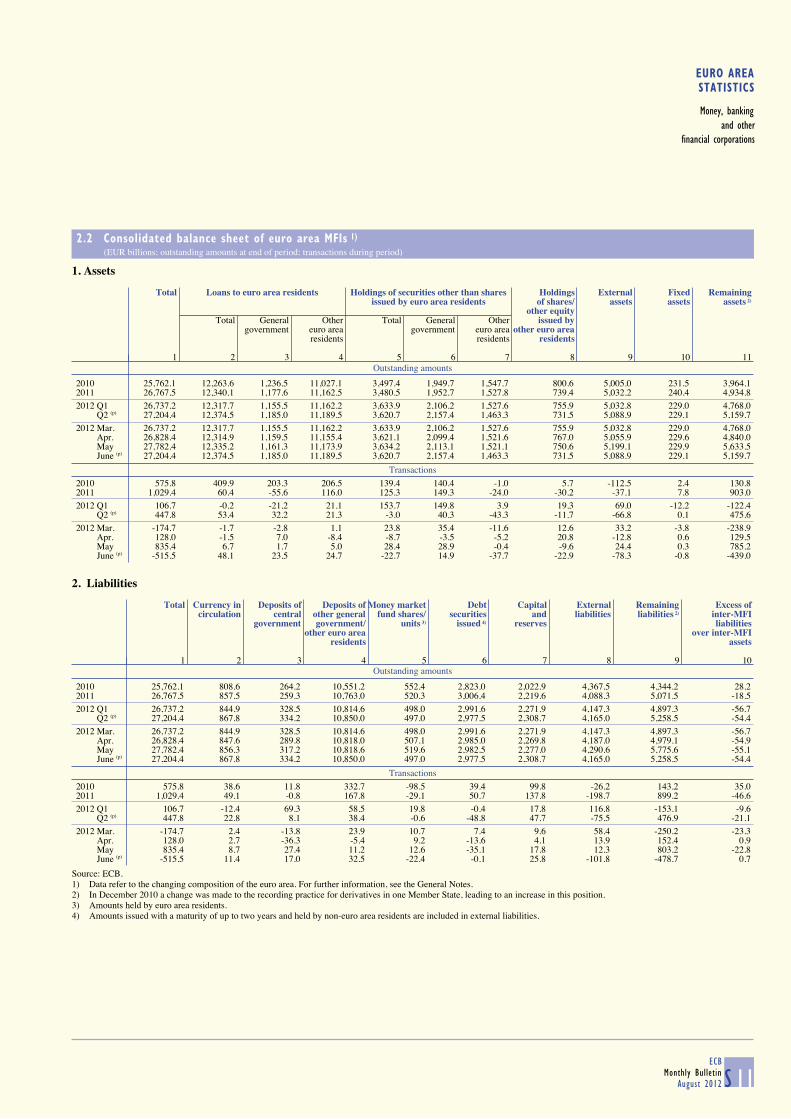
EURO AREASTATISTICS
Money, bankingand other
financial corporations
2.2 Consolidated balance sheet of euro area MFIs 1) (EUR billions; outstanding amounts at end of period; transactions during period)
S 11ECB
Monthly BulletinAugust 2012
1. Assets
Outstanding amounts
Total Loans to euro area residents Holdings of securities other than shares Holdings External Fixed Remaining
issued by euro area residents of shares/ assets assets assets 2)
other equityTotal General Other Total General Other issued by
government euro area government euro area other euro arearesidents residents residents
1 2 3 4 5 6 7 8 9 10 11
2010 25,762.1 12,263.6 1,236.5 11,027.1 3,497.4 1,949.7 1,547.7 800.6 5,005.0 231.5 3,964.12011 26,767.5 12,340.1 1,177.6 11,162.5 3,480.5 1,952.7 1,527.8 739.4 5,032.2 240.4 4,934.8
2012 Q1 26,737.2 12,317.7 1,155.5 11,162.2 3,633.9 2,106.2 1,527.6 755.9 5,032.8 229.0 4,768.0 Q2 (p) 27,204.4 12,374.5 1,185.0 11,189.5 3,620.7 2,157.4 1,463.3 731.5 5,088.9 229.1 5,159.7
2012 Mar. 26,737.2 12,317.7 1,155.5 11,162.2 3,633.9 2,106.2 1,527.6 755.9 5,032.8 229.0 4,768.0 Apr. 26,828.4 12,314.9 1,159.5 11,155.4 3,621.1 2,099.4 1,521.6 767.0 5,055.9 229.6 4,840.0 May 27,782.4 12,335.2 1,161.3 11,173.9 3,634.2 2,113.1 1,521.1 750.6 5,199.1 229.9 5,633.5 June (p) 27,204.4 12,374.5 1,185.0 11,189.5 3,620.7 2,157.4 1,463.3 731.5 5,088.9 229.1 5,159.7
Transactions
2010 575.8 409.9 203.3 206.5 139.4 140.4 -1.0 5.7 -112.5 2.4 130.82011 1,029.4 60.4 -55.6 116.0 125.3 149.3 -24.0 -30.2 -37.1 7.8 903.0
2012 Q1 106.7 -0.2 -21.2 21.1 153.7 149.8 3.9 19.3 69.0 -12.2 -122.4 Q2 (p) 447.8 53.4 32.2 21.3 -3.0 40.3 -43.3 -11.7 -66.8 0.1 475.6
2012 Mar. -174.7 -1.7 -2.8 1.1 23.8 35.4 -11.6 12.6 33.2 -3.8 -238.9 Apr. 128.0 -1.5 7.0 -8.4 -8.7 -3.5 -5.2 20.8 -12.8 0.6 129.5 May 835.4 6.7 1.7 5.0 28.4 28.9 -0.4 -9.6 24.4 0.3 785.2 June (p) -515.5 48.1 23.5 24.7 -22.7 14.9 -37.7 -22.9 -78.3 -0.8 -439.0
2. Liabilities
Outstanding amounts
Total Currency in Deposits of Deposits of Money market Debt Capital External Remaining Excess ofcirculation central other general fund shares/ securities and liabilities liabilities 2) inter-MFI
government government/ units 3) issued 4) reserves liabilitiesother euro area over inter-MFI
residents assets
1 2 3 4 5 6 7 8 9 10
2010 25,762.1 808.6 264.2 10,551.2 552.4 2,823.0 2,022.9 4,367.5 4,344.2 28.22011 26,767.5 857.5 259.3 10,763.0 520.3 3,006.4 2,219.6 4,088.3 5,071.5 -18.5
2012 Q1 26,737.2 844.9 328.5 10,814.6 498.0 2,991.6 2,271.9 4,147.3 4,897.3 -56.7 Q2 (p) 27,204.4 867.8 334.2 10,850.0 497.0 2,977.5 2,308.7 4,165.0 5,258.5 -54.4
2012 Mar. 26,737.2 844.9 328.5 10,814.6 498.0 2,991.6 2,271.9 4,147.3 4,897.3 -56.7 Apr. 26,828.4 847.6 289.8 10,818.0 507.1 2,985.0 2,269.8 4,187.0 4,979.1 -54.9 May 27,782.4 856.3 317.2 10,818.6 519.6 2,982.5 2,277.0 4,290.6 5,775.6 -55.1 June (p) 27,204.4 867.8 334.2 10,850.0 497.0 2,977.5 2,308.7 4,165.0 5,258.5 -54.4
Transactions
2010 575.8 38.6 11.8 332.7 -98.5 39.4 99.8 -26.2 143.2 35.02011 1,029.4 49.1 -0.8 167.8 -29.1 50.7 137.8 -198.7 899.2 -46.6
2012 Q1 106.7 -12.4 69.3 58.5 19.8 -0.4 17.8 116.8 -153.1 -9.6 Q2 (p) 447.8 22.8 8.1 38.4 -0.6 -48.8 47.7 -75.5 476.9 -21.1
2012 Mar. -174.7 2.4 -13.8 23.9 10.7 7.4 9.6 58.4 -250.2 -23.3 Apr. 128.0 2.7 -36.3 -5.4 9.2 -13.6 4.1 13.9 152.4 0.9 May 835.4 8.7 27.4 11.2 12.6 -35.1 17.8 12.3 803.2 -22.8 June (p) -515.5 11.4 17.0 32.5 -22.4 -0.1 25.8 -101.8 -478.7 0.7
Source: ECB.1) Data refer to the changing composition of the euro area. For further information, see the General Notes.2) In December 2010 a change was made to the recording practice for derivatives in one Member State, leading to an increase in this position.3) Amounts held by euro area residents.4) Amounts issued with a maturity of up to two years and held by non-euro area residents are included in external liabilities.
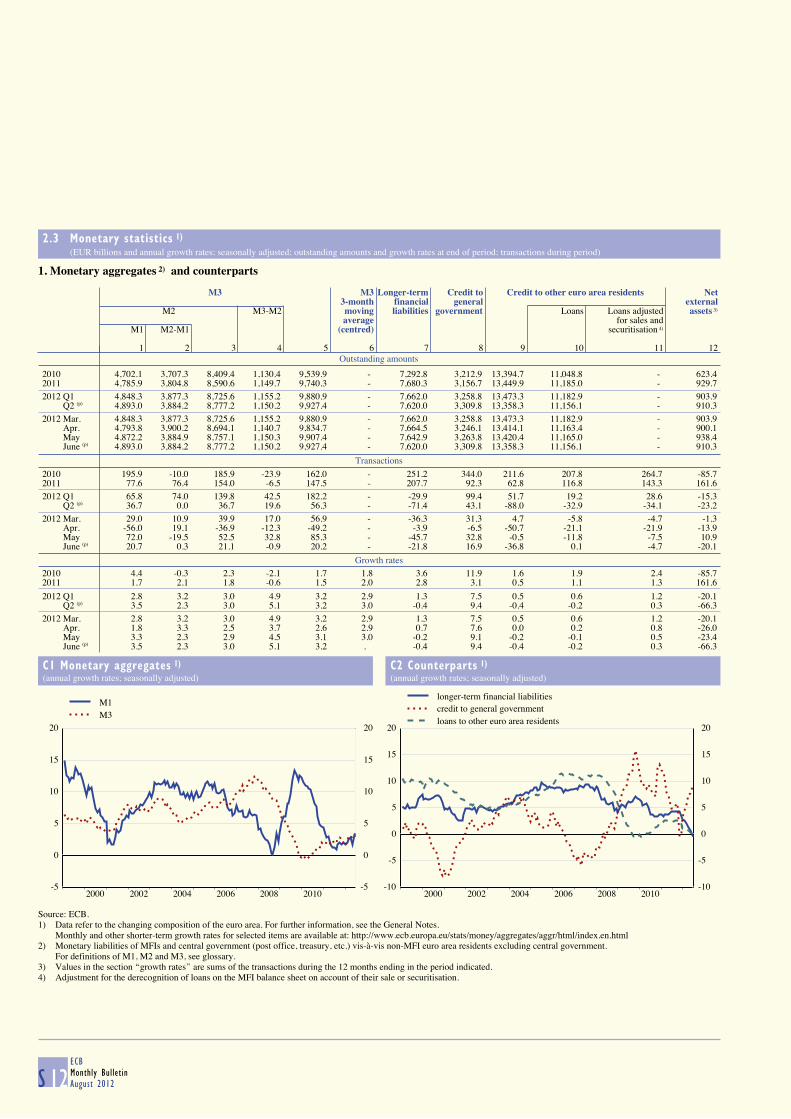
2.3 Monetary statistics 1) (EUR billions and annual growth rates; seasonally adjusted; outstanding amounts and growth rates at end of period; transactions during period)
S 12ECBMonthly BulletinAugust 2012
1. Monetary aggregates 2) and counterparts
Outstanding amounts
M3 M3 Longer-term Credit to Credit to other euro area residents Net
3-month financial general external M2 M3-M2 moving liabilities government Loans Loans adjusted assets 3)
average for sales andM1 M2-M1 (centred) securitisation 4)
1 2 3 4 5 6 7 8 9 10 11 12
2010 4,702.1 3,707.3 8,409.4 1,130.4 9,539.9 - 7,292.8 3,212.9 13,394.7 11,048.8 - 623.42011 4,785.9 3,804.8 8,590.6 1,149.7 9,740.3 - 7,680.3 3,156.7 13,449.9 11,185.0 - 929.7
2012 Q1 4,848.3 3,877.3 8,725.6 1,155.2 9,880.9 - 7,662.0 3,258.8 13,473.3 11,182.9 - 903.9 Q2 (p) 4,893.0 3,884.2 8,777.2 1,150.2 9,927.4 - 7,620.0 3,309.8 13,358.3 11,156.1 - 910.3
2012 Mar. 4,848.3 3,877.3 8,725.6 1,155.2 9,880.9 - 7,662.0 3,258.8 13,473.3 11,182.9 - 903.9 Apr. 4,793.8 3,900.2 8,694.1 1,140.7 9,834.7 - 7,664.5 3,246.1 13,414.1 11,163.4 - 900.1 May 4,872.2 3,884.9 8,757.1 1,150.3 9,907.4 - 7,642.9 3,263.8 13,420.4 11,165.0 - 938.4 June (p) 4,893.0 3,884.2 8,777.2 1,150.2 9,927.4 - 7,620.0 3,309.8 13,358.3 11,156.1 - 910.3
Transactions
2010 195.9 -10.0 185.9 -23.9 162.0 - 251.2 344.0 211.6 207.8 264.7 -85.72011 77.6 76.4 154.0 -6.5 147.5 - 207.7 92.3 62.8 116.8 143.3 161.6
2012 Q1 65.8 74.0 139.8 42.5 182.2 - -29.9 99.4 51.7 19.2 28.6 -15.3 Q2 (p) 36.7 0.0 36.7 19.6 56.3 - -71.4 43.1 -88.0 -32.9 -34.1 -23.2
2012 Mar. 29.0 10.9 39.9 17.0 56.9 - -36.3 31.3 4.7 -5.8 -4.7 -1.3 Apr. -56.0 19.1 -36.9 -12.3 -49.2 - -3.9 -6.5 -50.7 -21.1 -21.9 -13.9 May 72.0 -19.5 52.5 32.8 85.3 - -45.7 32.8 -0.5 -11.8 -7.5 10.9 June (p) 20.7 0.3 21.1 -0.9 20.2 - -21.8 16.9 -36.8 0.1 -4.7 -20.1
Growth rates
2010 4.4 -0.3 2.3 -2.1 1.7 1.8 3.6 11.9 1.6 1.9 2.4 -85.72011 1.7 2.1 1.8 -0.6 1.5 2.0 2.8 3.1 0.5 1.1 1.3 161.6
2012 Q1 2.8 3.2 3.0 4.9 3.2 2.9 1.3 7.5 0.5 0.6 1.2 -20.1 Q2 (p) 3.5 2.3 3.0 5.1 3.2 3.0 -0.4 9.4 -0.4 -0.2 0.3 -66.3
2012 Mar. 2.8 3.2 3.0 4.9 3.2 2.9 1.3 7.5 0.5 0.6 1.2 -20.1 Apr. 1.8 3.3 2.5 3.7 2.6 2.9 0.7 7.6 0.0 0.2 0.8 -26.0 May 3.3 2.3 2.9 4.5 3.1 3.0 -0.2 9.1 -0.2 -0.1 0.5 -23.4 June (p) 3.5 2.3 3.0 5.1 3.2 . -0.4 9.4 -0.4 -0.2 0.3 -66.3
C1 Monetary aggregates 1)
(annual growth rates; seasonally adjusted)
C2 Counterparts 1)
(annual growth rates; seasonally adjusted)
-5
0
5
10
15
20
2000 2002 2004 2006 2008 2010-5
0
5
10
15
20
M1M3
-10
-5
0
5
10
15
20
2000 2002 2004 2006 2008 2010-10
-5
0
5
10
15
20
longer-term financial liabilitiescredit to general governmentloans to other euro area residents
Source: ECB.1) Data refer to the changing composition of the euro area. For further information, see the General Notes.
Monthly and other shorter-term growth rates for selected items are available at: http://www.ecb.europa.eu/stats/money/aggregates/aggr/html/index.en.html2) Monetary liabilities of MFIs and central government (post office, treasury, etc.) vis-à-vis non-MFI euro area residents excluding central government.
For definitions of M1, M2 and M3, see glossary.3) Values in the section ‘‘growth rates’’ are sums of the transactions during the 12 months ending in the period indicated.4) Adjustment for the derecognition of loans on the MFI balance sheet on account of their sale or securitisation.
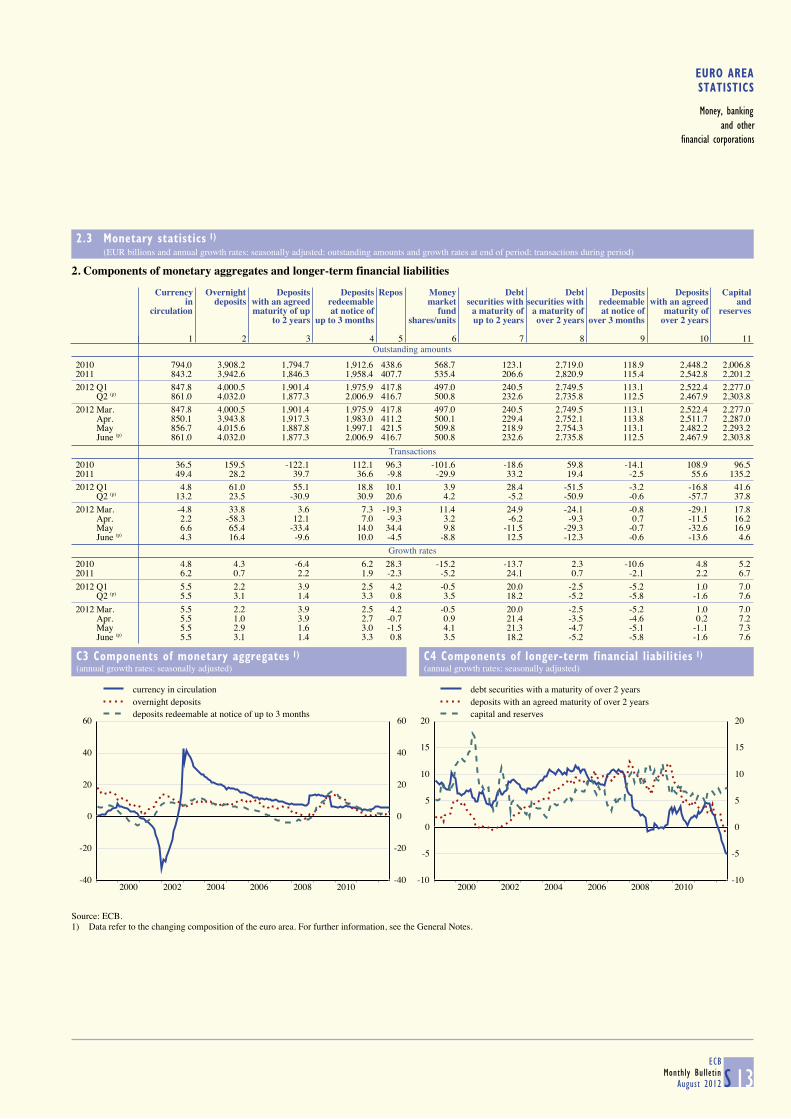
EURO AREASTATISTICS
Money, bankingand other
financial corporations
2.3 Monetary statistics 1) (EUR billions and annual growth rates; seasonally adjusted; outstanding amounts and growth rates at end of period; transactions during period)
S 13ECB
Monthly BulletinAugust 2012
2. Components of monetary aggregates and longer-term financial liabilities
Outstanding amounts
Currency Overnight Deposits Deposits Repos Money Debt Debt Deposits Deposits Capitalin deposits with an agreed redeemable market securities with securities with redeemable with an agreed and
circulation maturity of up at notice of fund a maturity of a maturity of at notice of maturity of reservesto 2 years up to 3 months shares/units up to 2 years over 2 years over 3 months over 2 years
1 2 3 4 5 6 7 8 9 10 11
2010 794.0 3,908.2 1,794.7 1,912.6 438.6 568.7 123.1 2,719.0 118.9 2,448.2 2,006.82011 843.2 3,942.6 1,846.3 1,958.4 407.7 535.4 206.6 2,820.9 115.4 2,542.8 2,201.2
2012 Q1 847.8 4,000.5 1,901.4 1,975.9 417.8 497.0 240.5 2,749.5 113.1 2,522.4 2,277.0 Q2 (p) 861.0 4,032.0 1,877.3 2,006.9 416.7 500.8 232.6 2,735.8 112.5 2,467.9 2,303.8
2012 Mar. 847.8 4,000.5 1,901.4 1,975.9 417.8 497.0 240.5 2,749.5 113.1 2,522.4 2,277.0 Apr. 850.1 3,943.8 1,917.3 1,983.0 411.2 500.1 229.4 2,752.1 113.8 2,511.7 2,287.0 May 856.7 4,015.6 1,887.8 1,997.1 421.5 509.8 218.9 2,754.3 113.1 2,482.2 2,293.2 June (p) 861.0 4,032.0 1,877.3 2,006.9 416.7 500.8 232.6 2,735.8 112.5 2,467.9 2,303.8
Transactions
2010 36.5 159.5 -122.1 112.1 96.3 -101.6 -18.6 59.8 -14.1 108.9 96.52011 49.4 28.2 39.7 36.6 -9.8 -29.9 33.2 19.4 -2.5 55.6 135.2
2012 Q1 4.8 61.0 55.1 18.8 10.1 3.9 28.4 -51.5 -3.2 -16.8 41.6 Q2 (p) 13.2 23.5 -30.9 30.9 20.6 4.2 -5.2 -50.9 -0.6 -57.7 37.8
2012 Mar. -4.8 33.8 3.6 7.3 -19.3 11.4 24.9 -24.1 -0.8 -29.1 17.8 Apr. 2.2 -58.3 12.1 7.0 -9.3 3.2 -6.2 -9.3 0.7 -11.5 16.2 May 6.6 65.4 -33.4 14.0 34.4 9.8 -11.5 -29.3 -0.7 -32.6 16.9 June (p) 4.3 16.4 -9.6 10.0 -4.5 -8.8 12.5 -12.3 -0.6 -13.6 4.6
Growth rates
2010 4.8 4.3 -6.4 6.2 28.3 -15.2 -13.7 2.3 -10.6 4.8 5.22011 6.2 0.7 2.2 1.9 -2.3 -5.2 24.1 0.7 -2.1 2.2 6.7
2012 Q1 5.5 2.2 3.9 2.5 4.2 -0.5 20.0 -2.5 -5.2 1.0 7.0 Q2 (p) 5.5 3.1 1.4 3.3 0.8 3.5 18.2 -5.2 -5.8 -1.6 7.6
2012 Mar. 5.5 2.2 3.9 2.5 4.2 -0.5 20.0 -2.5 -5.2 1.0 7.0 Apr. 5.5 1.0 3.9 2.7 -0.7 0.9 21.4 -3.5 -4.6 0.2 7.2 May 5.5 2.9 1.6 3.0 -1.5 4.1 21.3 -4.7 -5.1 -1.1 7.3 June (p) 5.5 3.1 1.4 3.3 0.8 3.5 18.2 -5.2 -5.8 -1.6 7.6
C3 Components of monetary aggregates 1)
(annual growth rates; seasonally adjusted)
C4 Components of longer-term financial liabilities 1)
(annual growth rates; seasonally adjusted)
-40
-20
0
20
40
60
2000 2002 2004 2006 2008 2010-40
-20
0
20
40
60
currency in circulationovernight depositsdeposits redeemable at notice of up to 3 months
-10
-5
0
5
10
15
20
2000 2002 2004 2006 2008 2010-10
-5
0
5
10
15
20
debt securities with a maturity of over 2 yearsdeposits with an agreed maturity of over 2 yearscapital and reserves
Source: ECB.1) Data refer to the changing composition of the euro area. For further information, see the General Notes.
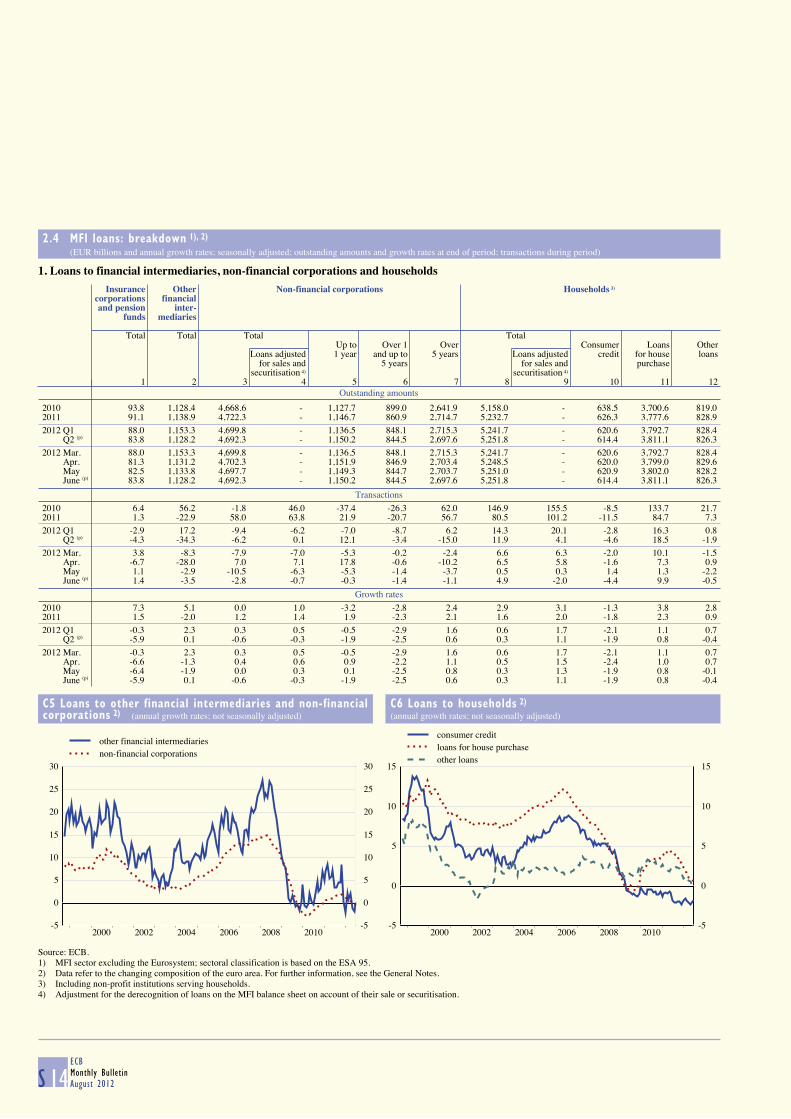
2.4 MFI loans: breakdown 1), 2) (EUR billions and annual growth rates; seasonally adjusted; outstanding amounts and growth rates at end of period; transactions during period)
S 14ECBMonthly BulletinAugust 2012
1. Loans to financial intermediaries, non-financial corporations and households
Outstanding amounts
Insurance Other Non-financial corporations Households 3)
corporations financial and pension inter-
funds mediaries
Total Total Total TotalUp to Over 1 Over Consumer Loans Other
Loans adjusted 1 year and up to 5 years Loans adjusted credit for house loansfor sales and 5 years for sales and purchase
securitisation 4) securitisation 4)
1 2 3 4 5 6 7 8 9 10 11 12
2010 93.8 1,128.4 4,668.6 - 1,127.7 899.0 2,641.9 5,158.0 - 638.5 3,700.6 819.02011 91.1 1,138.9 4,722.3 - 1,146.7 860.9 2,714.7 5,232.7 - 626.3 3,777.6 828.9
2012 Q1 88.0 1,153.3 4,699.8 - 1,136.5 848.1 2,715.3 5,241.7 - 620.6 3,792.7 828.4 Q2 (p) 83.8 1,128.2 4,692.3 - 1,150.2 844.5 2,697.6 5,251.8 - 614.4 3,811.1 826.3
2012 Mar. 88.0 1,153.3 4,699.8 - 1,136.5 848.1 2,715.3 5,241.7 - 620.6 3,792.7 828.4 Apr. 81.3 1,131.2 4,702.3 - 1,151.9 846.9 2,703.4 5,248.5 - 620.0 3,799.0 829.6 May 82.5 1,133.8 4,697.7 - 1,149.3 844.7 2,703.7 5,251.0 - 620.9 3,802.0 828.2 June (p) 83.8 1,128.2 4,692.3 - 1,150.2 844.5 2,697.6 5,251.8 - 614.4 3,811.1 826.3
Transactions
2010 6.4 56.2 -1.8 46.0 -37.4 -26.3 62.0 146.9 155.5 -8.5 133.7 21.72011 1.3 -22.9 58.0 63.8 21.9 -20.7 56.7 80.5 101.2 -11.5 84.7 7.3
2012 Q1 -2.9 17.2 -9.4 -6.2 -7.0 -8.7 6.2 14.3 20.1 -2.8 16.3 0.8 Q2 (p) -4.3 -34.3 -6.2 0.1 12.1 -3.4 -15.0 11.9 4.1 -4.6 18.5 -1.9
2012 Mar. 3.8 -8.3 -7.9 -7.0 -5.3 -0.2 -2.4 6.6 6.3 -2.0 10.1 -1.5 Apr. -6.7 -28.0 7.0 7.1 17.8 -0.6 -10.2 6.5 5.8 -1.6 7.3 0.9 May 1.1 -2.9 -10.5 -6.3 -5.3 -1.4 -3.7 0.5 0.3 1.4 1.3 -2.2 June (p) 1.4 -3.5 -2.8 -0.7 -0.3 -1.4 -1.1 4.9 -2.0 -4.4 9.9 -0.5
Growth rates
2010 7.3 5.1 0.0 1.0 -3.2 -2.8 2.4 2.9 3.1 -1.3 3.8 2.82011 1.5 -2.0 1.2 1.4 1.9 -2.3 2.1 1.6 2.0 -1.8 2.3 0.9
2012 Q1 -0.3 2.3 0.3 0.5 -0.5 -2.9 1.6 0.6 1.7 -2.1 1.1 0.7 Q2 (p) -5.9 0.1 -0.6 -0.3 -1.9 -2.5 0.6 0.3 1.1 -1.9 0.8 -0.4
2012 Mar. -0.3 2.3 0.3 0.5 -0.5 -2.9 1.6 0.6 1.7 -2.1 1.1 0.7 Apr. -6.6 -1.3 0.4 0.6 0.9 -2.2 1.1 0.5 1.5 -2.4 1.0 0.7 May -6.4 -1.9 0.0 0.3 0.1 -2.5 0.8 0.3 1.3 -1.9 0.8 -0.1 June (p) -5.9 0.1 -0.6 -0.3 -1.9 -2.5 0.6 0.3 1.1 -1.9 0.8 -0.4
C5 Loans to other financial intermediaries and non-financial
corporations 2) (annual growth rates; not seasonally adjusted)
C6 Loans to households 2)
(annual growth rates; not seasonally adjusted)
-5
0
5
10
15
20
25
30
2000 2002 2004 2006 2008 2010-5
0
5
10
15
20
25
30
other financial intermediariesnon-financial corporations
-5
0
5
10
15
2000 2002 2004 2006 2008 2010-5
0
5
10
15
consumer creditloans for house purchaseother loans
Source: ECB.1) MFI sector excluding the Eurosystem; sectoral classification is based on the ESA 95.2) Data refer to the changing composition of the euro area. For further information, see the General Notes.3) Including non-profit institutions serving households.4) Adjustment for the derecognition of loans on the MFI balance sheet on account of their sale or securitisation.
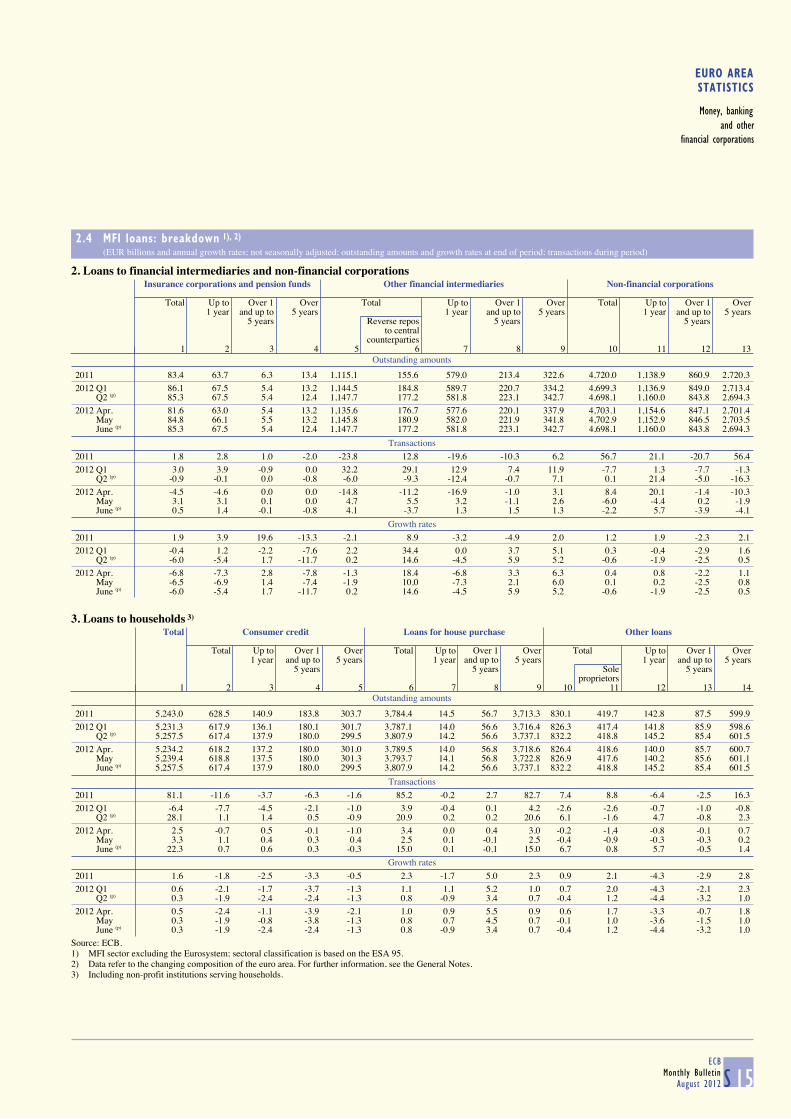
EURO AREASTATISTICS
Money, bankingand other
financial corporations
2.4 MFI loans: breakdown 1), 2) (EUR billions and annual growth rates; not seasonally adjusted; outstanding amounts and growth rates at end of period; transactions during period)
S 15ECB
Monthly BulletinAugust 2012
2. Loans to financial intermediaries and non-financial corporations
Outstanding amounts
Insurance corporations and pension funds Other financial intermediaries Non-financial corporations
Total Up to Over 1 Over Total Up to Over 1 Over Total Up to Over 1 Over
1 year and up to 5 years 1 year and up to 5 years 1 year and up to 5 years5 years Reverse repos 5 years 5 years
to centralcounterparties
1 2 3 4 5 6 7 8 9 10 11 12 13
2011 83.4 63.7 6.3 13.4 1,115.1 155.6 579.0 213.4 322.6 4,720.0 1,138.9 860.9 2,720.3
2012 Q1 86.1 67.5 5.4 13.2 1,144.5 184.8 589.7 220.7 334.2 4,699.3 1,136.9 849.0 2,713.4 Q2 (p) 85.3 67.5 5.4 12.4 1,147.7 177.2 581.8 223.1 342.7 4,698.1 1,160.0 843.8 2,694.3
2012 Apr. 81.6 63.0 5.4 13.2 1,135.6 176.7 577.6 220.1 337.9 4,703.1 1,154.6 847.1 2,701.4 May 84.8 66.1 5.5 13.2 1,145.8 180.9 582.0 221.9 341.8 4,702.9 1,152.9 846.5 2,703.5 June (p) 85.3 67.5 5.4 12.4 1,147.7 177.2 581.8 223.1 342.7 4,698.1 1,160.0 843.8 2,694.3
Transactions
2011 1.8 2.8 1.0 -2.0 -23.8 12.8 -19.6 -10.3 6.2 56.7 21.1 -20.7 56.4
2012 Q1 3.0 3.9 -0.9 0.0 32.2 29.1 12.9 7.4 11.9 -7.7 1.3 -7.7 -1.3 Q2 (p) -0.9 -0.1 0.0 -0.8 -6.0 -9.3 -12.4 -0.7 7.1 0.1 21.4 -5.0 -16.3
2012 Apr. -4.5 -4.6 0.0 0.0 -14.8 -11.2 -16.9 -1.0 3.1 8.4 20.1 -1.4 -10.3 May 3.1 3.1 0.1 0.0 4.7 5.5 3.2 -1.1 2.6 -6.0 -4.4 0.2 -1.9 June (p) 0.5 1.4 -0.1 -0.8 4.1 -3.7 1.3 1.5 1.3 -2.2 5.7 -3.9 -4.1
Growth rates
2011 1.9 3.9 19.6 -13.3 -2.1 8.9 -3.2 -4.9 2.0 1.2 1.9 -2.3 2.1
2012 Q1 -0.4 1.2 -2.2 -7.6 2.2 34.4 0.0 3.7 5.1 0.3 -0.4 -2.9 1.6 Q2 (p) -6.0 -5.4 1.7 -11.7 0.2 14.6 -4.5 5.9 5.2 -0.6 -1.9 -2.5 0.5
2012 Apr. -6.8 -7.3 2.8 -7.8 -1.3 18.4 -6.8 3.3 6.3 0.4 0.8 -2.2 1.1 May -6.5 -6.9 1.4 -7.4 -1.9 10.0 -7.3 2.1 6.0 0.1 0.2 -2.5 0.8 June (p) -6.0 -5.4 1.7 -11.7 0.2 14.6 -4.5 5.9 5.2 -0.6 -1.9 -2.5 0.5
3. Loans to households 3)
Outstanding amounts
Total Consumer credit Loans for house purchase Other loans
Total Up to Over 1 Over Total Up to Over 1 Over Total Up to Over 1 Over
1 year and up to 5 years 1 year and up to 5 years 1 year and up to 5 years5 years 5 years Sole 5 years
proprietors1 2 3 4 5 6 7 8 9 10 11 12 13 14
2011 5,243.0 628.5 140.9 183.8 303.7 3,784.4 14.5 56.7 3,713.3 830.1 419.7 142.8 87.5 599.9
2012 Q1 5,231.3 617.9 136.1 180.1 301.7 3,787.1 14.0 56.6 3,716.4 826.3 417.4 141.8 85.9 598.6 Q2 (p) 5,257.5 617.4 137.9 180.0 299.5 3,807.9 14.2 56.6 3,737.1 832.2 418.8 145.2 85.4 601.5
2012 Apr. 5,234.2 618.2 137.2 180.0 301.0 3,789.5 14.0 56.8 3,718.6 826.4 418.6 140.0 85.7 600.7 May 5,239.4 618.8 137.5 180.0 301.3 3,793.7 14.1 56.8 3,722.8 826.9 417.6 140.2 85.6 601.1 June (p) 5,257.5 617.4 137.9 180.0 299.5 3,807.9 14.2 56.6 3,737.1 832.2 418.8 145.2 85.4 601.5
Transactions
2011 81.1 -11.6 -3.7 -6.3 -1.6 85.2 -0.2 2.7 82.7 7.4 8.8 -6.4 -2.5 16.3
2012 Q1 -6.4 -7.7 -4.5 -2.1 -1.0 3.9 -0.4 0.1 4.2 -2.6 -2.6 -0.7 -1.0 -0.8 Q2 (p) 28.1 1.1 1.4 0.5 -0.9 20.9 0.2 0.2 20.6 6.1 -1.6 4.7 -0.8 2.3
2012 Apr. 2.5 -0.7 0.5 -0.1 -1.0 3.4 0.0 0.4 3.0 -0.2 -1.4 -0.8 -0.1 0.7 May 3.3 1.1 0.4 0.3 0.4 2.5 0.1 -0.1 2.5 -0.4 -0.9 -0.3 -0.3 0.2 June (p) 22.3 0.7 0.6 0.3 -0.3 15.0 0.1 -0.1 15.0 6.7 0.8 5.7 -0.5 1.4
Growth rates
2011 1.6 -1.8 -2.5 -3.3 -0.5 2.3 -1.7 5.0 2.3 0.9 2.1 -4.3 -2.9 2.8
2012 Q1 0.6 -2.1 -1.7 -3.7 -1.3 1.1 1.1 5.2 1.0 0.7 2.0 -4.3 -2.1 2.3 Q2 (p) 0.3 -1.9 -2.4 -2.4 -1.3 0.8 -0.9 3.4 0.7 -0.4 1.2 -4.4 -3.2 1.0
2012 Apr. 0.5 -2.4 -1.1 -3.9 -2.1 1.0 0.9 5.5 0.9 0.6 1.7 -3.3 -0.7 1.8 May 0.3 -1.9 -0.8 -3.8 -1.3 0.8 0.7 4.5 0.7 -0.1 1.0 -3.6 -1.5 1.0 June (p) 0.3 -1.9 -2.4 -2.4 -1.3 0.8 -0.9 3.4 0.7 -0.4 1.2 -4.4 -3.2 1.0
Source: ECB.1) MFI sector excluding the Eurosystem; sectoral classification is based on the ESA 95.2) Data refer to the changing composition of the euro area. For further information, see the General Notes.3) Including non-profit institutions serving households.
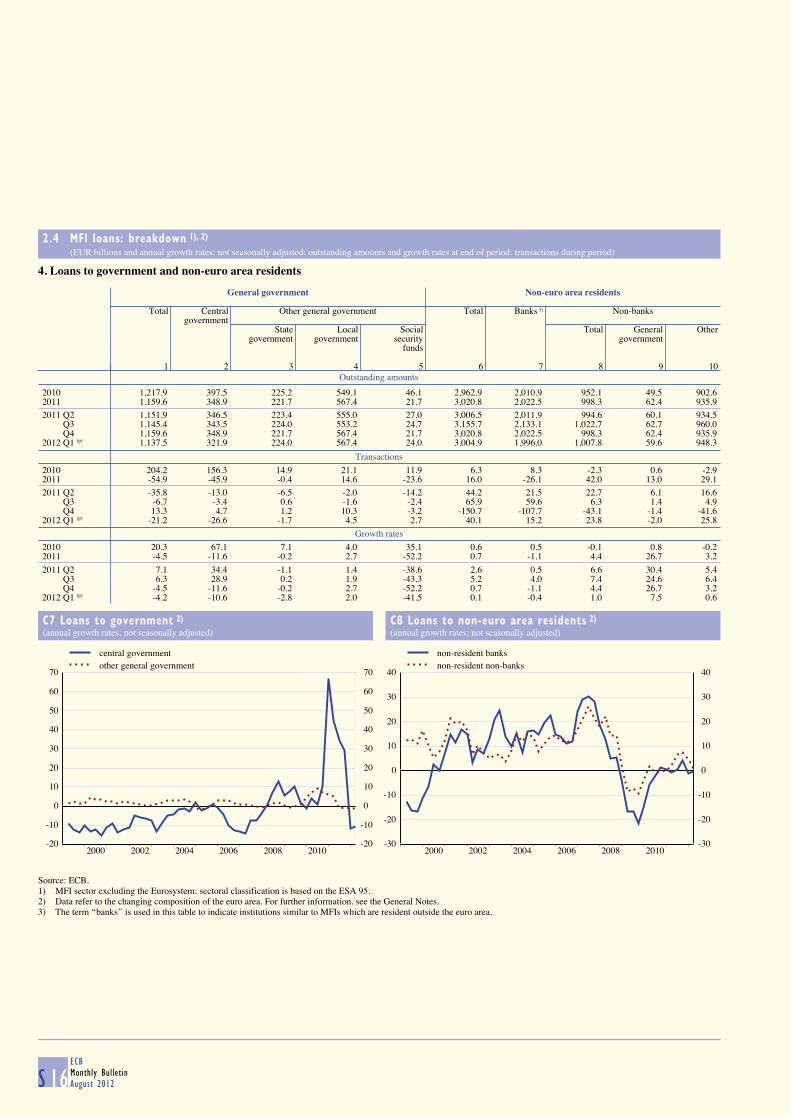
2.4 MFI loans: breakdown 1), 2) (EUR billions and annual growth rates; not seasonally adjusted; outstanding amounts and growth rates at end of period; transactions during period)
S 16ECBMonthly BulletinAugust 2012
4. Loans to government and non-euro area residents
Outstanding amounts
General government Non-euro area residents
Total Central Other general government Total Banks 3) Non-banks
governmentState Local Social Total General Other
government government security governmentfunds
1 2 3 4 5 6 7 8 9 10
2010 1,217.9 397.5 225.2 549.1 46.1 2,962.9 2,010.9 952.1 49.5 902.62011 1,159.6 348.9 221.7 567.4 21.7 3,020.8 2,022.5 998.3 62.4 935.9
2011 Q2 1,151.9 346.5 223.4 555.0 27.0 3,006.5 2,011.9 994.6 60.1 934.5 Q3 1,145.4 343.5 224.0 553.2 24.7 3,155.7 2,133.1 1,022.7 62.7 960.0 Q4 1,159.6 348.9 221.7 567.4 21.7 3,020.8 2,022.5 998.3 62.4 935.92012 Q1 (p) 1,137.5 321.9 224.0 567.4 24.0 3,004.9 1,996.0 1,007.8 59.6 948.3
Transactions
2010 204.2 156.3 14.9 21.1 11.9 6.3 8.3 -2.3 0.6 -2.92011 -54.9 -45.9 -0.4 14.6 -23.6 16.0 -26.1 42.0 13.0 29.1
2011 Q2 -35.8 -13.0 -6.5 -2.0 -14.2 44.2 21.5 22.7 6.1 16.6 Q3 -6.7 -3.4 0.6 -1.6 -2.4 65.9 59.6 6.3 1.4 4.9 Q4 13.3 4.7 1.2 10.3 -3.2 -150.7 -107.7 -43.1 -1.4 -41.62012 Q1 (p) -21.2 -26.6 -1.7 4.5 2.7 40.1 15.2 23.8 -2.0 25.8
Growth rates
2010 20.3 67.1 7.1 4.0 35.1 0.6 0.5 -0.1 0.8 -0.22011 -4.5 -11.6 -0.2 2.7 -52.2 0.7 -1.1 4.4 26.7 3.2
2011 Q2 7.1 34.4 -1.1 1.4 -38.6 2.6 0.5 6.6 30.4 5.4 Q3 6.3 28.9 0.2 1.9 -43.3 5.2 4.0 7.4 24.6 6.4 Q4 -4.5 -11.6 -0.2 2.7 -52.2 0.7 -1.1 4.4 26.7 3.22012 Q1 (p) -4.2 -10.6 -2.8 2.0 -41.5 0.1 -0.4 1.0 7.5 0.6
C7 Loans to government 2)
(annual growth rates; not seasonally adjusted)
C8 Loans to non-euro area residents 2)
(annual growth rates; not seasonally adjusted)
-20
-10
0
10
20
30
40
50
60
70
2000 2002 2004 2006 2008 2010-20
-10
0
10
20
30
40
50
60
70
central governmentother general government
-30
-20
-10
0
10
20
30
40
2000 2002 2004 2006 2008 2010-30
-20
-10
0
10
20
30
40
non-resident banksnon-resident non-banks
Source: ECB.1) MFI sector excluding the Eurosystem; sectoral classification is based on the ESA 95.2) Data refer to the changing composition of the euro area. For further information, see the General Notes.3) The term ‘‘banks’’ is used in this table to indicate institutions similar to MFIs which are resident outside the euro area.
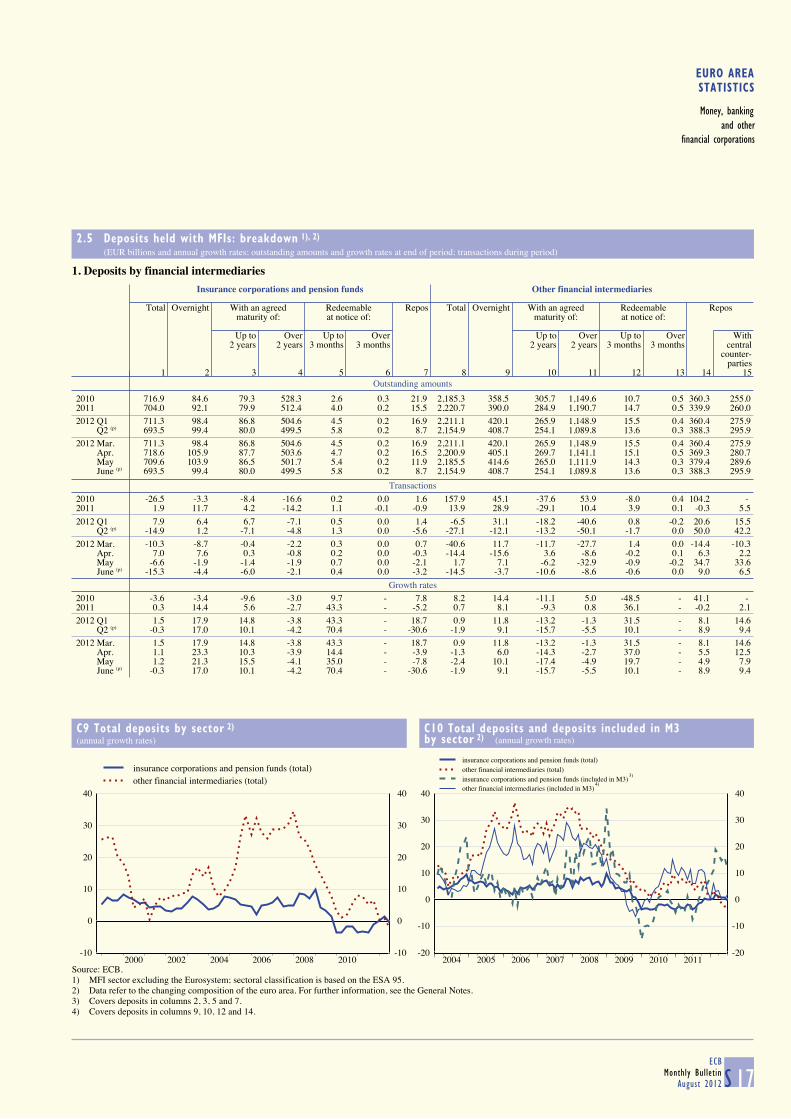
EURO AREASTATISTICS
Money, bankingand other
financial corporations
2.5 Deposits held with MFIs: breakdown 1), 2) (EUR billions and annual growth rates; outstanding amounts and growth rates at end of period; transactions during period)
S 17ECB
Monthly BulletinAugust 2012
1. Deposits by financial intermediaries
Outstanding amounts
Insurance corporations and pension funds Other financial intermediaries
Total Overnight With an agreed Redeemable Repos Total Overnight With an agreed Redeemable Repos
maturity of: at notice of: maturity of: at notice of:
Up to Over Up to Over Up to Over Up to Over With2 years 2 years 3 months 3 months 2 years 2 years 3 months 3 months central
counter-parties
1 2 3 4 5 6 7 8 9 10 11 12 13 14 15
2010 716.9 84.6 79.3 528.3 2.6 0.3 21.9 2,185.3 358.5 305.7 1,149.6 10.7 0.5 360.3 255.02011 704.0 92.1 79.9 512.4 4.0 0.2 15.5 2,220.7 390.0 284.9 1,190.7 14.7 0.5 339.9 260.0
2012 Q1 711.3 98.4 86.8 504.6 4.5 0.2 16.9 2,211.1 420.1 265.9 1,148.9 15.5 0.4 360.4 275.9 Q2 (p) 693.5 99.4 80.0 499.5 5.8 0.2 8.7 2,154.9 408.7 254.1 1,089.8 13.6 0.3 388.3 295.9
2012 Mar. 711.3 98.4 86.8 504.6 4.5 0.2 16.9 2,211.1 420.1 265.9 1,148.9 15.5 0.4 360.4 275.9 Apr. 718.6 105.9 87.7 503.6 4.7 0.2 16.5 2,200.9 405.1 269.7 1,141.1 15.1 0.5 369.3 280.7 May 709.6 103.9 86.5 501.7 5.4 0.2 11.9 2,185.5 414.6 265.0 1,111.9 14.3 0.3 379.4 289.6 June (p) 693.5 99.4 80.0 499.5 5.8 0.2 8.7 2,154.9 408.7 254.1 1,089.8 13.6 0.3 388.3 295.9
Transactions
2010 -26.5 -3.3 -8.4 -16.6 0.2 0.0 1.6 157.9 45.1 -37.6 53.9 -8.0 0.4 104.2 - 2011 1.9 11.7 4.2 -14.2 1.1 -0.1 -0.9 13.9 28.9 -29.1 10.4 3.9 0.1 -0.3 5.5
2012 Q1 7.9 6.4 6.7 -7.1 0.5 0.0 1.4 -6.5 31.1 -18.2 -40.6 0.8 -0.2 20.6 15.5 Q2 (p) -14.9 1.2 -7.1 -4.8 1.3 0.0 -5.6 -27.1 -12.1 -13.2 -50.1 -1.7 0.0 50.0 42.2
2012 Mar. -10.3 -8.7 -0.4 -2.2 0.3 0.0 0.7 -40.6 11.7 -11.7 -27.7 1.4 0.0 -14.4 -10.3 Apr. 7.0 7.6 0.3 -0.8 0.2 0.0 -0.3 -14.4 -15.6 3.6 -8.6 -0.2 0.1 6.3 2.2 May -6.6 -1.9 -1.4 -1.9 0.7 0.0 -2.1 1.7 7.1 -6.2 -32.9 -0.9 -0.2 34.7 33.6 June (p) -15.3 -4.4 -6.0 -2.1 0.4 0.0 -3.2 -14.5 -3.7 -10.6 -8.6 -0.6 0.0 9.0 6.5
Growth rates
2010 -3.6 -3.4 -9.6 -3.0 9.7 - 7.8 8.2 14.4 -11.1 5.0 -48.5 - 41.1 - 2011 0.3 14.4 5.6 -2.7 43.3 - -5.2 0.7 8.1 -9.3 0.8 36.1 - -0.2 2.1
2012 Q1 1.5 17.9 14.8 -3.8 43.3 - 18.7 0.9 11.8 -13.2 -1.3 31.5 - 8.1 14.6 Q2 (p) -0.3 17.0 10.1 -4.2 70.4 - -30.6 -1.9 9.1 -15.7 -5.5 10.1 - 8.9 9.4
2012 Mar. 1.5 17.9 14.8 -3.8 43.3 - 18.7 0.9 11.8 -13.2 -1.3 31.5 - 8.1 14.6 Apr. 1.1 23.3 10.3 -3.9 14.4 - -3.9 -1.3 6.0 -14.3 -2.7 37.0 - 5.5 12.5 May 1.2 21.3 15.5 -4.1 35.0 - -7.8 -2.4 10.1 -17.4 -4.9 19.7 - 4.9 7.9 June (p) -0.3 17.0 10.1 -4.2 70.4 - -30.6 -1.9 9.1 -15.7 -5.5 10.1 - 8.9 9.4
C9 Total deposits by sector 2)
(annual growth rates)
C10 Total deposits and deposits included in M3
by sector 2) (annual growth rates)
-10
0
10
20
30
40
2000 2002 2004 2006 2008 2010-10
0
10
20
30
40
insurance corporations and pension funds (total)other financial intermediaries (total)
-20
-10
0
10
20
30
40
2004 2005 2006 2007 2008 2009 2010 2011-20
-10
0
10
20
30
40
insurance corporations and pension funds (total)other financial intermediaries (total)insurance corporations and pension funds (included in M3)other financial intermediaries (included in M3)
Source: ECB.1) MFI sector excluding the Eurosystem; sectoral classification is based on the ESA 95.2) Data refer to the changing composition of the euro area. For further information, see the General Notes.3) Covers deposits in columns 2, 3, 5 and 7.4) Covers deposits in columns 9, 10, 12 and 14.
3)
4)
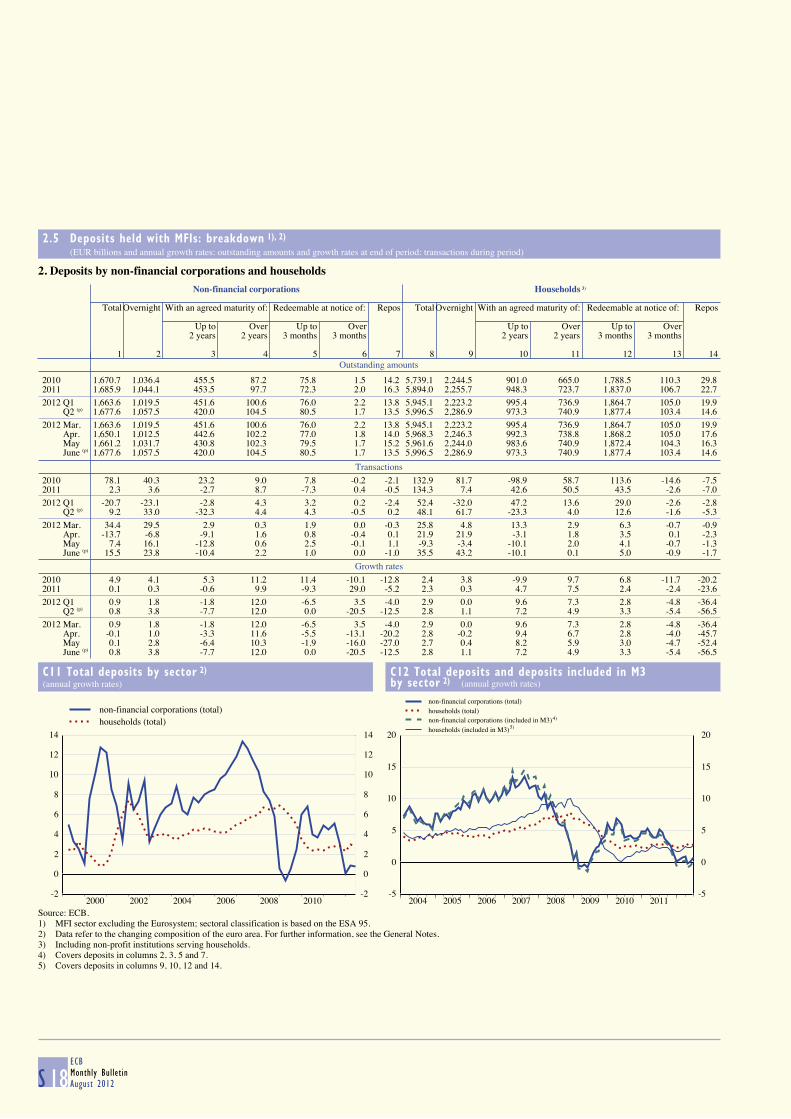
2.5 Deposits held with MFIs: breakdown 1), 2) (EUR billions and annual growth rates; outstanding amounts and growth rates at end of period; transactions during period)
S 18ECBMonthly BulletinAugust 2012
2. Deposits by non-financial corporations and households
Outstanding amounts
Non-financial corporations Households 3)
TotalOvernight With an agreed maturity of: Redeemable at notice of: Repos TotalOvernight With an agreed maturity of: Redeemable at notice of: Repos
Up to Over Up to Over Up to Over Up to Over2 years 2 years 3 months 3 months 2 years 2 years 3 months 3 months
1 2 3 4 5 6 7 8 9 10 11 12 13 14
2010 1,670.7 1,036.4 455.5 87.2 75.8 1.5 14.2 5,739.1 2,244.5 901.0 665.0 1,788.5 110.3 29.82011 1,685.9 1,044.1 453.5 97.7 72.3 2.0 16.3 5,894.0 2,255.7 948.3 723.7 1,837.0 106.7 22.7
2012 Q1 1,663.6 1,019.5 451.6 100.6 76.0 2.2 13.8 5,945.1 2,223.2 995.4 736.9 1,864.7 105.0 19.9 Q2 (p) 1,677.6 1,057.5 420.0 104.5 80.5 1.7 13.5 5,996.5 2,286.9 973.3 740.9 1,877.4 103.4 14.6
2012 Mar. 1,663.6 1,019.5 451.6 100.6 76.0 2.2 13.8 5,945.1 2,223.2 995.4 736.9 1,864.7 105.0 19.9 Apr. 1,650.1 1,012.5 442.6 102.2 77.0 1.8 14.0 5,968.3 2,246.3 992.3 738.8 1,868.2 105.0 17.6 May 1,661.2 1,031.7 430.8 102.3 79.5 1.7 15.2 5,961.6 2,244.0 983.6 740.9 1,872.4 104.3 16.3 June (p) 1,677.6 1,057.5 420.0 104.5 80.5 1.7 13.5 5,996.5 2,286.9 973.3 740.9 1,877.4 103.4 14.6
Transactions
2010 78.1 40.3 23.2 9.0 7.8 -0.2 -2.1 132.9 81.7 -98.9 58.7 113.6 -14.6 -7.52011 2.3 3.6 -2.7 8.7 -7.3 0.4 -0.5 134.3 7.4 42.6 50.5 43.5 -2.6 -7.0
2012 Q1 -20.7 -23.1 -2.8 4.3 3.2 0.2 -2.4 52.4 -32.0 47.2 13.6 29.0 -2.6 -2.8 Q2 (p) 9.2 33.0 -32.3 4.4 4.3 -0.5 0.2 48.1 61.7 -23.3 4.0 12.6 -1.6 -5.3
2012 Mar. 34.4 29.5 2.9 0.3 1.9 0.0 -0.3 25.8 4.8 13.3 2.9 6.3 -0.7 -0.9 Apr. -13.7 -6.8 -9.1 1.6 0.8 -0.4 0.1 21.9 21.9 -3.1 1.8 3.5 0.1 -2.3 May 7.4 16.1 -12.8 0.6 2.5 -0.1 1.1 -9.3 -3.4 -10.1 2.0 4.1 -0.7 -1.3 June (p) 15.5 23.8 -10.4 2.2 1.0 0.0 -1.0 35.5 43.2 -10.1 0.1 5.0 -0.9 -1.7
Growth rates
2010 4.9 4.1 5.3 11.2 11.4 -10.1 -12.8 2.4 3.8 -9.9 9.7 6.8 -11.7 -20.22011 0.1 0.3 -0.6 9.9 -9.3 29.0 -5.2 2.3 0.3 4.7 7.5 2.4 -2.4 -23.6
2012 Q1 0.9 1.8 -1.8 12.0 -6.5 3.5 -4.0 2.9 0.0 9.6 7.3 2.8 -4.8 -36.4 Q2 (p) 0.8 3.8 -7.7 12.0 0.0 -20.5 -12.5 2.8 1.1 7.2 4.9 3.3 -5.4 -56.5
2012 Mar. 0.9 1.8 -1.8 12.0 -6.5 3.5 -4.0 2.9 0.0 9.6 7.3 2.8 -4.8 -36.4 Apr. -0.1 1.0 -3.3 11.6 -5.5 -13.1 -20.2 2.8 -0.2 9.4 6.7 2.8 -4.0 -45.7 May 0.1 2.8 -6.4 10.3 -1.9 -16.0 -27.0 2.7 0.4 8.2 5.9 3.0 -4.7 -52.4 June (p) 0.8 3.8 -7.7 12.0 0.0 -20.5 -12.5 2.8 1.1 7.2 4.9 3.3 -5.4 -56.5
C11 Total deposits by sector 2)
(annual growth rates)
C12 Total deposits and deposits included in M3
by sector 2) (annual growth rates)
-2
0
2
4
6
8
10
12
14
2000 2002 2004 2006 2008 2010-2
0
2
4
6
8
10
12
14
non-financial corporations (total)households (total)
-5
0
5
10
15
20
2004 2005 2006 2007 2008 2009 2010 2011-5
0
5
10
15
20
non-financial corporations (total)households (total)non-financial corporations (included in M3)households (included in M3)
Source: ECB.1) MFI sector excluding the Eurosystem; sectoral classification is based on the ESA 95.2) Data refer to the changing composition of the euro area. For further information, see the General Notes.3) Including non-profit institutions serving households.4) Covers deposits in columns 2, 3, 5 and 7.5) Covers deposits in columns 9, 10, 12 and 14.
4)
5)
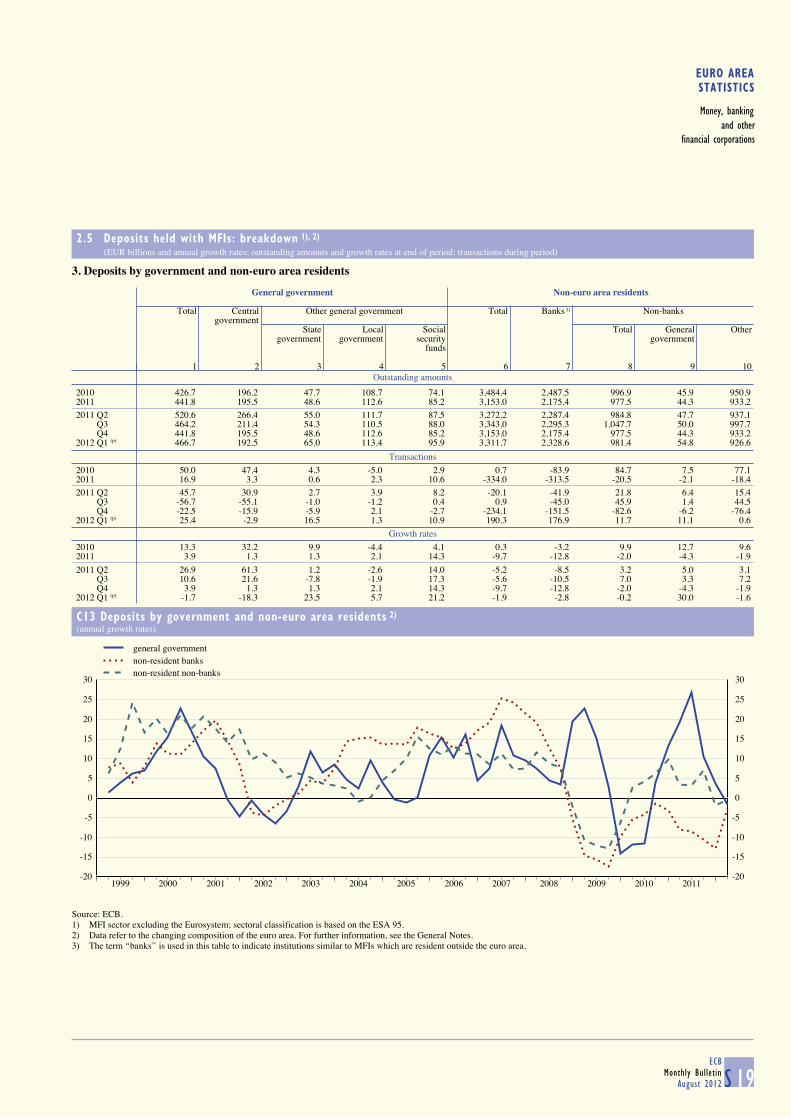
EURO AREASTATISTICS
Money, bankingand other
financial corporations
2.5 Deposits held with MFIs: breakdown 1), 2) (EUR billions and annual growth rates; outstanding amounts and growth rates at end of period; transactions during period)
S 19ECB
Monthly BulletinAugust 2012
3. Deposits by government and non-euro area residents
Outstanding amounts
General government Non-euro area residents
Total Central Other general government Total Banks 3) Non-banks
governmentState Local Social Total General Other
government government security governmentfunds
1 2 3 4 5 6 7 8 9 10
2010 426.7 196.2 47.7 108.7 74.1 3,484.4 2,487.5 996.9 45.9 950.92011 441.8 195.5 48.6 112.6 85.2 3,153.0 2,175.4 977.5 44.3 933.2
2011 Q2 520.6 266.4 55.0 111.7 87.5 3,272.2 2,287.4 984.8 47.7 937.1 Q3 464.2 211.4 54.3 110.5 88.0 3,343.0 2,295.3 1,047.7 50.0 997.7 Q4 441.8 195.5 48.6 112.6 85.2 3,153.0 2,175.4 977.5 44.3 933.22012 Q1 (p) 466.7 192.5 65.0 113.4 95.9 3,311.7 2,328.6 981.4 54.8 926.6
Transactions
2010 50.0 47.4 4.3 -5.0 2.9 0.7 -83.9 84.7 7.5 77.12011 16.9 3.3 0.6 2.3 10.6 -334.0 -313.5 -20.5 -2.1 -18.4
2011 Q2 45.7 30.9 2.7 3.9 8.2 -20.1 -41.9 21.8 6.4 15.4 Q3 -56.7 -55.1 -1.0 -1.2 0.4 0.9 -45.0 45.9 1.4 44.5 Q4 -22.5 -15.9 -5.9 2.1 -2.7 -234.1 -151.5 -82.6 -6.2 -76.42012 Q1 (p) 25.4 -2.9 16.5 1.3 10.9 190.3 176.9 11.7 11.1 0.6
Growth rates
2010 13.3 32.2 9.9 -4.4 4.1 0.3 -3.2 9.9 12.7 9.62011 3.9 1.3 1.3 2.1 14.3 -9.7 -12.8 -2.0 -4.3 -1.9
2011 Q2 26.9 61.3 1.2 -2.6 14.0 -5.2 -8.5 3.2 5.0 3.1 Q3 10.6 21.6 -7.8 -1.9 17.3 -5.6 -10.5 7.0 3.3 7.2 Q4 3.9 1.3 1.3 2.1 14.3 -9.7 -12.8 -2.0 -4.3 -1.92012 Q1 (p) -1.7 -18.3 23.5 5.7 21.2 -1.9 -2.8 -0.2 30.0 -1.6
C13 Deposits by government and non-euro area residents 2)
(annual growth rates)
-20
-15
-10
-5
0
5
10
15
20
25
30
1999 2000 2001 2002 2003 2004 2005 2006 2007 2008 2009 2010 2011-20
-15
-10
-5
0
5
10
15
20
25
30
general governmentnon-resident banksnon-resident non-banks
Source: ECB.1) MFI sector excluding the Eurosystem; sectoral classification is based on the ESA 95.2) Data refer to the changing composition of the euro area. For further information, see the General Notes.3) The term ‘‘banks’’ is used in this table to indicate institutions similar to MFIs which are resident outside the euro area.
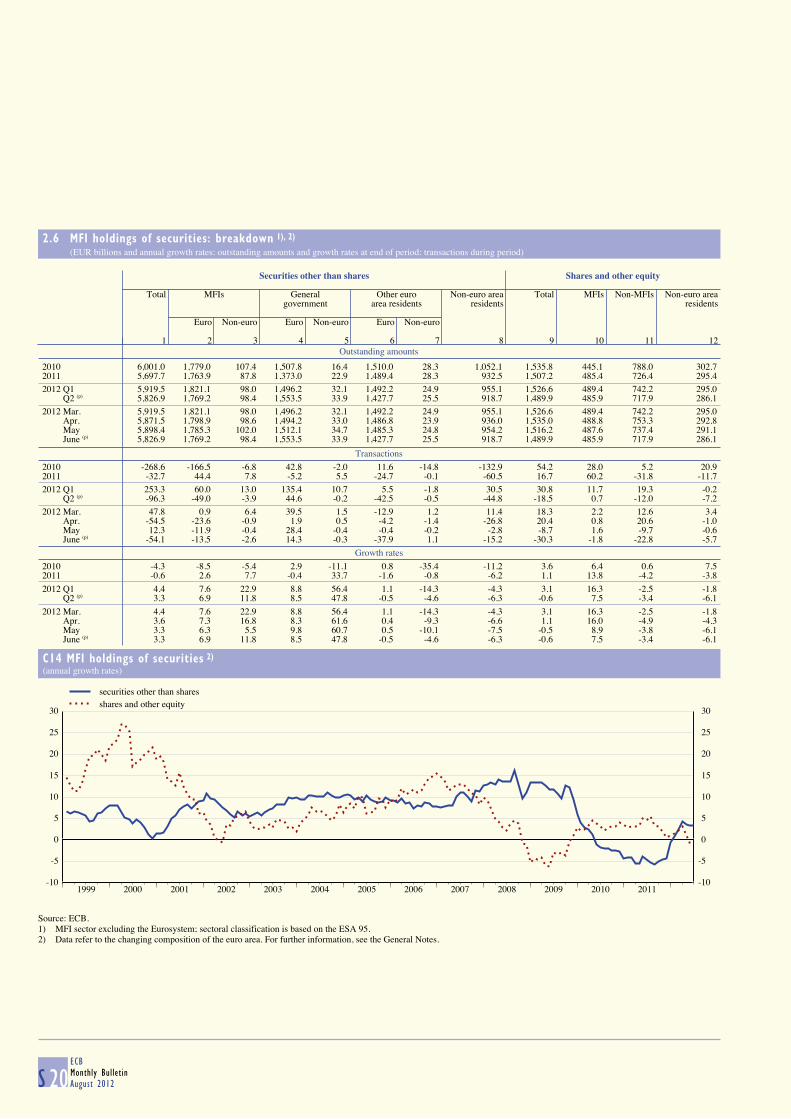
2.6 MFI holdings of securities: breakdown 1), 2) (EUR billions and annual growth rates; outstanding amounts and growth rates at end of period; transactions during period)
S 20ECBMonthly BulletinAugust 2012
Outstanding amounts
Securities other than shares Shares and other equity
Total MFIs General Other euro Non-euro area Total MFIs Non-MFIs Non-euro area
government area residents residents residents
Euro Non-euro Euro Non-euro Euro Non-euro
1 2 3 4 5 6 7 8 9 10 11 12
2010 6,001.0 1,779.0 107.4 1,507.8 16.4 1,510.0 28.3 1,052.1 1,535.8 445.1 788.0 302.72011 5,697.7 1,763.9 87.8 1,373.0 22.9 1,489.4 28.3 932.5 1,507.2 485.4 726.4 295.4
2012 Q1 5,919.5 1,821.1 98.0 1,496.2 32.1 1,492.2 24.9 955.1 1,526.6 489.4 742.2 295.0 Q2 (p) 5,826.9 1,769.2 98.4 1,553.5 33.9 1,427.7 25.5 918.7 1,489.9 485.9 717.9 286.1
2012 Mar. 5,919.5 1,821.1 98.0 1,496.2 32.1 1,492.2 24.9 955.1 1,526.6 489.4 742.2 295.0 Apr. 5,871.5 1,798.9 98.6 1,494.2 33.0 1,486.8 23.9 936.0 1,535.0 488.8 753.3 292.8 May 5,898.4 1,785.3 102.0 1,512.1 34.7 1,485.3 24.8 954.2 1,516.2 487.6 737.4 291.1 June (p) 5,826.9 1,769.2 98.4 1,553.5 33.9 1,427.7 25.5 918.7 1,489.9 485.9 717.9 286.1
Transactions
2010 -268.6 -166.5 -6.8 42.8 -2.0 11.6 -14.8 -132.9 54.2 28.0 5.2 20.92011 -32.7 44.4 7.8 -5.2 5.5 -24.7 -0.1 -60.5 16.7 60.2 -31.8 -11.7
2012 Q1 253.3 60.0 13.0 135.4 10.7 5.5 -1.8 30.5 30.8 11.7 19.3 -0.2 Q2 (p) -96.3 -49.0 -3.9 44.6 -0.2 -42.5 -0.5 -44.8 -18.5 0.7 -12.0 -7.2
2012 Mar. 47.8 0.9 6.4 39.5 1.5 -12.9 1.2 11.4 18.3 2.2 12.6 3.4 Apr. -54.5 -23.6 -0.9 1.9 0.5 -4.2 -1.4 -26.8 20.4 0.8 20.6 -1.0 May 12.3 -11.9 -0.4 28.4 -0.4 -0.4 -0.2 -2.8 -8.7 1.6 -9.7 -0.6 June (p) -54.1 -13.5 -2.6 14.3 -0.3 -37.9 1.1 -15.2 -30.3 -1.8 -22.8 -5.7
Growth rates
2010 -4.3 -8.5 -5.4 2.9 -11.1 0.8 -35.4 -11.2 3.6 6.4 0.6 7.52011 -0.6 2.6 7.7 -0.4 33.7 -1.6 -0.8 -6.2 1.1 13.8 -4.2 -3.8
2012 Q1 4.4 7.6 22.9 8.8 56.4 1.1 -14.3 -4.3 3.1 16.3 -2.5 -1.8 Q2 (p) 3.3 6.9 11.8 8.5 47.8 -0.5 -4.6 -6.3 -0.6 7.5 -3.4 -6.1
2012 Mar. 4.4 7.6 22.9 8.8 56.4 1.1 -14.3 -4.3 3.1 16.3 -2.5 -1.8 Apr. 3.6 7.3 16.8 8.3 61.6 0.4 -9.3 -6.6 1.1 16.0 -4.9 -4.3 May 3.3 6.3 5.5 9.8 60.7 0.5 -10.1 -7.5 -0.5 8.9 -3.8 -6.1 June (p) 3.3 6.9 11.8 8.5 47.8 -0.5 -4.6 -6.3 -0.6 7.5 -3.4 -6.1
C14 MFI holdings of securities 2)
(annual growth rates)
-10
-5
0
5
10
15
20
25
30
1999 2000 2001 2002 2003 2004 2005 2006 2007 2008 2009 2010 2011-10
-5
0
5
10
15
20
25
30
securities other than sharesshares and other equity
Source: ECB.1) MFI sector excluding the Eurosystem; sectoral classification is based on the ESA 95.2) Data refer to the changing composition of the euro area. For further information, see the General Notes.

EURO AREASTATISTICS
Money, bankingand other
financial corporations
2.7 Currency breakdown of selected MFI balance sheet items 1), 2) (percentages of total; outstanding amounts in EUR billions; end of period)
S 21ECB
Monthly BulletinAugust 2012
1. Loans, holdings of securities other than shares, and deposits
Loans
MFIs 3) Non-MFIs
All Euro 4) Non-euro currencies All Euro 4) Non-euro currencies
currencies currencies (outstanding Total (outstanding Total
amount) amount)USD JPY CHF GBP USD JPY CHF GBP
1 2 3 4 5 6 7 8 9 10 11 12 13 14
To euro area residents
2010 5,517.3 - - - - - - 12,244.0 96.0 4.0 2.1 0.2 1.1 0.42011 6,160.7 - - - - - - 12,321.1 96.2 3.8 1.9 0.3 1.1 0.4
2011 Q4 6,160.7 - - - - - - 12,321.1 96.2 3.8 1.9 0.3 1.1 0.42012 Q1 (p) 6,330.9 - - - - - - 12,298.7 96.3 3.7 1.8 0.2 1.1 0.4
To non-euro area residents
2010 2,010.9 44.9 55.1 30.7 2.9 3.2 11.6 952.1 39.9 60.1 42.8 1.4 3.7 6.72011 2,022.5 44.5 55.5 35.6 2.5 2.7 9.3 998.3 38.2 61.8 41.2 2.6 3.3 7.8
2011 Q4 2,022.5 44.5 55.5 35.6 2.5 2.7 9.3 998.3 38.2 61.8 41.2 2.6 3.3 7.82012 Q1 (p) 1,996.0 47.9 52.1 32.9 2.5 2.6 8.5 1,007.8 39.1 60.9 41.0 2.4 3.1 7.6
Holdings of securities other than shares
Issued by euro area residents
2010 1,886.4 94.3 5.7 3.3 0.1 0.3 1.7 3,062.5 98.5 1.5 0.8 0.1 0.1 0.42011 1,851.7 95.3 4.7 2.5 0.1 0.3 1.5 2,913.5 98.2 1.8 1.0 0.2 0.1 0.4
2011 Q4 1,851.7 95.3 4.7 2.5 0.1 0.3 1.5 2,913.5 98.2 1.8 1.0 0.2 0.1 0.42012 Q1 (p) 1,919.1 94.9 5.1 2.6 0.1 0.3 1.8 3,045.3 98.1 1.9 1.1 0.1 0.1 0.4
Issued by non-euro area residents
2010 545.9 49.9 50.1 27.6 0.3 0.5 16.8 506.2 33.3 66.7 40.4 3.9 0.9 13.62011 457.0 56.4 43.6 21.1 0.3 0.3 16.0 475.5 32.3 67.7 39.3 5.8 0.7 13.7
2011 Q4 457.0 56.4 43.6 21.1 0.3 0.3 16.0 475.5 32.3 67.7 39.3 5.8 0.7 13.72012 Q1 (p) 489.5 55.5 44.5 19.8 0.3 0.3 20.2 465.1 33.5 66.5 36.2 4.5 0.9 13.6
Deposits
By euro area residents
2010 5,774.7 92.9 7.1 4.1 0.3 1.3 0.8 10,738.7 97.1 2.9 1.9 0.2 0.1 0.42011 6,318.7 92.1 7.9 5.2 0.2 1.2 0.7 10,946.4 97.0 3.0 2.0 0.1 0.1 0.4
2011 Q4 6,318.7 92.1 7.9 5.2 0.2 1.2 0.7 10,946.4 97.0 3.0 2.0 0.1 0.1 0.42012 Q1 (p) 6,470.7 93.4 6.6 3.9 0.2 1.2 0.6 10,997.8 97.1 2.9 1.9 0.1 0.1 0.4
By non-euro area residents
2010 2,487.5 52.0 48.0 31.8 2.2 1.8 8.7 996.9 58.8 41.2 29.3 1.2 1.4 5.12011 2,175.4 59.2 40.8 25.6 2.1 1.8 7.2 977.5 56.1 43.9 30.0 2.0 1.5 5.1
2011 Q4 2,175.4 59.2 40.8 25.6 2.1 1.8 7.2 977.5 56.1 43.9 30.0 2.0 1.5 5.12012 Q1 (p) 2,328.6 60.4 39.6 25.4 1.8 1.6 6.9 981.4 55.4 44.6 29.8 2.0 1.3 5.2
2. Debt securities issued by euro area MFIs
All Euro 4) Non-euro currencies
currencies (outstanding Total
amount)USD JPY CHF GBP
1 2 3 4 5 6 7
2010 5,083.2 81.6 18.4 9.7 1.8 2.1 2.52011 5,236.8 82.0 18.0 9.4 1.7 2.0 2.6
2011 Q4 5,236.8 82.0 18.0 9.4 1.7 2.0 2.62012 Q1 (p) 5,295.7 82.5 17.5 9.3 1.5 2.0 2.4
Source: ECB.1) MFI sector excluding the Eurosystem; sectoral classification is based on the ESA 95.2) Data refer to the changing composition of the euro area. For further information, see the General Notes.3) For non-euro area residents, the term ‘‘MFIs’’ refers to institutions similar to euro area MFIs.4) Including items expressed in the national denominations of the euro.
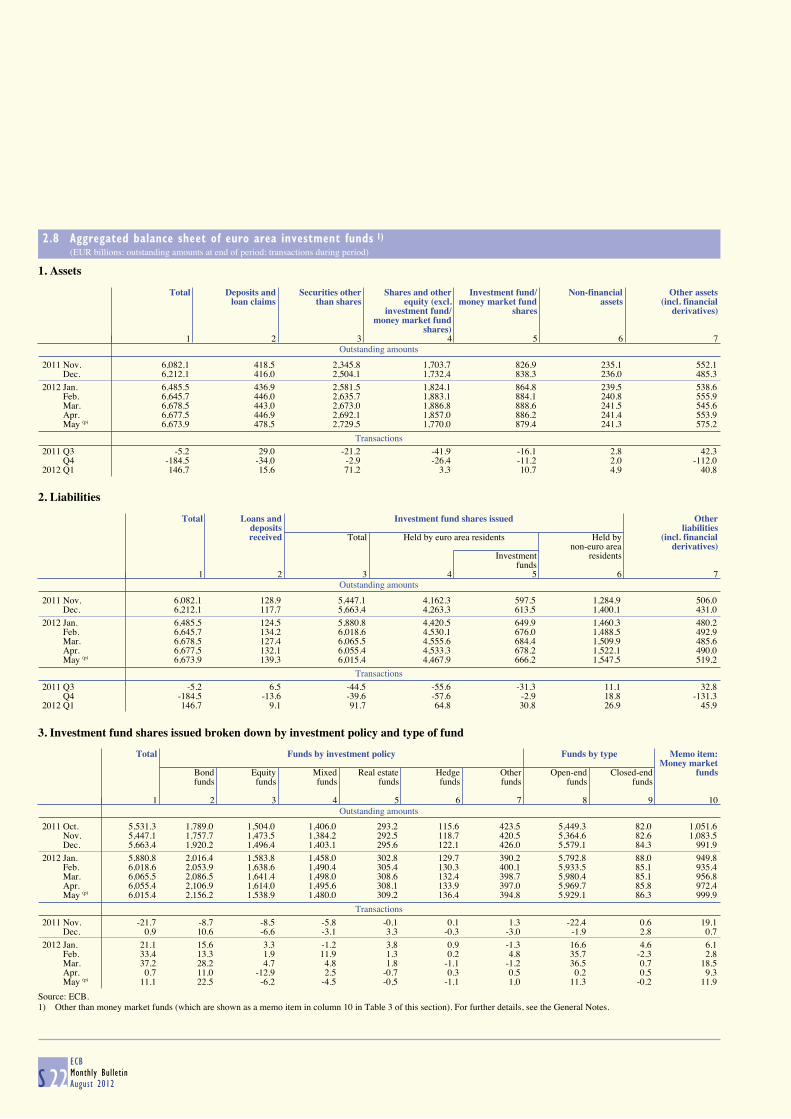
2.8 Aggregated balance sheet of euro area investment funds 1) (EUR billions; outstanding amounts at end of period; transactions during period)
S 22ECBMonthly BulletinAugust 2012
1. Assets
Outstanding amounts
Total Deposits and Securities other Shares and other Investment fund/ Non-financial Other assetsloan claims than shares equity (excl. money market fund assets (incl. financial
investment fund/ shares derivatives)money market fund
shares)1 2 3 4 5 6 7
2011 Nov. 6,082.1 418.5 2,345.8 1,703.7 826.9 235.1 552.1 Dec. 6,212.1 416.0 2,504.1 1,732.4 838.3 236.0 485.3
2012 Jan. 6,485.5 436.9 2,581.5 1,824.1 864.8 239.5 538.6 Feb. 6,645.7 446.0 2,635.7 1,883.1 884.1 240.8 555.9 Mar. 6,678.5 443.0 2,673.0 1,886.8 888.6 241.5 545.6 Apr. 6,677.5 446.9 2,692.1 1,857.0 886.2 241.4 553.9 May (p) 6,673.9 478.5 2,729.5 1,770.0 879.4 241.3 575.2
Transactions
2011 Q3 -5.2 29.0 -21.2 -41.9 -16.1 2.8 42.3 Q4 -184.5 -34.0 -2.9 -26.4 -11.2 2.0 -112.02012 Q1 146.7 15.6 71.2 3.3 10.7 4.9 40.8
2. Liabilities
Outstanding amounts
Total Loans and Investment fund shares issued Other
deposits liabilitiesreceived Total Held by euro area residents Held by (incl. financial
non-euro area derivatives)Investment residents
funds1 2 3 4 5 6 7
2011 Nov. 6,082.1 128.9 5,447.1 4,162.3 597.5 1,284.9 506.0 Dec. 6,212.1 117.7 5,663.4 4,263.3 613.5 1,400.1 431.0
2012 Jan. 6,485.5 124.5 5,880.8 4,420.5 649.9 1,460.3 480.2 Feb. 6,645.7 134.2 6,018.6 4,530.1 676.0 1,488.5 492.9 Mar. 6,678.5 127.4 6,065.5 4,555.6 684.4 1,509.9 485.6 Apr. 6,677.5 132.1 6,055.4 4,533.3 678.2 1,522.1 490.0 May (p) 6,673.9 139.3 6,015.4 4,467.9 666.2 1,547.5 519.2
Transactions
2011 Q3 -5.2 6.5 -44.5 -55.6 -31.3 11.1 32.8 Q4 -184.5 -13.6 -39.6 -57.6 -2.9 18.8 -131.32012 Q1 146.7 9.1 91.7 64.8 30.8 26.9 45.9
3. Investment fund shares issued broken down by investment policy and type of fund
Outstanding amounts
Total Funds by investment policy Funds by type Memo item:
Money marketBond Equity Mixed Real estate Hedge Other Open-end Closed-end fundsfunds funds funds funds funds funds funds funds
1 2 3 4 5 6 7 8 9 10
2011 Oct. 5,531.3 1,789.0 1,504.0 1,406.0 293.2 115.6 423.5 5,449.3 82.0 1,051.6 Nov. 5,447.1 1,757.7 1,473.5 1,384.2 292.5 118.7 420.5 5,364.6 82.6 1,083.5 Dec. 5,663.4 1,920.2 1,496.4 1,403.1 295.6 122.1 426.0 5,579.1 84.3 991.9
2012 Jan. 5,880.8 2,016.4 1,583.8 1,458.0 302.8 129.7 390.2 5,792.8 88.0 949.8 Feb. 6,018.6 2,053.9 1,638.6 1,490.4 305.4 130.3 400.1 5,933.5 85.1 935.4 Mar. 6,065.5 2,086.5 1,641.4 1,498.0 308.6 132.4 398.7 5,980.4 85.1 956.8 Apr. 6,055.4 2,106.9 1,614.0 1,495.6 308.1 133.9 397.0 5,969.7 85.8 972.4 May (p) 6,015.4 2,156.2 1,538.9 1,480.0 309.2 136.4 394.8 5,929.1 86.3 999.9
Transactions
2011 Nov. -21.7 -8.7 -8.5 -5.8 -0.1 0.1 1.3 -22.4 0.6 19.1 Dec. 0.9 10.6 -6.6 -3.1 3.3 -0.3 -3.0 -1.9 2.8 0.7
2012 Jan. 21.1 15.6 3.3 -1.2 3.8 0.9 -1.3 16.6 4.6 6.1 Feb. 33.4 13.3 1.9 11.9 1.3 0.2 4.8 35.7 -2.3 2.8 Mar. 37.2 28.2 4.7 4.8 1.8 -1.1 -1.2 36.5 0.7 18.5 Apr. 0.7 11.0 -12.9 2.5 -0.7 0.3 0.5 0.2 0.5 9.3 May (p) 11.1 22.5 -6.2 -4.5 -0.5 -1.1 1.0 11.3 -0.2 11.9
Source: ECB.1) Other than money market funds (which are shown as a memo item in column 10 in Table 3 of this section). For further details, see the General Notes.
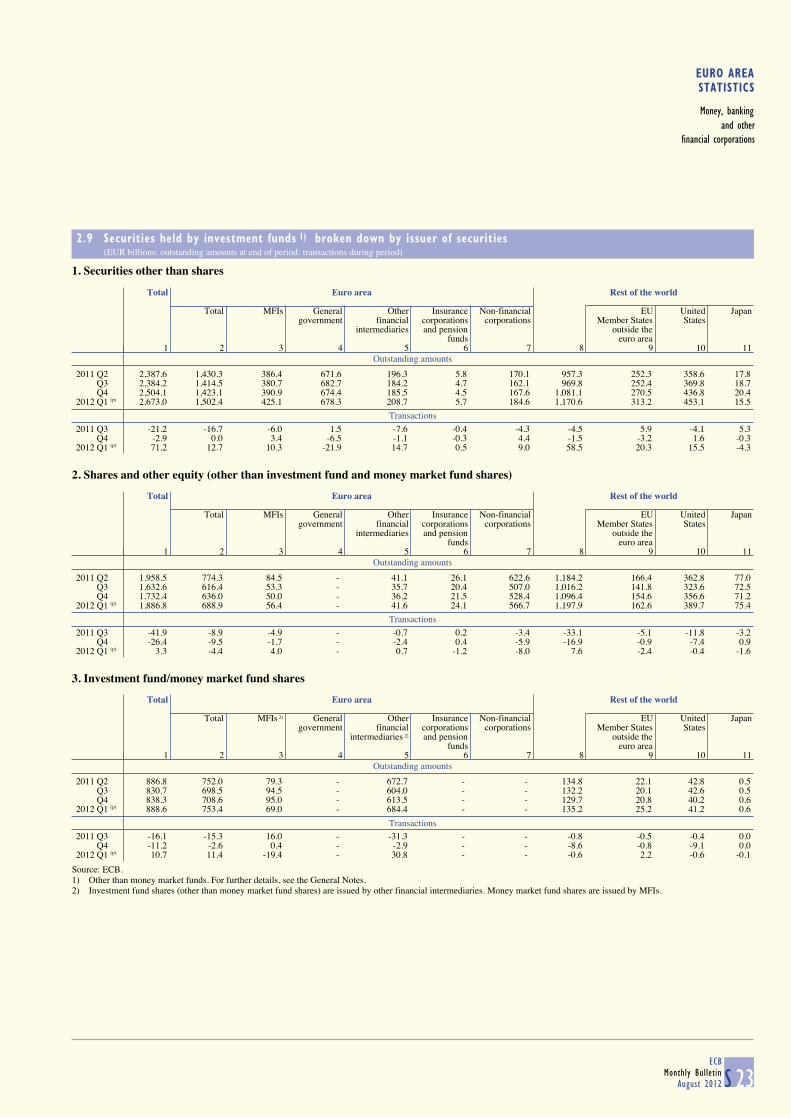
EURO AREASTATISTICS
Money, bankingand other
financial corporations
2.9 Securities held by investment funds 1) broken down by issuer of securities (EUR billions; outstanding amounts at end of period; transactions during period)
S 23ECB
Monthly BulletinAugust 2012
1. Securities other than shares
Outstanding amounts
Total Euro area Rest of the world
Total MFIs General Other Insurance Non-financial EU United Japangovernment financial corporations corporations Member States States
intermediaries and pension outside thefunds euro area
1 2 3 4 5 6 7 8 9 10 11
2011 Q2 2,387.6 1,430.3 386.4 671.6 196.3 5.8 170.1 957.3 252.3 358.6 17.8 Q3 2,384.2 1,414.5 380.7 682.7 184.2 4.7 162.1 969.8 252.4 369.8 18.7 Q4 2,504.1 1,423.1 390.9 674.4 185.5 4.5 167.6 1,081.1 270.5 436.8 20.42012 Q1 (p) 2,673.0 1,502.4 425.1 678.3 208.7 5.7 184.6 1,170.6 313.2 453.1 15.5
Transactions
2011 Q3 -21.2 -16.7 -6.0 1.5 -7.6 -0.4 -4.3 -4.5 5.9 -4.1 5.3 Q4 -2.9 0.0 3.4 -6.5 -1.1 -0.3 4.4 -1.5 -3.2 1.6 -0.32012 Q1 (p) 71.2 12.7 10.3 -21.9 14.7 0.5 9.0 58.5 20.3 15.5 -4.3
2. Shares and other equity (other than investment fund and money market fund shares)
Outstanding amounts
Total Euro area Rest of the world
Total MFIs General Other Insurance Non-financial EU United Japangovernment financial corporations corporations Member States States
intermediaries and pension outside thefunds euro area
1 2 3 4 5 6 7 8 9 10 11
2011 Q2 1,958.5 774.3 84.5 - 41.1 26.1 622.6 1,184.2 166.4 362.8 77.0 Q3 1,632.6 616.4 53.3 - 35.7 20.4 507.0 1,016.2 141.8 323.6 72.5 Q4 1,732.4 636.0 50.0 - 36.2 21.5 528.4 1,096.4 154.6 356.6 71.22012 Q1 (p) 1,886.8 688.9 56.4 - 41.6 24.1 566.7 1,197.9 162.6 389.7 75.4
Transactions
2011 Q3 -41.9 -8.9 -4.9 - -0.7 0.2 -3.4 -33.1 -5.1 -11.8 -3.2 Q4 -26.4 -9.5 -1.7 - -2.4 0.4 -5.9 -16.9 -0.9 -7.4 0.92012 Q1 (p) 3.3 -4.4 4.0 - 0.7 -1.2 -8.0 7.6 -2.4 -0.4 -1.6
3. Investment fund/money market fund shares
Outstanding amounts
Total Euro area Rest of the world
Total MFIs 2) General Other Insurance Non-financial EU United Japangovernment financial corporations corporations Member States States
intermediaries 2) and pension outside thefunds euro area
1 2 3 4 5 6 7 8 9 10 11
2011 Q2 886.8 752.0 79.3 - 672.7 - - 134.8 22.1 42.8 0.5 Q3 830.7 698.5 94.5 - 604.0 - - 132.2 20.1 42.6 0.5 Q4 838.3 708.6 95.0 - 613.5 - - 129.7 20.8 40.2 0.62012 Q1 (p) 888.6 753.4 69.0 - 684.4 - - 135.2 25.2 41.2 0.6
Transactions
2011 Q3 -16.1 -15.3 16.0 - -31.3 - - -0.8 -0.5 -0.4 0.0 Q4 -11.2 -2.6 0.4 - -2.9 - - -8.6 -0.8 -9.1 0.02012 Q1 (p) 10.7 11.4 -19.4 - 30.8 - - -0.6 2.2 -0.6 -0.1
Source: ECB.1) Other than money market funds. For further details, see the General Notes.2) Investment fund shares (other than money market fund shares) are issued by other financial intermediaries. Money market fund shares are issued by MFIs.
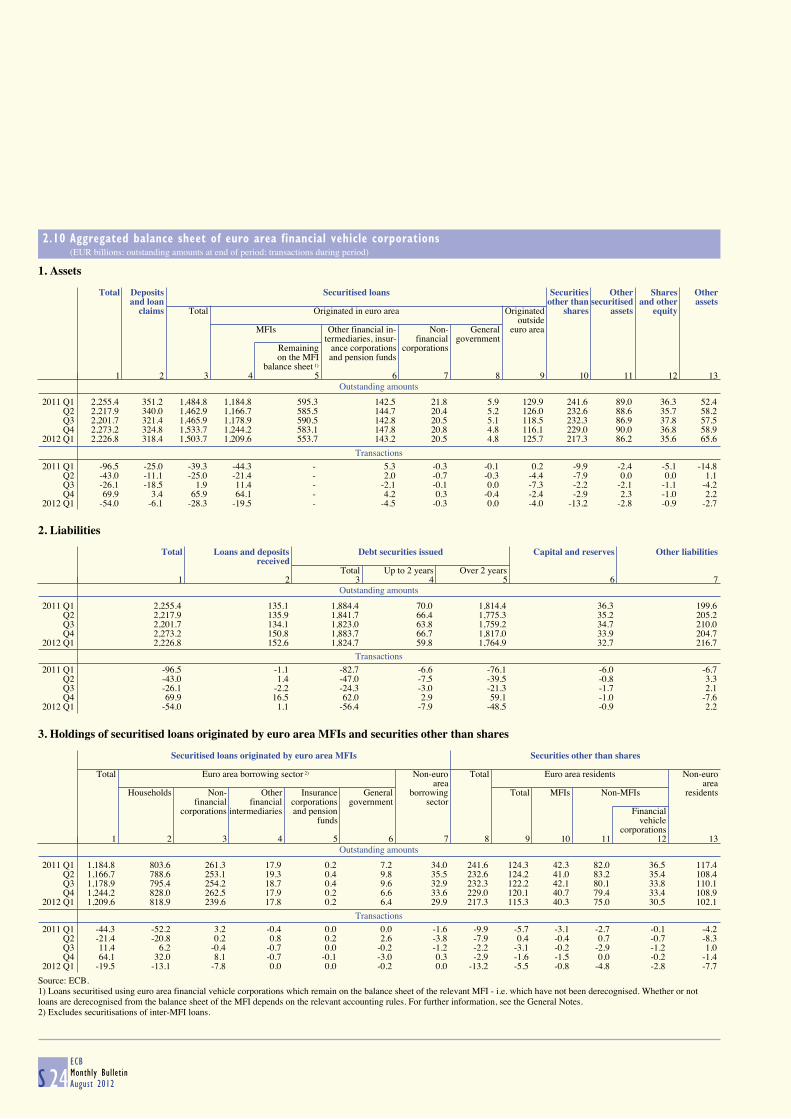
2.10 Aggregated balance sheet of euro area financial vehicle corporations (EUR billions; outstanding amounts at end of period; transactions during period)
S 24ECBMonthly BulletinAugust 2012
1. Assets
Outstanding amounts
Total Deposits Securitised loans Securities Other Shares Other
and loan other than securitised and other assetsclaims Total Originated in euro area Originated shares assets equity
outside MFIs Other financial in- Non- General euro area
termediaries, insur- financial governmentRemaining ance corporations corporationson the MFI and pension funds
balance sheet 1)
1 2 3 4 5 6 7 8 9 10 11 12 13
2011 Q1 2,255.4 351.2 1,484.8 1,184.8 595.3 142.5 21.8 5.9 129.9 241.6 89.0 36.3 52.4 Q2 2,217.9 340.0 1,462.9 1,166.7 585.5 144.7 20.4 5.2 126.0 232.6 88.6 35.7 58.2 Q3 2,201.7 321.4 1,465.9 1,178.9 590.5 142.8 20.5 5.1 118.5 232.3 86.9 37.8 57.5 Q4 2,273.2 324.8 1,533.7 1,244.2 583.1 147.8 20.8 4.8 116.1 229.0 90.0 36.8 58.92012 Q1 2,226.8 318.4 1,503.7 1,209.6 553.7 143.2 20.5 4.8 125.7 217.3 86.2 35.6 65.6
Transactions
2011 Q1 -96.5 -25.0 -39.3 -44.3 - 5.3 -0.3 -0.1 0.2 -9.9 -2.4 -5.1 -14.8 Q2 -43.0 -11.1 -25.0 -21.4 - 2.0 -0.7 -0.3 -4.4 -7.9 0.0 0.0 1.1 Q3 -26.1 -18.5 1.9 11.4 - -2.1 -0.1 0.0 -7.3 -2.2 -2.1 -1.1 -4.2 Q4 69.9 3.4 65.9 64.1 - 4.2 0.3 -0.4 -2.4 -2.9 2.3 -1.0 2.22012 Q1 -54.0 -6.1 -28.3 -19.5 - -4.5 -0.3 0.0 -4.0 -13.2 -2.8 -0.9 -2.7
2. Liabilities
Outstanding amounts
Total Loans and deposits Debt securities issued Capital and reserves Other liabilities
receivedTotal Up to 2 years Over 2 years
1 2 3 4 5 6 7
2011 Q1 2,255.4 135.1 1,884.4 70.0 1,814.4 36.3 199.6 Q2 2,217.9 135.9 1,841.7 66.4 1,775.3 35.2 205.2 Q3 2,201.7 134.1 1,823.0 63.8 1,759.2 34.7 210.0 Q4 2,273.2 150.8 1,883.7 66.7 1,817.0 33.9 204.72012 Q1 2,226.8 152.6 1,824.7 59.8 1,764.9 32.7 216.7
Transactions
2011 Q1 -96.5 -1.1 -82.7 -6.6 -76.1 -6.0 -6.7 Q2 -43.0 1.4 -47.0 -7.5 -39.5 -0.8 3.3 Q3 -26.1 -2.2 -24.3 -3.0 -21.3 -1.7 2.1 Q4 69.9 16.5 62.0 2.9 59.1 -1.0 -7.62012 Q1 -54.0 1.1 -56.4 -7.9 -48.5 -0.9 2.2
3. Holdings of securitised loans originated by euro area MFIs and securities other than shares
Outstanding amounts
Securitised loans originated by euro area MFIs Securities other than shares
Total Euro area borrowing sector 2) Non-euro Total Euro area residents Non-euro
area areaHouseholds Non- Other Insurance General borrowing Total MFIs Non-MFIs residents
financial financial corporations government sectorcorporations intermediaries and pension Financial
funds vehiclecorporations
1 2 3 4 5 6 7 8 9 10 11 12 13
2011 Q1 1,184.8 803.6 261.3 17.9 0.2 7.2 34.0 241.6 124.3 42.3 82.0 36.5 117.4 Q2 1,166.7 788.6 253.1 19.3 0.4 9.8 35.5 232.6 124.2 41.0 83.2 35.4 108.4 Q3 1,178.9 795.4 254.2 18.7 0.4 9.6 32.9 232.3 122.2 42.1 80.1 33.8 110.1 Q4 1,244.2 828.0 262.5 17.9 0.2 6.6 33.6 229.0 120.1 40.7 79.4 33.4 108.92012 Q1 1,209.6 818.9 239.6 17.8 0.2 6.4 29.9 217.3 115.3 40.3 75.0 30.5 102.1
Transactions
2011 Q1 -44.3 -52.2 3.2 -0.4 0.0 0.0 -1.6 -9.9 -5.7 -3.1 -2.7 -0.1 -4.2 Q2 -21.4 -20.8 0.2 0.8 0.2 2.6 -3.8 -7.9 0.4 -0.4 0.7 -0.7 -8.3 Q3 11.4 6.2 -0.4 -0.7 0.0 -0.2 -1.2 -2.2 -3.1 -0.2 -2.9 -1.2 1.0 Q4 64.1 32.0 8.1 -0.7 -0.1 -3.0 0.3 -2.9 -1.6 -1.5 0.0 -0.2 -1.42012 Q1 -19.5 -13.1 -7.8 0.0 0.0 -0.2 0.0 -13.2 -5.5 -0.8 -4.8 -2.8 -7.7
Source: ECB.1) Loans securitised using euro area financial vehicle corporations which remain on the balance sheet of the relevant MFI - i.e. which have not been derecognised. Whether or notloans are derecognised from the balance sheet of the MFI depends on the relevant accounting rules. For further information, see the General Notes.2) Excludes securitisations of inter-MFI loans.
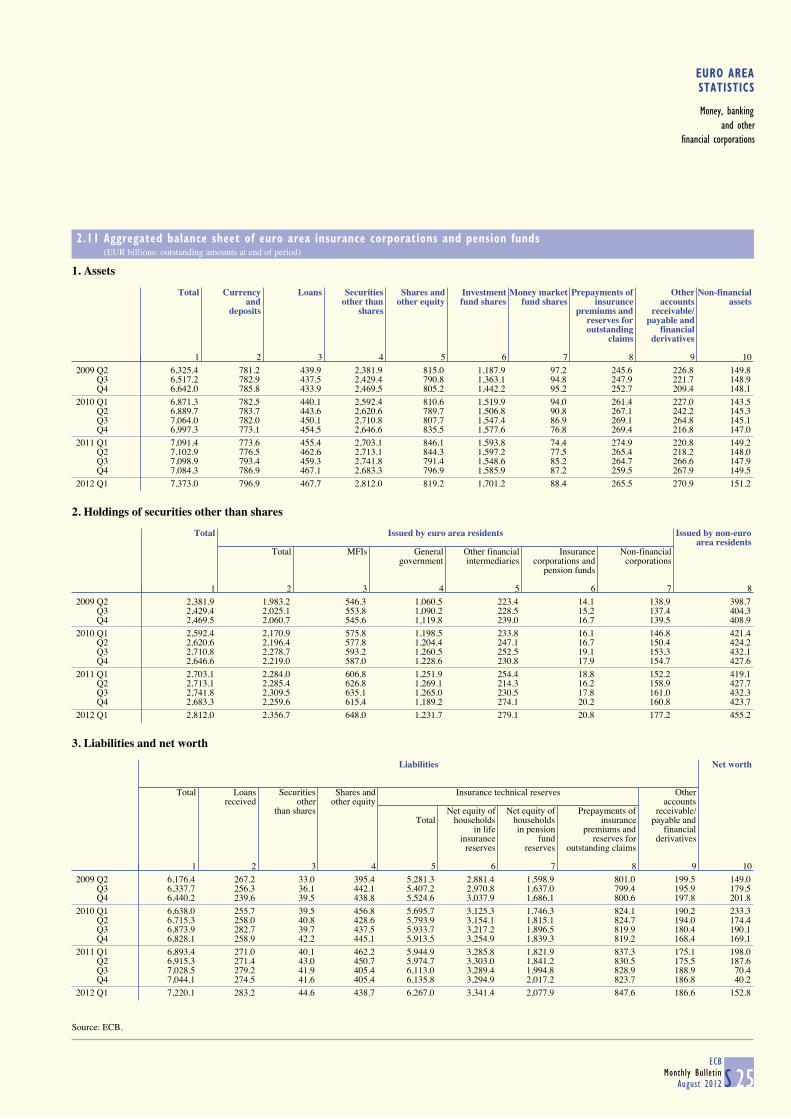
EURO AREASTATISTICS
Money, bankingand other
financial corporations
2.11 Aggregated balance sheet of euro area insurance corporations and pension funds (EUR billions; outstanding amounts at end of period)
S 25ECB
Monthly BulletinAugust 2012
1. Assets
Total Currency Loans Securities Shares and Investment Money market Prepayments of Other Non-financialand other than other equity fund shares fund shares insurance accounts assets
deposits shares premiums and receivable/reserves for payable andoutstanding financial
claims derivatives
1 2 3 4 5 6 7 8 9 10
2009 Q2 6,325.4 781.2 439.9 2,381.9 815.0 1,187.9 97.2 245.6 226.8 149.8 Q3 6,517.2 782.9 437.5 2,429.4 790.8 1,363.1 94.8 247.9 221.7 148.9 Q4 6,642.0 785.8 433.9 2,469.5 805.2 1,442.2 95.2 252.7 209.4 148.1
2010 Q1 6,871.3 782.5 440.1 2,592.4 810.6 1,519.9 94.0 261.4 227.0 143.5 Q2 6,889.7 783.7 443.6 2,620.6 789.7 1,506.8 90.8 267.1 242.2 145.3 Q3 7,064.0 782.0 450.1 2,710.8 807.7 1,547.4 86.9 269.1 264.8 145.1 Q4 6,997.3 773.1 454.5 2,646.6 835.5 1,577.6 76.8 269.4 216.8 147.0
2011 Q1 7,091.4 773.6 455.4 2,703.1 846.1 1,593.8 74.4 274.9 220.8 149.2 Q2 7,102.9 776.5 462.6 2,713.1 844.3 1,597.2 77.5 265.4 218.2 148.0 Q3 7,098.9 793.4 459.3 2,741.8 791.4 1,548.6 85.2 264.7 266.6 147.9 Q4 7,084.3 786.9 467.1 2,683.3 796.9 1,585.9 87.2 259.5 267.9 149.5
2012 Q1 7,373.0 796.9 467.7 2,812.0 819.2 1,701.2 88.4 265.5 270.9 151.2
2. Holdings of securities other than shares
Total Issued by euro area residents Issued by non-euro
area residentsTotal MFIs General Other financial Insurance Non-financial
government intermediaries corporations and corporationspension funds
1 2 3 4 5 6 7 8
2009 Q2 2,381.9 1,983.2 546.3 1,060.5 223.4 14.1 138.9 398.7 Q3 2,429.4 2,025.1 553.8 1,090.2 228.5 15.2 137.4 404.3 Q4 2,469.5 2,060.7 545.6 1,119.8 239.0 16.7 139.5 408.9
2010 Q1 2,592.4 2,170.9 575.8 1,198.5 233.8 16.1 146.8 421.4 Q2 2,620.6 2,196.4 577.8 1,204.4 247.1 16.7 150.4 424.2 Q3 2,710.8 2,278.7 593.2 1,260.5 252.5 19.1 153.3 432.1 Q4 2,646.6 2,219.0 587.0 1,228.6 230.8 17.9 154.7 427.6
2011 Q1 2,703.1 2,284.0 606.8 1,251.9 254.4 18.8 152.2 419.1 Q2 2,713.1 2,285.4 626.8 1,269.1 214.3 16.2 158.9 427.7 Q3 2,741.8 2,309.5 635.1 1,265.0 230.5 17.8 161.0 432.3 Q4 2,683.3 2,259.6 615.4 1,189.2 274.1 20.2 160.8 423.7
2012 Q1 2,812.0 2,356.7 648.0 1,231.7 279.1 20.8 177.2 455.2
3. Liabilities and net worth
Liabilities Net worth
Total Loans Securities Shares and Insurance technical reserves Otherreceived other other equity accounts
than shares Net equity of Net equity of Prepayments of receivable/Total households households insurance payable and
in life in pension premiums and financialinsurance fund reserves for derivatives
reserves reserves outstanding claims
1 2 3 4 5 6 7 8 9 10
2009 Q2 6,176.4 267.2 33.0 395.4 5,281.3 2,881.4 1,598.9 801.0 199.5 149.0 Q3 6,337.7 256.3 36.1 442.1 5,407.2 2,970.8 1,637.0 799.4 195.9 179.5 Q4 6,440.2 239.6 39.5 438.8 5,524.6 3,037.9 1,686.1 800.6 197.8 201.8
2010 Q1 6,638.0 255.7 39.5 456.8 5,695.7 3,125.3 1,746.3 824.1 190.2 233.3 Q2 6,715.3 258.0 40.8 428.6 5,793.9 3,154.1 1,815.1 824.7 194.0 174.4 Q3 6,873.9 282.7 39.7 437.5 5,933.7 3,217.2 1,896.5 819.9 180.4 190.1 Q4 6,828.1 258.9 42.2 445.1 5,913.5 3,254.9 1,839.3 819.2 168.4 169.1
2011 Q1 6,893.4 271.0 40.1 462.2 5,944.9 3,285.8 1,821.9 837.3 175.1 198.0 Q2 6,915.3 271.4 43.0 450.7 5,974.7 3,303.0 1,841.2 830.5 175.5 187.6 Q3 7,028.5 279.2 41.9 405.4 6,113.0 3,289.4 1,994.8 828.9 188.9 70.4 Q4 7,044.1 274.5 41.6 405.4 6,135.8 3,294.9 2,017.2 823.7 186.8 40.2
2012 Q1 7,220.1 283.2 44.6 438.7 6,267.0 3,341.4 2,077.9 847.6 186.6 152.8
Source: ECB.
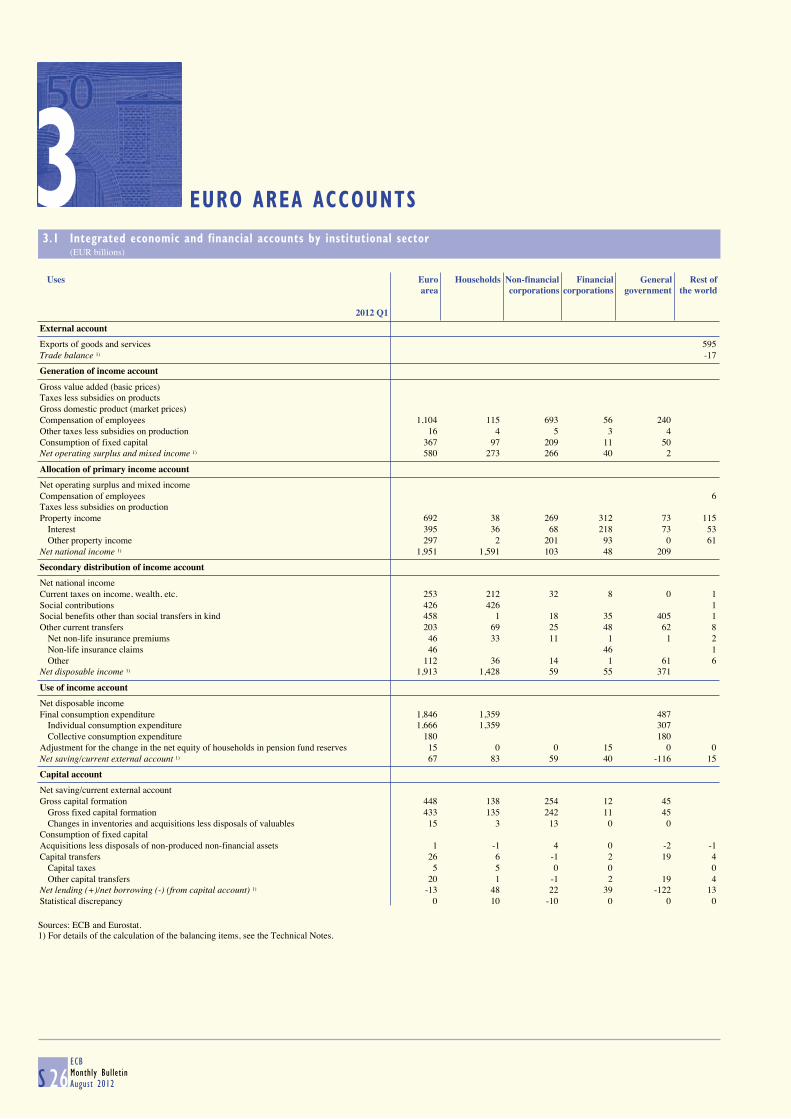
3 EURO AREA ACCOUNTS
3.1 Integrated economic and financial accounts by institutional sector (EUR billions)
S 26ECBMonthly BulletinAugust 2012
Uses Euro Households Non-financial Financial General Rest ofarea corporations corporations government the world
2012 Q1
External account
Exports of goods and services 595 Trade balance 1) -17
Generation of income account
Gross value added (basic prices) Taxes less subsidies on products Gross domestic product (market prices) Compensation of employees 1,104 115 693 56 240 Other taxes less subsidies on production 16 4 5 3 4 Consumption of fixed capital 367 97 209 11 50 Net operating surplus and mixed income 1) 580 273 266 40 2
Allocation of primary income account
Net operating surplus and mixed income Compensation of employees 6 Taxes less subsidies on production Property income 692 38 269 312 73 115 Interest 395 36 68 218 73 53 Other property income 297 2 201 93 0 61 Net national income 1) 1,951 1,591 103 48 209
Secondary distribution of income account
Net national income Current taxes on income, wealth, etc. 253 212 32 8 0 1 Social contributions 426 426 1 Social benefits other than social transfers in kind 458 1 18 35 405 1 Other current transfers 203 69 25 48 62 8 Net non-life insurance premiums 46 33 11 1 1 2 Non-life insurance claims 46 46 1 Other 112 36 14 1 61 6 Net disposable income 1) 1,913 1,428 59 55 371
Use of income account
Net disposable income Final consumption expenditure 1,846 1,359 487 Individual consumption expenditure 1,666 1,359 307 Collective consumption expenditure 180 180 Adjustment for the change in the net equity of households in pension fund reserves 15 0 0 15 0 0 Net saving/current external account 1) 67 83 59 40 -116 15
Capital account
Net saving/current external account Gross capital formation 448 138 254 12 45 Gross fixed capital formation 433 135 242 11 45 Changes in inventories and acquisitions less disposals of valuables 15 3 13 0 0 Consumption of fixed capital Acquisitions less disposals of non-produced non-financial assets 1 -1 4 0 -2 -1 Capital transfers 26 6 -1 2 19 4 Capital taxes 5 5 0 0 0 Other capital transfers 20 1 -1 2 19 4 Net lending (+)/net borrowing (-) (from capital account) 1) -13 48 22 39 -122 13 Statistical discrepancy 0 10 -10 0 0 0
Sources: ECB and Eurostat.1) For details of the calculation of the balancing items, see the Technical Notes.
3

EURO AREASTATISTICS
Euro areaaccounts
3.1 Integrated economic and financial accounts by institutional sector (cont'd) (EUR billions)
S 27ECB
Monthly BulletinAugust 2012
Resources Euro Households Non-financial Financial General Rest ofarea corporations corporations government the world
2012 Q1
External account
Imports of goods and services 577 Trade balance
Generation of income account
Gross value added (basic prices) 2,067 489 1,172 110 295 Taxes less subsidies on products 245 Gross domestic product (market prices)2) 2,312 Compensation of employees Other taxes less subsidies on production Consumption of fixed capital Net operating surplus and mixed income
Allocation of primary income account
Net operating surplus and mixed income 580 273 266 40 2 Compensation of employees 1,108 1,108 2 Taxes less subsidies on production 259 259 2 Property income 696 248 106 320 21 110 Interest 383 63 42 270 8 65 Other property income 313 185 65 50 13 45 Net national income
Secondary distribution of income account
Net national income 1,951 1,591 103 48 209 Current taxes on income, wealth, etc. 254 254 0 Social contributions 425 1 18 50 356 1 Social benefits other than social transfers in kind 457 457 2 Other current transfers 166 87 14 47 19 45 Net non-life insurance premiums 46 46 2 Non-life insurance claims 45 35 8 1 0 2 Other 75 51 5 0 18 42 Net disposable income
Use of income account
Net disposable income 1,913 1,428 59 55 371 Final consumption expenditure Individual consumption expenditure Collective consumption expenditure Adjustment for the change in the net equity of households in pension fund reserves 15 15 0 Net saving/current external account
Capital account
Net saving/current external account 67 83 59 40 -116 15 Gross capital formation Gross fixed capital formation Changes in inventories and acquisitions less disposals of valuables Consumption of fixed capital 367 97 209 11 50 Acquisitions less disposals of non-produced non-financial assets Capital transfers 28 10 12 1 5 2 Capital taxes 5 5 0 Other capital transfers 23 10 12 1 0 2 Net lending (+)/net borrowing (-) (from capital account) Statistical discrepancy
Sources: ECB and Eurostat.2) Gross domestic product is equal to the gross value added of all domestic sectors plus net taxes (i.e. taxes less subsidies) on products.
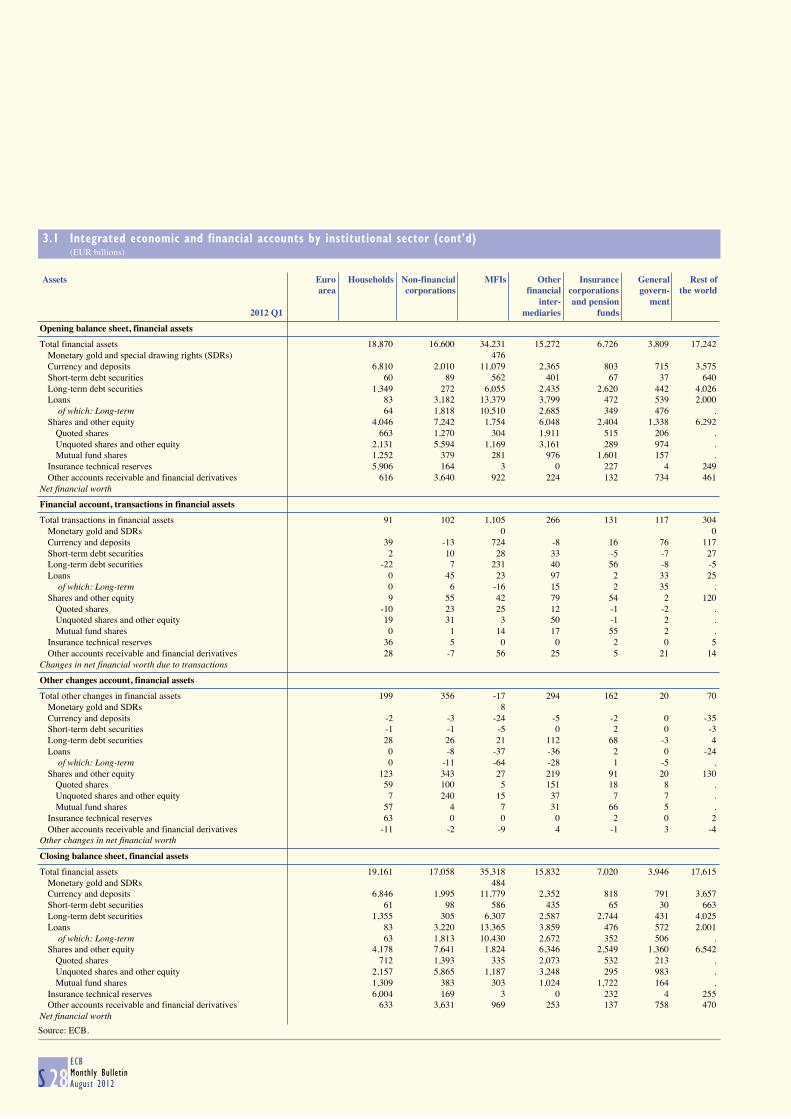
3.1 Integrated economic and financial accounts by institutional sector (cont'd) (EUR billions)
S 28ECBMonthly BulletinAugust 2012
Assets Euro Households Non-financial MFIs Other Insurance General Rest ofarea corporations financial corporations govern- the world
inter- and pension ment2012 Q1 mediaries funds
Opening balance sheet, financial assets
Total financial assets 18,870 16,600 34,231 15,272 6,726 3,809 17,242 Monetary gold and special drawing rights (SDRs) 476 Currency and deposits 6,810 2,010 11,079 2,365 803 715 3,575 Short-term debt securities 60 89 562 401 67 37 640 Long-term debt securities 1,349 272 6,055 2,435 2,620 442 4,026 Loans 83 3,182 13,379 3,799 472 539 2,000 of which: Long-term 64 1,818 10,510 2,685 349 476 . Shares and other equity 4,046 7,242 1,754 6,048 2,404 1,338 6,292 Quoted shares 663 1,270 304 1,911 515 206 . Unquoted shares and other equity 2,131 5,594 1,169 3,161 289 974 . Mutual fund shares 1,252 379 281 976 1,601 157 . Insurance technical reserves 5,906 164 3 0 227 4 249 Other accounts receivable and financial derivatives 616 3,640 922 224 132 734 461 Net financial worth
Financial account, transactions in financial assets
Total transactions in financial assets 91 102 1,105 266 131 117 304 Monetary gold and SDRs 0 0 Currency and deposits 39 -13 724 -8 16 76 117 Short-term debt securities 2 10 28 33 -5 -7 27 Long-term debt securities -22 7 231 40 56 -8 -5 Loans 0 45 23 97 2 33 25 of which: Long-term 0 6 -16 15 2 35 . Shares and other equity 9 55 42 79 54 2 120 Quoted shares -10 23 25 12 -1 -2 . Unquoted shares and other equity 19 31 3 50 -1 2 . Mutual fund shares 0 1 14 17 55 2 . Insurance technical reserves 36 5 0 0 2 0 5 Other accounts receivable and financial derivatives 28 -7 56 25 5 21 14 Changes in net financial worth due to transactions
Other changes account, financial assets
Total other changes in financial assets 199 356 -17 294 162 20 70 Monetary gold and SDRs 8 Currency and deposits -2 -3 -24 -5 -2 0 -35 Short-term debt securities -1 -1 -5 0 2 0 -3 Long-term debt securities 28 26 21 112 68 -3 4 Loans 0 -8 -37 -36 2 0 -24 of which: Long-term 0 -11 -64 -28 1 -5 . Shares and other equity 123 343 27 219 91 20 130 Quoted shares 59 100 5 151 18 8 . Unquoted shares and other equity 7 240 15 37 7 7 . Mutual fund shares 57 4 7 31 66 5 . Insurance technical reserves 63 0 0 0 2 0 2 Other accounts receivable and financial derivatives -11 -2 -9 4 -1 3 -4 Other changes in net financial worth
Closing balance sheet, financial assets
Total financial assets 19,161 17,058 35,318 15,832 7,020 3,946 17,615 Monetary gold and SDRs 484 Currency and deposits 6,846 1,995 11,779 2,352 818 791 3,657 Short-term debt securities 61 98 586 435 65 30 663 Long-term debt securities 1,355 305 6,307 2,587 2,744 431 4,025 Loans 83 3,220 13,365 3,859 476 572 2,001 of which: Long-term 63 1,813 10,430 2,672 352 506 . Shares and other equity 4,178 7,641 1,824 6,346 2,549 1,360 6,542 Quoted shares 712 1,393 335 2,073 532 213 . Unquoted shares and other equity 2,157 5,865 1,187 3,248 295 983 . Mutual fund shares 1,309 383 303 1,024 1,722 164 . Insurance technical reserves 6,004 169 3 0 232 4 255 Other accounts receivable and financial derivatives 633 3,631 969 253 137 758 470 Net financial worth
Source: ECB.
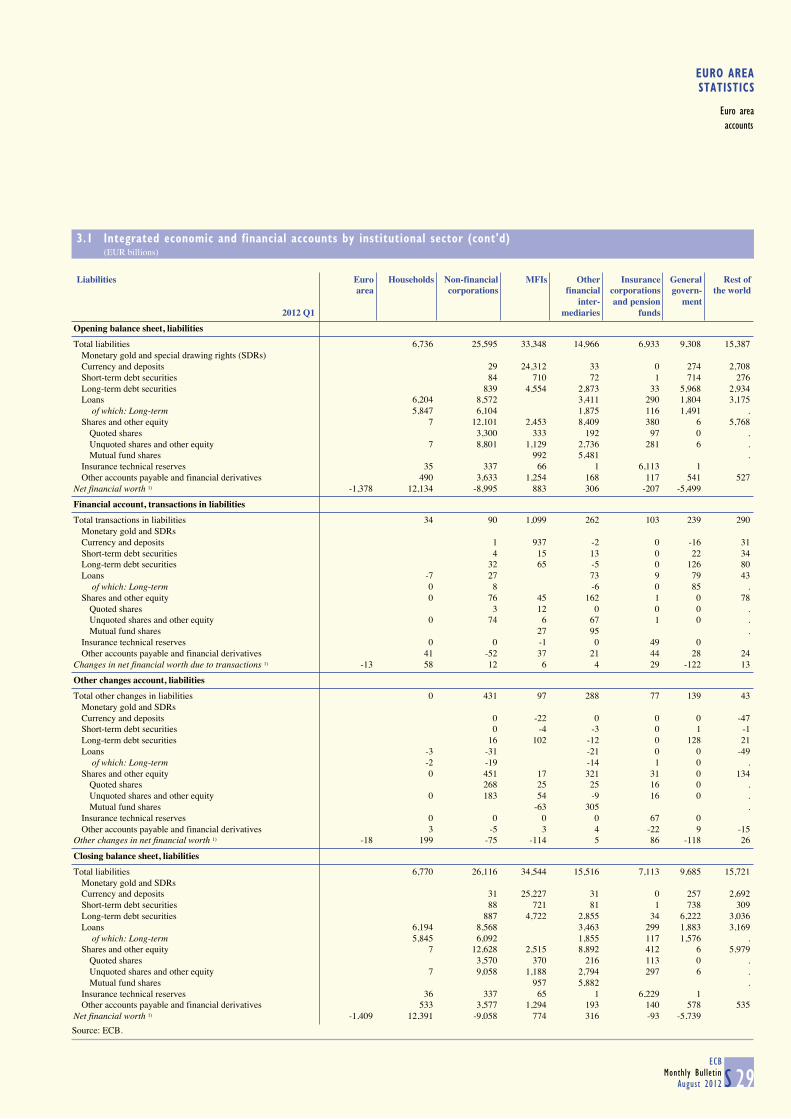
EURO AREASTATISTICS
Euro areaaccounts
3.1 Integrated economic and financial accounts by institutional sector (cont'd) (EUR billions)
S 29ECB
Monthly BulletinAugust 2012
Liabilities Euro Households Non-financial MFIs Other Insurance General Rest ofarea corporations financial corporations govern- the world
inter- and pension ment2012 Q1 mediaries funds
Opening balance sheet, liabilities
Total liabilities 6,736 25,595 33,348 14,966 6,933 9,308 15,387 Monetary gold and special drawing rights (SDRs) Currency and deposits 29 24,312 33 0 274 2,708 Short-term debt securities 84 710 72 1 714 276 Long-term debt securities 839 4,554 2,873 33 5,968 2,934 Loans 6,204 8,572 3,411 290 1,804 3,175 of which: Long-term 5,847 6,104 1,875 116 1,491 . Shares and other equity 7 12,101 2,453 8,409 380 6 5,768 Quoted shares 3,300 333 192 97 0 . Unquoted shares and other equity 7 8,801 1,129 2,736 281 6 . Mutual fund shares 992 5,481 . Insurance technical reserves 35 337 66 1 6,113 1 Other accounts payable and financial derivatives 490 3,633 1,254 168 117 541 527 Net financial worth 1) -1,378 12,134 -8,995 883 306 -207 -5,499
Financial account, transactions in liabilities
Total transactions in liabilities 34 90 1,099 262 103 239 290 Monetary gold and SDRs Currency and deposits 1 937 -2 0 -16 31 Short-term debt securities 4 15 13 0 22 34 Long-term debt securities 32 65 -5 0 126 80 Loans -7 27 73 9 79 43 of which: Long-term 0 8 -6 0 85 . Shares and other equity 0 76 45 162 1 0 78 Quoted shares 3 12 0 0 0 . Unquoted shares and other equity 0 74 6 67 1 0 . Mutual fund shares 27 95 . Insurance technical reserves 0 0 -1 0 49 0 Other accounts payable and financial derivatives 41 -52 37 21 44 28 24 Changes in net financial worth due to transactions 1) -13 58 12 6 4 29 -122 13
Other changes account, liabilities
Total other changes in liabilities 0 431 97 288 77 139 43 Monetary gold and SDRs Currency and deposits 0 -22 0 0 0 -47 Short-term debt securities 0 -4 -3 0 1 -1 Long-term debt securities 16 102 -12 0 128 21 Loans -3 -31 -21 0 0 -49 of which: Long-term -2 -19 -14 1 0 . Shares and other equity 0 451 17 321 31 0 134 Quoted shares 268 25 25 16 0 . Unquoted shares and other equity 0 183 54 -9 16 0 . Mutual fund shares -63 305 . Insurance technical reserves 0 0 0 0 67 0 Other accounts payable and financial derivatives 3 -5 3 4 -22 9 -15 Other changes in net financial worth 1) -18 199 -75 -114 5 86 -118 26
Closing balance sheet, liabilities
Total liabilities 6,770 26,116 34,544 15,516 7,113 9,685 15,721 Monetary gold and SDRs Currency and deposits 31 25,227 31 0 257 2,692 Short-term debt securities 88 721 81 1 738 309 Long-term debt securities 887 4,722 2,855 34 6,222 3,036 Loans 6,194 8,568 3,463 299 1,883 3,169 of which: Long-term 5,845 6,092 1,855 117 1,576 . Shares and other equity 7 12,628 2,515 8,892 412 6 5,979 Quoted shares 3,570 370 216 113 0 . Unquoted shares and other equity 7 9,058 1,188 2,794 297 6 . Mutual fund shares 957 5,882 . Insurance technical reserves 36 337 65 1 6,229 1 Other accounts payable and financial derivatives 533 3,577 1,294 193 140 578 535 Net financial worth 1) -1,409 12,391 -9,058 774 316 -93 -5,739
Source: ECB.
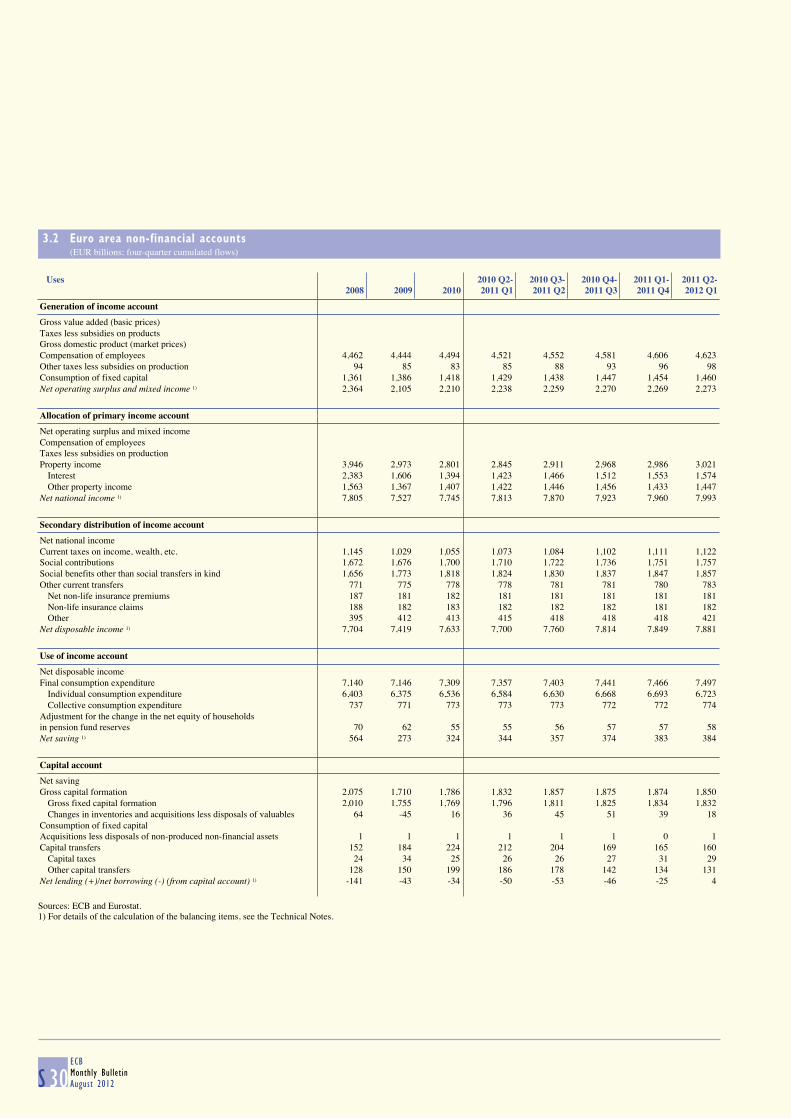
3.2 Euro area non-financial accounts (EUR billions; four-quarter cumulated flows)
S 30ECBMonthly BulletinAugust 2012
Uses 2010 Q2- 2010 Q3- 2010 Q4- 2011 Q1- 2011 Q2-2008 2009 2010 2011 Q1 2011 Q2 2011 Q3 2011 Q4 2012 Q1
Generation of income account
Gross value added (basic prices) Taxes less subsidies on products Gross domestic product (market prices) Compensation of employees 4,462 4,444 4,494 4,521 4,552 4,581 4,606 4,623 Other taxes less subsidies on production 94 85 83 85 88 93 96 98 Consumption of fixed capital 1,361 1,386 1,418 1,429 1,438 1,447 1,454 1,460 Net operating surplus and mixed income 1) 2,364 2,105 2,210 2,238 2,259 2,270 2,269 2,273
Allocation of primary income account
Net operating surplus and mixed income Compensation of employees Taxes less subsidies on production Property income 3,946 2,973 2,801 2,845 2,911 2,968 2,986 3,021 Interest 2,383 1,606 1,394 1,423 1,466 1,512 1,553 1,574 Other property income 1,563 1,367 1,407 1,422 1,446 1,456 1,433 1,447 Net national income 1) 7,805 7,527 7,745 7,813 7,870 7,923 7,960 7,993
Secondary distribution of income account
Net national income Current taxes on income, wealth, etc. 1,145 1,029 1,055 1,073 1,084 1,102 1,111 1,122 Social contributions 1,672 1,676 1,700 1,710 1,722 1,736 1,751 1,757 Social benefits other than social transfers in kind 1,656 1,773 1,818 1,824 1,830 1,837 1,847 1,857 Other current transfers 771 775 778 778 781 781 780 783 Net non-life insurance premiums 187 181 182 181 181 181 181 181 Non-life insurance claims 188 182 183 182 182 182 181 182 Other 395 412 413 415 418 418 418 421 Net disposable income 1) 7,704 7,419 7,633 7,700 7,760 7,814 7,849 7,881
Use of income account
Net disposable income Final consumption expenditure 7,140 7,146 7,309 7,357 7,403 7,441 7,466 7,497 Individual consumption expenditure 6,403 6,375 6,536 6,584 6,630 6,668 6,693 6,723 Collective consumption expenditure 737 771 773 773 773 772 772 774 Adjustment for the change in the net equity of households in pension fund reserves 70 62 55 55 56 57 57 58 Net saving 1) 564 273 324 344 357 374 383 384
Capital account
Net saving Gross capital formation 2,075 1,710 1,786 1,832 1,857 1,875 1,874 1,850 Gross fixed capital formation 2,010 1,755 1,769 1,796 1,811 1,825 1,834 1,832 Changes in inventories and acquisitions less disposals of valuables 64 -45 16 36 45 51 39 18 Consumption of fixed capital Acquisitions less disposals of non-produced non-financial assets 1 1 1 1 1 1 0 1 Capital transfers 152 184 224 212 204 169 165 160 Capital taxes 24 34 25 26 26 27 31 29 Other capital transfers 128 150 199 186 178 142 134 131 Net lending (+)/net borrowing (-) (from capital account) 1) -141 -43 -34 -50 -53 -46 -25 4
Sources: ECB and Eurostat.1) For details of the calculation of the balancing items, see the Technical Notes.
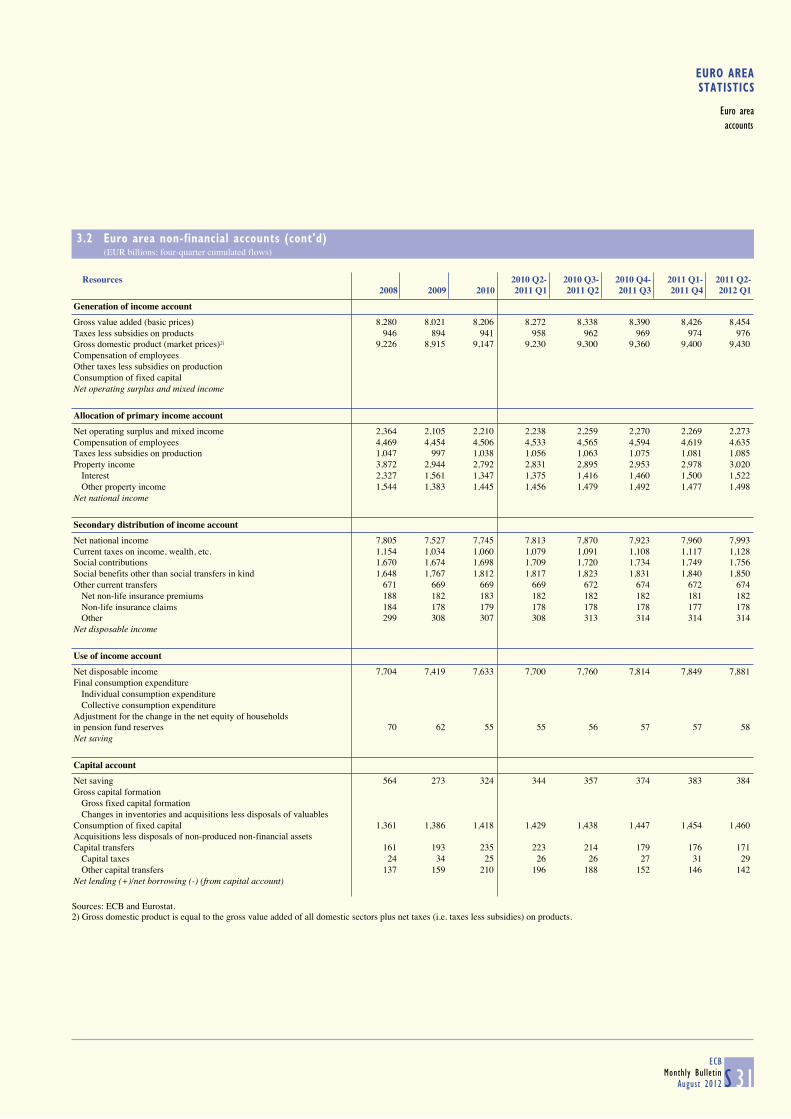
EURO AREASTATISTICS
Euro areaaccounts
3.2 Euro area non-financial accounts (cont'd) (EUR billions; four-quarter cumulated flows)
S 31ECB
Monthly BulletinAugust 2012
Resources 2010 Q2- 2010 Q3- 2010 Q4- 2011 Q1- 2011 Q2-2008 2009 2010 2011 Q1 2011 Q2 2011 Q3 2011 Q4 2012 Q1
Generation of income account
Gross value added (basic prices) 8,280 8,021 8,206 8,272 8,338 8,390 8,426 8,454 Taxes less subsidies on products 946 894 941 958 962 969 974 976 Gross domestic product (market prices)2) 9,226 8,915 9,147 9,230 9,300 9,360 9,400 9,430 Compensation of employees Other taxes less subsidies on production Consumption of fixed capital Net operating surplus and mixed income
Allocation of primary income account
Net operating surplus and mixed income 2,364 2,105 2,210 2,238 2,259 2,270 2,269 2,273 Compensation of employees 4,469 4,454 4,506 4,533 4,565 4,594 4,619 4,635 Taxes less subsidies on production 1,047 997 1,038 1,056 1,063 1,075 1,081 1,085 Property income 3,872 2,944 2,792 2,831 2,895 2,953 2,978 3,020 Interest 2,327 1,561 1,347 1,375 1,416 1,460 1,500 1,522 Other property income 1,544 1,383 1,445 1,456 1,479 1,492 1,477 1,498 Net national income
Secondary distribution of income account
Net national income 7,805 7,527 7,745 7,813 7,870 7,923 7,960 7,993 Current taxes on income, wealth, etc. 1,154 1,034 1,060 1,079 1,091 1,108 1,117 1,128 Social contributions 1,670 1,674 1,698 1,709 1,720 1,734 1,749 1,756 Social benefits other than social transfers in kind 1,648 1,767 1,812 1,817 1,823 1,831 1,840 1,850 Other current transfers 671 669 669 669 672 674 672 674 Net non-life insurance premiums 188 182 183 182 182 182 181 182 Non-life insurance claims 184 178 179 178 178 178 177 178 Other 299 308 307 308 313 314 314 314 Net disposable income
Use of income account
Net disposable income 7,704 7,419 7,633 7,700 7,760 7,814 7,849 7,881 Final consumption expenditure Individual consumption expenditure Collective consumption expenditure Adjustment for the change in the net equity of households in pension fund reserves 70 62 55 55 56 57 57 58 Net saving
Capital account
Net saving 564 273 324 344 357 374 383 384 Gross capital formation Gross fixed capital formation Changes in inventories and acquisitions less disposals of valuables Consumption of fixed capital 1,361 1,386 1,418 1,429 1,438 1,447 1,454 1,460 Acquisitions less disposals of non-produced non-financial assets Capital transfers 161 193 235 223 214 179 176 171 Capital taxes 24 34 25 26 26 27 31 29 Other capital transfers 137 159 210 196 188 152 146 142 Net lending (+)/net borrowing (-) (from capital account)
Sources: ECB and Eurostat.2) Gross domestic product is equal to the gross value added of all domestic sectors plus net taxes (i.e. taxes less subsidies) on products.
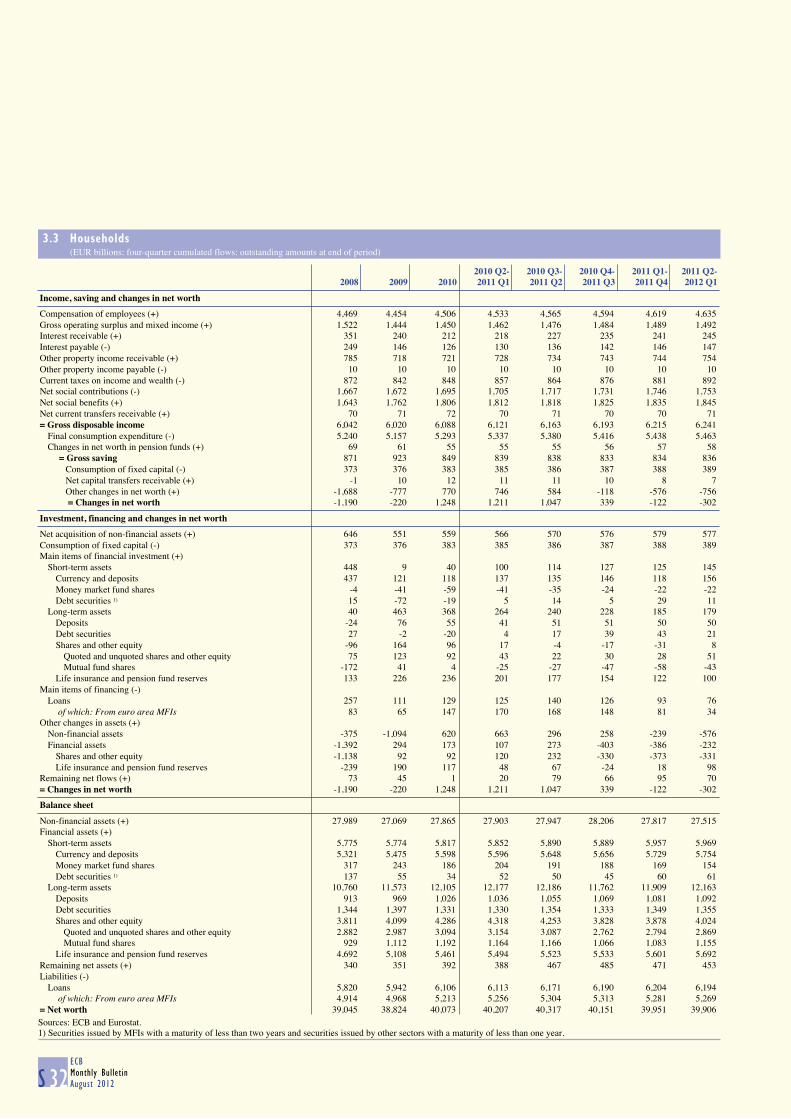
3.3 Households (EUR billions; four-quarter cumulated flows; outstanding amounts at end of period)
S 32ECBMonthly BulletinAugust 2012
2010 Q2- 2010 Q3- 2010 Q4- 2011 Q1- 2011 Q2-2008 2009 2010 2011 Q1 2011 Q2 2011 Q3 2011 Q4 2012 Q1
Income, saving and changes in net worth
Compensation of employees (+) 4,469 4,454 4,506 4,533 4,565 4,594 4,619 4,635 Gross operating surplus and mixed income (+) 1,522 1,444 1,450 1,462 1,476 1,484 1,489 1,492 Interest receivable (+) 351 240 212 218 227 235 241 245 Interest payable (-) 249 146 126 130 136 142 146 147 Other property income receivable (+) 785 718 721 728 734 743 744 754 Other property income payable (-) 10 10 10 10 10 10 10 10 Current taxes on income and wealth (-) 872 842 848 857 864 876 881 892 Net social contributions (-) 1,667 1,672 1,695 1,705 1,717 1,731 1,746 1,753 Net social benefits (+) 1,643 1,762 1,806 1,812 1,818 1,825 1,835 1,845 Net current transfers receivable (+) 70 71 72 70 71 70 70 71 = Gross disposable income 6,042 6,020 6,088 6,121 6,163 6,193 6,215 6,241 Final consumption expenditure (-) 5,240 5,157 5,293 5,337 5,380 5,416 5,438 5,463 Changes in net worth in pension funds (+) 69 61 55 55 55 56 57 58 = Gross saving 871 923 849 839 838 833 834 836 Consumption of fixed capital (-) 373 376 383 385 386 387 388 389 Net capital transfers receivable (+) -1 10 12 11 11 10 8 7 Other changes in net worth (+) -1,688 -777 770 746 584 -118 -576 -756 = Changes in net worth -1,190 -220 1,248 1,211 1,047 339 -122 -302
Investment, financing and changes in net worth
Net acquisition of non-financial assets (+) 646 551 559 566 570 576 579 577 Consumption of fixed capital (-) 373 376 383 385 386 387 388 389 Main items of financial investment (+) Short-term assets 448 9 40 100 114 127 125 145 Currency and deposits 437 121 118 137 135 146 118 156 Money market fund shares -4 -41 -59 -41 -35 -24 -22 -22 Debt securities 1) 15 -72 -19 5 14 5 29 11 Long-term assets 40 463 368 264 240 228 185 179 Deposits -24 76 55 41 51 51 50 50 Debt securities 27 -2 -20 4 17 39 43 21 Shares and other equity -96 164 96 17 -4 -17 -31 8 Quoted and unquoted shares and other equity 75 123 92 43 22 30 28 51 Mutual fund shares -172 41 4 -25 -27 -47 -58 -43 Life insurance and pension fund reserves 133 226 236 201 177 154 122 100 Main items of financing (-) Loans 257 111 129 125 140 126 93 76 of which: From euro area MFIs 83 65 147 170 168 148 81 34 Other changes in assets (+) Non-financial assets -375 -1,094 620 663 296 258 -239 -576 Financial assets -1,392 294 173 107 273 -403 -386 -232 Shares and other equity -1,138 92 92 120 232 -330 -373 -331 Life insurance and pension fund reserves -239 190 117 48 67 -24 18 98 Remaining net flows (+) 73 45 1 20 79 66 95 70 = Changes in net worth -1,190 -220 1,248 1,211 1,047 339 -122 -302
Balance sheet
Non-financial assets (+) 27,989 27,069 27,865 27,903 27,947 28,206 27,817 27,515 Financial assets (+) Short-term assets 5,775 5,774 5,817 5,852 5,890 5,889 5,957 5,969 Currency and deposits 5,321 5,475 5,598 5,596 5,648 5,656 5,729 5,754 Money market fund shares 317 243 186 204 191 188 169 154 Debt securities 1) 137 55 34 52 50 45 60 61 Long-term assets 10,760 11,573 12,105 12,177 12,186 11,762 11,909 12,163 Deposits 913 969 1,026 1,036 1,055 1,069 1,081 1,092 Debt securities 1,344 1,397 1,331 1,330 1,354 1,333 1,349 1,355 Shares and other equity 3,811 4,099 4,286 4,318 4,253 3,828 3,878 4,024 Quoted and unquoted shares and other equity 2,882 2,987 3,094 3,154 3,087 2,762 2,794 2,869 Mutual fund shares 929 1,112 1,192 1,164 1,166 1,066 1,083 1,155 Life insurance and pension fund reserves 4,692 5,108 5,461 5,494 5,523 5,533 5,601 5,692 Remaining net assets (+) 340 351 392 388 467 485 471 453 Liabilities (-) Loans 5,820 5,942 6,106 6,113 6,171 6,190 6,204 6,194 of which: From euro area MFIs 4,914 4,968 5,213 5,256 5,304 5,313 5,281 5,269 = Net worth 39,045 38,824 40,073 40,207 40,317 40,151 39,951 39,906Sources: ECB and Eurostat.1) Securities issued by MFIs with a maturity of less than two years and securities issued by other sectors with a maturity of less than one year.
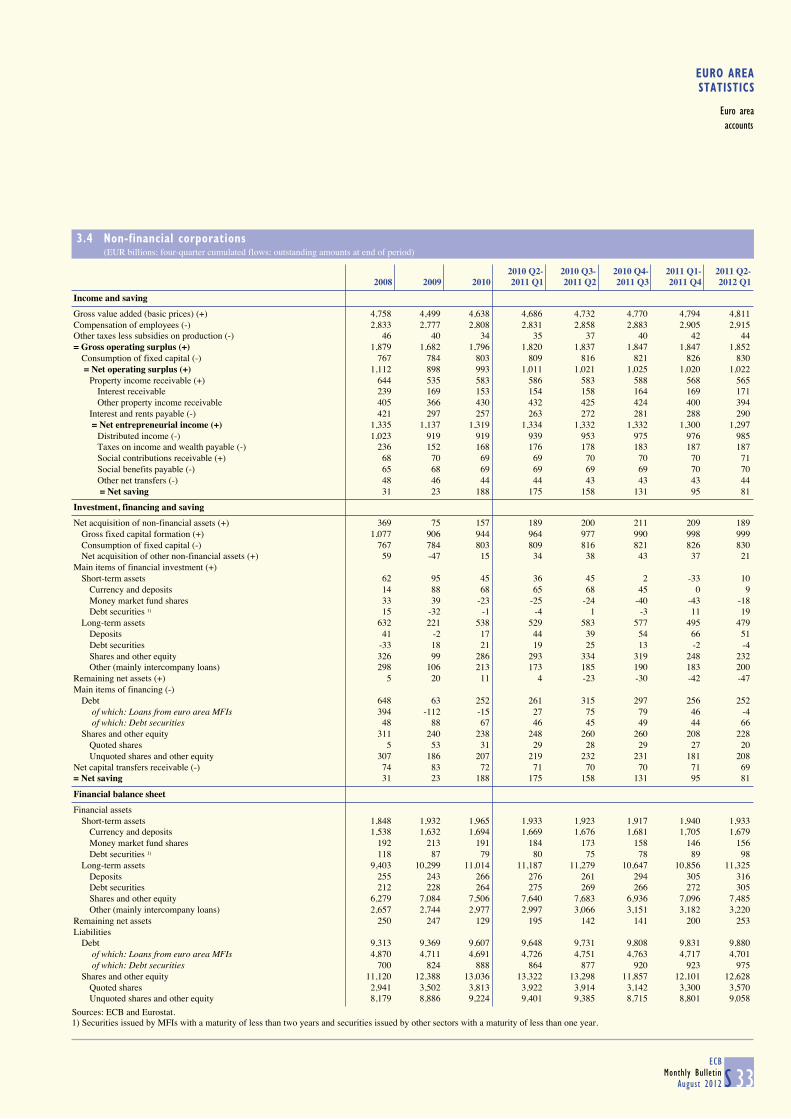
EURO AREASTATISTICS
Euro areaaccounts
3.4 Non-financial corporations (EUR billions; four-quarter cumulated flows; outstanding amounts at end of period)
S 33ECB
Monthly BulletinAugust 2012
2010 Q2- 2010 Q3- 2010 Q4- 2011 Q1- 2011 Q2-2008 2009 2010 2011 Q1 2011 Q2 2011 Q3 2011 Q4 2012 Q1
Income and saving
Gross value added (basic prices) (+) 4,758 4,499 4,638 4,686 4,732 4,770 4,794 4,811 Compensation of employees (-) 2,833 2,777 2,808 2,831 2,858 2,883 2,905 2,915 Other taxes less subsidies on production (-) 46 40 34 35 37 40 42 44 = Gross operating surplus (+) 1,879 1,682 1,796 1,820 1,837 1,847 1,847 1,852 Consumption of fixed capital (-) 767 784 803 809 816 821 826 830 = Net operating surplus (+) 1,112 898 993 1,011 1,021 1,025 1,020 1,022 Property income receivable (+) 644 535 583 586 583 588 568 565 Interest receivable 239 169 153 154 158 164 169 171 Other property income receivable 405 366 430 432 425 424 400 394 Interest and rents payable (-) 421 297 257 263 272 281 288 290 = Net entrepreneurial income (+) 1,335 1,137 1,319 1,334 1,332 1,332 1,300 1,297 Distributed income (-) 1,023 919 919 939 953 975 976 985 Taxes on income and wealth payable (-) 236 152 168 176 178 183 187 187 Social contributions receivable (+) 68 70 69 69 70 70 70 71 Social benefits payable (-) 65 68 69 69 69 69 70 70 Other net transfers (-) 48 46 44 44 43 43 43 44 = Net saving 31 23 188 175 158 131 95 81
Investment, financing and saving
Net acquisition of non-financial assets (+) 369 75 157 189 200 211 209 189 Gross fixed capital formation (+) 1,077 906 944 964 977 990 998 999 Consumption of fixed capital (-) 767 784 803 809 816 821 826 830 Net acquisition of other non-financial assets (+) 59 -47 15 34 38 43 37 21 Main items of financial investment (+) Short-term assets 62 95 45 36 45 2 -33 10 Currency and deposits 14 88 68 65 68 45 0 9 Money market fund shares 33 39 -23 -25 -24 -40 -43 -18 Debt securities 1) 15 -32 -1 -4 1 -3 11 19 Long-term assets 632 221 538 529 583 577 495 479 Deposits 41 -2 17 44 39 54 66 51 Debt securities -33 18 21 19 25 13 -2 -4 Shares and other equity 326 99 286 293 334 319 248 232 Other (mainly intercompany loans) 298 106 213 173 185 190 183 200 Remaining net assets (+) 5 20 11 4 -23 -30 -42 -47 Main items of financing (-) Debt 648 63 252 261 315 297 256 252 of which: Loans from euro area MFIs 394 -112 -15 27 75 79 46 -4 of which: Debt securities 48 88 67 46 45 49 44 66 Shares and other equity 311 240 238 248 260 260 208 228 Quoted shares 5 53 31 29 28 29 27 20 Unquoted shares and other equity 307 186 207 219 232 231 181 208 Net capital transfers receivable (-) 74 83 72 71 70 70 71 69 = Net saving 31 23 188 175 158 131 95 81
Financial balance sheet
Financial assets Short-term assets 1,848 1,932 1,965 1,933 1,923 1,917 1,940 1,933 Currency and deposits 1,538 1,632 1,694 1,669 1,676 1,681 1,705 1,679 Money market fund shares 192 213 191 184 173 158 146 156 Debt securities 1) 118 87 79 80 75 78 89 98 Long-term assets 9,403 10,299 11,014 11,187 11,279 10,647 10,856 11,325 Deposits 255 243 266 276 261 294 305 316 Debt securities 212 228 264 275 269 266 272 305 Shares and other equity 6,279 7,084 7,506 7,640 7,683 6,936 7,096 7,485 Other (mainly intercompany loans) 2,657 2,744 2,977 2,997 3,066 3,151 3,182 3,220 Remaining net assets 250 247 129 195 142 141 200 253 Liabilities Debt 9,313 9,369 9,607 9,648 9,731 9,808 9,831 9,880 of which: Loans from euro area MFIs 4,870 4,711 4,691 4,726 4,751 4,763 4,717 4,701 of which: Debt securities 700 824 888 864 877 920 923 975 Shares and other equity 11,120 12,388 13,036 13,322 13,298 11,857 12,101 12,628 Quoted shares 2,941 3,502 3,813 3,922 3,914 3,142 3,300 3,570 Unquoted shares and other equity 8,179 8,886 9,224 9,401 9,385 8,715 8,801 9,058
Sources: ECB and Eurostat.1) Securities issued by MFIs with a maturity of less than two years and securities issued by other sectors with a maturity of less than one year.
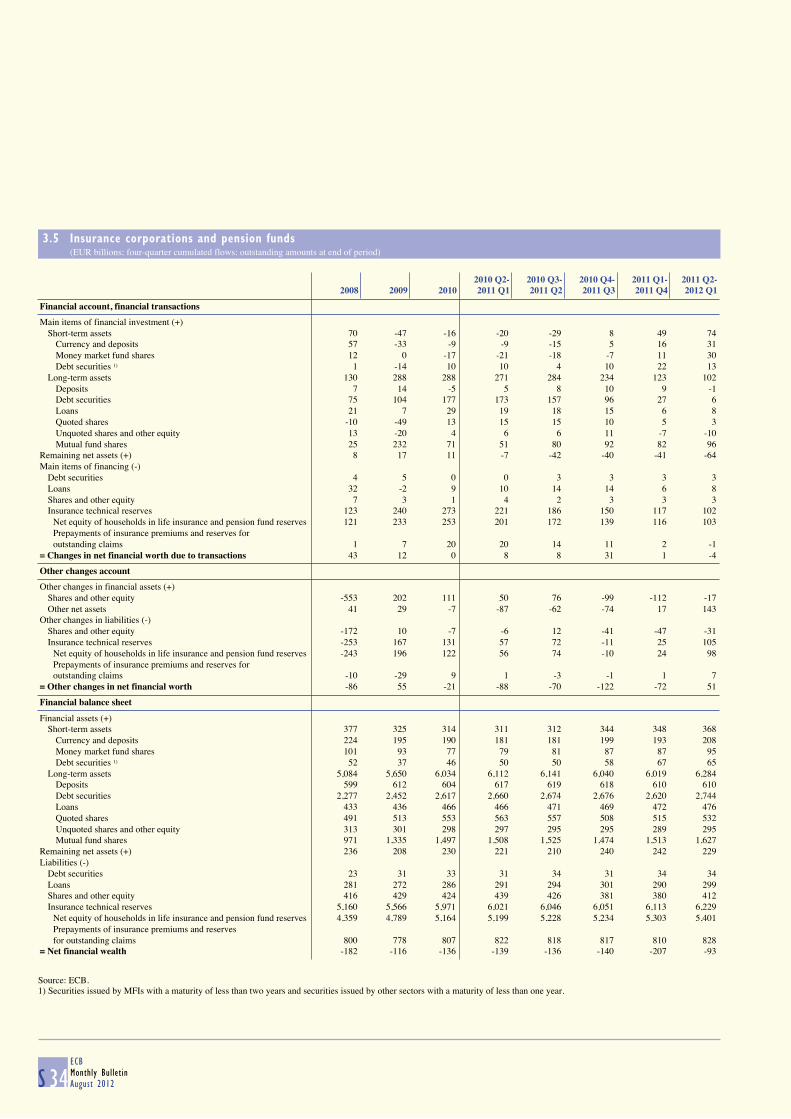
3.5 Insurance corporations and pension funds (EUR billions; four-quarter cumulated flows; outstanding amounts at end of period)
S 34ECBMonthly BulletinAugust 2012
2010 Q2- 2010 Q3- 2010 Q4- 2011 Q1- 2011 Q2-2008 2009 2010 2011 Q1 2011 Q2 2011 Q3 2011 Q4 2012 Q1
Financial account, financial transactions
Main items of financial investment (+) Short-term assets 70 -47 -16 -20 -29 8 49 74 Currency and deposits 57 -33 -9 -9 -15 5 16 31 Money market fund shares 12 0 -17 -21 -18 -7 11 30 Debt securities 1) 1 -14 10 10 4 10 22 13 Long-term assets 130 288 288 271 284 234 123 102 Deposits 7 14 -5 5 8 10 9 -1 Debt securities 75 104 177 173 157 96 27 6 Loans 21 7 29 19 18 15 6 8 Quoted shares -10 -49 13 15 15 10 5 3 Unquoted shares and other equity 13 -20 4 6 6 11 -7 -10 Mutual fund shares 25 232 71 51 80 92 82 96 Remaining net assets (+) 8 17 11 -7 -42 -40 -41 -64 Main items of financing (-) Debt securities 4 5 0 0 3 3 3 3 Loans 32 -2 9 10 14 14 6 8 Shares and other equity 7 3 1 4 2 3 3 3 Insurance technical reserves 123 240 273 221 186 150 117 102 Net equity of households in life insurance and pension fund reserves 121 233 253 201 172 139 116 103 Prepayments of insurance premiums and reserves for outstanding claims 1 7 20 20 14 11 2 -1 = Changes in net financial worth due to transactions 43 12 0 8 8 31 1 -4
Other changes account
Other changes in financial assets (+) Shares and other equity -553 202 111 50 76 -99 -112 -17 Other net assets 41 29 -7 -87 -62 -74 17 143 Other changes in liabilities (-) Shares and other equity -172 10 -7 -6 12 -41 -47 -31 Insurance technical reserves -253 167 131 57 72 -11 25 105 Net equity of households in life insurance and pension fund reserves -243 196 122 56 74 -10 24 98 Prepayments of insurance premiums and reserves for outstanding claims -10 -29 9 1 -3 -1 1 7 = Other changes in net financial worth -86 55 -21 -88 -70 -122 -72 51
Financial balance sheet
Financial assets (+) Short-term assets 377 325 314 311 312 344 348 368 Currency and deposits 224 195 190 181 181 199 193 208 Money market fund shares 101 93 77 79 81 87 87 95 Debt securities 1) 52 37 46 50 50 58 67 65 Long-term assets 5,084 5,650 6,034 6,112 6,141 6,040 6,019 6,284 Deposits 599 612 604 617 619 618 610 610 Debt securities 2,277 2,452 2,617 2,660 2,674 2,676 2,620 2,744 Loans 433 436 466 466 471 469 472 476 Quoted shares 491 513 553 563 557 508 515 532 Unquoted shares and other equity 313 301 298 297 295 295 289 295 Mutual fund shares 971 1,335 1,497 1,508 1,525 1,474 1,513 1,627 Remaining net assets (+) 236 208 230 221 210 240 242 229 Liabilities (-) Debt securities 23 31 33 31 34 31 34 34 Loans 281 272 286 291 294 301 290 299 Shares and other equity 416 429 424 439 426 381 380 412 Insurance technical reserves 5,160 5,566 5,971 6,021 6,046 6,051 6,113 6,229 Net equity of households in life insurance and pension fund reserves 4,359 4,789 5,164 5,199 5,228 5,234 5,303 5,401 Prepayments of insurance premiums and reserves for outstanding claims 800 778 807 822 818 817 810 828 = Net financial wealth -182 -116 -136 -139 -136 -140 -207 -93
Source: ECB.1) Securities issued by MFIs with a maturity of less than two years and securities issued by other sectors with a maturity of less than one year.
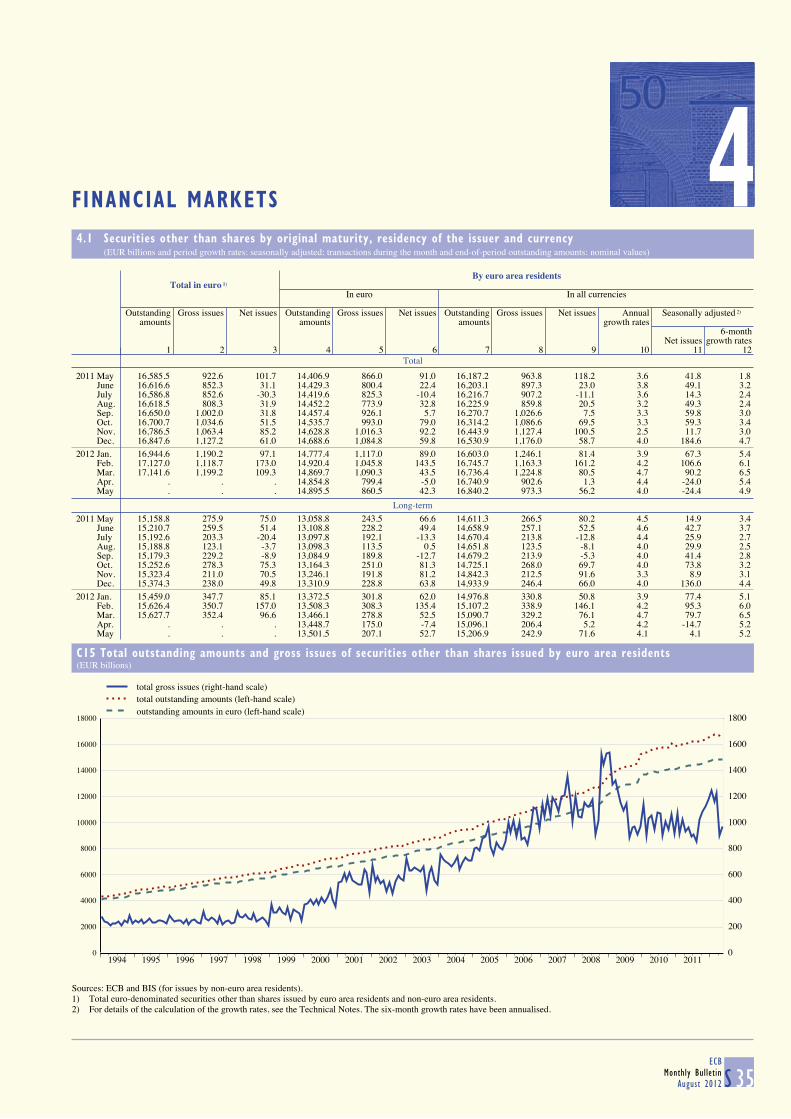
4FINANCIAL MARKETS
4.1 Securities other than shares by original maturity, residency of the issuer and currency (EUR billions and period growth rates; seasonally adjusted; transactions during the month and end-of-period outstanding amounts; nominal values)
S 35ECB
Monthly BulletinAugust 2012
Total
By euro area residents
Total in euro 1) In euro In all currencies
Outstanding Gross issues Net issues Outstanding Gross issues Net issues Outstanding Gross issues Net issues Annual Seasonally adjusted 2)
amounts amounts amounts growth rates6-month
Net issues growth rates1 2 3 4 5 6 7 8 9 10 11 12
2011 May 16,585.5 922.6 101.7 14,406.9 866.0 91.0 16,187.2 963.8 118.2 3.6 41.8 1.8 June 16,616.6 852.3 31.1 14,429.3 800.4 22.4 16,203.1 897.3 23.0 3.8 49.1 3.2 July 16,586.8 852.6 -30.3 14,419.6 825.3 -10.4 16,216.7 907.2 -11.1 3.6 14.3 2.4 Aug. 16,618.5 808.3 31.9 14,452.2 773.9 32.8 16,225.9 859.8 20.5 3.2 49.3 2.4 Sep. 16,650.0 1,002.0 31.8 14,457.4 926.1 5.7 16,270.7 1,026.6 7.5 3.3 59.8 3.0 Oct. 16,700.7 1,034.6 51.5 14,535.7 993.0 79.0 16,314.2 1,086.6 69.5 3.3 59.3 3.4 Nov. 16,786.5 1,063.4 85.2 14,628.8 1,016.3 92.2 16,443.9 1,127.4 100.5 2.5 11.7 3.0 Dec. 16,847.6 1,127.2 61.0 14,688.6 1,084.8 59.8 16,530.9 1,176.0 58.7 4.0 184.6 4.7
2012 Jan. 16,944.6 1,190.2 97.1 14,777.4 1,117.0 89.0 16,603.0 1,246.1 81.4 3.9 67.3 5.4 Feb. 17,127.0 1,118.7 173.0 14,920.4 1,045.8 143.5 16,745.7 1,163.3 161.2 4.2 106.6 6.1 Mar. 17,141.6 1,199.2 109.3 14,869.7 1,090.3 43.5 16,736.4 1,224.8 80.5 4.7 90.2 6.5 Apr. . . . 14,854.8 799.4 -5.0 16,740.9 902.6 1.3 4.4 -24.0 5.4 May . . . 14,895.5 860.5 42.3 16,840.2 973.3 56.2 4.0 -24.4 4.9
Long-term
2011 May 15,158.8 275.9 75.0 13,058.8 243.5 66.6 14,611.3 266.5 80.2 4.5 14.9 3.4 June 15,210.7 259.5 51.4 13,108.8 228.2 49.4 14,658.9 257.1 52.5 4.6 42.7 3.7 July 15,192.6 203.3 -20.4 13,097.8 192.1 -13.3 14,670.4 213.8 -12.8 4.4 25.9 2.7 Aug. 15,188.8 123.1 -3.7 13,098.3 113.5 0.5 14,651.8 123.5 -8.1 4.0 29.9 2.5 Sep. 15,179.3 229.2 -8.9 13,084.9 189.8 -12.7 14,679.2 213.9 -5.3 4.0 41.4 2.8 Oct. 15,252.6 278.3 75.3 13,164.3 251.0 81.3 14,725.1 268.0 69.7 4.0 73.8 3.2 Nov. 15,323.4 211.0 70.5 13,246.1 191.8 81.2 14,842.3 212.5 91.6 3.3 8.9 3.1 Dec. 15,374.3 238.0 49.8 13,310.9 228.8 63.8 14,933.9 246.4 66.0 4.0 136.0 4.4
2012 Jan. 15,459.0 347.7 85.1 13,372.5 301.8 62.0 14,976.8 330.8 50.8 3.9 77.4 5.1 Feb. 15,626.4 350.7 157.0 13,508.3 308.3 135.4 15,107.2 338.9 146.1 4.2 95.3 6.0 Mar. 15,627.7 352.4 96.6 13,466.1 278.8 52.5 15,090.7 329.2 76.1 4.7 79.7 6.5 Apr. . . . 13,448.7 175.0 -7.4 15,096.1 206.4 5.2 4.2 -14.7 5.2 May . . . 13,501.5 207.1 52.7 15,206.9 242.9 71.6 4.1 4.1 5.2
C15 Total outstanding amounts and gross issues of securities other than shares issued by euro area residents
(EUR billions)
0
2000
4000
6000
8000
10000
12000
14000
16000
18000
1994 1995 1996 1997 1998 1999 2000 2001 2002 2003 2004 2005 2006 2007 2008 2009 2010 20110
200
400
600
800
1000
1200
1400
1600
1800
total gross issues (right-hand scale)total outstanding amounts (left-hand scale)outstanding amounts in euro (left-hand scale)
Sources: ECB and BIS (for issues by non-euro area residents).1) Total euro-denominated securities other than shares issued by euro area residents and non-euro area residents.2) For details of the calculation of the growth rates, see the Technical Notes. The six-month growth rates have been annualised.
4
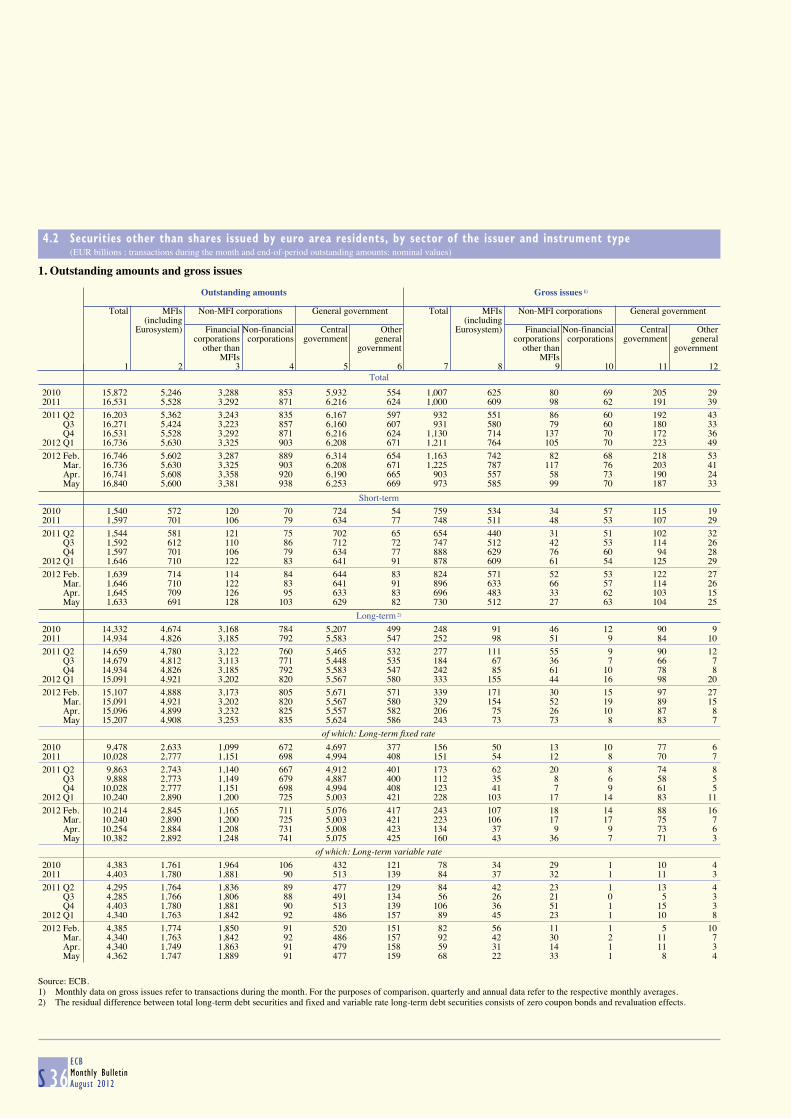
4.2 Securities other than shares issued by euro area residents, by sector of the issuer and instrument type (EUR billions ; transactions during the month and end-of-period outstanding amounts; nominal values)
S 36ECBMonthly BulletinAugust 2012
1. Outstanding amounts and gross issues
Total
Outstanding amounts Gross issues 1)
Total MFIs Non-MFI corporations General government Total MFIs Non-MFI corporations General government
(including (includingEurosystem) Financial Non-financial Central Other Eurosystem) Financial Non-financial Central Other
corporations corporations government general corporations corporations government generalother than government other than government
MFIs MFIs1 2 3 4 5 6 7 8 9 10 11 12
2010 15,872 5,246 3,288 853 5,932 554 1,007 625 80 69 205 292011 16,531 5,528 3,292 871 6,216 624 1,000 609 98 62 191 39
2011 Q2 16,203 5,362 3,243 835 6,167 597 932 551 86 60 192 43 Q3 16,271 5,424 3,223 857 6,160 607 931 580 79 60 180 33 Q4 16,531 5,528 3,292 871 6,216 624 1,130 714 137 70 172 362012 Q1 16,736 5,630 3,325 903 6,208 671 1,211 764 105 70 223 49
2012 Feb. 16,746 5,602 3,287 889 6,314 654 1,163 742 82 68 218 53 Mar. 16,736 5,630 3,325 903 6,208 671 1,225 787 117 76 203 41 Apr. 16,741 5,608 3,358 920 6,190 665 903 557 58 73 190 24 May 16,840 5,600 3,381 938 6,253 669 973 585 99 70 187 33
Short-term
2010 1,540 572 120 70 724 54 759 534 34 57 115 192011 1,597 701 106 79 634 77 748 511 48 53 107 29
2011 Q2 1,544 581 121 75 702 65 654 440 31 51 102 32 Q3 1,592 612 110 86 712 72 747 512 42 53 114 26 Q4 1,597 701 106 79 634 77 888 629 76 60 94 282012 Q1 1,646 710 122 83 641 91 878 609 61 54 125 29
2012 Feb. 1,639 714 114 84 644 83 824 571 52 53 122 27 Mar. 1,646 710 122 83 641 91 896 633 66 57 114 26 Apr. 1,645 709 126 95 633 83 696 483 33 62 103 15 May 1,633 691 128 103 629 82 730 512 27 63 104 25
Long-term 2)
2010 14,332 4,674 3,168 784 5,207 499 248 91 46 12 90 92011 14,934 4,826 3,185 792 5,583 547 252 98 51 9 84 10
2011 Q2 14,659 4,780 3,122 760 5,465 532 277 111 55 9 90 12 Q3 14,679 4,812 3,113 771 5,448 535 184 67 36 7 66 7 Q4 14,934 4,826 3,185 792 5,583 547 242 85 61 10 78 82012 Q1 15,091 4,921 3,202 820 5,567 580 333 155 44 16 98 20
2012 Feb. 15,107 4,888 3,173 805 5,671 571 339 171 30 15 97 27 Mar. 15,091 4,921 3,202 820 5,567 580 329 154 52 19 89 15 Apr. 15,096 4,899 3,232 825 5,557 582 206 75 26 10 87 8 May 15,207 4,908 3,253 835 5,624 586 243 73 73 8 83 7
of which: Long-term fixed rate
2010 9,478 2,633 1,099 672 4,697 377 156 50 13 10 77 62011 10,028 2,777 1,151 698 4,994 408 151 54 12 8 70 7
2011 Q2 9,863 2,743 1,140 667 4,912 401 173 62 20 8 74 8 Q3 9,888 2,773 1,149 679 4,887 400 112 35 8 6 58 5 Q4 10,028 2,777 1,151 698 4,994 408 123 41 7 9 61 52012 Q1 10,240 2,890 1,200 725 5,003 421 228 103 17 14 83 11
2012 Feb. 10,214 2,845 1,165 711 5,076 417 243 107 18 14 88 16 Mar. 10,240 2,890 1,200 725 5,003 421 223 106 17 17 75 7 Apr. 10,254 2,884 1,208 731 5,008 423 134 37 9 9 73 6 May 10,382 2,892 1,248 741 5,075 425 160 43 36 7 71 3
of which: Long-term variable rate
2010 4,383 1,761 1,964 106 432 121 78 34 29 1 10 42011 4,403 1,780 1,881 90 513 139 84 37 32 1 11 3
2011 Q2 4,295 1,764 1,836 89 477 129 84 42 23 1 13 4 Q3 4,285 1,766 1,806 88 491 134 56 26 21 0 5 3 Q4 4,403 1,780 1,881 90 513 139 106 36 51 1 15 32012 Q1 4,340 1,763 1,842 92 486 157 89 45 23 1 10 8
2012 Feb. 4,385 1,774 1,850 91 520 151 82 56 11 1 5 10 Mar. 4,340 1,763 1,842 92 486 157 92 42 30 2 11 7 Apr. 4,340 1,749 1,863 91 479 158 59 31 14 1 11 3 May 4,362 1,747 1,889 91 477 159 68 22 33 1 8 4
Source: ECB.1) Monthly data on gross issues refer to transactions during the month. For the purposes of comparison, quarterly and annual data refer to the respective monthly averages.2) The residual difference between total long-term debt securities and fixed and variable rate long-term debt securities consists of zero coupon bonds and revaluation effects.
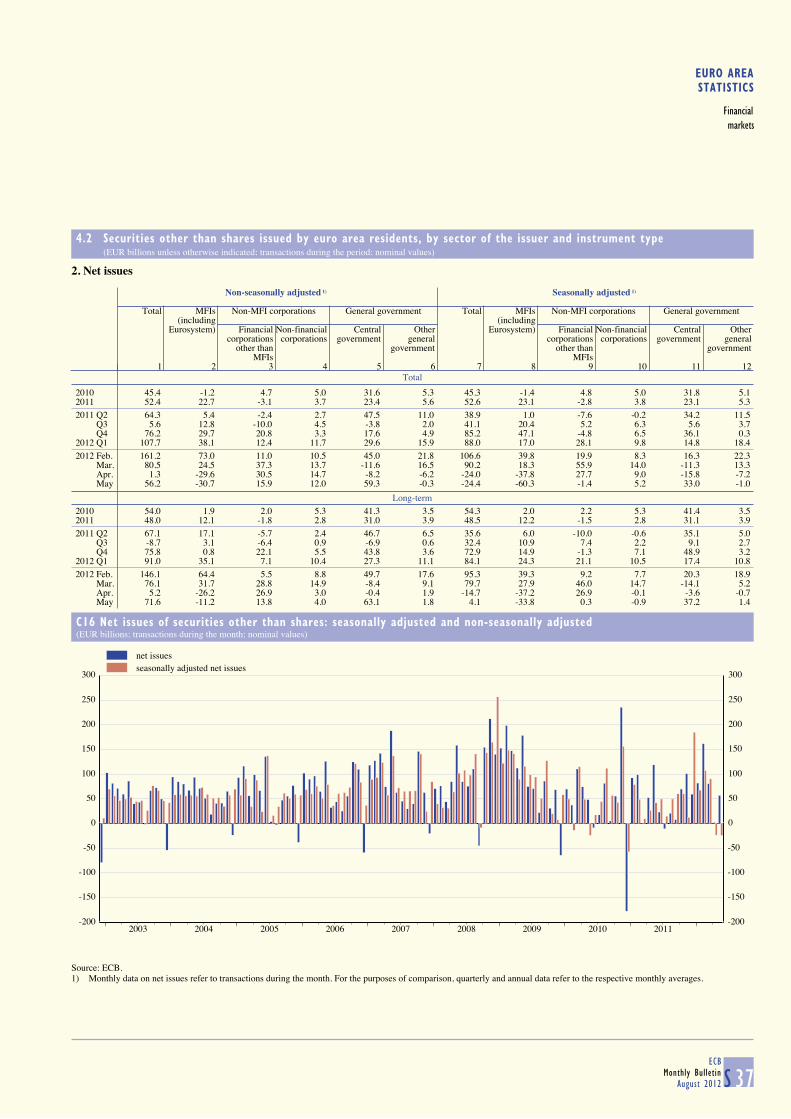
EURO AREASTATISTICS
Financialmarkets
4.2 Securities other than shares issued by euro area residents, by sector of the issuer and instrument type (EUR billions unless otherwise indicated; transactions during the period; nominal values)
S 37ECB
Monthly BulletinAugust 2012
2. Net issues
Total
Non-seasonally adjusted 1) Seasonally adjusted 1)
Total MFIs Non-MFI corporations General government Total MFIs Non-MFI corporations General government
(including (includingEurosystem) Financial Non-financial Central Other Eurosystem) Financial Non-financial Central Other
corporations corporations government general corporations corporations government generalother than government other than government
MFIs MFIs1 2 3 4 5 6 7 8 9 10 11 12
2010 45.4 -1.2 4.7 5.0 31.6 5.3 45.3 -1.4 4.8 5.0 31.8 5.12011 52.4 22.7 -3.1 3.7 23.4 5.6 52.6 23.1 -2.8 3.8 23.1 5.3
2011 Q2 64.3 5.4 -2.4 2.7 47.5 11.0 38.9 1.0 -7.6 -0.2 34.2 11.5 Q3 5.6 12.8 -10.0 4.5 -3.8 2.0 41.1 20.4 5.2 6.3 5.6 3.7 Q4 76.2 29.7 20.8 3.3 17.6 4.9 85.2 47.1 -4.8 6.5 36.1 0.32012 Q1 107.7 38.1 12.4 11.7 29.6 15.9 88.0 17.0 28.1 9.8 14.8 18.4
2012 Feb. 161.2 73.0 11.0 10.5 45.0 21.8 106.6 39.8 19.9 8.3 16.3 22.3 Mar. 80.5 24.5 37.3 13.7 -11.6 16.5 90.2 18.3 55.9 14.0 -11.3 13.3 Apr. 1.3 -29.6 30.5 14.7 -8.2 -6.2 -24.0 -37.8 27.7 9.0 -15.8 -7.2 May 56.2 -30.7 15.9 12.0 59.3 -0.3 -24.4 -60.3 -1.4 5.2 33.0 -1.0
Long-term
2010 54.0 1.9 2.0 5.3 41.3 3.5 54.3 2.0 2.2 5.3 41.4 3.52011 48.0 12.1 -1.8 2.8 31.0 3.9 48.5 12.2 -1.5 2.8 31.1 3.9
2011 Q2 67.1 17.1 -5.7 2.4 46.7 6.5 35.6 6.0 -10.0 -0.6 35.1 5.0 Q3 -8.7 3.1 -6.4 0.9 -6.9 0.6 32.4 10.9 7.4 2.2 9.1 2.7 Q4 75.8 0.8 22.1 5.5 43.8 3.6 72.9 14.9 -1.3 7.1 48.9 3.22012 Q1 91.0 35.1 7.1 10.4 27.3 11.1 84.1 24.3 21.1 10.5 17.4 10.8
2012 Feb. 146.1 64.4 5.5 8.8 49.7 17.6 95.3 39.3 9.2 7.7 20.3 18.9 Mar. 76.1 31.7 28.8 14.9 -8.4 9.1 79.7 27.9 46.0 14.7 -14.1 5.2 Apr. 5.2 -26.2 26.9 3.0 -0.4 1.9 -14.7 -37.2 26.9 -0.1 -3.6 -0.7 May 71.6 -11.2 13.8 4.0 63.1 1.8 4.1 -33.8 0.3 -0.9 37.2 1.4
C16 Net issues of securities other than shares: seasonally adjusted and non-seasonally adjusted
(EUR billions; transactions during the month; nominal values)
-200
-150
-100
-50
0
50
100
150
200
250
300
2003 2004 2005 2006 2007 2008 2009 2010 2011-200
-150
-100
-50
0
50
100
150
200
250
300
net issuesseasonally adjusted net issues
Source: ECB.1) Monthly data on net issues refer to transactions during the month. For the purposes of comparison, quarterly and annual data refer to the respective monthly averages.
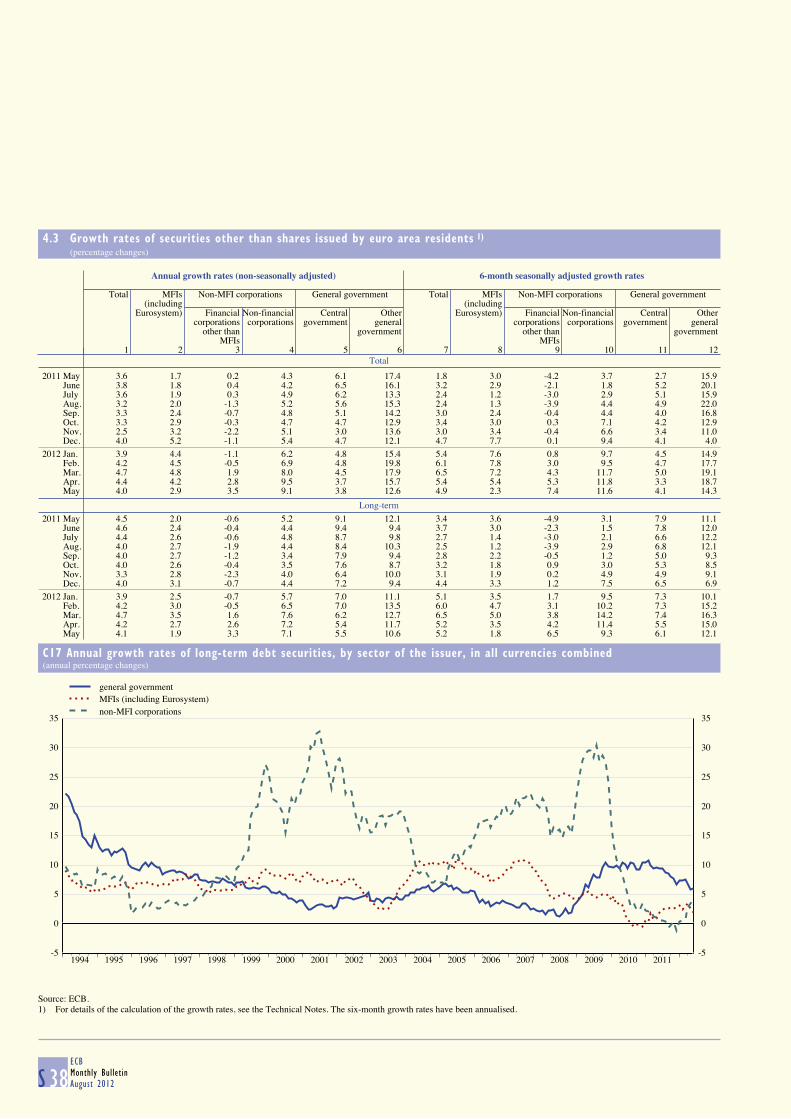
4.3 Growth rates of securities other than shares issued by euro area residents 1) (percentage changes)
S 38ECBMonthly BulletinAugust 2012
Total
Annual growth rates (non-seasonally adjusted) 6-month seasonally adjusted growth rates
Total MFIs Non-MFI corporations General government Total MFIs Non-MFI corporations General government
(including (includingEurosystem) Financial Non-financial Central Other Eurosystem) Financial Non-financial Central Other
corporations corporations government general corporations corporations government generalother than government other than government
MFIs MFIs1 2 3 4 5 6 7 8 9 10 11 12
2011 May 3.6 1.7 0.2 4.3 6.1 17.4 1.8 3.0 -4.2 3.7 2.7 15.9 June 3.8 1.8 0.4 4.2 6.5 16.1 3.2 2.9 -2.1 1.8 5.2 20.1 July 3.6 1.9 0.3 4.9 6.2 13.3 2.4 1.2 -3.0 2.9 5.1 15.9 Aug. 3.2 2.0 -1.3 5.2 5.6 15.3 2.4 1.3 -3.9 4.4 4.9 22.0 Sep. 3.3 2.4 -0.7 4.8 5.1 14.2 3.0 2.4 -0.4 4.4 4.0 16.8 Oct. 3.3 2.9 -0.3 4.7 4.7 12.9 3.4 3.0 0.3 7.1 4.2 12.9 Nov. 2.5 3.2 -2.2 5.1 3.0 13.6 3.0 3.4 -0.4 6.6 3.4 11.0 Dec. 4.0 5.2 -1.1 5.4 4.7 12.1 4.7 7.7 0.1 9.4 4.1 4.0
2012 Jan. 3.9 4.4 -1.1 6.2 4.8 15.4 5.4 7.6 0.8 9.7 4.5 14.9 Feb. 4.2 4.5 -0.5 6.9 4.8 19.8 6.1 7.8 3.0 9.5 4.7 17.7 Mar. 4.7 4.8 1.9 8.0 4.5 17.9 6.5 7.2 4.3 11.7 5.0 19.1 Apr. 4.4 4.2 2.8 9.5 3.7 15.7 5.4 5.4 5.3 11.8 3.3 18.7 May 4.0 2.9 3.5 9.1 3.8 12.6 4.9 2.3 7.4 11.6 4.1 14.3
Long-term
2011 May 4.5 2.0 -0.6 5.2 9.1 12.1 3.4 3.6 -4.9 3.1 7.9 11.1 June 4.6 2.4 -0.4 4.4 9.4 9.4 3.7 3.0 -2.3 1.5 7.8 12.0 July 4.4 2.6 -0.6 4.8 8.7 9.8 2.7 1.4 -3.0 2.1 6.6 12.2 Aug. 4.0 2.7 -1.9 4.4 8.4 10.3 2.5 1.2 -3.9 2.9 6.8 12.1 Sep. 4.0 2.7 -1.2 3.4 7.9 9.4 2.8 2.2 -0.5 1.2 5.0 9.3 Oct. 4.0 2.6 -0.4 3.5 7.6 8.7 3.2 1.8 0.9 3.0 5.3 8.5 Nov. 3.3 2.8 -2.3 4.0 6.4 10.0 3.1 1.9 0.2 4.9 4.9 9.1 Dec. 4.0 3.1 -0.7 4.4 7.2 9.4 4.4 3.3 1.2 7.5 6.5 6.9
2012 Jan. 3.9 2.5 -0.7 5.7 7.0 11.1 5.1 3.5 1.7 9.5 7.3 10.1 Feb. 4.2 3.0 -0.5 6.5 7.0 13.5 6.0 4.7 3.1 10.2 7.3 15.2 Mar. 4.7 3.5 1.6 7.6 6.2 12.7 6.5 5.0 3.8 14.2 7.4 16.3 Apr. 4.2 2.7 2.6 7.2 5.4 11.7 5.2 3.5 4.2 11.4 5.5 15.0 May 4.1 1.9 3.3 7.1 5.5 10.6 5.2 1.8 6.5 9.3 6.1 12.1
C17 Annual growth rates of long-term debt securities, by sector of the issuer, in all currencies combined
(annual percentage changes)
-5
0
5
10
15
20
25
30
35
1994 1995 1996 1997 1998 1999 2000 2001 2002 2003 2004 2005 2006 2007 2008 2009 2010 2011-5
0
5
10
15
20
25
30
35
general governmentMFIs (including Eurosystem)non-MFI corporations
Source: ECB.1) For details of the calculation of the growth rates, see the Technical Notes. The six-month growth rates have been annualised.
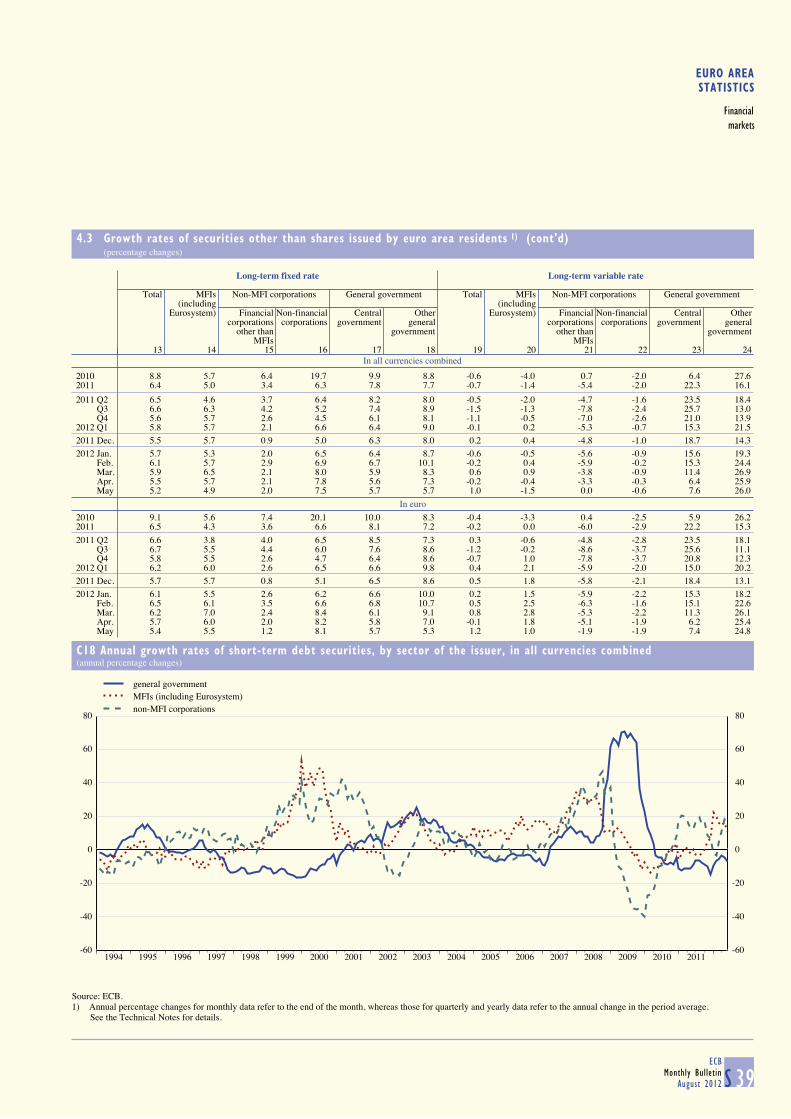
EURO AREASTATISTICS
Financialmarkets
4.3 Growth rates of securities other than shares issued by euro area residents 1) (cont'd) (percentage changes)
S 39ECB
Monthly BulletinAugust 2012
In all currencies combined
Long-term fixed rate Long-term variable rate
Total MFIs Non-MFI corporations General government Total MFIs Non-MFI corporations General government
(including (includingEurosystem) Financial Non-financial Central Other Eurosystem) Financial Non-financial Central Other
corporations corporations government general corporations corporations government generalother than government other than government
MFIs MFIs13 14 15 16 17 18 19 20 21 22 23 24
2010 8.8 5.7 6.4 19.7 9.9 8.8 -0.6 -4.0 0.7 -2.0 6.4 27.62011 6.4 5.0 3.4 6.3 7.8 7.7 -0.7 -1.4 -5.4 -2.0 22.3 16.1
2011 Q2 6.5 4.6 3.7 6.4 8.2 8.0 -0.5 -2.0 -4.7 -1.6 23.5 18.4 Q3 6.6 6.3 4.2 5.2 7.4 8.9 -1.5 -1.3 -7.8 -2.4 25.7 13.0 Q4 5.6 5.7 2.6 4.5 6.1 8.1 -1.1 -0.5 -7.0 -2.6 21.0 13.92012 Q1 5.8 5.7 2.1 6.6 6.4 9.0 -0.1 0.2 -5.3 -0.7 15.3 21.5
2011 Dec. 5.5 5.7 0.9 5.0 6.3 8.0 0.2 0.4 -4.8 -1.0 18.7 14.3
2012 Jan. 5.7 5.3 2.0 6.5 6.4 8.7 -0.6 -0.5 -5.6 -0.9 15.6 19.3 Feb. 6.1 5.7 2.9 6.9 6.7 10.1 -0.2 0.4 -5.9 -0.2 15.3 24.4 Mar. 5.9 6.5 2.1 8.0 5.9 8.3 0.6 0.9 -3.8 -0.9 11.4 26.9 Apr. 5.5 5.7 2.1 7.8 5.6 7.3 -0.2 -0.4 -3.3 -0.3 6.4 25.9 May 5.2 4.9 2.0 7.5 5.7 5.7 1.0 -1.5 0.0 -0.6 7.6 26.0
In euro
2010 9.1 5.6 7.4 20.1 10.0 8.3 -0.4 -3.3 0.4 -2.5 5.9 26.22011 6.5 4.3 3.6 6.6 8.1 7.2 -0.2 0.0 -6.0 -2.9 22.2 15.3
2011 Q2 6.6 3.8 4.0 6.5 8.5 7.3 0.3 -0.6 -4.8 -2.8 23.5 18.1 Q3 6.7 5.5 4.4 6.0 7.6 8.6 -1.2 -0.2 -8.6 -3.7 25.6 11.1 Q4 5.8 5.5 2.6 4.7 6.4 8.6 -0.7 1.0 -7.8 -3.7 20.8 12.32012 Q1 6.2 6.0 2.6 6.5 6.6 9.8 0.4 2.1 -5.9 -2.0 15.0 20.2
2011 Dec. 5.7 5.7 0.8 5.1 6.5 8.6 0.5 1.8 -5.8 -2.1 18.4 13.1
2012 Jan. 6.1 5.5 2.6 6.2 6.6 10.0 0.2 1.5 -5.9 -2.2 15.3 18.2 Feb. 6.5 6.1 3.5 6.6 6.8 10.7 0.5 2.5 -6.3 -1.6 15.1 22.6 Mar. 6.2 7.0 2.4 8.4 6.1 9.1 0.8 2.8 -5.3 -2.2 11.3 26.1 Apr. 5.7 6.0 2.0 8.2 5.8 7.0 -0.1 1.8 -5.1 -1.9 6.2 25.4 May 5.4 5.5 1.2 8.1 5.7 5.3 1.2 1.0 -1.9 -1.9 7.4 24.8
C18 Annual growth rates of short-term debt securities, by sector of the issuer, in all currencies combined
(annual percentage changes)
-60
-40
-20
0
20
40
60
80
1994 1995 1996 1997 1998 1999 2000 2001 2002 2003 2004 2005 2006 2007 2008 2009 2010 2011-60
-40
-20
0
20
40
60
80
general governmentMFIs (including Eurosystem)non-MFI corporations
Source: ECB.1) Annual percentage changes for monthly data refer to the end of the month, whereas those for quarterly and yearly data refer to the annual change in the period average. See the Technical Notes for details.
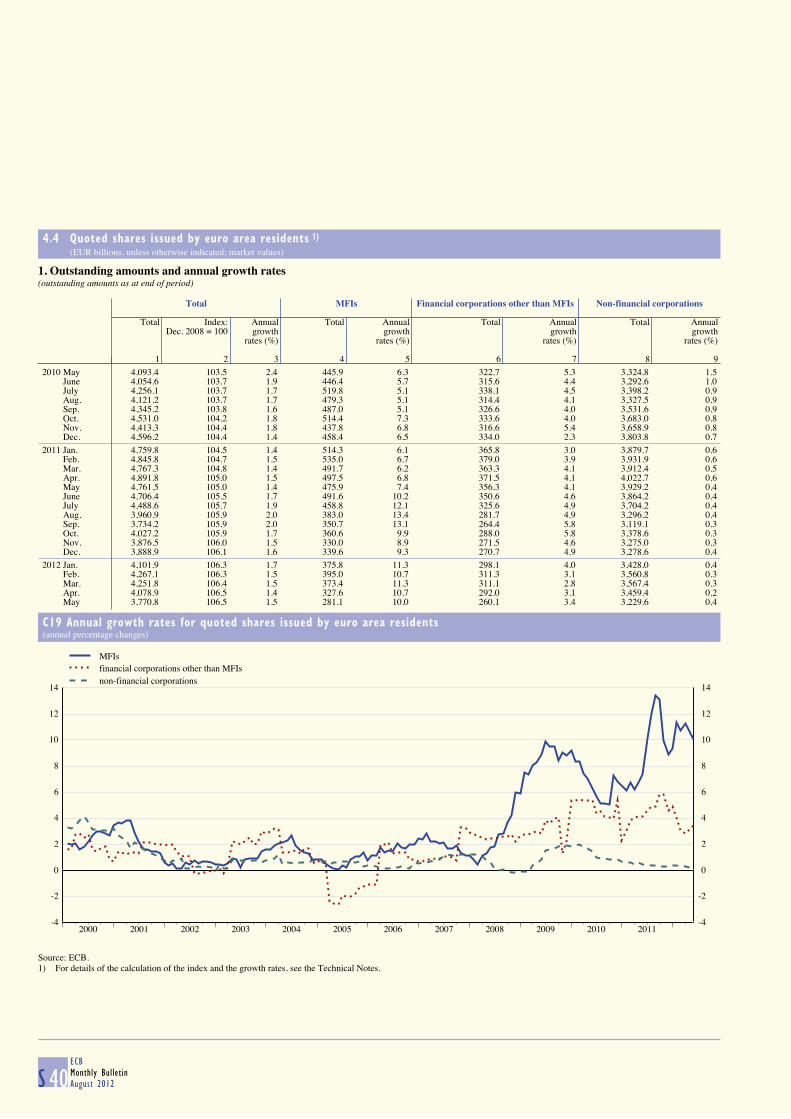
4.4 Quoted shares issued by euro area residents 1) (EUR billions, unless otherwise indicated; market values)
S 40ECBMonthly BulletinAugust 2012
1. Outstanding amounts and annual growth rates(outstanding amounts as at end of period)
Total MFIs Financial corporations other than MFIs Non-financial corporations
Total Index: Annual Total Annual Total Annual Total AnnualDec. 2008 = 100 growth growth growth growth
rates (%) rates (%) rates (%) rates (%)
1 2 3 4 5 6 7 8 9
2010 May 4,093.4 103.5 2.4 445.9 6.3 322.7 5.3 3,324.8 1.5 June 4,054.6 103.7 1.9 446.4 5.7 315.6 4.4 3,292.6 1.0 July 4,256.1 103.7 1.7 519.8 5.1 338.1 4.5 3,398.2 0.9 Aug. 4,121.2 103.7 1.7 479.3 5.1 314.4 4.1 3,327.5 0.9 Sep. 4,345.2 103.8 1.6 487.0 5.1 326.6 4.0 3,531.6 0.9 Oct. 4,531.0 104.2 1.8 514.4 7.3 333.6 4.0 3,683.0 0.8 Nov. 4,413.3 104.4 1.8 437.8 6.8 316.6 5.4 3,658.9 0.8 Dec. 4,596.2 104.4 1.4 458.4 6.5 334.0 2.3 3,803.8 0.7
2011 Jan. 4,759.8 104.5 1.4 514.3 6.1 365.8 3.0 3,879.7 0.6 Feb. 4,845.8 104.7 1.5 535.0 6.7 379.0 3.9 3,931.9 0.6 Mar. 4,767.3 104.8 1.4 491.7 6.2 363.3 4.1 3,912.4 0.5 Apr. 4,891.8 105.0 1.5 497.5 6.8 371.5 4.1 4,022.7 0.6 May 4,761.5 105.0 1.4 475.9 7.4 356.3 4.1 3,929.2 0.4 June 4,706.4 105.5 1.7 491.6 10.2 350.6 4.6 3,864.2 0.4 July 4,488.6 105.7 1.9 458.8 12.1 325.6 4.9 3,704.2 0.4 Aug. 3,960.9 105.9 2.0 383.0 13.4 281.7 4.9 3,296.2 0.4 Sep. 3,734.2 105.9 2.0 350.7 13.1 264.4 5.8 3,119.1 0.3 Oct. 4,027.2 105.9 1.7 360.6 9.9 288.0 5.8 3,378.6 0.3 Nov. 3,876.5 106.0 1.5 330.0 8.9 271.5 4.6 3,275.0 0.3 Dec. 3,888.9 106.1 1.6 339.6 9.3 270.7 4.9 3,278.6 0.4
2012 Jan. 4,101.9 106.3 1.7 375.8 11.3 298.1 4.0 3,428.0 0.4 Feb. 4,267.1 106.3 1.5 395.0 10.7 311.3 3.1 3,560.8 0.3 Mar. 4,251.8 106.4 1.5 373.4 11.3 311.1 2.8 3,567.4 0.3 Apr. 4,078.9 106.5 1.4 327.6 10.7 292.0 3.1 3,459.4 0.2 May 3,770.8 106.5 1.5 281.1 10.0 260.1 3.4 3,229.6 0.4
C19 Annual growth rates for quoted shares issued by euro area residents
(annual percentage changes)
-4
-2
0
2
4
6
8
10
12
14
2000 2001 2002 2003 2004 2005 2006 2007 2008 2009 2010 2011-4
-2
0
2
4
6
8
10
12
14
MFIsfinancial corporations other than MFIsnon-financial corporations
Source: ECB.1) For details of the calculation of the index and the growth rates, see the Technical Notes.
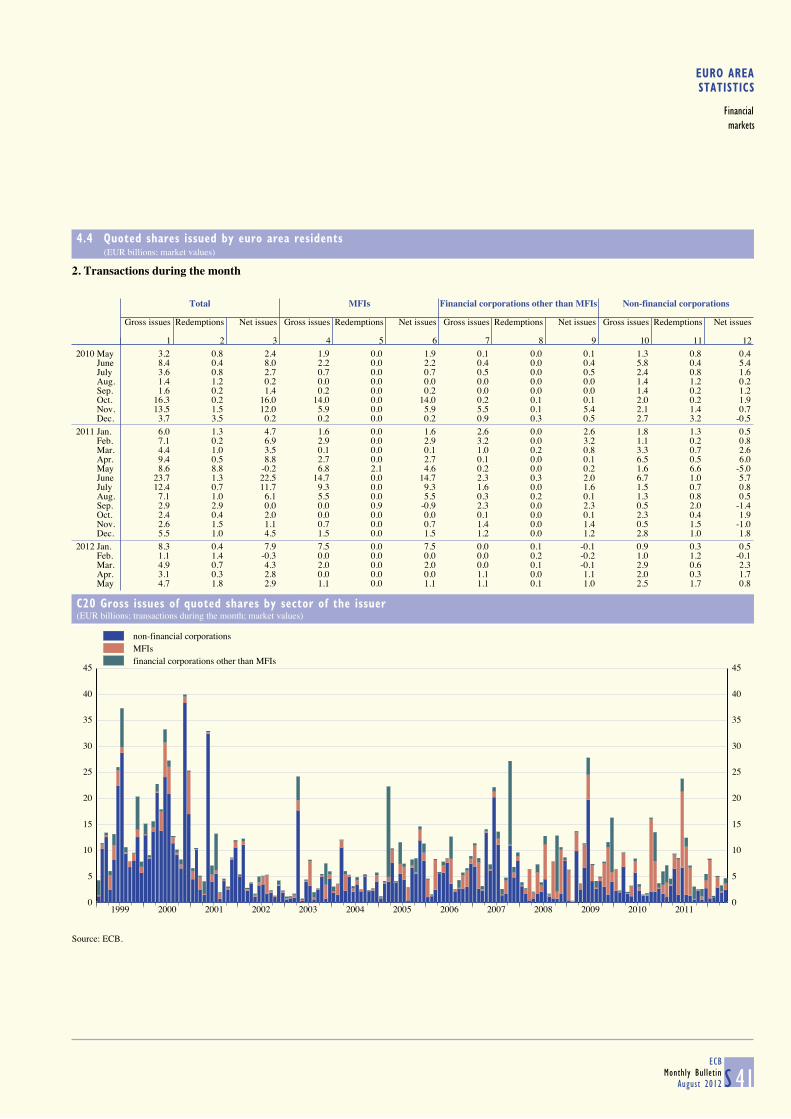
EURO AREASTATISTICS
Financialmarkets
4.4 Quoted shares issued by euro area residents (EUR billions; market values)
S 41ECB
Monthly BulletinAugust 2012
2. Transactions during the month
Total MFIs Financial corporations other than MFIs Non-financial corporations
Gross issues Redemptions Net issues Gross issues Redemptions Net issues Gross issues Redemptions Net issues Gross issues Redemptions Net issues
1 2 3 4 5 6 7 8 9 10 11 12
2010 May 3.2 0.8 2.4 1.9 0.0 1.9 0.1 0.0 0.1 1.3 0.8 0.4 June 8.4 0.4 8.0 2.2 0.0 2.2 0.4 0.0 0.4 5.8 0.4 5.4 July 3.6 0.8 2.7 0.7 0.0 0.7 0.5 0.0 0.5 2.4 0.8 1.6 Aug. 1.4 1.2 0.2 0.0 0.0 0.0 0.0 0.0 0.0 1.4 1.2 0.2 Sep. 1.6 0.2 1.4 0.2 0.0 0.2 0.0 0.0 0.0 1.4 0.2 1.2 Oct. 16.3 0.2 16.0 14.0 0.0 14.0 0.2 0.1 0.1 2.0 0.2 1.9 Nov. 13.5 1.5 12.0 5.9 0.0 5.9 5.5 0.1 5.4 2.1 1.4 0.7 Dec. 3.7 3.5 0.2 0.2 0.0 0.2 0.9 0.3 0.5 2.7 3.2 -0.5
2011 Jan. 6.0 1.3 4.7 1.6 0.0 1.6 2.6 0.0 2.6 1.8 1.3 0.5 Feb. 7.1 0.2 6.9 2.9 0.0 2.9 3.2 0.0 3.2 1.1 0.2 0.8 Mar. 4.4 1.0 3.5 0.1 0.0 0.1 1.0 0.2 0.8 3.3 0.7 2.6 Apr. 9.4 0.5 8.8 2.7 0.0 2.7 0.1 0.0 0.1 6.5 0.5 6.0 May 8.6 8.8 -0.2 6.8 2.1 4.6 0.2 0.0 0.2 1.6 6.6 -5.0 June 23.7 1.3 22.5 14.7 0.0 14.7 2.3 0.3 2.0 6.7 1.0 5.7 July 12.4 0.7 11.7 9.3 0.0 9.3 1.6 0.0 1.6 1.5 0.7 0.8 Aug. 7.1 1.0 6.1 5.5 0.0 5.5 0.3 0.2 0.1 1.3 0.8 0.5 Sep. 2.9 2.9 0.0 0.0 0.9 -0.9 2.3 0.0 2.3 0.5 2.0 -1.4 Oct. 2.4 0.4 2.0 0.0 0.0 0.0 0.1 0.0 0.1 2.3 0.4 1.9 Nov. 2.6 1.5 1.1 0.7 0.0 0.7 1.4 0.0 1.4 0.5 1.5 -1.0 Dec. 5.5 1.0 4.5 1.5 0.0 1.5 1.2 0.0 1.2 2.8 1.0 1.8
2012 Jan. 8.3 0.4 7.9 7.5 0.0 7.5 0.0 0.1 -0.1 0.9 0.3 0.5 Feb. 1.1 1.4 -0.3 0.0 0.0 0.0 0.0 0.2 -0.2 1.0 1.2 -0.1 Mar. 4.9 0.7 4.3 2.0 0.0 2.0 0.0 0.1 -0.1 2.9 0.6 2.3 Apr. 3.1 0.3 2.8 0.0 0.0 0.0 1.1 0.0 1.1 2.0 0.3 1.7 May 4.7 1.8 2.9 1.1 0.0 1.1 1.1 0.1 1.0 2.5 1.7 0.8
C20 Gross issues of quoted shares by sector of the issuer
(EUR billions; transactions during the month; market values)
0
5
10
15
20
25
30
35
40
45
1999 2000 2001 2002 2003 2004 2005 2006 2007 2008 2009 2010 20110
5
10
15
20
25
30
35
40
45
non-financial corporationsMFIsfinancial corporations other than MFIs
Source: ECB.
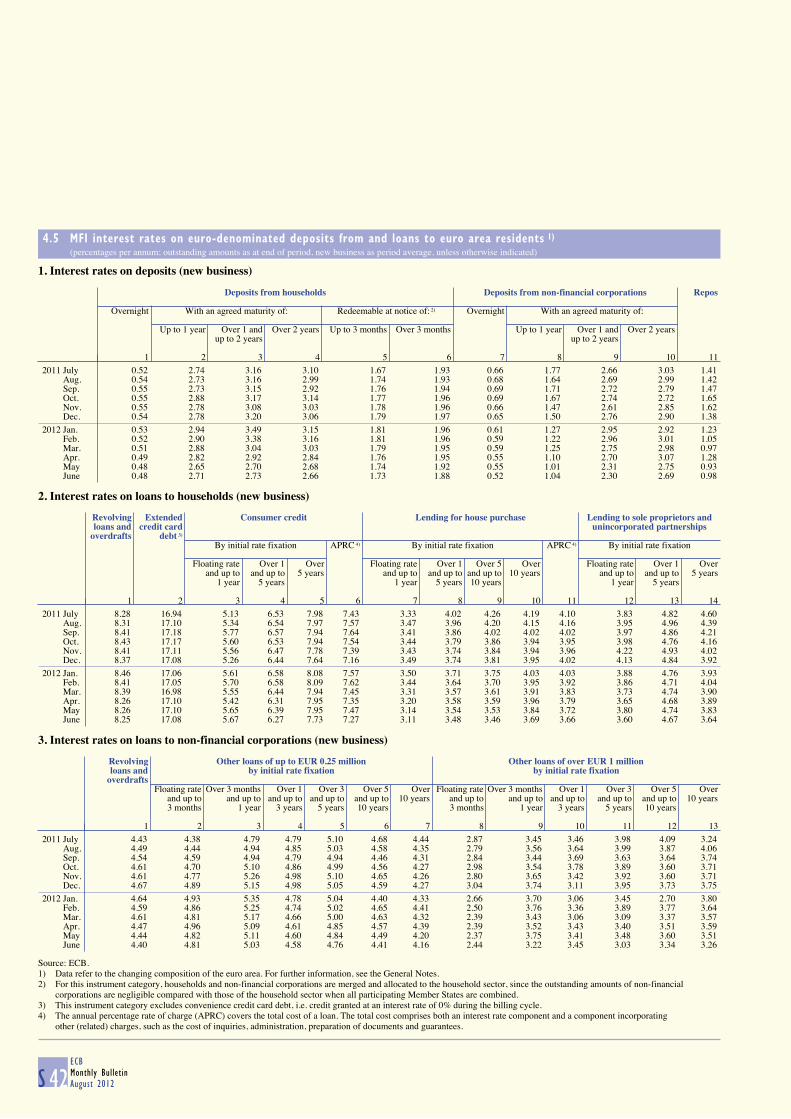
4.5 MFI interest rates on euro-denominated deposits from and loans to euro area residents 1) (percentages per annum; outstanding amounts as at end of period, new business as period average, unless otherwise indicated)
S 42ECBMonthly BulletinAugust 2012
1. Interest rates on deposits (new business)
Deposits from households Deposits from non-financial corporations Repos
Overnight With an agreed maturity of: Redeemable at notice of: 2) Overnight With an agreed maturity of:
Up to 1 year Over 1 and Over 2 years Up to 3 months Over 3 months Up to 1 year Over 1 and Over 2 yearsup to 2 years up to 2 years
1 2 3 4 5 6 7 8 9 10 11
2011 July 0.52 2.74 3.16 3.10 1.67 1.93 0.66 1.77 2.66 3.03 1.41 Aug. 0.54 2.73 3.16 2.99 1.74 1.93 0.68 1.64 2.69 2.99 1.42 Sep. 0.55 2.73 3.15 2.92 1.76 1.94 0.69 1.71 2.72 2.79 1.47 Oct. 0.55 2.88 3.17 3.14 1.77 1.96 0.69 1.67 2.74 2.72 1.65 Nov. 0.55 2.78 3.08 3.03 1.78 1.96 0.66 1.47 2.61 2.85 1.62 Dec. 0.54 2.78 3.20 3.06 1.79 1.97 0.65 1.50 2.76 2.90 1.38
2012 Jan. 0.53 2.94 3.49 3.15 1.81 1.96 0.61 1.27 2.95 2.92 1.23 Feb. 0.52 2.90 3.38 3.16 1.81 1.96 0.59 1.22 2.96 3.01 1.05 Mar. 0.51 2.88 3.04 3.03 1.79 1.95 0.59 1.25 2.75 2.98 0.97 Apr. 0.49 2.82 2.92 2.84 1.76 1.95 0.55 1.10 2.70 3.07 1.28 May 0.48 2.65 2.70 2.68 1.74 1.92 0.55 1.01 2.31 2.75 0.93 June 0.48 2.71 2.73 2.66 1.73 1.88 0.52 1.04 2.30 2.69 0.98
2. Interest rates on loans to households (new business)
Revolving Extended Consumer credit Lending for house purchase Lending to sole proprietors andloans and credit card unincorporated partnerships
overdrafts debt 3) By initial rate fixation APRC 4) By initial rate fixation APRC 4) By initial rate fixation
Floating rate Over 1 Over Floating rate Over 1 Over 5 Over Floating rate Over 1 Overand up to and up to 5 years and up to and up to and up to 10 years and up to and up to 5 years
1 year 5 years 1 year 5 years 10 years 1 year 5 years
1 2 3 4 5 6 7 8 9 10 11 12 13 14
2011 July 8.28 16.94 5.13 6.53 7.98 7.43 3.33 4.02 4.26 4.19 4.10 3.83 4.82 4.60 Aug. 8.31 17.10 5.34 6.54 7.97 7.57 3.47 3.96 4.20 4.15 4.16 3.95 4.96 4.39 Sep. 8.41 17.18 5.77 6.57 7.94 7.64 3.41 3.86 4.02 4.02 4.02 3.97 4.86 4.21 Oct. 8.43 17.17 5.60 6.53 7.94 7.54 3.44 3.79 3.86 3.94 3.95 3.98 4.76 4.16 Nov. 8.41 17.11 5.56 6.47 7.78 7.39 3.43 3.74 3.84 3.94 3.96 4.22 4.93 4.02 Dec. 8.37 17.08 5.26 6.44 7.64 7.16 3.49 3.74 3.81 3.95 4.02 4.13 4.84 3.92
2012 Jan. 8.46 17.06 5.61 6.58 8.08 7.57 3.50 3.71 3.75 4.03 4.03 3.88 4.76 3.93 Feb. 8.41 17.05 5.70 6.58 8.09 7.62 3.44 3.64 3.70 3.95 3.92 3.86 4.71 4.04 Mar. 8.39 16.98 5.55 6.44 7.94 7.45 3.31 3.57 3.61 3.91 3.83 3.73 4.74 3.90 Apr. 8.26 17.10 5.42 6.31 7.95 7.35 3.20 3.58 3.59 3.96 3.79 3.65 4.68 3.89 May 8.26 17.10 5.65 6.39 7.95 7.47 3.14 3.54 3.53 3.84 3.72 3.80 4.74 3.83 June 8.25 17.08 5.67 6.27 7.73 7.27 3.11 3.48 3.46 3.69 3.66 3.60 4.67 3.64
3. Interest rates on loans to non-financial corporations (new business)
Revolving Other loans of up to EUR 0.25 million Other loans of over EUR 1 millionloans and by initial rate fixation by initial rate fixation
overdraftsFloating rate Over 3 months Over 1 Over 3 Over 5 Over Floating rate Over 3 months Over 1 Over 3 Over 5 Over
and up to and up to and up to and up to and up to 10 years and up to and up to and up to and up to and up to 10 years3 months 1 year 3 years 5 years 10 years 3 months 1 year 3 years 5 years 10 years
1 2 3 4 5 6 7 8 9 10 11 12 13
2011 July 4.43 4.38 4.79 4.79 5.10 4.68 4.44 2.87 3.45 3.46 3.98 4.09 3.24 Aug. 4.49 4.44 4.94 4.85 5.03 4.58 4.35 2.79 3.56 3.64 3.99 3.87 4.06 Sep. 4.54 4.59 4.94 4.79 4.94 4.46 4.31 2.84 3.44 3.69 3.63 3.64 3.74 Oct. 4.61 4.70 5.10 4.86 4.99 4.56 4.27 2.98 3.54 3.78 3.89 3.60 3.71 Nov. 4.61 4.77 5.26 4.98 5.10 4.65 4.26 2.80 3.65 3.42 3.92 3.60 3.71 Dec. 4.67 4.89 5.15 4.98 5.05 4.59 4.27 3.04 3.74 3.11 3.95 3.73 3.75
2012 Jan. 4.64 4.93 5.35 4.78 5.04 4.40 4.33 2.66 3.70 3.06 3.45 2.70 3.80 Feb. 4.59 4.86 5.25 4.74 5.02 4.65 4.41 2.50 3.76 3.36 3.89 3.77 3.64 Mar. 4.61 4.81 5.17 4.66 5.00 4.63 4.32 2.39 3.43 3.06 3.09 3.37 3.57 Apr. 4.47 4.96 5.09 4.61 4.85 4.57 4.39 2.39 3.52 3.43 3.40 3.51 3.59 May 4.44 4.82 5.11 4.60 4.84 4.49 4.20 2.37 3.75 3.41 3.48 3.60 3.51 June 4.40 4.81 5.03 4.58 4.76 4.41 4.16 2.44 3.22 3.45 3.03 3.34 3.26
Source: ECB.1) Data refer to the changing composition of the euro area. For further information, see the General Notes.2) For this instrument category, households and non-financial corporations are merged and allocated to the household sector, since the outstanding amounts of non-financial
corporations are negligible compared with those of the household sector when all participating Member States are combined.3) This instrument category excludes convenience credit card debt, i.e. credit granted at an interest rate of 0% during the billing cycle.4) The annual percentage rate of charge (APRC) covers the total cost of a loan. The total cost comprises both an interest rate component and a component incorporating
other (related) charges, such as the cost of inquiries, administration, preparation of documents and guarantees.
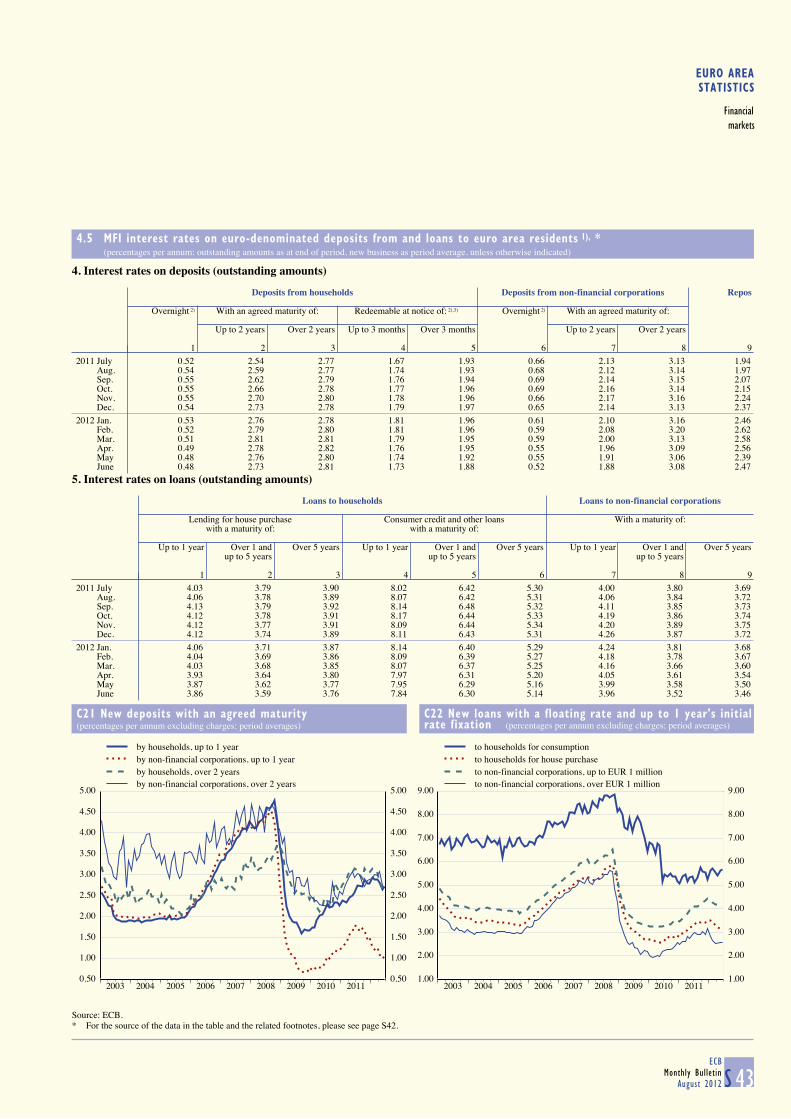
EURO AREASTATISTICS
Financialmarkets
4.5 MFI interest rates on euro-denominated deposits from and loans to euro area residents 1), * (percentages per annum; outstanding amounts as at end of period, new business as period average, unless otherwise indicated)
S 43ECB
Monthly BulletinAugust 2012
4. Interest rates on deposits (outstanding amounts)
Deposits from households Deposits from non-financial corporations Repos
Overnight 2) With an agreed maturity of: Redeemable at notice of: 2),3) Overnight 2) With an agreed maturity of:
Up to 2 years Over 2 years Up to 3 months Over 3 months Up to 2 years Over 2 years
1 2 3 4 5 6 7 8 9
2011 July 0.52 2.54 2.77 1.67 1.93 0.66 2.13 3.13 1.94 Aug. 0.54 2.59 2.77 1.74 1.93 0.68 2.12 3.14 1.97 Sep. 0.55 2.62 2.79 1.76 1.94 0.69 2.14 3.15 2.07 Oct. 0.55 2.66 2.78 1.77 1.96 0.69 2.16 3.14 2.15 Nov. 0.55 2.70 2.80 1.78 1.96 0.66 2.17 3.16 2.24 Dec. 0.54 2.73 2.78 1.79 1.97 0.65 2.14 3.13 2.37
2012 Jan. 0.53 2.76 2.78 1.81 1.96 0.61 2.10 3.16 2.46 Feb. 0.52 2.79 2.80 1.81 1.96 0.59 2.08 3.20 2.62 Mar. 0.51 2.81 2.81 1.79 1.95 0.59 2.00 3.13 2.58 Apr. 0.49 2.78 2.82 1.76 1.95 0.55 1.96 3.09 2.56 May 0.48 2.76 2.80 1.74 1.92 0.55 1.91 3.06 2.39 June 0.48 2.73 2.81 1.73 1.88 0.52 1.88 3.08 2.47
5. Interest rates on loans (outstanding amounts)
Loans to households Loans to non-financial corporations
Lending for house purchase Consumer credit and other loans With a maturity of:
with a maturity of: with a maturity of:
Up to 1 year Over 1 and Over 5 years Up to 1 year Over 1 and Over 5 years Up to 1 year Over 1 and Over 5 yearsup to 5 years up to 5 years up to 5 years
1 2 3 4 5 6 7 8 9
2011 July 4.03 3.79 3.90 8.02 6.42 5.30 4.00 3.80 3.69 Aug. 4.06 3.78 3.89 8.07 6.42 5.31 4.06 3.84 3.72 Sep. 4.13 3.79 3.92 8.14 6.48 5.32 4.11 3.85 3.73 Oct. 4.12 3.78 3.91 8.17 6.44 5.33 4.19 3.86 3.74 Nov. 4.12 3.77 3.91 8.09 6.44 5.34 4.20 3.89 3.75 Dec. 4.12 3.74 3.89 8.11 6.43 5.31 4.26 3.87 3.72
2012 Jan. 4.06 3.71 3.87 8.14 6.40 5.29 4.24 3.81 3.68 Feb. 4.04 3.69 3.86 8.09 6.39 5.27 4.18 3.78 3.67 Mar. 4.03 3.68 3.85 8.07 6.37 5.25 4.16 3.66 3.60 Apr. 3.93 3.64 3.80 7.97 6.31 5.20 4.05 3.61 3.54 May 3.87 3.62 3.77 7.95 6.29 5.16 3.99 3.58 3.50 June 3.86 3.59 3.76 7.84 6.30 5.14 3.96 3.52 3.46
C21 New deposits with an agreed maturity
(percentages per annum excluding charges; period averages)
C22 New loans with a floating rate and up to 1 year's initial
rate fixation (percentages per annum excluding charges; period averages)
0.50
1.00
1.50
2.00
2.50
3.00
3.50
4.00
4.50
5.00
2003 2004 2005 2006 2007 2008 2009 2010 20110.50
1.00
1.50
2.00
2.50
3.00
3.50
4.00
4.50
5.00
by households, up to 1 yearby non-financial corporations, up to 1 yearby households, over 2 yearsby non-financial corporations, over 2 years
1.00
2.00
3.00
4.00
5.00
6.00
7.00
8.00
9.00
2003 2004 2005 2006 2007 2008 2009 2010 20111.00
2.00
3.00
4.00
5.00
6.00
7.00
8.00
9.00
to households for consumptionto households for house purchaseto non-financial corporations, up to EUR 1 millionto non-financial corporations, over EUR 1 million
Source: ECB.* For the source of the data in the table and the related footnotes, please see page S42.
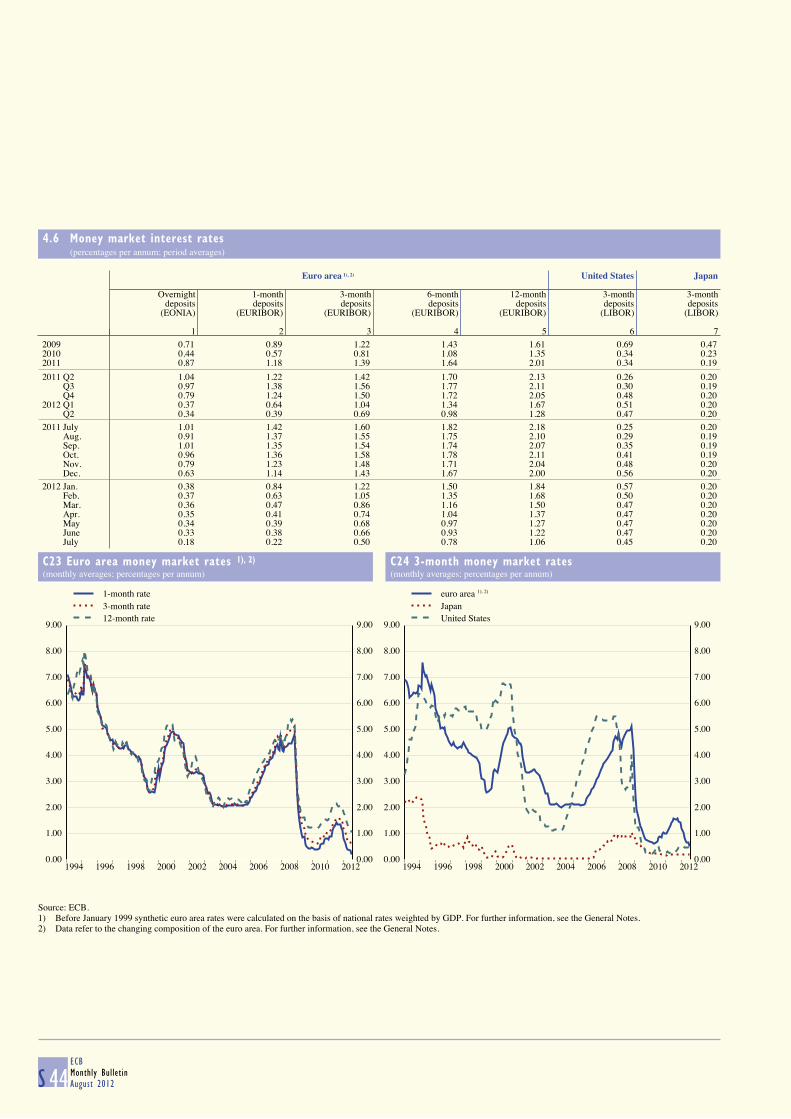
4.6 Money market interest rates (percentages per annum; period averages)
S 44ECBMonthly BulletinAugust 2012
Euro area 1), 2) United States Japan
Overnight 1-month 3-month 6-month 12-month 3-month 3-monthdeposits deposits deposits deposits deposits deposits deposits
(EONIA) (EURIBOR) (EURIBOR) (EURIBOR) (EURIBOR) (LIBOR) (LIBOR)
1 2 3 4 5 6 7
2009 0.71 0.89 1.22 1.43 1.61 0.69 0.472010 0.44 0.57 0.81 1.08 1.35 0.34 0.232011 0.87 1.18 1.39 1.64 2.01 0.34 0.19
2011 Q2 1.04 1.22 1.42 1.70 2.13 0.26 0.20 Q3 0.97 1.38 1.56 1.77 2.11 0.30 0.19 Q4 0.79 1.24 1.50 1.72 2.05 0.48 0.202012 Q1 0.37 0.64 1.04 1.34 1.67 0.51 0.20 Q2 0.34 0.39 0.69 0.98 1.28 0.47 0.20
2011 July 1.01 1.42 1.60 1.82 2.18 0.25 0.20 Aug. 0.91 1.37 1.55 1.75 2.10 0.29 0.19 Sep. 1.01 1.35 1.54 1.74 2.07 0.35 0.19 Oct. 0.96 1.36 1.58 1.78 2.11 0.41 0.19 Nov. 0.79 1.23 1.48 1.71 2.04 0.48 0.20 Dec. 0.63 1.14 1.43 1.67 2.00 0.56 0.20
2012 Jan. 0.38 0.84 1.22 1.50 1.84 0.57 0.20 Feb. 0.37 0.63 1.05 1.35 1.68 0.50 0.20 Mar. 0.36 0.47 0.86 1.16 1.50 0.47 0.20 Apr. 0.35 0.41 0.74 1.04 1.37 0.47 0.20 May 0.34 0.39 0.68 0.97 1.27 0.47 0.20 June 0.33 0.38 0.66 0.93 1.22 0.47 0.20 July 0.18 0.22 0.50 0.78 1.06 0.45 0.20
C23 Euro area money market rates 1), 2)
(monthly averages; percentages per annum)
C24 3-month money market rates
(monthly averages; percentages per annum)
0.00
1.00
2.00
3.00
4.00
5.00
6.00
7.00
8.00
9.00
1994 1996 1998 2000 2002 2004 2006 2008 2010 20120.00
1.00
2.00
3.00
4.00
5.00
6.00
7.00
8.00
9.00
1-month rate3-month rate12-month rate
0.00
1.00
2.00
3.00
4.00
5.00
6.00
7.00
8.00
9.00
1994 1996 1998 2000 2002 2004 2006 2008 2010 20120.00
1.00
2.00
3.00
4.00
5.00
6.00
7.00
8.00
9.00
euro areaJapanUnited States
Source: ECB.1) Before January 1999 synthetic euro area rates were calculated on the basis of national rates weighted by GDP. For further information, see the General Notes.2) Data refer to the changing composition of the euro area. For further information, see the General Notes.
1), 2)
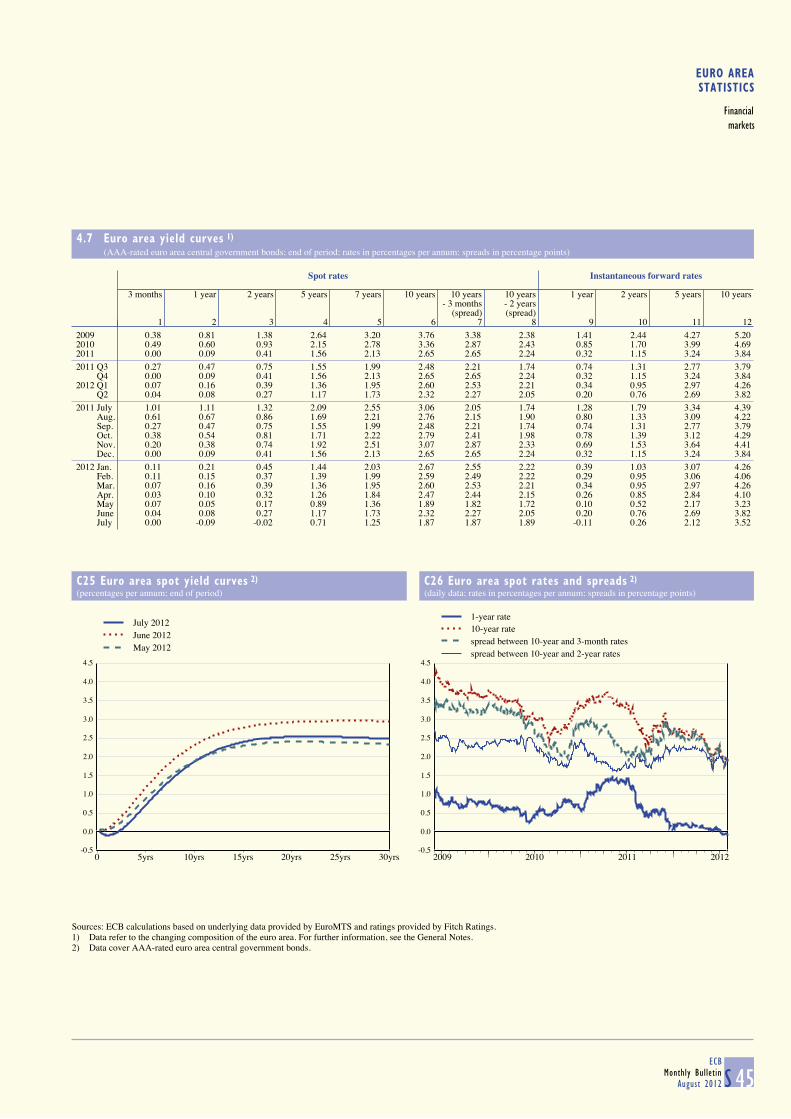
EURO AREASTATISTICS
Financialmarkets
4.7 Euro area yield curves 1)
(AAA-rated euro area central government bonds; end of period; rates in percentages per annum; spreads in percentage points)
S 45ECB
Monthly BulletinAugust 2012
Spot rates Instantaneous forward rates
3 months 1 year 2 years 5 years 7 years 10 years 10 years 10 years 1 year 2 years 5 years 10 years- 3 months - 2 years
(spread) (spread)1 2 3 4 5 6 7 8 9 10 11 12
2009 0.38 0.81 1.38 2.64 3.20 3.76 3.38 2.38 1.41 2.44 4.27 5.202010 0.49 0.60 0.93 2.15 2.78 3.36 2.87 2.43 0.85 1.70 3.99 4.692011 0.00 0.09 0.41 1.56 2.13 2.65 2.65 2.24 0.32 1.15 3.24 3.84
2011 Q3 0.27 0.47 0.75 1.55 1.99 2.48 2.21 1.74 0.74 1.31 2.77 3.79 Q4 0.00 0.09 0.41 1.56 2.13 2.65 2.65 2.24 0.32 1.15 3.24 3.842012 Q1 0.07 0.16 0.39 1.36 1.95 2.60 2.53 2.21 0.34 0.95 2.97 4.26 Q2 0.04 0.08 0.27 1.17 1.73 2.32 2.27 2.05 0.20 0.76 2.69 3.82
2011 July 1.01 1.11 1.32 2.09 2.55 3.06 2.05 1.74 1.28 1.79 3.34 4.39 Aug. 0.61 0.67 0.86 1.69 2.21 2.76 2.15 1.90 0.80 1.33 3.09 4.22 Sep. 0.27 0.47 0.75 1.55 1.99 2.48 2.21 1.74 0.74 1.31 2.77 3.79 Oct. 0.38 0.54 0.81 1.71 2.22 2.79 2.41 1.98 0.78 1.39 3.12 4.29 Nov. 0.20 0.38 0.74 1.92 2.51 3.07 2.87 2.33 0.69 1.53 3.64 4.41 Dec. 0.00 0.09 0.41 1.56 2.13 2.65 2.65 2.24 0.32 1.15 3.24 3.84
2012 Jan. 0.11 0.21 0.45 1.44 2.03 2.67 2.55 2.22 0.39 1.03 3.07 4.26 Feb. 0.11 0.15 0.37 1.39 1.99 2.59 2.49 2.22 0.29 0.95 3.06 4.06 Mar. 0.07 0.16 0.39 1.36 1.95 2.60 2.53 2.21 0.34 0.95 2.97 4.26 Apr. 0.03 0.10 0.32 1.26 1.84 2.47 2.44 2.15 0.26 0.85 2.84 4.10 May 0.07 0.05 0.17 0.89 1.36 1.89 1.82 1.72 0.10 0.52 2.17 3.23 June 0.04 0.08 0.27 1.17 1.73 2.32 2.27 2.05 0.20 0.76 2.69 3.82 July 0.00 -0.09 -0.02 0.71 1.25 1.87 1.87 1.89 -0.11 0.26 2.12 3.52
C25 Euro area spot yield curves 2)
(percentages per annum; end of period)
C26 Euro area spot rates and spreads 2)
(daily data; rates in percentages per annum; spreads in percentage points)
-0.5
0.0
0.5
1.0
1.5
2.0
2.5
3.0
3.5
4.0
4.5
0 5yrs 10yrs 15yrs 20yrs 25yrs 30yrs
July 2012June 2012May 2012
-0.5
0.0
0.5
1.0
1.5
2.0
2.5
3.0
3.5
4.0
4.5
2009 2010 2011 2012
1-year rate10-year ratespread between 10-year and 3-month ratesspread between 10-year and 2-year rates
Sources: ECB calculations based on underlying data provided by EuroMTS and ratings provided by Fitch Ratings.1) Data refer to the changing composition of the euro area. For further information, see the General Notes.2) Data cover AAA-rated euro area central government bonds.

4.8 Stock market indices (index levels in points; period averages)
S 46ECBMonthly BulletinAugust 2012
Dow Jones EURO STOXX indices 1) United Japan
States Benchmark Main industry indices
Broad 50 Basic Consumer Consumer Oil and Financials Industrials Technology Utilities Telecoms Health care Standard Nikkeiindex materials services goods gas & Poor’s 225
500
1 2 3 4 5 6 7 8 9 10 11 12 13 14
2009 234.2 2,521.0 353.2 140.5 244.5 293.5 172.1 269.7 200.7 353.7 380.4 363.5 946.2 9,321.62010 265.5 2,779.3 463.1 166.2 323.4 307.2 182.8 337.6 224.1 344.9 389.6 408.4 1,140.0 10,006.52011 256.0 2,611.0 493.4 158.1 351.2 311.6 152.6 349.4 222.5 301.7 358.4 432.7 1,267.6 9,425.4
2011 Q2 281.2 2,862.7 552.0 169.6 370.7 328.8 175.2 391.5 239.7 333.7 385.0 448.4 1,318.3 9,609.4 Q3 236.0 2,381.6 463.7 146.0 341.5 282.0 133.8 323.0 199.8 270.2 333.0 435.0 1,225.3 9,246.3 Q4 222.4 2,277.8 427.1 142.1 327.1 295.5 117.2 296.6 201.8 256.5 320.3 432.4 1,225.7 8,580.62012 Q1 243.7 2,473.6 499.1 150.3 372.3 324.6 129.7 333.3 221.7 253.7 300.6 480.6 1,348.8 9,295.3 Q2 224.0 2,226.2 472.5 140.8 370.7 285.3 108.2 311.6 207.4 223.4 261.9 493.2 1,349.7 9,026.5
2011 July 270.5 2,743.5 550.7 160.8 384.4 317.4 160.6 375.7 221.0 307.8 360.0 467.4 1,325.2 9,996.7 Aug. 226.9 2,297.2 443.7 141.1 329.7 268.6 129.0 307.3 189.7 258.4 329.3 420.7 1,185.3 9,072.9 Sep. 212.6 2,124.3 401.4 137.0 312.8 262.4 113.3 289.2 190.1 246.7 311.1 419.0 1,173.9 8,695.4 Oct. 226.1 2,312.3 424.8 142.4 325.6 290.2 123.1 302.3 203.0 269.9 334.1 426.1 1,207.2 8,733.6 Nov. 219.2 2,239.6 423.6 141.5 325.9 293.5 112.8 292.2 205.7 250.6 316.6 423.3 1,226.4 8,506.1 Dec. 222.2 2,283.3 433.2 142.4 329.9 302.9 115.9 295.5 196.6 249.3 310.3 448.4 1,243.3 8,506.0
2012 Jan. 233.4 2,382.1 477.6 146.9 351.8 317.3 120.4 319.2 206.9 248.8 305.0 473.6 1,300.6 8,616.7 Feb. 247.2 2,508.2 507.2 152.1 377.3 327.0 134.4 336.3 223.9 254.6 300.1 477.6 1,352.5 9,242.3 Mar. 250.7 2,532.2 512.9 152.0 388.0 329.5 134.6 344.6 234.3 257.7 296.7 490.5 1,389.2 9,962.3 Apr. 235.0 2,340.8 497.6 145.9 380.9 301.1 116.8 327.8 221.2 237.7 275.2 488.5 1,386.4 9,627.4 May 221.9 2,198.5 469.5 139.7 373.7 281.6 105.0 310.4 204.5 218.9 261.4 492.0 1,341.3 8,842.5 June 216.2 2,152.7 453.1 137.4 358.3 275.1 104.0 298.4 198.0 215.4 250.4 498.9 1,323.5 8,638.1 July 226.5 2,258.4 479.1 145.8 379.4 290.4 106.5 313.9 204.4 224.3 257.3 534.2 1,359.8 8,760.7
C27 Dow Jones EURO STOXX broad index, Standard & Poor's 500 and Nikkei 225
(January 1994 = 100; monthly averages)
0
50
100
150
200
250
300
350
1994 1995 1996 1997 1998 1999 2000 2001 2002 2003 2004 2005 2006 2007 2008 2009 2010 2011 20120
50
100
150
200
250
300
350
Dow Jones EURO STOXX broad indexStandard & Poor’s 500Nikkei 225
Source: ECB.1) Data refer to the changing composition of the euro area. For further information, see the General Notes.
1)

LABOUR MARKETS 5PRICES, OUTPUT, DEMAND AND
5.1 HICP, other prices and costs (annual percentage changes, unless otherwise indicated)
S 47ECB
Monthly BulletinAugust 2012
1. Harmonised Index of Consumer Prices 1)
Total Total (s.a.; percentage change vis-à-vis previous period) Memo item: Administered prices 2)
Index: Total Goods Services Total Processed Unprocessed Non-energy Energy Services2005 = 100 food food industrial (n.s.a.) Total HICP Administered
Total excl. goods excluding pricesunprocessed administered
food and energy prices
% of totalin 2012 100.0 100.0 81.8 58.5 41.5 100.0 11.9 7.2 28.5 11.0 41.5 88.2 11.8
1 2 3 4 5 6 7 8 9 10 11 12 13
2008 107.8 3.3 2.4 3.8 2.6 - - - - - - 3.4 2.72009 108.1 0.3 1.3 -0.9 2.0 - - - - - - 0.1 1.82010 109.8 1.6 1.0 1.8 1.4 - - - - - - 1.6 1.52011 112.8 2.7 1.7 3.3 1.8 - - - - - - 2.6 3.5
2011 Q2 113.1 2.8 1.8 3.3 1.9 0.8 1.1 0.4 0.3 2.8 0.6 2.6 3.6 Q3 112.9 2.7 1.7 3.2 2.0 0.3 1.1 -0.1 -0.3 0.4 0.5 2.6 3.5 Q4 114.1 2.9 2.0 3.7 1.9 0.8 1.1 1.0 1.1 1.5 0.3 2.9 3.52012 Q1 114.3 2.7 1.9 3.3 1.8 0.8 0.7 0.6 0.2 4.1 0.5 2.6 3.4 Q2 115.9 2.5 1.8 3.0 1.7 0.5 0.6 0.7 0.2 1.0 0.5 2.3 3.4
2012 Feb. 114.0 2.7 1.9 3.4 1.8 0.3 0.3 0.8 0.1 1.1 0.1 2.6 3.4 Mar. 115.5 2.7 1.9 3.3 1.8 0.3 0.2 0.2 0.2 1.6 0.1 2.6 3.3 Apr. 116.0 2.6 1.9 3.2 1.7 0.3 0.2 0.0 0.0 1.1 0.3 2.5 3.3 May 115.9 2.4 1.8 2.9 1.8 -0.1 0.2 0.0 0.0 -1.4 0.1 2.3 3.4 June 115.8 2.4 1.8 2.8 1.7 0.0 0.1 1.0 0.0 -1.7 0.2 2.2 3.4 July 3) . 2.4 . . . . . . . . . . .
Goods Services
Food (incl. alcoholic beverages and tobacco) Industrial goods Housing Transport Communication Recreation Miscellaneous
andTotal Processed Unprocessed Total Non-energy Energy Rents personal
food food industrialgoods
% of totalin 2012 19.1 11.9 7.2 39.5 28.5 11.0 10.1 6.0 6.5 3.1 14.5 7.3
14 15 16 17 18 19 20 21 22 23 24 25
2008 5.1 6.1 3.5 3.1 0.8 10.3 2.3 1.9 3.9 -2.2 3.2 2.52009 0.7 1.1 0.2 -1.7 0.6 -8.1 2.0 1.8 2.9 -1.0 2.1 2.12010 1.1 0.9 1.3 2.2 0.5 7.4 1.8 1.5 2.3 -0.8 1.0 1.52011 2.7 3.3 1.8 3.7 0.8 11.9 1.8 1.4 2.9 -1.3 2.0 2.1
2011 Q2 2.6 3.0 1.9 3.7 1.0 11.5 1.9 1.4 3.2 -1.0 2.0 2.1 Q3 2.8 3.7 1.3 3.4 0.4 12.0 1.8 1.5 3.3 -1.8 2.3 2.1 Q4 3.3 4.2 1.8 3.9 1.2 11.5 1.7 1.4 3.0 -1.8 2.2 2.12012 Q1 3.2 4.0 2.0 3.3 1.1 9.1 1.7 1.5 2.9 -2.7 2.1 2.4 Q2 3.0 3.5 2.3 2.9 1.3 7.2 1.7 1.4 2.7 -3.1 2.2 2.0
2012 Jan. 3.1 4.1 1.6 3.2 0.9 9.2 1.8 1.5 2.8 -2.4 2.1 2.6 Feb. 3.3 4.1 2.2 3.4 1.0 9.5 1.7 1.5 2.8 -3.0 2.2 2.4 Mar. 3.3 3.9 2.2 3.4 1.4 8.5 1.7 1.4 3.1 -2.8 2.0 2.2 Apr. 3.1 3.7 2.1 3.2 1.3 8.1 1.7 1.5 2.5 -3.1 2.3 2.1 May 2.8 3.4 1.8 3.0 1.3 7.3 1.7 1.4 2.7 -3.3 2.4 2.0 June 3.2 3.2 3.1 2.6 1.3 6.1 1.7 1.4 3.0 -2.8 2.1 2.0
Sources: Eurostat and ECB calculations.1) Data refer to the changing composition of the euro area. For further information, see the General Notes.2) These experimental statistics can only provide an approximate measure of price administration, since changes in administered prices cannot be fully isolated from other influences. Please refer to Eurostat’s website (http://epp.eurostat.ec.europa.eu/portal/page/portal/hicp/introduction) for a note explaining the methodology used in the compilation of this indicator.3) Estimate based on provisional national releases, which usually cover around 95% of the euro area, as well as on early information on energy prices.
5
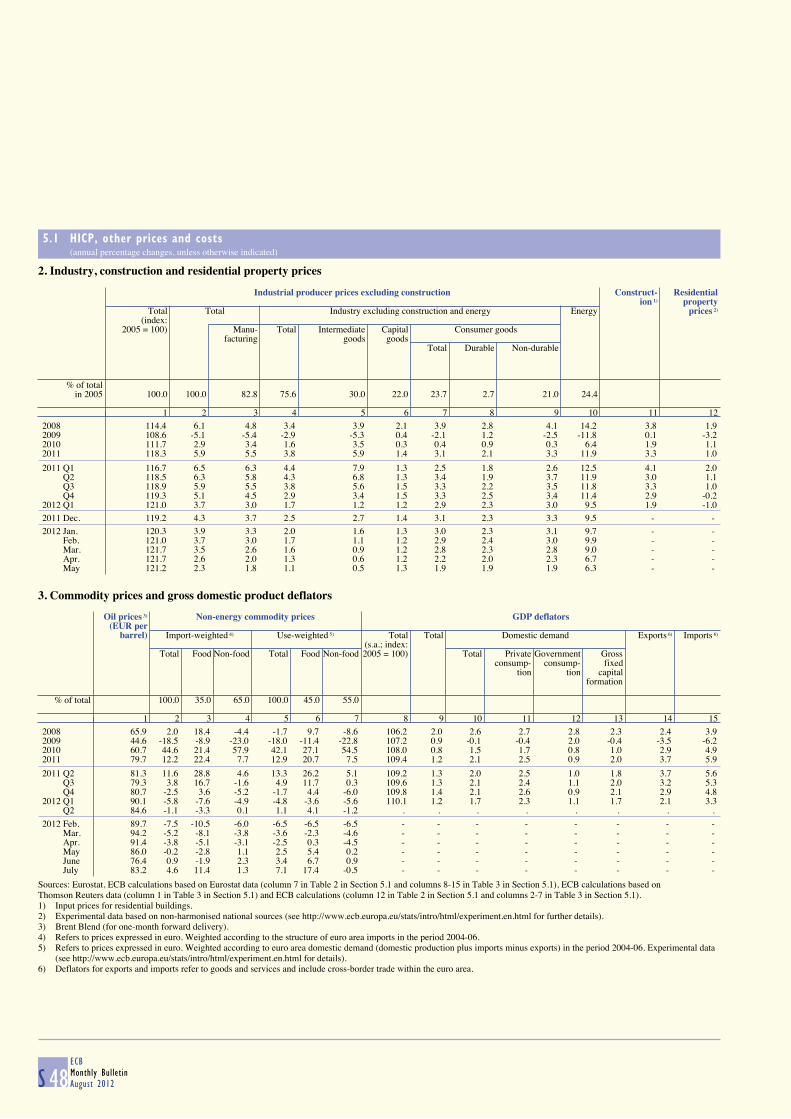
5.1 HICP, other prices and costs (annual percentage changes, unless otherwise indicated)
S 48ECBMonthly BulletinAugust 2012
2. Industry, construction and residential property prices
Industrial producer prices excluding construction Construct- Residential
ion 1) propertyTotal Total Industry excluding construction and energy Energy prices 2)
(index: 2005 = 100) Manu- Total Intermediate Capital Consumer goods
facturing goods goodsTotal Durable Non-durable
% of totalin 2005 100.0 100.0 82.8 75.6 30.0 22.0 23.7 2.7 21.0 24.4
1 2 3 4 5 6 7 8 9 10 11 12
2008 114.4 6.1 4.8 3.4 3.9 2.1 3.9 2.8 4.1 14.2 3.8 1.92009 108.6 -5.1 -5.4 -2.9 -5.3 0.4 -2.1 1.2 -2.5 -11.8 0.1 -3.22010 111.7 2.9 3.4 1.6 3.5 0.3 0.4 0.9 0.3 6.4 1.9 1.12011 118.3 5.9 5.5 3.8 5.9 1.4 3.1 2.1 3.3 11.9 3.3 1.0
2011 Q1 116.7 6.5 6.3 4.4 7.9 1.3 2.5 1.8 2.6 12.5 4.1 2.0 Q2 118.5 6.3 5.8 4.3 6.8 1.3 3.4 1.9 3.7 11.9 3.0 1.1 Q3 118.9 5.9 5.5 3.8 5.6 1.5 3.3 2.2 3.5 11.8 3.3 1.0 Q4 119.3 5.1 4.5 2.9 3.4 1.5 3.3 2.5 3.4 11.4 2.9 -0.22012 Q1 121.0 3.7 3.0 1.7 1.2 1.2 2.9 2.3 3.0 9.5 1.9 -1.0
2011 Dec. 119.2 4.3 3.7 2.5 2.7 1.4 3.1 2.3 3.3 9.5 - -
2012 Jan. 120.3 3.9 3.3 2.0 1.6 1.3 3.0 2.3 3.1 9.7 - - Feb. 121.0 3.7 3.0 1.7 1.1 1.2 2.9 2.4 3.0 9.9 - - Mar. 121.7 3.5 2.6 1.6 0.9 1.2 2.8 2.3 2.8 9.0 - - Apr. 121.7 2.6 2.0 1.3 0.6 1.2 2.2 2.0 2.3 6.7 - - May 121.2 2.3 1.8 1.1 0.5 1.3 1.9 1.9 1.9 6.3 - -
3. Commodity prices and gross domestic product deflators
Oil prices 3) Non-energy commodity prices GDP deflators
(EUR per barrel) Import-weighted 4) Use-weighted 5) Total Total Domestic demand Exports 6) Imports 6)
(s.a.; index:Total Food Non-food Total Food Non-food 2005 = 100) Total Private Government Gross
consump- consump- fixedtion tion capital
formation
% of total 100.0 35.0 65.0 100.0 45.0 55.0
1 2 3 4 5 6 7 8 9 10 11 12 13 14 15
2008 65.9 2.0 18.4 -4.4 -1.7 9.7 -8.6 106.2 2.0 2.6 2.7 2.8 2.3 2.4 3.92009 44.6 -18.5 -8.9 -23.0 -18.0 -11.4 -22.8 107.2 0.9 -0.1 -0.4 2.0 -0.4 -3.5 -6.22010 60.7 44.6 21.4 57.9 42.1 27.1 54.5 108.0 0.8 1.5 1.7 0.8 1.0 2.9 4.92011 79.7 12.2 22.4 7.7 12.9 20.7 7.5 109.4 1.2 2.1 2.5 0.9 2.0 3.7 5.9
2011 Q2 81.3 11.6 28.8 4.6 13.3 26.2 5.1 109.2 1.3 2.0 2.5 1.0 1.8 3.7 5.6 Q3 79.3 3.8 16.7 -1.6 4.9 11.7 0.3 109.6 1.3 2.1 2.4 1.1 2.0 3.2 5.3 Q4 80.7 -2.5 3.6 -5.2 -1.7 4.4 -6.0 109.8 1.4 2.1 2.6 0.9 2.1 2.9 4.82012 Q1 90.1 -5.8 -7.6 -4.9 -4.8 -3.6 -5.6 110.1 1.2 1.7 2.3 1.1 1.7 2.1 3.3 Q2 84.6 -1.1 -3.3 0.1 1.1 4.1 -1.2 . . . . . . . .
2012 Feb. 89.7 -7.5 -10.5 -6.0 -6.5 -6.5 -6.5 - - - - - - - - Mar. 94.2 -5.2 -8.1 -3.8 -3.6 -2.3 -4.6 - - - - - - - - Apr. 91.4 -3.8 -5.1 -3.1 -2.5 0.3 -4.5 - - - - - - - - May 86.0 -0.2 -2.8 1.1 2.5 5.4 0.2 - - - - - - - - June 76.4 0.9 -1.9 2.3 3.4 6.7 0.9 - - - - - - - - July 83.2 4.6 11.4 1.3 7.1 17.4 -0.5 - - - - - - - -
Sources: Eurostat, ECB calculations based on Eurostat data (column 7 in Table 2 in Section 5.1 and columns 8-15 in Table 3 in Section 5.1), ECB calculations based onThomson Reuters data (column 1 in Table 3 in Section 5.1) and ECB calculations (column 12 in Table 2 in Section 5.1 and columns 2-7 in Table 3 in Section 5.1).1) Input prices for residential buildings.2) Experimental data based on non-harmonised national sources (see http://www.ecb.europa.eu/stats/intro/html/experiment.en.html for further details).3) Brent Blend (for one-month forward delivery).4) Refers to prices expressed in euro. Weighted according to the structure of euro area imports in the period 2004-06.5) Refers to prices expressed in euro. Weighted according to euro area domestic demand (domestic production plus imports minus exports) in the period 2004-06. Experimental data
(see http://www.ecb.europa.eu/stats/intro/html/experiment.en.html for details).6) Deflators for exports and imports refer to goods and services and include cross-border trade within the euro area.
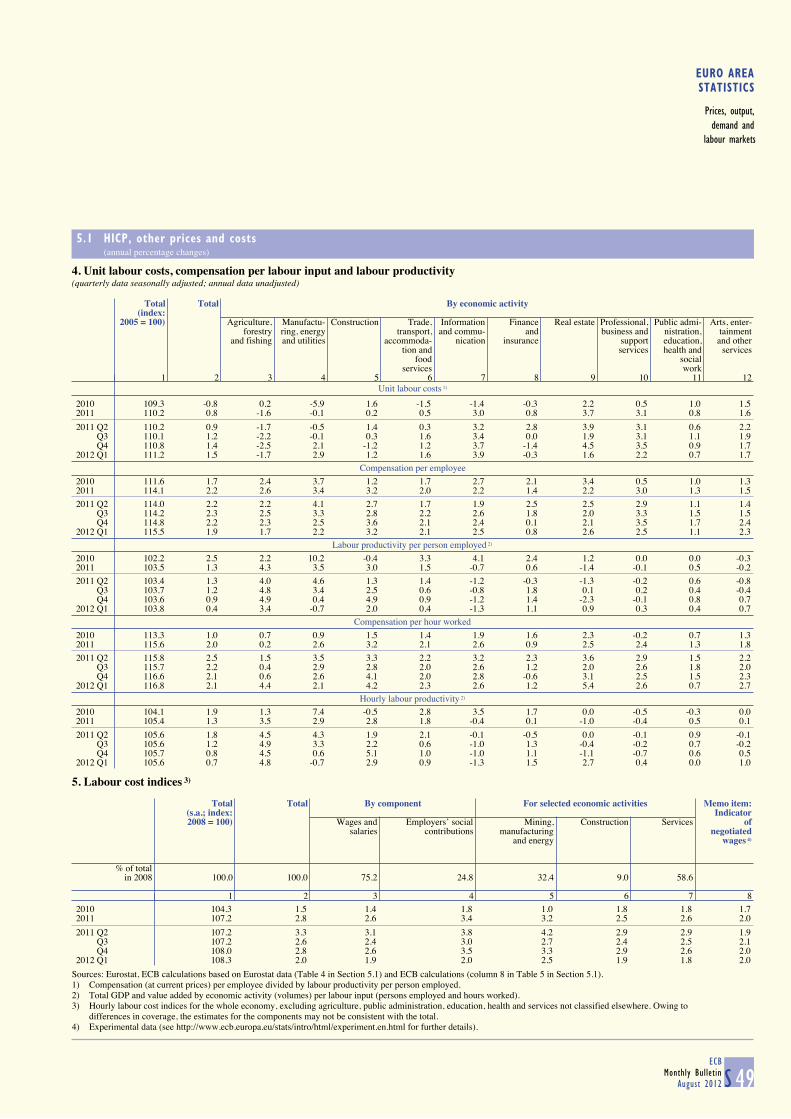
EURO AREASTATISTICS
Prices, output,demand and
labour markets
5.1 HICP, other prices and costs (annual percentage changes)
S 49ECB
Monthly BulletinAugust 2012
4. Unit labour costs, compensation per labour input and labour productivity(quarterly data seasonally adjusted; annual data unadjusted)
Unit labour costs 1)
Total Total By economic activity
(index:2005 = 100) Agriculture, Manufactu- Construction Trade, Information Finance Real estate Professional, Public admi- Arts, enter-
forestry ring, energy transport, and commu- and business and nistration, tainmentand fishing and utilities accommoda- nication insurance support education, and other
tion and services health and servicesfood social
services work1 2 3 4 5 6 7 8 9 10 11 12
2010 109.3 -0.8 0.2 -5.9 1.6 -1.5 -1.4 -0.3 2.2 0.5 1.0 1.52011 110.2 0.8 -1.6 -0.1 0.2 0.5 3.0 0.8 3.7 3.1 0.8 1.6
2011 Q2 110.2 0.9 -1.7 -0.5 1.4 0.3 3.2 2.8 3.9 3.1 0.6 2.2 Q3 110.1 1.2 -2.2 -0.1 0.3 1.6 3.4 0.0 1.9 3.1 1.1 1.9 Q4 110.8 1.4 -2.5 2.1 -1.2 1.2 3.7 -1.4 4.5 3.5 0.9 1.72012 Q1 111.2 1.5 -1.7 2.9 1.2 1.6 3.9 -0.3 1.6 2.2 0.7 1.7
Compensation per employee
2010 111.6 1.7 2.4 3.7 1.2 1.7 2.7 2.1 3.4 0.5 1.0 1.32011 114.1 2.2 2.6 3.4 3.2 2.0 2.2 1.4 2.2 3.0 1.3 1.5
2011 Q2 114.0 2.2 2.2 4.1 2.7 1.7 1.9 2.5 2.5 2.9 1.1 1.4 Q3 114.2 2.3 2.5 3.3 2.8 2.2 2.6 1.8 2.0 3.3 1.5 1.5 Q4 114.8 2.2 2.3 2.5 3.6 2.1 2.4 0.1 2.1 3.5 1.7 2.42012 Q1 115.5 1.9 1.7 2.2 3.2 2.1 2.5 0.8 2.6 2.5 1.1 2.3
Labour productivity per person employed 2)
2010 102.2 2.5 2.2 10.2 -0.4 3.3 4.1 2.4 1.2 0.0 0.0 -0.32011 103.5 1.3 4.3 3.5 3.0 1.5 -0.7 0.6 -1.4 -0.1 0.5 -0.2
2011 Q2 103.4 1.3 4.0 4.6 1.3 1.4 -1.2 -0.3 -1.3 -0.2 0.6 -0.8 Q3 103.7 1.2 4.8 3.4 2.5 0.6 -0.8 1.8 0.1 0.2 0.4 -0.4 Q4 103.6 0.9 4.9 0.4 4.9 0.9 -1.2 1.4 -2.3 -0.1 0.8 0.72012 Q1 103.8 0.4 3.4 -0.7 2.0 0.4 -1.3 1.1 0.9 0.3 0.4 0.7
Compensation per hour worked
2010 113.3 1.0 0.7 0.9 1.5 1.4 1.9 1.6 2.3 -0.2 0.7 1.32011 115.6 2.0 0.2 2.6 3.2 2.1 2.6 0.9 2.5 2.4 1.3 1.8
2011 Q2 115.8 2.5 1.5 3.5 3.3 2.2 3.2 2.3 3.6 2.9 1.5 2.2 Q3 115.7 2.2 0.4 2.9 2.8 2.0 2.6 1.2 2.0 2.6 1.8 2.0 Q4 116.6 2.1 0.6 2.6 4.1 2.0 2.8 -0.6 3.1 2.5 1.5 2.32012 Q1 116.8 2.1 4.4 2.1 4.2 2.3 2.6 1.2 5.4 2.6 0.7 2.7
Hourly labour productivity 2)
2010 104.1 1.9 1.3 7.4 -0.5 2.8 3.5 1.7 0.0 -0.5 -0.3 0.02011 105.4 1.3 3.5 2.9 2.8 1.8 -0.4 0.1 -1.0 -0.4 0.5 0.1
2011 Q2 105.6 1.8 4.5 4.3 1.9 2.1 -0.1 -0.5 0.0 -0.1 0.9 -0.1 Q3 105.6 1.2 4.9 3.3 2.2 0.6 -1.0 1.3 -0.4 -0.2 0.7 -0.2 Q4 105.7 0.8 4.5 0.6 5.1 1.0 -1.0 1.1 -1.1 -0.7 0.6 0.52012 Q1 105.6 0.7 4.8 -0.7 2.9 0.9 -1.3 1.5 2.7 0.4 0.0 1.0
5. Labour cost indices 3)
Total Total By component For selected economic activities Memo item:
(s.a.; index: Indicator2008 = 100) Wages and Employers’ social Mining, Construction Services of
salaries contributions manufacturing negotiatedand energy wages 4)
% of totalin 2008 100.0 100.0 75.2 24.8 32.4 9.0 58.6
1 2 3 4 5 6 7 8
2010 104.3 1.5 1.4 1.8 1.0 1.8 1.8 1.72011 107.2 2.8 2.6 3.4 3.2 2.5 2.6 2.0
2011 Q2 107.2 3.3 3.1 3.8 4.2 2.9 2.9 1.9 Q3 107.2 2.6 2.4 3.0 2.7 2.4 2.5 2.1 Q4 108.0 2.8 2.6 3.5 3.3 2.9 2.6 2.02012 Q1 108.3 2.0 1.9 2.0 2.5 1.9 1.8 2.0
Sources: Eurostat, ECB calculations based on Eurostat data (Table 4 in Section 5.1) and ECB calculations (column 8 in Table 5 in Section 5.1).1) Compensation (at current prices) per employee divided by labour productivity per person employed.2) Total GDP and value added by economic activity (volumes) per labour input (persons employed and hours worked).3) Hourly labour cost indices for the whole economy, excluding agriculture, public administration, education, health and services not classified elsewhere. Owing to
differences in coverage, the estimates for the components may not be consistent with the total.4) Experimental data (see http://www.ecb.europa.eu/stats/intro/html/experiment.en.html for further details).
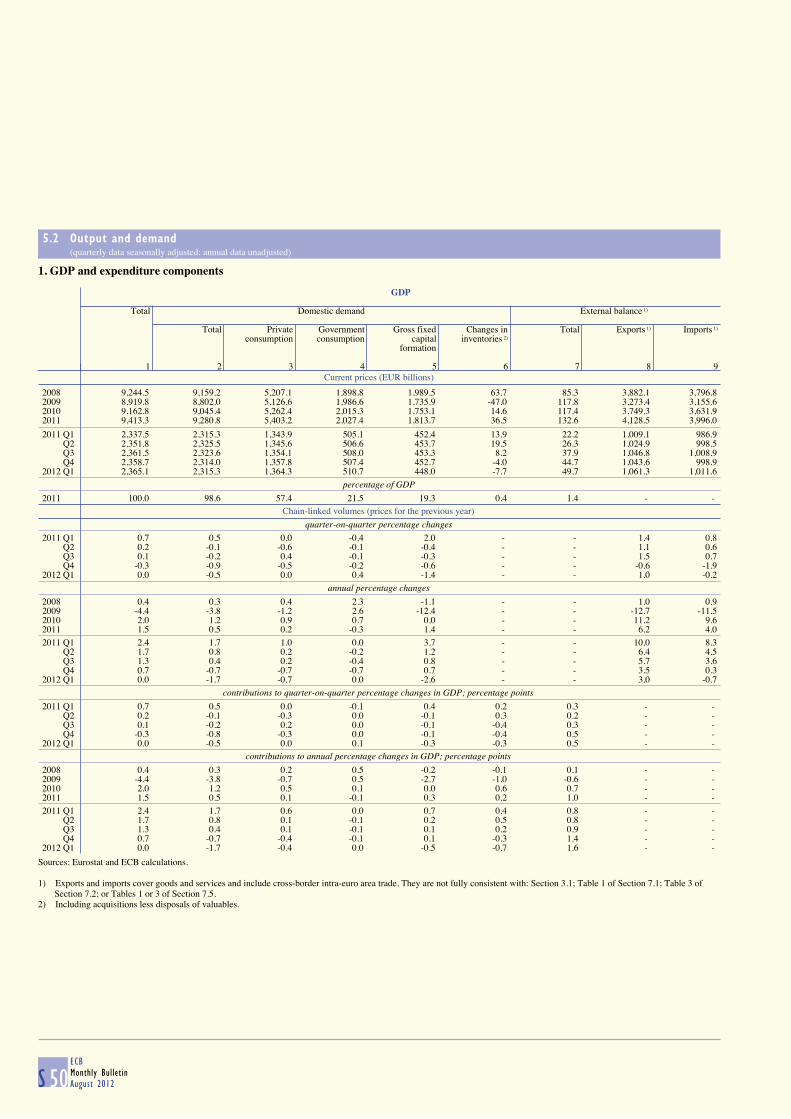
5.2 Output and demand (quarterly data seasonally adjusted; annual data unadjusted)
S 50ECBMonthly BulletinAugust 2012
1. GDP and expenditure components
Current prices (EUR billions)
GDP
Total Domestic demand External balance 1)
Total Private Government Gross fixed Changes in Total Exports 1) Imports 1)
consumption consumption capital inventories 2)
formation
1 2 3 4 5 6 7 8 9
2008 9,244.5 9,159.2 5,207.1 1,898.8 1,989.5 63.7 85.3 3,882.1 3,796.82009 8,919.8 8,802.0 5,126.6 1,986.6 1,735.9 -47.0 117.8 3,273.4 3,155.62010 9,162.8 9,045.4 5,262.4 2,015.3 1,753.1 14.6 117.4 3,749.3 3,631.92011 9,413.3 9,280.8 5,403.2 2,027.4 1,813.7 36.5 132.6 4,128.5 3,996.0
2011 Q1 2,337.5 2,315.3 1,343.9 505.1 452.4 13.9 22.2 1,009.1 986.9 Q2 2,351.8 2,325.5 1,345.6 506.6 453.7 19.5 26.3 1,024.9 998.5 Q3 2,361.5 2,323.6 1,354.1 508.0 453.3 8.2 37.9 1,046.8 1,008.9 Q4 2,358.7 2,314.0 1,357.8 507.4 452.7 -4.0 44.7 1,043.6 998.92012 Q1 2,365.1 2,315.3 1,364.3 510.7 448.0 -7.7 49.7 1,061.3 1,011.6
percentage of GDP
2011 100.0 98.6 57.4 21.5 19.3 0.4 1.4 - -
Chain-linked volumes (prices for the previous year)
quarter-on-quarter percentage changes
2011 Q1 0.7 0.5 0.0 -0.4 2.0 - - 1.4 0.8 Q2 0.2 -0.1 -0.6 -0.1 -0.4 - - 1.1 0.6 Q3 0.1 -0.2 0.4 -0.1 -0.3 - - 1.5 0.7 Q4 -0.3 -0.9 -0.5 -0.2 -0.6 - - -0.6 -1.92012 Q1 0.0 -0.5 0.0 0.4 -1.4 - - 1.0 -0.2
annual percentage changes
2008 0.4 0.3 0.4 2.3 -1.1 - - 1.0 0.92009 -4.4 -3.8 -1.2 2.6 -12.4 - - -12.7 -11.52010 2.0 1.2 0.9 0.7 0.0 - - 11.2 9.62011 1.5 0.5 0.2 -0.3 1.4 - - 6.2 4.0
2011 Q1 2.4 1.7 1.0 0.0 3.7 - - 10.0 8.3 Q2 1.7 0.8 0.2 -0.2 1.2 - - 6.4 4.5 Q3 1.3 0.4 0.2 -0.4 0.8 - - 5.7 3.6 Q4 0.7 -0.7 -0.7 -0.7 0.7 - - 3.5 0.32012 Q1 0.0 -1.7 -0.7 0.0 -2.6 - - 3.0 -0.7
contributions to quarter-on-quarter percentage changes in GDP; percentage points
2011 Q1 0.7 0.5 0.0 -0.1 0.4 0.2 0.3 - - Q2 0.2 -0.1 -0.3 0.0 -0.1 0.3 0.2 - - Q3 0.1 -0.2 0.2 0.0 -0.1 -0.4 0.3 - - Q4 -0.3 -0.8 -0.3 0.0 -0.1 -0.4 0.5 - - 2012 Q1 0.0 -0.5 0.0 0.1 -0.3 -0.3 0.5 - -
contributions to annual percentage changes in GDP; percentage points
2008 0.4 0.3 0.2 0.5 -0.2 -0.1 0.1 - - 2009 -4.4 -3.8 -0.7 0.5 -2.7 -1.0 -0.6 - - 2010 2.0 1.2 0.5 0.1 0.0 0.6 0.7 - - 2011 1.5 0.5 0.1 -0.1 0.3 0.2 1.0 - -
2011 Q1 2.4 1.7 0.6 0.0 0.7 0.4 0.8 - - Q2 1.7 0.8 0.1 -0.1 0.2 0.5 0.8 - - Q3 1.3 0.4 0.1 -0.1 0.1 0.2 0.9 - - Q4 0.7 -0.7 -0.4 -0.1 0.1 -0.3 1.4 - - 2012 Q1 0.0 -1.7 -0.4 0.0 -0.5 -0.7 1.6 - -
Sources: Eurostat and ECB calculations.
1) Exports and imports cover goods and services and include cross-border intra-euro area trade. They are not fully consistent with: Section 3.1; Table 1 of Section 7.1; Table 3 of Section 7.2; or Tables 1 or 3 of Section 7.5.2) Including acquisitions less disposals of valuables.
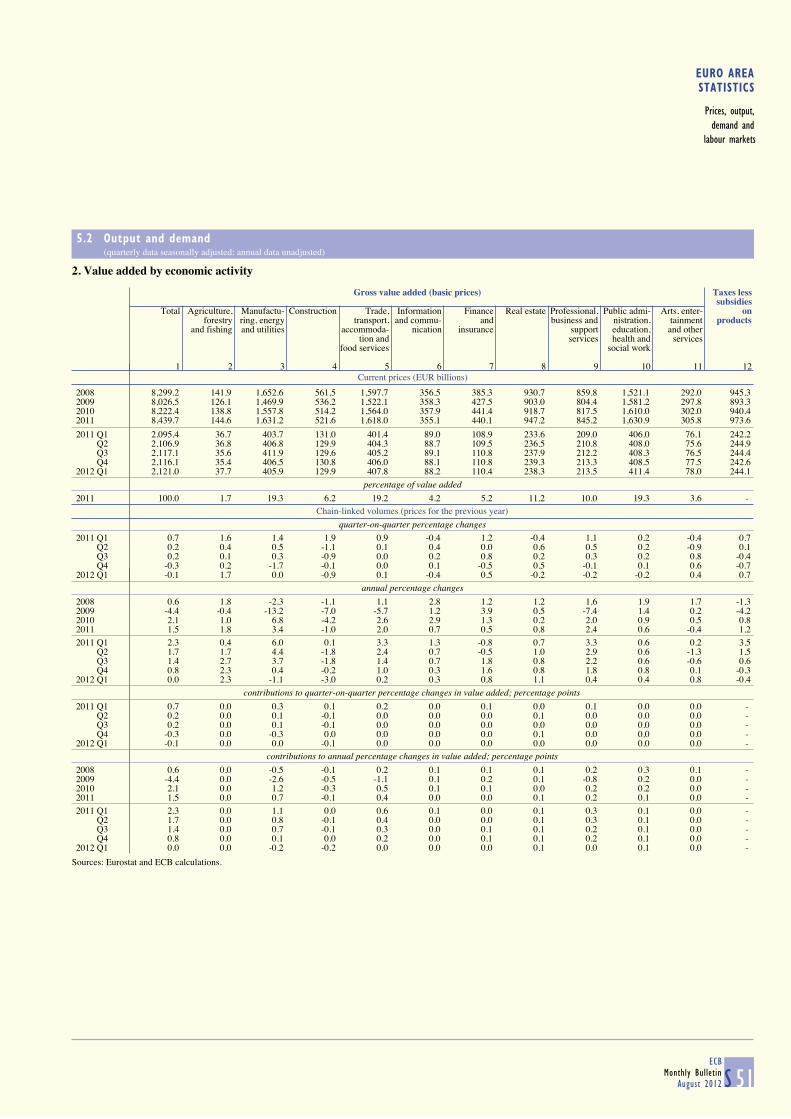
EURO AREASTATISTICS
Prices, output,demand and
labour markets
5.2 Output and demand (quarterly data seasonally adjusted; annual data unadjusted)
S 51ECB
Monthly BulletinAugust 2012
2. Value added by economic activity
Current prices (EUR billions)
Gross value added (basic prices) Taxes less
subsidiesTotal Agriculture, Manufactu- Construction Trade, Information Finance Real estate Professional, Public admi- Arts, enter- on
forestry ring, energy transport, and commu- and business and nistration, tainment productsand fishing and utilities accommoda- nication insurance support education, and other
tion and services health and servicesfood services social work
1 2 3 4 5 6 7 8 9 10 11 12
2008 8,299.2 141.9 1,652.6 561.5 1,597.7 356.5 385.3 930.7 859.8 1,521.1 292.0 945.32009 8,026.5 126.1 1,469.9 536.2 1,522.1 358.3 427.5 903.0 804.4 1,581.2 297.8 893.32010 8,222.4 138.8 1,557.8 514.2 1,564.0 357.9 441.4 918.7 817.5 1,610.0 302.0 940.42011 8,439.7 144.6 1,631.2 521.6 1,618.0 355.1 440.1 947.2 845.2 1,630.9 305.8 973.6
2011 Q1 2,095.4 36.7 403.7 131.0 401.4 89.0 108.9 233.6 209.0 406.0 76.1 242.2 Q2 2,106.9 36.8 406.8 129.9 404.3 88.7 109.5 236.5 210.8 408.0 75.6 244.9 Q3 2,117.1 35.6 411.9 129.6 405.2 89.1 110.8 237.9 212.2 408.3 76.5 244.4 Q4 2,116.1 35.4 406.5 130.8 406.0 88.1 110.8 239.3 213.3 408.5 77.5 242.62012 Q1 2,121.0 37.7 405.9 129.9 407.8 88.2 110.4 238.3 213.5 411.4 78.0 244.1
percentage of value added
2011 100.0 1.7 19.3 6.2 19.2 4.2 5.2 11.2 10.0 19.3 3.6 -
Chain-linked volumes (prices for the previous year)
quarter-on-quarter percentage changes
2011 Q1 0.7 1.6 1.4 1.9 0.9 -0.4 1.2 -0.4 1.1 0.2 -0.4 0.7 Q2 0.2 0.4 0.5 -1.1 0.1 0.4 0.0 0.6 0.5 0.2 -0.9 0.1 Q3 0.2 0.1 0.3 -0.9 0.0 0.2 0.8 0.2 0.3 0.2 0.8 -0.4 Q4 -0.3 0.2 -1.7 -0.1 0.0 0.1 -0.5 0.5 -0.1 0.1 0.6 -0.72012 Q1 -0.1 1.7 0.0 -0.9 0.1 -0.4 0.5 -0.2 -0.2 -0.2 0.4 0.7
annual percentage changes
2008 0.6 1.8 -2.3 -1.1 1.1 2.8 1.2 1.2 1.6 1.9 1.7 -1.32009 -4.4 -0.4 -13.2 -7.0 -5.7 1.2 3.9 0.5 -7.4 1.4 0.2 -4.22010 2.1 1.0 6.8 -4.2 2.6 2.9 1.3 0.2 2.0 0.9 0.5 0.82011 1.5 1.8 3.4 -1.0 2.0 0.7 0.5 0.8 2.4 0.6 -0.4 1.2
2011 Q1 2.3 0.4 6.0 0.1 3.3 1.3 -0.8 0.7 3.3 0.6 0.2 3.5 Q2 1.7 1.7 4.4 -1.8 2.4 0.7 -0.5 1.0 2.9 0.6 -1.3 1.5 Q3 1.4 2.7 3.7 -1.8 1.4 0.7 1.8 0.8 2.2 0.6 -0.6 0.6 Q4 0.8 2.3 0.4 -0.2 1.0 0.3 1.6 0.8 1.8 0.8 0.1 -0.32012 Q1 0.0 2.3 -1.1 -3.0 0.2 0.3 0.8 1.1 0.4 0.4 0.8 -0.4
contributions to quarter-on-quarter percentage changes in value added; percentage points
2011 Q1 0.7 0.0 0.3 0.1 0.2 0.0 0.1 0.0 0.1 0.0 0.0 - Q2 0.2 0.0 0.1 -0.1 0.0 0.0 0.0 0.1 0.0 0.0 0.0 - Q3 0.2 0.0 0.1 -0.1 0.0 0.0 0.0 0.0 0.0 0.0 0.0 - Q4 -0.3 0.0 -0.3 0.0 0.0 0.0 0.0 0.1 0.0 0.0 0.0 - 2012 Q1 -0.1 0.0 0.0 -0.1 0.0 0.0 0.0 0.0 0.0 0.0 0.0 -
contributions to annual percentage changes in value added; percentage points
2008 0.6 0.0 -0.5 -0.1 0.2 0.1 0.1 0.1 0.2 0.3 0.1 - 2009 -4.4 0.0 -2.6 -0.5 -1.1 0.1 0.2 0.1 -0.8 0.2 0.0 - 2010 2.1 0.0 1.2 -0.3 0.5 0.1 0.1 0.0 0.2 0.2 0.0 - 2011 1.5 0.0 0.7 -0.1 0.4 0.0 0.0 0.1 0.2 0.1 0.0 -
2011 Q1 2.3 0.0 1.1 0.0 0.6 0.1 0.0 0.1 0.3 0.1 0.0 - Q2 1.7 0.0 0.8 -0.1 0.4 0.0 0.0 0.1 0.3 0.1 0.0 - Q3 1.4 0.0 0.7 -0.1 0.3 0.0 0.1 0.1 0.2 0.1 0.0 - Q4 0.8 0.0 0.1 0.0 0.2 0.0 0.1 0.1 0.2 0.1 0.0 - 2012 Q1 0.0 0.0 -0.2 -0.2 0.0 0.0 0.0 0.1 0.0 0.1 0.0 -
Sources: Eurostat and ECB calculations.
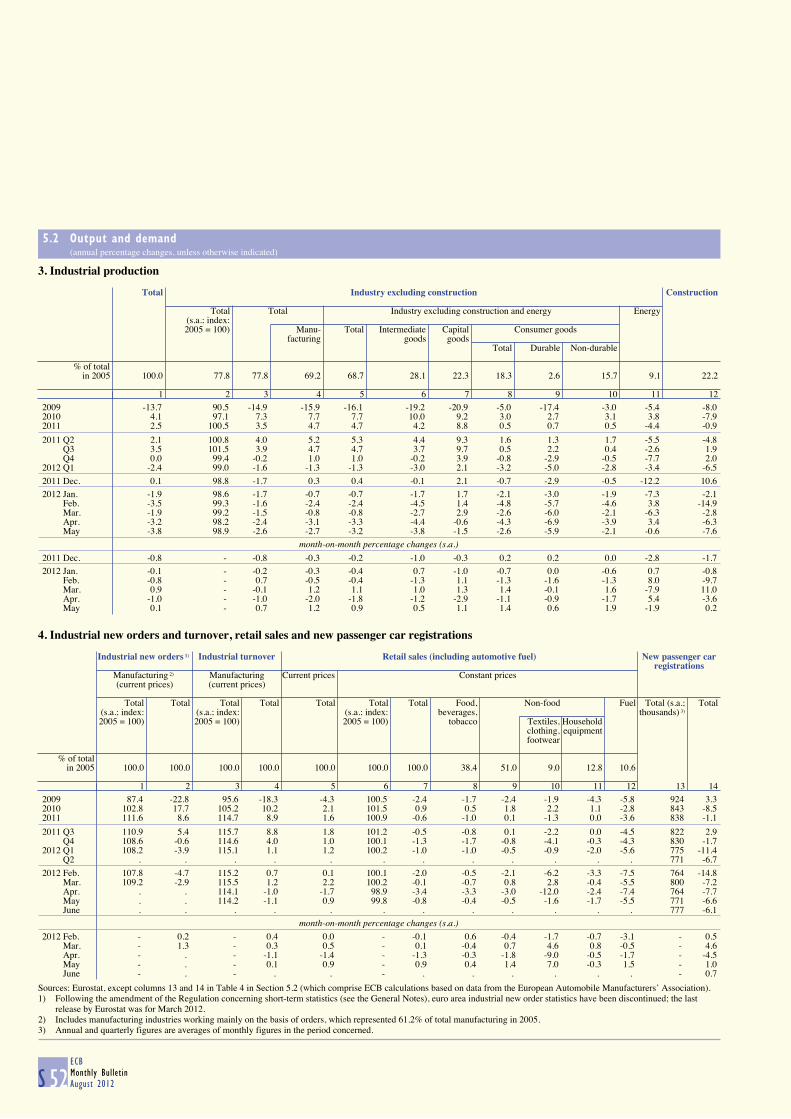
5.2 Output and demand (annual percentage changes, unless otherwise indicated)
S 52ECBMonthly BulletinAugust 2012
3. Industrial production
Total Industry excluding construction Construction
Total Total Industry excluding construction and energy Energy
(s.a.; index: 2005 = 100) Manu- Total Intermediate Capital Consumer goods
facturing goods goodsTotal Durable Non-durable
% of totalin 2005 100.0 77.8 77.8 69.2 68.7 28.1 22.3 18.3 2.6 15.7 9.1 22.2
1 2 3 4 5 6 7 8 9 10 11 12
2009 -13.7 90.5 -14.9 -15.9 -16.1 -19.2 -20.9 -5.0 -17.4 -3.0 -5.4 -8.02010 4.1 97.1 7.3 7.7 7.7 10.0 9.2 3.0 2.7 3.1 3.8 -7.92011 2.5 100.5 3.5 4.7 4.7 4.2 8.8 0.5 0.7 0.5 -4.4 -0.9
2011 Q2 2.1 100.8 4.0 5.2 5.3 4.4 9.3 1.6 1.3 1.7 -5.5 -4.8 Q3 3.5 101.5 3.9 4.7 4.7 3.7 9.7 0.5 2.2 0.4 -2.6 1.9 Q4 0.0 99.4 -0.2 1.0 1.0 -0.2 3.9 -0.8 -2.9 -0.5 -7.7 2.02012 Q1 -2.4 99.0 -1.6 -1.3 -1.3 -3.0 2.1 -3.2 -5.0 -2.8 -3.4 -6.5
2011 Dec. 0.1 98.8 -1.7 0.3 0.4 -0.1 2.1 -0.7 -2.9 -0.5 -12.2 10.6
2012 Jan. -1.9 98.6 -1.7 -0.7 -0.7 -1.7 1.7 -2.1 -3.0 -1.9 -7.3 -2.1 Feb. -3.5 99.3 -1.6 -2.4 -2.4 -4.5 1.4 -4.8 -5.7 -4.6 3.8 -14.9 Mar. -1.9 99.2 -1.5 -0.8 -0.8 -2.7 2.9 -2.6 -6.0 -2.1 -6.3 -2.8 Apr. -3.2 98.2 -2.4 -3.1 -3.3 -4.4 -0.6 -4.3 -6.9 -3.9 3.4 -6.3 May -3.8 98.9 -2.6 -2.7 -3.2 -3.8 -1.5 -2.6 -5.9 -2.1 -0.6 -7.6
month-on-month percentage changes (s.a.)
2011 Dec. -0.8 - -0.8 -0.3 -0.2 -1.0 -0.3 0.2 0.2 0.0 -2.8 -1.7
2012 Jan. -0.1 - -0.2 -0.3 -0.4 0.7 -1.0 -0.7 0.0 -0.6 0.7 -0.8 Feb. -0.8 - 0.7 -0.5 -0.4 -1.3 1.1 -1.3 -1.6 -1.3 8.0 -9.7 Mar. 0.9 - -0.1 1.2 1.1 1.0 1.3 1.4 -0.1 1.6 -7.9 11.0 Apr. -1.0 - -1.0 -2.0 -1.8 -1.2 -2.9 -1.1 -0.9 -1.7 5.4 -3.6 May 0.1 - 0.7 1.2 0.9 0.5 1.1 1.4 0.6 1.9 -1.9 0.2
4. Industrial new orders and turnover, retail sales and new passenger car registrations
Industrial new orders 1) Industrial turnover Retail sales (including automotive fuel) New passenger car
registrations Manufacturing 2) Manufacturing Current prices Constant prices (current prices) (current prices)
Total Total Total Total Total Total Total Food, Non-food Fuel Total (s.a.; Total
(s.a.; index: (s.a.; index: (s.a.; index: beverages, thousands) 3)
2005 = 100) 2005 = 100) 2005 = 100) tobacco Textiles, Householdclothing, equipmentfootwear
% of totalin 2005 100.0 100.0 100.0 100.0 100.0 100.0 100.0 38.4 51.0 9.0 12.8 10.6
1 2 3 4 5 6 7 8 9 10 11 12 13 14
2009 87.4 -22.8 95.6 -18.3 -4.3 100.5 -2.4 -1.7 -2.4 -1.9 -4.3 -5.8 924 3.32010 102.8 17.7 105.2 10.2 2.1 101.5 0.9 0.5 1.8 2.2 1.1 -2.8 843 -8.52011 111.6 8.6 114.7 8.9 1.6 100.9 -0.6 -1.0 0.1 -1.3 0.0 -3.6 838 -1.1
2011 Q3 110.9 5.4 115.7 8.8 1.8 101.2 -0.5 -0.8 0.1 -2.2 0.0 -4.5 822 2.9 Q4 108.6 -0.6 114.6 4.0 1.0 100.1 -1.3 -1.7 -0.8 -4.1 -0.3 -4.3 830 -1.72012 Q1 108.2 -3.9 115.1 1.1 1.2 100.2 -1.0 -1.0 -0.5 -0.9 -2.0 -5.6 775 -11.4 Q2 . . . . . . . . . . . . 771 -6.7
2012 Feb. 107.8 -4.7 115.2 0.7 0.1 100.1 -2.0 -0.5 -2.1 -6.2 -3.3 -7.5 764 -14.8 Mar. 109.2 -2.9 115.5 1.2 2.2 100.2 -0.1 -0.7 0.8 2.8 -0.4 -5.5 800 -7.2 Apr. . . 114.1 -1.0 -1.7 98.9 -3.4 -3.3 -3.0 -12.0 -2.4 -7.4 764 -7.7 May . . 114.2 -1.1 0.9 99.8 -0.8 -0.4 -0.5 -1.6 -1.7 -5.5 771 -6.6 June . . . . . . . . . . . . 777 -6.1
month-on-month percentage changes (s.a.)
2012 Feb. - 0.2 - 0.4 0.0 - -0.1 0.6 -0.4 -1.7 -0.7 -3.1 - 0.5 Mar. - 1.3 - 0.3 0.5 - 0.1 -0.4 0.7 4.6 0.8 -0.5 - 4.6 Apr. - . - -1.1 -1.4 - -1.3 -0.3 -1.8 -9.0 -0.5 -1.7 - -4.5 May - . - 0.1 0.9 - 0.9 0.4 1.4 7.0 -0.3 1.5 - 1.0 June - . - . . - . . . . . . - 0.7
Sources: Eurostat, except columns 13 and 14 in Table 4 in Section 5.2 (which comprise ECB calculations based on data from the European Automobile Manufacturers’ Association).1) Following the amendment of the Regulation concerning short-term statistics (see the General Notes), euro area industrial new order statistics have been discontinued; the last
release by Eurostat was for March 2012.2) Includes manufacturing industries working mainly on the basis of orders, which represented 61.2% of total manufacturing in 2005.3) Annual and quarterly figures are averages of monthly figures in the period concerned.
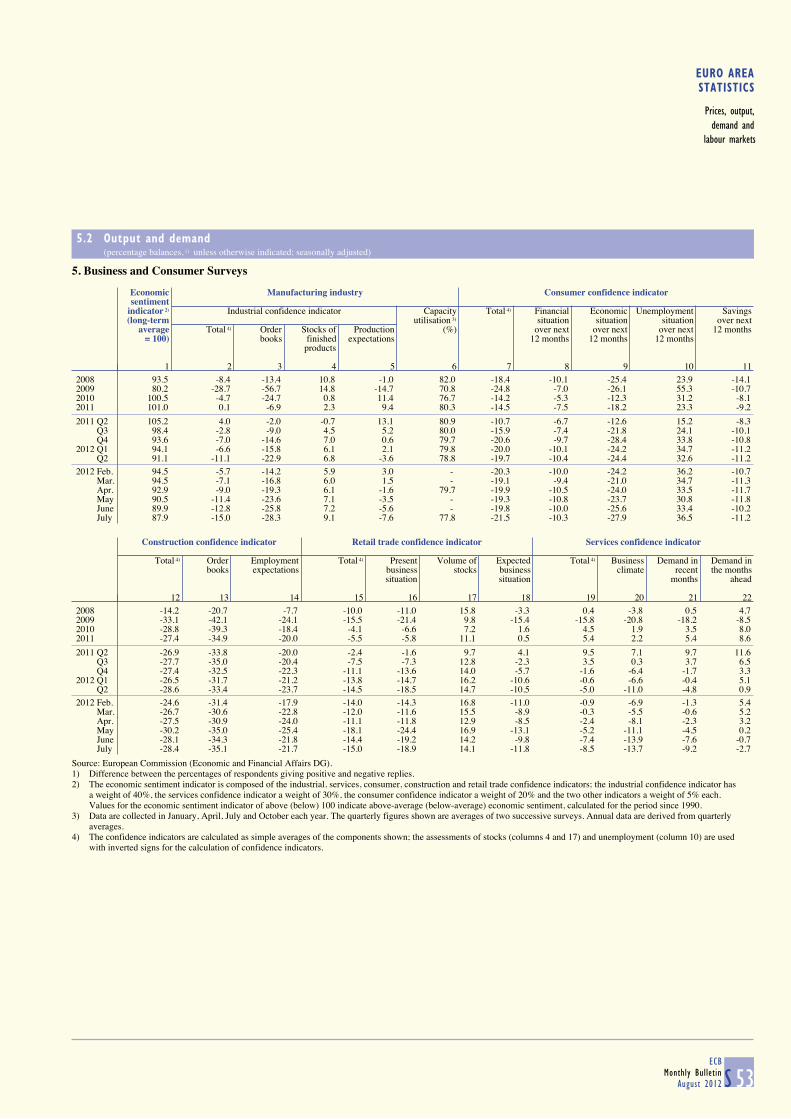
EURO AREASTATISTICS
Prices, output,demand and
labour markets
5.2 Output and demand (percentage balances, 1) unless otherwise indicated; seasonally adjusted)
S 53ECB
Monthly BulletinAugust 2012
5. Business and Consumer Surveys
Economic Manufacturing industry Consumer confidence indicatorsentiment
indicator 2) Industrial confidence indicator Capacity Total 4) Financial Economic Unemployment Savings(long-term utilisation 3) situation situation situation over next
average Total 4) Order Stocks of Production (%) over next over next over next 12 months= 100) books finished expectations 12 months 12 months 12 months
products
1 2 3 4 5 6 7 8 9 10 11
2008 93.5 -8.4 -13.4 10.8 -1.0 82.0 -18.4 -10.1 -25.4 23.9 -14.12009 80.2 -28.7 -56.7 14.8 -14.7 70.8 -24.8 -7.0 -26.1 55.3 -10.72010 100.5 -4.7 -24.7 0.8 11.4 76.7 -14.2 -5.3 -12.3 31.2 -8.12011 101.0 0.1 -6.9 2.3 9.4 80.3 -14.5 -7.5 -18.2 23.3 -9.2
2011 Q2 105.2 4.0 -2.0 -0.7 13.1 80.9 -10.7 -6.7 -12.6 15.2 -8.3 Q3 98.4 -2.8 -9.0 4.5 5.2 80.0 -15.9 -7.4 -21.8 24.1 -10.1 Q4 93.6 -7.0 -14.6 7.0 0.6 79.7 -20.6 -9.7 -28.4 33.8 -10.82012 Q1 94.1 -6.6 -15.8 6.1 2.1 79.8 -20.0 -10.1 -24.2 34.7 -11.2 Q2 91.1 -11.1 -22.9 6.8 -3.6 78.8 -19.7 -10.4 -24.4 32.6 -11.2
2012 Feb. 94.5 -5.7 -14.2 5.9 3.0 - -20.3 -10.0 -24.2 36.2 -10.7 Mar. 94.5 -7.1 -16.8 6.0 1.5 - -19.1 -9.4 -21.0 34.7 -11.3 Apr. 92.9 -9.0 -19.3 6.1 -1.6 79.7 -19.9 -10.5 -24.0 33.5 -11.7 May 90.5 -11.4 -23.6 7.1 -3.5 - -19.3 -10.8 -23.7 30.8 -11.8 June 89.9 -12.8 -25.8 7.2 -5.6 - -19.8 -10.0 -25.6 33.4 -10.2 July 87.9 -15.0 -28.3 9.1 -7.6 77.8 -21.5 -10.3 -27.9 36.5 -11.2
Construction confidence indicator Retail trade confidence indicator Services confidence indicator
Total 4) Order Employment Total 4) Present Volume of Expected Total 4) Business Demand in Demand inbooks expectations business stocks business climate recent the months
situation situation months ahead
12 13 14 15 16 17 18 19 20 21 22
2008 -14.2 -20.7 -7.7 -10.0 -11.0 15.8 -3.3 0.4 -3.8 0.5 4.72009 -33.1 -42.1 -24.1 -15.5 -21.4 9.8 -15.4 -15.8 -20.8 -18.2 -8.52010 -28.8 -39.3 -18.4 -4.1 -6.6 7.2 1.6 4.5 1.9 3.5 8.02011 -27.4 -34.9 -20.0 -5.5 -5.8 11.1 0.5 5.4 2.2 5.4 8.6
2011 Q2 -26.9 -33.8 -20.0 -2.4 -1.6 9.7 4.1 9.5 7.1 9.7 11.6 Q3 -27.7 -35.0 -20.4 -7.5 -7.3 12.8 -2.3 3.5 0.3 3.7 6.5 Q4 -27.4 -32.5 -22.3 -11.1 -13.6 14.0 -5.7 -1.6 -6.4 -1.7 3.32012 Q1 -26.5 -31.7 -21.2 -13.8 -14.7 16.2 -10.6 -0.6 -6.6 -0.4 5.1 Q2 -28.6 -33.4 -23.7 -14.5 -18.5 14.7 -10.5 -5.0 -11.0 -4.8 0.9
2012 Feb. -24.6 -31.4 -17.9 -14.0 -14.3 16.8 -11.0 -0.9 -6.9 -1.3 5.4 Mar. -26.7 -30.6 -22.8 -12.0 -11.6 15.5 -8.9 -0.3 -5.5 -0.6 5.2 Apr. -27.5 -30.9 -24.0 -11.1 -11.8 12.9 -8.5 -2.4 -8.1 -2.3 3.2 May -30.2 -35.0 -25.4 -18.1 -24.4 16.9 -13.1 -5.2 -11.1 -4.5 0.2 June -28.1 -34.3 -21.8 -14.4 -19.2 14.2 -9.8 -7.4 -13.9 -7.6 -0.7 July -28.4 -35.1 -21.7 -15.0 -18.9 14.1 -11.8 -8.5 -13.7 -9.2 -2.7
Source: European Commission (Economic and Financial Affairs DG).1) Difference between the percentages of respondents giving positive and negative replies.2) The economic sentiment indicator is composed of the industrial, services, consumer, construction and retail trade confidence indicators; the industrial confidence indicator has
a weight of 40%, the services confidence indicator a weight of 30%, the consumer confidence indicator a weight of 20% and the two other indicators a weight of 5% each.Values for the economic sentiment indicator of above (below) 100 indicate above-average (below-average) economic sentiment, calculated for the period since 1990.
3) Data are collected in January, April, July and October each year. The quarterly figures shown are averages of two successive surveys. Annual data are derived from quarterly averages.
4) The confidence indicators are calculated as simple averages of the components shown; the assessments of stocks (columns 4 and 17) and unemployment (column 10) are used with inverted signs for the calculation of confidence indicators.
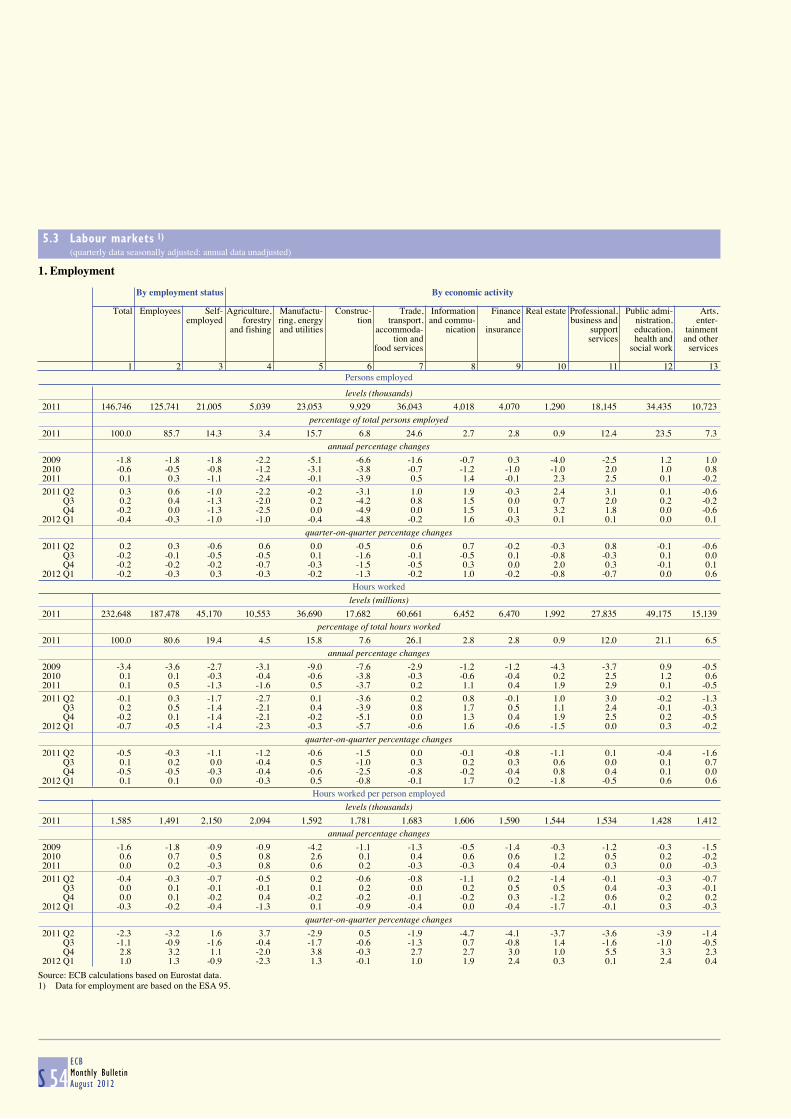
5.3 Labour markets 1)
(quarterly data seasonally adjusted; annual data unadjusted)
S 54ECBMonthly BulletinAugust 2012
1. Employment
Persons employed
By employment status By economic activity
Total Employees Self- Agriculture, Manufactu- Construc- Trade, Information Finance Real estate Professional, Public admi- Arts,employed forestry ring, energy tion transport, and commu- and business and nistration, enter-
and fishing and utilities accommoda- nication insurance support education, tainmenttion and services health and and other
food services social work services
1 2 3 4 5 6 7 8 9 10 11 12 13
levels (thousands)
2011 146,746 125,741 21,005 5,039 23,053 9,929 36,043 4,018 4,070 1,290 18,145 34,435 10,723
percentage of total persons employed
2011 100.0 85.7 14.3 3.4 15.7 6.8 24.6 2.7 2.8 0.9 12.4 23.5 7.3annual percentage changes
2009 -1.8 -1.8 -1.8 -2.2 -5.1 -6.6 -1.6 -0.7 0.3 -4.0 -2.5 1.2 1.02010 -0.6 -0.5 -0.8 -1.2 -3.1 -3.8 -0.7 -1.2 -1.0 -1.0 2.0 1.0 0.82011 0.1 0.3 -1.1 -2.4 -0.1 -3.9 0.5 1.4 -0.1 2.3 2.5 0.1 -0.2
2011 Q2 0.3 0.6 -1.0 -2.2 -0.2 -3.1 1.0 1.9 -0.3 2.4 3.1 0.1 -0.6 Q3 0.2 0.4 -1.3 -2.0 0.2 -4.2 0.8 1.5 0.0 0.7 2.0 0.2 -0.2 Q4 -0.2 0.0 -1.3 -2.5 0.0 -4.9 0.0 1.5 0.1 3.2 1.8 0.0 -0.62012 Q1 -0.4 -0.3 -1.0 -1.0 -0.4 -4.8 -0.2 1.6 -0.3 0.1 0.1 0.0 0.1
quarter-on-quarter percentage changes
2011 Q2 0.2 0.3 -0.6 0.6 0.0 -0.5 0.6 0.7 -0.2 -0.3 0.8 -0.1 -0.6 Q3 -0.2 -0.1 -0.5 -0.5 0.1 -1.6 -0.1 -0.5 0.1 -0.8 -0.3 0.1 0.0 Q4 -0.2 -0.2 -0.2 -0.7 -0.3 -1.5 -0.5 0.3 0.0 2.0 0.3 -0.1 0.12012 Q1 -0.2 -0.3 0.3 -0.3 -0.2 -1.3 -0.2 1.0 -0.2 -0.8 -0.7 0.0 0.6
Hours worked
levels (millions)
2011 232,648 187,478 45,170 10,553 36,690 17,682 60,661 6,452 6,470 1,992 27,835 49,175 15,139percentage of total hours worked
2011 100.0 80.6 19.4 4.5 15.8 7.6 26.1 2.8 2.8 0.9 12.0 21.1 6.5annual percentage changes
2009 -3.4 -3.6 -2.7 -3.1 -9.0 -7.6 -2.9 -1.2 -1.2 -4.3 -3.7 0.9 -0.52010 0.1 0.1 -0.3 -0.4 -0.6 -3.8 -0.3 -0.6 -0.4 0.2 2.5 1.2 0.62011 0.1 0.5 -1.3 -1.6 0.5 -3.7 0.2 1.1 0.4 1.9 2.9 0.1 -0.5
2011 Q2 -0.1 0.3 -1.7 -2.7 0.1 -3.6 0.2 0.8 -0.1 1.0 3.0 -0.2 -1.3 Q3 0.2 0.5 -1.4 -2.1 0.4 -3.9 0.8 1.7 0.5 1.1 2.4 -0.1 -0.3 Q4 -0.2 0.1 -1.4 -2.1 -0.2 -5.1 0.0 1.3 0.4 1.9 2.5 0.2 -0.52012 Q1 -0.7 -0.5 -1.4 -2.3 -0.3 -5.7 -0.6 1.6 -0.6 -1.5 0.0 0.3 -0.2
quarter-on-quarter percentage changes
2011 Q2 -0.5 -0.3 -1.1 -1.2 -0.6 -1.5 0.0 -0.1 -0.8 -1.1 0.1 -0.4 -1.6 Q3 0.1 0.2 0.0 -0.4 0.5 -1.0 0.3 0.2 0.3 0.6 0.0 0.1 0.7 Q4 -0.5 -0.5 -0.3 -0.4 -0.6 -2.5 -0.8 -0.2 -0.4 0.8 0.4 0.1 0.02012 Q1 0.1 0.1 0.0 -0.3 0.5 -0.8 -0.1 1.7 0.2 -1.8 -0.5 0.6 0.6
Hours worked per person employed
levels (thousands)
2011 1,585 1,491 2,150 2,094 1,592 1,781 1,683 1,606 1,590 1,544 1,534 1,428 1,412annual percentage changes
2009 -1.6 -1.8 -0.9 -0.9 -4.2 -1.1 -1.3 -0.5 -1.4 -0.3 -1.2 -0.3 -1.52010 0.6 0.7 0.5 0.8 2.6 0.1 0.4 0.6 0.6 1.2 0.5 0.2 -0.22011 0.0 0.2 -0.3 0.8 0.6 0.2 -0.3 -0.3 0.4 -0.4 0.3 0.0 -0.3
2011 Q2 -0.4 -0.3 -0.7 -0.5 0.2 -0.6 -0.8 -1.1 0.2 -1.4 -0.1 -0.3 -0.7 Q3 0.0 0.1 -0.1 -0.1 0.1 0.2 0.0 0.2 0.5 0.5 0.4 -0.3 -0.1 Q4 0.0 0.1 -0.2 0.4 -0.2 -0.2 -0.1 -0.2 0.3 -1.2 0.6 0.2 0.22012 Q1 -0.3 -0.2 -0.4 -1.3 0.1 -0.9 -0.4 0.0 -0.4 -1.7 -0.1 0.3 -0.3
quarter-on-quarter percentage changes
2011 Q2 -2.3 -3.2 1.6 3.7 -2.9 0.5 -1.9 -4.7 -4.1 -3.7 -3.6 -3.9 -1.4 Q3 -1.1 -0.9 -1.6 -0.4 -1.7 -0.6 -1.3 0.7 -0.8 1.4 -1.6 -1.0 -0.5 Q4 2.8 3.2 1.1 -2.0 3.8 -0.3 2.7 2.7 3.0 1.0 5.5 3.3 2.32012 Q1 1.0 1.3 -0.9 -2.3 1.3 -0.1 1.0 1.9 2.4 0.3 0.1 2.4 0.4
Source: ECB calculations based on Eurostat data.1) Data for employment are based on the ESA 95.
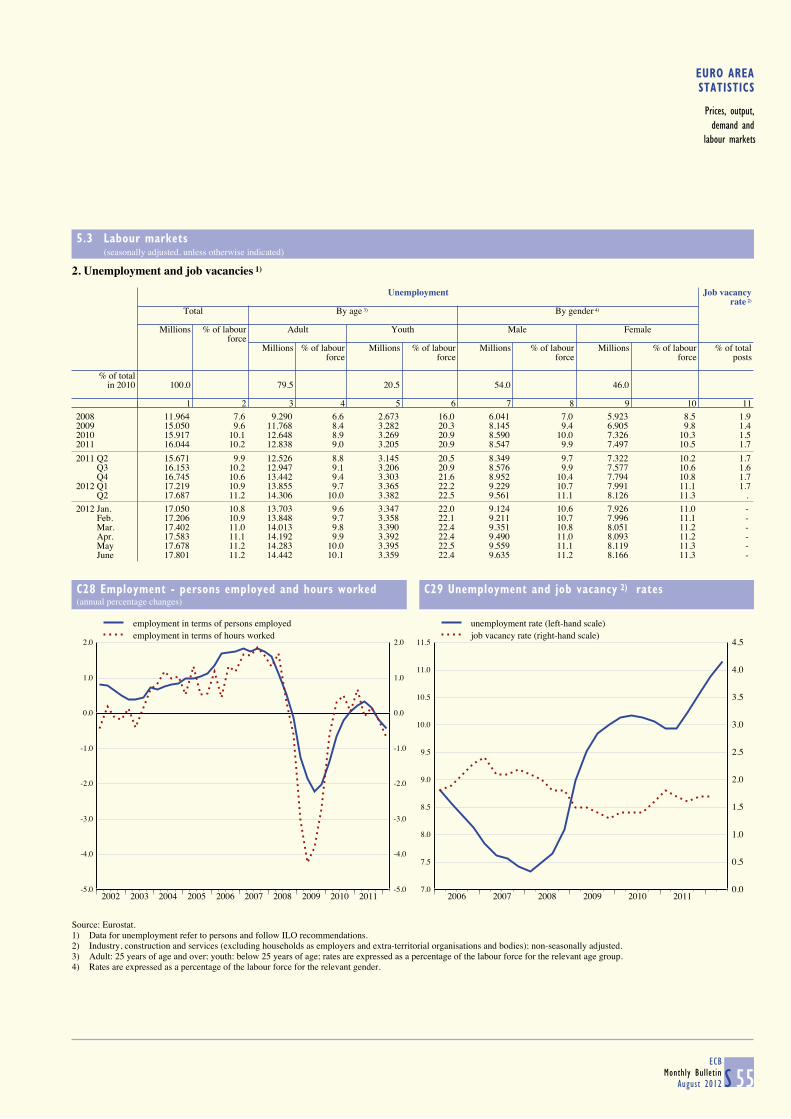
EURO AREASTATISTICS
Prices, output,demand and
labour markets
5.3 Labour markets (seasonally adjusted, unless otherwise indicated)
S 55ECB
Monthly BulletinAugust 2012
2. Unemployment and job vacancies 1)
Unemployment Job vacancy
rate 2)
Total By age 3) By gender 4)
Millions % of labour Adult Youth Male Femaleforce
Millions % of labour Millions % of labour Millions % of labour Millions % of labour % of totalforce force force force posts
% of totalin 2010 100.0 79.5 20.5 54.0 46.0
1 2 3 4 5 6 7 8 9 10 11
2008 11.964 7.6 9.290 6.6 2.673 16.0 6.041 7.0 5.923 8.5 1.92009 15.050 9.6 11.768 8.4 3.282 20.3 8.145 9.4 6.905 9.8 1.42010 15.917 10.1 12.648 8.9 3.269 20.9 8.590 10.0 7.326 10.3 1.52011 16.044 10.2 12.838 9.0 3.205 20.9 8.547 9.9 7.497 10.5 1.7
2011 Q2 15.671 9.9 12.526 8.8 3.145 20.5 8.349 9.7 7.322 10.2 1.7 Q3 16.153 10.2 12.947 9.1 3.206 20.9 8.576 9.9 7.577 10.6 1.6 Q4 16.745 10.6 13.442 9.4 3.303 21.6 8.952 10.4 7.794 10.8 1.72012 Q1 17.219 10.9 13.855 9.7 3.365 22.2 9.229 10.7 7.991 11.1 1.7 Q2 17.687 11.2 14.306 10.0 3.382 22.5 9.561 11.1 8.126 11.3 .
2012 Jan. 17.050 10.8 13.703 9.6 3.347 22.0 9.124 10.6 7.926 11.0 - Feb. 17.206 10.9 13.848 9.7 3.358 22.1 9.211 10.7 7.996 11.1 - Mar. 17.402 11.0 14.013 9.8 3.390 22.4 9.351 10.8 8.051 11.2 - Apr. 17.583 11.1 14.192 9.9 3.392 22.4 9.490 11.0 8.093 11.2 - May 17.678 11.2 14.283 10.0 3.395 22.5 9.559 11.1 8.119 11.3 - June 17.801 11.2 14.442 10.1 3.359 22.4 9.635 11.2 8.166 11.3 -
C28 Employment - persons employed and hours worked
(annual percentage changes)
C29 Unemployment and job vacancy 2) rates
-5.0
-4.0
-3.0
-2.0
-1.0
0.0
1.0
2.0
2002 2003 2004 2005 2006 2007 2008 2009 2010 2011-5.0
-4.0
-3.0
-2.0
-1.0
0.0
1.0
2.0
employment in terms of persons employedemployment in terms of hours worked
7.0
7.5
8.0
8.5
9.0
9.5
10.0
10.5
11.0
11.5
2006 2007 2008 2009 2010 20110.0
0.5
1.0
1.5
2.0
2.5
3.0
3.5
4.0
4.5
unemployment rate (left-hand scale)job vacancy rate (right-hand scale)
Source: Eurostat.1) Data for unemployment refer to persons and follow ILO recommendations.2) Industry, construction and services (excluding households as employers and extra-territorial organisations and bodies); non-seasonally adjusted.3) Adult: 25 years of age and over; youth: below 25 years of age; rates are expressed as a percentage of the labour force for the relevant age group.4) Rates are expressed as a percentage of the labour force for the relevant gender.

6 GOVERNMENT FINANCE
6.1 Revenue, expenditure and deficit/surplus 1) (as a percentage of GDP)
S 56ECBMonthly BulletinAugust 2012
1. Euro area _ revenue
Total Current revenue Capital revenue Memo
item:Direct Indirect Social Sales Capital Fiscaltaxes Households Corporations taxes Received by EU contributions Employers Employees taxes burden 2)
institutions1 2 3 4 5 6 7 8 9 10 11 12 13 14
2003 44.9 44.2 11.5 8.8 2.7 13.2 0.4 15.7 8.2 4.6 2.3 0.6 0.5 40.92004 44.5 44.0 11.5 8.5 2.9 13.2 0.3 15.5 8.1 4.5 2.2 0.5 0.4 40.62005 44.8 44.3 11.7 8.6 3.0 13.3 0.3 15.4 8.1 4.5 2.3 0.5 0.3 40.72006 45.3 45.0 12.3 8.7 3.4 13.4 0.3 15.3 8.0 4.5 2.3 0.3 0.3 41.32007 45.3 45.1 12.7 8.9 3.6 13.3 0.3 15.1 8.0 4.4 2.3 0.3 0.3 41.32008 45.1 44.8 12.5 9.1 3.2 12.9 0.3 15.3 8.1 4.5 2.3 0.2 0.3 40.92009 44.9 44.5 11.6 9.2 2.3 12.8 0.3 15.8 8.3 4.5 2.5 0.3 0.4 40.62010 44.7 44.5 11.6 8.9 2.5 12.9 0.3 15.6 8.2 4.5 2.6 0.3 0.3 40.42011 45.3 45.0 11.9 9.1 2.7 13.0 0.3 15.7 8.2 4.6 2.6 0.3 0.3 40.9
2. Euro area _ expenditure
Total Current expenditure Capital expenditure Memo
item:Total Compensation Intermediate Interest Current Investment Capital Primary
of consumption transfers Social Subsidies transfers Paid by EU expenditure 3)
employees payments Paid by EU institutionsinstitutions
1 2 3 4 5 6 7 8 9 10 11 12 13 14
2003 48.0 44.1 10.6 5.0 3.3 25.2 22.3 1.8 0.5 4.0 2.6 1.4 0.1 44.72004 47.4 43.5 10.5 5.0 3.1 24.9 22.1 1.7 0.5 3.9 2.5 1.5 0.1 44.32005 47.3 43.4 10.5 5.0 3.0 24.9 22.1 1.7 0.5 3.9 2.5 1.4 0.0 44.32006 46.7 42.8 10.3 5.0 2.9 24.6 21.8 1.6 0.5 3.9 2.5 1.4 0.0 43.82007 46.0 42.2 10.1 5.0 3.0 24.2 21.4 1.6 0.4 3.8 2.6 1.2 0.0 43.12008 47.2 43.3 10.3 5.2 3.0 24.8 21.9 1.6 0.4 3.9 2.6 1.3 0.0 44.22009 51.3 47.0 11.0 5.7 2.9 27.4 24.3 1.8 0.4 4.3 2.8 1.4 0.0 48.42010 51.0 46.6 10.8 5.7 2.8 27.3 24.2 1.8 0.4 4.4 2.5 1.9 0.0 48.22011 49.4 46.0 10.6 5.5 3.0 26.9 23.9 1.7 0.4 3.4 2.3 1.2 0.0 46.4
3. Euro area _ deficit/surplus, primary deficit/surplus and government consumption
Deficit (-)/surplus (+) Primary Government consumption 4)
deficit (-)/ Total Central State Local Social surplus (+) Total Collective Individual
gov. gov. gov. security Compensation Intermediate Transfers Consumption Sales consumption consumptionfunds of employees consumption in kind of fixed (minus)
via market capitalproducers
1 2 3 4 5 6 7 8 9 10 11 12 13 14
2003 -3.2 -2.5 -0.5 -0.2 0.1 0.2 20.5 10.6 5.0 5.2 1.9 2.3 8.1 12.32004 -2.9 -2.5 -0.4 -0.3 0.2 0.2 20.4 10.5 5.0 5.1 1.9 2.2 8.1 12.32005 -2.6 -2.3 -0.3 -0.2 0.2 0.5 20.4 10.5 5.0 5.1 1.9 2.3 8.0 12.42006 -1.4 -1.5 -0.1 -0.2 0.4 1.5 20.3 10.3 5.0 5.2 1.9 2.3 7.9 12.42007 -0.7 -1.2 0.0 0.0 0.6 2.3 20.0 10.1 5.0 5.1 1.9 2.3 7.7 12.32008 -2.1 -2.3 -0.2 -0.2 0.5 0.9 20.5 10.3 5.2 5.3 2.0 2.3 8.0 12.62009 -6.4 -5.2 -0.5 -0.3 -0.4 -3.5 22.3 11.0 5.7 5.8 2.1 2.5 8.6 13.62010 -6.2 -5.1 -0.7 -0.3 -0.1 -3.4 22.0 10.8 5.7 5.8 2.1 2.6 8.4 13.62011 -4.1 -3.2 -0.7 -0.2 0.0 -1.1 21.5 10.6 5.5 5.8 2.1 2.6 8.2 13.3
4. Euro area countries _ deficit (-)/surplus (+) 5)
BE DE EE IE GR ES FR IT CY LU MT NL AT PT SI SK FI1 2 3 4 5 6 7 8 9 10 11 12 13 14 15 16 17
2008 -1.0 -0.1 -2.9 -7.3 -9.8 -4.5 -3.3 -2.7 0.9 3.0 -4.6 0.5 -0.9 -3.6 -1.9 -2.1 4.32009 -5.6 -3.2 -2.0 -14.0 -15.6 -11.2 -7.5 -5.4 -6.1 -0.8 -3.8 -5.6 -4.1 -10.2 -6.1 -8.0 -2.52010 -3.8 -4.3 0.2 -31.2 -10.3 -9.3 -7.1 -4.6 -5.3 -0.9 -3.7 -5.1 -4.5 -9.8 -6.0 -7.7 -2.52011 -3.7 -1.0 1.0 -13.1 -9.1 -8.5 -5.2 -3.9 -6.3 -0.6 -2.7 -4.7 -2.6 -4.2 -6.4 -4.8 -0.5
Sources: ECB for euro area aggregated data; European Commission for data relating to countries’ deficit/surplus.1) Data refer to the Euro 17. The concepts "revenue", "expenditure" and "deficit/surplus" are based on the ESA 95. Transactions involving the EU budget are included and
consolidated. Transactions among Member States’ governments are not consolidated.2) The fiscal burden comprises taxes and social contributions.3) Comprises total expenditure minus interest expenditure.4) Corresponds to final consumption expenditure (P.3) of general government in the ESA 95.5) Includes proceeds from the sale of UMTS licences and settlements under swaps and forward rate agreements.
6
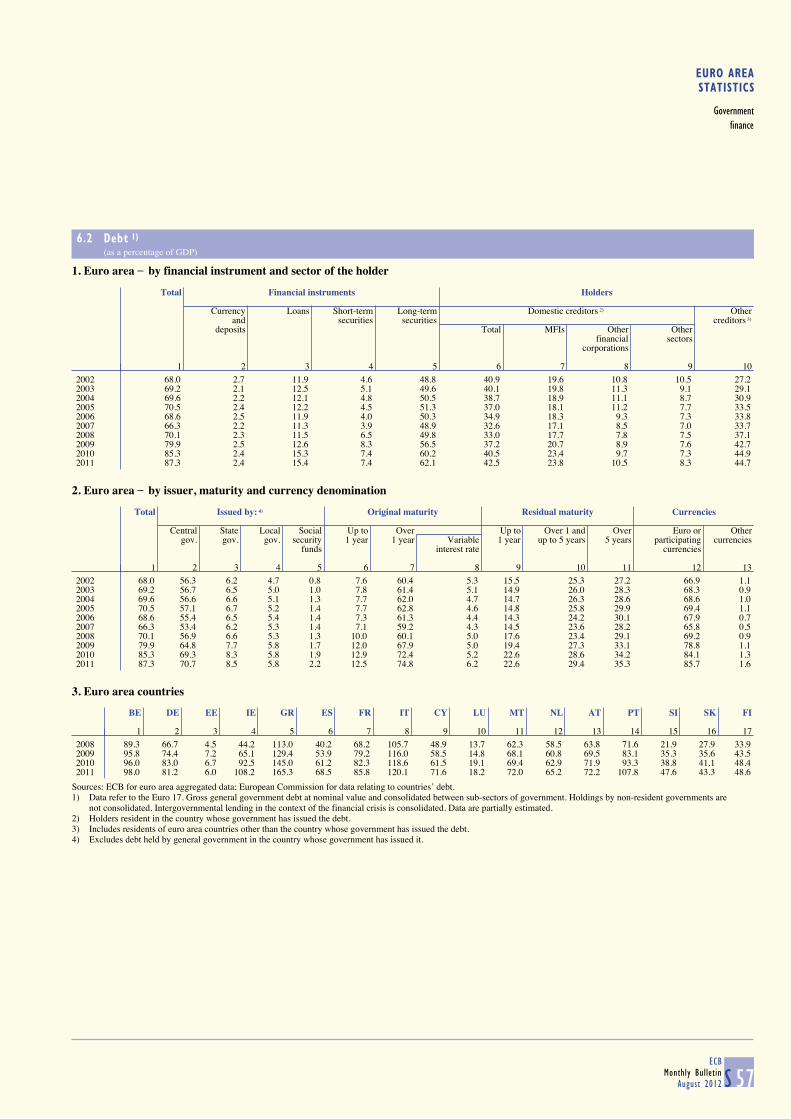
EURO AREASTATISTICS
Governmentfinance
6.2 Debt 1) (as a percentage of GDP)
S 57ECB
Monthly BulletinAugust 2012
1. Euro area _ by financial instrument and sector of the holder
Total Financial instruments Holders
Currency Loans Short-term Long-term Domestic creditors 2) Other
and securities securities creditors 3)
deposits Total MFIs Other Otherfinancial sectors
corporations
1 2 3 4 5 6 7 8 9 10
2002 68.0 2.7 11.9 4.6 48.8 40.9 19.6 10.8 10.5 27.22003 69.2 2.1 12.5 5.1 49.6 40.1 19.8 11.3 9.1 29.12004 69.6 2.2 12.1 4.8 50.5 38.7 18.9 11.1 8.7 30.92005 70.5 2.4 12.2 4.5 51.3 37.0 18.1 11.2 7.7 33.52006 68.6 2.5 11.9 4.0 50.3 34.9 18.3 9.3 7.3 33.82007 66.3 2.2 11.3 3.9 48.9 32.6 17.1 8.5 7.0 33.72008 70.1 2.3 11.5 6.5 49.8 33.0 17.7 7.8 7.5 37.12009 79.9 2.5 12.6 8.3 56.5 37.2 20.7 8.9 7.6 42.72010 85.3 2.4 15.3 7.4 60.2 40.5 23.4 9.7 7.3 44.92011 87.3 2.4 15.4 7.4 62.1 42.5 23.8 10.5 8.3 44.7
2. Euro area _ by issuer, maturity and currency denomination
Total Issued by: 4) Original maturity Residual maturity Currencies
Central State Local Social Up to Over Up to Over 1 and Over Euro or Other
gov. gov. gov. security 1 year 1 year Variable 1 year up to 5 years 5 years participating currenciesfunds interest rate currencies
1 2 3 4 5 6 7 8 9 10 11 12 13
2002 68.0 56.3 6.2 4.7 0.8 7.6 60.4 5.3 15.5 25.3 27.2 66.9 1.12003 69.2 56.7 6.5 5.0 1.0 7.8 61.4 5.1 14.9 26.0 28.3 68.3 0.92004 69.6 56.6 6.6 5.1 1.3 7.7 62.0 4.7 14.7 26.3 28.6 68.6 1.02005 70.5 57.1 6.7 5.2 1.4 7.7 62.8 4.6 14.8 25.8 29.9 69.4 1.12006 68.6 55.4 6.5 5.4 1.4 7.3 61.3 4.4 14.3 24.2 30.1 67.9 0.72007 66.3 53.4 6.2 5.3 1.4 7.1 59.2 4.3 14.5 23.6 28.2 65.8 0.52008 70.1 56.9 6.6 5.3 1.3 10.0 60.1 5.0 17.6 23.4 29.1 69.2 0.92009 79.9 64.8 7.7 5.8 1.7 12.0 67.9 5.0 19.4 27.3 33.1 78.8 1.12010 85.3 69.3 8.3 5.8 1.9 12.9 72.4 5.2 22.6 28.6 34.2 84.1 1.32011 87.3 70.7 8.5 5.8 2.2 12.5 74.8 6.2 22.6 29.4 35.3 85.7 1.6
3. Euro area countries
BE DE EE IE GR ES FR IT CY LU MT NL AT PT SI SK FI
1 2 3 4 5 6 7 8 9 10 11 12 13 14 15 16 17
2008 89.3 66.7 4.5 44.2 113.0 40.2 68.2 105.7 48.9 13.7 62.3 58.5 63.8 71.6 21.9 27.9 33.92009 95.8 74.4 7.2 65.1 129.4 53.9 79.2 116.0 58.5 14.8 68.1 60.8 69.5 83.1 35.3 35.6 43.52010 96.0 83.0 6.7 92.5 145.0 61.2 82.3 118.6 61.5 19.1 69.4 62.9 71.9 93.3 38.8 41.1 48.42011 98.0 81.2 6.0 108.2 165.3 68.5 85.8 120.1 71.6 18.2 72.0 65.2 72.2 107.8 47.6 43.3 48.6
Sources: ECB for euro area aggregated data; European Commission for data relating to countries’ debt.1) Data refer to the Euro 17. Gross general government debt at nominal value and consolidated between sub-sectors of government. Holdings by non-resident governments are
not consolidated. Intergovernmental lending in the context of the financial crisis is consolidated. Data are partially estimated.2) Holders resident in the country whose government has issued the debt. 3) Includes residents of euro area countries other than the country whose government has issued the debt. 4) Excludes debt held by general government in the country whose government has issued it.
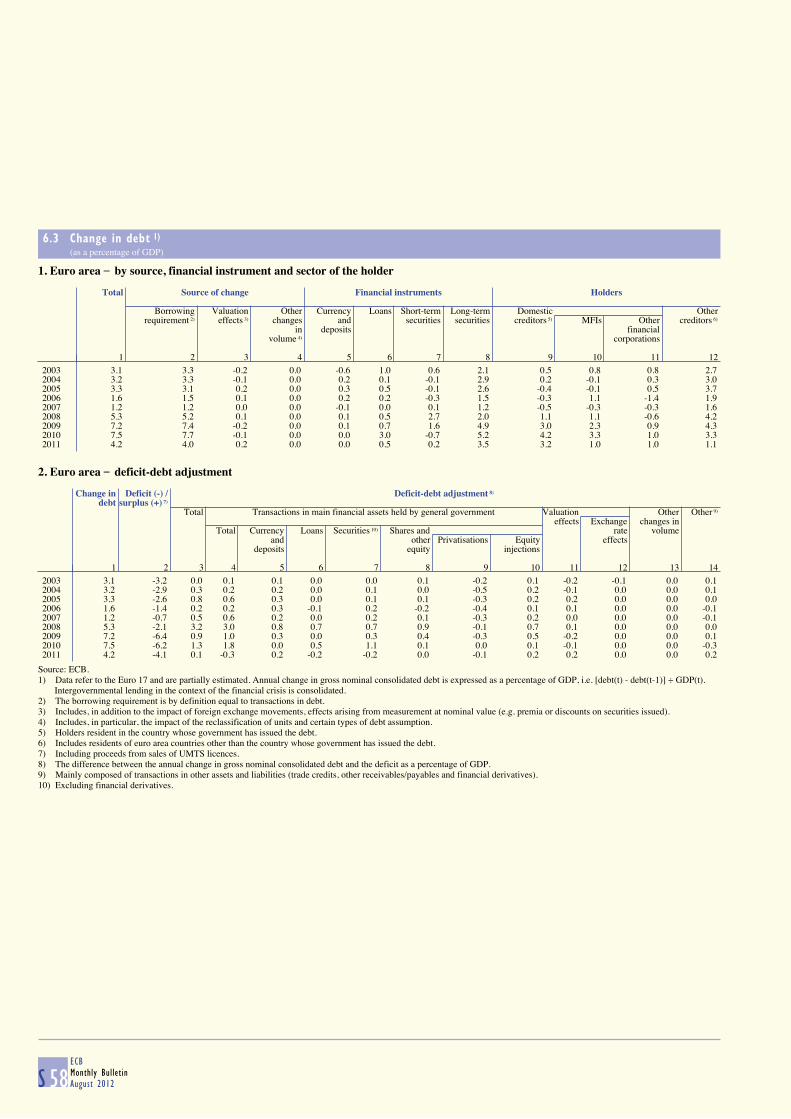
6.3 Change in debt 1) (as a percentage of GDP)
S 58ECBMonthly BulletinAugust 2012
1. Euro area _ by source, financial instrument and sector of the holder
Total Source of change Financial instruments Holders
Borrowing Valuation Other Currency Loans Short-term Long-term Domestic Other
requirement 2) effects 3) changes and securities securities creditors 5) MFIs Other creditors 6)
in deposits financialvolume 4) corporations
1 2 3 4 5 6 7 8 9 10 11 12
2003 3.1 3.3 -0.2 0.0 -0.6 1.0 0.6 2.1 0.5 0.8 0.8 2.72004 3.2 3.3 -0.1 0.0 0.2 0.1 -0.1 2.9 0.2 -0.1 0.3 3.02005 3.3 3.1 0.2 0.0 0.3 0.5 -0.1 2.6 -0.4 -0.1 0.5 3.72006 1.6 1.5 0.1 0.0 0.2 0.2 -0.3 1.5 -0.3 1.1 -1.4 1.92007 1.2 1.2 0.0 0.0 -0.1 0.0 0.1 1.2 -0.5 -0.3 -0.3 1.62008 5.3 5.2 0.1 0.0 0.1 0.5 2.7 2.0 1.1 1.1 -0.6 4.22009 7.2 7.4 -0.2 0.0 0.1 0.7 1.6 4.9 3.0 2.3 0.9 4.32010 7.5 7.7 -0.1 0.0 0.0 3.0 -0.7 5.2 4.2 3.3 1.0 3.32011 4.2 4.0 0.2 0.0 0.0 0.5 0.2 3.5 3.2 1.0 1.0 1.1
2. Euro area _ deficit-debt adjustment
Change in Deficit (-) / Deficit-debt adjustment 8)
debt surplus (+) 7) Total Transactions in main financial assets held by general government Valuation Other Other 9)
effects Exchange changes inTotal Currency Loans Securities 10) Shares and rate volume
and other Privatisations Equity effectsdeposits equity injections
1 2 3 4 5 6 7 8 9 10 11 12 13 14
2003 3.1 -3.2 0.0 0.1 0.1 0.0 0.0 0.1 -0.2 0.1 -0.2 -0.1 0.0 0.12004 3.2 -2.9 0.3 0.2 0.2 0.0 0.1 0.0 -0.5 0.2 -0.1 0.0 0.0 0.12005 3.3 -2.6 0.8 0.6 0.3 0.0 0.1 0.1 -0.3 0.2 0.2 0.0 0.0 0.02006 1.6 -1.4 0.2 0.2 0.3 -0.1 0.2 -0.2 -0.4 0.1 0.1 0.0 0.0 -0.12007 1.2 -0.7 0.5 0.6 0.2 0.0 0.2 0.1 -0.3 0.2 0.0 0.0 0.0 -0.12008 5.3 -2.1 3.2 3.0 0.8 0.7 0.7 0.9 -0.1 0.7 0.1 0.0 0.0 0.02009 7.2 -6.4 0.9 1.0 0.3 0.0 0.3 0.4 -0.3 0.5 -0.2 0.0 0.0 0.12010 7.5 -6.2 1.3 1.8 0.0 0.5 1.1 0.1 0.0 0.1 -0.1 0.0 0.0 -0.32011 4.2 -4.1 0.1 -0.3 0.2 -0.2 -0.2 0.0 -0.1 0.2 0.2 0.0 0.0 0.2
Source: ECB.1) Data refer to the Euro 17 and are partially estimated. Annual change in gross nominal consolidated debt is expressed as a percentage of GDP, i.e. [debt(t) - debt(t-1)] ÷ GDP(t). Intergovernmental lending in the context of the financial crisis is consolidated.2) The borrowing requirement is by definition equal to transactions in debt.3) Includes, in addition to the impact of foreign exchange movements, effects arising from measurement at nominal value (e.g. premia or discounts on securities issued).4) Includes, in particular, the impact of the reclassification of units and certain types of debt assumption.5) Holders resident in the country whose government has issued the debt. 6) Includes residents of euro area countries other than the country whose government has issued the debt. 7) Including proceeds from sales of UMTS licences.8) The difference between the annual change in gross nominal consolidated debt and the deficit as a percentage of GDP. 9) Mainly composed of transactions in other assets and liabilities (trade credits, other receivables/payables and financial derivatives).10) Excluding financial derivatives.
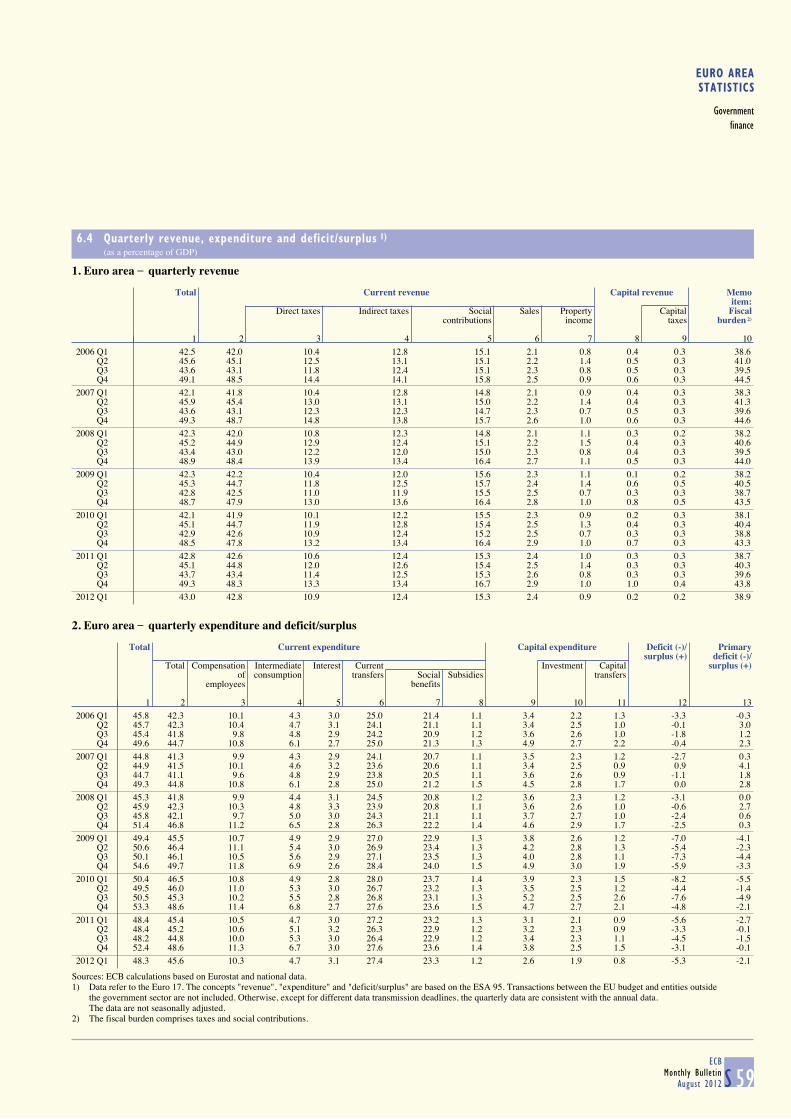
EURO AREASTATISTICS
Governmentfinance
6.4 Quarterly revenue, expenditure and deficit/surplus 1) (as a percentage of GDP)
S 59ECB
Monthly BulletinAugust 2012
1. Euro area _ quarterly revenue
Total Current revenue Capital revenue Memo
item:Direct taxes Indirect taxes Social Sales Property Capital Fiscal
contributions income taxes burden 2)
1 2 3 4 5 6 7 8 9 10
2006 Q1 42.5 42.0 10.4 12.8 15.1 2.1 0.8 0.4 0.3 38.6 Q2 45.6 45.1 12.5 13.1 15.1 2.2 1.4 0.5 0.3 41.0 Q3 43.6 43.1 11.8 12.4 15.1 2.3 0.8 0.5 0.3 39.5 Q4 49.1 48.5 14.4 14.1 15.8 2.5 0.9 0.6 0.3 44.5
2007 Q1 42.1 41.8 10.4 12.8 14.8 2.1 0.9 0.4 0.3 38.3 Q2 45.9 45.4 13.0 13.1 15.0 2.2 1.4 0.4 0.3 41.3 Q3 43.6 43.1 12.3 12.3 14.7 2.3 0.7 0.5 0.3 39.6 Q4 49.3 48.7 14.8 13.8 15.7 2.6 1.0 0.6 0.3 44.6
2008 Q1 42.3 42.0 10.8 12.3 14.8 2.1 1.1 0.3 0.2 38.2 Q2 45.2 44.9 12.9 12.4 15.1 2.2 1.5 0.4 0.3 40.6 Q3 43.4 43.0 12.2 12.0 15.0 2.3 0.8 0.4 0.3 39.5 Q4 48.9 48.4 13.9 13.4 16.4 2.7 1.1 0.5 0.3 44.0
2009 Q1 42.3 42.2 10.4 12.0 15.6 2.3 1.1 0.1 0.2 38.2 Q2 45.3 44.7 11.8 12.5 15.7 2.4 1.4 0.6 0.5 40.5 Q3 42.8 42.5 11.0 11.9 15.5 2.5 0.7 0.3 0.3 38.7 Q4 48.7 47.9 13.0 13.6 16.4 2.8 1.0 0.8 0.5 43.5
2010 Q1 42.1 41.9 10.1 12.2 15.5 2.3 0.9 0.2 0.3 38.1 Q2 45.1 44.7 11.9 12.8 15.4 2.5 1.3 0.4 0.3 40.4 Q3 42.9 42.6 10.9 12.4 15.2 2.5 0.7 0.3 0.3 38.8 Q4 48.5 47.8 13.2 13.4 16.4 2.9 1.0 0.7 0.3 43.3
2011 Q1 42.8 42.6 10.6 12.4 15.3 2.4 1.0 0.3 0.3 38.7 Q2 45.1 44.8 12.0 12.6 15.4 2.5 1.4 0.3 0.3 40.3 Q3 43.7 43.4 11.4 12.5 15.3 2.6 0.8 0.3 0.3 39.6 Q4 49.3 48.3 13.3 13.4 16.7 2.9 1.0 1.0 0.4 43.8
2012 Q1 43.0 42.8 10.9 12.4 15.3 2.4 0.9 0.2 0.2 38.9
2. Euro area _ quarterly expenditure and deficit/surplus
Total Current expenditure Capital expenditure Deficit (-)/ Primary
surplus (+) deficit (-)/Total Compensation Intermediate Interest Current Investment Capital surplus (+)
of consumption transfers Social Subsidies transfersemployees benefits
1 2 3 4 5 6 7 8 9 10 11 12 13
2006 Q1 45.8 42.3 10.1 4.3 3.0 25.0 21.4 1.1 3.4 2.2 1.3 -3.3 -0.3 Q2 45.7 42.3 10.4 4.7 3.1 24.1 21.1 1.1 3.4 2.5 1.0 -0.1 3.0 Q3 45.4 41.8 9.8 4.8 2.9 24.2 20.9 1.2 3.6 2.6 1.0 -1.8 1.2 Q4 49.6 44.7 10.8 6.1 2.7 25.0 21.3 1.3 4.9 2.7 2.2 -0.4 2.3
2007 Q1 44.8 41.3 9.9 4.3 2.9 24.1 20.7 1.1 3.5 2.3 1.2 -2.7 0.3 Q2 44.9 41.5 10.1 4.6 3.2 23.6 20.6 1.1 3.4 2.5 0.9 0.9 4.1 Q3 44.7 41.1 9.6 4.8 2.9 23.8 20.5 1.1 3.6 2.6 0.9 -1.1 1.8 Q4 49.3 44.8 10.8 6.1 2.8 25.0 21.2 1.5 4.5 2.8 1.7 0.0 2.8
2008 Q1 45.3 41.8 9.9 4.4 3.1 24.5 20.8 1.2 3.6 2.3 1.2 -3.1 0.0 Q2 45.9 42.3 10.3 4.8 3.3 23.9 20.8 1.1 3.6 2.6 1.0 -0.6 2.7 Q3 45.8 42.1 9.7 5.0 3.0 24.3 21.1 1.1 3.7 2.7 1.0 -2.4 0.6 Q4 51.4 46.8 11.2 6.5 2.8 26.3 22.2 1.4 4.6 2.9 1.7 -2.5 0.3
2009 Q1 49.4 45.5 10.7 4.9 2.9 27.0 22.9 1.3 3.8 2.6 1.2 -7.0 -4.1 Q2 50.6 46.4 11.1 5.4 3.0 26.9 23.4 1.3 4.2 2.8 1.3 -5.4 -2.3 Q3 50.1 46.1 10.5 5.6 2.9 27.1 23.5 1.3 4.0 2.8 1.1 -7.3 -4.4 Q4 54.6 49.7 11.8 6.9 2.6 28.4 24.0 1.5 4.9 3.0 1.9 -5.9 -3.3
2010 Q1 50.4 46.5 10.8 4.9 2.8 28.0 23.7 1.4 3.9 2.3 1.5 -8.2 -5.5 Q2 49.5 46.0 11.0 5.3 3.0 26.7 23.2 1.3 3.5 2.5 1.2 -4.4 -1.4 Q3 50.5 45.3 10.2 5.5 2.8 26.8 23.1 1.3 5.2 2.5 2.6 -7.6 -4.9 Q4 53.3 48.6 11.4 6.8 2.7 27.6 23.6 1.5 4.7 2.7 2.1 -4.8 -2.1
2011 Q1 48.4 45.4 10.5 4.7 3.0 27.2 23.2 1.3 3.1 2.1 0.9 -5.6 -2.7 Q2 48.4 45.2 10.6 5.1 3.2 26.3 22.9 1.2 3.2 2.3 0.9 -3.3 -0.1 Q3 48.2 44.8 10.0 5.3 3.0 26.4 22.9 1.2 3.4 2.3 1.1 -4.5 -1.5 Q4 52.4 48.6 11.3 6.7 3.0 27.6 23.6 1.4 3.8 2.5 1.5 -3.1 -0.1
2012 Q1 48.3 45.6 10.3 4.7 3.1 27.4 23.3 1.2 2.6 1.9 0.8 -5.3 -2.1
Sources: ECB calculations based on Eurostat and national data.1) Data refer to the Euro 17. The concepts "revenue", "expenditure" and "deficit/surplus" are based on the ESA 95. Transactions between the EU budget and entities outside
the government sector are not included. Otherwise, except for different data transmission deadlines, the quarterly data are consistent with the annual data.The data are not seasonally adjusted.
2) The fiscal burden comprises taxes and social contributions.
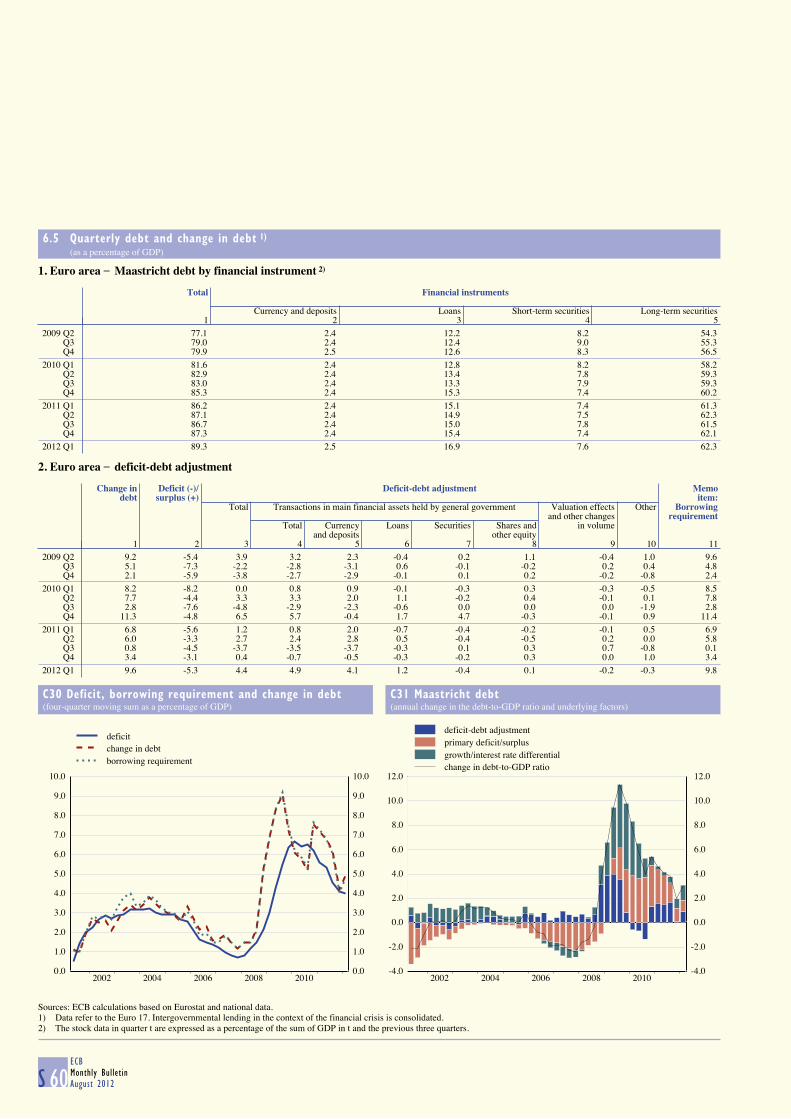
6.5 Quarterly debt and change in debt 1) (as a percentage of GDP)
S 60ECBMonthly BulletinAugust 2012
1. Euro area _ Maastricht debt by financial instrument 2)
Total Financial instruments
Currency and deposits Loans Short-term securities Long-term securities1 2 3 4 5
2009 Q2 77.1 2.4 12.2 8.2 54.3 Q3 79.0 2.4 12.4 9.0 55.3 Q4 79.9 2.5 12.6 8.3 56.5
2010 Q1 81.6 2.4 12.8 8.2 58.2 Q2 82.9 2.4 13.4 7.8 59.3 Q3 83.0 2.4 13.3 7.9 59.3 Q4 85.3 2.4 15.3 7.4 60.2
2011 Q1 86.2 2.4 15.1 7.4 61.3 Q2 87.1 2.4 14.9 7.5 62.3 Q3 86.7 2.4 15.0 7.8 61.5 Q4 87.3 2.4 15.4 7.4 62.1
2012 Q1 89.3 2.5 16.9 7.6 62.3
2. Euro area _ deficit-debt adjustment
Change in Deficit (-)/ Deficit-debt adjustment Memo
debt surplus (+) item:Total Transactions in main financial assets held by general government Valuation effects Other Borrowing
and other changes requirementTotal Currency Loans Securities Shares and in volume
and deposits other equity1 2 3 4 5 6 7 8 9 10 11
2009 Q2 9.2 -5.4 3.9 3.2 2.3 -0.4 0.2 1.1 -0.4 1.0 9.6 Q3 5.1 -7.3 -2.2 -2.8 -3.1 0.6 -0.1 -0.2 0.2 0.4 4.8 Q4 2.1 -5.9 -3.8 -2.7 -2.9 -0.1 0.1 0.2 -0.2 -0.8 2.4
2010 Q1 8.2 -8.2 0.0 0.8 0.9 -0.1 -0.3 0.3 -0.3 -0.5 8.5 Q2 7.7 -4.4 3.3 3.3 2.0 1.1 -0.2 0.4 -0.1 0.1 7.8 Q3 2.8 -7.6 -4.8 -2.9 -2.3 -0.6 0.0 0.0 0.0 -1.9 2.8 Q4 11.3 -4.8 6.5 5.7 -0.4 1.7 4.7 -0.3 -0.1 0.9 11.4
2011 Q1 6.8 -5.6 1.2 0.8 2.0 -0.7 -0.4 -0.2 -0.1 0.5 6.9 Q2 6.0 -3.3 2.7 2.4 2.8 0.5 -0.4 -0.5 0.2 0.0 5.8 Q3 0.8 -4.5 -3.7 -3.5 -3.7 -0.3 0.1 0.3 0.7 -0.8 0.1 Q4 3.4 -3.1 0.4 -0.7 -0.5 -0.3 -0.2 0.3 0.0 1.0 3.4
2012 Q1 9.6 -5.3 4.4 4.9 4.1 1.2 -0.4 0.1 -0.2 -0.3 9.8
C30 Deficit, borrowing requirement and change in debt
(four-quarter moving sum as a percentage of GDP)
C31 Maastricht debt
(annual change in the debt-to-GDP ratio and underlying factors)
0.0
1.0
2.0
3.0
4.0
5.0
6.0
7.0
8.0
9.0
10.0
2002 2004 2006 2008 20100.0
1.0
2.0
3.0
4.0
5.0
6.0
7.0
8.0
9.0
10.0
deficitchange in debtborrowing requirement
-4.0
-2.0
0.0
2.0
4.0
6.0
8.0
10.0
12.0
2002 2004 2006 2008 2010-4.0
-2.0
0.0
2.0
4.0
6.0
8.0
10.0
12.0
deficit-debt adjustmentprimary deficit/surplusgrowth/interest rate differentialchange in debt-to-GDP ratio
Sources: ECB calculations based on Eurostat and national data.1) Data refer to the Euro 17. Intergovernmental lending in the context of the financial crisis is consolidated.2) The stock data in quarter t are expressed as a percentage of the sum of GDP in t and the previous three quarters.
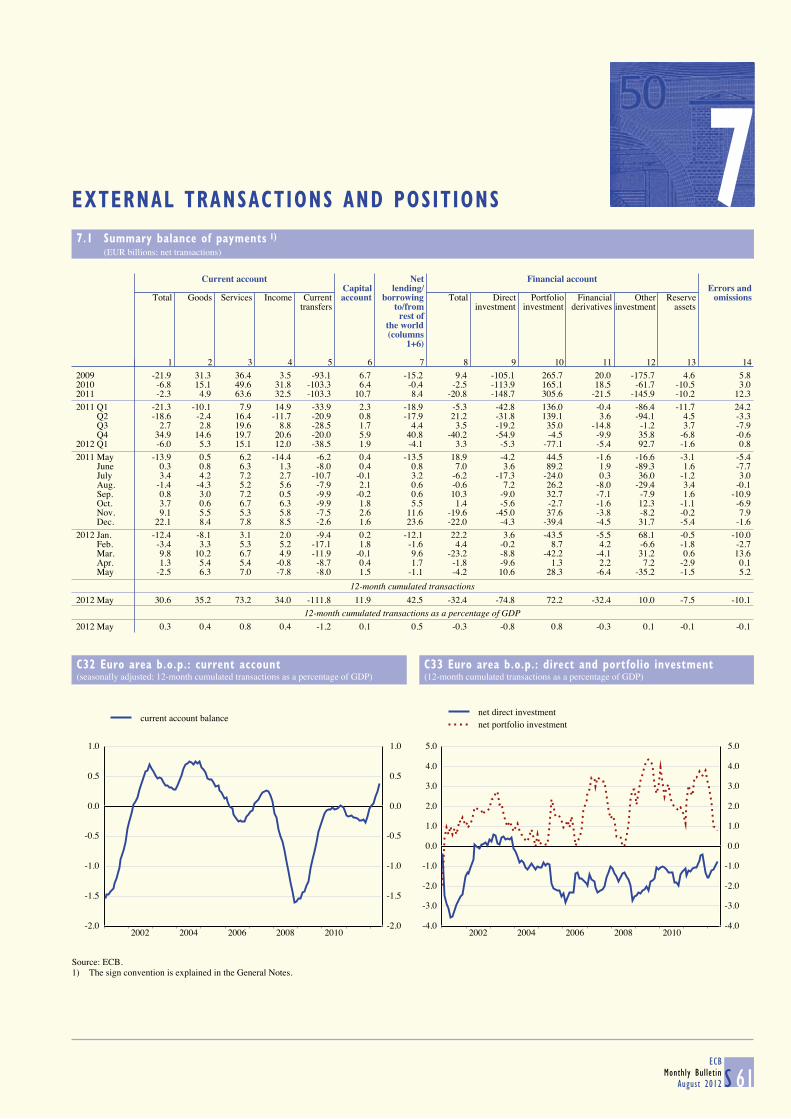
7EXTERNAL TRANSACTIONS AND POSITIONS
7.1 Summary balance of payments 1) (EUR billions; net transactions)
S 61ECB
Monthly BulletinAugust 2012
Current account Net Financial account
Capital lending/ Errors andTotal Goods Services Income Current account borrowing Total Direct Portfolio Financial Other Reserve omissions
transfers to/from investment investment derivatives investment assetsrest of
the world(columns
1+6)
1 2 3 4 5 6 7 8 9 10 11 12 13 14
2009 -21.9 31.3 36.4 3.5 -93.1 6.7 -15.2 9.4 -105.1 265.7 20.0 -175.7 4.6 5.82010 -6.8 15.1 49.6 31.8 -103.3 6.4 -0.4 -2.5 -113.9 165.1 18.5 -61.7 -10.5 3.02011 -2.3 4.9 63.6 32.5 -103.3 10.7 8.4 -20.8 -148.7 305.6 -21.5 -145.9 -10.2 12.3
2011 Q1 -21.3 -10.1 7.9 14.9 -33.9 2.3 -18.9 -5.3 -42.8 136.0 -0.4 -86.4 -11.7 24.2 Q2 -18.6 -2.4 16.4 -11.7 -20.9 0.8 -17.9 21.2 -31.8 139.1 3.6 -94.1 4.5 -3.3 Q3 2.7 2.8 19.6 8.8 -28.5 1.7 4.4 3.5 -19.2 35.0 -14.8 -1.2 3.7 -7.9 Q4 34.9 14.6 19.7 20.6 -20.0 5.9 40.8 -40.2 -54.9 -4.5 -9.9 35.8 -6.8 -0.62012 Q1 -6.0 5.3 15.1 12.0 -38.5 1.9 -4.1 3.3 -5.3 -77.1 -5.4 92.7 -1.6 0.8
2011 May -13.9 0.5 6.2 -14.4 -6.2 0.4 -13.5 18.9 -4.2 44.5 -1.6 -16.6 -3.1 -5.4 June 0.3 0.8 6.3 1.3 -8.0 0.4 0.8 7.0 3.6 89.2 1.9 -89.3 1.6 -7.7 July 3.4 4.2 7.2 2.7 -10.7 -0.1 3.2 -6.2 -17.3 -24.0 0.3 36.0 -1.2 3.0 Aug. -1.4 -4.3 5.2 5.6 -7.9 2.1 0.6 -0.6 7.2 26.2 -8.0 -29.4 3.4 -0.1 Sep. 0.8 3.0 7.2 0.5 -9.9 -0.2 0.6 10.3 -9.0 32.7 -7.1 -7.9 1.6 -10.9 Oct. 3.7 0.6 6.7 6.3 -9.9 1.8 5.5 1.4 -5.6 -2.7 -1.6 12.3 -1.1 -6.9 Nov. 9.1 5.5 5.3 5.8 -7.5 2.6 11.6 -19.6 -45.0 37.6 -3.8 -8.2 -0.2 7.9 Dec. 22.1 8.4 7.8 8.5 -2.6 1.6 23.6 -22.0 -4.3 -39.4 -4.5 31.7 -5.4 -1.6
2012 Jan. -12.4 -8.1 3.1 2.0 -9.4 0.2 -12.1 22.2 3.6 -43.5 -5.5 68.1 -0.5 -10.0 Feb. -3.4 3.3 5.3 5.2 -17.1 1.8 -1.6 4.4 -0.2 8.7 4.2 -6.6 -1.8 -2.7 Mar. 9.8 10.2 6.7 4.9 -11.9 -0.1 9.6 -23.2 -8.8 -42.2 -4.1 31.2 0.6 13.6 Apr. 1.3 5.4 5.4 -0.8 -8.7 0.4 1.7 -1.8 -9.6 1.3 2.2 7.2 -2.9 0.1 May -2.5 6.3 7.0 -7.8 -8.0 1.5 -1.1 -4.2 10.6 28.3 -6.4 -35.2 -1.5 5.2
12-month cumulated transactions
2012 May 30.6 35.2 73.2 34.0 -111.8 11.9 42.5 -32.4 -74.8 72.2 -32.4 10.0 -7.5 -10.1
12-month cumulated transactions as a percentage of GDP
2012 May 0.3 0.4 0.8 0.4 -1.2 0.1 0.5 -0.3 -0.8 0.8 -0.3 0.1 -0.1 -0.1
C32 Euro area b.o.p.: current account
(seasonally adjusted; 12-month cumulated transactions as a percentage of GDP)
C33 Euro area b.o.p.: direct and portfolio investment
(12-month cumulated transactions as a percentage of GDP)
-2.0
-1.5
-1.0
-0.5
0.0
0.5
1.0
2002 2004 2006 2008 2010-2.0
-1.5
-1.0
-0.5
0.0
0.5
1.0
current account balance
-4.0
-3.0
-2.0
-1.0
0.0
1.0
2.0
3.0
4.0
5.0
2002 2004 2006 2008 2010-4.0
-3.0
-2.0
-1.0
0.0
1.0
2.0
3.0
4.0
5.0
net direct investmentnet portfolio investment
Source: ECB.1) The sign convention is explained in the General Notes.
7
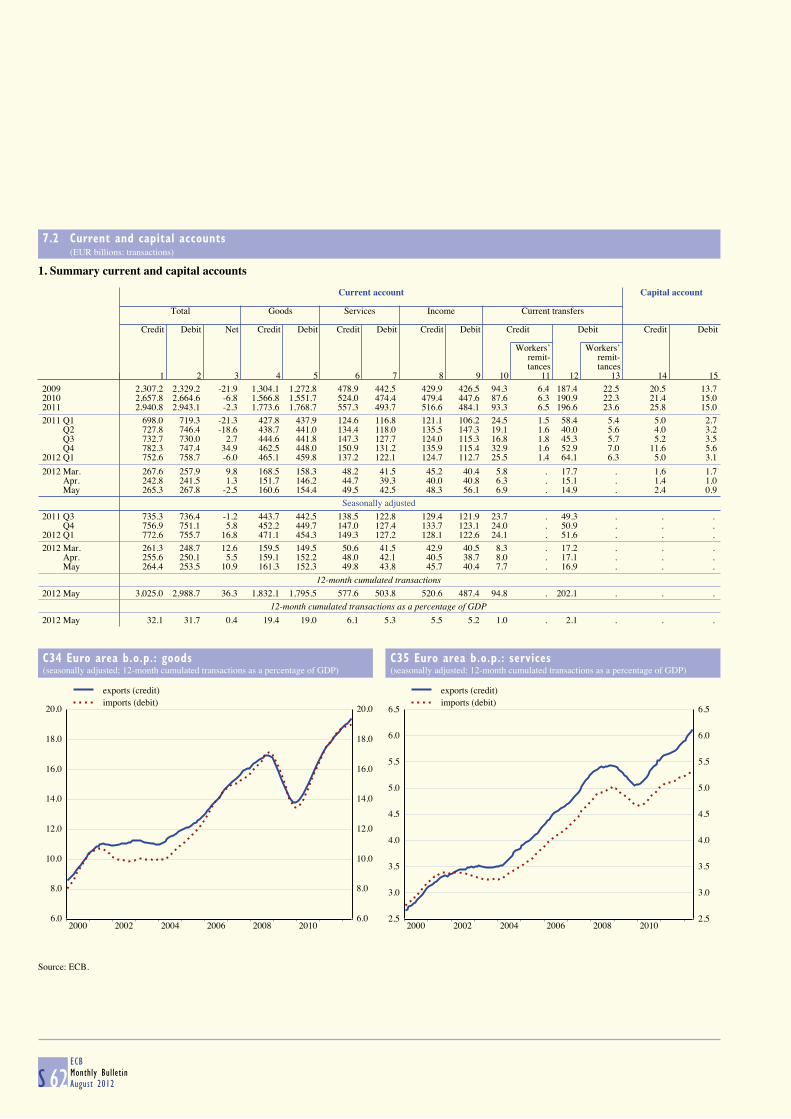
7.2 Current and capital accounts (EUR billions; transactions)
S 62ECBMonthly BulletinAugust 2012
1. Summary current and capital accounts
Current account Capital account
Total Goods Services Income Current transfers
Credit Debit Net Credit Debit Credit Debit Credit Debit Credit Debit Credit Debit
Workers’ Workers’remit- remit-tances tances
1 2 3 4 5 6 7 8 9 10 11 12 13 14 15
2009 2,307.2 2,329.2 -21.9 1,304.1 1,272.8 478.9 442.5 429.9 426.5 94.3 6.4 187.4 22.5 20.5 13.72010 2,657.8 2,664.6 -6.8 1,566.8 1,551.7 524.0 474.4 479.4 447.6 87.6 6.3 190.9 22.3 21.4 15.02011 2,940.8 2,943.1 -2.3 1,773.6 1,768.7 557.3 493.7 516.6 484.1 93.3 6.5 196.6 23.6 25.8 15.0
2011 Q1 698.0 719.3 -21.3 427.8 437.9 124.6 116.8 121.1 106.2 24.5 1.5 58.4 5.4 5.0 2.7 Q2 727.8 746.4 -18.6 438.7 441.0 134.4 118.0 135.5 147.3 19.1 1.6 40.0 5.6 4.0 3.2 Q3 732.7 730.0 2.7 444.6 441.8 147.3 127.7 124.0 115.3 16.8 1.8 45.3 5.7 5.2 3.5 Q4 782.3 747.4 34.9 462.5 448.0 150.9 131.2 135.9 115.4 32.9 1.6 52.9 7.0 11.6 5.62012 Q1 752.6 758.7 -6.0 465.1 459.8 137.2 122.1 124.7 112.7 25.5 1.4 64.1 6.3 5.0 3.1
2012 Mar. 267.6 257.9 9.8 168.5 158.3 48.2 41.5 45.2 40.4 5.8 . 17.7 . 1.6 1.7 Apr. 242.8 241.5 1.3 151.7 146.2 44.7 39.3 40.0 40.8 6.3 . 15.1 . 1.4 1.0 May 265.3 267.8 -2.5 160.6 154.4 49.5 42.5 48.3 56.1 6.9 . 14.9 . 2.4 0.9
Seasonally adjusted
2011 Q3 735.3 736.4 -1.2 443.7 442.5 138.5 122.8 129.4 121.9 23.7 . 49.3 . . . Q4 756.9 751.1 5.8 452.2 449.7 147.0 127.4 133.7 123.1 24.0 . 50.9 . . . 2012 Q1 772.6 755.7 16.8 471.1 454.3 149.3 127.2 128.1 122.6 24.1 . 51.6 . . .
2012 Mar. 261.3 248.7 12.6 159.5 149.5 50.6 41.5 42.9 40.5 8.3 . 17.2 . . . Apr. 255.6 250.1 5.5 159.1 152.2 48.0 42.1 40.5 38.7 8.0 . 17.1 . . . May 264.4 253.5 10.9 161.3 152.3 49.8 43.8 45.7 40.4 7.7 . 16.9 . . .
12-month cumulated transactions
2012 May 3,025.0 2,988.7 36.3 1,832.1 1,795.5 577.6 503.8 520.6 487.4 94.8 . 202.1 . . .
12-month cumulated transactions as a percentage of GDP
2012 May 32.1 31.7 0.4 19.4 19.0 6.1 5.3 5.5 5.2 1.0 . 2.1 . . .
C34 Euro area b.o.p.: goods
(seasonally adjusted; 12-month cumulated transactions as a percentage of GDP)
C35 Euro area b.o.p.: services
(seasonally adjusted; 12-month cumulated transactions as a percentage of GDP)
6.0
8.0
10.0
12.0
14.0
16.0
18.0
20.0
2000 2002 2004 2006 2008 20106.0
8.0
10.0
12.0
14.0
16.0
18.0
20.0
exports (credit)imports (debit)
2.5
3.0
3.5
4.0
4.5
5.0
5.5
6.0
6.5
2000 2002 2004 2006 2008 20102.5
3.0
3.5
4.0
4.5
5.0
5.5
6.0
6.5
exports (credit)imports (debit)
Source: ECB.
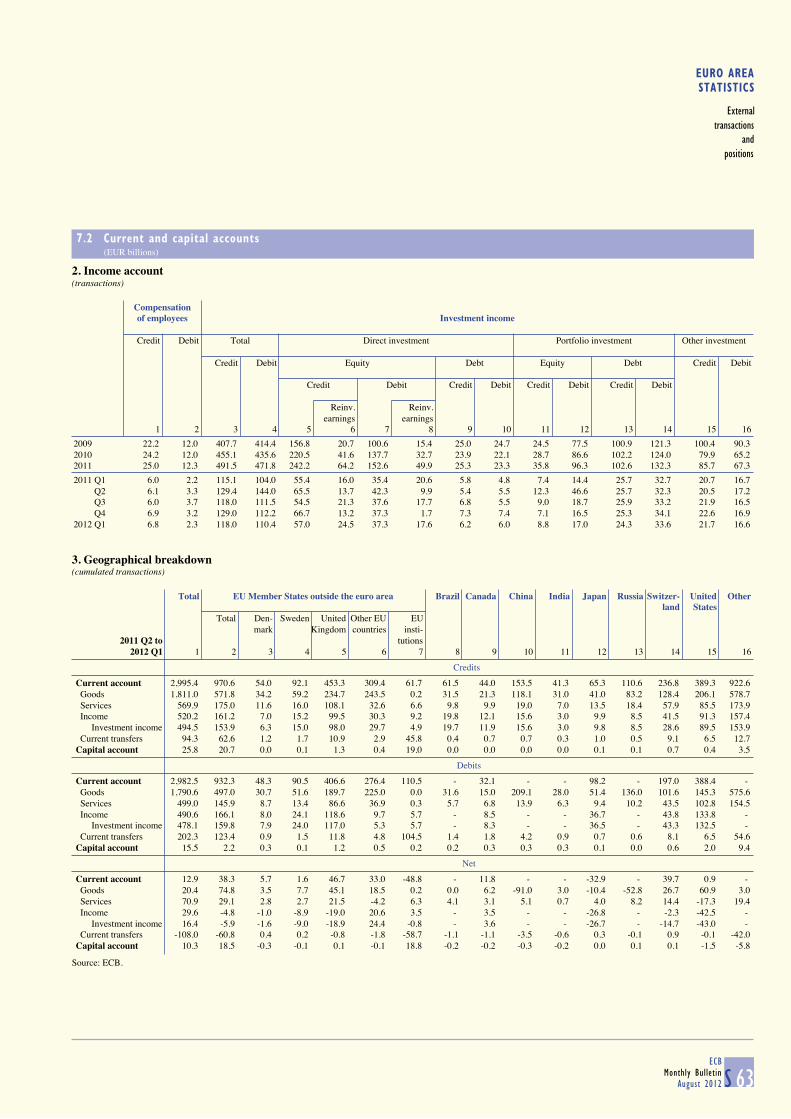
EURO AREASTATISTICS
Externaltransactions
andpositions
7.2 Current and capital accounts (EUR billions)
S 63ECB
Monthly BulletinAugust 2012
2. Income account(transactions)
Compensation of employees Investment income
Credit Debit Total Direct investment Portfolio investment Other investment
Credit Debit Equity Debt Equity Debt Credit Debit
Credit Debit Credit Debit Credit Debit Credit Debit
Reinv. Reinv.earnings earnings
1 2 3 4 5 6 7 8 9 10 11 12 13 14 15 16
2009 22.2 12.0 407.7 414.4 156.8 20.7 100.6 15.4 25.0 24.7 24.5 77.5 100.9 121.3 100.4 90.3 2010 24.2 12.0 455.1 435.6 220.5 41.6 137.7 32.7 23.9 22.1 28.7 86.6 102.2 124.0 79.9 65.2 2011 25.0 12.3 491.5 471.8 242.2 64.2 152.6 49.9 25.3 23.3 35.8 96.3 102.6 132.3 85.7 67.3
2011 Q1 6.0 2.2 115.1 104.0 55.4 16.0 35.4 20.6 5.8 4.8 7.4 14.4 25.7 32.7 20.7 16.7 Q2 6.1 3.3 129.4 144.0 65.5 13.7 42.3 9.9 5.4 5.5 12.3 46.6 25.7 32.3 20.5 17.2 Q3 6.0 3.7 118.0 111.5 54.5 21.3 37.6 17.7 6.8 5.5 9.0 18.7 25.9 33.2 21.9 16.5 Q4 6.9 3.2 129.0 112.2 66.7 13.2 37.3 1.7 7.3 7.4 7.1 16.5 25.3 34.1 22.6 16.9 2012 Q1 6.8 2.3 118.0 110.4 57.0 24.5 37.3 17.6 6.2 6.0 8.8 17.0 24.3 33.6 21.7 16.6
3. Geographical breakdown(cumulated transactions)
Total EU Member States outside the euro area Brazil Canada China India Japan Russia Switzer- United Other
land StatesTotal Den- Sweden United Other EU EU
mark Kingdom countries insti-2011 Q2 to tutions
2012 Q1 1 2 3 4 5 6 7 8 9 10 11 12 13 14 15 16
Credits
Current account 2,995.4 970.6 54.0 92.1 453.3 309.4 61.7 61.5 44.0 153.5 41.3 65.3 110.6 236.8 389.3 922.6 Goods 1,811.0 571.8 34.2 59.2 234.7 243.5 0.2 31.5 21.3 118.1 31.0 41.0 83.2 128.4 206.1 578.7 Services 569.9 175.0 11.6 16.0 108.1 32.6 6.6 9.8 9.9 19.0 7.0 13.5 18.4 57.9 85.5 173.9 Income 520.2 161.2 7.0 15.2 99.5 30.3 9.2 19.8 12.1 15.6 3.0 9.9 8.5 41.5 91.3 157.4 Investment income 494.5 153.9 6.3 15.0 98.0 29.7 4.9 19.7 11.9 15.6 3.0 9.8 8.5 28.6 89.5 153.9 Current transfers 94.3 62.6 1.2 1.7 10.9 2.9 45.8 0.4 0.7 0.7 0.3 1.0 0.5 9.1 6.5 12.7 Capital account 25.8 20.7 0.0 0.1 1.3 0.4 19.0 0.0 0.0 0.0 0.0 0.1 0.1 0.7 0.4 3.5
Debits
Current account 2,982.5 932.3 48.3 90.5 406.6 276.4 110.5 - 32.1 - - 98.2 - 197.0 388.4 - Goods 1,790.6 497.0 30.7 51.6 189.7 225.0 0.0 31.6 15.0 209.1 28.0 51.4 136.0 101.6 145.3 575.6 Services 499.0 145.9 8.7 13.4 86.6 36.9 0.3 5.7 6.8 13.9 6.3 9.4 10.2 43.5 102.8 154.5 Income 490.6 166.1 8.0 24.1 118.6 9.7 5.7 - 8.5 - - 36.7 - 43.8 133.8 - Investment income 478.1 159.8 7.9 24.0 117.0 5.3 5.7 - 8.3 - - 36.5 - 43.3 132.5 - Current transfers 202.3 123.4 0.9 1.5 11.8 4.8 104.5 1.4 1.8 4.2 0.9 0.7 0.6 8.1 6.5 54.6 Capital account 15.5 2.2 0.3 0.1 1.2 0.5 0.2 0.2 0.3 0.3 0.3 0.1 0.0 0.6 2.0 9.4
Net
Current account 12.9 38.3 5.7 1.6 46.7 33.0 -48.8 - 11.8 - - -32.9 - 39.7 0.9 - Goods 20.4 74.8 3.5 7.7 45.1 18.5 0.2 0.0 6.2 -91.0 3.0 -10.4 -52.8 26.7 60.9 3.0 Services 70.9 29.1 2.8 2.7 21.5 -4.2 6.3 4.1 3.1 5.1 0.7 4.0 8.2 14.4 -17.3 19.4 Income 29.6 -4.8 -1.0 -8.9 -19.0 20.6 3.5 - 3.5 - - -26.8 - -2.3 -42.5 - Investment income 16.4 -5.9 -1.6 -9.0 -18.9 24.4 -0.8 - 3.6 - - -26.7 - -14.7 -43.0 - Current transfers -108.0 -60.8 0.4 0.2 -0.8 -1.8 -58.7 -1.1 -1.1 -3.5 -0.6 0.3 -0.1 0.9 -0.1 -42.0 Capital account 10.3 18.5 -0.3 -0.1 0.1 -0.1 18.8 -0.2 -0.2 -0.3 -0.2 0.0 0.1 0.1 -1.5 -5.8
Source: ECB.
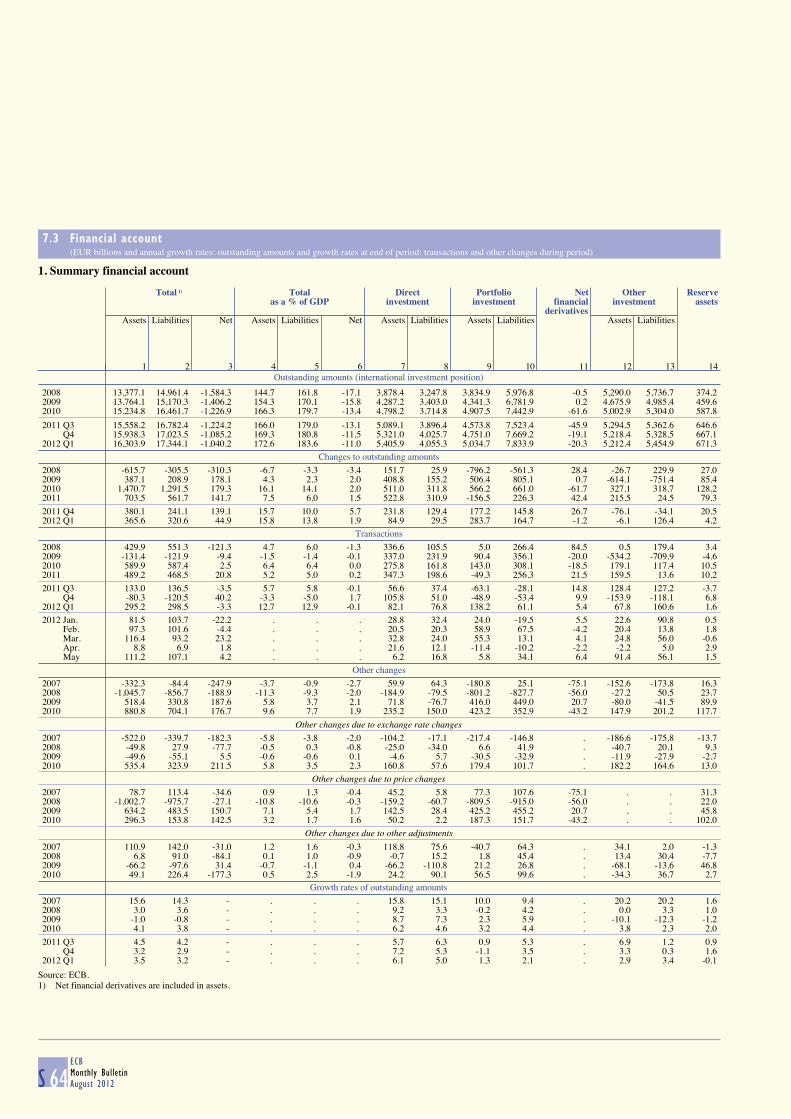
7.3 Financial account (EUR billions and annual growth rates; outstanding amounts and growth rates at end of period; transactions and other changes during period)
S 64ECBMonthly BulletinAugust 2012
1. Summary financial account
Outstanding amounts (international investment position)
Total 1) Total Direct Portfolio Net Other Reserve
as a % of GDP investment investment financial investment assetsderivatives
Assets Liabilities Net Assets Liabilities Net Assets Liabilities Assets Liabilities Assets Liabilities
1 2 3 4 5 6 7 8 9 10 11 12 13 14
2008 13,377.1 14,961.4 -1,584.3 144.7 161.8 -17.1 3,878.4 3,247.8 3,834.9 5,976.8 -0.5 5,290.0 5,736.7 374.22009 13,764.1 15,170.3 -1,406.2 154.3 170.1 -15.8 4,287.2 3,403.0 4,341.3 6,781.9 0.2 4,675.9 4,985.4 459.62010 15,234.8 16,461.7 -1,226.9 166.3 179.7 -13.4 4,798.2 3,714.8 4,907.5 7,442.9 -61.6 5,002.9 5,304.0 587.8
2011 Q3 15,558.2 16,782.4 -1,224.2 166.0 179.0 -13.1 5,089.1 3,896.4 4,573.8 7,523.4 -45.9 5,294.5 5,362.6 646.6 Q4 15,938.3 17,023.5 -1,085.2 169.3 180.8 -11.5 5,321.0 4,025.7 4,751.0 7,669.2 -19.1 5,218.4 5,328.5 667.12012 Q1 16,303.9 17,344.1 -1,040.2 172.6 183.6 -11.0 5,405.9 4,055.3 5,034.7 7,833.9 -20.3 5,212.4 5,454.9 671.3
Changes to outstanding amounts
2008 -615.7 -305.5 -310.3 -6.7 -3.3 -3.4 151.7 25.9 -796.2 -561.3 28.4 -26.7 229.9 27.02009 387.1 208.9 178.1 4.3 2.3 2.0 408.8 155.2 506.4 805.1 0.7 -614.1 -751.4 85.42010 1,470.7 1,291.5 179.3 16.1 14.1 2.0 511.0 311.8 566.2 661.0 -61.7 327.1 318.7 128.22011 703.5 561.7 141.7 7.5 6.0 1.5 522.8 310.9 -156.5 226.3 42.4 215.5 24.5 79.3
2011 Q4 380.1 241.1 139.1 15.7 10.0 5.7 231.8 129.4 177.2 145.8 26.7 -76.1 -34.1 20.52012 Q1 365.6 320.6 44.9 15.8 13.8 1.9 84.9 29.5 283.7 164.7 -1.2 -6.1 126.4 4.2
Transactions
2008 429.9 551.3 -121.3 4.7 6.0 -1.3 336.6 105.5 5.0 266.4 84.5 0.5 179.4 3.42009 -131.4 -121.9 -9.4 -1.5 -1.4 -0.1 337.0 231.9 90.4 356.1 -20.0 -534.2 -709.9 -4.62010 589.9 587.4 2.5 6.4 6.4 0.0 275.8 161.8 143.0 308.1 -18.5 179.1 117.4 10.52011 489.2 468.5 20.8 5.2 5.0 0.2 347.3 198.6 -49.3 256.3 21.5 159.5 13.6 10.2
2011 Q3 133.0 136.5 -3.5 5.7 5.8 -0.1 56.6 37.4 -63.1 -28.1 14.8 128.4 127.2 -3.7 Q4 -80.3 -120.5 40.2 -3.3 -5.0 1.7 105.8 51.0 -48.9 -53.4 9.9 -153.9 -118.1 6.82012 Q1 295.2 298.5 -3.3 12.7 12.9 -0.1 82.1 76.8 138.2 61.1 5.4 67.8 160.6 1.6
2012 Jan. 81.5 103.7 -22.2 . . . 28.8 32.4 24.0 -19.5 5.5 22.6 90.8 0.5 Feb. 97.3 101.6 -4.4 . . . 20.5 20.3 58.9 67.5 -4.2 20.4 13.8 1.8 Mar. 116.4 93.2 23.2 . . . 32.8 24.0 55.3 13.1 4.1 24.8 56.0 -0.6 Apr. 8.8 6.9 1.8 . . . 21.6 12.1 -11.4 -10.2 -2.2 -2.2 5.0 2.9 May 111.2 107.1 4.2 . . . 6.2 16.8 5.8 34.1 6.4 91.4 56.1 1.5
Other changes
2007 -332.3 -84.4 -247.9 -3.7 -0.9 -2.7 59.9 64.3 -180.8 25.1 -75.1 -152.6 -173.8 16.32008 -1,045.7 -856.7 -188.9 -11.3 -9.3 -2.0 -184.9 -79.5 -801.2 -827.7 -56.0 -27.2 50.5 23.72009 518.4 330.8 187.6 5.8 3.7 2.1 71.8 -76.7 416.0 449.0 20.7 -80.0 -41.5 89.92010 880.8 704.1 176.7 9.6 7.7 1.9 235.2 150.0 423.2 352.9 -43.2 147.9 201.2 117.7
Other changes due to exchange rate changes
2007 -522.0 -339.7 -182.3 -5.8 -3.8 -2.0 -104.2 -17.1 -217.4 -146.8 . -186.6 -175.8 -13.72008 -49.8 27.9 -77.7 -0.5 0.3 -0.8 -25.0 -34.0 6.6 41.9 . -40.7 20.1 9.32009 -49.6 -55.1 5.5 -0.6 -0.6 0.1 -4.6 5.7 -30.5 -32.9 . -11.9 -27.9 -2.72010 535.4 323.9 211.5 5.8 3.5 2.3 160.8 57.6 179.4 101.7 . 182.2 164.6 13.0
Other changes due to price changes
2007 78.7 113.4 -34.6 0.9 1.3 -0.4 45.2 5.8 77.3 107.6 -75.1 . . 31.32008 -1,002.7 -975.7 -27.1 -10.8 -10.6 -0.3 -159.2 -60.7 -809.5 -915.0 -56.0 . . 22.02009 634.2 483.5 150.7 7.1 5.4 1.7 142.5 28.4 425.2 455.2 20.7 . . 45.82010 296.3 153.8 142.5 3.2 1.7 1.6 50.2 2.2 187.3 151.7 -43.2 . . 102.0
Other changes due to other adjustments
2007 110.9 142.0 -31.0 1.2 1.6 -0.3 118.8 75.6 -40.7 64.3 . 34.1 2.0 -1.32008 6.8 91.0 -84.1 0.1 1.0 -0.9 -0.7 15.2 1.8 45.4 . 13.4 30.4 -7.72009 -66.2 -97.6 31.4 -0.7 -1.1 0.4 -66.2 -110.8 21.2 26.8 . -68.1 -13.6 46.82010 49.1 226.4 -177.3 0.5 2.5 -1.9 24.2 90.1 56.5 99.6 . -34.3 36.7 2.7
Growth rates of outstanding amounts
2007 15.6 14.3 - . . . 15.8 15.1 10.0 9.4 . 20.2 20.2 1.62008 3.0 3.6 - . . . 9.2 3.3 -0.2 4.2 . 0.0 3.3 1.02009 -1.0 -0.8 - . . . 8.7 7.3 2.3 5.9 . -10.1 -12.3 -1.22010 4.1 3.8 - . . . 6.2 4.6 3.2 4.4 . 3.8 2.3 2.0
2011 Q3 4.5 4.2 - . . . 5.7 6.3 0.9 5.3 . 6.9 1.2 0.9 Q4 3.2 2.9 - . . . 7.2 5.3 -1.1 3.5 . 3.3 0.3 1.62012 Q1 3.5 3.2 - . . . 6.1 5.0 1.3 2.1 . 2.9 3.4 -0.1
Source: ECB.1) Net financial derivatives are included in assets.
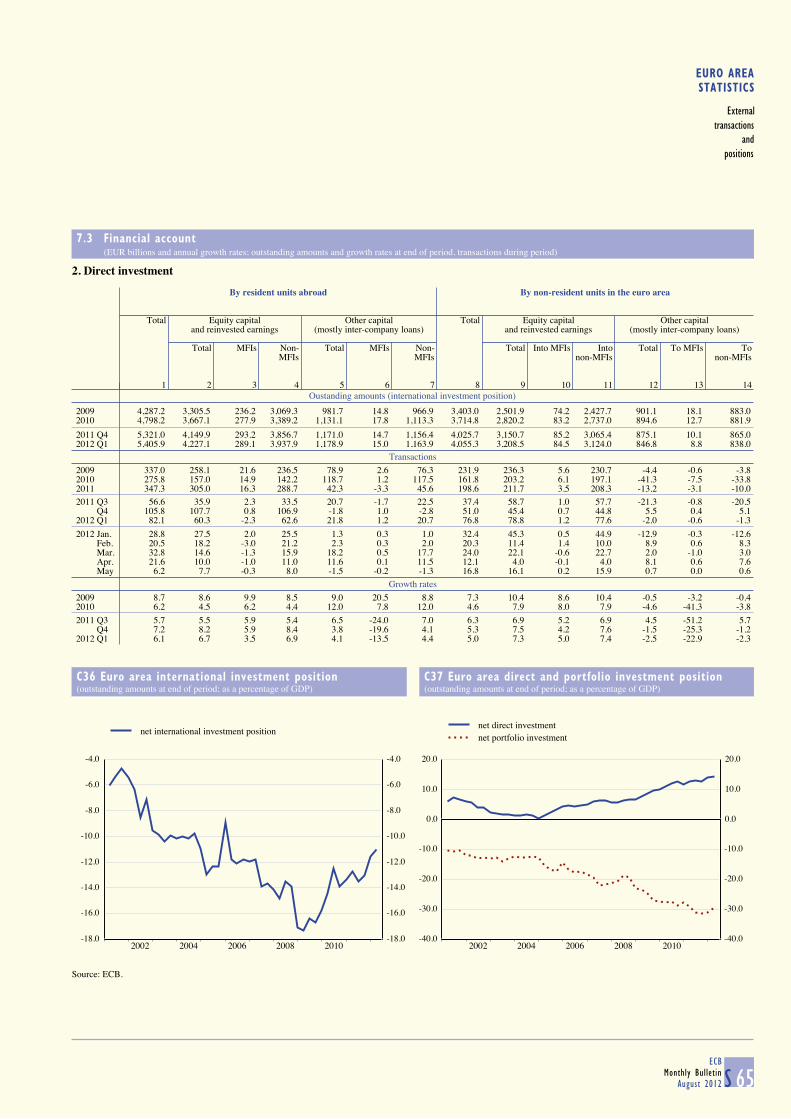
EURO AREASTATISTICS
Externaltransactions
andpositions
7.3 Financial account (EUR billions and annual growth rates; outstanding amounts and growth rates at end of period, transactions during period)
S 65ECB
Monthly BulletinAugust 2012
2. Direct investment
Oustanding amounts (international investment position)
By resident units abroad By non-resident units in the euro area
Total Equity capital Other capital Total Equity capital Other capital and reinvested earnings (mostly inter-company loans) and reinvested earnings (mostly inter-company loans)
Total MFIs Non- Total MFIs Non- Total Into MFIs Into Total To MFIs ToMFIs MFIs non-MFIs non-MFIs
1 2 3 4 5 6 7 8 9 10 11 12 13 14
2009 4,287.2 3,305.5 236.2 3,069.3 981.7 14.8 966.9 3,403.0 2,501.9 74.2 2,427.7 901.1 18.1 883.02010 4,798.2 3,667.1 277.9 3,389.2 1,131.1 17.8 1,113.3 3,714.8 2,820.2 83.2 2,737.0 894.6 12.7 881.9
2011 Q4 5,321.0 4,149.9 293.2 3,856.7 1,171.0 14.7 1,156.4 4,025.7 3,150.7 85.2 3,065.4 875.1 10.1 865.02012 Q1 5,405.9 4,227.1 289.1 3,937.9 1,178.9 15.0 1,163.9 4,055.3 3,208.5 84.5 3,124.0 846.8 8.8 838.0
Transactions
2009 337.0 258.1 21.6 236.5 78.9 2.6 76.3 231.9 236.3 5.6 230.7 -4.4 -0.6 -3.82010 275.8 157.0 14.9 142.2 118.7 1.2 117.5 161.8 203.2 6.1 197.1 -41.3 -7.5 -33.82011 347.3 305.0 16.3 288.7 42.3 -3.3 45.6 198.6 211.7 3.5 208.3 -13.2 -3.1 -10.0
2011 Q3 56.6 35.9 2.3 33.5 20.7 -1.7 22.5 37.4 58.7 1.0 57.7 -21.3 -0.8 -20.5 Q4 105.8 107.7 0.8 106.9 -1.8 1.0 -2.8 51.0 45.4 0.7 44.8 5.5 0.4 5.12012 Q1 82.1 60.3 -2.3 62.6 21.8 1.2 20.7 76.8 78.8 1.2 77.6 -2.0 -0.6 -1.3
2012 Jan. 28.8 27.5 2.0 25.5 1.3 0.3 1.0 32.4 45.3 0.5 44.9 -12.9 -0.3 -12.6 Feb. 20.5 18.2 -3.0 21.2 2.3 0.3 2.0 20.3 11.4 1.4 10.0 8.9 0.6 8.3 Mar. 32.8 14.6 -1.3 15.9 18.2 0.5 17.7 24.0 22.1 -0.6 22.7 2.0 -1.0 3.0 Apr. 21.6 10.0 -1.0 11.0 11.6 0.1 11.5 12.1 4.0 -0.1 4.0 8.1 0.6 7.6 May 6.2 7.7 -0.3 8.0 -1.5 -0.2 -1.3 16.8 16.1 0.2 15.9 0.7 0.0 0.6
Growth rates
2009 8.7 8.6 9.9 8.5 9.0 20.5 8.8 7.3 10.4 8.6 10.4 -0.5 -3.2 -0.42010 6.2 4.5 6.2 4.4 12.0 7.8 12.0 4.6 7.9 8.0 7.9 -4.6 -41.3 -3.8
2011 Q3 5.7 5.5 5.9 5.4 6.5 -24.0 7.0 6.3 6.9 5.2 6.9 4.5 -51.2 5.7 Q4 7.2 8.2 5.9 8.4 3.8 -19.6 4.1 5.3 7.5 4.2 7.6 -1.5 -25.3 -1.22012 Q1 6.1 6.7 3.5 6.9 4.1 -13.5 4.4 5.0 7.3 5.0 7.4 -2.5 -22.9 -2.3
C36 Euro area international investment position
(outstanding amounts at end of period; as a percentage of GDP)
C37 Euro area direct and portfolio investment position
(outstanding amounts at end of period; as a percentage of GDP)
-18.0
-16.0
-14.0
-12.0
-10.0
-8.0
-6.0
-4.0
2002 2004 2006 2008 2010-18.0
-16.0
-14.0
-12.0
-10.0
-8.0
-6.0
-4.0
net international investment position
-40.0
-30.0
-20.0
-10.0
0.0
10.0
20.0
2002 2004 2006 2008 2010-40.0
-30.0
-20.0
-10.0
0.0
10.0
20.0
net direct investmentnet portfolio investment
Source: ECB.
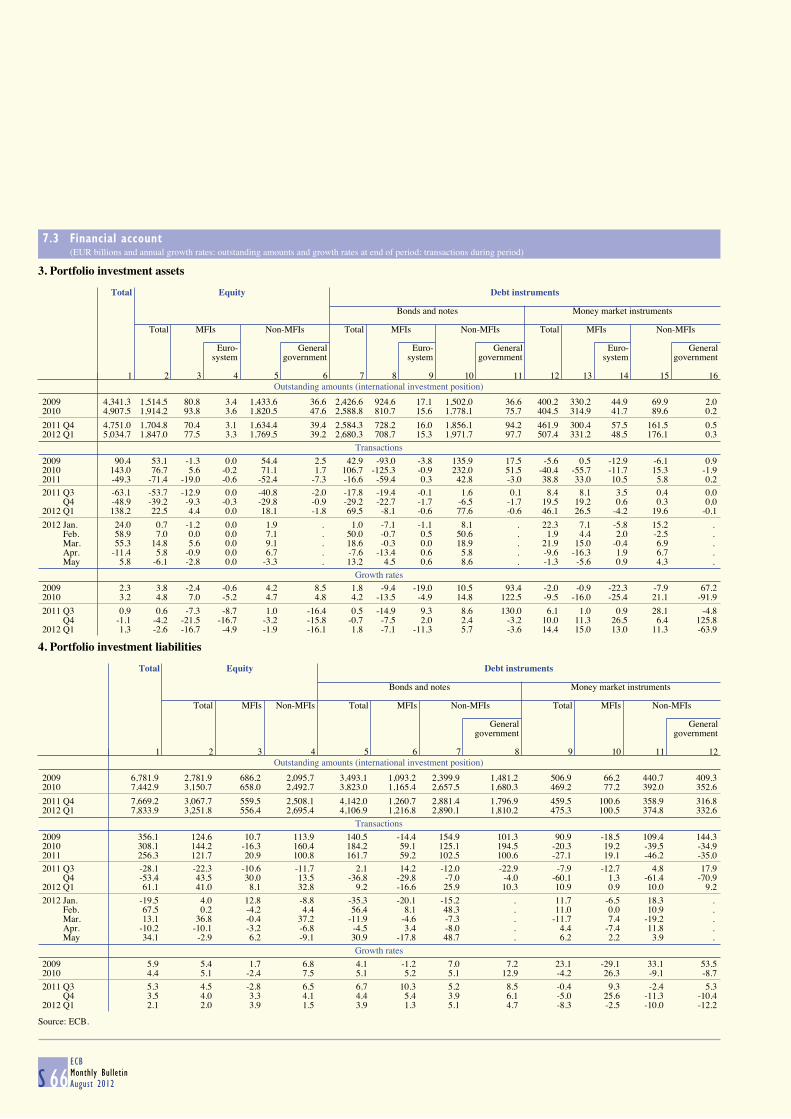
7.3 Financial account (EUR billions and annual growth rates; outstanding amounts and growth rates at end of period; transactions during period)
S 66ECBMonthly BulletinAugust 2012
3. Portfolio investment assets
Outstanding amounts (international investment position)
Total Equity Debt instruments
Bonds and notes Money market instruments
Total MFIs Non-MFIs Total MFIs Non-MFIs Total MFIs Non-MFIs
Euro- General Euro- General Euro- Generalsystem government system government system government
1 2 3 4 5 6 7 8 9 10 11 12 13 14 15 16
2009 4,341.3 1,514.5 80.8 3.4 1,433.6 36.6 2,426.6 924.6 17.1 1,502.0 36.6 400.2 330.2 44.9 69.9 2.02010 4,907.5 1,914.2 93.8 3.6 1,820.5 47.6 2,588.8 810.7 15.6 1,778.1 75.7 404.5 314.9 41.7 89.6 0.2
2011 Q4 4,751.0 1,704.8 70.4 3.1 1,634.4 39.4 2,584.3 728.2 16.0 1,856.1 94.2 461.9 300.4 57.5 161.5 0.52012 Q1 5,034.7 1,847.0 77.5 3.3 1,769.5 39.2 2,680.3 708.7 15.3 1,971.7 97.7 507.4 331.2 48.5 176.1 0.3
Transactions
2009 90.4 53.1 -1.3 0.0 54.4 2.5 42.9 -93.0 -3.8 135.9 17.5 -5.6 0.5 -12.9 -6.1 0.92010 143.0 76.7 5.6 -0.2 71.1 1.7 106.7 -125.3 -0.9 232.0 51.5 -40.4 -55.7 -11.7 15.3 -1.92011 -49.3 -71.4 -19.0 -0.6 -52.4 -7.3 -16.6 -59.4 0.3 42.8 -3.0 38.8 33.0 10.5 5.8 0.2
2011 Q3 -63.1 -53.7 -12.9 0.0 -40.8 -2.0 -17.8 -19.4 -0.1 1.6 0.1 8.4 8.1 3.5 0.4 0.0 Q4 -48.9 -39.2 -9.3 -0.3 -29.8 -0.9 -29.2 -22.7 -1.7 -6.5 -1.7 19.5 19.2 0.6 0.3 0.02012 Q1 138.2 22.5 4.4 0.0 18.1 -1.8 69.5 -8.1 -0.6 77.6 -0.6 46.1 26.5 -4.2 19.6 -0.1
2012 Jan. 24.0 0.7 -1.2 0.0 1.9 . 1.0 -7.1 -1.1 8.1 . 22.3 7.1 -5.8 15.2 . Feb. 58.9 7.0 0.0 0.0 7.1 . 50.0 -0.7 0.5 50.6 . 1.9 4.4 2.0 -2.5 . Mar. 55.3 14.8 5.6 0.0 9.1 . 18.6 -0.3 0.0 18.9 . 21.9 15.0 -0.4 6.9 . Apr. -11.4 5.8 -0.9 0.0 6.7 . -7.6 -13.4 0.6 5.8 . -9.6 -16.3 1.9 6.7 . May 5.8 -6.1 -2.8 0.0 -3.3 . 13.2 4.5 0.6 8.6 . -1.3 -5.6 0.9 4.3 .
Growth rates
2009 2.3 3.8 -2.4 -0.6 4.2 8.5 1.8 -9.4 -19.0 10.5 93.4 -2.0 -0.9 -22.3 -7.9 67.22010 3.2 4.8 7.0 -5.2 4.7 4.8 4.2 -13.5 -4.9 14.8 122.5 -9.5 -16.0 -25.4 21.1 -91.9
2011 Q3 0.9 0.6 -7.3 -8.7 1.0 -16.4 0.5 -14.9 9.3 8.6 130.0 6.1 1.0 0.9 28.1 -4.8 Q4 -1.1 -4.2 -21.5 -16.7 -3.2 -15.8 -0.7 -7.5 2.0 2.4 -3.2 10.0 11.3 26.5 6.4 125.82012 Q1 1.3 -2.6 -16.7 -4.9 -1.9 -16.1 1.8 -7.1 -11.3 5.7 -3.6 14.4 15.0 13.0 11.3 -63.9
4. Portfolio investment liabilities
Outstanding amounts (international investment position)
Total Equity Debt instruments
Bonds and notes Money market instruments
Total MFIs Non-MFIs Total MFIs Non-MFIs Total MFIs Non-MFIs
General Generalgovernment government
1 2 3 4 5 6 7 8 9 10 11 12
2009 6,781.9 2,781.9 686.2 2,095.7 3,493.1 1,093.2 2,399.9 1,481.2 506.9 66.2 440.7 409.32010 7,442.9 3,150.7 658.0 2,492.7 3,823.0 1,165.4 2,657.5 1,680.3 469.2 77.2 392.0 352.6
2011 Q4 7,669.2 3,067.7 559.5 2,508.1 4,142.0 1,260.7 2,881.4 1,796.9 459.5 100.6 358.9 316.82012 Q1 7,833.9 3,251.8 556.4 2,695.4 4,106.9 1,216.8 2,890.1 1,810.2 475.3 100.5 374.8 332.6
Transactions
2009 356.1 124.6 10.7 113.9 140.5 -14.4 154.9 101.3 90.9 -18.5 109.4 144.32010 308.1 144.2 -16.3 160.4 184.2 59.1 125.1 194.5 -20.3 19.2 -39.5 -34.92011 256.3 121.7 20.9 100.8 161.7 59.2 102.5 100.6 -27.1 19.1 -46.2 -35.0
2011 Q3 -28.1 -22.3 -10.6 -11.7 2.1 14.2 -12.0 -22.9 -7.9 -12.7 4.8 17.9 Q4 -53.4 43.5 30.0 13.5 -36.8 -29.8 -7.0 -4.0 -60.1 1.3 -61.4 -70.92012 Q1 61.1 41.0 8.1 32.8 9.2 -16.6 25.9 10.3 10.9 0.9 10.0 9.2
2012 Jan. -19.5 4.0 12.8 -8.8 -35.3 -20.1 -15.2 . 11.7 -6.5 18.3 . Feb. 67.5 0.2 -4.2 4.4 56.4 8.1 48.3 . 11.0 0.0 10.9 . Mar. 13.1 36.8 -0.4 37.2 -11.9 -4.6 -7.3 . -11.7 7.4 -19.2 . Apr. -10.2 -10.1 -3.2 -6.8 -4.5 3.4 -8.0 . 4.4 -7.4 11.8 . May 34.1 -2.9 6.2 -9.1 30.9 -17.8 48.7 . 6.2 2.2 3.9 .
Growth rates
2009 5.9 5.4 1.7 6.8 4.1 -1.2 7.0 7.2 23.1 -29.1 33.1 53.52010 4.4 5.1 -2.4 7.5 5.1 5.2 5.1 12.9 -4.2 26.3 -9.1 -8.7
2011 Q3 5.3 4.5 -2.8 6.5 6.7 10.3 5.2 8.5 -0.4 9.3 -2.4 5.3 Q4 3.5 4.0 3.3 4.1 4.4 5.4 3.9 6.1 -5.0 25.6 -11.3 -10.42012 Q1 2.1 2.0 3.9 1.5 3.9 1.3 5.1 4.7 -8.3 -2.5 -10.0 -12.2
Source: ECB.

EURO AREASTATISTICS
Externaltransactions
andpositions
7.3 Financial account (EUR billions and annual growth rates; outstanding amounts and growth rates at end of period; transactions during period)
S 67ECB
Monthly BulletinAugust 2012
5. Other investment assets
Outstanding amounts (international investment position)
Total Eurosystem MFIs General Other sectors
(excluding Eurosystem) government
Total Loans/ Other Total Loans/ Other Trade Loans/currency Trade Loans/currencycurrency assets currency assets credits and deposits credits and deposits
and anddeposits deposits Currency Currency
and anddeposits deposits
1 2 3 4 5 6 7 8 9 10 11 12 13 14 15
2009 4,675.9 30.2 29.8 0.4 2,834.7 2,804.2 30.5 122.1 8.4 74.9 15.9 1,688.9 201.4 1,344.7 402.62010 5,002.9 32.6 32.0 0.7 2,972.3 2,939.9 32.4 166.3 7.6 117.6 21.0 1,831.8 214.4 1,468.5 428.6
2011 Q4 5,218.4 35.5 35.2 0.3 3,067.1 3,008.8 58.4 162.8 6.7 116.5 30.2 1,953.0 227.8 1,573.1 489.72012 Q1 5,212.4 36.7 36.4 0.3 3,046.9 2,994.4 52.5 150.0 7.3 103.6 24.5 1,978.8 236.3 1,572.9 503.4
Transactions
2009 -534.2 0.1 0.0 0.1 -420.4 -399.9 -20.5 11.8 -0.4 10.4 0.2 -125.6 7.5 -129.0 -34.82010 179.1 -2.9 -2.9 0.0 8.6 -0.2 8.8 41.7 -0.3 41.3 4.9 131.7 7.6 101.7 46.72011 159.5 -2.6 -2.7 0.1 52.2 22.8 29.4 1.1 -0.2 0.8 9.8 108.8 8.0 78.8 45.6
2011 Q3 128.4 -2.7 -2.7 0.1 82.7 68.3 14.4 -6.0 -0.1 -6.0 -1.5 54.4 2.4 39.2 19.0 Q4 -153.9 -8.2 -8.2 0.0 -155.0 -155.3 0.3 16.6 0.0 16.9 13.2 -7.3 0.0 3.1 -11.52012 Q1 67.8 1.2 1.2 0.0 31.2 36.0 -4.9 -10.4 -0.2 -10.1 -5.7 45.9 9.1 22.3 17.3
2012 Jan. 22.6 1.8 . . 5.5 . . -1.5 . . 0.6 16.9 . . 5.7 Feb. 20.4 0.1 . . 10.5 . . -8.3 . . -6.3 18.1 . . 5.8 Mar. 24.8 -0.7 . . 15.2 . . -0.6 . . 0.1 11.0 . . 5.9 Apr. -2.2 -0.1 . . 5.2 . . 0.8 . . 0.7 -8.0 . . -3.4 May 91.4 -1.7 . . 49.8 . . 5.0 . . 3.8 38.2 . . 15.9
Growth rates
2009 -10.1 -0.4 -1.4 23.4 -12.8 -12.4 -37.0 10.8 -3.5 17.1 3.5 -6.9 3.8 -8.6 -8.22010 3.8 -13.1 -13.0 -9.9 0.4 0.1 27.7 33.2 -3.1 53.2 30.6 7.7 3.7 7.4 11.3
2011 Q3 6.9 46.0 46.3 63.4 6.0 5.1 84.1 16.1 -3.6 25.0 9.1 7.2 4.5 7.0 18.0 Q4 3.3 -5.3 -5.4 40.4 1.9 0.9 88.4 1.0 -3.2 1.3 51.5 6.1 3.7 5.5 10.92012 Q1 2.9 -11.9 -12.2 43.2 0.8 0.2 38.2 -0.1 -3.9 0.4 54.5 7.1 4.8 6.9 13.1
6. Other investment liabilities
Outstanding amounts (international investment position)
Total Eurosystem MFIs General Other sectors
(excluding Eurosystem) government
Total Loans/ Other Total Loans/ Other Total Trade Loans Other Total Trade Loans Othercurrency liabilities currency liabilities credits liabilities credits liabilities
and anddeposits deposits
1 2 3 4 5 6 7 8 9 10 11 12 13 14 15
2009 4,985.4 251.7 251.3 0.4 3,399.7 3,360.7 39.0 85.2 0.0 80.8 4.4 1,248.8 177.8 929.3 141.72010 5,304.0 268.8 265.7 3.1 3,508.6 3,462.6 46.0 153.9 0.0 147.2 6.6 1,372.8 200.8 1,016.2 155.8
2011 Q4 5,328.5 408.8 406.0 2.8 3,208.0 3,140.4 67.6 223.5 0.1 216.0 7.4 1,488.3 217.2 1,112.8 158.32012 Q1 5,454.9 334.2 331.3 2.9 3,364.6 3,301.1 63.5 231.0 0.1 223.0 7.9 1,525.1 221.1 1,132.7 171.3
Transactions
2009 -709.9 -233.2 -233.4 0.2 -352.8 -341.6 -11.2 17.2 0.0 17.2 0.0 -141.1 0.8 -127.6 -14.32010 117.4 8.9 6.3 2.6 -10.8 -16.7 5.9 65.6 0.0 64.8 0.8 53.7 15.4 14.9 23.42011 13.6 134.6 134.8 -0.2 -285.8 -324.5 38.7 73.0 0.0 73.2 -0.2 91.8 9.8 49.7 32.3
2011 Q3 127.2 29.8 29.8 0.0 24.3 5.6 18.7 23.2 -0.1 23.2 0.1 49.8 6.3 24.2 19.4 Q4 -118.1 87.9 88.0 0.0 -229.1 -237.1 8.0 9.3 0.0 8.8 0.5 13.7 -0.1 21.7 -7.82012 Q1 160.6 -71.5 -71.7 0.1 187.1 190.6 -3.5 8.4 0.0 7.4 1.0 36.7 5.6 18.0 13.1
2012 Jan. 90.8 -36.0 . . 109.3 . . 7.1 . . . 10.4 . . . Feb. 13.8 0.1 . . -7.3 . . -1.9 . . . 23.0 . . . Mar. 56.0 -35.6 . . 85.1 . . 3.2 . . . 3.3 . . . Apr. 5.0 1.0 . . 2.9 . . 5.5 . . . -4.4 . . . May 56.1 40.7 . . 1.3 . . 2.9 . . . 11.2 . . .
Growth rates
2009 -12.3 -48.1 -48.1 . -9.4 -9.2 -19.8 24.9 . 26.5 -0.7 -9.9 0.3 -11.6 -9.22010 2.3 3.4 2.4 . -0.2 -0.4 15.5 75.5 . 79.7 11.8 4.1 8.5 1.4 15.4
2011 Q3 1.2 25.9 25.6 . -4.3 -5.4 79.4 104.6 . 111.8 -8.4 3.1 10.3 -0.5 19.4 Q4 0.3 50.6 51.2 . -8.2 -9.4 89.7 48.7 . 51.1 -2.7 6.8 4.8 5.0 22.52012 Q1 3.4 19.9 19.1 . -1.1 -1.9 45.9 30.8 . 30.7 32.1 7.7 5.9 6.6 18.1
Source: ECB.
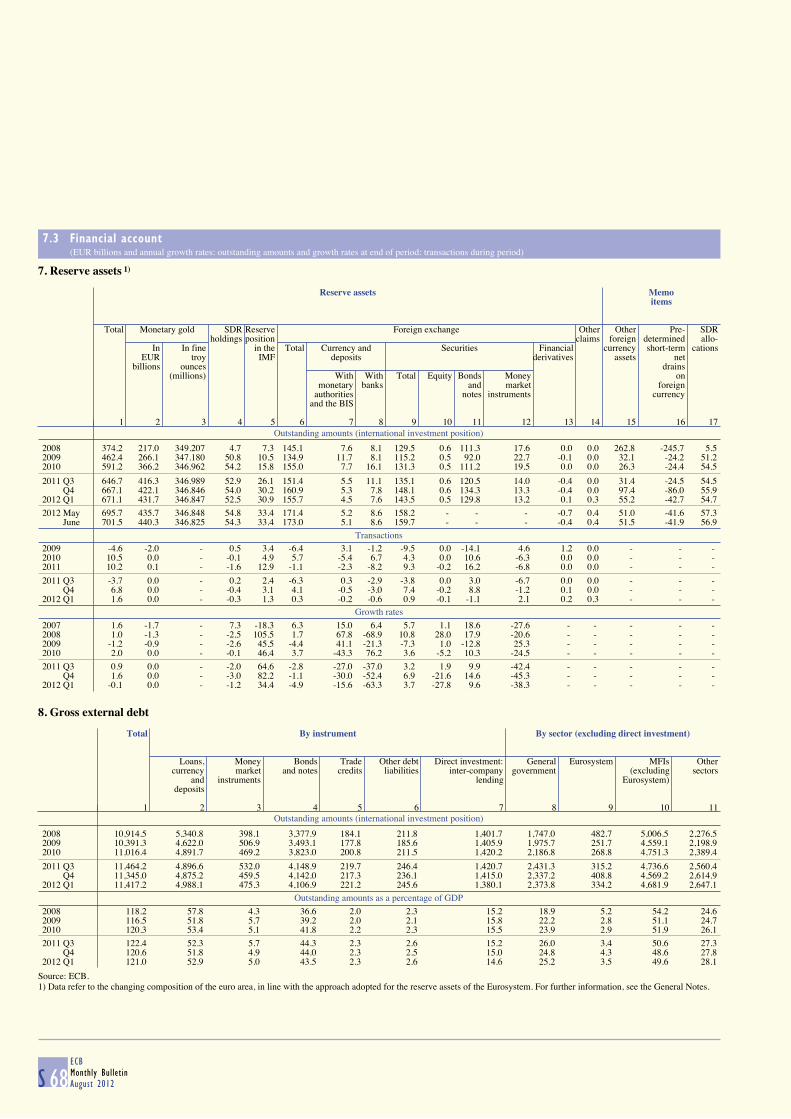
7.3 Financial account (EUR billions and annual growth rates; outstanding amounts and growth rates at end of period; transactions during period)
S 68ECBMonthly BulletinAugust 2012
7. Reserve assets 1)
Outstanding amounts (international investment position)
Reserve assets Memo
items
Total Monetary gold SDR Reserve Foreign exchange Other Other Pre- SDR
holdings position claims foreign determined allo-In In fine in the Total Currency and Securities Financial currency short-term cations
EUR troy IMF deposits derivatives assets netbillions ounces drains
(millions) With With Total Equity Bonds Money onmonetary banks and market foreign
authorities notes instruments currencyand the BIS
1 2 3 4 5 6 7 8 9 10 11 12 13 14 15 16 17
2008 374.2 217.0 349.207 4.7 7.3 145.1 7.6 8.1 129.5 0.6 111.3 17.6 0.0 0.0 262.8 -245.7 5.52009 462.4 266.1 347.180 50.8 10.5 134.9 11.7 8.1 115.2 0.5 92.0 22.7 -0.1 0.0 32.1 -24.2 51.22010 591.2 366.2 346.962 54.2 15.8 155.0 7.7 16.1 131.3 0.5 111.2 19.5 0.0 0.0 26.3 -24.4 54.5
2011 Q3 646.7 416.3 346.989 52.9 26.1 151.4 5.5 11.1 135.1 0.6 120.5 14.0 -0.4 0.0 31.4 -24.5 54.5 Q4 667.1 422.1 346.846 54.0 30.2 160.9 5.3 7.8 148.1 0.6 134.3 13.3 -0.4 0.0 97.4 -86.0 55.92012 Q1 671.1 431.7 346.847 52.5 30.9 155.7 4.5 7.6 143.5 0.5 129.8 13.2 0.1 0.3 55.2 -42.7 54.7
2012 May 695.7 435.7 346.848 54.8 33.4 171.4 5.2 8.6 158.2 - - - -0.7 0.4 51.0 -41.6 57.3 June 701.5 440.3 346.825 54.3 33.4 173.0 5.1 8.6 159.7 - - - -0.4 0.4 51.5 -41.9 56.9
Transactions
2009 -4.6 -2.0 - 0.5 3.4 -6.4 3.1 -1.2 -9.5 0.0 -14.1 4.6 1.2 0.0 - - - 2010 10.5 0.0 - -0.1 4.9 5.7 -5.4 6.7 4.3 0.0 10.6 -6.3 0.0 0.0 - - - 2011 10.2 0.1 - -1.6 12.9 -1.1 -2.3 -8.2 9.3 -0.2 16.2 -6.8 0.0 0.0 - - -
2011 Q3 -3.7 0.0 - 0.2 2.4 -6.3 0.3 -2.9 -3.8 0.0 3.0 -6.7 0.0 0.0 - - - Q4 6.8 0.0 - -0.4 3.1 4.1 -0.5 -3.0 7.4 -0.2 8.8 -1.2 0.1 0.0 - - - 2012 Q1 1.6 0.0 - -0.3 1.3 0.3 -0.2 -0.6 0.9 -0.1 -1.1 2.1 0.2 0.3 - - -
Growth rates
2007 1.6 -1.7 - 7.3 -18.3 6.3 15.0 6.4 5.7 1.1 18.6 -27.6 - - - - - 2008 1.0 -1.3 - -2.5 105.5 1.7 67.8 -68.9 10.8 28.0 17.9 -20.6 - - - - - 2009 -1.2 -0.9 - -2.6 45.5 -4.4 41.1 -21.3 -7.3 1.0 -12.8 25.3 - - - - - 2010 2.0 0.0 - -0.1 46.4 3.7 -43.3 76.2 3.6 -5.2 10.3 -24.5 - - - - -
2011 Q3 0.9 0.0 - -2.0 64.6 -2.8 -27.0 -37.0 3.2 1.9 9.9 -42.4 - - - - - Q4 1.6 0.0 - -3.0 82.2 -1.1 -30.0 -52.4 6.9 -21.6 14.6 -45.3 - - - - - 2012 Q1 -0.1 0.0 - -1.2 34.4 -4.9 -15.6 -63.3 3.7 -27.8 9.6 -38.3 - - - - -
8. Gross external debt
Outstanding amounts (international investment position)
Total By instrument By sector (excluding direct investment)
Loans, Money Bonds Trade Other debt Direct investment: General Eurosystem MFIs Othercurrency market and notes credits liabilities inter-company government (excluding sectors
and instruments lending Eurosystem)deposits
1 2 3 4 5 6 7 8 9 10 11
2008 10,914.5 5,340.8 398.1 3,377.9 184.1 211.8 1,401.7 1,747.0 482.7 5,006.5 2,276.52009 10,391.3 4,622.0 506.9 3,493.1 177.8 185.6 1,405.9 1,975.7 251.7 4,559.1 2,198.92010 11,016.4 4,891.7 469.2 3,823.0 200.8 211.5 1,420.2 2,186.8 268.8 4,751.3 2,389.4
2011 Q3 11,464.2 4,896.6 532.0 4,148.9 219.7 246.4 1,420.7 2,431.3 315.2 4,736.6 2,560.4 Q4 11,345.0 4,875.2 459.5 4,142.0 217.3 236.1 1,415.0 2,337.2 408.8 4,569.2 2,614.92012 Q1 11,417.2 4,988.1 475.3 4,106.9 221.2 245.6 1,380.1 2,373.8 334.2 4,681.9 2,647.1
Outstanding amounts as a percentage of GDP
2008 118.2 57.8 4.3 36.6 2.0 2.3 15.2 18.9 5.2 54.2 24.62009 116.5 51.8 5.7 39.2 2.0 2.1 15.8 22.2 2.8 51.1 24.72010 120.3 53.4 5.1 41.8 2.2 2.3 15.5 23.9 2.9 51.9 26.1
2011 Q3 122.4 52.3 5.7 44.3 2.3 2.6 15.2 26.0 3.4 50.6 27.3 Q4 120.6 51.8 4.9 44.0 2.3 2.5 15.0 24.8 4.3 48.6 27.82012 Q1 121.0 52.9 5.0 43.5 2.3 2.6 14.6 25.2 3.5 49.6 28.1
Source: ECB.1) Data refer to the changing composition of the euro area, in line with the approach adopted for the reserve assets of the Eurosystem. For further information, see the General Notes.
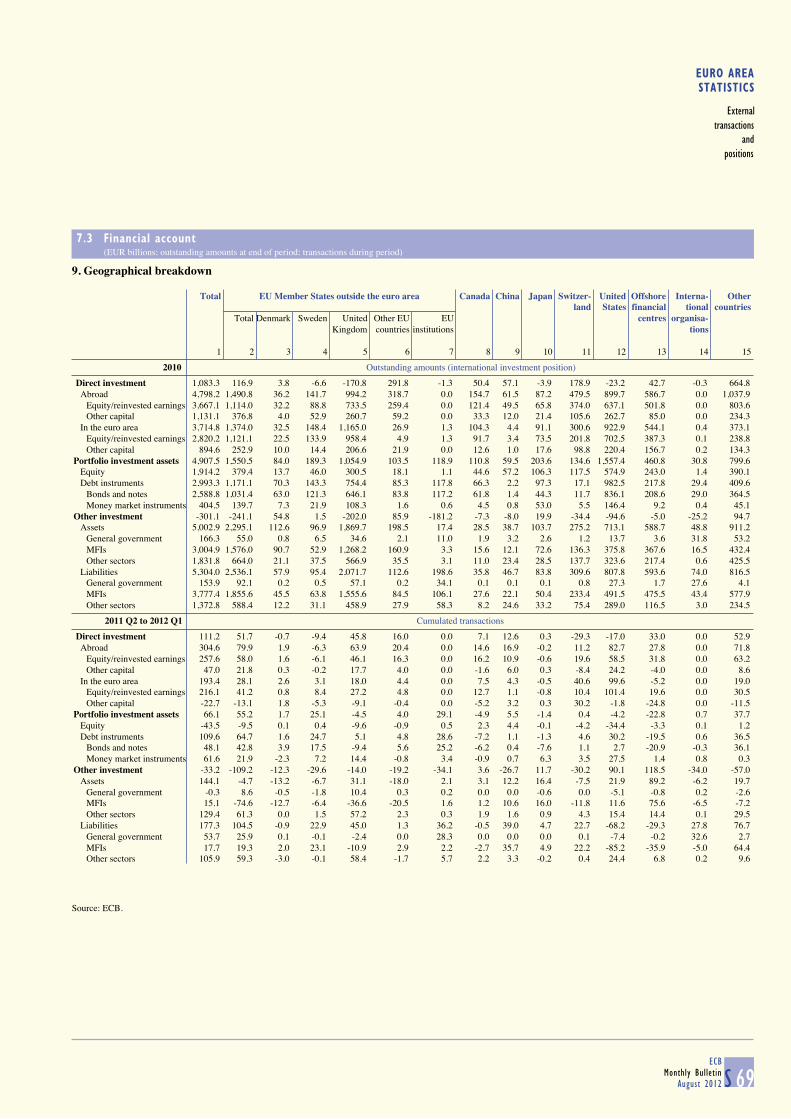
EURO AREASTATISTICS
Externaltransactions
andpositions
7.3 Financial account (EUR billions; outstanding amounts at end of period; transactions during period)
S 69ECB
Monthly BulletinAugust 2012
9. Geographical breakdown
Total EU Member States outside the euro area Canada China Japan Switzer- United Offshore Interna- Otherland States financial tional countries
Total Denmark Sweden United Other EU EU centres organisa-Kingdom countries institutions tions
1 2 3 4 5 6 7 8 9 10 11 12 13 14 15
2010 Outstanding amounts (international investment position)
Direct investment 1,083.3 116.9 3.8 -6.6 -170.8 291.8 -1.3 50.4 57.1 -3.9 178.9 -23.2 42.7 -0.3 664.8 Abroad 4,798.2 1,490.8 36.2 141.7 994.2 318.7 0.0 154.7 61.5 87.2 479.5 899.7 586.7 0.0 1,037.9 Equity/reinvested earnings 3,667.1 1,114.0 32.2 88.8 733.5 259.4 0.0 121.4 49.5 65.8 374.0 637.1 501.8 0.0 803.6 Other capital 1,131.1 376.8 4.0 52.9 260.7 59.2 0.0 33.3 12.0 21.4 105.6 262.7 85.0 0.0 234.3 In the euro area 3,714.8 1,374.0 32.5 148.4 1,165.0 26.9 1.3 104.3 4.4 91.1 300.6 922.9 544.1 0.4 373.1 Equity/reinvested earnings 2,820.2 1,121.1 22.5 133.9 958.4 4.9 1.3 91.7 3.4 73.5 201.8 702.5 387.3 0.1 238.8 Other capital 894.6 252.9 10.0 14.4 206.6 21.9 0.0 12.6 1.0 17.6 98.8 220.4 156.7 0.2 134.3 Portfolio investment assets 4,907.5 1,550.5 84.0 189.3 1,054.9 103.5 118.9 110.8 59.5 203.6 134.6 1,557.4 460.8 30.8 799.6 Equity 1,914.2 379.4 13.7 46.0 300.5 18.1 1.1 44.6 57.2 106.3 117.5 574.9 243.0 1.4 390.1 Debt instruments 2,993.3 1,171.1 70.3 143.3 754.4 85.3 117.8 66.3 2.2 97.3 17.1 982.5 217.8 29.4 409.6 Bonds and notes 2,588.8 1,031.4 63.0 121.3 646.1 83.8 117.2 61.8 1.4 44.3 11.7 836.1 208.6 29.0 364.5 Money market instruments 404.5 139.7 7.3 21.9 108.3 1.6 0.6 4.5 0.8 53.0 5.5 146.4 9.2 0.4 45.1 Other investment -301.1 -241.1 54.8 1.5 -202.0 85.9 -181.2 -7.3 -8.0 19.9 -34.4 -94.6 -5.0 -25.2 94.7 Assets 5,002.9 2,295.1 112.6 96.9 1,869.7 198.5 17.4 28.5 38.7 103.7 275.2 713.1 588.7 48.8 911.2 General government 166.3 55.0 0.8 6.5 34.6 2.1 11.0 1.9 3.2 2.6 1.2 13.7 3.6 31.8 53.2 MFIs 3,004.9 1,576.0 90.7 52.9 1,268.2 160.9 3.3 15.6 12.1 72.6 136.3 375.8 367.6 16.5 432.4 Other sectors 1,831.8 664.0 21.1 37.5 566.9 35.5 3.1 11.0 23.4 28.5 137.7 323.6 217.4 0.6 425.5 Liabilities 5,304.0 2,536.1 57.9 95.4 2,071.7 112.6 198.6 35.8 46.7 83.8 309.6 807.8 593.6 74.0 816.5 General government 153.9 92.1 0.2 0.5 57.1 0.2 34.1 0.1 0.1 0.1 0.8 27.3 1.7 27.6 4.1 MFIs 3,777.4 1,855.6 45.5 63.8 1,555.6 84.5 106.1 27.6 22.1 50.4 233.4 491.5 475.5 43.4 577.9 Other sectors 1,372.8 588.4 12.2 31.1 458.9 27.9 58.3 8.2 24.6 33.2 75.4 289.0 116.5 3.0 234.5
2011 Q2 to 2012 Q1 Cumulated transactions
Direct investment 111.2 51.7 -0.7 -9.4 45.8 16.0 0.0 7.1 12.6 0.3 -29.3 -17.0 33.0 0.0 52.9 Abroad 304.6 79.9 1.9 -6.3 63.9 20.4 0.0 14.6 16.9 -0.2 11.2 82.7 27.8 0.0 71.8 Equity/reinvested earnings 257.6 58.0 1.6 -6.1 46.1 16.3 0.0 16.2 10.9 -0.6 19.6 58.5 31.8 0.0 63.2 Other capital 47.0 21.8 0.3 -0.2 17.7 4.0 0.0 -1.6 6.0 0.3 -8.4 24.2 -4.0 0.0 8.6 In the euro area 193.4 28.1 2.6 3.1 18.0 4.4 0.0 7.5 4.3 -0.5 40.6 99.6 -5.2 0.0 19.0 Equity/reinvested earnings 216.1 41.2 0.8 8.4 27.2 4.8 0.0 12.7 1.1 -0.8 10.4 101.4 19.6 0.0 30.5 Other capital -22.7 -13.1 1.8 -5.3 -9.1 -0.4 0.0 -5.2 3.2 0.3 30.2 -1.8 -24.8 0.0 -11.5 Portfolio investment assets 66.1 55.2 1.7 25.1 -4.5 4.0 29.1 -4.9 5.5 -1.4 0.4 -4.2 -22.8 0.7 37.7 Equity -43.5 -9.5 0.1 0.4 -9.6 -0.9 0.5 2.3 4.4 -0.1 -4.2 -34.4 -3.3 0.1 1.2 Debt instruments 109.6 64.7 1.6 24.7 5.1 4.8 28.6 -7.2 1.1 -1.3 4.6 30.2 -19.5 0.6 36.5 Bonds and notes 48.1 42.8 3.9 17.5 -9.4 5.6 25.2 -6.2 0.4 -7.6 1.1 2.7 -20.9 -0.3 36.1 Money market instruments 61.6 21.9 -2.3 7.2 14.4 -0.8 3.4 -0.9 0.7 6.3 3.5 27.5 1.4 0.8 0.3 Other investment -33.2 -109.2 -12.3 -29.6 -14.0 -19.2 -34.1 3.6 -26.7 11.7 -30.2 90.1 118.5 -34.0 -57.0 Assets 144.1 -4.7 -13.2 -6.7 31.1 -18.0 2.1 3.1 12.2 16.4 -7.5 21.9 89.2 -6.2 19.7 General government -0.3 8.6 -0.5 -1.8 10.4 0.3 0.2 0.0 0.0 -0.6 0.0 -5.1 -0.8 0.2 -2.6 MFIs 15.1 -74.6 -12.7 -6.4 -36.6 -20.5 1.6 1.2 10.6 16.0 -11.8 11.6 75.6 -6.5 -7.2 Other sectors 129.4 61.3 0.0 1.5 57.2 2.3 0.3 1.9 1.6 0.9 4.3 15.4 14.4 0.1 29.5 Liabilities 177.3 104.5 -0.9 22.9 45.0 1.3 36.2 -0.5 39.0 4.7 22.7 -68.2 -29.3 27.8 76.7 General government 53.7 25.9 0.1 -0.1 -2.4 0.0 28.3 0.0 0.0 0.0 0.1 -7.4 -0.2 32.6 2.7 MFIs 17.7 19.3 2.0 23.1 -10.9 2.9 2.2 -2.7 35.7 4.9 22.2 -85.2 -35.9 -5.0 64.4 Other sectors 105.9 59.3 -3.0 -0.1 58.4 -1.7 5.7 2.2 3.3 -0.2 0.4 24.4 6.8 0.2 9.6
Source: ECB.
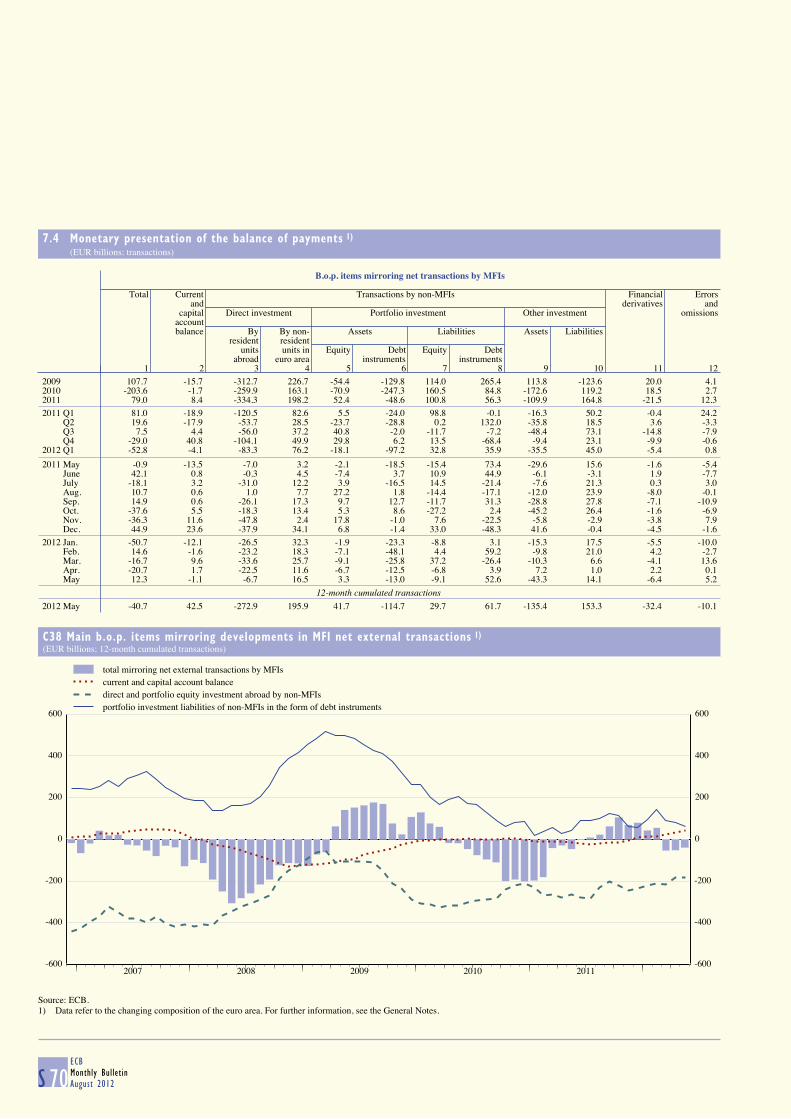
7.4 Monetary presentation of the balance of payments 1) (EUR billions; transactions)
S 70ECBMonthly BulletinAugust 2012
B.o.p. items mirroring net transactions by MFIs
Total Current Transactions by non-MFIs Financial Errors
and derivatives andcapital Direct investment Portfolio investment Other investment omissions
account balance By By non- Assets Liabilities Assets Liabilities
resident residentunits units in Equity Debt Equity Debt
abroad euro area instruments instruments1 2 3 4 5 6 7 8 9 10 11 12
2009 107.7 -15.7 -312.7 226.7 -54.4 -129.8 114.0 265.4 113.8 -123.6 20.0 4.12010 -203.6 -1.7 -259.9 163.1 -70.9 -247.3 160.5 84.8 -172.6 119.2 18.5 2.72011 79.0 8.4 -334.3 198.2 52.4 -48.6 100.8 56.3 -109.9 164.8 -21.5 12.3
2011 Q1 81.0 -18.9 -120.5 82.6 5.5 -24.0 98.8 -0.1 -16.3 50.2 -0.4 24.2 Q2 19.6 -17.9 -53.7 28.5 -23.7 -28.8 0.2 132.0 -35.8 18.5 3.6 -3.3 Q3 7.5 4.4 -56.0 37.2 40.8 -2.0 -11.7 -7.2 -48.4 73.1 -14.8 -7.9 Q4 -29.0 40.8 -104.1 49.9 29.8 6.2 13.5 -68.4 -9.4 23.1 -9.9 -0.62012 Q1 -52.8 -4.1 -83.3 76.2 -18.1 -97.2 32.8 35.9 -35.5 45.0 -5.4 0.8
2011 May -0.9 -13.5 -7.0 3.2 -2.1 -18.5 -15.4 73.4 -29.6 15.6 -1.6 -5.4 June 42.1 0.8 -0.3 4.5 -7.4 3.7 10.9 44.9 -6.1 -3.1 1.9 -7.7 July -18.1 3.2 -31.0 12.2 3.9 -16.5 14.5 -21.4 -7.6 21.3 0.3 3.0 Aug. 10.7 0.6 1.0 7.7 27.2 1.8 -14.4 -17.1 -12.0 23.9 -8.0 -0.1 Sep. 14.9 0.6 -26.1 17.3 9.7 12.7 -11.7 31.3 -28.8 27.8 -7.1 -10.9 Oct. -37.6 5.5 -18.3 13.4 5.3 8.6 -27.2 2.4 -45.2 26.4 -1.6 -6.9 Nov. -36.3 11.6 -47.8 2.4 17.8 -1.0 7.6 -22.5 -5.8 -2.9 -3.8 7.9 Dec. 44.9 23.6 -37.9 34.1 6.8 -1.4 33.0 -48.3 41.6 -0.4 -4.5 -1.6
2012 Jan. -50.7 -12.1 -26.5 32.3 -1.9 -23.3 -8.8 3.1 -15.3 17.5 -5.5 -10.0 Feb. 14.6 -1.6 -23.2 18.3 -7.1 -48.1 4.4 59.2 -9.8 21.0 4.2 -2.7 Mar. -16.7 9.6 -33.6 25.7 -9.1 -25.8 37.2 -26.4 -10.3 6.6 -4.1 13.6 Apr. -20.7 1.7 -22.5 11.6 -6.7 -12.5 -6.8 3.9 7.2 1.0 2.2 0.1 May 12.3 -1.1 -6.7 16.5 3.3 -13.0 -9.1 52.6 -43.3 14.1 -6.4 5.2
12-month cumulated transactions
2012 May -40.7 42.5 -272.9 195.9 41.7 -114.7 29.7 61.7 -135.4 153.3 -32.4 -10.1
C38 Main b.o.p. items mirroring developments in MFI net external transactions 1)
(EUR billions; 12-month cumulated transactions)
-600
-400
-200
0
200
400
600
2007 2008 2009 2010 2011-600
-400
-200
0
200
400
600
total mirroring net external transactions by MFIscurrent and capital account balancedirect and portfolio equity investment abroad by non-MFIsportfolio investment liabilities of non-MFIs in the form of debt instruments
Source: ECB.1) Data refer to the changing composition of the euro area. For further information, see the General Notes.
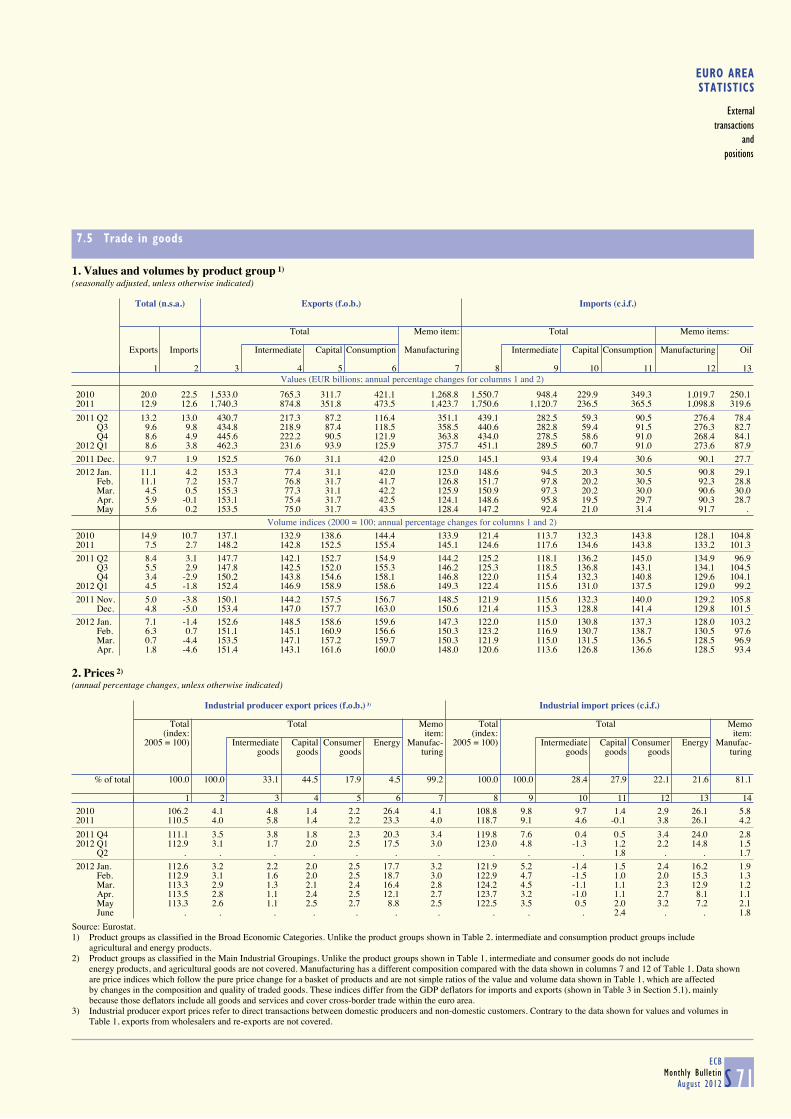
EURO AREASTATISTICS
Externaltransactions
andpositions
7.5 Trade in goods
S 71ECB
Monthly BulletinAugust 2012
1. Values and volumes by product group 1) (seasonally adjusted, unless otherwise indicated)
Values (EUR billions; annual percentage changes for columns 1 and 2)
Total (n.s.a.) Exports (f.o.b.) Imports (c.i.f.)
Total Memo item: Total Memo items:
Exports Imports Intermediate Capital Consumption Manufacturing Intermediate Capital Consumption Manufacturing Oil
1 2 3 4 5 6 7 8 9 10 11 12 13
2010 20.0 22.5 1,533.0 765.3 311.7 421.1 1,268.8 1,550.7 948.4 229.9 349.3 1,019.7 250.12011 12.9 12.6 1,740.3 874.8 351.8 473.5 1,423.7 1,750.6 1,120.7 236.5 365.5 1,098.8 319.6
2011 Q2 13.2 13.0 430.7 217.3 87.2 116.4 351.1 439.1 282.5 59.3 90.5 276.4 78.4 Q3 9.6 9.8 434.8 218.9 87.4 118.5 358.5 440.6 282.8 59.4 91.5 276.3 82.7 Q4 8.6 4.9 445.6 222.2 90.5 121.9 363.8 434.0 278.5 58.6 91.0 268.4 84.12012 Q1 8.6 3.8 462.3 231.6 93.9 125.9 375.7 451.1 289.5 60.7 91.0 273.6 87.9
2011 Dec. 9.7 1.9 152.5 76.0 31.1 42.0 125.0 145.1 93.4 19.4 30.6 90.1 27.7
2012 Jan. 11.1 4.2 153.3 77.4 31.1 42.0 123.0 148.6 94.5 20.3 30.5 90.8 29.1 Feb. 11.1 7.2 153.7 76.8 31.7 41.7 126.8 151.7 97.8 20.2 30.5 92.3 28.8 Mar. 4.5 0.5 155.3 77.3 31.1 42.2 125.9 150.9 97.3 20.2 30.0 90.6 30.0 Apr. 5.9 -0.1 153.1 75.4 31.7 42.5 124.1 148.6 95.8 19.5 29.7 90.3 28.7 May 5.6 0.2 153.5 75.0 31.7 43.5 128.4 147.2 92.4 21.0 31.4 91.7 .
Volume indices (2000 = 100; annual percentage changes for columns 1 and 2)
2010 14.9 10.7 137.1 132.9 138.6 144.4 133.9 121.4 113.7 132.3 143.8 128.1 104.82011 7.5 2.7 148.2 142.8 152.5 155.4 145.1 124.6 117.6 134.6 143.8 133.2 101.3
2011 Q2 8.4 3.1 147.7 142.1 152.7 154.9 144.2 125.2 118.1 136.2 145.0 134.9 96.9 Q3 5.5 2.9 147.8 142.5 152.0 155.3 146.2 125.3 118.5 136.8 143.1 134.1 104.5 Q4 3.4 -2.9 150.2 143.8 154.6 158.1 146.8 122.0 115.4 132.3 140.8 129.6 104.12012 Q1 4.5 -1.8 152.4 146.9 158.9 158.6 149.3 122.4 115.6 131.0 137.5 129.0 99.2
2011 Nov. 5.0 -3.8 150.1 144.2 157.5 156.7 148.5 121.9 115.6 132.3 140.0 129.2 105.8 Dec. 4.8 -5.0 153.4 147.0 157.7 163.0 150.6 121.4 115.3 128.8 141.4 129.8 101.5
2012 Jan. 7.1 -1.4 152.6 148.5 158.6 159.6 147.3 122.0 115.0 130.8 137.3 128.0 103.2 Feb. 6.3 0.7 151.1 145.1 160.9 156.6 150.3 123.2 116.9 130.7 138.7 130.5 97.6 Mar. 0.7 -4.4 153.5 147.1 157.2 159.7 150.3 121.9 115.0 131.5 136.5 128.5 96.9 Apr. 1.8 -4.6 151.4 143.1 161.6 160.0 148.0 120.6 113.6 126.8 136.6 128.5 93.4
2. Prices 2) (annual percentage changes, unless otherwise indicated)
Industrial producer export prices (f.o.b.) 3) Industrial import prices (c.i.f.)
Total Total Memo Total Total Memo
(index: item: (index: item:2005 = 100) Intermediate Capital Consumer Energy Manufac- 2005 = 100) Intermediate Capital Consumer Energy Manufac-
goods goods goods turing goods goods goods turing
% of total 100.0 100.0 33.1 44.5 17.9 4.5 99.2 100.0 100.0 28.4 27.9 22.1 21.6 81.1
1 2 3 4 5 6 7 8 9 10 11 12 13 14
2010 106.2 4.1 4.8 1.4 2.2 26.4 4.1 108.8 9.8 9.7 1.4 2.9 26.1 5.82011 110.5 4.0 5.8 1.4 2.2 23.3 4.0 118.7 9.1 4.6 -0.1 3.8 26.1 4.2
2011 Q4 111.1 3.5 3.8 1.8 2.3 20.3 3.4 119.8 7.6 0.4 0.5 3.4 24.0 2.82012 Q1 112.9 3.1 1.7 2.0 2.5 17.5 3.0 123.0 4.8 -1.3 1.2 2.2 14.8 1.5 Q2 . . . . . . . . . . 1.8 . . 1.7
2012 Jan. 112.6 3.2 2.2 2.0 2.5 17.7 3.2 121.9 5.2 -1.4 1.5 2.4 16.2 1.9 Feb. 112.9 3.1 1.6 2.0 2.5 18.7 3.0 122.9 4.7 -1.5 1.0 2.0 15.3 1.3 Mar. 113.3 2.9 1.3 2.1 2.4 16.4 2.8 124.2 4.5 -1.1 1.1 2.3 12.9 1.2 Apr. 113.5 2.8 1.1 2.4 2.5 12.1 2.7 123.7 3.2 -1.0 1.1 2.7 8.1 1.1 May 113.3 2.6 1.1 2.5 2.7 8.8 2.5 122.5 3.5 0.5 2.0 3.2 7.2 2.1 June . . . . . . . . . . 2.4 . . 1.8
Source: Eurostat.1) Product groups as classified in the Broad Economic Categories. Unlike the product groups shown in Table 2, intermediate and consumption product groups include
agricultural and energy products.2) Product groups as classified in the Main Industrial Groupings. Unlike the product groups shown in Table 1, intermediate and consumer goods do not include
energy products, and agricultural goods are not covered. Manufacturing has a different composition compared with the data shown in columns 7 and 12 of Table 1. Data shownare price indices which follow the pure price change for a basket of products and are not simple ratios of the value and volume data shown in Table 1, which are affectedby changes in the composition and quality of traded goods. These indices differ from the GDP deflators for imports and exports (shown in Table 3 in Section 5.1), mainlybecause those deflators include all goods and services and cover cross-border trade within the euro area.
3) Industrial producer export prices refer to direct transactions between domestic producers and non-domestic customers. Contrary to the data shown for values and volumes in Table 1, exports from wholesalers and re-exports are not covered.
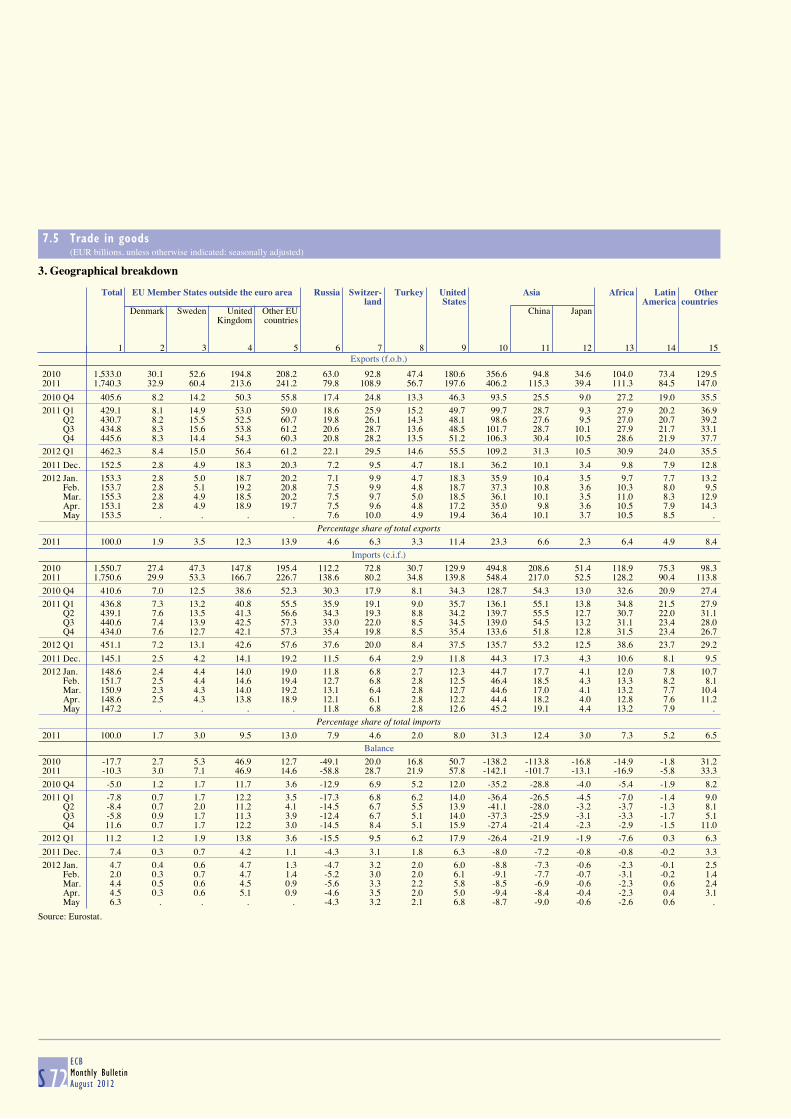
7.5 Trade in goods (EUR billions, unless otherwise indicated; seasonally adjusted)
S 72ECBMonthly BulletinAugust 2012
3. Geographical breakdown
Exports (f.o.b.)
Total EU Member States outside the euro area Russia Switzer- Turkey United Asia Africa Latin Other
land States America countriesDenmark Sweden United Other EU China Japan
Kingdom countries
1 2 3 4 5 6 7 8 9 10 11 12 13 14 15
2010 1,533.0 30.1 52.6 194.8 208.2 63.0 92.8 47.4 180.6 356.6 94.8 34.6 104.0 73.4 129.52011 1,740.3 32.9 60.4 213.6 241.2 79.8 108.9 56.7 197.6 406.2 115.3 39.4 111.3 84.5 147.0
2010 Q4 405.6 8.2 14.2 50.3 55.8 17.4 24.8 13.3 46.3 93.5 25.5 9.0 27.2 19.0 35.5
2011 Q1 429.1 8.1 14.9 53.0 59.0 18.6 25.9 15.2 49.7 99.7 28.7 9.3 27.9 20.2 36.9 Q2 430.7 8.2 15.5 52.5 60.7 19.8 26.1 14.3 48.1 98.6 27.6 9.5 27.0 20.7 39.2 Q3 434.8 8.3 15.6 53.8 61.2 20.6 28.7 13.6 48.5 101.7 28.7 10.1 27.9 21.7 33.1 Q4 445.6 8.3 14.4 54.3 60.3 20.8 28.2 13.5 51.2 106.3 30.4 10.5 28.6 21.9 37.7
2012 Q1 462.3 8.4 15.0 56.4 61.2 22.1 29.5 14.6 55.5 109.2 31.3 10.5 30.9 24.0 35.5
2011 Dec. 152.5 2.8 4.9 18.3 20.3 7.2 9.5 4.7 18.1 36.2 10.1 3.4 9.8 7.9 12.8
2012 Jan. 153.3 2.8 5.0 18.7 20.2 7.1 9.9 4.7 18.3 35.9 10.4 3.5 9.7 7.7 13.2 Feb. 153.7 2.8 5.1 19.2 20.8 7.5 9.9 4.8 18.7 37.3 10.8 3.6 10.3 8.0 9.5 Mar. 155.3 2.8 4.9 18.5 20.2 7.5 9.7 5.0 18.5 36.1 10.1 3.5 11.0 8.3 12.9 Apr. 153.1 2.8 4.9 18.9 19.7 7.5 9.6 4.8 17.2 35.0 9.8 3.6 10.5 7.9 14.3 May 153.5 . . . . 7.6 10.0 4.9 19.4 36.4 10.1 3.7 10.5 8.5 .
Percentage share of total exports
2011 100.0 1.9 3.5 12.3 13.9 4.6 6.3 3.3 11.4 23.3 6.6 2.3 6.4 4.9 8.4
Imports (c.i.f.)
2010 1,550.7 27.4 47.3 147.8 195.4 112.2 72.8 30.7 129.9 494.8 208.6 51.4 118.9 75.3 98.32011 1,750.6 29.9 53.3 166.7 226.7 138.6 80.2 34.8 139.8 548.4 217.0 52.5 128.2 90.4 113.8
2010 Q4 410.6 7.0 12.5 38.6 52.3 30.3 17.9 8.1 34.3 128.7 54.3 13.0 32.6 20.9 27.4
2011 Q1 436.8 7.3 13.2 40.8 55.5 35.9 19.1 9.0 35.7 136.1 55.1 13.8 34.8 21.5 27.9 Q2 439.1 7.6 13.5 41.3 56.6 34.3 19.3 8.8 34.2 139.7 55.5 12.7 30.7 22.0 31.1 Q3 440.6 7.4 13.9 42.5 57.3 33.0 22.0 8.5 34.5 139.0 54.5 13.2 31.1 23.4 28.0 Q4 434.0 7.6 12.7 42.1 57.3 35.4 19.8 8.5 35.4 133.6 51.8 12.8 31.5 23.4 26.7
2012 Q1 451.1 7.2 13.1 42.6 57.6 37.6 20.0 8.4 37.5 135.7 53.2 12.5 38.6 23.7 29.2
2011 Dec. 145.1 2.5 4.2 14.1 19.2 11.5 6.4 2.9 11.8 44.3 17.3 4.3 10.6 8.1 9.5
2012 Jan. 148.6 2.4 4.4 14.0 19.0 11.8 6.8 2.7 12.3 44.7 17.7 4.1 12.0 7.8 10.7 Feb. 151.7 2.5 4.4 14.6 19.4 12.7 6.8 2.8 12.5 46.4 18.5 4.3 13.3 8.2 8.1 Mar. 150.9 2.3 4.3 14.0 19.2 13.1 6.4 2.8 12.7 44.6 17.0 4.1 13.2 7.7 10.4 Apr. 148.6 2.5 4.3 13.8 18.9 12.1 6.1 2.8 12.2 44.4 18.2 4.0 12.8 7.6 11.2 May 147.2 . . . . 11.8 6.8 2.8 12.6 45.2 19.1 4.4 13.2 7.9 .
Percentage share of total imports
2011 100.0 1.7 3.0 9.5 13.0 7.9 4.6 2.0 8.0 31.3 12.4 3.0 7.3 5.2 6.5
Balance
2010 -17.7 2.7 5.3 46.9 12.7 -49.1 20.0 16.8 50.7 -138.2 -113.8 -16.8 -14.9 -1.8 31.22011 -10.3 3.0 7.1 46.9 14.6 -58.8 28.7 21.9 57.8 -142.1 -101.7 -13.1 -16.9 -5.8 33.3
2010 Q4 -5.0 1.2 1.7 11.7 3.6 -12.9 6.9 5.2 12.0 -35.2 -28.8 -4.0 -5.4 -1.9 8.2
2011 Q1 -7.8 0.7 1.7 12.2 3.5 -17.3 6.8 6.2 14.0 -36.4 -26.5 -4.5 -7.0 -1.4 9.0 Q2 -8.4 0.7 2.0 11.2 4.1 -14.5 6.7 5.5 13.9 -41.1 -28.0 -3.2 -3.7 -1.3 8.1 Q3 -5.8 0.9 1.7 11.3 3.9 -12.4 6.7 5.1 14.0 -37.3 -25.9 -3.1 -3.3 -1.7 5.1 Q4 11.6 0.7 1.7 12.2 3.0 -14.5 8.4 5.1 15.9 -27.4 -21.4 -2.3 -2.9 -1.5 11.0
2012 Q1 11.2 1.2 1.9 13.8 3.6 -15.5 9.5 6.2 17.9 -26.4 -21.9 -1.9 -7.6 0.3 6.3
2011 Dec. 7.4 0.3 0.7 4.2 1.1 -4.3 3.1 1.8 6.3 -8.0 -7.2 -0.8 -0.8 -0.2 3.3
2012 Jan. 4.7 0.4 0.6 4.7 1.3 -4.7 3.2 2.0 6.0 -8.8 -7.3 -0.6 -2.3 -0.1 2.5 Feb. 2.0 0.3 0.7 4.7 1.4 -5.2 3.0 2.0 6.1 -9.1 -7.7 -0.7 -3.1 -0.2 1.4 Mar. 4.4 0.5 0.6 4.5 0.9 -5.6 3.3 2.2 5.8 -8.5 -6.9 -0.6 -2.3 0.6 2.4 Apr. 4.5 0.3 0.6 5.1 0.9 -4.6 3.5 2.0 5.0 -9.4 -8.4 -0.4 -2.3 0.4 3.1 May 6.3 . . . . -4.3 3.2 2.1 6.8 -8.7 -9.0 -0.6 -2.6 0.6 .
Source: Eurostat.
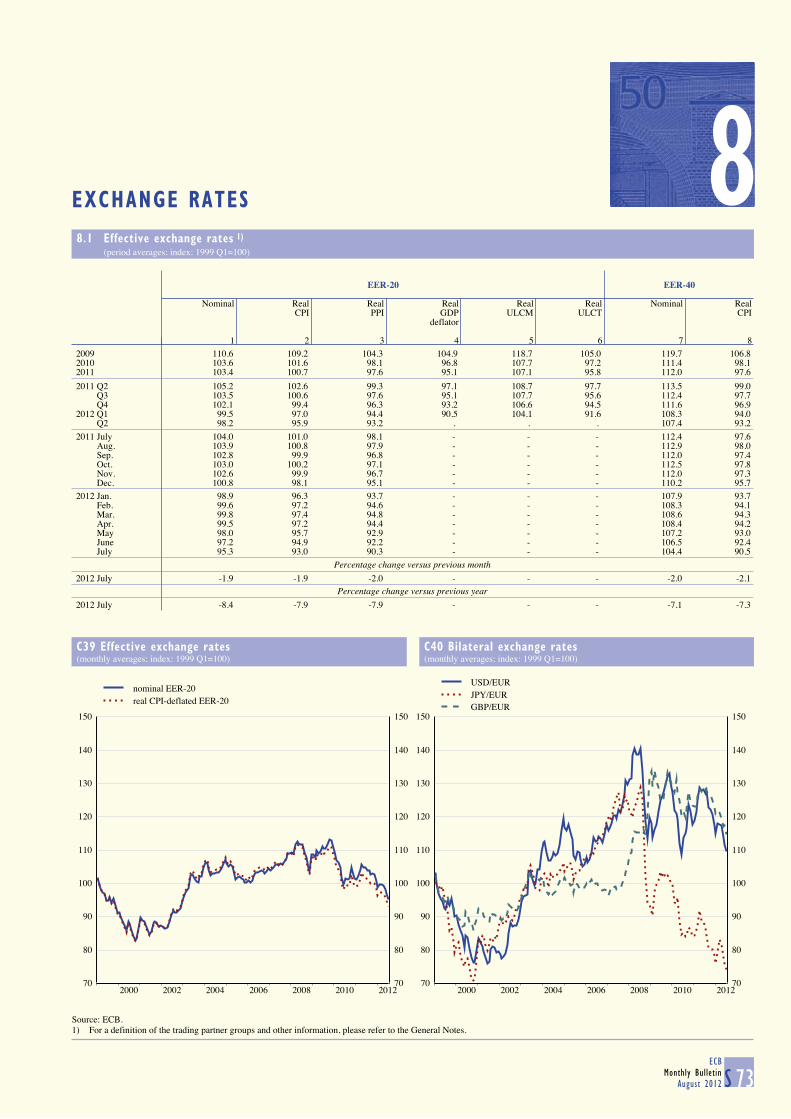
8EXCHANGE RATES
8.1 Effective exchange rates 1) (period averages; index: 1999 Q1=100)
S 73ECB
Monthly BulletinAugust 2012
EER-20 EER-40
Nominal Real Real Real Real Real Nominal RealCPI PPI GDP ULCM ULCT CPI
deflator
1 2 3 4 5 6 7 8
2009 110.6 109.2 104.3 104.9 118.7 105.0 119.7 106.82010 103.6 101.6 98.1 96.8 107.7 97.2 111.4 98.12011 103.4 100.7 97.6 95.1 107.1 95.8 112.0 97.6
2011 Q2 105.2 102.6 99.3 97.1 108.7 97.7 113.5 99.0 Q3 103.5 100.6 97.6 95.1 107.7 95.6 112.4 97.7 Q4 102.1 99.4 96.3 93.2 106.6 94.5 111.6 96.92012 Q1 99.5 97.0 94.4 90.5 104.1 91.6 108.3 94.0 Q2 98.2 95.9 93.2 . . . 107.4 93.2
2011 July 104.0 101.0 98.1 - - - 112.4 97.6 Aug. 103.9 100.8 97.9 - - - 112.9 98.0 Sep. 102.8 99.9 96.8 - - - 112.0 97.4 Oct. 103.0 100.2 97.1 - - - 112.5 97.8 Nov. 102.6 99.9 96.7 - - - 112.0 97.3 Dec. 100.8 98.1 95.1 - - - 110.2 95.7
2012 Jan. 98.9 96.3 93.7 - - - 107.9 93.7 Feb. 99.6 97.2 94.6 - - - 108.3 94.1 Mar. 99.8 97.4 94.8 - - - 108.6 94.3 Apr. 99.5 97.2 94.4 - - - 108.4 94.2 May 98.0 95.7 92.9 - - - 107.2 93.0 June 97.2 94.9 92.2 - - - 106.5 92.4 July 95.3 93.0 90.3 - - - 104.4 90.5
Percentage change versus previous month
2012 July -1.9 -1.9 -2.0 - - - -2.0 -2.1Percentage change versus previous year
2012 July -8.4 -7.9 -7.9 - - - -7.1 -7.3
C39 Effective exchange rates
(monthly averages; index: 1999 Q1=100)
C40 Bilateral exchange rates
(monthly averages; index: 1999 Q1=100)
70
80
90
100
110
120
130
140
150
2000 2002 2004 2006 2008 2010 201270
80
90
100
110
120
130
140
150
nominal EER-20real CPI-deflated EER-20
70
80
90
100
110
120
130
140
150
2000 2002 2004 2006 2008 2010 201270
80
90
100
110
120
130
140
150
USD/EURJPY/EURGBP/EUR
Source: ECB.1) For a definition of the trading partner groups and other information, please refer to the General Notes.
8
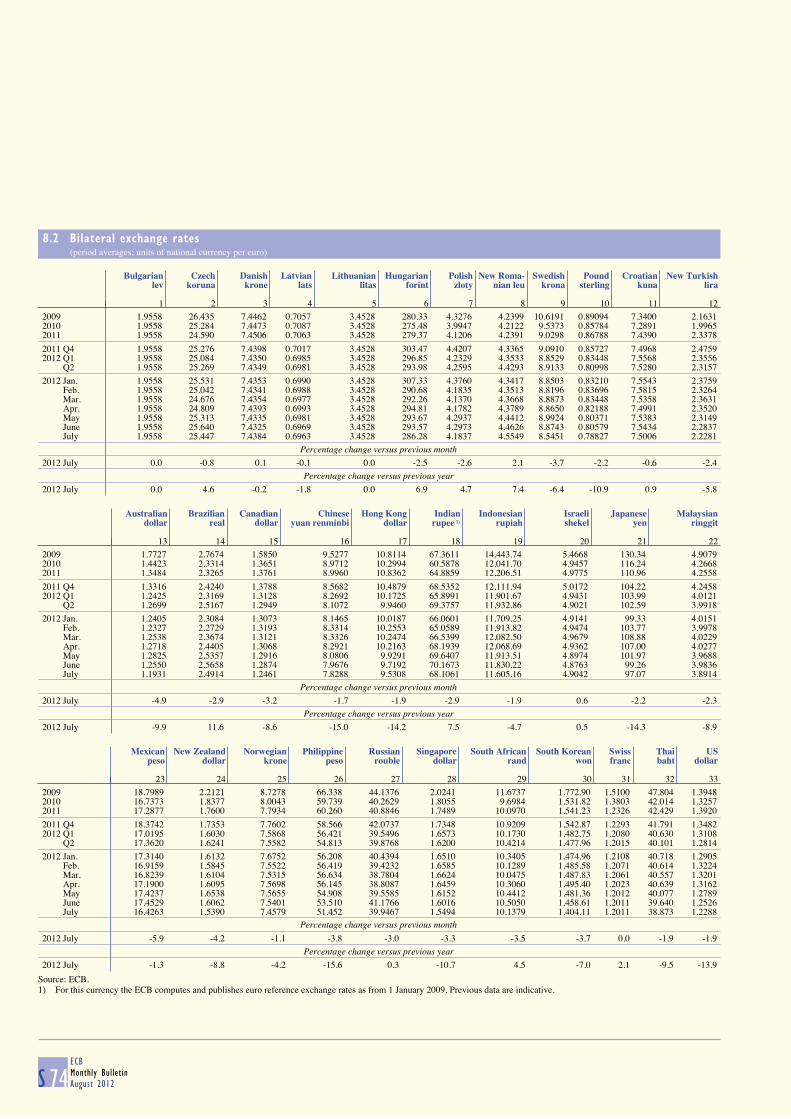
8.2 Bilateral exchange rates (period averages; units of national currency per euro)
S 74ECBMonthly BulletinAugust 2012
Bulgarian Czech Danish Latvian Lithuanian Hungarian Polish New Roma- Swedish Pound Croatian New Turkishlev koruna krone lats litas forint zloty nian leu krona sterling kuna lira
1 2 3 4 5 6 7 8 9 10 11 12
2009 1.9558 26.435 7.4462 0.7057 3.4528 280.33 4.3276 4.2399 10.6191 0.89094 7.3400 2.16312010 1.9558 25.284 7.4473 0.7087 3.4528 275.48 3.9947 4.2122 9.5373 0.85784 7.2891 1.99652011 1.9558 24.590 7.4506 0.7063 3.4528 279.37 4.1206 4.2391 9.0298 0.86788 7.4390 2.3378
2011 Q4 1.9558 25.276 7.4398 0.7017 3.4528 303.47 4.4207 4.3365 9.0910 0.85727 7.4968 2.47592012 Q1 1.9558 25.084 7.4350 0.6985 3.4528 296.85 4.2329 4.3533 8.8529 0.83448 7.5568 2.3556 Q2 1.9558 25.269 7.4349 0.6981 3.4528 293.98 4.2595 4.4293 8.9133 0.80998 7.5280 2.3157
2012 Jan. 1.9558 25.531 7.4353 0.6990 3.4528 307.33 4.3760 4.3417 8.8503 0.83210 7.5543 2.3759 Feb. 1.9558 25.042 7.4341 0.6988 3.4528 290.68 4.1835 4.3513 8.8196 0.83696 7.5815 2.3264 Mar. 1.9558 24.676 7.4354 0.6977 3.4528 292.26 4.1370 4.3668 8.8873 0.83448 7.5358 2.3631 Apr. 1.9558 24.809 7.4393 0.6993 3.4528 294.81 4.1782 4.3789 8.8650 0.82188 7.4991 2.3520 May 1.9558 25.313 7.4335 0.6981 3.4528 293.67 4.2937 4.4412 8.9924 0.80371 7.5383 2.3149 June 1.9558 25.640 7.4325 0.6969 3.4528 293.57 4.2973 4.4626 8.8743 0.80579 7.5434 2.2837 July 1.9558 25.447 7.4384 0.6963 3.4528 286.28 4.1837 4.5549 8.5451 0.78827 7.5006 2.2281
Percentage change versus previous month
2012 July 0.0 -0.8 0.1 -0.1 0.0 -2.5 -2.6 2.1 -3.7 -2.2 -0.6 -2.4
Percentage change versus previous year
2012 July 0.0 4.6 -0.2 -1.8 0.0 6.9 4.7 7.4 -6.4 -10.9 0.9 -5.8
Australian Brazilian Canadian Chinese Hong Kong Indian Indonesian Israeli Japanese Malaysiandollar real dollar yuan renminbi dollar rupee 1) rupiah shekel yen ringgit
13 14 15 16 17 18 19 20 21 22
2009 1.7727 2.7674 1.5850 9.5277 10.8114 67.3611 14,443.74 5.4668 130.34 4.90792010 1.4423 2.3314 1.3651 8.9712 10.2994 60.5878 12,041.70 4.9457 116.24 4.26682011 1.3484 2.3265 1.3761 8.9960 10.8362 64.8859 12,206.51 4.9775 110.96 4.2558
2011 Q4 1.3316 2.4240 1.3788 8.5682 10.4879 68.5352 12,111.94 5.0172 104.22 4.24582012 Q1 1.2425 2.3169 1.3128 8.2692 10.1725 65.8991 11,901.67 4.9431 103.99 4.0121 Q2 1.2699 2.5167 1.2949 8.1072 9.9460 69.3757 11,932.86 4.9021 102.59 3.9918
2012 Jan. 1.2405 2.3084 1.3073 8.1465 10.0187 66.0601 11,709.25 4.9141 99.33 4.0151 Feb. 1.2327 2.2729 1.3193 8.3314 10.2553 65.0589 11,913.82 4.9474 103.77 3.9978 Mar. 1.2538 2.3674 1.3121 8.3326 10.2474 66.5399 12,082.50 4.9679 108.88 4.0229 Apr. 1.2718 2.4405 1.3068 8.2921 10.2163 68.1939 12,068.69 4.9362 107.00 4.0277 May 1.2825 2.5357 1.2916 8.0806 9.9291 69.6407 11,913.51 4.8974 101.97 3.9688 June 1.2550 2.5658 1.2874 7.9676 9.7192 70.1673 11,830.22 4.8763 99.26 3.9836 July 1.1931 2.4914 1.2461 7.8288 9.5308 68.1061 11,605.16 4.9042 97.07 3.8914
Percentage change versus previous month
2012 July -4.9 -2.9 -3.2 -1.7 -1.9 -2.9 -1.9 0.6 -2.2 -2.3
Percentage change versus previous year
2012 July -9.9 11.6 -8.6 -15.0 -14.2 7.5 -4.7 0.5 -14.3 -8.9
Mexican New Zealand Norwegian Philippine Russian Singapore South African South Korean Swiss Thai USpeso dollar krone peso rouble dollar rand won franc baht dollar
23 24 25 26 27 28 29 30 31 32 33
2009 18.7989 2.2121 8.7278 66.338 44.1376 2.0241 11.6737 1,772.90 1.5100 47.804 1.39482010 16.7373 1.8377 8.0043 59.739 40.2629 1.8055 9.6984 1,531.82 1.3803 42.014 1.32572011 17.2877 1.7600 7.7934 60.260 40.8846 1.7489 10.0970 1,541.23 1.2326 42.429 1.3920
2011 Q4 18.3742 1.7353 7.7602 58.566 42.0737 1.7348 10.9209 1,542.87 1.2293 41.791 1.34822012 Q1 17.0195 1.6030 7.5868 56.421 39.5496 1.6573 10.1730 1,482.75 1.2080 40.630 1.3108 Q2 17.3620 1.6241 7.5582 54.813 39.8768 1.6200 10.4214 1,477.96 1.2015 40.101 1.2814
2012 Jan. 17.3140 1.6132 7.6752 56.208 40.4394 1.6510 10.3405 1,474.96 1.2108 40.718 1.2905 Feb. 16.9159 1.5845 7.5522 56.419 39.4232 1.6585 10.1289 1,485.58 1.2071 40.614 1.3224 Mar. 16.8239 1.6104 7.5315 56.634 38.7804 1.6624 10.0475 1,487.83 1.2061 40.557 1.3201 Apr. 17.1900 1.6095 7.5698 56.145 38.8087 1.6459 10.3060 1,495.40 1.2023 40.639 1.3162 May 17.4237 1.6538 7.5655 54.908 39.5585 1.6152 10.4412 1,481.36 1.2012 40.077 1.2789 June 17.4529 1.6062 7.5401 53.510 41.1766 1.6016 10.5050 1,458.61 1.2011 39.640 1.2526 July 16.4263 1.5390 7.4579 51.452 39.9467 1.5494 10.1379 1,404.11 1.2011 38.873 1.2288
Percentage change versus previous month
2012 July -5.9 -4.2 -1.1 -3.8 -3.0 -3.3 -3.5 -3.7 0.0 -1.9 -1.9
Percentage change versus previous year
2012 July -1.3 -8.8 -4.2 -15.6 0.3 -10.7 4.5 -7.0 2.1 -9.5 -13.9
Source: ECB.1) For this currency the ECB computes and publishes euro reference exchange rates as from 1 January 2009. Previous data are indicative.

9DEVELOPMENTS OUTSIDE THE EURO AREA
9.1 Economic and financial developments in other EU Member States (annual percentage changes, unless otherwise indicated)
S 75ECB
Monthly BulletinAugust 2012
HICP
Bulgaria Czech Denmark Latvia Lithuania Hungary Poland Romania Sweden UnitedRepublic Kingdom
1 2 3 4 5 6 7 8 9 10
2010 3.0 1.2 2.2 -1.2 1.2 4.7 2.7 6.1 1.9 3.32011 3.4 2.1 2.7 4.2 4.1 3.9 3.9 5.8 1.4 4.5
2012 Q1 1.9 4.0 2.8 3.3 3.6 5.6 4.2 2.7 0.9 3.5 Q2 1.8 3.8 2.2 2.4 2.8 5.5 4.0 2.1 0.9 2.7
2012 Apr. 2.0 4.0 2.3 2.8 3.3 5.6 4.0 1.9 1.0 3.0 May 1.8 3.5 2.1 2.3 2.6 5.4 3.6 2.0 0.9 2.8 June 1.6 3.8 2.2 2.1 2.6 5.6 4.2 2.2 0.9 2.4
General government deficit (-)/surplus (+) as a percentage of GDP
2009 -4.3 -5.8 -2.7 -9.8 -9.4 -4.6 -7.4 -9.0 -0.7 -11.52010 -3.1 -4.8 -2.5 -8.2 -7.2 -4.2 -7.8 -6.8 0.3 -10.22011 -2.1 -3.1 -1.8 -3.5 -5.5 4.3 -5.1 -5.2 0.3 -8.3
General government gross debt as a percentage of GDP
2009 14.6 34.4 40.6 36.7 29.4 79.8 50.9 23.6 42.6 69.62010 16.3 38.1 42.9 44.7 38.0 81.4 54.8 30.5 39.4 79.62011 16.3 41.2 46.5 42.6 38.5 80.6 56.3 33.3 38.4 85.7
Long-term government bond yield as a percentage per annum; period average
2012 Jan. 5.30 3.39 1.74 5.74 5.35 9.51 5.68 7.02 1.70 2.04 Feb. 5.31 3.12 1.84 5.45 5.15 8.60 5.46 6.99 1.89 2.13 Mar. 5.07 3.51 1.89 5.15 5.29 8.73 5.37 6.48 1.95 2.17 Apr. 5.11 3.51 1.71 5.10 5.30 8.77 5.49 6.24 1.82 2.03 May 5.11 3.31 1.37 5.15 5.30 8.33 5.41 6.50 1.51 1.78 June 5.07 3.11 1.26 5.07 4.96 8.30 5.24 6.68 1.45 1.60
3-month interest rate as a percentage per annum; period average
2012 Jan. 3.34 1.17 1.01 1.79 1.48 8.54 4.99 5.26 2.61 1.09 Feb. 3.19 1.20 1.00 1.31 1.43 8.83 4.97 4.79 2.44 1.07 Mar. 2.91 1.23 0.99 1.19 1.31 - 4.95 4.25 2.30 1.04 Apr. 2.71 1.24 0.97 1.00 1.28 8.19 4.94 4.12 2.19 1.02 May 2.59 1.24 0.90 0.94 1.24 8.22 5.05 4.69 2.14 1.00 June 2.45 1.21 0.62 0.90 1.20 - 5.12 5.10 2.14 0.95
Real GDP
2010 0.4 2.7 1.3 -0.3 1.4 1.3 3.9 -1.7 6.2 1.82011 1.7 1.7 0.8 5.5 5.9 1.6 4.3 2.5 3.9 0.8
2011 Q4 0.9 0.6 0.1 5.7 5.2 1.2 4.2 2.1 1.2 0.62012 Q1 0.5 -0.7 0.4 5.6 3.9 -1.4 3.8 0.8 1.6 -0.2 Q2 . . . . 2.7 . . . 2.2 -0.8
Current and capital account balance as a percentage of GDP
2010 -0.2 -3.0 5.6 4.9 4.2 3.0 -2.8 -4.2 6.7 -3.12011 2.2 -2.5 6.9 0.9 0.9 3.6 -2.1 -4.1 6.9 -1.7
2011 Q3 11.9 -5.7 8.4 0.8 5.7 4.4 -3.3 -4.3 8.6 -3.1 Q4 -4.1 -0.6 6.2 2.6 -1.6 3.2 -1.5 -1.8 4.6 -1.52012 Q1 -5.2 4.0 3.1 -2.9 -8.8 3.1 -3.5 -0.7 8.0 -2.9
Gross external debt as a percentage of GDP
2010 102.8 56.5 191.3 165.4 87.4 144.0 66.0 75.8 191.3 413.12011 92.0 58.4 183.2 145.9 80.8 145.9 72.7 73.5 195.2 421.3
2011 Q3 93.3 57.9 183.7 151.4 82.0 147.1 73.5 76.9 196.4 432.8 Q4 92.0 58.4 183.2 145.9 80.8 145.9 72.7 73.5 195.2 421.32012 Q1 93.2 59.1 185.2 145.3 85.4 135.4 70.7 74.2 194.5 417.5
Unit labour costs
2010 5.6 -0.7 -1.0 -9.8 -7.3 -3.2 1.3 7.9 -1.9 1.22011 1.1 1.0 0.5 2.1 -0.2 3.8 0.5 1.7 -0.8 1.7
2011 Q3 3.1 0.9 1.2 1.9 -0.9 4.5 1.7 3.9 -0.5 2.1 Q4 4.8 1.6 1.8 1.7 3.1 3.0 -0.1 0.3 0.5 2.92012 Q1 1.9 4.7 1.0 -0.2 5.0 5.0 1.3 4.5 1.7 4.5
Standardised unemployment rate as a percentage of labour force (s.a.)
2010 10.3 7.3 7.5 19.8 17.8 11.1 9.6 7.3 8.4 7.82011 11.3 6.7 7.6 16.3 15.4 10.9 9.7 7.4 7.5 8.0
2012 Q1 12.0 6.8 7.5 15.3 13.6 11.0 9.9 7.2 7.5 8.2 Q2 12.3 6.7 7.8 . 13.6 10.9 9.9 7.6 7.6 .
2012 Apr. 12.2 6.7 7.7 . 13.6 10.7 9.9 7.4 7.4 8.1 May 12.2 6.7 7.8 . 13.6 10.9 9.9 7.7 7.8 . June 12.4 6.7 8.0 . 13.7 11.0 10.0 7.6 7.5 .
Sources: ECB, European Commission (Economic and Financial Affairs DG and Eurostat), national data, Thomson Reuters and ECB calculations.
9
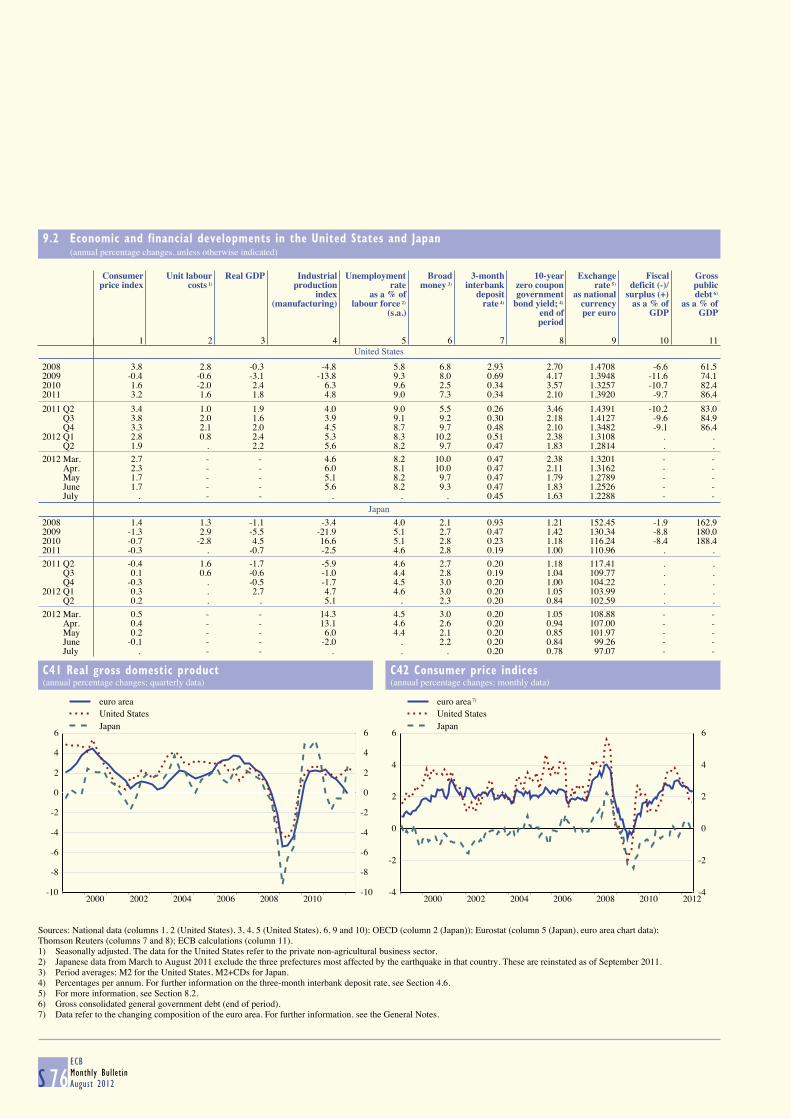
9.2 Economic and financial developments in the United States and Japan (annual percentage changes, unless otherwise indicated)
S 76ECBMonthly BulletinAugust 2012
United States
Consumer Unit labour Real GDP Industrial Unemployment Broad 3-month 10-year Exchange Fiscal Grossprice index costs 1) production rate money 3) interbank zero coupon rate 5) deficit (-)/ public
index as a % of deposit government as national surplus (+) debt 6)
(manufacturing) labour force 2) rate 4) bond yield; 4) currency as a % of as a % of(s.a.) end of per euro GDP GDP
period
1 2 3 4 5 6 7 8 9 10 11
2008 3.8 2.8 -0.3 -4.8 5.8 6.8 2.93 2.70 1.4708 -6.6 61.52009 -0.4 -0.6 -3.1 -13.8 9.3 8.0 0.69 4.17 1.3948 -11.6 74.12010 1.6 -2.0 2.4 6.3 9.6 2.5 0.34 3.57 1.3257 -10.7 82.42011 3.2 1.6 1.8 4.8 9.0 7.3 0.34 2.10 1.3920 -9.7 86.4
2011 Q2 3.4 1.0 1.9 4.0 9.0 5.5 0.26 3.46 1.4391 -10.2 83.0 Q3 3.8 2.0 1.6 3.9 9.1 9.2 0.30 2.18 1.4127 -9.6 84.9 Q4 3.3 2.1 2.0 4.5 8.7 9.7 0.48 2.10 1.3482 -9.1 86.42012 Q1 2.8 0.8 2.4 5.3 8.3 10.2 0.51 2.38 1.3108 . . Q2 1.9 . 2.2 5.6 8.2 9.7 0.47 1.83 1.2814 . .
2012 Mar. 2.7 - - 4.6 8.2 10.0 0.47 2.38 1.3201 - - Apr. 2.3 - - 6.0 8.1 10.0 0.47 2.11 1.3162 - - May 1.7 - - 5.1 8.2 9.7 0.47 1.79 1.2789 - - June 1.7 - - 5.6 8.2 9.3 0.47 1.83 1.2526 - - July . - - . . . 0.45 1.63 1.2288 - -
Japan
2008 1.4 1.3 -1.1 -3.4 4.0 2.1 0.93 1.21 152.45 -1.9 162.92009 -1.3 2.9 -5.5 -21.9 5.1 2.7 0.47 1.42 130.34 -8.8 180.02010 -0.7 -2.8 4.5 16.6 5.1 2.8 0.23 1.18 116.24 -8.4 188.42011 -0.3 . -0.7 -2.5 4.6 2.8 0.19 1.00 110.96 . .
2011 Q2 -0.4 1.6 -1.7 -5.9 4.6 2.7 0.20 1.18 117.41 . . Q3 0.1 0.6 -0.6 -1.0 4.4 2.8 0.19 1.04 109.77 . . Q4 -0.3 . -0.5 -1.7 4.5 3.0 0.20 1.00 104.22 . . 2012 Q1 0.3 . 2.7 4.7 4.6 3.0 0.20 1.05 103.99 . . Q2 0.2 . . 5.1 . 2.3 0.20 0.84 102.59 . .
2012 Mar. 0.5 - - 14.3 4.5 3.0 0.20 1.05 108.88 - - Apr. 0.4 - - 13.1 4.6 2.6 0.20 0.94 107.00 - - May 0.2 - - 6.0 4.4 2.1 0.20 0.85 101.97 - - June -0.1 - - -2.0 . 2.2 0.20 0.84 99.26 - - July . - - . . . 0.20 0.78 97.07 - -
C41 Real gross domestic product
(annual percentage changes; quarterly data)
C42 Consumer price indices
(annual percentage changes; monthly data)
-10
-8
-6
-4
-2
0
2
4
6
2000 2002 2004 2006 2008 2010-10
-8
-6
-4
-2
0
2
4
6
euro areaUnited StatesJapan
-4
-2
0
2
4
6
2000 2002 2004 2006 2008 2010 2012-4
-2
0
2
4
6
euro areaUnited StatesJapan
Sources: National data (columns 1, 2 (United States), 3, 4, 5 (United States), 6, 9 and 10); OECD (column 2 (Japan)); Eurostat (column 5 (Japan), euro area chart data);Thomson Reuters (columns 7 and 8); ECB calculations (column 11).1) Seasonally adjusted. The data for the United States refer to the private non-agricultural business sector.2) Japanese data from March to August 2011 exclude the three prefectures most affected by the earthquake in that country. These are reinstated as of September 2011.3) Period averages; M2 for the United States, M2+CDs for Japan.4) Percentages per annum. For further information on the three-month interbank deposit rate, see Section 4.6.5) For more information, see Section 8.2.6) Gross consolidated general government debt (end of period).7) Data refer to the changing composition of the euro area. For further information, see the General Notes.
7)
S 77ECB
Monthly Bulletin
August 2012
LIST OF CHARTS
C1 Monetary aggregates S12
C2 Counterparts S12
C3 Components of monetary aggregates S13
C4 Components of longer-term fi nancial liabilities S13
C5 Loans to other fi nancial intermediaries and non-fi nancial corporations S14
C6 Loans to households S14
C7 Loans to government S16
C8 Loans to non-euro area residents S16
C9 Total deposits by sector (fi nancial intermediaries) S17
C10 Total deposits and deposits included in M3 by sector (fi nancial intermediaries) S17
C11 Total deposits by sector (non-fi nancial corporations and households) S18
C12 Total deposits and deposits included in M3 by sector (non-fi nancial corporations and households) S18
C13 Deposits by government and non-euro area residents S19
C14 MFI holdings of securities S20
C15 Total outstanding amounts and gross issues of securities other than shares issued by euro area residents S35
C16 Net issues of securities other than shares: seasonally adjusted and non-seasonally adjusted S37
C17 Annual growth rates of long-term debt securities, by sector of the issuer, in all currencies combined S38
C18 Annual growth rates of short-term debt securities, by sector of the issuer, in all currencies combined S39
C19 Annual growth rates for quoted shares issued by euro area residents S40
C20 Gross issues of quoted shares by sector of the issuer S41
C21 New deposits with an agreed maturity S43
C22 New loans with a fl oating rate and up to 1 year’s initial rate fi xation S43
C23 Euro area money market rates S44
C24 3-month money market rates S44
C25 Euro area spot yield curves S45
C26 Euro area spot rates and spreads S45
C27 Dow Jones EURO STOXX broad index, Standard & Poor’s 500 and Nikkei 225 S46
C28 Employment – persons employed and hours worked S55
C29 Unemployment and job vacancy rates S55
C30 Defi cit, borrowing requirement and change in debt S60
C31 Maastricht debt S60
C32 Euro area b.o.p: current account S61
C33 Euro area b.o.p: direct and portfolio investment S61
C34 Euro area b.o.p: goods S62
C35 Euro area b.o.p: services S62
C36 Euro area international investment position S65
C37 Euro area direct and portfolio investment position S65
C38 Main b.o.p. items mirroring developments in MFI net external transactions S70
C39 Effective exchange rates S73
C40 Bilateral exchange rates S73
C41 Real gross domestic product S76
C42 Consumer price indices S76

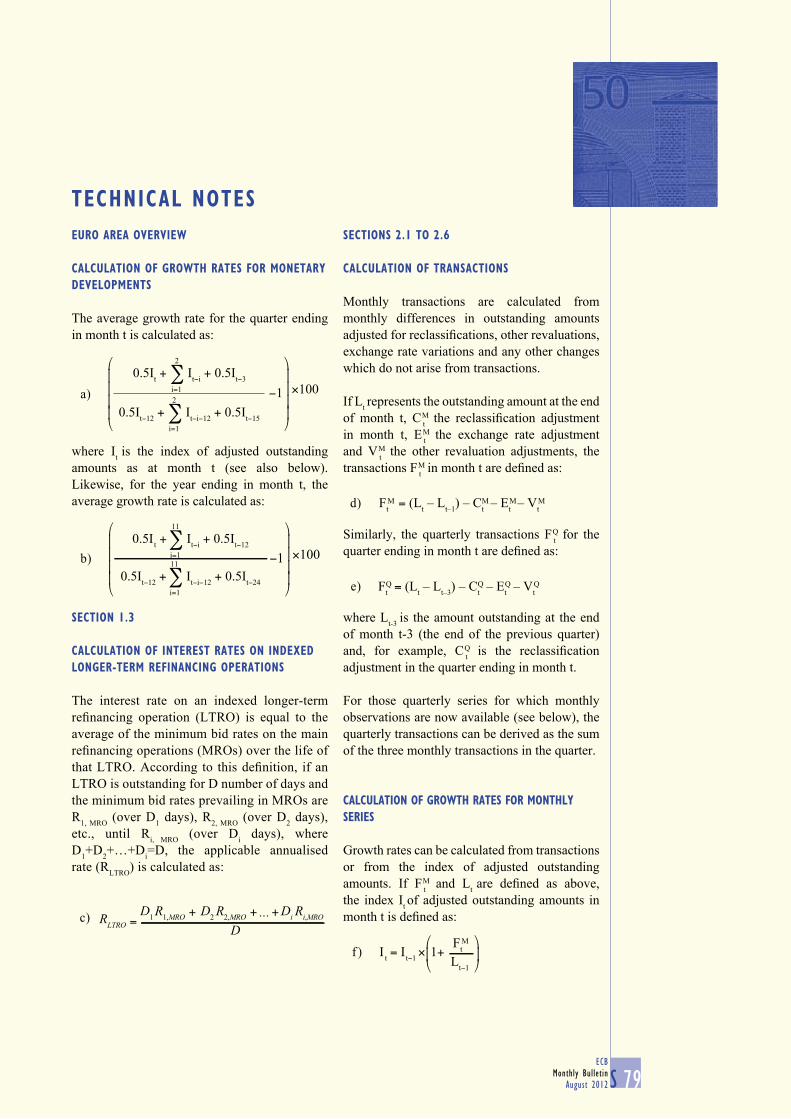
ECB
Monthly Bulletin
August 2012 S 79
TECHNICAL NOTES
EURO AREA OVERVIEW
CALCULATION OF GROWTH RATES FOR MONETARY
DEVELOPMENTS
The average growth rate for the quarter ending
in month t is calculated as:
where It is the index of adjusted outstanding
amounts as at month t (see also below).
Likewise, for the year ending in month t, the
average growth rate is calculated as:
SECTION 1.3
CALCULATION OF INTEREST RATES ON INDEXED
LONGER-TERM REFINANCING OPERATIONS
The interest rate on an indexed longer-term
refi nancing operation (LTRO) is equal to the
average of the minimum bid rates on the main
refi nancing operations (MROs) over the life of
that LTRO. According to this defi nition, if an
LTRO is outstanding for D number of days and
the minimum bid rates prevailing in MROs are
R1, MRO
(over D1 days), R
2, MRO (over D
2 days),
etc., until Ri, MRO
(over Di days), where
D1+D
2+…+D
i=D, the applicable annualised
rate (RLTRO
) is calculated as:
SECTIONS 2.1 TO 2.6
CALCULATION OF TRANSACTIONS
Monthly transactions are calculated from
monthly differences in outstanding amounts
adjusted for reclassifi cations, other revaluations,
exchange rate variations and any other changes
which do not arise from transactions.
If Lt represents the outstanding amount at the end
of month t, C t
M the reclassifi cation adjustment
in month t, E t
M the exchange rate adjustment
and V t
M the other revaluation adjustments, the
transactions F t
M in month t are defi ned as:
Similarly, the quarterly transactions F t
Q for the
quarter ending in month t are defi ned as:
where Lt-3
is the amount outstanding at the end
of month t-3 (the end of the previous quarter)
and, for example, C t
Q is the reclassifi cation
adjustment in the quarter ending in month t.
For those quarterly series for which monthly
observations are now available (see below), the
quarterly transactions can be derived as the sum
of the three monthly transactions in the quarter.
CALCULATION OF GROWTH RATES FOR MONTHLY
SERIES
Growth rates can be calculated from transactions
or from the index of adjusted outstanding
amounts. If F t
M and Lt are defi ned as above,
the index It of adjusted outstanding amounts in
month t is defi ned as:
−1
⎞
⎠
⎟⎟⎟⎟
⎞
⎠
⎟⎟⎟⎟
×100
0.5It−12 + ∑ It−i−12 + 0.5It−15
2
i=1
0.5It + ∑ It−i + 0.5It−3
2
i=1a)
⎞
⎠
⎟⎟⎟⎟
⎞
⎠
⎟⎟⎟⎟
−1 ×1000.5It + ∑ It−i + 0.5It−12
11
i=1
0.5It−12 + ∑ It−i−12 + 0.5It−24
11
i=1
b)
Ft = (Lt – Lt–1) – Ct – Et – VtM M M Md)
I t = It−1 ×Ft
Lt−1
M⎛
⎝⎜
⎞
⎠⎟1+f )
RLTRO =D
1R
1,MRO + D2R
2,MRO + + Di Ri,MRO
D. . .c)
Ft = (Lt – Lt–3) – Ct – Et – VtQ Q Q Qe)
ECB
Monthly Bulletin
August 2012S 80
The base of the index (for the non-seasonally
adjusted series) is currently set as December
2008 = 100. Time series for the index of adjusted
outstanding amounts are available on the ECB’s
website (www.ecb.europa.eu) in the “Monetary
and fi nancial statistics” sub-section of the
“Statistics” section.
The annual growth rate at for month t – i.e. the
change in the 12 months ending in month t – can
be calculated using either of the following
two formulae:
Unless otherwise indicated, the annual growth
rates refer to the end of the indicated period.
For example, the annual percentage change for
the year 2002 is calculated in h) by dividing
the index for December 2002 by the index for
December 2001.
Growth rates for intra-annual periods can be
derived by adapting formula h). For example,
the month-on-month growth rate aM
t can be
calculated as:
Finally, the three-month moving average
(centred) for the annual growth rate of M3 is
obtained as (at+1
+ at + a
t-1)/3, where a
t is defi ned
as in g) or h) above.
CALCULATION OF GROWTH RATES FOR
QUARTERLY SERIES
If F t
Q and Lt-3
are defi ned as above, the index It
of adjusted outstanding amounts for the quarter
ending in month t is defi ned as:
The annual growth rate in the four quarters
ending in month t (i.e. at) can be calculated
using formula h).
SEASONAL ADJUSTMENT OF THE EURO AREA
MONETARY STATISTICS 1
The approach used is based on multiplicative
decomposition using X-12-ARIMA.2 The
seasonal adjustment may include a day-of-the-
week adjustment, and for some series it is carried
out indirectly by means of a linear combination
of components. This is the case for M3, which is
derived by aggregating the seasonally adjusted
series for M1, M2 less M1, and M3 less M2.
The seasonal adjustment procedures are fi rst
applied to the index of adjusted outstanding
amounts.3 The resulting estimates of seasonal
factors are then applied to the levels and to the
adjustments arising from reclassifi cations and
revaluations, in turn yielding seasonally adjusted
transactions. Seasonal (and trading day) factors
are revised at annual intervals or as required.
at =Ft−i
Lt−1−i
M
i=0
⎛
⎝⎜
⎞
⎠⎟
⎡
⎣⎢
⎤
⎦⎥×100∏ 1 + −1
11
g)
at =It
It−12
⎛⎝⎜
⎞⎠⎟× 100−1h)
ItIt−1
at =M −1
⎛
⎝⎜
⎞
⎠⎟ ×100i)
It = It−3 ×⎛
⎝⎜
⎞
⎠⎟Lt−3
FtQ
1+j)
For details, see “Seasonal adjustment of monetary aggregates and 1
HICP for the euro area”, ECB (August 2000) and the “Monetary
and fi nancial statistics” sub-section of the “Statistics” section of
the ECB’s website (www.ecb.europa. eu).
For details, see Findley, D., Monsell, B., Bell, W., Otto, M. 2
and Chen, B. C. (1998), “New Capabilities and Methods of
the X-12-ARIMA Seasonal Adjustment Program”, Journal
of Business and Economic Statistics, 16, 2, pp.127-152, or
“X-12-ARIMA Reference Manual”, Time Series Staff, Bureau
of the Census, Washington, D.C.
For internal purposes, the model-based approach of
TRAMO-SEATS is also used. For details of TRAMO-SEATS,
see Gomez, V. and Maravall, A. (1996), “Programs TRAMO and
SEATS: Instructions for the User”, Banco de España, Working
Paper No 9628, Madrid.
It follows that for the seasonally adjusted series, the level of the 3
index for the base period (i.e. December 2008) generally differs
from 100, refl ecting the seasonality of that month.
ECB
Monthly Bulletin
August 2012 S 81
EURO AREASTATISTICS
Technical Notes
SECTIONS 3.1 TO 3.5
EQUALITY OF USES AND RESOURCES
In Section 3.1 the data conform to a basic
accounting identity. For non-fi nancial
transactions, total uses equal total resources
for each transaction category. This accounting
identity is also refl ected in the fi nancial
account – i.e. for each fi nancial instrument
category, total transactions in fi nancial assets
equal total transactions in liabilities. In the
other changes in assets account and the fi nancial
balance sheets, total fi nancial assets equal total
liabilities for each fi nancial instrument category,
with the exception of monetary gold and special
drawing rights, which are by defi nition not a
liability of any sector.
CALCULATION OF BALANCING ITEMS
The balancing items at the end of each account
in Sections 3.1, 3.2 and 3.3 are computed as
follows.
The trade balance equals euro area imports
minus exports vis-à-vis the rest of the world for
goods and services.
Net operating surplus and mixed income
is defi ned for resident sectors only and is
calculated as gross value added (gross domestic
product at market prices for the euro area) minus
compensation of employees (uses) minus other
taxes less subsidies on production (uses) minus
consumption of fi xed capital (uses).
Net national income is defi ned for resident
sectors only and is computed as net operating
surplus and mixed income plus compensation of
employees (resources) plus taxes less subsidies
on production (resources) plus net property
income (resources minus uses).
Net disposable income is also defi ned only
for resident sectors and equals net national
income plus net current taxes on income and
wealth (resources minus uses) plus net social
contributions (resources minus uses) plus net
social benefi ts other than social transfers in kind
(resources minus uses) plus net other current
transfers (resources minus uses).
Net saving is defi ned for resident sectors and
is calculated as net disposable income plus
the net adjustment for the change in the net
equity of households in pension fund reserves
(resources minus uses) minus fi nal consumption
expenditure (uses). For the rest of the world, the
current external account is compiled as the trade
balance plus all net income (resources minus
uses).
Net lending/net borrowing is computed
from the capital account as net saving plus
net capital transfers (resources minus uses)
minus gross capital formation (uses) minus
acquisitions less disposals of non-produced
non-fi nancial assets (uses) plus consumption
of fi xed capital (resources). It can also be
calculated in the fi nancial account as total
transactions in fi nancial assets minus total
transactions in liabilities (also known as
changes in net fi nancial worth (wealth)
due to transactions). For the household and
non-fi nancial corporation sectors, there is a
statistical discrepancy between the balancing
items computed from the capital account and
the fi nancial account.
Changes in net fi nancial worth (wealth) due to
transactions are computed as total transactions
in fi nancial assets minus total transactions in
liabilities, whereas other changes in net fi nancial
worth (wealth) are calculated as (total) other
changes in fi nancial assets minus (total) other
changes in liabilities.
Net fi nancial worth (wealth) is calculated as
total fi nancial assets minus total liabilities,
whereas changes in net fi nancial worth (wealth)
are equal to the sum of changes in net fi nancial
worth (wealth) due to transactions (lending/net
borrowing from the fi nancial account) and other
changes in net fi nancial worth (wealth).
ECB
Monthly Bulletin
August 2012S 82
Changes in net worth (wealth) are calculated
as changes in net worth (wealth) due to savings
and capital transfers plus other changes in net
fi nancial worth (wealth) and other changes in
non-fi nancial assets.
The net worth (wealth) of households is
calculated as the sum of the non-fi nancial assets
and net fi nancial worth (wealth) of households.
SECTIONS 4.3 AND 4.4
CALCULATION OF GROWTH RATES FOR DEBT
SECURITIES AND QUOTED SHARES
Growth rates are calculated on the basis of
fi nancial transactions and therefore exclude
reclassifi cations, revaluations, exchange rate
variations and any other changes which do not
arise from transactions. They can be calculated
from transactions or from the index of notional
stocks. If Nt
M represents the transactions
(net issues) in month t and Lt the level outstanding
at the end of month t, the index It of notional
stocks in month t is defi ned as:
As a base, the index is set equal to 100 in
December 2008. The growth rate at for month t,
corresponding to the change in the 12 months
ending in month t, can be calculated using either
of the following two formulae:
The method used to calculate the growth rates
for securities other than shares is the same as
that used for the monetary aggregates, the only
difference being that an “N” is used instead of
an “F”. This is to show that the method used to
obtain “net issues” for securities issues statistics
differs from that used to calculate equivalent
“transactions” for the monetary aggregates.
The average growth rate for the quarter ending
in month t is calculated as:
where It is the index of notional stocks as at
month t. Likewise, for the year ending in month t,
the average growth rate is calculated as:
The calculation formula used for Section 4.3 is
also used for Section 4.4 and is likewise based on
that used for the monetary aggregates. Section 4.4
is based on market values, and the calculations
are based on fi nancial transactions, which
exclude reclassifi cations, revaluations and any
other changes that do not arise from transactions.
Exchange rate variations are not included, as all
quoted shares covered are denominated in euro.
SEASONAL ADJUSTMENT OF SECURITIES ISSUES
STATISTICS 4
The approach used is based on multiplicative
decomposition using X-12-ARIMA. The seasonal
adjustment of total securities issues is carried out
indirectly by means of a linear combination of
sector and maturity component breakdowns.
The seasonal adjustment procedures are applied
to the index of notional stocks. The resulting
estimates of seasonal factors are then applied to
the outstanding amounts, from which seasonally
I t = It−1 ×Nt
Lt−1
⎛
⎝⎜
⎞
⎠⎟1+k)
at =Nt−i
Lt−1−i
M
i=0
⎛
⎝⎜
⎞
⎠⎟
⎡
⎣⎢
⎤
⎦⎥×100∏ 1 + −1
11
l)
at =It
It−12
⎛⎝⎜
⎞⎠⎟×100−1m)
−1
⎞
⎠
⎟⎟⎟⎟
⎞
⎠
⎟⎟⎟⎟
×1002
0.5It−12 + ∑ It−i−12 + 0.5It−15i=1
0.5It + ∑ It−i + 0.5It−3
2
i=1n)
⎞
⎠
⎟⎟⎟⎟
⎞
⎠
⎟⎟⎟⎟
−1 ×1000.5It + ∑ It−i + 0.5It−12
11
i=1
0.5It−12 + ∑ It−i−12 + 0.5It−24
11
i=1
o)
For details, see “Seasonal adjustment of monetary aggregates and 4
HICP for the euro area”, ECB (August 2000) and the “Monetary
and fi nancial statistics” sub-section of the “Statistics” section of
the ECB’s website (www.ecb.europa.eu).
ECB
Monthly Bulletin
August 2012 S 83
EURO AREASTATISTICS
Technical Notes
adjusted net issues are derived. Seasonal factors
are revised at annual intervals or as required.
As in formulae l) and m), the growth rate at for
month t, corresponding to the change in the six
months ending in month t, can be calculated
using either of the following two formulae:
TABLE 1 IN SECTION 5.1
SEASONAL ADJUSTMENT OF THE HICP 4
The approach used is based on multiplicative
decomposition using X-12-ARIMA (see
footnote 2 on page S80). The seasonal
adjustment of the overall HICP for the euro
area is carried out indirectly by aggregating
the seasonally adjusted euro area series for
processed food, unprocessed food, industrial
goods excluding energy, and services. Energy
is added without adjustment, since there is no
statistical evidence of seasonality. Seasonal
factors are revised at annual intervals or as
required.
TABLE 2 IN SECTION 7.1
SEASONAL ADJUSTMENT OF THE BALANCE
OF PAYMENTS CURRENT ACCOUNT
The approach used is based on multiplicative
decomposition, using X-12-ARIMA or
TRAMO-SEATS depending on the item.
The raw data for goods, services, income and
current transfers are pre-adjusted in order to take
into account signifi cant working day effects.
The working day adjustment for goods and
services takes account of national public holidays.
The seasonal adjustment of these items is carried
out using these pre-adjusted series. The seasonal
adjustment of the total current account is carried
out by aggregating the seasonally adjusted euro
area series for goods, services, income and current
transfers. Seasonal (and trading day) factors are
revised at biannual intervals or as required.
SECTION 7.3
CALCULATION OF GROWTH RATES FOR THE
QUARTERLY AND ANNUAL SERIES
The annual growth rate for quarter t is calculated
on the basis of quarterly transactions (Ft) and
positions (Lt) as follows:
The growth rate for the annual series is equal to
the growth rate in the last quarter of the year.
at =Nt−i
Lt−1−i
M
i=0
⎛
⎝⎜
⎞
⎠⎟
⎡
⎣⎢
⎤
⎦⎥×100∏ 1 + −1
5
p)
at =ItIt−6
⎛⎝⎜
⎞⎠⎟×100−1q)
at
t
= ×100⎛⎝⎜
⎛⎝⎜
⎞⎠⎟
⎞⎠⎟
i=t–3∏ 1 + Fi
Li–l
— −1r)

ECB
Monthly Bulletin
August 2012 S 85
The “Euro area statistics” section of the
Monthly Bulletin focuses on statistics for the
euro area as a whole. More detailed and longer
runs of data, with further explanatory notes, are
available in the “Statistics” section of the ECB’s
website (www.ecb.europa.eu). This allows user-
friendly access to data via the ECB’s Statistical
Data Warehouse (http://sdw.ecb.europa.eu),
which includes search and download facilities.
Further services available in the “Data services”
sub-section include subscriptions to different
datasets and a repository of compressed Comma
Separated Value (CSV) fi les. For further
information, please contact us at: statistics@
ecb.europa.eu.
In general, the cut-off date for the statistics
included in the Monthly Bulletin is the day
preceding the Governing Council of the ECB’s
fi rst meeting of the month. For this issue,
the cut-off date was 1 August 2012.
Unless otherwise indicated, all data series
including observations for 2011 relate to the
“Euro 17” (i.e. the euro area including Estonia)
for the whole time series. For interest rates,
monetary statistics, the HICP and reserve assets
(and, for consistency reasons, the components
and counterparts of M3 and the components
of the HICP), euro area statistical series take
into account the changing composition of the
euro area.
The composition of the euro area has changed a
number of times over the years. When the euro
was introduced in 1999, the euro area comprised
the following 11 countries (the Euro 11):
Belgium, Germany, Ireland, Spain, France,
Italy, Luxembourg, the Netherlands, Austria,
Portugal and Finland. Greece then joined in
2001, forming the Euro 12. Slovenia joined in
2007, forming the Euro 13; Cyprus and Malta
joined in 2008, forming the Euro 15; and
Slovakia joined in 2009, forming the Euro 16.
Finally, Estonia joined in 2011, bringing the
number of euro area countries to 17.
EURO AREA SERIES WITH A FIXED COMPOSITION
Aggregated statistical series for fi xed
compositions of the euro area relate to a given
fi xed composition for the whole time series,
regardless of the composition at the time to which
the statistics relate. For example, aggregated
series are calculated for the Euro 17 (i.e.
aggregating the data of all 17 countries currently
in the euro area) for all years, despite the fact
that the euro area has only had this composition
since 1 January 2011. Unless otherwise
indicated, the ECB’s Monthly Bulletin provides
statistical series for the current composition.
EURO AREA SERIES WITH A CHANGING
COMPOSITION
Aggregated statistical series with a changing
composition take into account the composition
of the euro area at the time to which the statistics
relate. For example, euro area statistical series
with a changing composition aggregate the data
of the Euro 11 for the period up to the end of
2000, the Euro 12 for the period from 2001 to
the end of 2006, and so on. With this approach,
each individual statistical series covers all of the
various compositions of the euro area.
For the HICP, as well as monetary aggregates
and their counterparts, annual rates of change are
compiled from chain-linked indices, with joining
countries’ series linked to the euro area series in
the December index. Thus, if a country joins the
euro area in January of a given year, annual rates
of change relate to the previous composition of
the euro area up to and including December of the
previous year, and the enlarged composition of
the euro area thereafter. Percentage changes are
calculated on the basis of a chain-linked index,
taking account of the changing composition of
the euro area. Absolute changes for monetary
aggregates and their counterparts (transactions)
refer to the composition of the euro area at the
time to which the statistics relate.
GENERAL NOTES
ECB
Monthly Bulletin
August 2012S 86
Given that the composition of the European
currency unit (ECU) does not coincide with the
former currencies of the countries that have
adopted the single currency, pre-1999 amounts
originally expressed in the participating
currencies and converted into ECU at current
ECU exchange rates are affected by movements
in the currencies of EU Member States that have
not adopted the euro. To avoid this effect on the
monetary statistics, pre-1999 data 1 are expressed
in units converted from national currencies at
the irrevocable euro exchange rates established
on 31 December 1998. Unless otherwise
indicated, price and cost statistics before 1999
are based on data expressed in national
currency terms.
Methods of aggregation and/or consolidation
(including cross-country consolidation) have
been used where appropriate.
Recent data are often provisional and may be
revised. Discrepancies between totals and their
components may arise from rounding.
The group “Other EU Member States” comprises
Bulgaria, the Czech Republic, Denmark, Latvia,
Lithuania, Hungary, Poland, Romania, Sweden
and the United Kingdom.
In most cases, the terminology used within the
tables follows international standards, such
as those contained in the European System of
Accounts 1995 and the IMF Balance of Payments
Manual. Transactions refer to voluntary
exchanges (measured directly or derived), while
fl ows also encompass changes in outstanding
amounts owing to price and exchange rate
changes, write-offs and other changes.
In the tables, the wording “up to (x) years”
means “up to and including (x) years”.
OVERVIEW
Developments in key indicators for the euro area
are summarised in an overview table.
MONETARY POLICY STATISTICS
Section 1.4 shows statistics on minimum reserve
and liquidity factors. Maintenance periods for
minimum reserve requirements start every month
on the settlement day of the main refi nancing
operation (MRO) following the Governing
Council meeting for which the monthly
assessment of the monetary policy stance is
scheduled. They end on the day preceding the
corresponding settlement day in the following
month. Annual/quarterly observations refer to
averages for the last reserve maintenance period
of the year/quarter.
Table 1 in Section 1.4 shows the components
of the reserve base of credit institutions
subject to reserve requirements. Liabilities
vis-à-vis other credit institutions subject to the
ESCB’s minimum reserve system, the ECB
and participating national central banks are
excluded from the reserve base. When a credit
institution cannot provide evidence of the
amount of its issues of debt securities with a
maturity of up to two years which are held by
the institutions mentioned above, it may deduct
a certain percentage of these liabilities from its
reserve base. The percentage used to calculate
the reserve base was 10% until November 1999
and has been 30% since that date.
Table 2 in Section 1.4 contains average data
for completed maintenance periods. First,
the reserve requirement of each individual
credit institution is calculated by applying the
reserve ratios for the corresponding categories
of liability to the eligible liabilities, using the
balance sheet data from the end of each calendar
month. Subsequently, each credit institution
deducts from this fi gure a lump-sum allowance
of €100,000. The resulting required reserves are
then aggregated at the euro area level (column 1).
Current account holdings (column 2) are the
Data on monetary statistics in Sections 2.1 to 2.8 are available 1
for periods prior to January 1999 on the ECB’s website (http://
www.ecb.europa.eu/stats/services/downloads/html/index.
en.html) and in the SDW (http://sdw.ecb.europa.eu/browse.
do?node=2018811).

ECB
Monthly Bulletin
August 2012 S 87
EURO AREASTATISTICS
General Notes
aggregate average daily current account holdings
of credit institutions, including those that serve
to fulfi l reserve requirements. Excess reserves
(column 3) are the average current account
holdings over the maintenance period in excess
of the required reserves. Defi ciencies (column 4)
are defi ned as the average shortfalls of current
account holdings from required reserves over
the maintenance period, computed on the basis
of those credit institutions that have not fulfi lled
their reserve requirements. The interest rate on
minimum reserves (column 5) is equal to the
average, over the maintenance period, of the
ECB’s rate (weighted according to the number
of calendar days) on the Eurosystem’s MROs
(see Section 1.3).
Table 3 in Section 1.4 shows the banking
system’s liquidity position, which is defi ned
as euro area credit institutions’ current account
holdings with the Eurosystem in euro. All
amounts are derived from the consolidated
fi nancial statement of the Eurosystem. Other
liquidity-absorbing operations (column 7)
exclude the issuance of debt certifi cates
initiated by NCBs in Stage Two of EMU. Net
other factors (column 10) represent the netted
remaining items in the consolidated fi nancial
statement of the Eurosystem. Credit institutions’
current accounts (column 11) are equal to
the difference between the sum of liquidity-
providing factors (columns 1 to 5) and the sum
of liquidity-absorbing factors (columns 6 to 10).
Base money (column 12) is calculated as the
sum of the deposit facility (column 6), banknotes
in circulation (column 8) and credit institutions’
current account holdings (column 11).
MONEY, BANKING AND OTHER FINANCIAL
CORPORATIONS
Chapter 2 shows balance sheet statistics for MFIs
and other fi nancial corporations. Other fi nancial
corporations comprise investment funds (other
than money market funds, which are part of
the MFI sector), fi nancial vehicle corporations,
insurance corporations and pension funds.
Section 2.1 shows the aggregated balance
sheet of the MFI sector, i.e. the sum of the
harmonised balance sheets of all MFIs resident
in the euro area. MFIs comprise central banks,
credit institutions as defi ned under EU law,
money market funds and other institutions
whose business it is to receive deposits and/or
close substitutes for deposits from entities other
than MFIs and, for their own account (at least
in economic terms), to grant credit and/or make
investments in securities. A complete list of
MFIs is published on the ECB’s website.
Section 2.2 shows the consolidated balance
sheet of the MFI sector, which is obtained by
netting the aggregated balance sheet positions of
MFIs in the euro area. Owing to a small amount
of heterogeneity in recording practices, the sum
of the inter-MFI positions is not necessarily
zero; the balance is shown in column 10 of
the liabilities side of Section 2.2. Section 2.3
sets out the euro area monetary aggregates
and counterparts. These are derived from the
consolidated MFI balance sheet and include
positions of non-MFIs resident in the euro area
held with MFIs resident in the euro area; they
also take account of some monetary assets/
liabilities of central government. Statistics
on monetary aggregates and counterparts are
adjusted for seasonal and trading day effects.
The external liabilities item in Sections 2.1
and 2.2 shows the holdings by non-euro area
residents of: (i) shares/units issued by money
market funds located in the euro area; and
(ii) debt securities issued with a maturity of up
to two years by MFIs located in the euro area.
In Section 2.3, however, these holdings are
excluded from the monetary aggregates and
contribute to the item “net external assets”.
Section 2.4 provides analysis, broken down
by sector, type and original maturity, of loans
granted by MFIs other than the Eurosystem
(i.e. the banking system) resident in the euro
area. Section 2.5 provides analysis, broken
down by sector and instrument, of deposits held
with the euro area banking system. Section 2.6
shows the securities held by the euro area
ECB
Monthly Bulletin
August 2012S 88
banking system, broken down by type of
issuer. Section 2.7 shows a quarterly currency
breakdown for selected MFI balance sheet
items.
Sections 2.2 to 2.6 also provide growth rates
based on those transactions in the form of annual
percentage changes.
Since 1 January 1999 statistical information has
been collected and compiled on the basis of
various ECB regulations concerning the balance
sheet of the monetary fi nancial institution sector.
Since July 2010 this has been carried out on the
basis of Regulation ECB/2008/32 2. Detailed
sector defi nitions are set out in the third edition
of the “Monetary fi nancial institutions and
markets statistics sector manual – Guidance for
the statistical classifi cation of customers” (ECB,
March 2007).
Section 2.8 shows outstanding amounts and
transactions on the balance sheet of euro area
investment funds (other than money market
funds, which are included in the MFI balance
sheet statistics). An investment fund is a
collective investment undertaking that invests
capital raised from the public in fi nancial and/
or non-fi nancial assets. A complete list of euro
area investment funds is published on the ECB’s
website. The balance sheet is aggregated, so
investment funds’ assets include their holdings
of shares/units issued by other investment
funds. Shares/units issued by investment funds
are also broken down by investment policy
(i.e. into bond funds, equity funds, mixed
funds, real estate funds, hedge funds and other
funds) and by type (i.e. into open-end funds and
closed-end funds). Section 2.9 provides further
details on the main types of asset held by euro
area investment funds. This section contains
a geographical breakdown of the issuers of
securities held by investment funds, as well
as breaking issuers down by economic sector
where they are resident in the euro area.
Since December 2008 harmonised statistical
information has been collected and compiled
on the basis of Regulation ECB/2007/8 3
concerning statistics on the assets and liabilities
of investment funds. Further information on
these investment fund statistics can be found
in the “Manual on investment fund statistics”
(ECB, May 2009).
Section 2.10 shows the aggregated balance
sheet of fi nancial vehicle corporations (FVCs)
resident in the euro area. FVCs are entities which
are set up in order to carry out securitisation
transactions. Securitisation generally involves
the transfer of an asset or pool of assets to an
FVC, with such assets reported on the FVC’s
balance sheet as securitised loans, securities
other than shares, or other securitised assets.
Alternatively, the credit risk relating to an asset
or pool of assets may be transferred to an FVC
through credit default swaps, guarantees or other
such mechanisms. Collateral held by the FVC
against these exposures is typically a deposit
held with an MFI or invested in securities other
than shares. FVCs typically securitise loans
which have been originated by the MFI sector.
FVCs must report such loans on their statistical
balance sheet, regardless of whether the relevant
accounting rules allow the MFI to derecognise
the loans. Data on loans which are securitised
by FVCs but remain on the balance sheet of
the relevant MFI (and thus remain in the MFI
statistics) are provided separately. These
quarterly data are collected under Regulation
ECB/2008/30 4 as of December 2009.
Section 2.11 shows the aggregated balance sheet
of insurance corporations and pension funds
resident in the euro area. Insurance corporations
cover both the insurance and reinsurance sectors,
while pension funds include entities which have
autonomy in terms of decision-making and keep
a complete set of accounts (i.e. autonomous
pension funds). This section also contains a
geographical and sectoral breakdown of issuing
counterparties for securities other than shares
held by insurance corporations and pension
funds.
OJ L 15, 20.01.2009, p. 14.2
OJ L 211, 11.08.2007, p. 8.3
OJ L 15, 20.01.2009, p. 1.4
ECB
Monthly Bulletin
August 2012 S 89
EURO AREASTATISTICS
General Notes
EURO AREA ACCOUNTS
Section 3.1 shows quarterly integrated euro area
accounts data, which provide comprehensive
information on the economic activities of
households (including non-profi t institutions
serving households), non-fi nancial corporations,
fi nancial corporations and general government,
as well as on the interaction between these
sectors and both the euro area and the rest of the
world. Non-seasonally adjusted data at current
prices are displayed for the last available quarter,
following a simplifi ed sequence of accounts in
accordance with the methodological framework
of the European System of Accounts 1995.
In short, the sequence of accounts (transactions)
comprises: (1) the generation of income account,
which shows how production activity translates
into various categories of income; (2) the
allocation of primary income account, which
records receipts and expenses relating to various
forms of property income (for the economy as a
whole; the balancing item of the primary income
account is national income); (3) the secondary
distribution of income account, which shows
how the national income of an institutional
sector changes because of current transfers; (4)
the use of income account, which shows how
disposable income is spent on consumption or
saved; (5) the capital account, which shows how
savings and net capital transfers are spent in the
acquisition of non-fi nancial assets (the balancing
item of the capital account is net lending/
net borrowing); and (6) the fi nancial account,
which records the net acquisitions of fi nancial
assets and the net incurrence of liabilities. As
each non-fi nancial transaction is mirrored by a
fi nancial transaction, the balancing item of the
fi nancial account conceptually also equals net
lending/net borrowing as calculated from the
capital account.
In addition, opening and closing fi nancial
balance sheets are presented, which provide a
picture of the fi nancial wealth of each individual
sector at a given point in time. Finally, other
changes in fi nancial assets and liabilities
(e.g. those resulting from the impact of changes
in asset prices) are also shown.
The sectoral coverage of the fi nancial account
and the fi nancial balance sheets is more detailed
for the fi nancial corporation sector, which
is broken down into MFIs, other fi nancial
intermediaries (including fi nancial auxiliaries),
and insurance corporations and pension funds.
Section 3.2 shows four-quarter cumulated fl ows
(transactions) for the “non-fi nancial accounts”
of the euro area (i.e. accounts (1) to (5) above),
also following the simplifi ed sequence of
accounts.
Section 3.3 shows four-quarter cumulated fl ows
(transactions and other changes) for households’
income, expenditure and accumulation accounts,
as well as outstanding amounts in the fi nancial
and non-fi nancial balance sheet accounts,
presenting data in a more analytical manner.
Sector-specifi c transactions and balancing
items are arranged in a way that more clearly
depicts the fi nancing and investment decisions
of households, while respecting the accounting
identities presented in Sections 3.1 and 3.2.
Section 3.4 displays four-quarter cumulated
fl ows (transactions) for non-fi nancial
corporations’ income and accumulation
accounts, as well as outstanding amounts for the
fi nancial balance sheet accounts, presenting data
in a more analytical manner.
Section 3.5 shows four-quarter cumulated
fi nancial fl ows (transactions and other changes)
and outstanding amounts for the fi nancial
balance sheets of insurance corporations and
pension funds.
FINANCIAL MARKETS
The series on fi nancial market statistics for the
euro area cover those EU Member States that
had adopted the euro at the time to which the
statistics relate (i.e. a changing composition),
ECB
Monthly Bulletin
August 2012S 90
with the exception of statistics on securities
issues (Sections 4.1 to 4.4), which relate to the
Euro 16 for the whole time series (i.e. a fi xed
composition).
Statistics on securities other than shares and
statistics on quoted shares (Sections 4.1 to 4.4)
are produced by the ECB using data from the
ESCB and the BIS. Section 4.5 presents MFI
interest rates on euro-denominated deposits
from and loans to euro area residents. Statistics
on money market interest rates, long-term
government bond yields and stock market
indices (Sections 4.6 to 4.8) are produced by the
ECB using data from wire services.
Statistics on securities issues cover: (i) securities
other than shares, excluding fi nancial
derivatives; and (ii) quoted shares. The former
are presented in Sections 4.1, 4.2 and 4.3, while
the latter are presented in Section 4.4. Debt
securities are broken down into short-term
and long-term securities. “Short-term” means
securities with an original maturity of one year
or less (in exceptional cases, two years or less).
Securities with (i) a longer maturity, (ii) optional
maturity dates, the latest of which is more than
one year away, or (iii) indefi nite maturity dates
are classifi ed as “long-term”. Long-term debt
securities issued by euro area residents are
broken down further into fi xed and variable rate
issues. Fixed rate issues consist of issues where
the coupon rate does not change during the life
of the issue. Variable rate issues comprise all
issues where the coupon is periodically refi xed
with reference to an independent interest rate
or index. The euro-denominated securities
indicated in Sections 4.1, 4.2 and 4.3 also include
items expressed in national denominations of
the euro.
Section 4.1 shows securities other than shares,
broken down by original maturity, residency of
the issuer and currency. It presents outstanding
amounts, gross issues and net issues of
securities other than shares, broken down into:
(i) issues denominated in euro and issues in all
currencies; (ii) issues by euro area residents
and total issues; and (iii) total and long-term
maturities. Net issues differ from the changes
in outstanding amounts owing to valuation
changes, reclassifi cations and other adjustments.
This section also presents seasonally adjusted
statistics, including six-month annualised
seasonally adjusted growth rates for total and
long-term debt securities. Seasonally adjusted
data are derived from the index of notional
stocks, from which the seasonal effects have
been removed. See the Technical Notes for
details.
Section 4.2 contains a sectoral breakdown
of outstanding amounts, gross issues and net
issues for issuers resident in the euro area in line
with the ESA 95. The ECB is included in the
Eurosystem.
The total outstanding amounts for total and long-
term debt securities in column 1 of Table 1 in
Section 4.2 correspond to the data on outstanding
amounts for total and long-term debt securities
issued by euro area residents in column 7 of
Section 4.1. The outstanding amounts for total
and long-term debt securities issued by MFIs in
column 2 of Table 1 in Section 4.2 are broadly
comparable with the data on debt securities
issued on the liabilities side of the aggregated
MFI balance sheet in column 8 of Table 2 in
Section 2.1. The total net issues for total debt
securities in column 1 of Table 2 in Section 4.2
correspond to the data on total net issues by
euro area residents in column 9 of Section 4.1.
The residual difference between long-term debt
securities and total fi xed and variable rate long-
term debt securities in Table 1 of Section 4.2
consists of zero coupon bonds and revaluation
effects.
Section 4.3 shows seasonally adjusted and
non-seasonally adjusted growth rates for
debt securities issued by euro area residents
(broken down by maturity, type of instrument,
sector of the issuer and currency), which are
based on fi nancial transactions that occur
when an institutional unit incurs or redeems
liabilities. The growth rates therefore exclude
reclassifi cations, revaluations, exchange rate
variations and any other changes that do
ECB
Monthly Bulletin
August 2012 S 91
EURO AREASTATISTICS
General Notes
not arise from transactions. The seasonally
adjusted growth rates have been annualised
for presentational purposes. See the Technical
Notes for details.
Columns 1, 4, 6 and 8 in Table 1 of Section 4.4
show the outstanding amounts of quoted shares
issued by euro area residents broken down by
issuing sector. The monthly data for quoted
shares issued by non-fi nancial corporations
correspond to the quarterly series shown in
Section 3.4 (fi nancial balance sheet; quoted
shares).
Columns 3, 5, 7 and 9 in Table 1 of Section 4.4
show annual growth rates for quoted shares
issued by euro area residents (broken down by
the sector of the issuer), which are based on
fi nancial transactions that occur when an issuer
issues or redeems shares for cash, excluding
investments in the issuer’s own shares.
The calculation of annual growth rates excludes
reclassifi cations, revaluations and any other
changes that do not arise from transactions.
Section 4.5 presents statistics on all the interest
rates that MFIs resident in the euro area apply
to euro-denominated deposits and loans vis-à-
vis households and non-fi nancial corporations
resident in the euro area. Euro area MFI interest
rates are calculated as a weighted average
(by corresponding business volume) of the euro
area countries’ interest rates for each category.
MFI interest rate statistics are broken down by
type of business coverage, sector, instrument
category and maturity, period of notice or initial
period of interest rate fi xation. These MFI
interest rate statistics replaced the ten transitional
statistical series on euro area retail interest rates
that had been published in the Monthly Bulletin
as of January 1999.
Section 4.6 presents money market interest rates
for the euro area, the United States and Japan.
For the euro area, a broad spectrum of money
market interest rates is covered, ranging from
interest rates on overnight deposits to those on
twelve-month deposits. Before January 1999,
synthetic euro area interest rates were calculated
on the basis of national rates weighted by
GDP. With the exception of the overnight rate
prior to January 1999, monthly, quarterly and
yearly values are period averages. Overnight
deposits are represented by end-of-period
interbank deposit bid rates up to and including
December 1998 and period averages for the euro
overnight index average (EONIA) thereafter.
As of January 1999, euro area interest rates on
one, three, six and twelve-month deposits are
euro interbank offered rates (EURIBOR); prior
to that date, they are London interbank offered
rates (LIBOR) where available. For the United
States and Japan, interest rates on three-month
deposits are represented by LIBOR.
Section 4.7 shows end-of-period rates estimated
from nominal spot yield curves based on AAA-
rated euro-denominated bonds issued by euro
area central governments. The yield curves are
estimated using the Svensson model 5. Spreads
between the ten-year rates and the three-month
and two-year rates are also released. Additional
yield curves (daily releases, including charts and
tables) and the corresponding methodological
information are available at: http://www.ecb.
europa.eu/stats/money/yc/html/index.en.html.
Daily data can also be downloaded.
Section 4.8 shows stock market indices for the
euro area, the United States and Japan.
PRICES, OUTPUT, DEMAND AND LABOUR MARKETS
Most of the data described in this section are
produced by the European Commission (mainly
Eurostat) and national statistical authorities. Euro
area results are obtained by aggregating data
for individual countries. As far as possible, the
data are harmonised and comparable. Statistics
on labour costs indices, GDP and expenditure
components, value added by economic activity,
industrial production, retail sales passenger car
Svensson, L.E., “Estimating and Interpreting Forward Interest 5
Rates: Sweden 1992-1994”, CEPR Discussion Papers, No 1051.
Centre for Economic Policy Research, London, 1994.
ECB
Monthly Bulletin
August 2012S 92
registrations and employment in terms of hours
worked are working day-adjusted.
The Harmonised Index of Consumer Prices
(HICP) for the euro area (Table 1 in Section 5.1)
is available from 1995 onwards. It is based
on national HICPs, which follow the same
methodology in all euro area countries.
The breakdown into goods and services
components is derived from the classifi cation
of individual consumption by purpose (Coicop/
HICP). The HICP covers monetary expenditure by
households on fi nal consumption in the economic
territory of the euro area. The table includes
seasonally adjusted HICP data and experimental
HICP-based estimates of administered prices,
which are compiled by the ECB.
Industrial producer prices (Table 2 in
Section 5.1), industrial production, industrial
turnover and retail sales (Section 5.2) are covered
by Council Regulation (EC) No 1165/98 of
19 May 1998 concerning short-term statistics 6.
Since January 2009 the revised classifi cation
of economic activities (NACE Revision 2), as
covered by Regulation (EC) No 1893/2006 of
the European Parliament and of the Council of
20 December 2006 establishing the statistical
classifi cation of economic activities NACE
Revision 2 and amending Council Regulation
(EEC) No 3037/90, as well as certain
EC Regulations on specifi c statistical domains 7,
has been applied in the production of short-
term statistics. The breakdown by end use of
product for industrial producer prices and
industrial production is the harmonised
sub-division of industry excluding construction
(NACE Revision 2, sections B to E) into Main
Industrial Groupings (MIGs) as defi ned by
Commission Regulation (EC) No 656/2007
of 14 June 2007 8. Industrial producer prices
refl ect the ex-factory gate prices of producers.
They include indirect taxes except VAT and
other deductible taxes. Industrial production
refl ects the value added of the industries
concerned.
The two non-energy commodity price indices
shown in Table 3 in Section 5.1 are compiled
with the same commodity coverage, but using
two different weighting schemes: one based on
the respective commodity imports of the euro
area (columns 2-4), and the other (columns 5-7)
based on estimated euro area domestic demand,
or “use”, taking into account information on
imports, exports and the domestic production
of each commodity (ignoring, for the sake of
simplicity, inventories, which are assumed to
be relatively stable over the observed period).
The import-weighted commodity price index is
appropriate for analysing external developments,
while the use-weighted index is suitable for
the specifi c purpose of analysing international
commodity price pressures on euro area infl ation.
The use-weighted commodity price indices are
experimental data. For more details as regards
the compilation of the ECB commodity price
indices, see Box 1 in the December 2008 issue
of the Monthly Bulletin.
The labour cost indices (Table 5 in Section 5.1)
measure the changes in labour costs per hour
worked in industry (including construction) and
market services. Their methodology is laid down
in Regulation (EC) No 450/2003 of the European
Parliament and of the Council of
27 February 2003 concerning the labour cost
index 9 and in the implementing Commission
Regulation (EC) No 1216/2003 of 7 July 2003 10.
A breakdown of the labour cost indices for the
euro area is available by labour cost component
(wages and salaries, and employers’ social
contributions plus employment-related taxes
paid by the employer less subsidies received
by the employer) and by economic activity.
The ECB calculates the indicator of negotiated
wages (memo item in Table 3 of Section 5.1) on
the basis of non-harmonised, national-defi nition
data.
Unit labour cost components (Table 4 in
Section 5.1), GDP and its components (Tables 1
and 2 in Section 5.2), GDP defl ators (Table 3
OJ L 162, 5.6.1998, p. 1.6
OJ L 393, 30.12.2006, p. 1.7
OJ L 155, 15.6.2007, p. 3.8
OJ L 69, 13.3.2003, p. 1.9
OJ L 169, 8.7.2003, p. 37.10
ECB
Monthly Bulletin
August 2012 S 93
EURO AREASTATISTICS
General Notes
in Section 5.1) and employment statistics
(Tables 1, 2 and 3 in Section 5.3) are derived
from the ESA 95 11 quarterly national accounts.
The ESA 95 was amended by Commission
Regulation (EU) No 715/2010 of 10 August
2010 12 introducing NACE Revision 2, the
updated statistical classifi cation of economic
activities. The publication of euro area national
accounts data applying this new classifi cation
began in December 2011.
Industrial new orders (Table 4 in Section 5.2)
measure the orders received during the reference
period and cover industries working mainly on
the basis of orders – in particular the textile, pulp
and paper, chemical, metal, capital goods and
durable consumer goods industries. The data are
calculated on the basis of current prices.
Indices for turnover in industry and for the
retail trade (Table 4 in Section 5.2) measure the
turnover, including all duties and taxes (with
the exception of VAT), invoiced during the
reference period. Retail trade turnover covers all
retail trade (excluding sales of motor vehicles
and motorcycles), except automotive fuel. New
passenger car registrations cover registrations of
both private and commercial passenger cars.
Qualitative business and consumer survey data
(Table 5 in Section 5.2) draw on the European
Commission Business and Consumer Surveys.
Unemployment rates (Table 4 in Section 5.3)
conform to International Labour Organization
guidelines. They refer to persons actively
seeking work as a share of the labour force,
using harmonised criteria and defi nitions.
The labour force estimates underlying the
unemployment rate are different from the sum
of the employment and unemployment levels
published in Section 5.3.
GOVERNMENT FINANCE
Sections 6.1 to 6.5 show the general government
fi scal position in the euro area. The data are
mainly consolidated and are based on the
ESA 95 methodology. The annual euro area
aggregates in Sections 6.1 to 6.3 are compiled
by the ECB on the basis of harmonised data
provided by the NCBs, which are regularly
updated. The defi cit and debt data for the euro
area countries may therefore differ from those
used by the European Commission within the
excessive defi cit procedure. The quarterly euro
area aggregates in Sections 6.4 and 6.5 are
compiled by the ECB on the basis of Eurostat
and national data.
Section 6.1 presents annual fi gures on general
government revenue and expenditure on the
basis of defi nitions laid down in Commission
Regulation (EC) No 1500/2000 of 10 July 2000 13
amending the ESA 95. Section 6.2 shows details
of general government gross consolidated debt
at nominal value in line with the Treaty
provisions on the excessive defi cit procedure.
Sections 6.1 and 6.2 include summary data for
the individual euro area countries owing to their
importance within the framework of the Stability
and Growth Pact. The defi cits/surpluses
presented for the individual euro area countries
correspond to excessive defi cit procedure B.9,
as defi ned by Council Regulation (EC)
No 479/2009 as regards references to the
ESA 95. Section 6.3 presents changes in general
government debt. The difference between the
change in the government debt and the
government defi cit – the defi cit-debt adjustment –
is mainly explained by government transactions
in fi nancial assets and by foreign exchange
valuation effects. Section 6.4 presents quarterly
fi gures on general government revenue and
expenditure on the basis of defi nitions laid down
in Regulation (EC) No 1221/2002 of the
European Parliament and of the Council of
10 June 2002 on quarterly non-fi nancial accounts
for general government 14. Section 6.5 presents
quarterly fi gures on gross consolidated
government debt, the defi cit-debt adjustment
and the government borrowing requirement.
These fi gures are compiled using data provided
OJ L 310, 30.11.1996, p. 1.11
OJ L 210, 11.8.2010, p. 1.12
OJ L 172, 12.7.2000, p. 3. 13
OJ L 179, 9.7.2002, p. 1.14
ECB
Monthly Bulletin
August 2012S 94
by the Member States under Regulation (EC)
No 501/2004 and Regulation (EC) No 222/2004
and data provided by the NCBs.
EXTERNAL TRANSACTIONS AND POSITIONS
The concepts and defi nitions used in balance of
payments and international investment position
(i.i.p.) statistics (Sections 7.1 to 7.4) are
generally in line with the IMF Balance of
Payments Manual (fi fth edition, October 1993),
the ECB Guideline of 16 July 2004 on the
statistical reporting requirements of the ECB
(ECB/2004/15) 15 and the amending ECB
Guideline of 31 May 2007 (ECB/2007/3) 16.
Additional information regarding the
methodologies and sources used in the euro area
b.o.p. and i.i.p. statistics can be found in the
ECB publication entitled “European Union
balance of payments/international investment
position statistical methods” (May 2007) and in
the reports of the Task Force on Portfolio
Investment Collection Systems (June 2002),
the Task Force on Portfolio Investment Income
(August 2003) and the Task Force on Foreign
Direct Investment (March 2004), all of which
can be downloaded from the ECB’s website.
In addition, a report by the ECB/European
Commission (Eurostat) Task Force on Quality
looking at balance of payments and international
investment position statistics (June 2004) is
available on the website of the Committee on
Monetary, Financial and Balance of Payments
Statistics (www.cmfb.org). The annual quality
report on the euro area b.o.p./i.i.p., which is
based on the Task Force’s recommendations
and follows the basic principles of the ECB
Statistics Quality Framework published in
April 2008, is available on the ECB’s website.
On 9 December 2011 the ECB Guideline on
the statistical requirements of the European
Central Bank in the fi eld of external statistics
(ECB/2011/23) 17 was adopted by the Governing
Council of the ECB. This legal act lays down new
reporting requirements in the fi eld of external
statistics, which mainly refl ect methodological
changes introduced in the sixth edition of the
IMF’s Balance of Payments and International
Investment Position Manual (BPM6). The ECB
will begin publishing the euro area’s b.o.p.,
i.i.p. and international reserves statistics in
accordance with Guideline ECB/2011/23 and
the BPM6 in 2014, with backdata.
The tables in Sections 7.1 and 7.4 follow
the sign convention in the IMF Balance of
Payments Manual – i.e. surpluses in the current
account and the capital account have a plus
sign, while in the fi nancial account a plus sign
denotes an increase in liabilities or a decrease
in assets. In the tables in Section 7.2, both credit
and debit transactions are presented with a plus
sign. Furthermore, as of the February 2008
issue of the Monthly Bulletin, the tables in
Section 7.3 have been restructured in order to
allow the data on the balance of payments, the
international investment position and related
growth rates to be presented together; in the new
tables, transactions in assets and liabilities that
correspond to increases in positions are shown
with a plus sign.
The euro area b.o.p. is compiled by the ECB.
Recent monthly fi gures should be regarded as
provisional. Data are revised when fi gures for
the following month and/or the detailed quarterly
b.o.p. are published. Earlier data are revised
periodically or as a result of methodological
changes in the compilation of the source data.
Table 1 in Section 7.2 also contains seasonally
adjusted data for the current account. Where
appropriate, the adjustment also covers
working day, leap year and/or Easter-related
effects. Table 3 in Section 7.2 and Table 9 in
Section 7.3 present a breakdown of the euro
area b.o.p. and i.i.p. vis-à-vis major partner
countries, both individually and as a group,
distinguishing between EU Member States
outside the euro area and countries or areas
outside the European Union. The breakdown
also shows transactions and positions vis-à-vis
EU institutions (which, with the exception
OJ L 354, 30.11.2004, p. 34.15
OJ L 159, 20.6.2007, p. 48.16
OJ L 65, 3.3.2012, p. 1.17
ECB
Monthly Bulletin
August 2012 S 95
EURO AREASTATISTICS
General Notes
of the ECB, are considered to be outside the
euro area for statistical purposes, regardless
of their physical location) and, for some
purposes, offshore centres and international
organisations. The breakdown does not cover
transactions or positions in portfolio investment
liabilities, fi nancial derivatives or international
reserves. In addition, separate data are not
provided for investment income payable
to Brazil, mainland China, India or Russia.
The geographical breakdown is described in the
article entitled “Euro area balance of payments
and international investment position vis-à-vis
main counterparts” in the February 2005 issue
of the Monthly Bulletin.
The data on the euro area b.o.p. fi nancial
account and i.i.p. in Section 7.3 are based on
transactions and positions vis-à-vis non-residents
of the euro area, regarding the euro area as
a single economic entity (see also Box 9 in the
December 2002 issue of the Monthly Bulletin,
Box 5 in the January 2007 issue of the Monthly
Bulletin and Box 6 in the January 2008 issue
of the Monthly Bulletin). The i.i.p. is valued
at current market prices, with the exception of
direct investment, where book values are used
for unquoted shares, and other investments
(e.g. loans and deposits). The quarterly
i.i.p. is compiled on the basis of the same
methodological framework as the annual i.i.p.
As some data sources are not available on
a quarterly basis (or are available with a delay),
the quarterly i.i.p. is partly estimated on the
basis of fi nancial transactions, asset prices and
foreign exchange developments.
Table 1 in Section 7.3 summarises the i.i.p. and
fi nancial transactions in the euro area b.o.p.
The breakdown of the change in the annual
i.i.p. is obtained by applying a statistical model
to i.i.p. changes other than transactions, using
information from the geographical breakdown
and currency composition of assets and
liabilities, as well as price indices for different
fi nancial assets. In this table, columns 5 and
6 refer to direct investment by resident units
abroad and direct investment by non-resident
units in the euro area.
In Table 5 in Section 7.3, the breakdown into
“loans” and “currency and deposits” is based on
the sector of the non-resident counterpart – i.e.
assets vis-à-vis non-resident banks are classifi ed
as deposits, whereas assets vis-à-vis other
non-resident sectors are classifi ed as loans. This
breakdown follows the distinction made in other
statistics, such as the MFI consolidated balance
sheet, and conforms to the IMF Balance of
Payments Manual.
The outstanding amounts for the Eurosystem’s
international reserves and related assets and
liabilities are shown in Table 7 of Section 7.3.
These fi gures are not fully comparable with
those in the Eurosystem’s weekly fi nancial
statement owing to differences in coverage
and valuation. The data in Table 7 are in line
with the recommendations for the template
on international reserves and foreign currency
liquidity. By defi nition, the assets included in the
Eurosystem’s international reserves take account
of the changing composition of the euro area.
Before countries join the euro area, the assets
of their national central banks are included in
portfolio investment (in the case of securities)
or other investment (in the case of other assets).
Changes in the gold holdings of the Eurosystem
(column 3) are due to transactions in gold within
the terms of the Central Bank Gold Agreement
of 26 September 1999, which was updated
on 27 September 2009. More information on
the statistical treatment of the Eurosystem’s
international reserves can be found in a publication
entitled “Statistical treatment of the Eurosystem’s
international reserves” (October 2000), which
can be downloaded from the ECB’s website. The
website also contains more comprehensive data
in accordance with the template on international
reserves and foreign currency liquidity.
The euro area’s gross external debt statistics
in Table 8 of Section 7.3 represent outstanding
actual (rather than contingent) liabilities vis-à-vis
non-euro area residents that require the payment
of principal and/or interest by the debtor at one
or more points in the future. Table 8 shows a
breakdown of gross external debt by instrument
and institutional sector.

ECB
Monthly Bulletin
August 2012S 96
Section 7.4 contains a monetary presentation
of the euro area balance of payments, showing
the transactions by non-MFIs that mirror the net
external transactions by MFIs. Included in the
transactions by non-MFIs are b.o.p. transactions
for which a sectoral breakdown is not available.
These concern the current and capital accounts
(column 2) and fi nancial derivatives (column 11).
An up-to-date methodological note on the
monetary presentation of the euro area balance
of payments is available in the “Statistics”
section of the ECB’s website. See also Box 1 in
the June 2003 issue of the Monthly Bulletin.
Section 7.5 shows data on euro area external
trade in goods. The source is Eurostat. Value data
and volume indices are seasonally and working
day-adjusted. The breakdown by product
group in columns 4 to 6 and 9 to 11 of Table 1
in Section 7.5 is in line with the classifi cation
contained in the Broad Economic Categories
and corresponds to the basic classes of goods in
the System of National Accounts. Manufactured
goods (columns 7 and 12) and oil (column 13)
are in line with the SITC Rev. 4 defi nition. The
geographical breakdown (Table 3 in Section 7.5)
shows major trading partners both individually
and in regional groups. China excludes Hong
Kong. On account of differences in defi nitions,
classifi cation, coverage and time of recording,
external trade data, in particular for imports, are
not fully comparable with the goods item in the
b.o.p. statistics (Sections 7.1 and 7.2). Part of the
difference arises from the inclusion of insurance
and freight services in the recording of imported
goods in external trade data.
Industrial import prices and industrial producer
export prices (or industrial output prices for
the non-domestic market) shown in Table 2
in Section 7.5 were introduced by Regulation
(EC) No 1158/2005 of the European Parliament
and of the Council of 6 July 2005 amending
Council Regulation (EC) No 1165/98, which is
the principal legal basis for short-term statistics.
The industrial import price index covers
industrial products imported from outside the
euro area under sections B to E of the Statistical
Classifi cation of Products by Activity in the
European Economic Community (CPA) and all
institutional import sectors except households,
governments and non-profi t institutions.
It refl ects the cost, insurance and freight price
excluding import duties and taxes, and refers to
actual transactions in euro recorded at the point
when ownership of the goods is transferred.
The industrial producer export prices cover all
industrial products exported directly by euro
area producers to the extra-euro area market
under sections B to E of NACE Revision 2.
Exports from wholesalers and re-exports are
not covered. The indices refl ect the free on
board price expressed in euro and calculated
at the euro area frontier, including any indirect
taxes except VAT and other deductible taxes.
Industrial import prices and industrial producer
export prices are available by Main Industrial
Grouping as defi ned by Commission Regulation
(EC) No 656/2007 of 14 June 2007. For more
details, see Box 11 in the December 2008 issue
of the Monthly Bulletin.
EXCHANGE RATES
Section 8.1 shows nominal and real effective
exchange rate indices for the euro, which are
calculated by the ECB on the basis of weighted
averages of the euro’s bilateral exchange rates
against the currencies of the selected trading
partners of the euro area. A positive change
denotes an appreciation of the euro. Weights
are based on trade in manufactured goods with
those trading partners in the periods 1995-1997,
1998-2000, 2001-2003, 2004-2006 and 2007-2009
and are calculated to account for third-market
effects. The EER indices are obtained by chain-
linking the indicators based on each of these fi ve
sets of trade weights at the end of each three-year
period. The base period of the resulting EER
index is the fi rst quarter of 1999. The EER-20
group of trading partners is composed of the 10
non-euro area EU Member States plus Australia,
Canada, China, Hong Kong, Japan, Norway,
Singapore, South Korea, Switzerland and the
United States. The EER-40 group comprises the
EER-20 plus the following countries: Algeria,
Argentina, Brazil, Chile, Croatia, Iceland,
ECB
Monthly Bulletin
August 2012 S 97
EURO AREASTATISTICS
General Notes
India, Indonesia, Israel, Malaysia, Mexico,
Morocco, New Zealand, the Philippines, Russia,
South Africa, Taiwan, Thailand, Turkey and
Venezuela. Real EERs are calculated using
consumer price indices, producer price indices,
gross domestic product defl ators and unit labour
costs, both for the manufacturing sector and for
the total economy.
For more detailed information on the calculation
of the EERs, see the relevant methodological
note and ECB Occasional Paper No 2
(“The effective exchange rates of the euro”
by Luca Buldorini, Stelios Makrydakis and
Christian Thimann, February 2002), which can
be downloaded from the ECB’s website.
The bilateral rates shown in Section 8.2 are
monthly averages of those published daily as
reference rates for these currencies. The most
recent rate for the Icelandic krona is 290.0 per
euro and refers to 3 December 2008.
DEVELOPMENTS OUTSIDE THE EURO AREA
Statistics on other EU Member States
(Section 9.1) follow the same principles as data
relating to the euro area. As a result, data on
current and capital accounts and gross external
debt include special-purpose vehicles. The data
for the United States and Japan contained in
Section 9.2 are obtained from national sources.

ECB
Monthly Bulletin
August 2012
14 JANUARY AND 4 FEBRUARY 2010
The Governing Council of the ECB decides
that the interest rate on the main refi nancing
operations and the interest rates on the marginal
lending facility and the deposit facility will
remain unchanged at 1.00%, 1.75% and 0.25%
respectively.
4 MARCH 2010
The Governing Council of the ECB decides
that the interest rate on the main refi nancing
operations and the interest rates on the marginal
lending facility and the deposit facility will
remain unchanged at 1.00%, 1.75% and 0.25%
respectively. It also decides on the details as
regards the tender procedures and modalities
to be applied in its refi nancing operations
up to 12 October 2010, including a return to
variable rate tender procedures in the regular
three-month longer-term refi nancing operations,
starting with the operation to be allotted
on 28 April 2010.
8 APRIL AND 6 MAY 2010
The Governing Council of the ECB decides
that the interest rate on the main refi nancing
operations and the interest rates on the marginal
lending facility and the deposit facility will
remain unchanged at 1.00%, 1.75% and 0.25%
respectively.
10 MAY 2010
The Governing Council of the ECB decides
on several measures to address severe tensions
in fi nancial markets. In particular, it decides
to conduct interventions in the euro area
public and private debt securities markets
(Securities Markets Programme) and to adopt a
fi xed rate tender procedure with full allotment in
the regular three-month longer-term refi nancing
operations in May and June 2010.
10 JUNE 2010
The Governing Council of the ECB decides that the
interest rate on the main refi nancing operations and
the interest rates on the marginal lending facility
and the deposit facility will remain unchanged at
1.00%, 1.75% and 0.25% respectively. In addition,
it decides to adopt a fi xed rate tender procedure
with full allotment in the regular three-month
longer-term refi nancing operations to be allotted
during the third quarter of 2010.
8 JULY AND 5 AUGUST 2010
The Governing Council of the ECB decides that the
interest rate on the main refi nancing operations and
the interest rates on the marginal lending facility
and the deposit facility will remain unchanged at
1.00%, 1.75% and 0.25% respectively.
2 SEPTEMBER 2010
The Governing Council of the ECB decides
that the interest rate on the main refi nancing
operations and the interest rates on the marginal
lending facility and the deposit facility will
remain unchanged at 1.00%, 1.75% and 0.25%
respectively. It also decides on the details as
regards the tender procedures and modalities
to be applied in its refi nancing operations up to
18 January 2011, notably the adoption of a fi xed
rate tender procedure with full allotment in the
three-month longer-term refi nancing operations.
7 OCTOBER AND 4 NOVEMBER 2010
The Governing Council of the ECB decides
that the interest rate on the main refi nancing
operations and the interest rates on the marginal
lending facility and the deposit facility will
remain unchanged at 1.00%, 1.75% and 0.25%
respectively.
I
ANNEXES
CHRONOLOGY OF MONETARY POLICY MEASURES OF THE EUROSYSTEM1
The chronology of monetary policy measures taken by the 1
Eurosystem between 1999 and 2009 can be found in the ECB’s
Annual Report for the respective years.
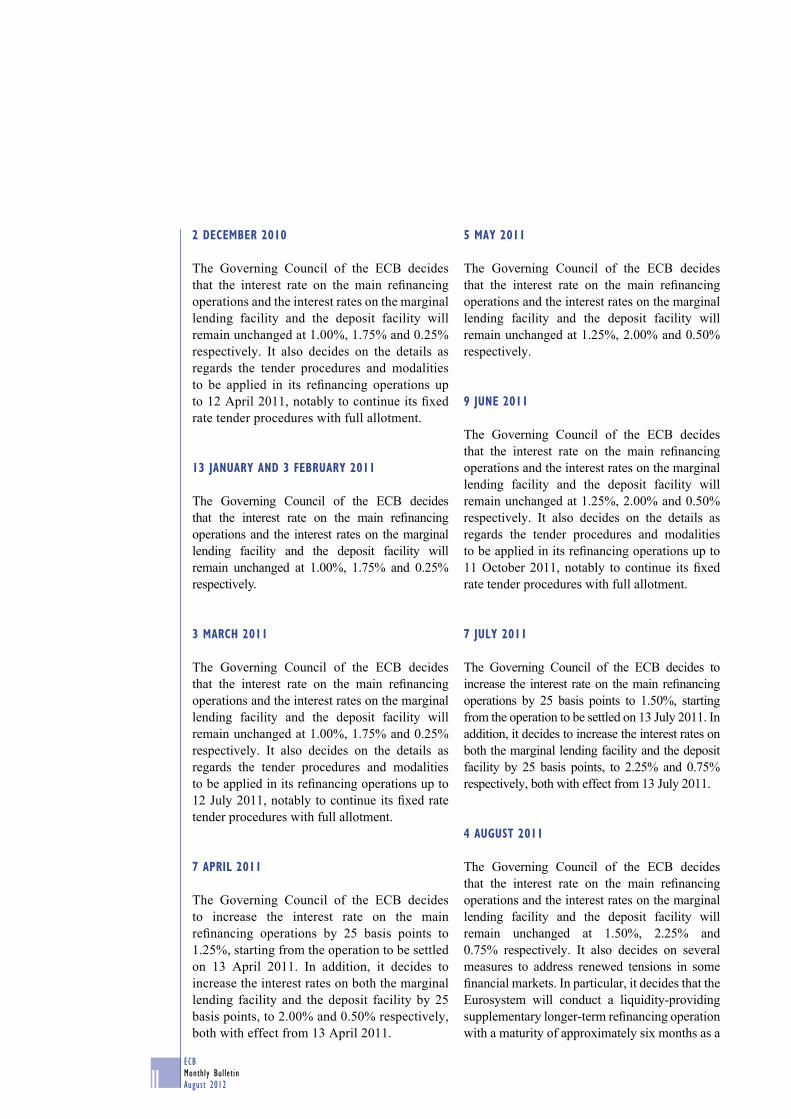
ECB
Monthly Bulletin
August 2012II
2 DECEMBER 2010
The Governing Council of the ECB decides
that the interest rate on the main refi nancing
operations and the interest rates on the marginal
lending facility and the deposit facility will
remain unchanged at 1.00%, 1.75% and 0.25%
respectively. It also decides on the details as
regards the tender procedures and modalities
to be applied in its refi nancing operations up
to 12 April 2011, notably to continue its fi xed
rate tender procedures with full allotment.
13 JANUARY AND 3 FEBRUARY 2011
The Governing Council of the ECB decides
that the interest rate on the main refi nancing
operations and the interest rates on the marginal
lending facility and the deposit facility will
remain unchanged at 1.00%, 1.75% and 0.25%
respectively.
3 MARCH 2011
The Governing Council of the ECB decides
that the interest rate on the main refi nancing
operations and the interest rates on the marginal
lending facility and the deposit facility will
remain unchanged at 1.00%, 1.75% and 0.25%
respectively. It also decides on the details as
regards the tender procedures and modalities
to be applied in its refi nancing operations up to
12 July 2011, notably to continue its fi xed rate
tender procedures with full allotment.
7 APRIL 2011
The Governing Council of the ECB decides
to increase the interest rate on the main
refi nancing operations by 25 basis points to
1.25%, starting from the operation to be settled
on 13 April 2011. In addition, it decides to
increase the interest rates on both the marginal
lending facility and the deposit facility by 25
basis points, to 2.00% and 0.50% respectively,
both with effect from 13 April 2011.
5 MAY 2011
The Governing Council of the ECB decides
that the interest rate on the main refi nancing
operations and the interest rates on the marginal
lending facility and the deposit facility will
remain unchanged at 1.25%, 2.00% and 0.50%
respectively.
9 JUNE 2011
The Governing Council of the ECB decides
that the interest rate on the main refi nancing
operations and the interest rates on the marginal
lending facility and the deposit facility will
remain unchanged at 1.25%, 2.00% and 0.50%
respectively. It also decides on the details as
regards the tender procedures and modalities
to be applied in its refi nancing operations up to
11 October 2011, notably to continue its fi xed
rate tender procedures with full allotment.
7 JULY 2011
The Governing Council of the ECB decides to
increase the interest rate on the main refi nancing
operations by 25 basis points to 1.50%, starting
from the operation to be settled on 13 July 2011. In
addition, it decides to increase the interest rates on
both the marginal lending facility and the deposit
facility by 25 basis points, to 2.25% and 0.75%
respectively, both with effect from 13 July 2011.
4 AUGUST 2011
The Governing Council of the ECB decides
that the interest rate on the main refi nancing
operations and the interest rates on the marginal
lending facility and the deposit facility will
remain unchanged at 1.50%, 2.25% and
0.75% respectively. It also decides on several
measures to address renewed tensions in some
fi nancial markets. In particular, it decides that the
Eurosystem will conduct a liquidity-providing
supplementary longer-term refi nancing operation
with a maturity of approximately six months as a
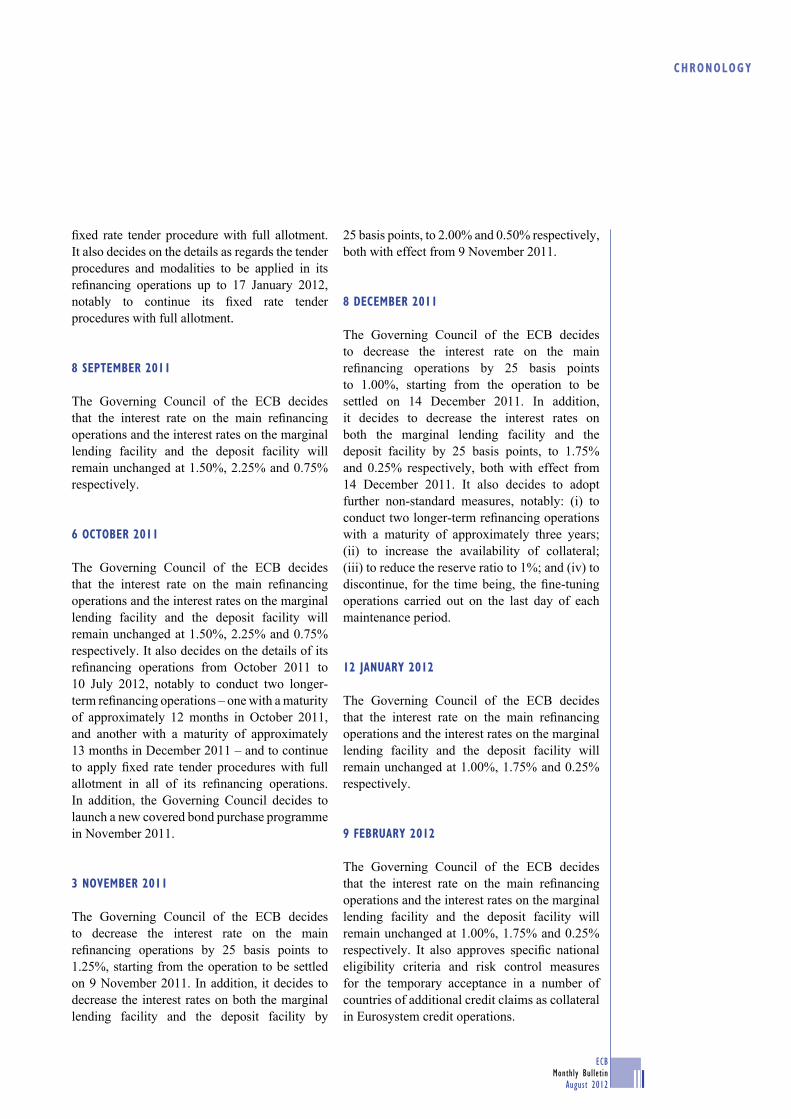
ECB
Monthly Bulletin
August 2012
CHRONOLOGY
III
fi xed rate tender procedure with full allotment.
It also decides on the details as regards the tender
procedures and modalities to be applied in its
refi nancing operations up to 17 January 2012,
notably to continue its fi xed rate tender
procedures with full allotment.
8 SEPTEMBER 2011
The Governing Council of the ECB decides
that the interest rate on the main refi nancing
operations and the interest rates on the marginal
lending facility and the deposit facility will
remain unchanged at 1.50%, 2.25% and 0.75%
respectively.
6 OCTOBER 2011
The Governing Council of the ECB decides
that the interest rate on the main refi nancing
operations and the interest rates on the marginal
lending facility and the deposit facility will
remain unchanged at 1.50%, 2.25% and 0.75%
respectively. It also decides on the details of its
refi nancing operations from October 2011 to
10 July 2012, notably to conduct two longer-
term refi nancing operations – one with a maturity
of approximately 12 months in October 2011,
and another with a maturity of approximately
13 months in December 2011 – and to continue
to apply fi xed rate tender procedures with full
allotment in all of its refi nancing operations.
In addition, the Governing Council decides to
launch a new covered bond purchase programme
in November 2011.
3 NOVEMBER 2011
The Governing Council of the ECB decides
to decrease the interest rate on the main
refi nancing operations by 25 basis points to
1.25%, starting from the operation to be settled
on 9 November 2011. In addition, it decides to
decrease the interest rates on both the marginal
lending facility and the deposit facility by
25 basis points, to 2.00% and 0.50% respectively,
both with effect from 9 November 2011.
8 DECEMBER 2011
The Governing Council of the ECB decides
to decrease the interest rate on the main
refi nancing operations by 25 basis points
to 1.00%, starting from the operation to be
settled on 14 December 2011. In addition,
it decides to decrease the interest rates on
both the marginal lending facility and the
deposit facility by 25 basis points, to 1.75%
and 0.25% respectively, both with effect from
14 December 2011. It also decides to adopt
further non-standard measures, notably: (i) to
conduct two longer-term refi nancing operations
with a maturity of approximately three years;
(ii) to increase the availability of collateral;
(iii) to reduce the reserve ratio to 1%; and (iv) to
discontinue, for the time being, the fi ne-tuning
operations carried out on the last day of each
maintenance period.
12 JANUARY 2012
The Governing Council of the ECB decides
that the interest rate on the main refi nancing
operations and the interest rates on the marginal
lending facility and the deposit facility will
remain unchanged at 1.00%, 1.75% and 0.25%
respectively.
9 FEBRUARY 2012
The Governing Council of the ECB decides
that the interest rate on the main refi nancing
operations and the interest rates on the marginal
lending facility and the deposit facility will
remain unchanged at 1.00%, 1.75% and 0.25%
respectively. It also approves specifi c national
eligibility criteria and risk control measures
for the temporary acceptance in a number of
countries of additional credit claims as collateral
in Eurosystem credit operations.
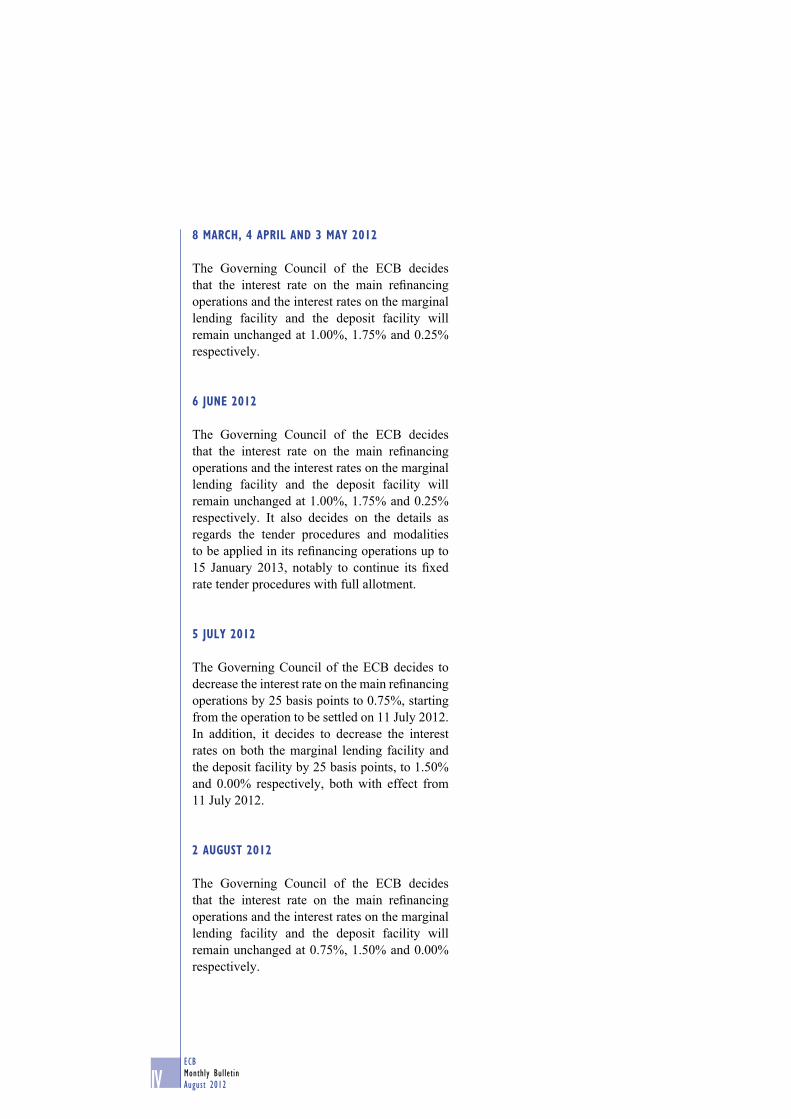
ECB
Monthly Bulletin
August 2012
8 MARCH, 4 APRIL AND 3 MAY 2012
The Governing Council of the ECB decides
that the interest rate on the main refi nancing
operations and the interest rates on the marginal
lending facility and the deposit facility will
remain unchanged at 1.00%, 1.75% and 0.25%
respectively.
6 JUNE 2012
The Governing Council of the ECB decides
that the interest rate on the main refi nancing
operations and the interest rates on the marginal
lending facility and the deposit facility will
remain unchanged at 1.00%, 1.75% and 0.25%
respectively. It also decides on the details as
regards the tender procedures and modalities
to be applied in its refi nancing operations up to
15 January 2013, notably to continue its fi xed
rate tender procedures with full allotment.
5 JULY 2012
The Governing Council of the ECB decides to
decrease the interest rate on the main refi nancing
operations by 25 basis points to 0.75%, starting
from the operation to be settled on 11 July 2012.
In addition, it decides to decrease the interest
rates on both the marginal lending facility and
the deposit facility by 25 basis points, to 1.50%
and 0.00% respectively, both with effect from
11 July 2012.
2 AUGUST 2012
The Governing Council of the ECB decides
that the interest rate on the main refi nancing
operations and the interest rates on the marginal
lending facility and the deposit facility will
remain unchanged at 0.75%, 1.50% and 0.00%
respectively.
IV
ECB
Monthly Bulletin
August 2012
The ECB produces a number of publications which provide information about its core activities:
monetary policy, statistics, payment and securities settlement systems, fi nancial stability and
supervision, international and European cooperation, and legal matters. These include the
following:
STATUTORY PUBLICATIONS
Annual Report –
Convergence Report –
Monthly Bulletin –
RESEARCH PAPERS
Legal Working Paper Series –
Occasional Paper Series –
Research Bulletin –
Working Paper Series –
OTHER/TASK-RELATED PUBLICATIONS
Enhancing monetary analysis –
Financial integration in Europe –
Financial Stability Review –
Statistics Pocket Book –
The European Central Bank: history, role and functions –
The international role of the euro –
The implementation of monetary policy in the euro area (“General Documentation”) –
The monetary policy of the ECB –
The payment system –
The ECB also publishes brochures and information materials on a variety of topics, such as the euro
banknotes and coins, as well as seminar and conference proceedings.
For a complete list of documents (in PDF format) published by the ECB and the European
Monetary Institute, the ECB’s forerunner from 1994 to 1998, please visit the ECB’s website at
http://www.ecb.europa.eu/pub/. Language codes indicate the languages in which each publication
is available.
Unless otherwise indicated, hard copies can be obtained or subscribed to free of charge, stock
permitting, by contacting [email protected]
PUBLICATIONS PRODUCED BY THE EUROPEAN CENTRAL BANK
V

ECB
Monthly Bulletin
August 2012
GLOSSARY
This glossary contains selected items that are frequently used in the Monthly Bulletin. A more
comprehensive and detailed glossary can be found on the ECB’s website (www.ecb.europa.eu/
home/glossary/html/index.en.html).
Autonomous liquidity factors: liquidity factors that do not normally stem from the use of monetary
policy instruments. Such factors are, for example, banknotes in circulation, government deposits
with the central bank and the net foreign assets of the central bank.
Balance of payments (b.o.p.): a statistical statement that summarises, for a specifi c period of
time, the economic transactions of an economy with the rest of the world.
Bank lending survey (BLS): a quarterly survey on lending policies that has been conducted by
the Eurosystem since January 2003. It addresses qualitative questions on developments in credit
standards, terms and conditions of loans and loan demand for both enterprises and households to a
predefi ned sample group of banks in the euro area.
Borrowing requirement (general government): net incurrence of debt by the general
government.
Break-even inflation rate: the spread between the yield on a nominal bond and that on an infl ation-
linked bond of the same (or as similar as possible) maturity.
Capital account: a b.o.p. account that covers all capital transfers and acquisitions/disposals of
non-produced, non-fi nancial assets between residents and non-residents.
Capital accounts: part of the system of national (or euro area) accounts consisting of the change in
net worth that is due to net saving, net capital transfers and net acquisitions of non-fi nancial assets.
Central parity (or central rate): the exchange rate of each ERM II member currency vis-à-vis the
euro, around which the ERM II fl uctuation margins are defi ned.
Compensation per employee or per hour worked: the total remuneration, in cash or in kind, that
is payable by employers to employees, i.e. gross wages and salaries, as well as bonuses, overtime
payments and employers’ social security contributions, divided by the total number of employees
or by the total number of employees’ hours worked.
Consolidated balance sheet of the MFI sector: a balance sheet obtained by netting out
inter-MFI positions (e.g. inter-MFI loans and deposits) in the aggregated MFI balance sheet.
It provides statistical information on the MFI sector’s assets and liabilities vis-à-vis residents of the
euro area not belonging to this sector (i.e. the general government and other euro area residents)
and vis-à-vis non-euro area residents. It is the main statistical source for the calculation of monetary
aggregates, and it provides the basis for the regular analysis of the counterparts of M3.
Collateral: assets pledged or transferred in some form as a guarantee for the repayment of
loans, as well as assets sold under repurchase agreements. Collateral used in Eurosystem reverse
transactions must fulfi l certain eligibility criteria.
Current account: a b.o.p. account that covers all transactions in goods and services, income and
current transfers between residents and non-residents.
VII
ECB
Monthly Bulletin
August 2012
Current transfers account: a technical b.o.p. account in which the value of real resources or
fi nancial items is recorded when these are transferred without receiving anything in exchange.
Current transfers cover all transfers that are not capital transfers.
Debt (financial accounts): loans taken out by households, as well as the loans, debt securities and
pension fund reserves (resulting from employers’ direct pension commitments on behalf of their
employees) of non-fi nancial corporations, valued at market prices at the end of the period.
Debt (general government): the gross debt (currency and deposits, loans and debt securities) at
nominal value outstanding at the end of the year and consolidated between and within the sectors of
general government.
Debt security: a promise on the part of the issuer (i.e. the borrower) to make one or more
payment(s) to the holder (the lender) on a specifi ed future date or dates. Such securities usually
carry a specifi c rate of interest (the coupon) and/or are sold at a discount to the amount that will
be repaid at maturity. Debt securities issued with an original maturity of more than one year are
classifi ed as long-term.
Debt-to-GDP ratio (general government): the ratio of general government debt to GDP at
current market prices. It is the subject of one of the fi scal criteria laid down in Article 126(2) of the
Treaty on the Functioning of the European Union to defi ne the existence of an excessive defi cit.
Deficit (general government): the general government’s net borrowing, i.e. the difference between
total government revenue and total government expenditure.
Deficit-debt adjustment (general government): the difference between the general government
defi cit and the change in general government debt.
Deficit ratio (general government): the ratio of the general government defi cit to GDP at current
market prices. It is the subject of one of the fi scal criteria laid down in Article 126(2) of the Treaty
on the Functioning of the European Union to defi ne the existence of an excessive defi cit. It is also
referred to as the budget defi cit ratio or the fi scal defi cit ratio.
Deflation: a signifi cant and persistent decline in the prices of a very broad set of consumer goods
and services that becomes entrenched in expectations.
Deposit facility: a standing facility of the Eurosystem enabling eligible counterparties to make, on
their own initiative, overnight deposits with the NCB in their respective jurisdiction. Deposits are
remunerated at a pre-specifi ed rate that normally provides a fl oor for overnight market interest rates.
Disinflation: a process of decelerating infl ation that may lead to negative infl ation rates of a
temporary nature.
Direct investment: cross-border investment for the purpose of obtaining a lasting interest in an
enterprise resident in another economy (assumed, in practice, for ownership of at least 10% of
the ordinary shares or voting power). Included are equity capital, reinvested earnings and other
capital associated with inter-company operations. The direct investment account records net
transactions/positions in assets abroad by euro area residents (as “direct investment abroad”) and net
transactions/positions in euro area assets by non-residents (as “direct investment in the euro area”).
VIII
ECB
Monthly Bulletin
August 2012
GLOSSARY
Effective exchange rates (EERs) of the euro (nominal/real): weighted averages of bilateral
euro exchange rates against the currencies of the euro area’s main trading partners. The EER indices
of the euro are calculated against different groups of trading partners: the EER-20 comprises the
ten non-euro area EU Member States and ten trading partners outside the EU, and the EER-40
encompasses the EER-20 and 20 additional countries. The weights used refl ect the share of each
partner country in the euro area’s trade in manufactured goods and account for competition in
third markets. Real EERs are nominal EERs defl ated by a weighted average of foreign, relative to
domestic, prices or costs. They are thus measures of price and cost competitiveness.
Enhanced credit support: the non-standard measures taken by the ECB/Eurosystem during the
fi nancial crisis with a view to supporting fi nancing conditions and credit fl ows above and beyond
what could be achieved through reductions in key ECB interest rates alone.
EONIA (euro overnight index average): a measure of the effective interest rate prevailing in
the euro interbank overnight market. It is calculated as a weighted average of the interest rates on
unsecured overnight lending transactions denominated in euro, as reported by a panel of contributing
banks.
Equities: securities representing ownership of a stake in a corporation, e.g. shares traded on stock
exchanges (quoted shares), unquoted shares and other forms of equity. Equities usually produce
income in the form of dividends.
ERM II (exchange rate mechanism II): the exchange rate arrangement that provides the
framework for exchange rate policy cooperation between the euro area countries and the EU
Member States not participating in Stage Three of EMU.
EURIBOR (euro interbank offered rate): the rate at which what is known as a prime bank is
willing to lend funds (denominated in euro) to another prime bank. The EURIBOR is computed
daily, based on the rates of a sample of selected banks, for different maturities of up to 12 months.
Euro area: the area formed by those EU Member States in which the euro has been adopted as the
single currency in accordance with the Treaty on the Functioning of the European Union.
European Commission surveys: harmonised surveys of business and/or consumer sentiment
conducted on behalf of the European Commission in each of the EU Member States. Such
questionnaire-based surveys are addressed to managers in the manufacturing, construction, retail
and services industries, as well as to consumers. From each monthly survey, composite indicators
are calculated that summarise the replies to a number of different questions in a single indicator
(confi dence indicators).
Eurosystem: the central banking system made up of the ECB and the NCBs of those EU Member
States whose currency is the euro.
Eurozone Purchasing Managers’ Surveys: surveys of business conditions in manufacturing and
in services industries conducted for a number of countries in the euro area and used to compile
indices. The Eurozone Manufacturing Purchasing Managers’ Index (PMI) is a weighted indicator
calculated from indices of output, new orders, employment, suppliers’ delivery times and stocks
of purchases. The services sector survey asks questions on business activity, expectations of future
business activity, the amount of business outstanding, incoming new business, employment, input
IX
ECB
Monthly Bulletin
August 2012
prices and prices charged. The Eurozone Composite Index is calculated by combining the results
from the manufacturing and services sector surveys.
External trade in goods: exports and imports of goods with countries outside the euro area,
measured in terms of value and as indices of volume and unit value. External trade statistics are
not comparable with the exports and imports recorded in the national accounts, as the latter include
both intra-euro area and extra-euro area transactions, and also combine goods and services. Nor are
they fully comparable with the goods item in b.o.p. statistics. Besides methodological adjustments,
the main difference is that imports in external trade statistics are recorded including insurance and
freight services, whereas they are recorded free on board in the goods item in the b.o.p. statistics.
Financial account: a b.o.p. account that covers transactions between residents and non-residents in
direct investment, portfolio investment, other investment, fi nancial derivatives and reserve assets.
Financial accounts: part of the system of national (or euro area) accounts showing the fi nancial
positions (stocks or balance sheets), fi nancial transactions and other changes of the different
institutional sectors of an economy by type of fi nancial asset.
Financial vehicle corporation (FVC): an entity whose principal activity is to carry out
securitisation transactions. An FVC typically issues marketable securities that are offered for sale
to the general public, or sold in the form of private placements. These securities are backed by
a portfolio of assets (typically loans) which are held by the FVC. In some cases, a securitisation
transaction may involve a number of FVCs, where one FVC holds the securitised assets and another
issues the securities backed by those assets.
Fixed rate tender: a tender procedure in which the interest rate is specifi ed in advance by the
central bank and in which participating counterparties bid the amount of money they wish to
transact at the fi xed interest rate.
Fixed rate full-allotment tender procedure: a tender procedure in which the interest rate is
pre-specifi ed by the central bank (fi xed rate) and in which counterparties bid the amount of
money they want to transact at that rate, knowing in advance that all their bids will be satisfi ed
(full allotment).
General government: a sector defi ned in the ESA 95 as comprising resident entities that are
engaged primarily in the production of non-market goods and services intended for individual and
collective consumption and/or in the redistribution of national income and wealth. Included are
central, regional and local government authorities as well as social security funds. Excluded are
government-owned entities that conduct commercial operations, such as public enterprises.
Gross domestic product (GDP): the value of an economy’s total output of goods and services less
intermediate consumption, plus net taxes on products and imports. GDP can be broken down by
output, expenditure or income components. The main expenditure aggregates that make up GDP are
household fi nal consumption, government fi nal consumption, gross fi xed capital formation, changes
in inventories, and imports and exports of goods and services (including intra-euro area trade).
Gross external debt: the outstanding amount of an economy’s actual (i.e. non-contingent) current
liabilities that require payment of principal and/or interest to non-residents at some point in the
future.
X
ECB
Monthly Bulletin
August 2012
GLOSSARY
Harmonised Index of Consumer Prices (HICP): a measure of the development of consumer
prices that is compiled by Eurostat and harmonised for all EU Member States.
Hourly labour cost index: a measure of labour costs, including gross wages and salaries (in cash
and in kind, including bonuses) and other labour costs (employers’ social contributions plus
employment-related taxes paid by the employer minus subsidies received by the employer), per
hour actually worked (including overtime).
Implied volatility: the expected volatility (i.e. standard deviation) in the rates of change of the
price of an asset (e.g. a share or a bond). It can be derived from the asset’s price, maturity date and
exercise price of its options, as well as from a riskless rate of return, using an option pricing model
such as the Black-Scholes model.
Income account: a b.o.p. account that covers two types of transactions with non-residents, namely
(i) those involving compensation of employees that is paid to non-resident workers (e.g., cross-
border, seasonal, and other short-term workers) and (ii) those involving investment income receipts
and payments on external fi nancial assets and liabilities, with the latter including receipts and
payments on direct investment, portfolio investment and other investment, as well as receipts on
reserve assets.
Index of negotiated wages: a measure of the direct outcome of collective bargaining in terms of
basic pay (i.e. excluding bonuses) at the euro area level. It refers to the implied average change in
monthly wages and salaries.
Industrial producer prices: factory-gate prices (transportation costs are not included) of
all products sold by industry, excluding construction, on the domestic markets of the euro area
countries, excluding imports.
Industrial production: the gross value added created by industry at constant prices.
Inflation: an increase in the general price level, e.g. in the consumer price index.
Inflation-indexed government bonds: debt securities issued by the general government, the
coupon payments and principal of which are linked to a specifi c consumer price index.
Insurance corporations and pension funds: fi nancial corporations and quasi-corporations that are
engaged primarily in fi nancial intermediation as the consequence of the pooling of risks.
International investment position (i.i.p.): the value and composition of an economy’s outstanding
net fi nancial claims on (or fi nancial liabilities to) the rest of the world.
International reserves: external assets readily available to and controlled by monetary authorities
for directly fi nancing or regulating the magnitude of payment imbalances through intervention in
exchange markets. The international reserves of the euro area comprise non-euro-denominated
claims on non-euro area residents, gold, special drawing rights and the reserve positions in the IMF
which are held by the Eurosystem.
Investment funds (except money market funds): fi nancial institutions that pool capital raised
from the public and invest it in fi nancial and non-fi nancial assets. See also MFIs.
XI
ECB
Monthly Bulletin
August 2012
Job vacancies: a collective term covering newly created jobs, unoccupied jobs or jobs about to
become vacant in the near future, for which the employer has recently taken active steps to fi nd a
suitable candidate.
Key ECB interest rates: the interest rates, set by the Governing Council, which refl ect the
monetary policy stance of the ECB. They are the rates at the main refi nancing operations, on the
marginal lending facility and on the deposit facility.
Labour force: the sum total of persons in employment and the number of unemployed.
Labour productivity: the output that can be produced with a given input of labour. It can be
measured in several ways, but is commonly measured as GDP (volume) divided by either total
employment or total hours worked.
Liquidity-absorbing operation: an operation through which the Eurosystem absorbs liquidity
in order to reduce excess liquidity, or to create a shortage of liquidity. Such operations can be
conducted by issuing debt certifi cates or fi xed-term deposits.
Longer-term refinancing operation (LTRO): an open market operation with a maturity of more
than one week that is executed by the Eurosystem in the form of a reverse transaction. The regular
monthly operations have a maturity of three months. During the fi nancial market turmoil that started
in August 2007, supplementary operations with maturities ranging from one maintenance period to
36 months were conducted, the frequency of which varied.
M1: a narrow monetary aggregate that comprises currency in circulation plus overnight deposits
held with MFIs and central government (e.g. at the post offi ce or treasury).
M2: an intermediate monetary aggregate that comprises M1 plus deposits redeemable at a period
of notice of up to and including three months (i.e. short-term savings deposits) and deposits with an
agreed maturity of up to and including two years (i.e. short-term time deposits) held with MFIs and
central government.
M3: a broad monetary aggregate that comprises M2 plus marketable instruments, in particular
repurchase agreements, money market fund shares and units, and debt securities with a maturity of
up to and including two years issued by MFIs.
Main refinancing operation (MRO): a regular open market operation executed by the Eurosystem
in the form of reverse transactions. Such operations are carried out through a weekly standard tender
and normally have a maturity of one week.
Marginal lending facility: a standing facility of the Eurosystem enabling eligible counterparties,
on their own initiative, to receive overnight credit from the NCB in their jurisdiction at a
pre-specifi ed rate in the form of a reverse transaction. The rate on loans extended within the scope of
the marginal lending facility normally provides an upper bound for overnight market interest rates.
MFI credit to euro area residents: MFI loans granted to non-MFI euro area residents (including
general government and the private sector) and MFI holdings of securities (shares, other equity and
debt securities) issued by non-MFI euro area residents.
XII
ECB
Monthly Bulletin
August 2012
GLOSSARY
MFI interest rates: the interest rates that are applied by resident credit institutions and other MFIs,
excluding central banks and money market funds, to euro-denominated deposits and loans vis-à-vis
households and non-fi nancial corporations resident in the euro area.
MFI longer-term financial liabilities: deposits with an agreed maturity of over two years,
deposits redeemable at a period of notice of over three months, debt securities issued by euro area
MFIs with an original maturity of more than two years and the capital and reserves of the euro area
MFI sector.
MFI net external assets: the external assets of the euro area MFI sector (such as gold, foreign
currency banknotes and coins, securities issued by non-euro area residents and loans granted to
non-euro area residents) minus the external liabilities of the euro area MFI sector (such as non-euro
area residents’ deposits and repurchase agreements, as well as their holdings of money market fund
shares/units and debt securities issued by MFIs with a maturity of up to and including two years).
MFIs (monetary financial institutions): fi nancial institutions which together form the money-
issuing sector of the euro area. These include (i) the Eurosystem, (ii) resident credit institutions
(as defi ned in EU law), (iii) other fi nancial institutions whose business is to receive deposits
and/or close substitutes for deposits from entities other than MFIs and, for their own account
(at least in economic terms), to grant credit and/or invest in securities, as well as electronic money
institutions that are principally engaged in fi nancial intermediation in the form of issuing electronic
money, and (iv) money market funds, i.e. collective investment undertakings that invest in
short-term and low-risk instruments.
Minimum bid rate: the lower limit to the interest rates at which counterparties may submit bids in
the variable tenders.
Open market operation: a fi nancial market operation executed on the initiative of the central
bank. These operations include reverse transactions, outright transactions as well as the issuance of
fi xed-term deposits or debt certifi cates or foreign exchange swaps. The open market operations can
be liquidity providing or liquidity absorbing.
Other investment: an item in the b.o.p. and the i.i.p. that covers the fi nancial transactions/positions
with non-residents in trade credits, deposits and loans, and other accounts receivable and payable.
Portfolio investment: euro area residents’ net transactions and/or positions in securities issued
by non-residents of the euro area (“assets”) and non-residents’ net transactions and/or positions
in securities issued by euro area residents (“liabilities”). Included are equity securities and debt
securities (bonds and notes, and money market instruments). Transactions are recorded at the
effective price paid or received, less commissions and expenses. To be regarded as a portfolio asset,
ownership in an enterprise must be equivalent to less than 10% of the ordinary shares or voting
power.
Price stability: as defi ned by the Governing Council, a year-on-year increase in the HICP for the
euro area of below 2%. The Governing Council has also made it clear that, in the pursuit of price
stability, it aims to maintain infl ation rates below, but close to, 2% over the medium term.
Purchasing power parity (PPP): the rate at which one currency is converted into another so as
to equalise the purchasing power of the two currencies by eliminating the differences in the price
XIII
ECB
Monthly Bulletin
August 2012
levels prevailing in the countries concerned. In their simplest form, PPPs show the ratio of the
prices in national currency of the same good or service in different countries.
Reference value for M3 growth: the annual growth rate of M3 that is deemed to be compatible
with price stability over the medium term.
Reserve requirement: the requirement for institutions to hold minimum reserves with the central
bank over a maintenance period. Compliance with the requirement is determined on the basis of the
average of the daily balances in the reserve accounts over the maintenance period.
Reverse transaction: an operation whereby the NCB buys or sells assets under a repurchase
agreement or conducts credit operations against collateral.
Securitisation: a transaction or scheme whereby an asset or a pool of cash fl ow-producing assets,
often consisting of loans (mortgages, consumer loans, etc.), is transferred from an originator (usually
a credit institution) to a fi nancial vehicle corporation (FVC). The FVC effectively converts these
assets into marketable securities by issuing debt instruments with principal and interest serviced
through the cash fl ows produced by the asset pool.
Survey of Professional Forecasters (SPF): a quarterly survey that has been conducted by the
ECB since 1999 to collect macroeconomic forecasts on euro area infl ation, real GDP growth and
unemployment from a panel of experts affi liated to fi nancial and non-fi nancial organisations based
in the EU.
Unit labour costs: a measure of total labour costs per unit of output calculated for the euro area as
the ratio of total compensation per employee to labour productivity (defi ned as GDP (volume) per
person employed).
Variable rate tender: a tender procedure where the counterparties bid both the amount of money
they wish to transact with the central bank and the interest rate at which they wish to enter into the
transaction.
Volatility: the degree of fl uctuation in a given variable.
Write-down: a downward adjustment to the value of loans recorded in the balance sheets of MFIs
when it is recognised that the loans have become partly unrecoverable.
Write-off: the removal of the value of loans from the balance sheets of MFIs when the loans are
considered to be totally unrecoverable.
Yield curve: a graphical representation of the relationship between the interest rate or yield and the
residual maturity at a given point in time for suffi ciently homogenous debt securities with different
maturity dates. The slope of the yield curve can be measured as the difference between the interest
rates or yield at two selected maturities.
XIV