
Battery Test Manual For Electric Vehicles · Battery Test Manual For Electric Vehicles Jon P ......
67
The INL is a U.S. Department of Energy National Laboratory operated by Battelle Energy Alliance INL/EXT-15-34184 Revision 3 Battery Test Manual For Electric Vehicles Jon P. Christopherson June 2015
Transcript of Battery Test Manual For Electric Vehicles · Battery Test Manual For Electric Vehicles Jon P ......
The INL is a U.S. Department of Energy National Laboratory operated by Battelle Energy Alliance
INL/EXT-15-34184 Revision 3
Battery Test Manual For Electric Vehicles
Jon P. Christopherson
June 2015

INL/EXT-15-34184 Revision 3
Battery Test Manual For Electric Vehicles
Jon P. Christopherson
June 2015
Idaho National Laboratory
Idaho Falls, Idaho 83415
http://www.inl.gov
Prepared for the U.S. Department of Energy
Office of Energy Efficiency and Renewable Energy Under DOE Idaho Operations Office
Contract DE-AC07-05ID14517
INL/EXT-15-34184
U.S. Department of Energy Vehicle Technologies Program
Battery Test Manual For Electric Vehicles
REVISION 3
JUNE 2015
The Idaho National Laboratory is a U.S. Department of Energy National
Laboratory Operated by Battelle Energy Alliance

Disclaimer This manual was prepared as an account of work sponsored by an agency of the United States
Government. Neither the United States Government nor any agency thereof, nor any of their employees, makes any warranty, express or implied, or assumes any legal liability or responsibility for the accuracy, completeness, or usefulness of any information, apparatus, product, or process disclosed, or represents that its use would not infringe privately owned rights. References herein to any specific commercial product, process or service by trade name, trademark, manufacturer, or otherwise does not necessarily constitute or imply its endorsement, recommendation, or favoring by the United States Government or any agency thereof. The views and opinions of authors expressed herein do not necessarily state or reflect those of the United States Government or any agency thereof.
Battery Test Manual For Hybrid Electric Vehicles
REVISION 3
JUNE 2015
Prepared for the U.S. Department of Energy
Assistant Secretary for Energy Efficiency and Renewable Energy (EERE) Idaho Operations Office
Contract DE-AC07-05ID14517


i
FOREWORD
This battery test procedure manual was prepared for the United States Department of Energy (DOE), Office of Energy Efficiency and Renewable Energy (EERE), Vehicle Technologies Office. It is based on technical targets for commercial viability established for energy storage development projects aimed at meeting system level DOE goals for Electric Vehicles (EVs). The specific procedures defined in this manual support the performance and life characterization of advanced battery devices under development for EV applications. Due to the complexity of some of the procedures and supporting analysis, future revisions including some modifications and clarifications of these procedures are expected. As in previous battery and capacitor test manuals, this version of the manual defines testing methods for full-size battery systems, along with provisions for scaling these tests for modules, cells or other subscale level devices. The DOE-United States Advanced Battery Consortium (USABC), Technical Advisory Committee (TAC) supported the development of the manual. Technical Team points of contact responsible for its development and revision are Brian Cunningham (DOE), Chul Bae (Ford Motor Company), Oliver Gross (Fiat Chrysler Automobiles), and Harshad Tataria (General Motors). Jon P. Christophersen from Idaho National Laboratory was the primary author for the manual. The development of this manual was funded by the Unites States Department of Energy, Office of Energy Efficiency and Renewable Energy, Vehicle Technologies Office. Technical direction from DOE was provided by David Howell, Energy Storage R&D Manager and Hybrid Electric Systems Team Leader.

ii
iii
CONTENTS
FOREWORD ................................................................................................................................... i
ACRONYMS ................................................................................................................................ vii
GLOSSARY .................................................................................................................................. ix
1. PURPOSE AND APPLICABILITY ......................................................................................1
1.1 Energy Storage Targets For Electric Vehicles ......................................................................... 1
2. TEST PROFILES DERIVED FROM TARGETS .................................................................3
3. TEST PROCEDURES ...........................................................................................................3
3.1 General Test Conditions and Scaling ....................................................................................... 3 3.1.1 Voltage Limits ....................................................................................................... 3 3.1.2 Temperature Control .............................................................................................. 4 3.1.3 Pressure control...................................................................................................... 4 3.1.4 Battery Size Factor................................................................................................. 4 3.1.5 Charging Procedure ............................................................................................... 4
3.2 Static Capacity Test ................................................................................................................. 5
3.3 High Rate Charge ..................................................................................................................... 5
3.4 Hybrid Pulse Power Characterization Test .............................................................................. 6 3.4.1 Hybrid Pulse Power Characterization Test Profile ................................................ 6 3.4.2 Test Procedure Description .................................................................................... 7 3.4.3 HPPC Available Energy Verification Test ............................................................ 9
3.5 Peak Power Test ..................................................................................................................... 10 3.5.1 Peak Power Test Profile ....................................................................................... 10 3.5.2 Test Procedure Description .................................................................................. 11
3.6 Self-Discharge Test ................................................................................................................ 12
3.7 Thermal Performance Test ..................................................................................................... 13 3.7.1 Survival Temperature Test ................................................................................... 13
3.8 Life Testing ............................................................................................................................ 14
3.9 Cycle Life Dynamic Stress Tests ........................................................................................... 16 3.9.1 Cycle Life Test Procedure Outline ...................................................................... 16 3.9.2 Cycle Life Dynamic Stress Test Profile ............................................................... 18
3.10 Calendar Life Test .................................................................................................................. 19 3.10.1 Calendar Life Test Planning ................................................................................ 19 3.10.2 Calendar Life Test Procedure .............................................................................. 20 3.10.3 Calendar Life Test Profile .................................................................................... 21 3.10.4 Alternative Calendar Life Test ............................................................................ 22
3.11 Reference Performance Tests ................................................................................................. 23
4. ANALYSIS AND REPORTING OF TEST RESULTS ......................................................24
4.1 General ................................................................................................................................... 24
4.2 Static Capacity Test ............................................................................................................... 24 4.2.1 Capacity Fade ...................................................................................................... 24
iv
4.2.2 Energy Fade ......................................................................................................... 24
4.3 High Rate Charge ................................................................................................................... 25
4.4 Hybrid Pulse Power Characterization Test ............................................................................ 25 4.4.1 Overall Analysis Approach .................................................................................. 25 4.4.2 Pulse Resistance ................................................................................................... 26 4.4.3 Pulse Power Capability ........................................................................................ 28 4.4.4 Available Energy and Peak Power ....................................................................... 30 4.4.5 Power and Energy Fade ....................................................................................... 31 4.4.6 Other Laboratory Cell Performance Characteristics ............................................ 32
4.5 Peak Power Test ..................................................................................................................... 32 4.5.1 Overall Analysis Approach .................................................................................. 32 4.5.2 Pulse Resistance ................................................................................................... 33 4.5.3 Pulse Power Capability ...................................................................................... 34 4.5.4 Peak Discharge Power ......................................................................................... 36 4.5.5 Power and Energy Fade ....................................................................................... 37 4.5.6 Other Laboratory Cell Performance Characteristics ............................................ 38
4.6 Self-Discharge Test ................................................................................................................ 38
4.7 Thermal Performance Tests ................................................................................................... 38 4.7.1 Survival Temperature Test ................................................................................... 39
4.8 Cycle Life Tests ..................................................................................................................... 39
4.9 Calendar Life Test .................................................................................................................. 39
4.10 Reference Performance Tests ................................................................................................. 40
4.11 Module Controls Verification Tests ....................................................................................... 40
4.12 System-Level Testing ............................................................................................................ 40
5. REFERENCES .....................................................................................................................41
Appendix A - Sample Test Plan.....................................................................................................42
Appendix B - Gap Analysis Reporting ..........................................................................................47
Appendix C – Voltage definitions .................................................................................................50
v
FIGURES
Figure 1. Hybrid Pulse Power Characterization Test Profile. ....................................................................... 7
Figure 2. Hybrid Pulse Power Characterization Test (start of test sequence). ............................................. 8
Figure 3. Hybrid Pulse Power Characterization Test (complete HPPC sequence). ..................................... 9
Figure 4. Peak Power Test Profile. ............................................................................................................. 11
Figure 5. Peak Power Test Sequence. ........................................................................................................ 12
Figure 6. Charge-Depleting Cycle Life Test Profile for the EV Battery. .................................................. 19
Figure 7. Calendar Life Test Profile. ......................................................................................................... 22
Figure 8. Resistance calculation time points. ............................................................................................. 26
Figure 9. Open-circuit voltage and pulse resistances versus capacity removed for HPPC test. ................ 27
Figure 10. Pulse power capability vs %-removed of operating capacity for HPPC test. ............................ 28
Figure 11. Relationship Between Energy and %-Capacity Removed in a C/3 Discharge ......................... 29
Figure 12. Unscaled HPPC Cell Power Capability vs. Energy Removed.................................................. 30
Figure 13. Available Energy and Peak Power Determination. .................................................................. 31
Figure 14. Resistance calculation time points for the Peak Power test. ..................................................... 33
Figure 15. Open-circuit voltage and pulse resistances versus capacity removed. ..................................... 34
Figure 17. Unscaled Peak Power capability vs. energy removed. ............................................................. 36
Figure 18. Available Energy and Peak Power Determination from Peak Power test. ............................... 37
Figure B.1. Gap Analysis – HPPC .............................................................................................................. 47
Figure B.2. Gap Analysis – Peak Power .................................................................................................... 48
Figure C.1. Voltage Definitions and Key Concepts .................................................................................... 50

vi
TABLES
Table 1. Energy Storage System Performance Targets for Electric Vehicles ............................................. 2
Table 2. Hybrid Pulse Power Characterization Test Profile. ....................................................................... 6
Table 3. DST Cycle Life Test Profile for the EV Battery. ........................................................................ 18
Table 4. Calendar Life Test Profile. .......................................................................................................... 21
Table 5. Reference Performance Tests and Test Intervals for Life Testing. ............................................. 23
Table B.1. Gap Analysis ........................................................................................................................... 49
vii
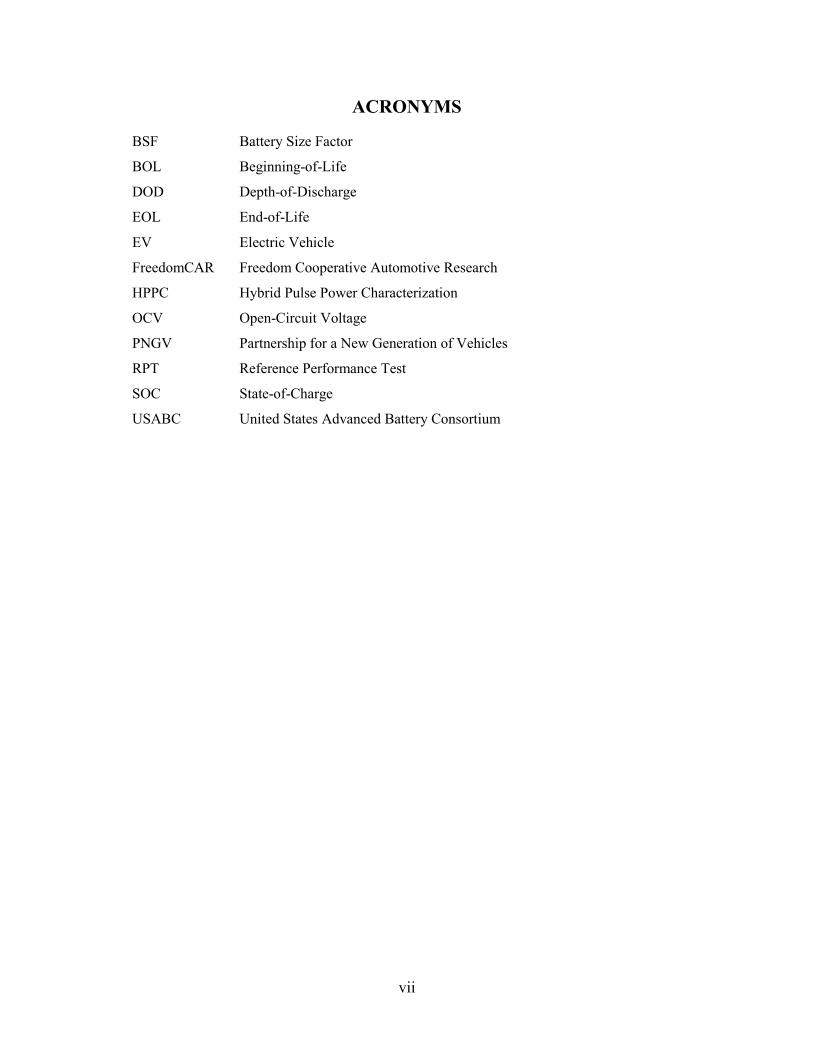
ACRONYMS
BSF Battery Size Factor
BOL Beginning-of-Life
DOD Depth-of-Discharge
EOL End-of-Life
EV Electric Vehicle
FreedomCAR Freedom Cooperative Automotive Research
HPPC Hybrid Pulse Power Characterization
OCV Open-Circuit Voltage
PNGV Partnership for a New Generation of Vehicles
RPT Reference Performance Test
SOC State-of-Charge
USABC United States Advanced Battery Consortium

viii
ix
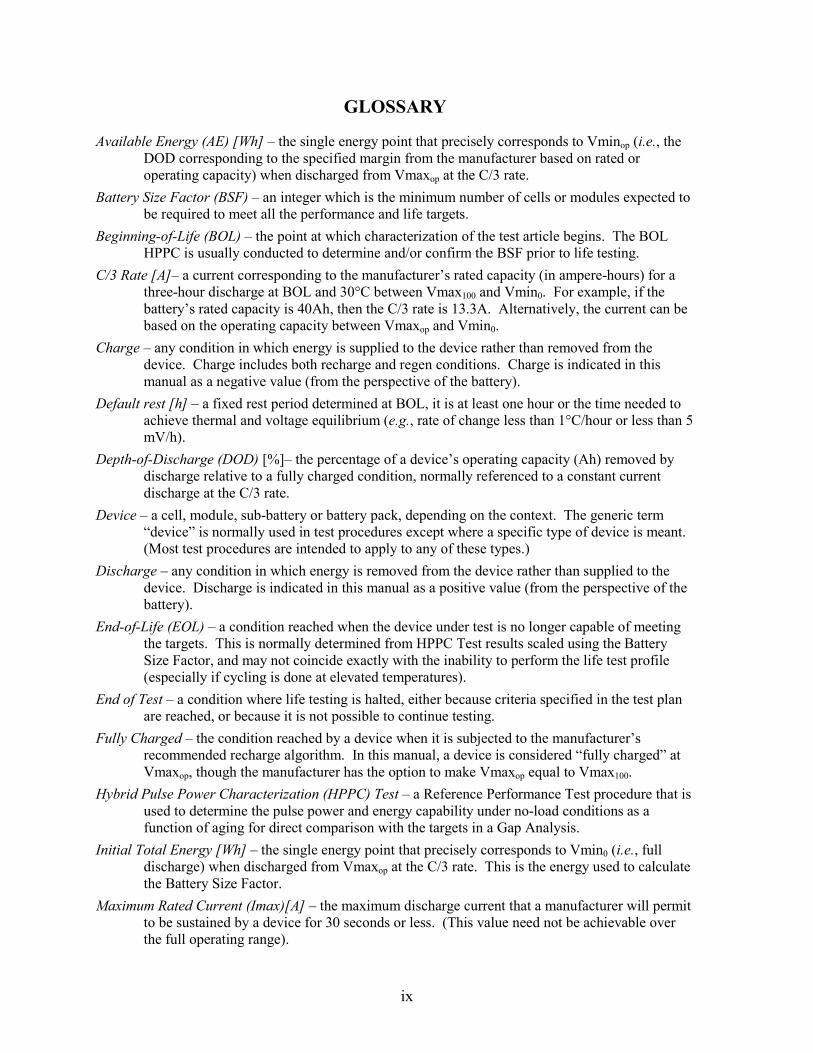
GLOSSARY
Available Energy (AE) [Wh] – the single energy point that precisely corresponds to Vminop (i.e., the DOD corresponding to the specified margin from the manufacturer based on rated or operating capacity) when discharged from Vmaxop at the C/3 rate.
Battery Size Factor (BSF) – an integer which is the minimum number of cells or modules expected to be required to meet all the performance and life targets.
Beginning-of-Life (BOL) – the point at which characterization of the test article begins. The BOL HPPC is usually conducted to determine and/or confirm the BSF prior to life testing.
C/3 Rate [A]– a current corresponding to the manufacturer’s rated capacity (in ampere-hours) for a three-hour discharge at BOL and 30°C between Vmax100 and Vmin0. For example, if the battery’s rated capacity is 40Ah, then the C/3 rate is 13.3A. Alternatively, the current can be based on the operating capacity between Vmaxop and Vmin0.
Charge – any condition in which energy is supplied to the device rather than removed from the device. Charge includes both recharge and regen conditions. Charge is indicated in this manual as a negative value (from the perspective of the battery).
Default rest [h] – a fixed rest period determined at BOL, it is at least one hour or the time needed to achieve thermal and voltage equilibrium (e.g., rate of change less than 1°C/hour or less than 5 mV/h).
Depth-of-Discharge (DOD) [%]– the percentage of a device’s operating capacity (Ah) removed by discharge relative to a fully charged condition, normally referenced to a constant current discharge at the C/3 rate.
Device – a cell, module, sub-battery or battery pack, depending on the context. The generic term “device” is normally used in test procedures except where a specific type of device is meant. (Most test procedures are intended to apply to any of these types.)
Discharge – any condition in which energy is removed from the device rather than supplied to the device. Discharge is indicated in this manual as a positive value (from the perspective of the battery).
End-of-Life (EOL) – a condition reached when the device under test is no longer capable of meeting the targets. This is normally determined from HPPC Test results scaled using the Battery Size Factor, and may not coincide exactly with the inability to perform the life test profile (especially if cycling is done at elevated temperatures).
End of Test – a condition where life testing is halted, either because criteria specified in the test plan are reached, or because it is not possible to continue testing.
Fully Charged – the condition reached by a device when it is subjected to the manufacturer’s recommended recharge algorithm. In this manual, a device is considered “fully charged” at Vmaxop, though the manufacturer has the option to make Vmaxop equal to Vmax100.
Hybrid Pulse Power Characterization (HPPC) Test – a Reference Performance Test procedure that is used to determine the pulse power and energy capability under no-load conditions as a function of aging for direct comparison with the targets in a Gap Analysis.
Initial Total Energy [Wh] – the single energy point that precisely corresponds to Vmin0 (i.e., full discharge) when discharged from Vmaxop at the C/3 rate. This is the energy used to calculate the Battery Size Factor.
Maximum Rated Current (Imax)[A] – the maximum discharge current that a manufacturer will permit to be sustained by a device for 30 seconds or less. (This value need not be achievable over the full operating range).
x
Operating Capacity [Ah] – the useable capacity at a C/3 rate over the full operating range of the device between Vmaxop and Vmin0. The operating capacity should be provided by the manufacturer, or it is established at BOL and remains fixed during life aging.
Peak Power Test – a Reference Performance Test procedure that is used to determine the discharge pulse power and energy capability under load conditions as a function of aging for direct comparison with the targets in a Gap Analysis.
Power Fade [W] - the change in Peak Discharge Power from RPT0 measured at the DOD corresponding to Vminop to the value determined at some later time, expressed as a percentage of the BOL value. (Similar definitions apply to Capacity Fade and Available Energy Fade, although these are not included in this glossary).
Power Margin (W) – for a given Peak Discharge Power, the difference between the calculated peak discharge power and the corresponding power target for a given application.
Profile – a connected sequence of pulses used as the basic ‘building block’ of many test procedures. A test profile normally includes discharge, rest and charge steps in a specific order, and each step is normally defined as having a fixed time duration and a particular (fixed) value of current or power.
Rated Capacity [Ah] – the useable capacity at a C/3 rate over the full electrochemical range of the device between Vmax100 and Vmin0. The rated capacity should be provided by the manufacturer, or it is established at BOL and remains fixed during life aging.
Recharge – a charge interval corresponding to the sustained replenishment of energy by a continuous current or power source (such as an engine-generator or off-board charger).
Reference Performance Test (RPT) – periodic interruptions during calendar and cycle life aging to gauge degradation in the test article (see Section 3.11). Degradation rates are established by comparing results from the RPTs during life testing with respect to the initial RPT performed immediately prior to the start of life testing (usually referred to as RPT0).
Regen – a charge interval corresponding to the return of vehicle kinetic energy to a device (typically from braking). Because of physical limitations, high rates of regen can only persist for a few seconds at a time. Regen in this manual is indicated as a negative value (from the perspective of the battery).
Rest – the condition in which energy is neither supplied to the device nor removed from the device. Rest is indicated by zero current.
State- of-Charge (SOC) [%] – an estimate of the device charge capability expressed as a percentage of the BOL rated or operating capacity and typically reached by obtaining specified voltages.
Voltage limits [V] – numerous voltage limits are defined in the manual as follows: Vmaxpulse [V] – the regen voltage limit; maximum voltage allowed during regen pulses of 10s or
less. Vmax100 [V] - manufacturer’s specified voltage and the basis for the rated capacity. Vmaxop [V] – corresponds to the upper end of the intended operating window, as specified by the
manufacturer. This is the relevant upper voltage used in all testing unless otherwise specified and the basis for the operating capacity. This voltage cannot exceed 420 V (scaled) based on the established performance requirements.
Vminop [V] – (optional) corresponds to the lower end of the intended operating window. It is a variable parameter that will generally decrease as the test article ages and the minimum value is typically specified by the manufacturer.
xi
Vmin0 [V] – manufacturer’s specified voltage corresponding to the minimum operating voltage (Vmin0). This voltage cannot be less than 220 V (scaled) based on the established performance requirements.
Vminpulse [V] – minimum voltage allowed during discharge pulses of 30s or less. VminLow T [V] – the minimum voltage allowable at less than or equal to 0°C set by the
manufacturer and the technical program manager. Vnominal [V] – The nominal electrochemical voltage between Vmax100 and Vmin0. It is determined
by the ratio between the total discharge energy and discharge capacity from the static capacity test (see Section 3.2).
1
Battery Test Manual For Electric Vehicles
1. PURPOSE AND APPLICABILITY
This manual defines a series of tests to characterize aspects of the performance or life behavior of batteries for electric vehicle (EV) applications. Tests are defined based on the Vehicle Technologies Office targets for electric vehicles and it is anticipated that these tests may be generally useful for testing energy storage devices designed for this purpose. The test procedures in this manual are directly applicable to both the complete battery systems as well as cell-level devices. Much of the rationale for the test procedures and analytical methodologies utilized in this manual evolved from Revision 2 of the USABC Electric Vehicle Battery Test Procedure Manual (Reference 1), the PNGV Battery Test Manual (Reference 2), the FreedomCAR Battery Test Manual for Power-Assist Hybrid Electric Vehicles (Reference 3) and the Battery Test Manual for Plug-In Hybrid Electric Vehicles (Reference 4). Deviations from the test or analysis procedures defined in this manual must be approved by the USABC technical program manager.
1.1 Energy Storage Targets For Electric Vehicles
The Department of Energy’s Vehicle Technologies Office Energy Storage Targets for EVs are the primary driving force for the test procedures and methods defined in this manual. The targets are outlined in Table 1 for a car having an equivalent electric range of 200 miles based on an Urban Dynamometer Driving Schedule (UDDS) cycle. Establishing or verifying battery performance in comparison to these targets is a principal objective of the test procedures defined in this document. Unless otherwise stated, these targets all pertain to devices operating at 30°C. This manual defines a charge depleting operational mode, which is intended to allow the vehicle to operate in an all-electric mode (propulsion and accessories powered by the electric drive and onboard electric energy storage), with a net decrease in battery state-of-charge (SOC).

2
Table 1. Energy Storage System Performance Targets for Electric Vehicles End of Life Characteristics at 30°C Units System Level Cell Level
Peak Discharge Power Density (30 sec) W/L 1000 1500 Peak Specific Discharge Power (30 sec) W/kg 470 700 Peak Specific Regen Power (10 sec) W/kg 200 300 Available Energy Density @ C/3 Discharge Rate Wh/L 500 750 Available Specific Energy @ C/3 Discharge Rate Wh/ kg 235 350 Available Energy @ C/3 Discharge Rate kWh 45 N/A Calendar Life Years 15 15 DST Cycle Life Cycles 1000 1000 Selling Price @ 100K units $/kWh 125 100 Operating Environment °C -30 to +52 -30 to +52 Normal Recharge Time Hours < 7 Hours, J1772 < 7 Hours, J1772 High Rate Charge Minutes 80% DSOC in 15 min 80% DSOC in 15 min Maximum Operating Voltage V 420 N/A Minimum Operating Voltage V 220 N/A Peak Current (30 sec) A 400 400
Unassisted Operating at Low Temperature %
>70% Available Energy @ C/3
Discharge rate at -20°C
>70% Available Energy @ C/3
Discharge rate at -20°C
Survival Temperature Range, 24 hr °C -40 to +66 -40 to +66 Maximum Self-Discharge %/month < 1 < 1
NOTES
i. Values correspond to End-of-Life (EOL). ii. The targets correspond to commercialization goals in FY 2020. iii. Normal Recharge Time assumes a Level 2 charging based on J1772-2009 standards. No test is defined in this manual
for this target and manufacturers can specify their own charging algorithm provided that it is consistent with this standard.
iv. The High Rate Charge is based on a 3.2C rate and allows for a 20% SOC margin in energy. v. Note that the targets listed in the open RFPI released on October 2014 used “Useable Energy,” but the terminology has
been changed to “Available Energy” to remain consistent with other USABC test manuals. vi. For the Unassisted Operating at Low Temperature target, >70% Available energy refers to >31.5 kWh at the C/3
discharge rate for the system level.
3
2. TEST PROFILES DERIVED FROM TARGETS
The test procedures described in this manual are intended for use over a broad range of devices at various stages of developmental maturity. The approach taken for these procedures is to define a small set of test profiles based on the overall vehicle characteristics, independent of the size or capability of the device to be tested. These test profiles are specified in terms of the characteristics of vehicle power demand. They can be used in various combinations, with the appropriate scaling factors, to define specific performance, calendar or cycle life tests for cells, modules or battery systems.
3. TEST PROCEDURES
3.1 General Test Conditions and Scaling
In general, testing is divided into three broad phases, i.e., characterization, life, and reference performance testing. Characterization testing establishes the baseline performance and includes static capacity, hybrid pulse power characterization (HPPC), peak power, self-discharge, and thermal performance tests.1 Life testing establishes behavior over time at various temperatures, states of charge and other stress conditions and includes both cycle life and calendar life testing. Reference Performance Tests establish changes in the baseline performance and are performed periodically during life testing, as well as at the start- and end-of-life testing. A generic test plan for testing is outlined in Appendix A; this outline can be used as a starting point for device-specific test plans.
3.1.1 Voltage Limits
Several voltage limits are defined in this manual for the purposes of testing and analysis (see Appendix C). The electrochemical voltage range between 100% SOC and 0% SOC are referred to as Vmax100 and Vmin0, respectively. Vnominal is the nominal electrochemical voltage between Vmax100 and Vmin0 (i.e., total energy divided by capacity). For example, if the total discharge capacity (rated) is 2 Ah and discharge energy is 7 Wh from the initial static capacity test, then Vnominal = (Wh / Ah) = 3.5V. Since energy storage devices in EV applications may not operate at 100% SOC, the test protocols defined in this manual also assume a maximum operating voltage, Vmaxop which corresponds to the upper end of the intended operating window. Note that in many cases for EV applications, Vmaxop can equal Vmax100. For the purposes of this manual, a “fully charged device” is when the device has been charged to Vmaxop using the manufacturer’s recommended procedure, unless otherwise specified. All tests should be conducted within the operating window between Vmaxop and Vmin0. Note that if Vmaxop is not the same as Vmax100, the manufacturer should also supply the operating capacity of the device (i.e., defined between Vmaxop and Vmin0) in addition to the rated capacity (i.e., defined between Vmax100 and Vmin0). As with the rated capacity, the operating capacity is defined during the initial characterizations tests and is fixed during aging. It is used to establish the device’s depth-of-discharge (DOD) condition from a fully charged state at Vmaxop.
In addition to the operating voltage limits, the maximum and minimum pulse voltage limits (Vmaxpulse, Vminpulse) should also be specified by the manufacturer for short duration (≤30s) charge or discharge pulses, respectively. A minimum voltage condition (VminLowT) should also be specified for short duration 1. In this manual, unless specifically stated otherwise, the desired test condition is typically established as a percentage of the
operating capacity, which is always reached by removing the appropriate fraction of the rated capacity from a fully charged device (normally at a constant C/3 discharge rate.) Also, the term “fully charged” means “charged in accordance with the manufacturer’s recommended procedure” to Vmaxop for operation.
4
pulses (≤30s) that are conducted at low temperatures (i.e., ≤0°C). All of these voltage limits must be carefully observed during performance testing to ensure proper operation of the energy storage device.
3.1.2 Temperature Control
Unless otherwise specified in a device-specific test plan, the ambient temperature for all tests should be controlled at a default nominal temperature of 30ºC. Also, to the extent possible, all testing should be conducted using environmental chambers. As a general practice, a rest of no less than 60 minutes should be observed after each charge and each discharge prior to proceeding with further testing, to allow devices to reach stable voltage and temperature conditions. A longer rest is likely to be required for modules or packs.
3.1.3 Pressure control
Unless otherwise specified in a device-specific test plan, pouch or prismatic cell pressure should be established by placing the device between two plates with four to six bolts around the edges that are tightened using torque specifications provided by the manufacturer (or finger tightened if no specification is provided). Preferably, spacers between the two plates should be used to ensure a sufficient gap between the plates. As a general practice, once the pouch pressure has been set, the device should be placed in an environmental chamber and left undisturbed for the duration of the test period. The devices should occasionally be visually inspected periodically for any signs of swelling or leaking.
3.1.4 Battery Size Factor
The Battery Size Factor (BSF) is a scaling ratio that defines the minimum number of units (cells, modules, or sub-batteries) of a given design required for a device to meet the energy and power targets. Wherever possible, the Battery Size Factor will be specified by the manufacturer with guidance from the USABC technical program manager, based on the manufacturer’s testing and best estimates of any allowances needed for system burdens and degradation over life. To determine the BSF, the manufacturer must first identify a key degradation parameter (e.g., capacity, energy, etc.) and establish a sufficient margin at beginning-of-life (BOL) to ensure the power and energy targets are still met at end-of-life (i.e., 15 years or 1000 cycles as defined in Table 1). For example, if the manufacturer determines a 20% energy margin at beginning-of-life, discharge the device at a C/3 rate from Vmaxop to Vmin0 and record the energy removed. The BSF is then determined from dividing the energy target by the energy removed from a fully discharged cell scaled by the margin (45 kWh / 80% of the energy removed in this example). This BSF is based on the number of units connected in a parallel configuration and shall be rounded to the next highest integer value. If needed, the BSF can also be increased with the addition of series strings to ensure the voltage targets in Table 1 are also met. Note that increasing the BSF will lead to a higher cost system and should be done judiciously. The manufacturer should select the margin such that the peak discharge power pulse can also be successfully completed at end-of-life once the energy has been removed from Vmaxop. Additionally, to avoid exceeding the maximum current limit, Vminpulse multiplied by the BSF may not be set below the Minimum Operating Voltage of the system provided in Table 1. Once the Battery Size Factor is determined, it is fixed for the life of the cell and used as the scaling factor for subsequent performance testing. If the manufacturer is unable to supply a margin, use a default energy margin of 20% with approval from the technical program manager and the manufacturer (i.e., the margin should ensure the power and energy targets are successfully met).
3.1.5 Charging Procedure
The manufacturer is responsible for defining a reasonable charging procedure with the assistance of the technical program manager. This charging procedure should specify default rest periods before and after
5
(at least 1 hour is recommended) charging is performed. During charge depletion cycle life testing, a rest period of 15 minutes can be used to accelerate testing before and after charging. This is a default value and can be adjusted based on the needs of the chemistry.
3.2 Static Capacity Test
This test measures device capacity in ampere-hours at a C/3 constant current discharge rate corresponding to the rated capacity. Discharge begins following a default rest from a fully-charged state to Vmax100 and is terminated on a manufacturer-specified discharge voltage limit (Vmin0), followed by a default rest at open-circuit voltage. If the measured capacity is significantly different from the rated (i.e., more than ±10%), notify the technical program manager before continuing testing and determine if the capacity needs to be re-rated. 2 The static capacity test is to be performed until three consecutive discharge capacities are stable within ±2% up to a maximum of 10 discharges. If the device is unable to reach stability after 10 discharges, the technical program manager should be notified.
In the case where the operating voltage limit is different from the electrochemical voltage range (i.e., Vmaxop < Vmax100), the static capacity test shall be repeated using operating capacity, which should also be specified by the manufacturer.3 Discharge begins following a default rest from a fully-charged state to Vmaxop and is terminated on a manufacturer-specified discharge voltage limit (Vmin0), followed by a default rest at open-circuit voltage. If the measured capacity is significantly different from the operating (i.e., more than ±10%), notify the technical program manager before continuing testing and determine if the capacity needs to be re-rated. The static capacity test is to be performed until three consecutive discharge capacities are stable within ±2% up to a maximum of 10 discharges. If the device is unable to reach stability after 10 discharges, the technical program manager should be notified.
3.3 High Rate Charge
The High Rate Charge test verifies the ability of the test article to provide a portion of the operating capacity based on a constant current charge from Vmin0 over a 15 minute period. The manufacturer should supply the current level to be applied for this test, but if it is not available, use a 3.2C rate as a default condition.4 The test sequence is as follows:
1. From a fully charged state at Vmaxop, discharge to Vminop (i.e., the operating capacity corresponding to the BOL margin specified by the manufacturer) at a C/3 rate (do not taper the current once the appropriate amount of capacity has been removed).
2. Rest for 1 hour at open-circuit voltage conditions.
2. If initial Static Capacity Tests indicate that the manufacturer’s rated/operating capacity is clearly not representative of the
device’s actual capacity, the value to be used as the rated/ operating capacity may be re-defined by USABC program management before testing continues. Use of a reasonably representative capacity value is important for high quality HPPC and Peak Power test results.
3. If the operating voltage limit is less than Vmax100, all subsequent testing shall be based on the BOL operating capacity which remains fixed during life aging.
4. If the developer believes the devices may be damaged from the high rate charge, use devices that are not designated for calendar or cycle life aging instead. The static capacity test (Section 3.2) should also be repeated to confirm the status of the devices.
6
3. Charge at the specified high rate constant current level for 15 minutes. If Vmaxop is reached during the charge, taper the current to complete the 15 minute charge time.
3.4 Hybrid Pulse Power Characterization Test
The Hybrid Pulse Power Characterization (HPPC) Test is intended to determine dynamic power capability over the device’s useable voltage range using a test profile that incorporates both discharge and regen pulses. The first step of this test is to establish, as a function of capacity removed (a) the Vminpulse discharge power capability at the end of a 30-s discharge current pulse and (b) the Vmaxpulse regen power capability at the end of a 10-s regen current pulse.5 These power and energy capabilities are then used to derive other performance characteristics such as Peak Power and Available Energy for direct comparison with the targets specified in Table 1.
Additional data from the HPPC test include the voltage response curves, from which the fixed (ohmic) cell resistance and cell polarization resistance as a function of capacity removed can be determined assuming sufficient resolution to reliably establish cell voltage response time constants during discharge, rest, and regen operating regimes. These data can be used to evaluate resistance degradation during subsequent life testing and to develop hybrid battery performance models for vehicle systems analysis.
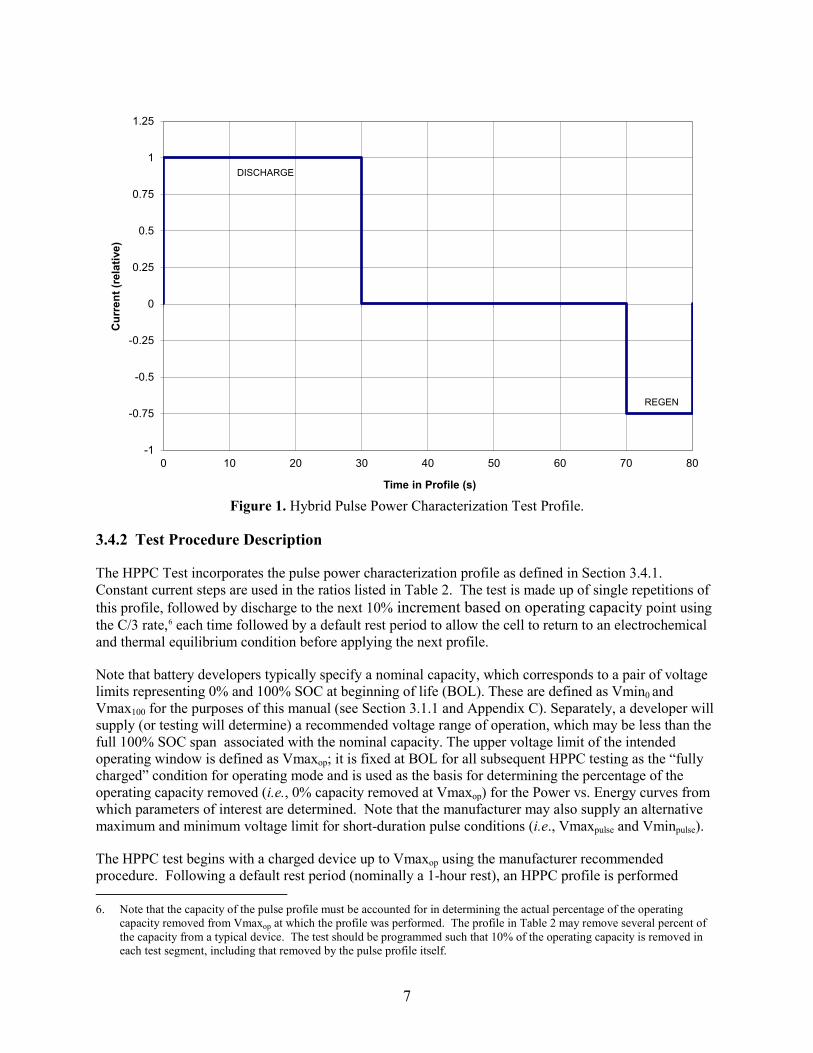
3.4.1 Hybrid Pulse Power Characterization Test Profile
The objective of this test is to determine the 30-second discharge-pulse and the 10-second regen-pulse power capabilities at each 10% increment relative to the BOL operating capacity for the EV Targets (e.g., for a 2 Ah cell, power capabilities are assessed at 0.2 Ah increments between Vmaxop and Vmin0). Between each pair of discharge and regen pulses, the device is discharged to the next 10% increment based on operating capacity using the C/3 rate. The pulse profile is shown in Table 2 and Figure 1.
Note that the current values are relative, not absolute. The actual current values are determined as defined at the end of Section 3.4.2. Also, note that this manual uses positive values for discharge current and power, whereas charge or regen values are negative.
Table 2. Hybrid Pulse Power Characterization Test Profile.
Time Increment
(s) Cumulative Time (s) Relative Currents
30 30 1.00 40 70 0 10 80 -0.75
5. Vminpulse and Vmaxpulse refer to the device minimum and maximum voltages that correspond to the operating voltage range
for the purposes of this manual as defined in Section 3.1.1. For cells, the specific voltages can be any values appropriate to the technology as long as they fall within the BSF-scaled limits in Table 1. Expanded definition of voltages can be found in Appendix C.
7
Figure 1. Hybrid Pulse Power Characterization Test Profile.
3.4.2 Test Procedure Description
The HPPC Test incorporates the pulse power characterization profile as defined in Section 3.4.1. Constant current steps are used in the ratios listed in Table 2. The test is made up of single repetitions of this profile, followed by discharge to the next 10% increment based on operating capacity point using the C/3 rate,6 each time followed by a default rest period to allow the cell to return to an electrochemical and thermal equilibrium condition before applying the next profile.
Note that battery developers typically specify a nominal capacity, which corresponds to a pair of voltage limits representing 0% and 100% SOC at beginning of life (BOL). These are defined as Vmin0 and Vmax100 for the purposes of this manual (see Section 3.1.1 and Appendix C). Separately, a developer will supply (or testing will determine) a recommended voltage range of operation, which may be less than the full 100% SOC span associated with the nominal capacity. The upper voltage limit of the intended operating window is defined as Vmaxop; it is fixed at BOL for all subsequent HPPC testing as the “fully charged” condition for operating mode and is used as the basis for determining the percentage of the operating capacity removed (i.e., 0% capacity removed at Vmaxop) for the Power vs. Energy curves from which parameters of interest are determined. Note that the manufacturer may also supply an alternative maximum and minimum voltage limit for short-duration pulse conditions (i.e., Vmaxpulse and Vminpulse).
The HPPC test begins with a charged device up to Vmaxop using the manufacturer recommended procedure. Following a default rest period (nominally a 1-hour rest), an HPPC profile is performed 6. Note that the capacity of the pulse profile must be accounted for in determining the actual percentage of the operating
capacity removed from Vmaxop at which the profile was performed. The profile in Table 2 may remove several percent of the capacity from a typical device. The test should be programmed such that 10% of the operating capacity is removed in each test segment, including that removed by the pulse profile itself.
-1
-0.75
-0.5
-0.25
0
0.25
0.5
0.75
1
1.25
0 10 20 30 40 50 60 70 80
Cur
rent
(rel
ativ
e)
Time in Profile (s)
DISCHARGE
REGEN

8
immediately followed by a discharge to the next 10% increment of the rated capacity at the C/3 rate (based on the established operating capacity at BOL) and a default rest. This sequence is repeated until the final profile at or near 90% of the operating capacity removed (or the maximum discharge specified by the manufacturer). The test terminates with a discharge of the device at the C/3 rate to Vmin0 and a final default rest. If at any point Vmin0 is reached during an HPPC pulse then taper the current to finish the pulse.7 If Vmin0 is reached in the C/3 discharge portion, stop the test. The voltages during each rest period are recorded to establish the cell’s OCV (open-circuit voltage) behavior. The sequence of rest periods, pulse profiles, and discharge segments is illustrated in Figures 2 and 3. These figures also illustrate the C/3 discharge to be executed just prior to each HPPC Test.8
Figure 2. Hybrid Pulse Power Characterization Test (start of test sequence).
7. The capacity removed during both the HPPC pulse and 10% discharges need to be tracked to ensure that the depth-of-
discharge is appropriately monitored and reported for each pulse relative to the operating capacity established at BOL.
8. This C/3 discharge is required because the HPPC results will eventually be reported as power capability versus energy removed at a C/3 rate. The availability of linked HPPC-Current data facilitates this analysis and reporting; see Section 4.3.
-360 -300 -240 -180 -120 -60 0 60 120 180
Cur
rent
Time (minutes)
Discharge
Regen
Full Discharge at C1/3 Rate
Full Recharge (operating capacity)
10% Increment
NOTE: Time scale is approximate because some elements in the test sequence have variable length. For example, the 100% SOC discharge is conducted to a minimum voltage, not necessarily for one hour.
1 hour Rest
HPPC Profile
HPPC Profile
10% Increment
1 hour Rest 1 hour Rest1 hour Rest
9
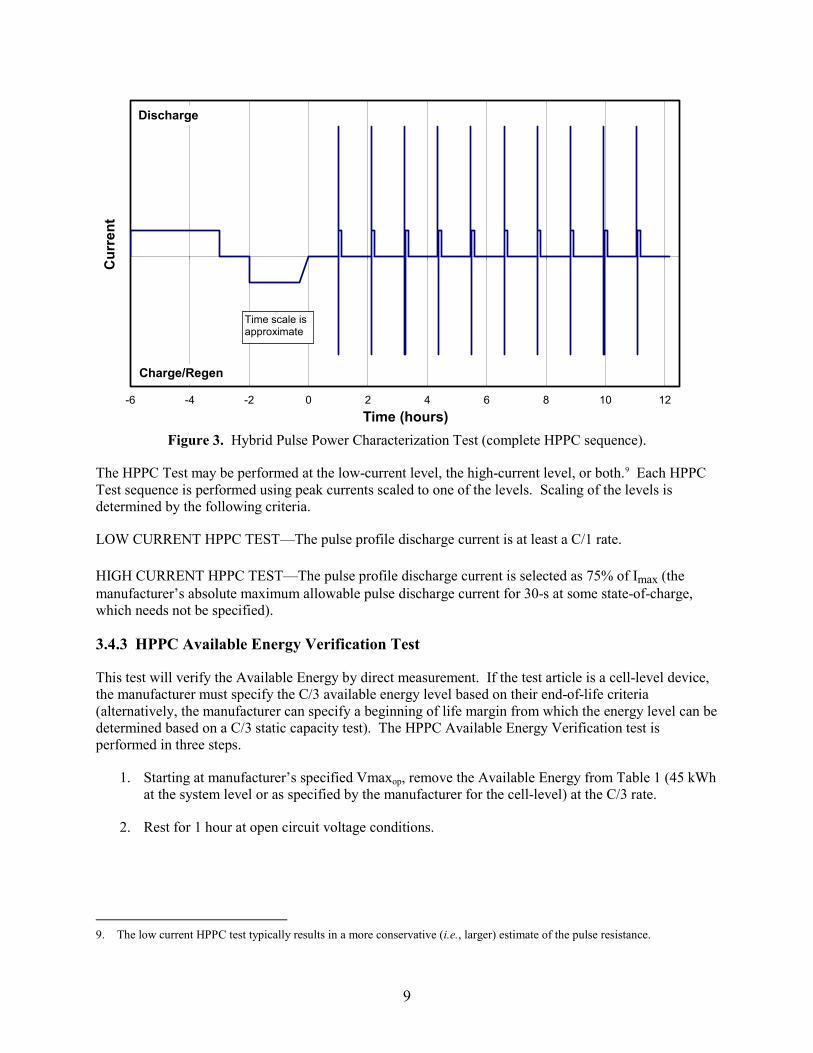
Figure 3. Hybrid Pulse Power Characterization Test (complete HPPC sequence).
The HPPC Test may be performed at the low-current level, the high-current level, or both.9 Each HPPC Test sequence is performed using peak currents scaled to one of the levels. Scaling of the levels is determined by the following criteria.
LOW CURRENT HPPC TEST—The pulse profile discharge current is at least a C/1 rate.
HIGH CURRENT HPPC TEST—The pulse profile discharge current is selected as 75% of Imax (the manufacturer’s absolute maximum allowable pulse discharge current for 30-s at some state-of-charge, which needs not be specified).
3.4.3 HPPC Available Energy Verification Test
This test will verify the Available Energy by direct measurement. If the test article is a cell-level device, the manufacturer must specify the C/3 available energy level based on their end-of-life criteria (alternatively, the manufacturer can specify a beginning of life margin from which the energy level can be determined based on a C/3 static capacity test). The HPPC Available Energy Verification test is performed in three steps.
1. Starting at manufacturer’s specified Vmaxop, remove the Available Energy from Table 1 (45 kWh at the system level or as specified by the manufacturer for the cell-level) at the C/3 rate.
2. Rest for 1 hour at open circuit voltage conditions.
9. The low current HPPC test typically results in a more conservative (i.e., larger) estimate of the pulse resistance.
-6 -4 -2 0 2 4 6 8 10 12
Cur
rent
Time (hours)
Discharge
Charge/Regen
Time scale is approximate
10
3. Perform a 30-s discharge pulse at the appropriate power levels (specified in Table 1).10 If the pulse is performed without violating the minimum voltage requirements (i.e., Vminpulse), the test article has passed the energy verification test.11
3.5 Peak Power Test
The Peak Power Test is intended to determine dynamic pulse power capability over the device’s useable voltage range under load conditions. The test consists of a single discharge at a given Base Current with periodic discharge pulses at a High Test Current starting from Vmaxop. No rest periods or charge pulses are included in this test sequence.
3.5.1 Peak Power Test Profile
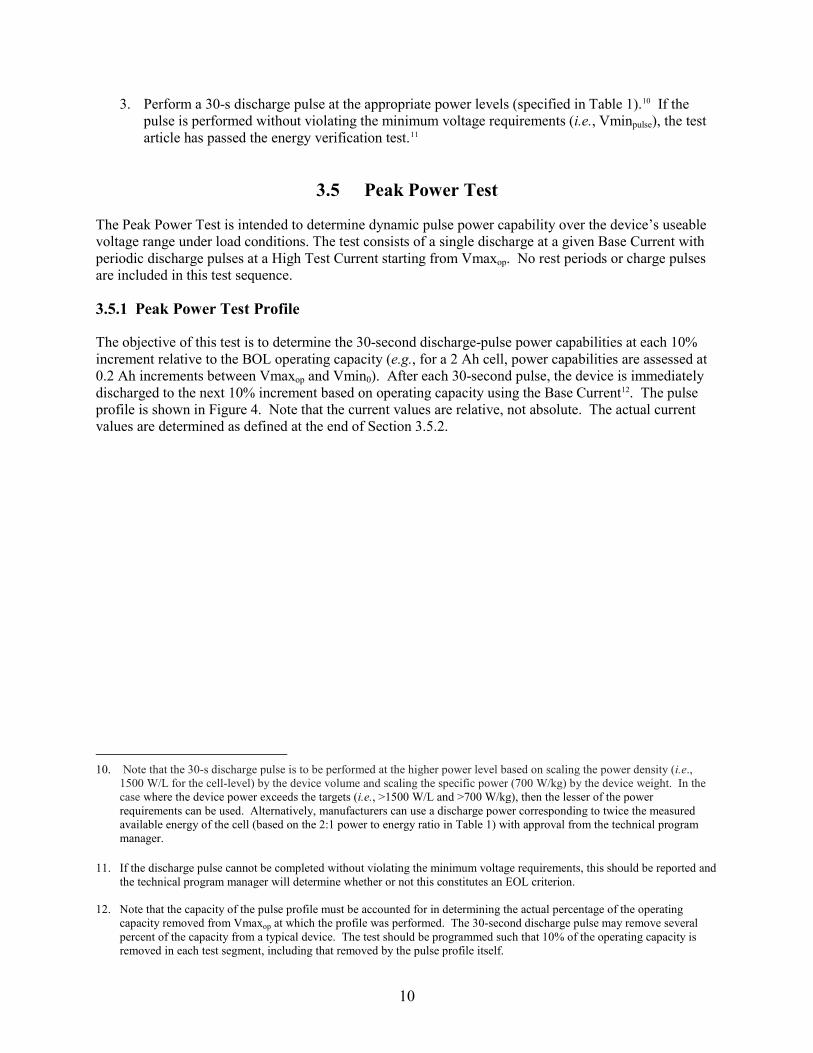
The objective of this test is to determine the 30-second discharge-pulse power capabilities at each 10% increment relative to the BOL operating capacity (e.g., for a 2 Ah cell, power capabilities are assessed at 0.2 Ah increments between Vmaxop and Vmin0). After each 30-second pulse, the device is immediately discharged to the next 10% increment based on operating capacity using the Base Current12. The pulse profile is shown in Figure 4. Note that the current values are relative, not absolute. The actual current values are determined as defined at the end of Section 3.5.2.
10. Note that the 30-s discharge pulse is to be performed at the higher power level based on scaling the power density (i.e.,
1500 W/L for the cell-level) by the device volume and scaling the specific power (700 W/kg) by the device weight. In the case where the device power exceeds the targets (i.e., >1500 W/L and >700 W/kg), then the lesser of the power requirements can be used. Alternatively, manufacturers can use a discharge power corresponding to twice the measured available energy of the cell (based on the 2:1 power to energy ratio in Table 1) with approval from the technical program manager.
11. If the discharge pulse cannot be completed without violating the minimum voltage requirements, this should be reported and the technical program manager will determine whether or not this constitutes an EOL criterion.
12. Note that the capacity of the pulse profile must be accounted for in determining the actual percentage of the operating
capacity removed from Vmaxop at which the profile was performed. The 30-second discharge pulse may remove several percent of the capacity from a typical device. The test should be programmed such that 10% of the operating capacity is removed in each test segment, including that removed by the pulse profile itself.
11
Figure 4. Peak Power Test Profile.
3.5.2 Test Procedure Description
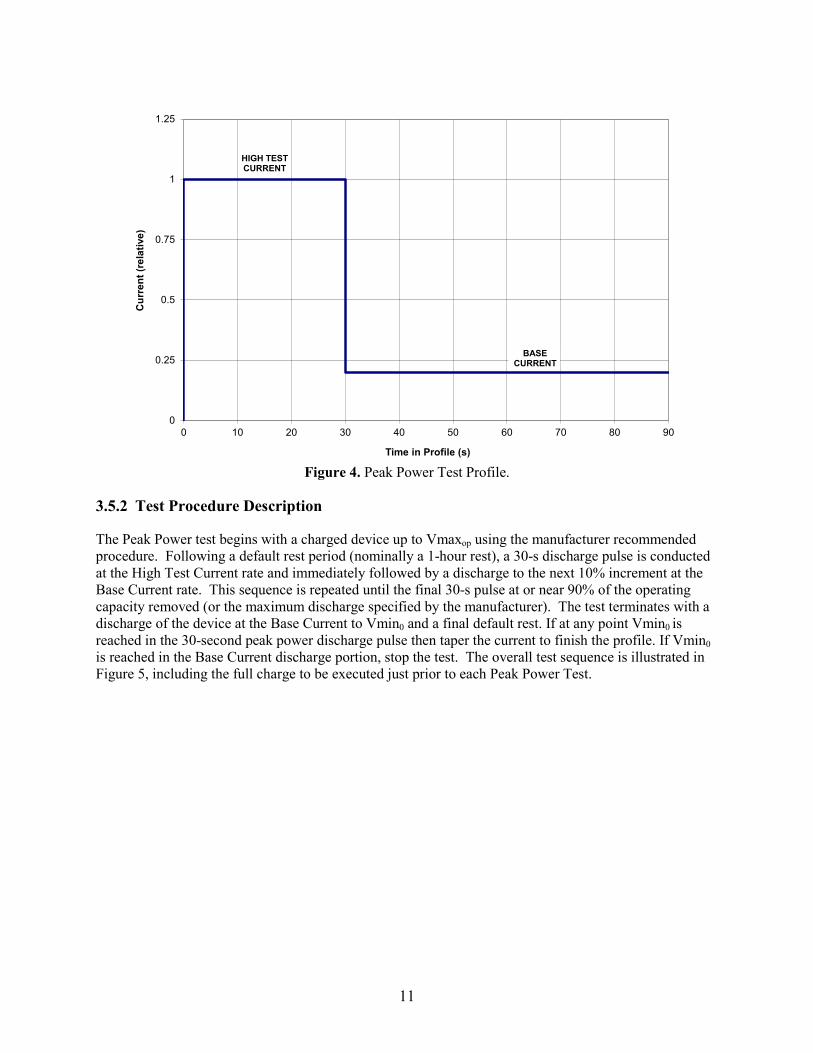
The Peak Power test begins with a charged device up to Vmaxop using the manufacturer recommended procedure. Following a default rest period (nominally a 1-hour rest), a 30-s discharge pulse is conducted at the High Test Current rate and immediately followed by a discharge to the next 10% increment at the Base Current rate. This sequence is repeated until the final 30-s pulse at or near 90% of the operating capacity removed (or the maximum discharge specified by the manufacturer). The test terminates with a discharge of the device at the Base Current to Vmin0 and a final default rest. If at any point Vmin0 is reached in the 30-second peak power discharge pulse then taper the current to finish the profile. If Vmin0 is reached in the Base Current discharge portion, stop the test. The overall test sequence is illustrated in Figure 5, including the full charge to be executed just prior to each Peak Power Test.
0
0.25
0.5
0.75
1
1.25
0 10 20 30 40 50 60 70 80 90
Cur
rent
(rel
ativ
e)
Time in Profile (s)
BASE CURRENT
HIGH TEST CURRENT
12
Figure 5. Peak Power Test Sequence.
The Peak Power Test is conducted using currents scaled as defined below.13 PEAK POWER TEST— The Base Current is established based on Equation (1), where Coperating is the device’s operating capacity between Vmaxop and Vmin0. The High Test Current should be the maximum rated pulse current for the device (Imax).
𝐼𝐼𝐵𝐵𝐵𝐵𝐵𝐵𝐵𝐵 𝐶𝐶𝐶𝐶𝐶𝐶𝐶𝐶𝐵𝐵𝐶𝐶𝐶𝐶 = ��12∗𝐶𝐶𝑜𝑜𝑝𝑝𝑒𝑒𝑒𝑒𝑒𝑒𝑒𝑒𝑒𝑒𝑒𝑒𝑒𝑒�−𝐼𝐼𝐻𝐻𝑒𝑒𝑒𝑒ℎ 𝑇𝑇𝑒𝑒𝑇𝑇𝑒𝑒 𝐶𝐶𝐶𝐶𝑒𝑒𝑒𝑒𝑒𝑒𝑒𝑒𝑒𝑒�35
(1)
3.6 Self-Discharge Test
This test is intended to determine the temporary capacity loss that results from a cell or battery standing (i.e., at rest) for a predetermined period of time (i.e., 30 days at 30°C).
The test consists of the following sequence of activities:
1. Measure the actual device capacity from full charge (Vmaxop) to the discharge voltage limit (Vmin0) using a constant C/3 rate, and recharge it using the manufacturer’s recommended charge algorithm.14
13. If the available test equipment has limited capabilities, a low-current peak power test can be performed instead with
approval from the technical program manager. The low-current peak power test has a Base Current of at least a C/3 rate and the High Test Current is at least a C/1 rate.
14. Note that the measured capacity may be less than the rated value since the operating range may a smaller voltage window.
-120 -60 0 60 120
Cur
rent
Time (minutes)
Discharge
Regen
Full Recharge (operating capacity)
NOTE: Time scale is approximate because some elements in the test sequence have variable length.
High Test Current
BaseCurrent1 hour Rest
13
2. Remove the half of the Available Energy from Table 1 (45 kWh at the system level or as specified by the manufacturer for the cell-level) at the C/3 rate. Allow it to stand in an open-circuit condition for a nominal interval of 30 days.15 All measurement equipment may need to be disconnected from the device during this period to reduce parasitic losses.
3. Discharge the device to Vmin0 for its remaining (residual) capacity at the C/3 rate.
4. Recharge the device and fully discharge it again at the C/3 discharge rate. If a loss of capacity is observed between (1) and (4), additional recharge/discharge cycles (up to 10 cycles) may be performed to return the device to its nominal capacity.
3.7 Thermal Performance Test
A primary objective of the thermal performance testing is to demonstrate the ability to meet some fraction of the Peak Power target at various temperatures. The effects of environment (ambient temperature) on device performance will be measured as required by performing the Static Capacity Test and Hybrid Pulse Power Characterization Test (either the low or high HPPC)16 at various temperatures within the operating temperature target range (-30 to +52ºC). Typical temperatures for the thermal performance test consist of 52, 0, -10, -20, and -30°C. At the laboratory cell level, such testing has two targets: to characterize the performance of the technology as a function of temperature and to bound the likely constraints on thermal management of full-size cells or batteries. At the module and system level, the emphasis of thermal performance testing is increasingly on thermal management system design and behavior.
Unless otherwise specified in a device-specific test plan, initial charging should be performed at 30ºC during thermal performance testing. This implies a test sequence as follows: (1) fully charge the device to Vmaxop at 30ºC; (2) raise or lower the device ambient temperature to the target value; (3) wait a suitable soak period for thermal equalization, typically 4 to 16 hr depending on size and mass; and (4) execute the desired performance test. If self-discharge is a major concern during the soak period, the device can be clamped at a voltage during this period; however, this requires knowledge of the device OCV versus temperature behavior to ensure that the SOC is not changed inadvertently.
It may be necessary to adjust the rest intervals in the HPPC Test to ensure that thermal stability as well as voltage equilibrium is reached before each repetition of the pulse power characterization profile.
Complete thermal performance testing is conducted at BOL and at EOL if practical. At middle of life, a thermal performance test at -20°C could be performed as well.
3.7.1 Survival Temperature Test
The survival temperature test is generally performed on a group of devices that will not be used for calendar and cycle life testing. This test may drastically affect or reduce the performance of the device. The effects of survival temperature on device performance will be measured as required within the
15. Although the Available Energy for Charge-Depleting Mode is the default nominal condition for this test, the actual value to
be used is commonly defined in a device-specific test plan. The same test conditions that will be used for cycle life or calendar life testing are typical.
16. Only one of the two HPPC test (low or high) should be used over a series of temperature tests for comparison with the targets. The HPPC current level will be invariant at all temperatures but the lower temperature tests may require lower voltage, but may not violate the Vmin0.
14
USABC temperature target range (-40 to +66ºC). Unless otherwise specified in a device-specific test plan, charging should be performed at the reference temperature (30 ±3ºC). The device should generally be at beginning of life (BOL) conditions for this test and other tests shall not be performed at these storage temperature limits.
The cold storage test is performed as follows:
1. From a fully charged state at Vmaxop, perform a C/3 discharge and charge test followed by a L-HPPC.
2. From a fully charged state at Vmaxop, bring the device to the voltage corresponding to Vnominal at 30°C using the C/3 constant-current rate. Taper the current at Vnominal following the manufacturer’s recommended procedure.
3. Ramp the thermal temperature chamber to the specified minimum survival temperature within 1-hr and then soak the device at open circuit for a 24-hr period (for a pack-level device, no fan should be running for this test).
4. Return to 30°C and rest for at least 4 to 16 hours (depending on the size of the device).
5. From a fully charged state at Vmaxop, perform a C/3 discharge and charge test followed by a L-HPPC.
The hot storage test is performed as follows:
1. From a fully charged state at Vmaxop, perform a C/3 discharge and charge test followed by a L-HPPC.
2. From a fully charged state at Vmaxop, bring the device to the voltage corresponding to Vnominal at 30°C using the C/3 constant-current rate. Taper the current at Vnominal following the manufacturer’s recommended procedure.
3. Ramp the thermal temperature chamber to the specified maximum survival temperature within 15-min and then soak the device at open circuit for a 24-hr period (for a pack-level device, no fan should be running for this test).
4. Return to 30°C and rest for at least 4 to 16 hours (depending on the size of the device).
5. From a fully charged state at Vmaxop, perform a C/3 discharge and charge test followed by a L-HPPC.
Note that if the intent of the testing is to verify both the cold and hot storage, the HPPC test at the end of the cold storage test and/or the HPPC test at the start of the hot storage testing can be omitted.
3.8 Life Testing
Life testing consists of cycle-life and calendar-life aging to ensure the device can meet the targets specified in Table 1 (i.e., 1,000 Dynamic Stress Test cycles and 15 year calendar life). Cycle-life testing consists of repeating a test profile continuously for a sustained period of time until the appropriate amount of energy has been depleted (Section 3.9). Calendar-life testing (Section 3.10) generally consists of
15
resting the device under test at OCV using elevated test temperatures with a pulse profile applied once per day.
The life testing regime is interrupted approximately once per month and the devices are brought back to nominal operating temperature (i.e., 30° C) for reference performance tests (Section 3.11) to gauge degradation as a function of aging. Key parameters, e.g., Peak Power and Available Energy, should be monitored. The corresponding end-of-life criteria for these parameters are when the Peak Power and Available Energy are less than target energy or power.
Wherever possible, devices subjected to the same test conditions should be contained in the same test chamber or other environment, preferably using calibrated test channels with identical characteristics, and test intervals should be time-synchronized.
All devices that are part of a common test matrix should be subjected to reference testing at the same intervals if possible. Minimizing the fraction of time not spent at target temperatures is important for testing at elevated temperatures. However, in some cases rapid degradation may take place at very high temperatures; in such cases, the use of uniform test intervals will lead to a reduced number of data points for predicting trends over life. The reference test intervals have been selected to balance these conflicting needs but may need adjustment in special cases.
The general life test procedure is as follows (specific test sequences are provided in the sections below):
1. Characterize the device using the Static Capacity Test (Section 3.2) and the Hybrid Pulse Power Characterization Test (Section 3.4) and other reference tests as detailed in a device-specific test plan.
2. Conduct the initial reference performance test immediately prior to the start of life testing using the tests identified in Table 5 of Section 3.11. These tests establish the baseline performance from which degradation can be tracked and is typically referred to as RPT0.
3. Fully charge the device at 30°C to Vmaxop using the manufacturer recommended procedure (i.e., fully charged) and rest at OCV for a default period (nominally 1 hour).
4. If necessary, discharge the device to the specified life test SOC condition or percent removed of operating capacity from Vmaxop. This can be done in one of two ways: (1) [default] remove the appropriate fraction of the cell’s operating capacity at a C/3 rate, or (b) if the open-circuit voltage corresponding to the target SOC is known, clamp the cell at this voltage while limiting discharge current to a C/3 rate and then wait for the voltage and current to stabilize.17 Note that the default method will typically reach the target condition more quickly. However, in some cases it may be desirable to use voltage (rather than fractional discharge) as the measure of SOC.
5. Rest at OCV for a default period (nominally 1 hour).
6. If aging is performed at an elevated temperature for accelerated aging, increase the ambient temperature and let the device soak for a sufficient duration to ensure thermal equilibrium (4 to 16 hours depending on the size and mass of the device).
7. Conduct the life aging sequence for ~32 days as specified in Sections 3.9 through 3.11 below.
17. A value less than 1% of the HPPC current is probably adequate to meet this criterion, provided this is within the
measurement capability of the test equipment.
16
8. If aging is performed at an elevated temperature, decrease the ambient temperature to the reference condition of 30°C and let the device soak for a sufficient duration to ensure thermal equilibrium (4 to 16 hours depending on the size and mass of the device).
9. Conduct the RPT as specified in Table 5 in Section 3.11.
10. Repeat Steps 6 through 9 until end of test or end of life.
The end-of-test criteria for life testing are normally specified in a device-specific test plan. A default (and generally mandatory) end-of-test condition is reached when the test profile cannot be executed within both the discharge and regen voltage limits.18 Another default end-of-test condition also occurs if performance degrades to a point where the HPPC Reference Performance Test (RPT) yields insufficient information to show further degradation.19 Other end of test criteria include: (a) a cycle life capability that meets the targets has been attained (i.e., the number of properly scaled test cycles exceeds the applicable target); or (b) the Available Energy or Peak Power drops below the target value. In case (a), the battery may not have reached end-of-life when testing stops, but further testing is not usually considered cost-effective. In case (b), end-of-life has occurred at some prior time. 20
3.9 Cycle Life Dynamic Stress Tests
Cycle life testing is performed by repeating the designated test profile (Section 3.9.2) until the net energy target from Table 1 is reached (e.g., 45 kWh at the system level or as specified by the manufacturer for the cell-level). The device is then recharged at the C/3 rate unless otherwise specified by the manufacturer. RPTs are conducted periodically during cycle life testing.
3.9.1 Cycle Life Test Procedure Outline
The cycle life testing process consists of the following steps:
1 Scale the test profile by dividing by the appropriate reference power and weight (i.e., 470 W/kg for the system level and 700 W/kg for the cell level). However, if this scaling results in currents that exceed the device’s maximum current limit, use a power equal to 2 times the energy of the cell from Vmaxop to Vmin0.21
2 The device is first fully charged at 30°C to Vmaxop using the manufacturer recommended procedure (i.e., fully charged).
3 Bring the device to the desired test temperature and soak for the appropriate duration. Repeat the designated test profile at the desired operating conditions until the net energy is equal to the
18. At this point, the device has insufficient available energy and capacity at the test conditions to execute the test, i.e., its
capability is less than that required by the test profile.
19. This would normally be the point where valid discharge and regen data are obtained at less than three DOD values using the Low-Current HPPC test.
20. Note that end-of-test and end-of-life are not the same, and they may not even be related. See the glossary for more information on this distinction. The determination of End-of-Life and Cycle Life is discussed in Section 4.9.
21. Manufacturers can choose to use a discharge power corresponding to twice the measured available energy of the cell (based on the 2:1 power to energy ratio in Table 1) with approval from the technical program manager.
17
Available Energy target from Table 1 (45 kWh at the system level or as specified by the manufacturer for the cell-level).
4 Rest at OCV for a default period of 15 minutes22 and then recharge the device to Vmaxop using the manufacturer recommended procedure. Rest at OCV for a default period of 15 minutes after the recharge. Steps 3 and 4 will be the equivalent of one DST Cycle.
5 Repeat the cycle (from steps 3 and 4) at the desired operating conditions the number of times specified in Table 5 or a device-specific test plan.
6 After the specified number of repetitions, suspend cycling. If cycling is being done at other than 30ºC, return the device to 30ºC and soak for the appropriate duration. Observe the open-circuit voltage after a 1-hr rest. Perform the Reference Performance Tests to determine the extent of degradation in capacity and/or power capability. The reference tests are listed in Table 5. The intervals between repetitions of these reference tests are also specified in Table 5, though these may be adjusted somewhat if required for time synchronization of cells being tested under different test regimes.
7 Repeat Steps 5 through 6 until an end-of-test condition is reached.
22. The manufacturer may specify an alternative rest period between the discharge and charge profiles. The rest interval should
be specified in a device-specific test plan.
18
3.9.2 Cycle Life Dynamic Stress Test Profile
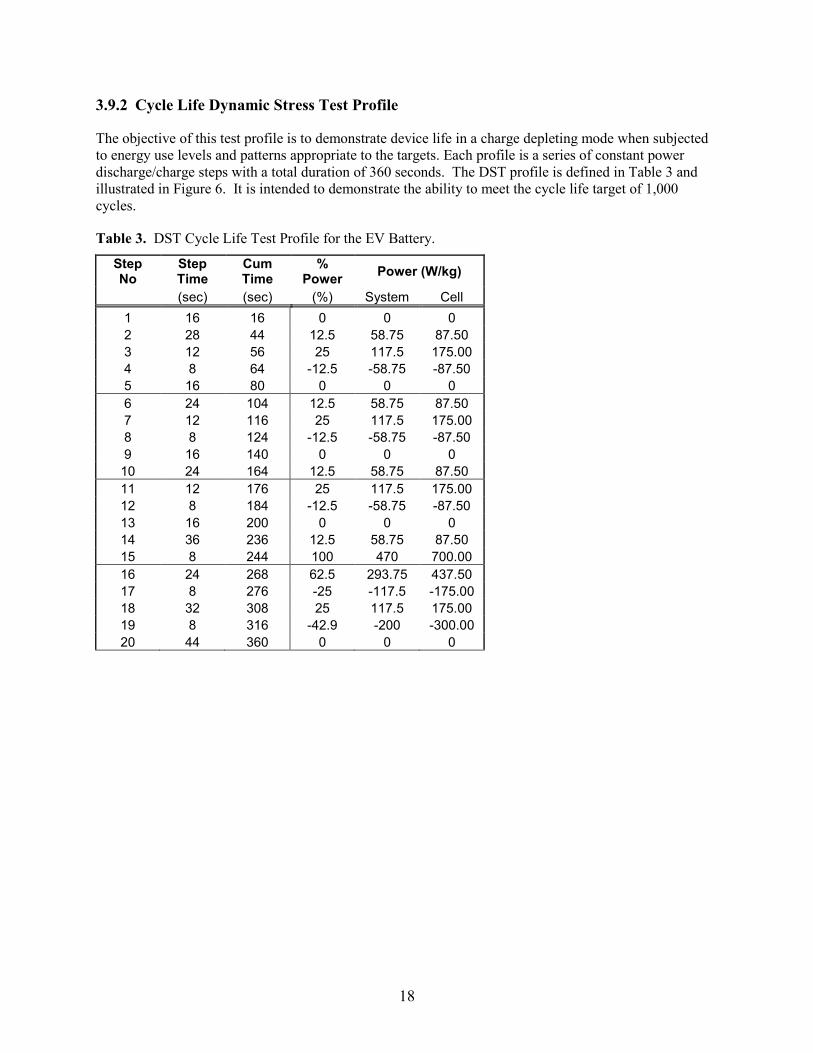
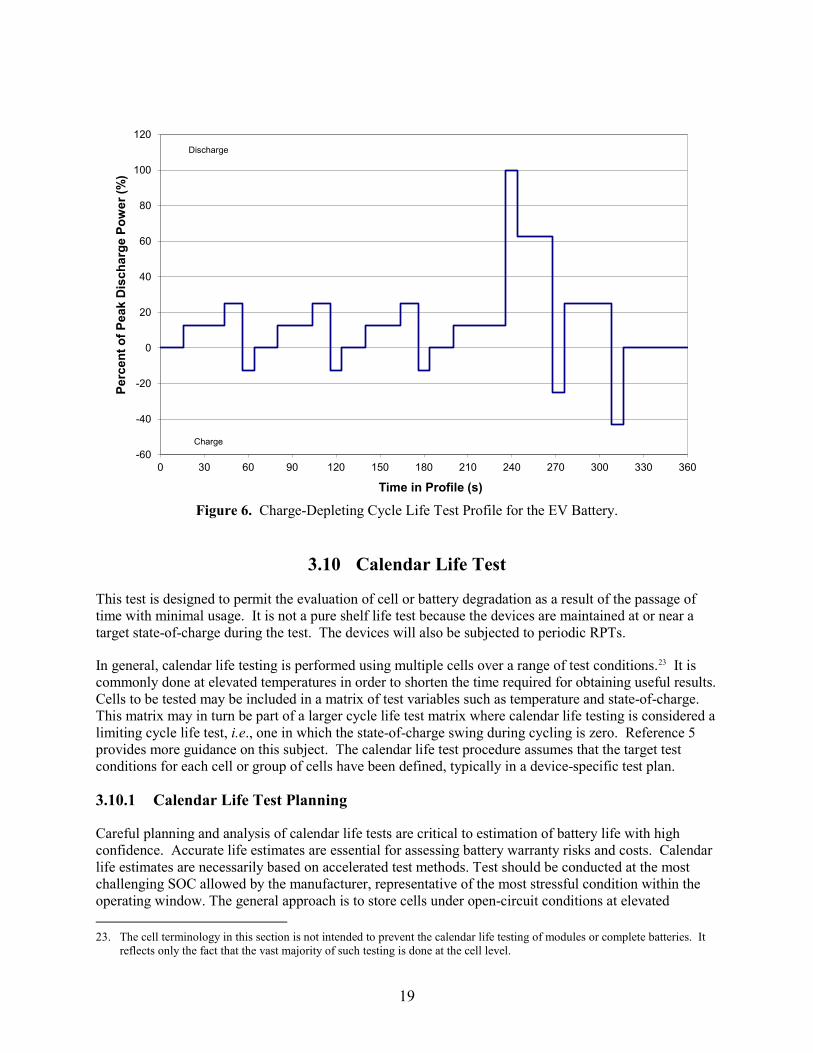
The objective of this test profile is to demonstrate device life in a charge depleting mode when subjected to energy use levels and patterns appropriate to the targets. Each profile is a series of constant power discharge/charge steps with a total duration of 360 seconds. The DST profile is defined in Table 3 and illustrated in Figure 6. It is intended to demonstrate the ability to meet the cycle life target of 1,000 cycles.
Table 3. DST Cycle Life Test Profile for the EV Battery.
Step No
Step Time
Cum Time
% Power Power (W/kg)
(sec) (sec) (%) System Cell 1 16 16 0 0 0 2 28 44 12.5 58.75 87.50 3 12 56 25 117.5 175.00 4 8 64 -12.5 -58.75 -87.50 5 16 80 0 0 0 6 24 104 12.5 58.75 87.50 7 12 116 25 117.5 175.00 8 8 124 -12.5 -58.75 -87.50 9 16 140 0 0 0 10 24 164 12.5 58.75 87.50 11 12 176 25 117.5 175.00 12 8 184 -12.5 -58.75 -87.50 13 16 200 0 0 0 14 36 236 12.5 58.75 87.50 15 8 244 100 470 700.00 16 24 268 62.5 293.75 437.50 17 8 276 -25 -117.5 -175.00 18 32 308 25 117.5 175.00 19 8 316 -42.9 -200 -300.00 20 44 360 0 0 0
19
Figure 6. Charge-Depleting Cycle Life Test Profile for the EV Battery.
3.10 Calendar Life Test
This test is designed to permit the evaluation of cell or battery degradation as a result of the passage of time with minimal usage. It is not a pure shelf life test because the devices are maintained at or near a target state-of-charge during the test. The devices will also be subjected to periodic RPTs.
In general, calendar life testing is performed using multiple cells over a range of test conditions.23 It is commonly done at elevated temperatures in order to shorten the time required for obtaining useful results. Cells to be tested may be included in a matrix of test variables such as temperature and state-of-charge. This matrix may in turn be part of a larger cycle life test matrix where calendar life testing is considered a limiting cycle life test, i.e., one in which the state-of-charge swing during cycling is zero. Reference 5 provides more guidance on this subject. The calendar life test procedure assumes that the target test conditions for each cell or group of cells have been defined, typically in a device-specific test plan.
3.10.1 Calendar Life Test Planning
Careful planning and analysis of calendar life tests are critical to estimation of battery life with high confidence. Accurate life estimates are essential for assessing battery warranty risks and costs. Calendar life estimates are necessarily based on accelerated test methods. Test should be conducted at the most challenging SOC allowed by the manufacturer, representative of the most stressful condition within the operating window. The general approach is to store cells under open-circuit conditions at elevated 23. The cell terminology in this section is not intended to prevent the calendar life testing of modules or complete batteries. It
reflects only the fact that the vast majority of such testing is done at the cell level.
-60
-40
-20
0
20
40
60
80
100
120
0 30 60 90 120 150 180 210 240 270 300 330 360
Perc
ent o
f Pea
k D
isch
arge
Pow
er (%
)
Time in Profile (s)
Discharge
Charge
20
temperatures to artificially increase their rates of performance deterioration. The key tradeoff in the selection of storage temperatures is to avoid introducing irrelevant failure modes at too high a temperature, while achieving high rates of deterioration to minimize test time and cost.
At a minimum, three temperatures should be selected. Optimally, five to seven elevated temperatures would be selected, but in many cases this proves impractical. The lowest temperature should be the baseline temperature for calendar life, while the highest temperature should result in an end-of-life condition at the desired test duration without introducing unrealistic failure mechanisms (e.g., two years or less). Other temperatures should be equally spaced between these extremes. At least three cells should be tested at each temperature, but for improved statistical results, additional cells should be used, especially at the lower temperatures. The cells under test should be stored in an open-circuit condition, but with voltage monitoring using sensing circuits that present negligible loads to the devices under test. If feasible, a daily pulse should be performed with a 5-minute voltage clamp after the pulse to maintain the appropriate SOC. Where it is not feasible to conduct a daily pulse, SOC should be periodically verified and maintained. For a test to be considered valid, the SOC may not be allowed to drop more than 1% below the target value. If a cell nears this level of drift, a taper charge to the target is permitted.
Wherever possible, cells subjected to the same test conditions should be contained in the same test chamber or other environment, preferably using calibrated test channels with identical characteristics, and test intervals should be time-synchronized.
All cells that are part of a common test matrix should be subjected to reference testing at the same intervals if possible. Minimizing the fraction of time not spent at target temperatures is important for testing at elevated temperatures. However, in some cases rapid degradation may take place at very high temperatures; in such cases, the use of uniform test intervals will lead to a reduced number of data points for predicting trends over life. The reference test intervals have been selected to balance these conflicting needs but may need adjustment in special cases.
3.10.2 Calendar Life Test Procedure
The outline of this test procedure for a particular cell is as follows:
1. The device is first fully charged at 30°C to Vmaxop using the manufacturer recommended procedure (i.e., fully charged).
2. If necessary, discharge to the target condition (i.e., capacity removed or SOC) at 30ºC using the C/3 rate and rest for an hour.
3. Apply a single iteration of the Calendar Life Test Profile defined in Section 3.10.3. The nominal discharge current to be used for this profile is equal to the peak discharge current for the Low-Current HPPC Test.
4. Bring the cell to the target temperature at open-circuit condition and wait for the ambient temperature and voltage to stabilize (i.e., 4 to 16 hours based on cell or pack mass).
5. Apply a single iteration of the Calendar Life Test Profile defined in Section 3.10.3 at the same current level defined in Step 3. The device is then placed in an open-circuit state and the test continues at the target conditions.24
24. In the event resources do not allow daily iteration, this step may be omitted with Manager approval and periodic voltage
checks are conducted to ensure SOC stability.
21
6. Once every 24-hours, and immediately before beginning Step 7, repeat Step 5. Note that data acquisition requirements during this pulse profile execution will be similar to those for HPPC Tests, even though other data may be required only infrequently during the 24-hour intervals.25
7. At intervals as specified in Table 5 or a device-specific test plan, return the cell to nominal temperature (e.g., 30ºC), observe its open-circuit voltage after a 1-hr rest, and apply a single iteration of the Calendar Life Test Profile before discharging its remaining capacity at the C/3 rate. Conduct a single iteration of the required periodic Reference Performance Tests, and then return the cells to their test temperatures.
8. Repeat this test sequence until the cell reaches an end-of-test condition.
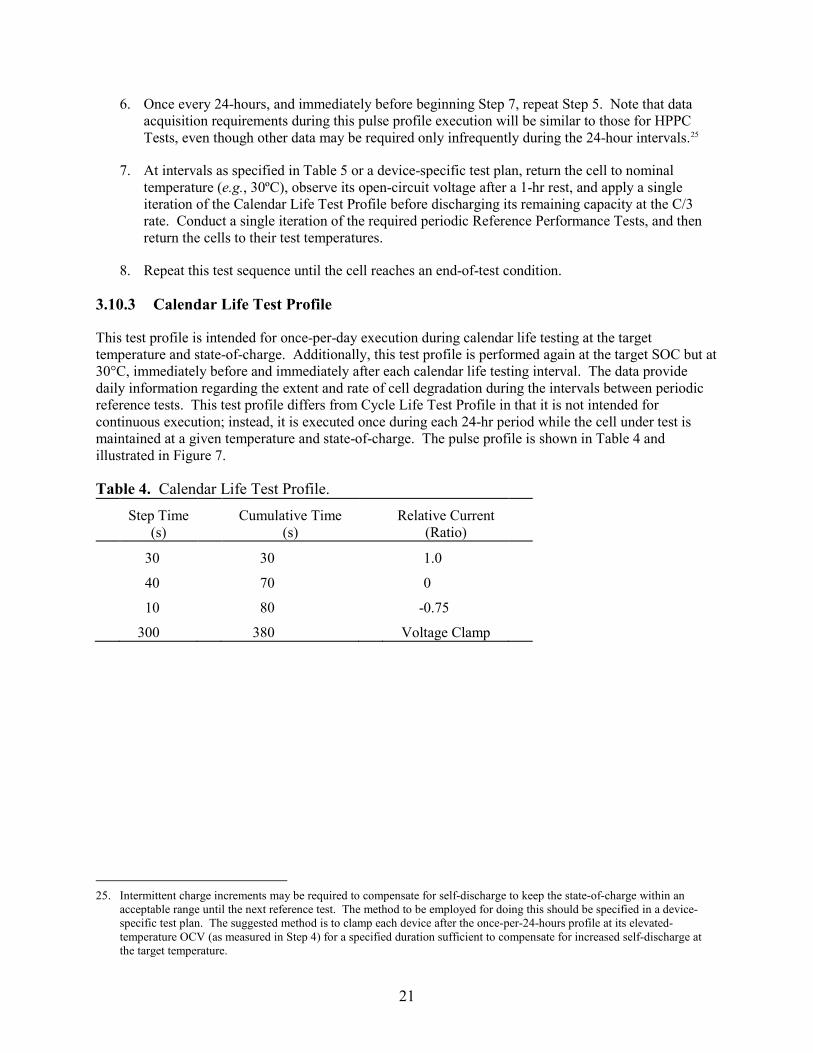
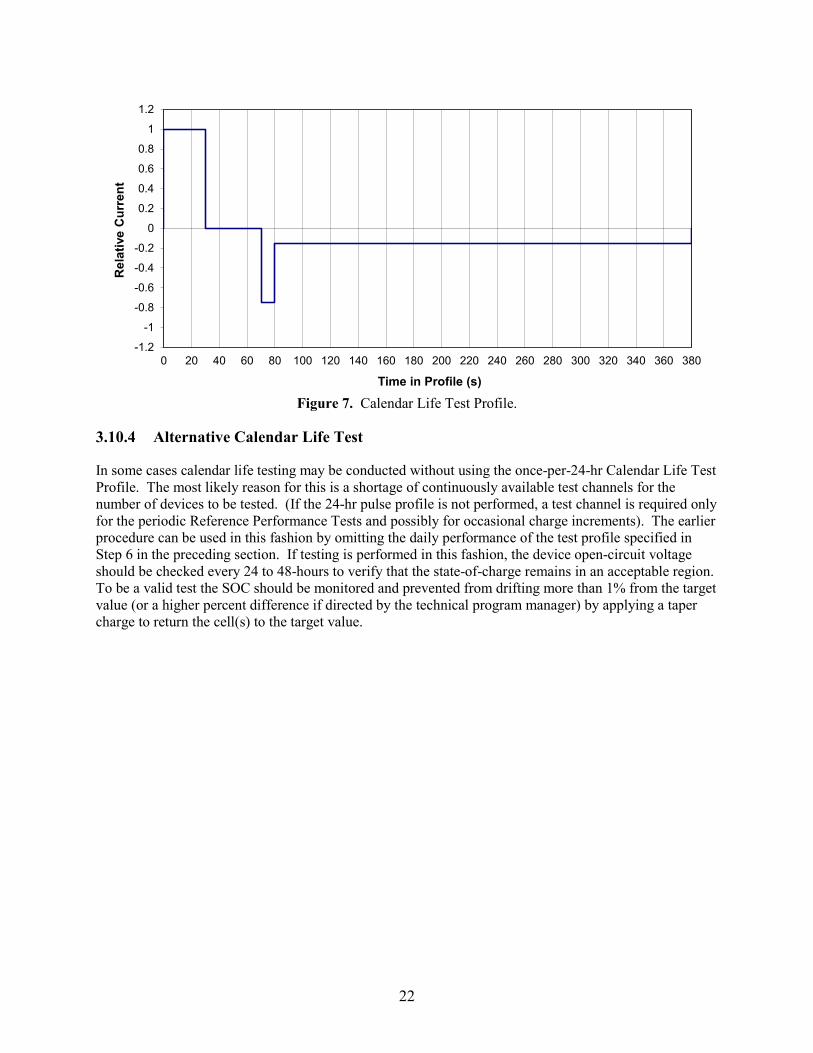
3.10.3 Calendar Life Test Profile
This test profile is intended for once-per-day execution during calendar life testing at the target temperature and state-of-charge. Additionally, this test profile is performed again at the target SOC but at 30°C, immediately before and immediately after each calendar life testing interval. The data provide daily information regarding the extent and rate of cell degradation during the intervals between periodic reference tests. This test profile differs from Cycle Life Test Profile in that it is not intended for continuous execution; instead, it is executed once during each 24-hr period while the cell under test is maintained at a given temperature and state-of-charge. The pulse profile is shown in Table 4 and illustrated in Figure 7.
Table 4. Calendar Life Test Profile.
Step Time
(s) Cumulative Time
(s) Relative Current
(Ratio)
30 30 1.0
40 70 0
10 80 -0.75
300 380 Voltage Clamp
25. Intermittent charge increments may be required to compensate for self-discharge to keep the state-of-charge within an
acceptable range until the next reference test. The method to be employed for doing this should be specified in a device-specific test plan. The suggested method is to clamp each device after the once-per-24-hours profile at its elevated-temperature OCV (as measured in Step 4) for a specified duration sufficient to compensate for increased self-discharge at the target temperature.
22
Figure 7. Calendar Life Test Profile.
3.10.4 Alternative Calendar Life Test
In some cases calendar life testing may be conducted without using the once-per-24-hr Calendar Life Test Profile. The most likely reason for this is a shortage of continuously available test channels for the number of devices to be tested. (If the 24-hr pulse profile is not performed, a test channel is required only for the periodic Reference Performance Tests and possibly for occasional charge increments). The earlier procedure can be used in this fashion by omitting the daily performance of the test profile specified in Step 6 in the preceding section. If testing is performed in this fashion, the device open-circuit voltage should be checked every 24 to 48-hours to verify that the state-of-charge remains in an acceptable region. To be a valid test the SOC should be monitored and prevented from drifting more than 1% from the target value (or a higher percent difference if directed by the technical program manager) by applying a taper charge to return the cell(s) to the target value.
-1.2
-1
-0.8
-0.6
-0.4
-0.2
0
0.2
0.4
0.6
0.8
1
1.2
0 20 40 60 80 100 120 140 160 180 200 220 240 260 280 300 320 340 360 380
Rel
ativ
e C
urre
nt
Time in Profile (s)
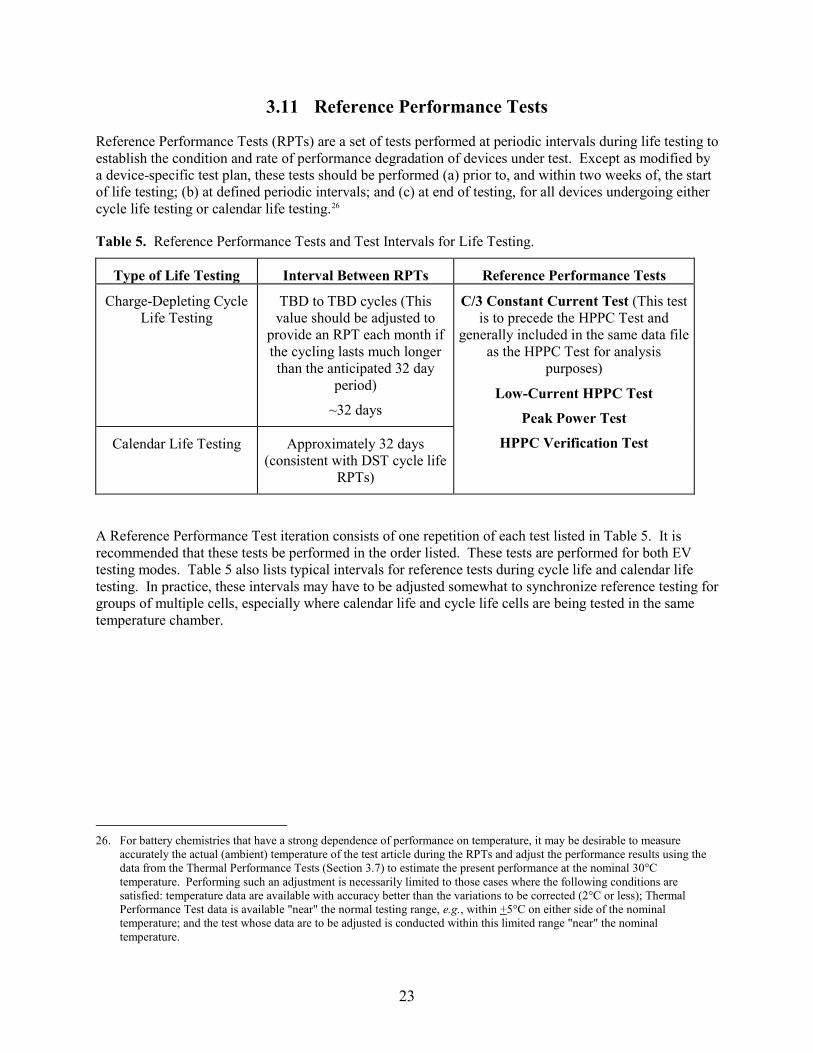
23
3.11 Reference Performance Tests
Reference Performance Tests (RPTs) are a set of tests performed at periodic intervals during life testing to establish the condition and rate of performance degradation of devices under test. Except as modified by a device-specific test plan, these tests should be performed (a) prior to, and within two weeks of, the start of life testing; (b) at defined periodic intervals; and (c) at end of testing, for all devices undergoing either cycle life testing or calendar life testing.26
Table 5. Reference Performance Tests and Test Intervals for Life Testing.
Type of Life Testing Interval Between RPTs Reference Performance Tests
Charge-Depleting Cycle Life Testing
TBD to TBD cycles (This value should be adjusted to
provide an RPT each month if the cycling lasts much longer than the anticipated 32 day
period)
~32 days
C/3 Constant Current Test (This test is to precede the HPPC Test and
generally included in the same data file as the HPPC Test for analysis
purposes)
Low-Current HPPC Test
Peak Power Test
HPPC Verification Test Calendar Life Testing Approximately 32 days (consistent with DST cycle life
RPTs)
A Reference Performance Test iteration consists of one repetition of each test listed in Table 5. It is recommended that these tests be performed in the order listed. These tests are performed for both EV testing modes. Table 5 also lists typical intervals for reference tests during cycle life and calendar life testing. In practice, these intervals may have to be adjusted somewhat to synchronize reference testing for groups of multiple cells, especially where calendar life and cycle life cells are being tested in the same temperature chamber.
26. For battery chemistries that have a strong dependence of performance on temperature, it may be desirable to measure
accurately the actual (ambient) temperature of the test article during the RPTs and adjust the performance results using the data from the Thermal Performance Tests (Section 3.7) to estimate the present performance at the nominal 30°C temperature. Performing such an adjustment is necessarily limited to those cases where the following conditions are satisfied: temperature data are available with accuracy better than the variations to be corrected (2°C or less); Thermal Performance Test data is available "near" the normal testing range, e.g., within +5°C on either side of the nominal temperature; and the test whose data are to be adjusted is conducted within this limited range "near" the nominal temperature.
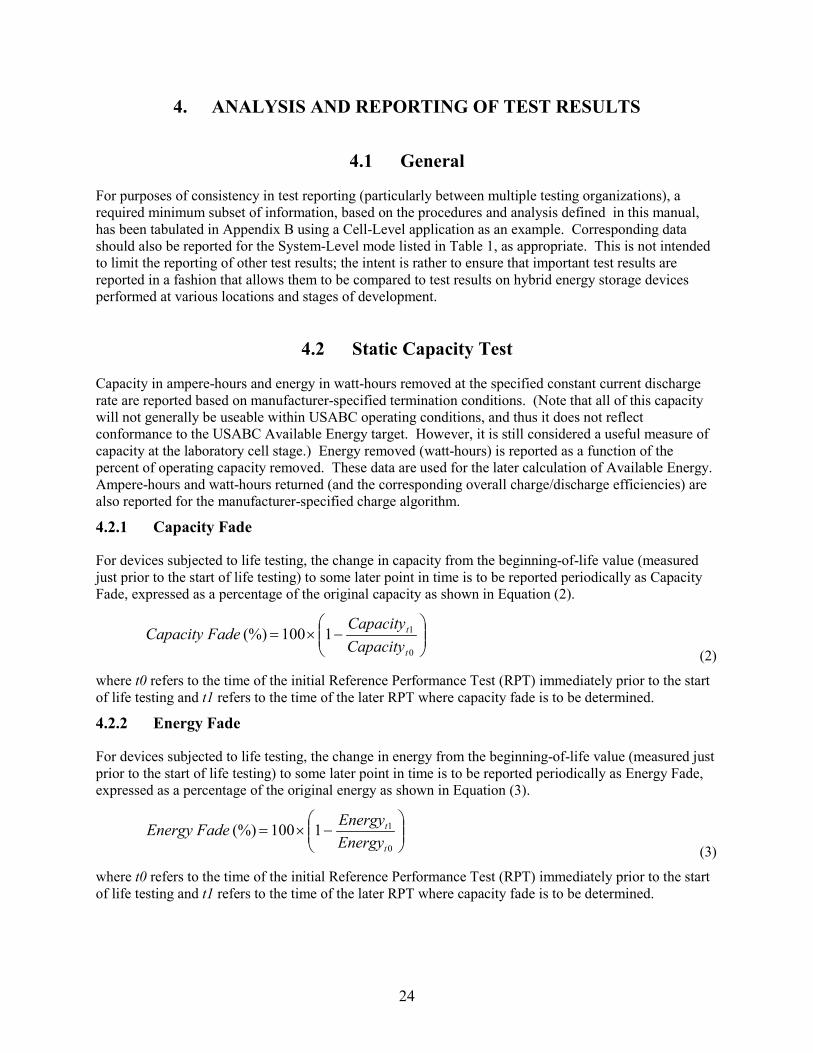
24
4. ANALYSIS AND REPORTING OF TEST RESULTS
4.1 General
For purposes of consistency in test reporting (particularly between multiple testing organizations), a required minimum subset of information, based on the procedures and analysis defined in this manual, has been tabulated in Appendix B using a Cell-Level application as an example. Corresponding data should also be reported for the System-Level mode listed in Table 1, as appropriate. This is not intended to limit the reporting of other test results; the intent is rather to ensure that important test results are reported in a fashion that allows them to be compared to test results on hybrid energy storage devices performed at various locations and stages of development.
4.2 Static Capacity Test
Capacity in ampere-hours and energy in watt-hours removed at the specified constant current discharge rate are reported based on manufacturer-specified termination conditions. (Note that all of this capacity will not generally be useable within USABC operating conditions, and thus it does not reflect conformance to the USABC Available Energy target. However, it is still considered a useful measure of capacity at the laboratory cell stage.) Energy removed (watt-hours) is reported as a function of the percent of operating capacity removed. These data are used for the later calculation of Available Energy. Ampere-hours and watt-hours returned (and the corresponding overall charge/discharge efficiencies) are also reported for the manufacturer-specified charge algorithm.
4.2.1 Capacity Fade
For devices subjected to life testing, the change in capacity from the beginning-of-life value (measured just prior to the start of life testing) to some later point in time is to be reported periodically as Capacity Fade, expressed as a percentage of the original capacity as shown in Equation (2).
−×=
0
11100 (%) t
t
CapacityCapacity
FadeCapacity (2)
where t0 refers to the time of the initial Reference Performance Test (RPT) immediately prior to the start of life testing and t1 refers to the time of the later RPT where capacity fade is to be determined.
4.2.2 Energy Fade
For devices subjected to life testing, the change in energy from the beginning-of-life value (measured just prior to the start of life testing) to some later point in time is to be reported periodically as Energy Fade, expressed as a percentage of the original energy as shown in Equation (3).
−×=
0
11100 (%) t
t
EnergyEnergyFadeEnergy
(3)
where t0 refers to the time of the initial Reference Performance Test (RPT) immediately prior to the start of life testing and t1 refers to the time of the later RPT where capacity fade is to be determined.
25
4.3 High Rate Charge
High rate charge is determined based on the ability of a test device to restore at least 80% of the measured capacity discharged from Vmaxop to Vminop (i.e., the operating capacity corresponding to the BOL margin specified by the manufacturer). Both the capacity removed at the C/3 rate and the capacity restored at the designated high rate constant current level are reported. The corresponding energy removed and restored can be reported as well.
4.4 Hybrid Pulse Power Characterization Test
Results from the HPPC test are generally aimed at comparing the performance of a device at a given RPT to the specified targets for a System Level or Cell Level application. Since these targets are expressed as specific power/energy or power/energy density, most HPPC test results must be scaled by the device weight and volume, respectively, before such comparisons can be made. A battery size factor (BSF) can also be supplied by the manufacturer for Cell Level applications (Section 3.1.4). The primary purpose of the BSF is to compare the Available Energy at the C/3 discharge rate to the System Level target of 45 kWh at end of life (EOL). The BSF can also be used to evaluate the estimated maximum and minimum operating voltage for a system-level operation given a Cell Level application. The BSF should be an integer value that aligns with all performance requirements and can be configured for series and/or parallel strings.
This section describes the HPPC analysis methodology using an illustrative dataset. The concepts and associated nomenclatures that are discussed in this analysis section have been defined in the glossary and summarized in Appendix B. Appendix B also describes how to use the HPPC test results to fill in a Gap Analysis.
4.4.1 Overall Analysis Approach
The primary purpose of the HPPC test is to periodically verify how the 30s Peak Discharge Power, 10s Peak Regen Power, and Available Energy for a given test article compare to the appropriate targets identified in Table 1. To achieve this purpose, several calculations are required based on the acquired test data. At a minimum, the following data need to be captured during the HPPC test for successful comparison with the targets:
1. Temperature of the test article during the HPPC test.
2. Cumulative capacity (Ah) removed at the end of each 10% increment based on operating capacity, defined at beginning of life and fixed throughout life testing.
3. Cumulative capacity (Ah) removed at the end of each discharge pulse within the HPPC profile.
4. Measured voltages at the start and end of both the discharge and regen pulses within the HPPC profile.
5. Measured currents at the start and end of both the discharge and regen pulses within the HPPC profile.
From these data, the analysis methodology described herein can be used to determine the parameters that are to be compared with the targets. Temperature data are useful to collect during HPPC testing, especially if the performance of the test articles is strongly affected by ambient conditions. Temperature
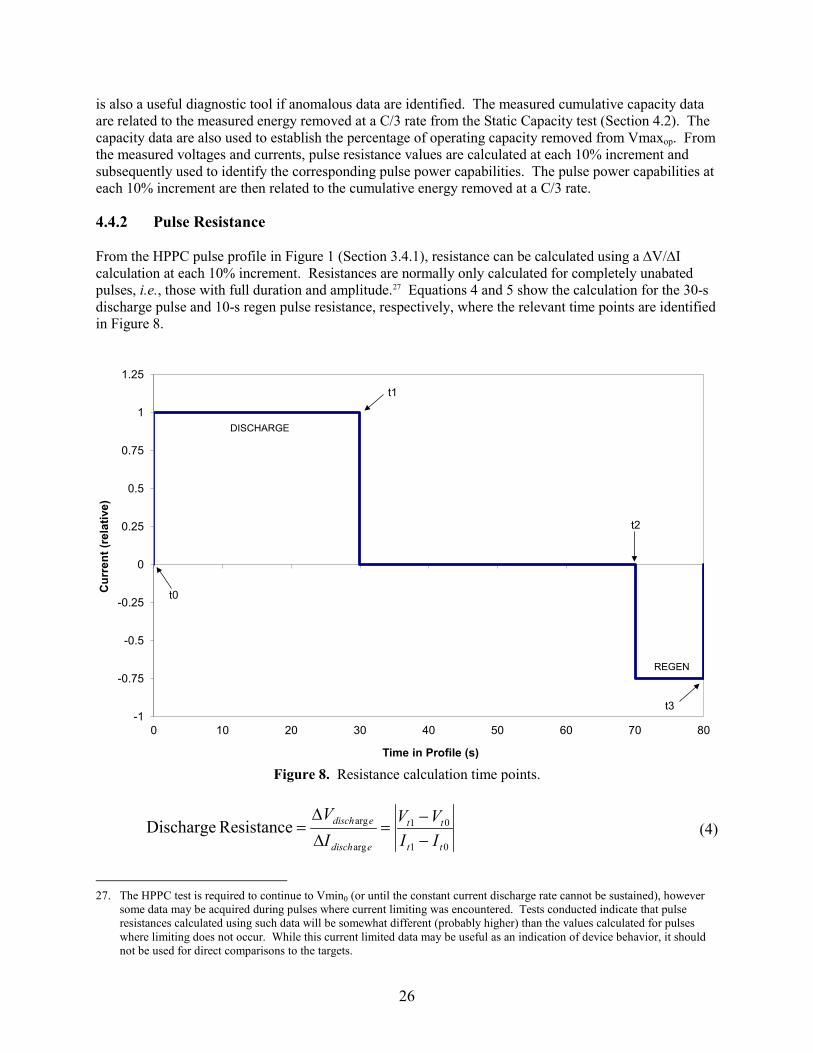
26
is also a useful diagnostic tool if anomalous data are identified. The measured cumulative capacity data are related to the measured energy removed at a C/3 rate from the Static Capacity test (Section 4.2). The capacity data are also used to establish the percentage of operating capacity removed from Vmaxop. From the measured voltages and currents, pulse resistance values are calculated at each 10% increment and subsequently used to identify the corresponding pulse power capabilities. The pulse power capabilities at each 10% increment are then related to the cumulative energy removed at a C/3 rate.
4.4.2 Pulse Resistance
From the HPPC pulse profile in Figure 1 (Section 3.4.1), resistance can be calculated using a DV/DI calculation at each 10% increment. Resistances are normally only calculated for completely unabated pulses, i.e., those with full duration and amplitude.27 Equations 4 and 5 show the calculation for the 30-s discharge pulse and 10-s regen pulse resistance, respectively, where the relevant time points are identified in Figure 8.
Figure 8. Resistance calculation time points.
01
01
arg
argResistance Dischargett
tt
edisch
edisch
IIVV
IV
−−
=DD
= (4)
27. The HPPC test is required to continue to Vmin0 (or until the constant current discharge rate cannot be sustained), however
some data may be acquired during pulses where current limiting was encountered. Tests conducted indicate that pulse resistances calculated using such data will be somewhat different (probably higher) than the values calculated for pulses where limiting does not occur. While this current limited data may be useful as an indication of device behavior, it should not be used for direct comparisons to the targets.
-1
-0.75
-0.5
-0.25
0
0.25
0.5
0.75
1
1.25
0 10 20 30 40 50 60 70 80
Cur
rent
(rel
ativ
e)
Time in Profile (s)
DISCHARGE
REGEN
t0
t2
t1
t3
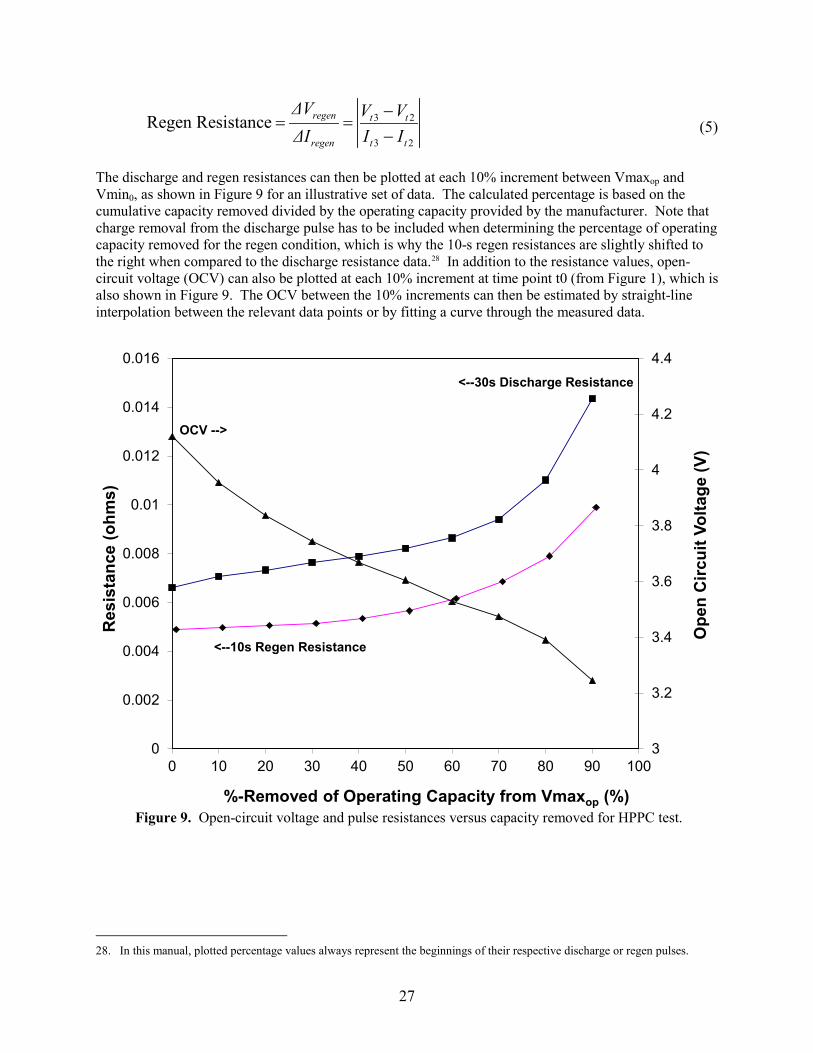
27
3 2
3 2
Regen Resistance regen t t
regen t t
ΔV V VΔI I I
−= =
− (5)
The discharge and regen resistances can then be plotted at each 10% increment between Vmaxop and Vmin0, as shown in Figure 9 for an illustrative set of data. The calculated percentage is based on the cumulative capacity removed divided by the operating capacity provided by the manufacturer. Note that charge removal from the discharge pulse has to be included when determining the percentage of operating capacity removed for the regen condition, which is why the 10-s regen resistances are slightly shifted to the right when compared to the discharge resistance data.28 In addition to the resistance values, open-circuit voltage (OCV) can also be plotted at each 10% increment at time point t0 (from Figure 1), which is also shown in Figure 9. The OCV between the 10% increments can then be estimated by straight-line interpolation between the relevant data points or by fitting a curve through the measured data.
Figure 9. Open-circuit voltage and pulse resistances versus capacity removed for HPPC test.
28. In this manual, plotted percentage values always represent the beginnings of their respective discharge or regen pulses.
3
3.2
3.4
3.6
3.8
4
4.2
4.4
0
0.002
0.004
0.006
0.008
0.01
0.012
0.014
0.016
0 10 20 30 40 50 60 70 80 90 100
Ope
n C
ircui
t Vol
tage
(V)
Res
ista
nce
(ohm
s)
%-Removed of Operating Capacity from Vmaxop (%)
OCV -->
<--10s Regen Resistance
<--30s Discharge Resistance
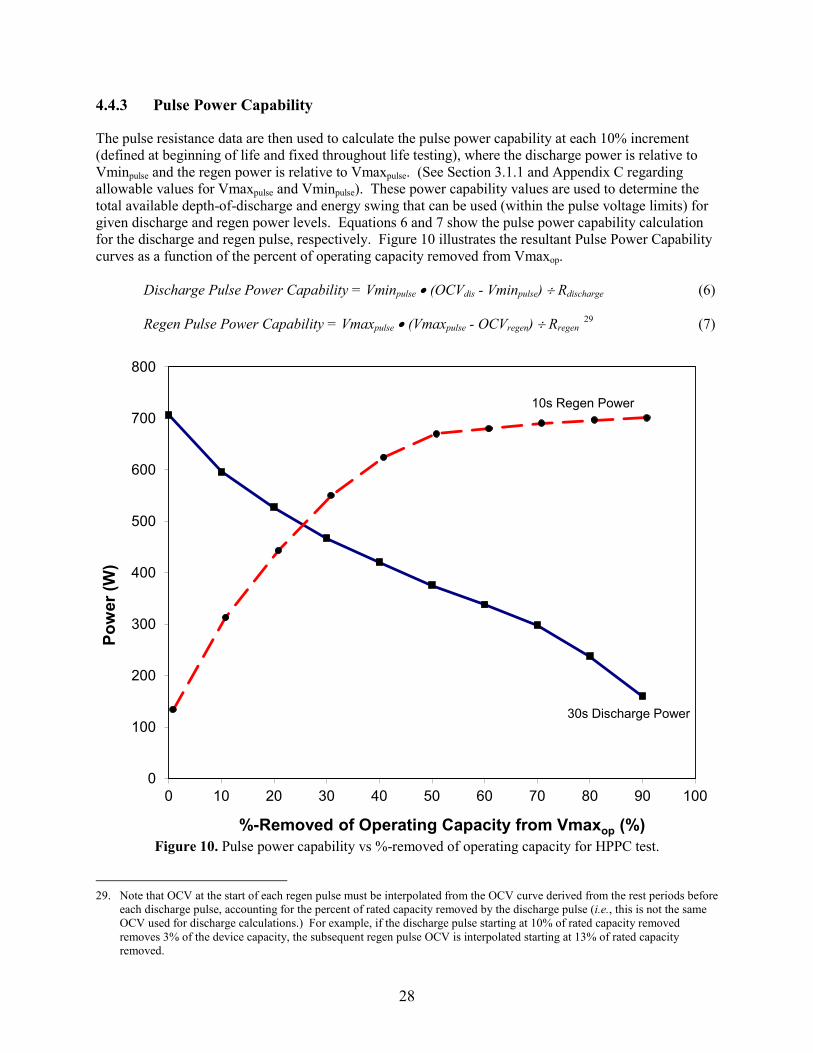
28
4.4.3 Pulse Power Capability
The pulse resistance data are then used to calculate the pulse power capability at each 10% increment (defined at beginning of life and fixed throughout life testing), where the discharge power is relative to Vminpulse and the regen power is relative to Vmaxpulse. (See Section 3.1.1 and Appendix C regarding allowable values for Vmaxpulse and Vminpulse). These power capability values are used to determine the total available depth-of-discharge and energy swing that can be used (within the pulse voltage limits) for given discharge and regen power levels. Equations 6 and 7 show the pulse power capability calculation for the discharge and regen pulse, respectively. Figure 10 illustrates the resultant Pulse Power Capability curves as a function of the percent of operating capacity removed from Vmaxop.
Discharge Pulse Power Capability = Vminpulse • (OCVdis - Vminpulse) ÷ Rdischarge (6)
Regen Pulse Power Capability = Vmaxpulse • (Vmaxpulse - OCVregen) ÷ Rregen 29
(7)
Figure 10. Pulse power capability vs %-removed of operating capacity for HPPC test.
29. Note that OCV at the start of each regen pulse must be interpolated from the OCV curve derived from the rest periods before
each discharge pulse, accounting for the percent of rated capacity removed by the discharge pulse (i.e., this is not the same OCV used for discharge calculations.) For example, if the discharge pulse starting at 10% of rated capacity removed removes 3% of the device capacity, the subsequent regen pulse OCV is interpolated starting at 13% of rated capacity removed.
0
100
200
300
400
500
600
700
800
0 10 20 30 40 50 60 70 80 90 100
Pow
er (W
)
%-Removed of Operating Capacity from Vmaxop (%)
10s Regen Power
30s Discharge Power
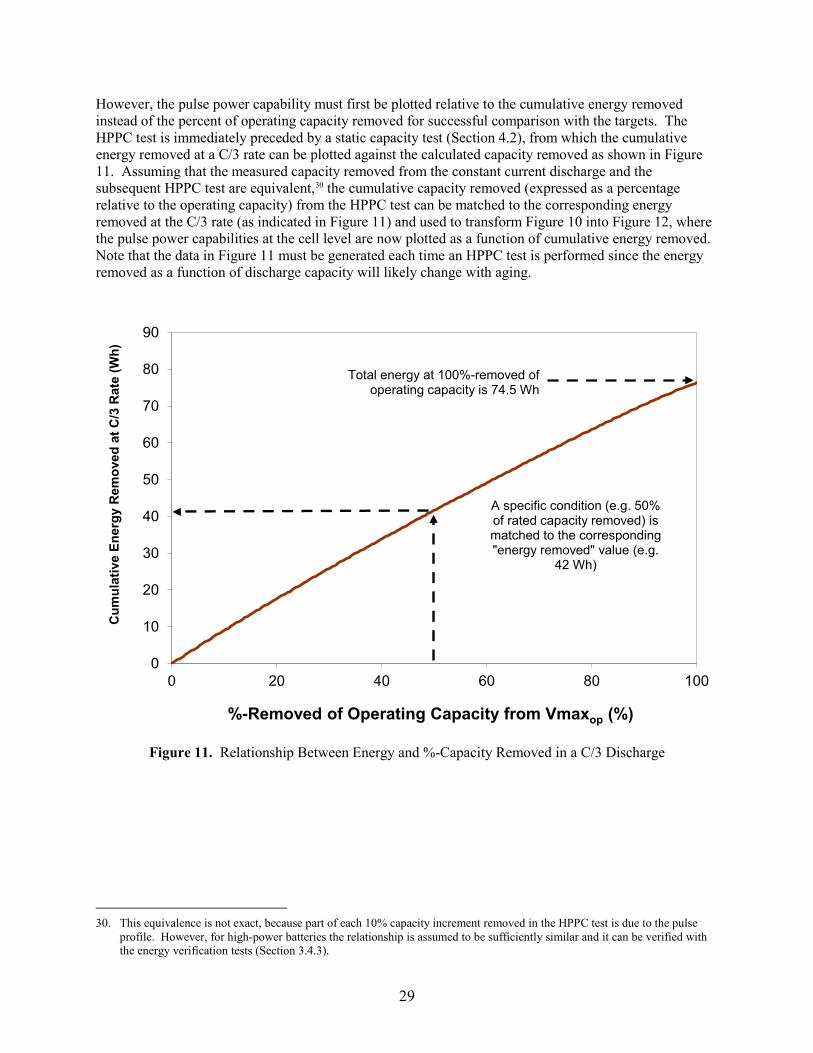
29
However, the pulse power capability must first be plotted relative to the cumulative energy removed instead of the percent of operating capacity removed for successful comparison with the targets. The HPPC test is immediately preceded by a static capacity test (Section 4.2), from which the cumulative energy removed at a C/3 rate can be plotted against the calculated capacity removed as shown in Figure 11. Assuming that the measured capacity removed from the constant current discharge and the subsequent HPPC test are equivalent,30 the cumulative capacity removed (expressed as a percentage relative to the operating capacity) from the HPPC test can be matched to the corresponding energy removed at the C/3 rate (as indicated in Figure 11) and used to transform Figure 10 into Figure 12, where the pulse power capabilities at the cell level are now plotted as a function of cumulative energy removed. Note that the data in Figure 11 must be generated each time an HPPC test is performed since the energy removed as a function of discharge capacity will likely change with aging.
Figure 11. Relationship Between Energy and %-Capacity Removed in a C/3 Discharge
30. This equivalence is not exact, because part of each 10% capacity increment removed in the HPPC test is due to the pulse
profile. However, for high-power batteries the relationship is assumed to be sufficiently similar and it can be verified with the energy verification tests (Section 3.4.3).
0
10
20
30
40
50
60
70
80
90
0 20 40 60 80 100
Cum
ulat
ive
Ener
gy R
emov
ed a
t C/3
Rat
e (W
h)
%-Removed of Operating Capacity from Vmaxop (%)
A specific condition (e.g. 50% of rated capacity removed) is matched to the corresponding "energy removed" value (e.g.
42 Wh)
Total energy at 100%-removed of operating capacity is 74.5 Wh
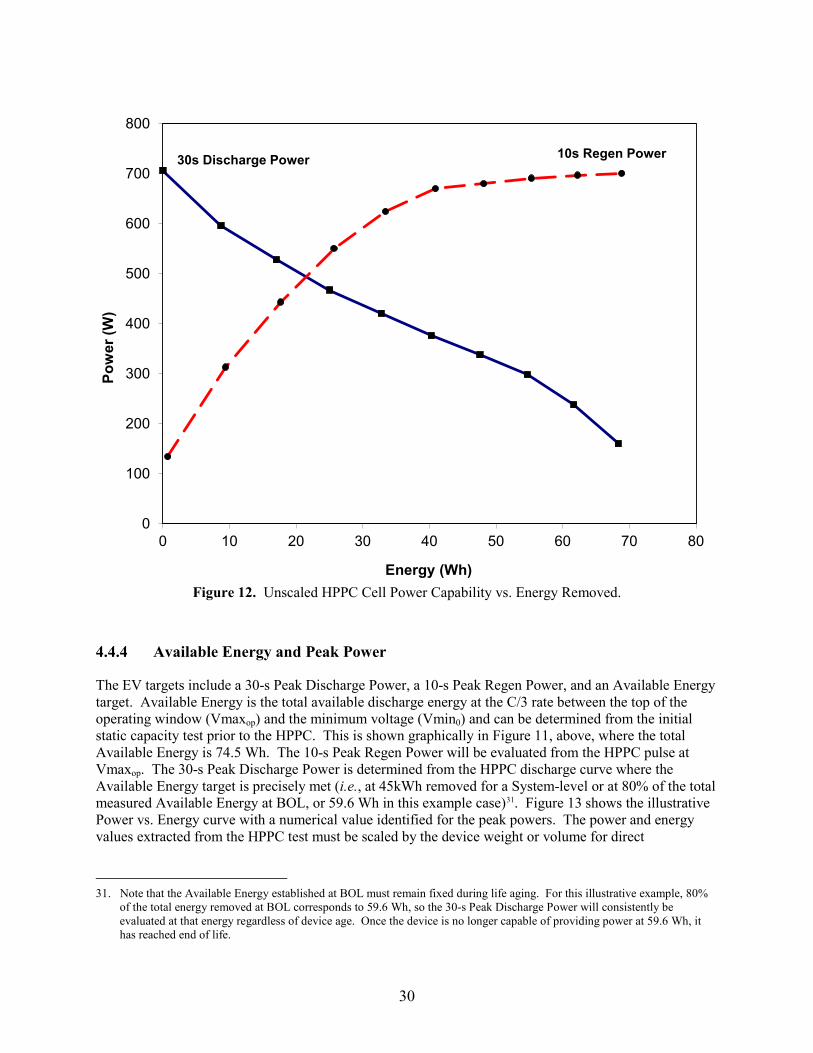
30
Figure 12. Unscaled HPPC Cell Power Capability vs. Energy Removed.
4.4.4 Available Energy and Peak Power
The EV targets include a 30-s Peak Discharge Power, a 10-s Peak Regen Power, and an Available Energy target. Available Energy is the total available discharge energy at the C/3 rate between the top of the operating window (Vmaxop) and the minimum voltage (Vmin0) and can be determined from the initial static capacity test prior to the HPPC. This is shown graphically in Figure 11, above, where the total Available Energy is 74.5 Wh. The 10-s Peak Regen Power will be evaluated from the HPPC pulse at Vmaxop. The 30-s Peak Discharge Power is determined from the HPPC discharge curve where the Available Energy target is precisely met (i.e., at 45kWh removed for a System-level or at 80% of the total measured Available Energy at BOL, or 59.6 Wh in this example case)31. Figure 13 shows the illustrative Power vs. Energy curve with a numerical value identified for the peak powers. The power and energy values extracted from the HPPC test must be scaled by the device weight or volume for direct
31. Note that the Available Energy established at BOL must remain fixed during life aging. For this illustrative example, 80%
of the total energy removed at BOL corresponds to 59.6 Wh, so the 30-s Peak Discharge Power will consistently be evaluated at that energy regardless of device age. Once the device is no longer capable of providing power at 59.6 Wh, it has reached end of life.
0
100
200
300
400
500
600
700
800
0 10 20 30 40 50 60 70 80
Pow
er (W
)
Energy (Wh)
30s Discharge Power 10s Regen Power
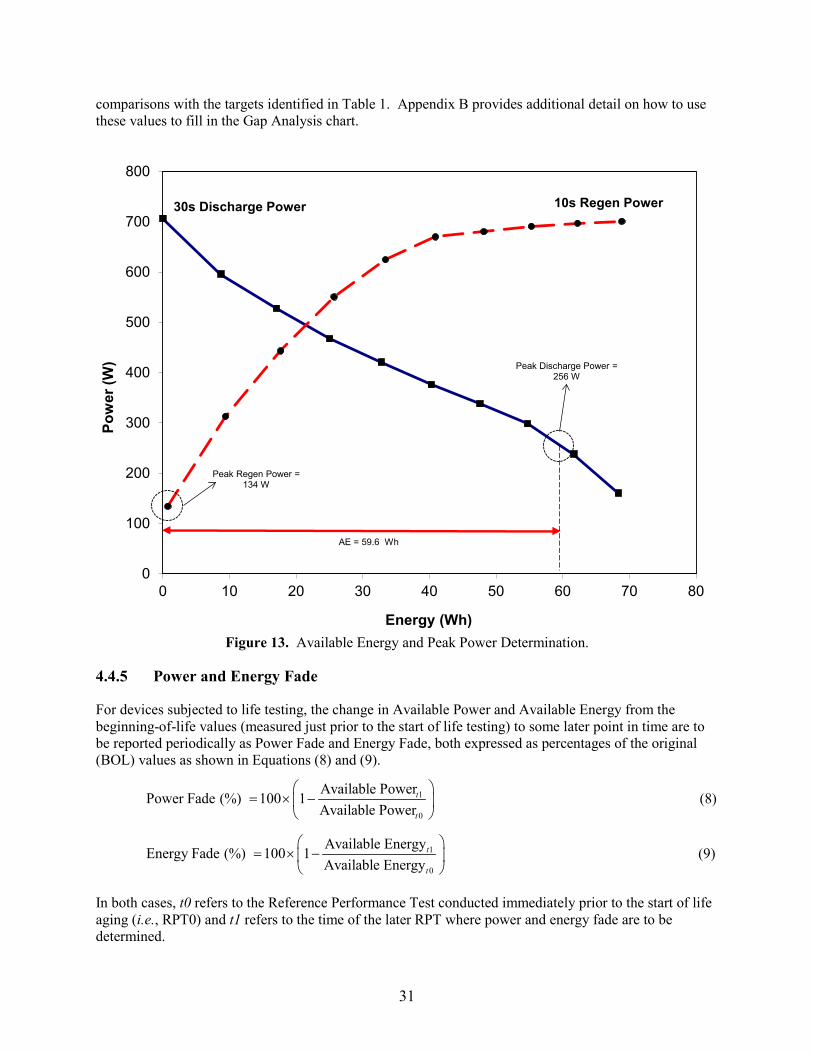
31
comparisons with the targets identified in Table 1. Appendix B provides additional detail on how to use these values to fill in the Gap Analysis chart.
Figure 13. Available Energy and Peak Power Determination.
4.4.5 Power and Energy Fade
For devices subjected to life testing, the change in Available Power and Available Energy from the beginning-of-life values (measured just prior to the start of life testing) to some later point in time are to be reported periodically as Power Fade and Energy Fade, both expressed as percentages of the original (BOL) values as shown in Equations (8) and (9).
1
0
Available PowerPower Fade (%) 100 1Available Power
t
t
= × −
(8)
1
0
Available EnergyEnergy Fade (%) 100 1Available Energy
t
t
= × −
(9)
In both cases, t0 refers to the Reference Performance Test conducted immediately prior to the start of life aging (i.e., RPT0) and t1 refers to the time of the later RPT where power and energy fade are to be determined.
0
100
200
300
400
500
600
700
800
0 10 20 30 40 50 60 70 80
Pow
er (W
)
Energy (Wh)
30s Discharge Power 10s Regen Power
AE = 59.6 Wh
Peak Discharge Power = 256 W
Peak Regen Power = 134 W
32
4.4.6 Other Laboratory Cell Performance Characteristics
Other laboratory cell performance characteristics can be calculated from the HPPC data to permit scale-up calculations to full-size cells and/or observe unique features in the specific cell chemistry. These include some or all of the following:
• Voltage response time constant estimates for discharge, regen, and rest periods derived from the current-driven HPPC Test data
• Ohmic and polarization resistances derived from lumped parameter equivalent circuit models
• Cell capacity and energy in area-specific, gravimetric, and volumetric units (mAh/cm2, mWh/cm2, Ah/kg, Wh/kg, Ah/liter, Wh/liter)
• Cell area-specific impedance in ohms-cm2 for discharge and for regen from HPPC data for 12 Volt Start/Stop applications. (Note: this requires specific knowledge of the active surface area of the cells).
The data acquired from HPPC cell testing are ultimately used for modeling cell characteristics and for the selection and design of full-size module and battery pack characteristics.
4.5 Peak Power Test
As with the HPPC test, results from the Peak Power test are generally aimed at comparing the performance of a device at a given RPT to the specified targets for a System Level or Cell Level application. Since these targets are expressed as specific power/energy or power/energy density, the Peak Power test results must be scaled by the device weight and volume, respectively, before such comparisons can be made. This section describes the Peak Power analysis methodology using an illustrative dataset. The concepts and associated nomenclatures that are discussed in this analysis section have been defined in the glossary and summarized in Appendix B. Appendix B also describes how to use the Peak Power test results to fill in a Gap Analysis.
4.5.1 Overall Analysis Approach
The primary purpose of the Peak Power test is to periodically verify how the 30s Peak Discharge Power, and Available Energy for a given test article compare to the appropriate targets identified in Table 1. To achieve this purpose, several calculations are required based on the acquired test data. At a minimum, the following data need to be captured during the Peak Power test for successful comparison with the targets:
1. Temperature of the test article during the Peak Power test.
2. Cumulative capacity (Ah) removed at the end of each 10% increment based on operating capacity, defined at beginning of life and fixed throughout life testing.
3. Cumulative energy (Wh) removed at the end of each 10% increment based on operating capacity.
4. Measured voltages at the start and end of the discharge pulses within the Peak Power profile.
5. Measured currents at the start and end of the discharge pulses within the Peak Power profile.
From these data, the analysis methodology described herein can be used to determine the parameters that are to be compared with the targets. Temperature data are useful to collect during Peak Power testing,
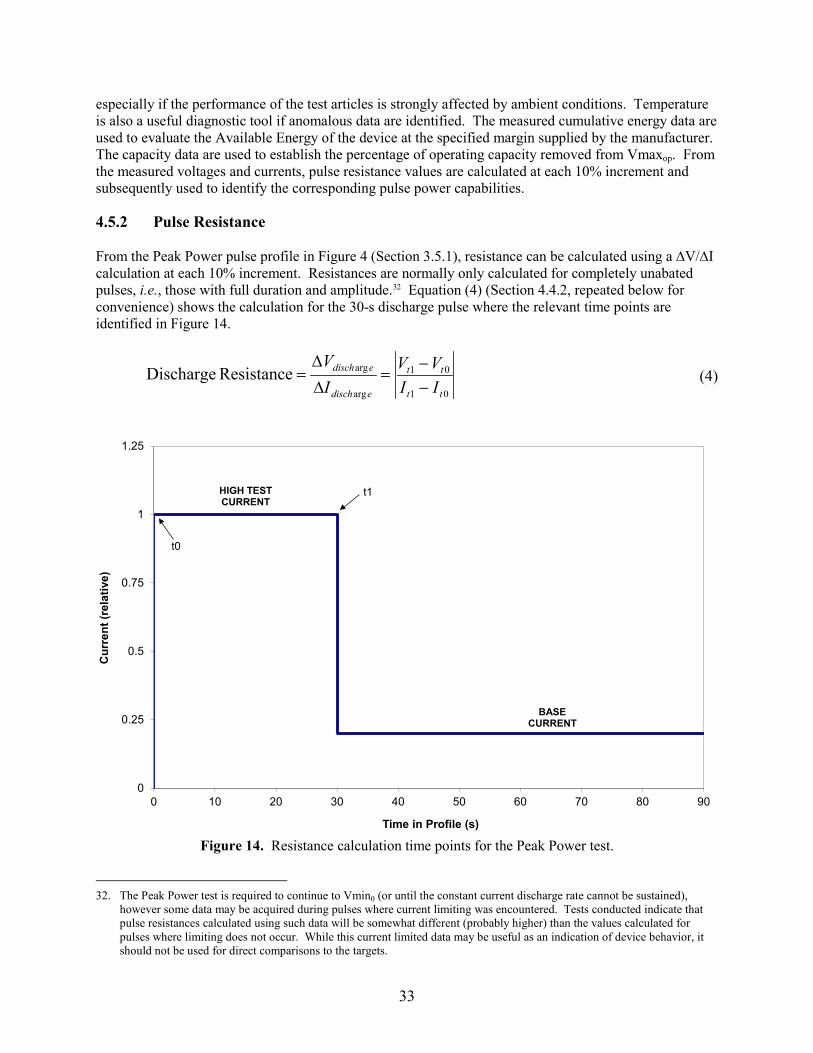
33
especially if the performance of the test articles is strongly affected by ambient conditions. Temperature is also a useful diagnostic tool if anomalous data are identified. The measured cumulative energy data are used to evaluate the Available Energy of the device at the specified margin supplied by the manufacturer. The capacity data are used to establish the percentage of operating capacity removed from Vmaxop. From the measured voltages and currents, pulse resistance values are calculated at each 10% increment and subsequently used to identify the corresponding pulse power capabilities.
4.5.2 Pulse Resistance
From the Peak Power pulse profile in Figure 4 (Section 3.5.1), resistance can be calculated using a DV/DI calculation at each 10% increment. Resistances are normally only calculated for completely unabated pulses, i.e., those with full duration and amplitude.32 Equation (4) (Section 4.4.2, repeated below for convenience) shows the calculation for the 30-s discharge pulse where the relevant time points are identified in Figure 14.
01
01
arg
argResistance Dischargett
tt
edisch
edisch
IIVV
IV
−−
=DD
= (4)
Figure 14. Resistance calculation time points for the Peak Power test.
32. The Peak Power test is required to continue to Vmin0 (or until the constant current discharge rate cannot be sustained),
however some data may be acquired during pulses where current limiting was encountered. Tests conducted indicate that pulse resistances calculated using such data will be somewhat different (probably higher) than the values calculated for pulses where limiting does not occur. While this current limited data may be useful as an indication of device behavior, it should not be used for direct comparisons to the targets.
0
0.25
0.5
0.75
1
1.25
0 10 20 30 40 50 60 70 80 90
Cur
rent
(rel
ativ
e)
Time in Profile (s)
BASE CURRENT
HIGH TEST CURRENT
t0
t1
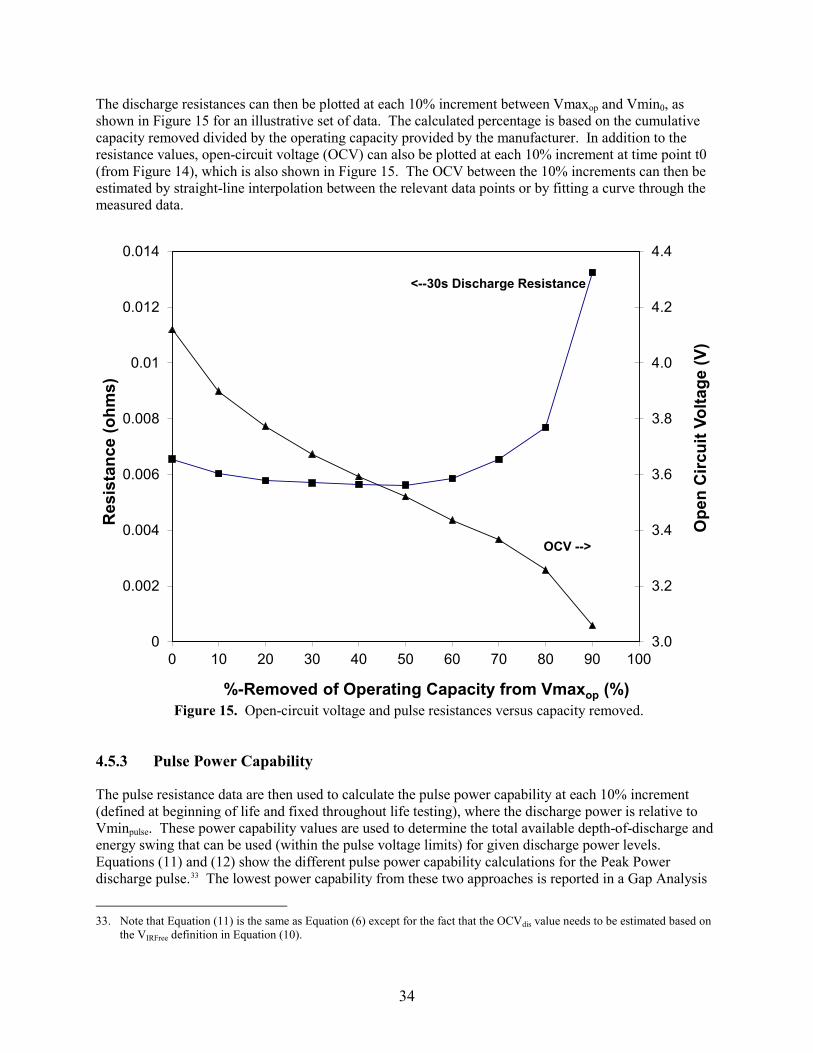
34
The discharge resistances can then be plotted at each 10% increment between Vmaxop and Vmin0, as shown in Figure 15 for an illustrative set of data. The calculated percentage is based on the cumulative capacity removed divided by the operating capacity provided by the manufacturer. In addition to the resistance values, open-circuit voltage (OCV) can also be plotted at each 10% increment at time point t0 (from Figure 14), which is also shown in Figure 15. The OCV between the 10% increments can then be estimated by straight-line interpolation between the relevant data points or by fitting a curve through the measured data.
Figure 15. Open-circuit voltage and pulse resistances versus capacity removed.
4.5.3 Pulse Power Capability
The pulse resistance data are then used to calculate the pulse power capability at each 10% increment (defined at beginning of life and fixed throughout life testing), where the discharge power is relative to Vminpulse. These power capability values are used to determine the total available depth-of-discharge and energy swing that can be used (within the pulse voltage limits) for given discharge power levels. Equations (11) and (12) show the different pulse power capability calculations for the Peak Power discharge pulse.33 The lowest power capability from these two approaches is reported in a Gap Analysis
33. Note that Equation (11) is the same as Equation (6) except for the fact that the OCVdis value needs to be estimated based on
the VIRFree definition in Equation (10).
3.0
3.2
3.4
3.6
3.8
4.0
4.2
4.4
0
0.002
0.004
0.006
0.008
0.01
0.012
0.014
0 10 20 30 40 50 60 70 80 90 100
Ope
n C
ircui
t Vol
tage
(V)
Res
ista
nce
(ohm
s)
%-Removed of Operating Capacity from Vmaxop (%)
OCV -->
<--30s Discharge Resistance
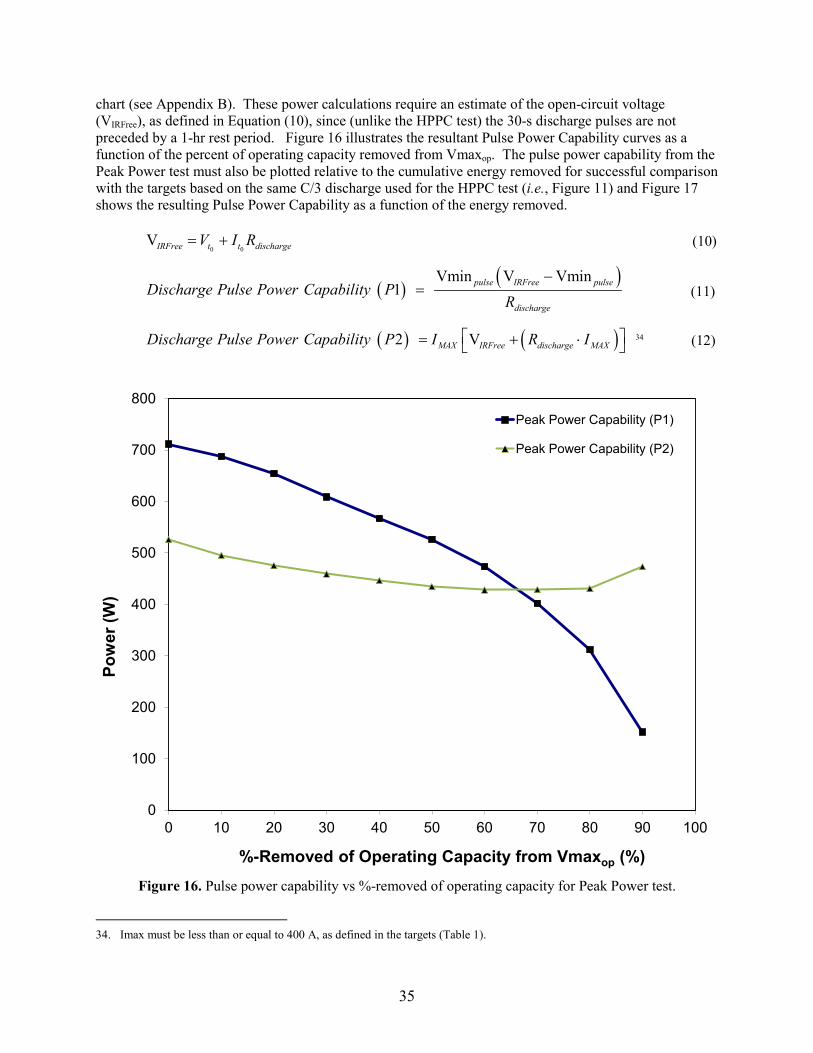
35
chart (see Appendix B). These power calculations require an estimate of the open-circuit voltage (VIRFree), as defined in Equation (10), since (unlike the HPPC test) the 30-s discharge pulses are not preceded by a 1-hr rest period. Figure 16 illustrates the resultant Pulse Power Capability curves as a function of the percent of operating capacity removed from Vmaxop. The pulse power capability from the Peak Power test must also be plotted relative to the cumulative energy removed for successful comparison with the targets based on the same C/3 discharge used for the HPPC test (i.e., Figure 11) and Figure 17 shows the resulting Pulse Power Capability as a function of the energy removed.
0 0VIRFree t t dischargeV I R= + (10)
( ) ( )Vmin V Vmin 1 pulse IRFree pulse
discharge
Discharge Pulse Power Capability PR
−= (11)
( ) ( ) 2 V MAX IRFree discharge MAXDischarge Pulse Power Capability P I R I = + ⋅ 34 (12)
Figure 16. Pulse power capability vs %-removed of operating capacity for Peak Power test.
34. Imax must be less than or equal to 400 A, as defined in the targets (Table 1).
0
100
200
300
400
500
600
700
800
0 10 20 30 40 50 60 70 80 90 100
Pow
er (W
)
%-Removed of Operating Capacity from Vmaxop (%)
Peak Power Capability (P1)
Peak Power Capability (P2)
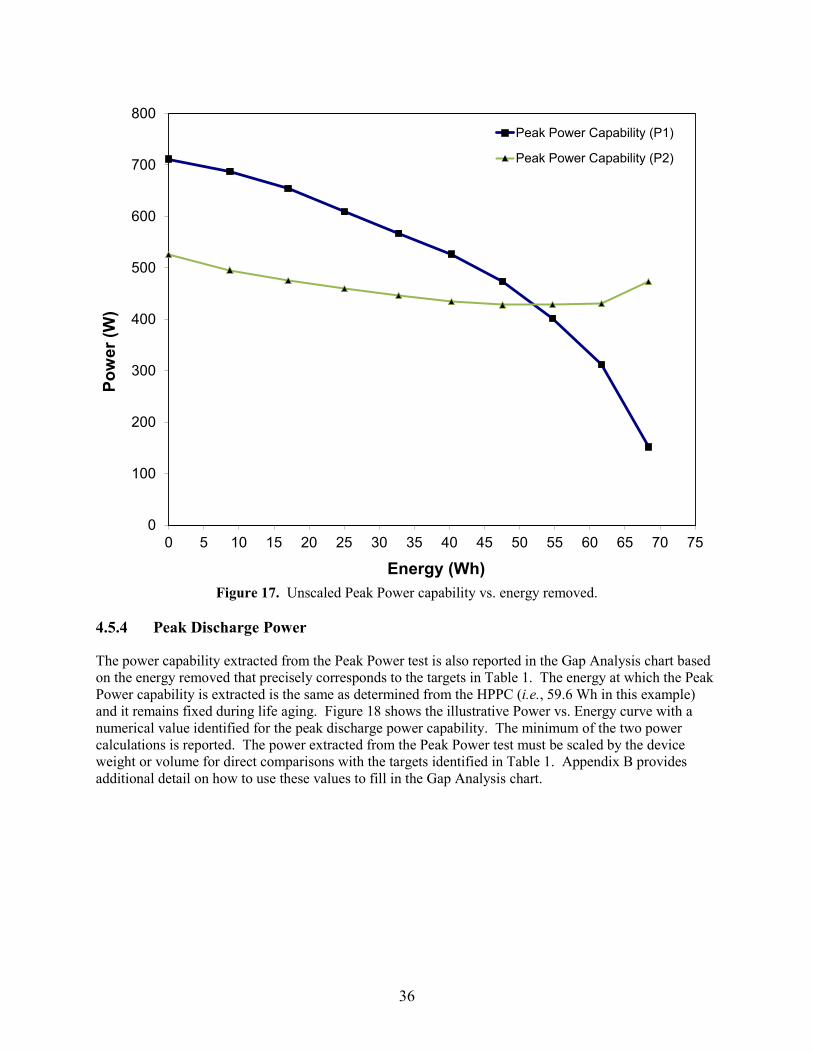
36
Figure 17. Unscaled Peak Power capability vs. energy removed.
4.5.4 Peak Discharge Power
The power capability extracted from the Peak Power test is also reported in the Gap Analysis chart based on the energy removed that precisely corresponds to the targets in Table 1. The energy at which the Peak Power capability is extracted is the same as determined from the HPPC (i.e., 59.6 Wh in this example) and it remains fixed during life aging. Figure 18 shows the illustrative Power vs. Energy curve with a numerical value identified for the peak discharge power capability. The minimum of the two power calculations is reported. The power extracted from the Peak Power test must be scaled by the device weight or volume for direct comparisons with the targets identified in Table 1. Appendix B provides additional detail on how to use these values to fill in the Gap Analysis chart.
0
100
200
300
400
500
600
700
800
0 5 10 15 20 25 30 35 40 45 50 55 60 65 70 75
Pow
er (W
)
Energy (Wh)
Peak Power Capability (P1)
Peak Power Capability (P2)
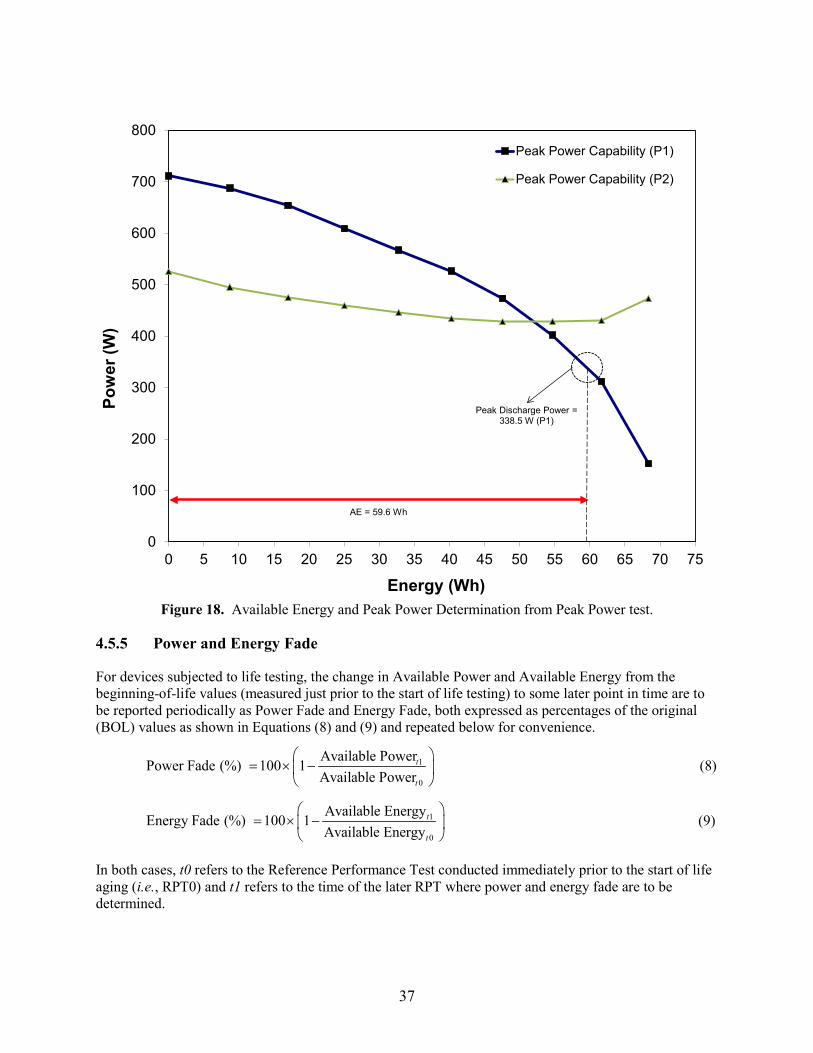
37
Figure 18. Available Energy and Peak Power Determination from Peak Power test.
4.5.5 Power and Energy Fade
For devices subjected to life testing, the change in Available Power and Available Energy from the beginning-of-life values (measured just prior to the start of life testing) to some later point in time are to be reported periodically as Power Fade and Energy Fade, both expressed as percentages of the original (BOL) values as shown in Equations (8) and (9) and repeated below for convenience.
1
0
Available PowerPower Fade (%) 100 1Available Power
t
t
= × −
(8)
1
0
Available EnergyEnergy Fade (%) 100 1Available Energy
t
t
= × −
(9)
In both cases, t0 refers to the Reference Performance Test conducted immediately prior to the start of life aging (i.e., RPT0) and t1 refers to the time of the later RPT where power and energy fade are to be determined.
0
100
200
300
400
500
600
700
800
0 5 10 15 20 25 30 35 40 45 50 55 60 65 70 75
Pow
er (W
)
Energy (Wh)
Peak Power Capability (P1)
Peak Power Capability (P2)
Peak Discharge Power = 338.5 W (P1)
AE = 59.6 Wh
38
4.5.6 Other Laboratory Cell Performance Characteristics
Other laboratory cell performance characteristics can be calculated from the Peak Power data to permit scale-up calculations to full-size cells and/or observe unique features in the specific cell chemistry. These include some or all of the following:
• Voltage response time constant estimates for discharge, regen, and rest periods derived from the current-driven HPPC Test data
• Ohmic and polarization resistances derived from lumped parameter equivalent circuit models
• Cell capacity and energy in area-specific, gravimetric, and volumetric units (mAh/cm2, mWh/cm2, Ah/kg, Wh/kg, Ah/liter, Wh/liter)
• Cell area-specific impedance in ohms-cm2 for discharge and for regen from HPPC data for 12 Volt Start/Stop applications. (Note: this requires specific knowledge of the active surface area of the cells).
The data acquired from Peak Power testing are ultimately used for modeling cell characteristics and for the selection and design of full-size module and battery pack characteristics.
4.6 Self-Discharge Test
Self-discharge rate is determined over a fixed period (nominally 30 days) at one or more intermediate test conditions (nominally after removing the energy corresponding to the manufacturer-specified margin or 45 kWh for a System Level application). The difference between the energy (watt-hours) measured prior to the test and during the test is considered to be the energy loss reflecting self-discharge during the stand period. This energy loss is computed as the difference between the pretest C/3 energy and the sum of the energies in the partial C/3 discharges before and after the stand period. This value is then divided by the length of the stand period in days and multiplied by the appropriate Battery Size Factor, as shown in Equation (13).
/3 before test part 1 part 2
/3 before test
( )Self Discharge 100%C
C
Wh Wh WhWh− +
= × (13)
The result of this calculation is reported for comparison with the USABC target of less than 1% loss per month. (Note: The self-discharge test for a module with electronic cell balancing circuit etc. should be reported to show the cell self-discharge and any parasitic drain on the module.)
4.7 Thermal Performance Tests
Measured capacity and energy at the C/3 rate is reported over the range of temperatures at which the Static Capacity Test is performed. Results of HPPC testing at temperatures other than nominal are reported in the same formats defined in Section 4.4, except that the test temperature must accompany all data and graphs. The results of the thermal performance test will show the available energy at each temperature. The observed available energy at -20°C is reported in the Gap Analysis chart and the rest are used to establish the range of performance capability over the target temperature range of -30 to +52°C. In all temperature conditions, it is expected that the power requirements in the established targets (Table 1) will also be met.
39
4.7.1 Survival Temperature Test
The survival temperature test is designed to evaluate degradation at the extreme upper and lower temperatures. The capacity, energy and power loss from the HPPC after the upper and/or lower temperature test are reported.
4.8 Cycle Life Tests
For the selected life test profile, the cumulative number of test profiles executed prior to the most recent Reference Performance Tests is reported, along with any performance changes measured by these Reference Performance Tests. If testing is terminated due to the inability of the cell to perform the programmed test profile within the voltage limits or some other end-of-test condition, this is reported. However, the number of profiles performed is not necessarily the cycle life and should not be reported as such.35 Detailed results of the reference tests are reported over life as described under these specific tests, including the magnitude of adjustments made (if any) due to the measured temperatures being above or below the nominal temperature. In addition, degradation of capacity, pulse power capability, and Available Energy as a function of life (i.e., number of test profiles performed) should be reported graphically.
The value of cycle life to be reported for a device subjected to cycle life testing is defined as the number of test profiles performed before end of life is reached.36 In general an end of life condition is reached when the device is no longer able to meet the USABC targets (regardless of when testing is actually terminated). The ability to meet the targets is evaluated based on the periodic Reference Performance Tests, particularly the HPPC and Peak Power test results. When the power and energy performance of the device degrades to the point that there is no power or energy margin (i.e., Available Energy is less than the target value at the target power), the device has reached end of life. In addition, the inability to meet any of the other USABC technical targets (e.g., the self-discharge target) also constitutes end of life. The basis for the reported cycle life value (i.e., the limiting target condition) should also be reported.37 If the cycle life based on power and energy performance is very near the target, the end of life point may need to be interpolated based on the change in HPPC performance from the previous reference test.
4.9 Calendar Life Test
The raw data from calendar life testing are the periodic reference performance parameter measurements for all the batteries under test. The objective of this data analysis is to estimate battery calendar life under actual usage in a specified customer environment. Typically, the environmental specification will include a cumulative distribution of expected battery temperature over its 15-year life in, for example, the 90th percentile climate among the target vehicle market regions. These temperatures will vary, and will generally be substantially lower than the elevated temperatures used for (accelerated) calendar life testing. 35. If the device can’t do the profile, that is the end of life. However, the device may fail the performance requirements in the
middle of the cycle life test, but it won’t be caught until the RPT. 36. If the RPT shows that the device has past the end of life, then the cycle life reported is from the prior RPT.
37. Self-discharge is not necessarily measured at regular intervals during life testing, so the point during life cycling where such an end of life condition is reached cannot always be determined with high accuracy. Typically the test results showing that the targets are not met would be reported, without attempting to interpolate an end of life point using two test results widely separated in time.
40
Note that for most (> 90%) of its 15-year life, the battery will typically be in a non-operating, vehicle-parked state. Predicting battery life is a desired outcome of testing. There are various approaches to constructing a battery life model. One is theoretical, using various physical and chemical processes that may occur in the battery, which degrade its performance. A second is fitting a curve to the data. For a more advanced treatment of life test results, refer to Battery Life Estimator Manual (Reference 6).
4.10 Reference Performance Tests
Results to be reported from the periodic Reference Performance Tests are defined in the previous sections on Cycle Life and Calendar Life Tests.
4.11 Module Controls Verification Tests
Standard tests are not defined in this manual for module control behavior, so analysis and reporting requirements for such tests must be detailed in device-specific test plans, as needed.
4.12 System-Level Testing
In general, the analysis and reporting of test results for complete battery systems is conducted similarly to comparable cell tests, with the exception that the BSF will be 1 by definition. Additional reporting requirements (e.g., detailed cell or module performance) should be specified in a device-specific test plan that accounts for the specific design features of such a system.
Test procedures and the associated reporting requirements are not defined in this manual for system-level thermal management load testing.

41
5. REFERENCES
1. USABC Electric Vehicle Battery Test Procedures Manual, Revision 2, DOE/ID-10479, January 1996.
2. PNGV Battery Test Manual, Revision 3, DOE/ID-10597, February 2001.
3. FreedomCAR Battery Test Manual for Power-Assist Hybrid Electric Vehicles, DOE/ID-11069, October 2003.
4. Battery Test Manual for Plug-In Hybrid Electric Vehicles, INL/EXT-14-32849, Rev. 3, September 2014.
5. Battery Technology Life Verification Test Manual, INL/EXT-12-27920, Rev. 1, December 2012.
6. Battery Calendar Life Estimator Manual, INL-EXT 08-15136, Rev. 1, October 2012.
42
APPENDIX A - SAMPLE TEST PLAN
This appendix provides a sample test plan based on the test requirements for this EV Manual. It is not intended to be a thorough representation, but an example format that can be useful in developing device-specific test plans for various deliverables.
VEHICLE TECHNOLOGIES OFFICE EV TEST PLAN FOR TBD DEVICES
1.0 Purpose and Applicability
The intent of the tests described in this test plan is to characterize the performance of TBD articles supplied by TBD for the TBD Battery mode. This testing will benchmark the performance capability of the articles relative to the TBD targets and is under the oversight of the Department of Energy, Vehicle Technology Office. TBD articles were received from TBD and TBD of them will be subjected to testing under this plan. The articles will be subjected to the performance test procedures defined for the EV Program and as outlined in Section 7.0.
2.0 References
2.1 Battery Test Manual for Electric Vehicles, INL/EXT-15-34184, Rev. 3, June 2015
3.0 Equipment
3.1 All testing is to be performed on test channels with current and voltage capabilities adequate for the specific test procedures to be performed.
3.2 Except where specifically noted otherwise, all tests will be performed within a temperature chamber capable of controlling the chamber temperature to within +3 °C.
4.0 Prerequisites and Pre-Test Preparation
4.1 Actual weights and open circuit voltages of the articles as delivered shall be recorded. 4.2 If possible, 1 kHz impedance measurements shall be made prior to the start of testing
with the articles as received.
5.0 Cell Ratings, Test Limitations and Other Test Information
5.1 Ratings
Rated Capacity: TBD A-h (C/3 rate) Operating Capacity: TBD A-h (C/3 rate) Application: TBD Level Battery Size Factor: TBD articles HPPC Pulse Power Voltage Calculation Ranges: Vmin0 TBD V
Vmaxop TBD V
Chemistry: TBD
43
5.2 Temperature Ratings
Operating Temperature Range: TBD°C to TBD°C Discharge Temperature Range: TBD°C to TBD°C
Charge Temperature Range: TBD°C to TBD°C Storage Temperature Range: TBD°C to TBD°C Cold Cranking Temperature TBD°C to TBD°C
5.3 Nominal Values
Nominal Capacity: TBD A-h Nominal Weight: TBD kg Nominal Volume: TBD L
5.4 Discharge Limits
Minimum Discharge Voltage
Continuous rates ≤ C/3 rate (Vmin0): TBD V ≤30 s pulse (Vminpulse): TBD V
≤30 s pulse and temp ≤0°C (VminLowT): TBD V Maximum Discharge Current: Continuous rates ≤ C/3 rate: TBD A
≤30 second pulse: TBD A
5.5 Charge and Regen Limits Maximum Charge and Regen Voltage
Continuous rates ≤ C/3 rate (Vmax100): TBD V Continuous rates ≤ C/3 rate (Vmaxop): TBD V ≤10 second pulse (Vmaxpulse): TBD V
Maximum Charge and Regen Current: Continuous ≤ C/3 rate: TBD A
≤10 second pulse: TBD A
5.6 Other Test Info:
Charge Procedure: TBD
5.7 End-of-Testing Criterion:
1. Completion of a number of properly scaled life cycle test profiles adequate to meet the EV life cycle target (as appropriate for the technology) or scheduled testing; or
2. Inability to perform the life cycle test profile at the programmed values at the required test condition without exceeding the voltage limits; or
3. Inability to give valid data from the HPPC Reference Performance Test; or 4. Inability to meet the EV power and energy targets or 5. When directed by the technical program manager.
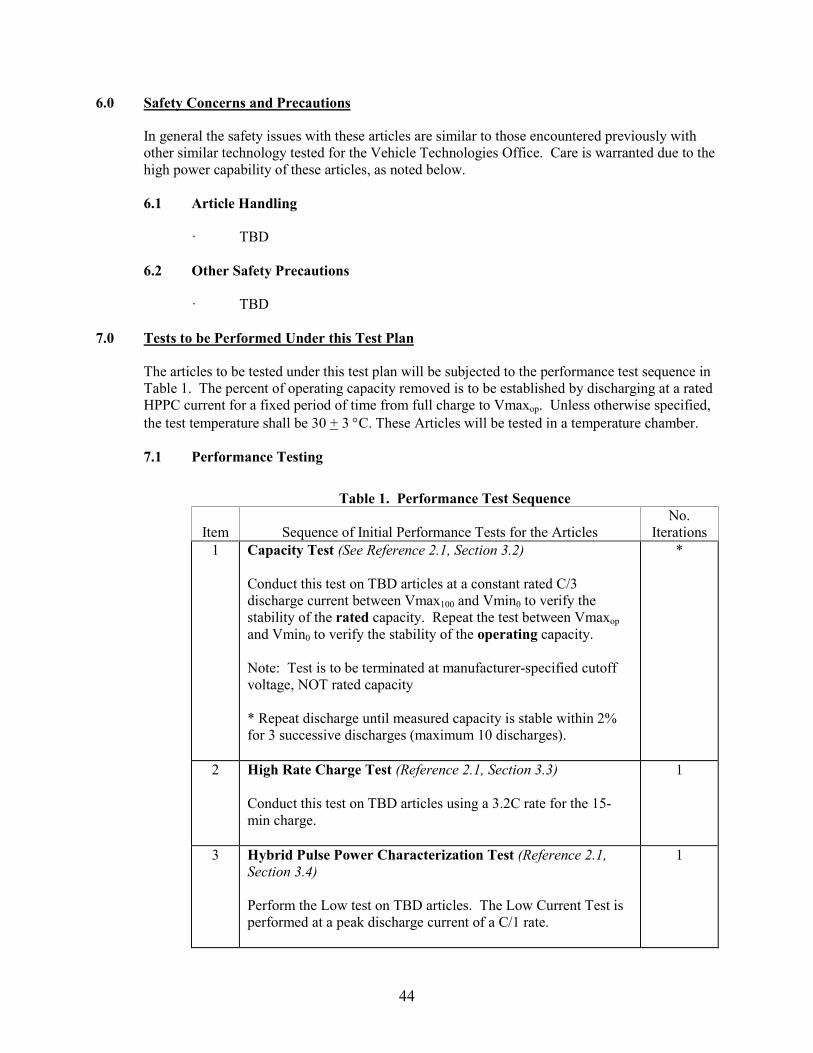
44
6.0 Safety Concerns and Precautions In general the safety issues with these articles are similar to those encountered previously with other similar technology tested for the Vehicle Technologies Office. Care is warranted due to the high power capability of these articles, as noted below.
6.1 Article Handling
· TBD
6.2 Other Safety Precautions
· TBD
7.0 Tests to be Performed Under this Test Plan
The articles to be tested under this test plan will be subjected to the performance test sequence in Table 1. The percent of operating capacity removed is to be established by discharging at a rated HPPC current for a fixed period of time from full charge to Vmaxop. Unless otherwise specified, the test temperature shall be 30 + 3 °C. These Articles will be tested in a temperature chamber.
7.1 Performance Testing
Table 1. Performance Test Sequence
Item
Sequence of Initial Performance Tests for the Articles
No. Iterations
1
Capacity Test (See Reference 2.1, Section 3.2) Conduct this test on TBD articles at a constant rated C/3 discharge current between Vmax100 and Vmin0 to verify the stability of the rated capacity. Repeat the test between Vmaxop and Vmin0 to verify the stability of the operating capacity. Note: Test is to be terminated at manufacturer-specified cutoff voltage, NOT rated capacity * Repeat discharge until measured capacity is stable within 2% for 3 successive discharges (maximum 10 discharges).
*
2 High Rate Charge Test (Reference 2.1, Section 3.3) Conduct this test on TBD articles using a 3.2C rate for the 15-min charge.
1
3 Hybrid Pulse Power Characterization Test (Reference 2.1, Section 3.4) Perform the Low test on TBD articles. The Low Current Test is performed at a peak discharge current of a C/1 rate.
1
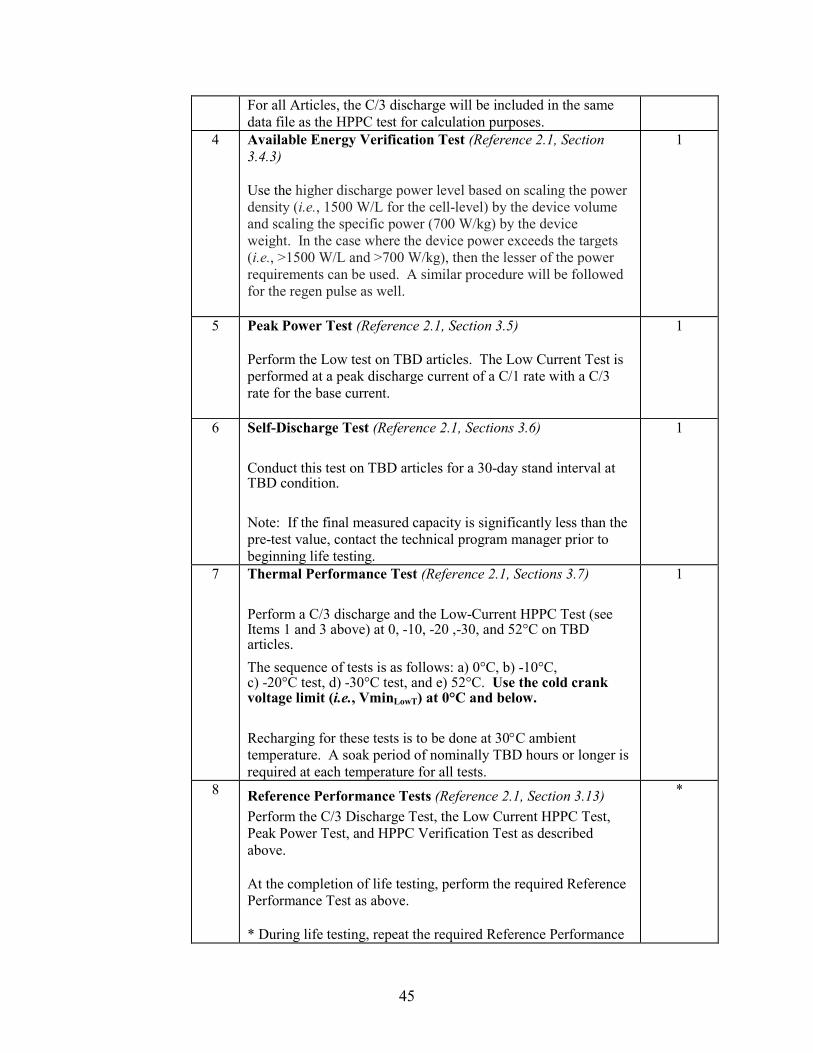
45
For all Articles, the C/3 discharge will be included in the same data file as the HPPC test for calculation purposes.
4 Available Energy Verification Test (Reference 2.1, Section 3.4.3) Use the higher discharge power level based on scaling the power density (i.e., 1500 W/L for the cell-level) by the device volume and scaling the specific power (700 W/kg) by the device weight. In the case where the device power exceeds the targets (i.e., >1500 W/L and >700 W/kg), then the lesser of the power requirements can be used. A similar procedure will be followed for the regen pulse as well.
1
5 Peak Power Test (Reference 2.1, Section 3.5) Perform the Low test on TBD articles. The Low Current Test is performed at a peak discharge current of a C/1 rate with a C/3 rate for the base current.
1
6 Self-Discharge Test (Reference 2.1, Sections 3.6) Conduct this test on TBD articles for a 30-day stand interval at TBD condition. Note: If the final measured capacity is significantly less than the pre-test value, contact the technical program manager prior to beginning life testing.
1
7 Thermal Performance Test (Reference 2.1, Sections 3.7) Perform a C/3 discharge and the Low-Current HPPC Test (see Items 1 and 3 above) at 0, -10, -20 ,-30, and 52°C on TBD articles. The sequence of tests is as follows: a) 0°C, b) -10°C, c) -20°C test, d) -30°C test, and e) 52°C. Use the cold crank voltage limit (i.e., VminLowT) at 0°C and below. Recharging for these tests is to be done at 30°C ambient temperature. A soak period of nominally TBD hours or longer is required at each temperature for all tests.
1
8 Reference Performance Tests (Reference 2.1, Section 3.13) Perform the C/3 Discharge Test, the Low Current HPPC Test, Peak Power Test, and HPPC Verification Test as described above. At the completion of life testing, perform the required Reference Performance Test as above. * During life testing, repeat the required Reference Performance
*
46
Test every 32 days.
9 Cycle Life Test (Reference 2.1, Sections 3.10) As directed.
10 Calendar Life Test (Reference 2.1, Sections 3.11) As directed.
8.0 Measurement and Reporting Requirements
8.1 Measurements TBD
8.2 Data Recording Intervals
TBD
8.3 Data Access TBD
9.0 Anticipated Results
The purpose of this testing is to compare the performance of the technology against the EV targets. 9.1 Testing Deliverables
Test data and results will be generated as specified in the performance and life cycle test procedures in Reference 2.1. Quarterly progress summary information will be provided to the technical program manager.
10.0 Post-Test Examination, Analysis, and Disposition
TBD 11.0 Contact Persons
TBD
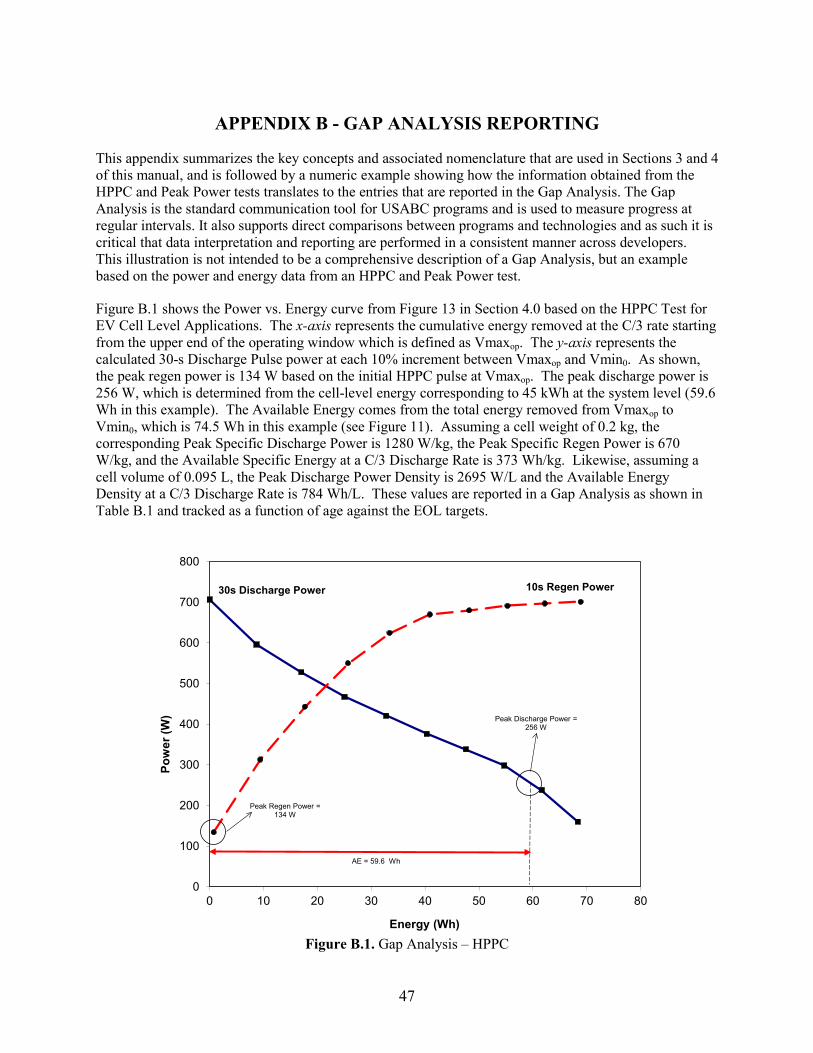
47
APPENDIX B - GAP ANALYSIS REPORTING
This appendix summarizes the key concepts and associated nomenclature that are used in Sections 3 and 4 of this manual, and is followed by a numeric example showing how the information obtained from the HPPC and Peak Power tests translates to the entries that are reported in the Gap Analysis. The Gap Analysis is the standard communication tool for USABC programs and is used to measure progress at regular intervals. It also supports direct comparisons between programs and technologies and as such it is critical that data interpretation and reporting are performed in a consistent manner across developers. This illustration is not intended to be a comprehensive description of a Gap Analysis, but an example based on the power and energy data from an HPPC and Peak Power test.
Figure B.1 shows the Power vs. Energy curve from Figure 13 in Section 4.0 based on the HPPC Test for EV Cell Level Applications. The x-axis represents the cumulative energy removed at the C/3 rate starting from the upper end of the operating window which is defined as Vmaxop. The y-axis represents the calculated 30-s Discharge Pulse power at each 10% increment between Vmaxop and Vmin0. As shown, the peak regen power is 134 W based on the initial HPPC pulse at Vmaxop. The peak discharge power is 256 W, which is determined from the cell-level energy corresponding to 45 kWh at the system level (59.6 Wh in this example). The Available Energy comes from the total energy removed from Vmaxop to Vmin0, which is 74.5 Wh in this example (see Figure 11). Assuming a cell weight of 0.2 kg, the corresponding Peak Specific Discharge Power is 1280 W/kg, the Peak Specific Regen Power is 670 W/kg, and the Available Specific Energy at a C/3 Discharge Rate is 373 Wh/kg. Likewise, assuming a cell volume of 0.095 L, the Peak Discharge Power Density is 2695 W/L and the Available Energy Density at a C/3 Discharge Rate is 784 Wh/L. These values are reported in a Gap Analysis as shown in Table B.1 and tracked as a function of age against the EOL targets.
Figure B.1. Gap Analysis – HPPC
0
100
200
300
400
500
600
700
800
0 10 20 30 40 50 60 70 80
Pow
er (W
)
Energy (Wh)
30s Discharge Power 10s Regen Power
AE = 59.6 Wh
Peak Discharge Power = 256 W
Peak Regen Power = 134 W
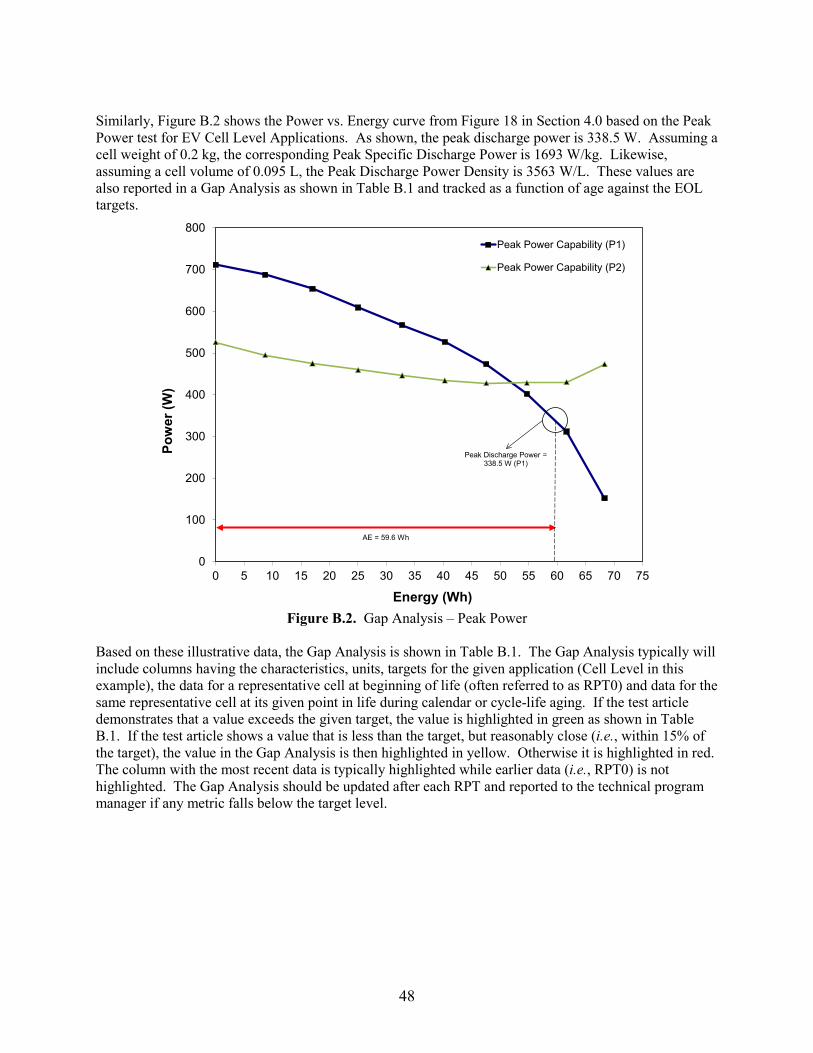
48
Similarly, Figure B.2 shows the Power vs. Energy curve from Figure 18 in Section 4.0 based on the Peak Power test for EV Cell Level Applications. As shown, the peak discharge power is 338.5 W. Assuming a cell weight of 0.2 kg, the corresponding Peak Specific Discharge Power is 1693 W/kg. Likewise, assuming a cell volume of 0.095 L, the Peak Discharge Power Density is 3563 W/L. These values are also reported in a Gap Analysis as shown in Table B.1 and tracked as a function of age against the EOL targets.
Figure B.2. Gap Analysis – Peak Power
Based on these illustrative data, the Gap Analysis is shown in Table B.1. The Gap Analysis typically will include columns having the characteristics, units, targets for the given application (Cell Level in this example), the data for a representative cell at beginning of life (often referred to as RPT0) and data for the same representative cell at its given point in life during calendar or cycle-life aging. If the test article demonstrates that a value exceeds the given target, the value is highlighted in green as shown in Table B.1. If the test article shows a value that is less than the target, but reasonably close (i.e., within 15% of the target), the value in the Gap Analysis is then highlighted in yellow. Otherwise it is highlighted in red. The column with the most recent data is typically highlighted while earlier data (i.e., RPT0) is not highlighted. The Gap Analysis should be updated after each RPT and reported to the technical program manager if any metric falls below the target level.
0
100
200
300
400
500
600
700
800
0 5 10 15 20 25 30 35 40 45 50 55 60 65 70 75
Pow
er (W
)
Energy (Wh)
Peak Power Capability (P1)
Peak Power Capability (P2)
Peak Discharge Power = 338.5 W (P1)
AE = 59.6 Wh
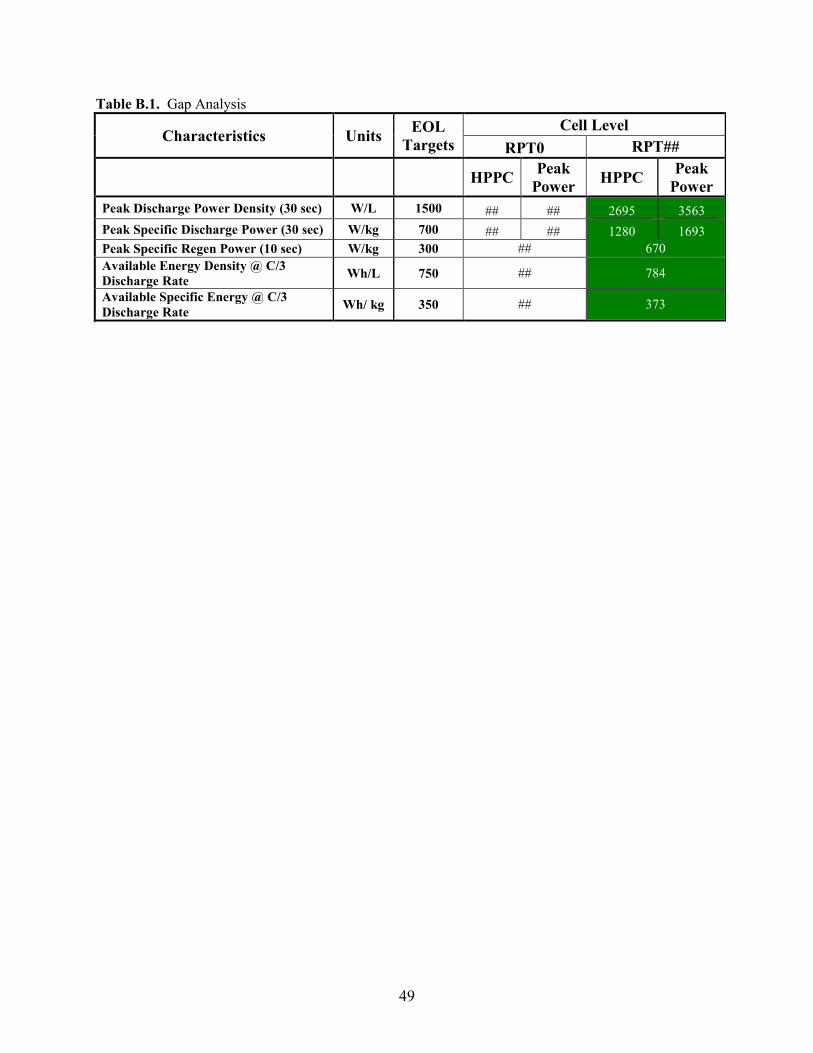
49
Table B.1. Gap Analysis
Characteristics Units EOL Targets
Cell Level RPT0 RPT##
HPPC Peak Power HPPC Peak
Power Peak Discharge Power Density (30 sec) W/L 1500 ## ## 2695 3563 Peak Specific Discharge Power (30 sec) W/kg 700 ## ## 1280 1693 Peak Specific Regen Power (10 sec) W/kg 300 ## 670 Available Energy Density @ C/3 Discharge Rate Wh/L 750 ## 784
Available Specific Energy @ C/3 Discharge Rate Wh/ kg 350 ## 373
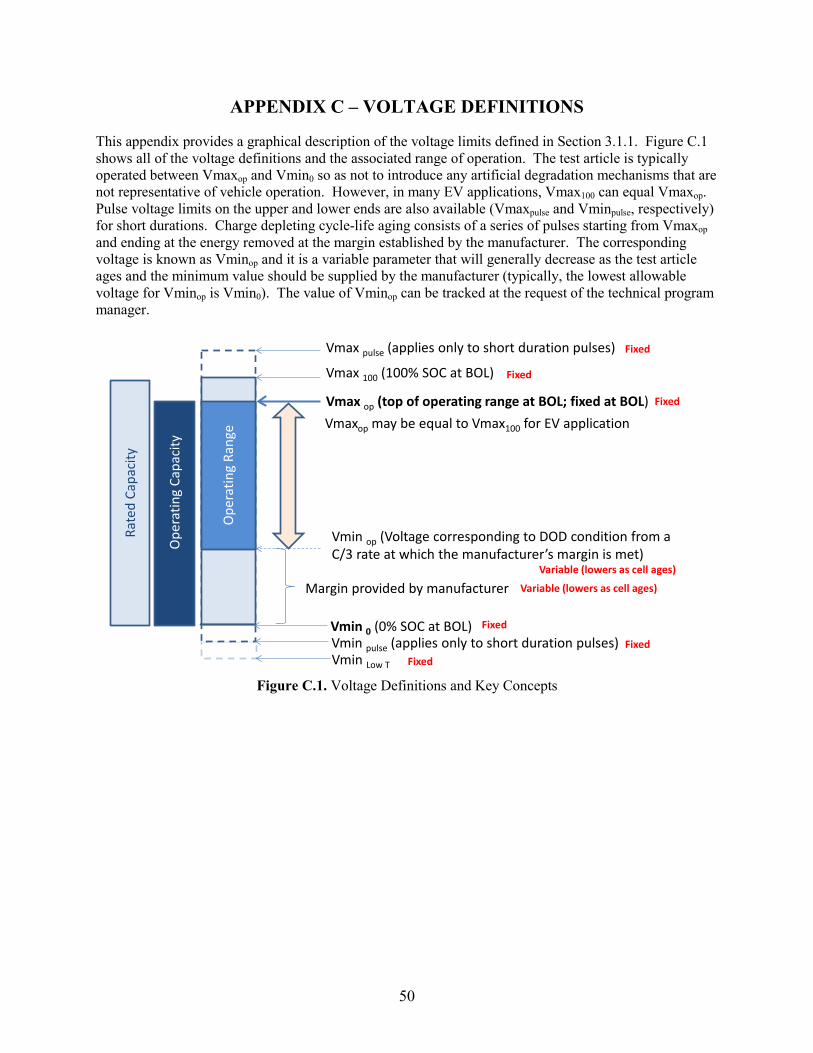
50
APPENDIX C – VOLTAGE DEFINITIONS
This appendix provides a graphical description of the voltage limits defined in Section 3.1.1. Figure C.1 shows all of the voltage definitions and the associated range of operation. The test article is typically operated between Vmaxop and Vmin0 so as not to introduce any artificial degradation mechanisms that are not representative of vehicle operation. However, in many EV applications, Vmax100 can equal Vmaxop. Pulse voltage limits on the upper and lower ends are also available (Vmaxpulse and Vminpulse, respectively) for short durations. Charge depleting cycle-life aging consists of a series of pulses starting from Vmaxop and ending at the energy removed at the margin established by the manufacturer. The corresponding voltage is known as Vminop and it is a variable parameter that will generally decrease as the test article ages and the minimum value should be supplied by the manufacturer (typically, the lowest allowable voltage for Vminop is Vmin0). The value of Vminop can be tracked at the request of the technical program manager.
Figure C.1. Voltage Definitions and Key Concepts
Vmin op (Voltage corresponding to DOD condition from a C/3 rate at which the manufacturer’s margin is met)
Vmax pulse (applies only to short duration pulses)
Vmax 100 (100% SOC at BOL)
Vmin pulse (applies only to short duration pulses)
Vmax op (top of operating range at BOL; fixed at BOL)
Vmin 0 (0% SOC at BOL)
Vmin Low T
Ope
ratin
g Ca
paci
ty
Ope
ratin
g Ra
nge
Fixed
Fixed
Fixed
Fixed
FixedFixed
Rate
d Ca
paci
ty
Variable (lowers as cell ages)
Vmaxop may be equal to Vmax100 for EV application
Margin provided by manufacturer Variable (lowers as cell ages)