Battery electric vehicles - WBCSD Publications
22
April 2019 Battery electric vehicles
Transcript of Battery electric vehicles - WBCSD Publications

April 2019
Battery electric vehicles

Background
Description of battery electric vehicles
GHG reduction potentials
New partnership opportunities
SWOT analysis
Sucess factors
1
2
3
5
6
7
Case Studies8
Summary9
Table of contents
Cost assessment and sensitivity analysis4
References10
2
1. Background
Road transport is almost exclusively fueled by fossil fuels, but various low-carbon solutions exist
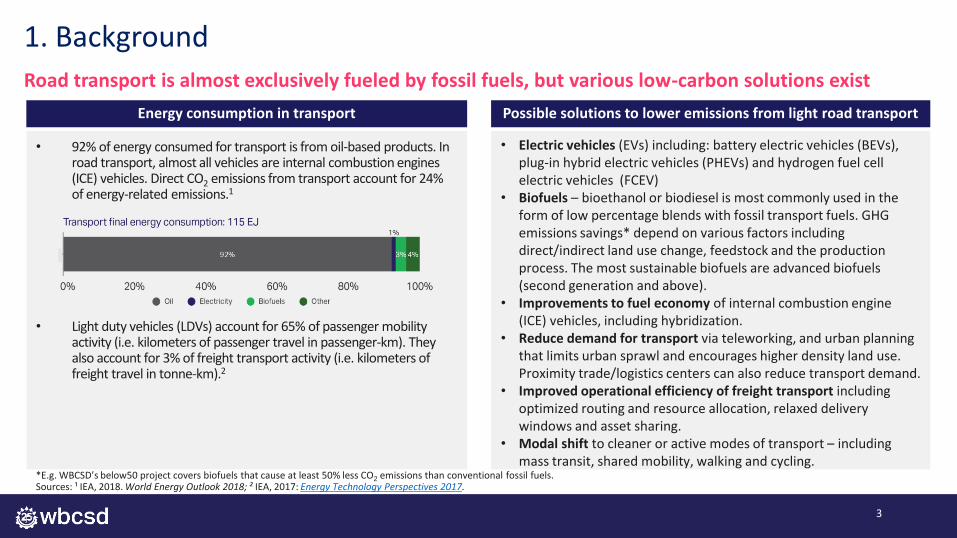
• 92% of energy consumed for transport is from oil-based products. In road transport, almost all vehicles are internal combustion engines (ICE) vehicles. Direct CO2 emissions from transport account for 24% of energy-related emissions.1
• Light duty vehicles (LDVs) account for 65% of passenger mobility activity (i.e. kilometers of passenger travel in passenger-km). They also account for 3% of freight transport activity (i.e. kilometers of freight travel in tonne-km).2
Energy consumption in transport
• Electric vehicles (EVs) including: battery electric vehicles (BEVs), plug-in hybrid electric vehicles (PHEVs) and hydrogen fuel cell electric vehicles (FCEV)
• Biofuels – bioethanol or biodiesel is most commonly used in the form of low percentage blends with fossil transport fuels. GHG emissions savings* depend on various factors including direct/indirect land use change, feedstock and the production process. The most sustainable biofuels are advanced biofuels (second generation and above).
• Improvements to fuel economy of internal combustion engine (ICE) vehicles, including hybridization.
• Reduce demand for transport via teleworking, and urban planning that limits urban sprawl and encourages higher density land use. Proximity trade/logistics centers can also reduce transport demand.
• Improved operational efficiency of freight transport including optimized routing and resource allocation, relaxed delivery windows and asset sharing.
• Modal shift to cleaner or active modes of transport – including mass transit, shared mobility, walking and cycling.
Possible solutions to lower emissions from light road transport
*E.g. WBCSD’s below50 project covers biofuels that cause at least 50% less CO2 emissions than conventional fossil fuels. Sources: ¹ IEA, 2018. World Energy Outlook 2018; ² IEA, 2017: Energy Technology Perspectives 2017.
3

• In 2014, well-to-wheel (WTW)* emissions from light duty vehicles were responsible for 4.8 GtCO2, or over half the WTW CO2 emissions from the transport sector.1
• In addition to CO2 emissions, light duty vehicles are also a major source of air pollutants in cities (including nitrogen oxides, particles, carbon monoxide and hydrocarbons).
Current CO2 and air pollution emissions from
light road transport
• Under the IEA’s reference technology scenario1 (taking into account today’s commitments to limit emissions and improve efficiency), demand for light duty passenger and freight services will double from today to 2050.
• However, WTW CO2 emissions from light road transport only increase from 4.8 GtCO2 in 2014 to 5.5 GtCO2 in 2050 in the IEA’s Reference Technology Scenario. The growth is moderated by efficiency improvements to ICE vehicles, hybridization and a small but growing share of electric vehicles.
Forecasted developments in a business-as-usual
scenario1
• Currently higher upfront purchase costs of electric vehicles is holding back scale up, although BEV costs are expected to come into line with ICEs in coming years. Also, limited infrastructure for refueling/charging, and range anxiety (for BEVs) constrain uptake of these vehicles.
• Limited availability of sustainable biofuels.• Infrastructure lock-in – many cities are designed with road transport as the main mode of transport,
limiting the possibilities for modal shifts to active or cleaner modes of transport.
Obstacles for decarbonizing light road
transport
Source: ¹ IEA, 2017: Energy Technology Perspectives 2017.
1. Background
Light duty vehicles are responsible for half of global CO2 emissions from transport
4
*Well-to-wheel (WTW) emissions associated with the fuel cycle, including power generation and transmission and distribution losses for BEVs, and liquid fossil fuel production, refining and transport and tail pipe emissions for ICEs.

• This business case covers battery electric vehicles (BEVs), which have a full electric drivetrain. The vehicle is powered by electricity from a battery and charged via an external charger.
• While many vehicle categories use this technology – including passenger cars, scooters, motorcycles and buses – this business case focuses on fully electric light duty vehicles or LDVs (passenger cars, vans and light trucks). Plug-in hybrids are not included in the scope of this case.
Description of the solution concept
• In general, BEVs have lower lifecycle GHG emissions compared to ICE vehicles; the emissions savings is dependent on the carbon intensity of the power generation mix used to charge the vehicle.
• BEVs also reduce air pollution (e.g. nitrous oxide and particulate matter) and noise pollution.• EVs have lower repair and maintenance bills compared with ICE vehicles. • Policy incentives – for example VAT, import and road tax exemptions for EVs in Norway.• Better access - examples include the exemption from congestion charging zone fees in London, access
and free parking in Lisbon’s and Madrid’s restricted access area.• BEVs can provide flexibility services to power systems, e.g. through vehicle-to-grid technologies, to help
stabilize the electricity grid and facilitate the integration of variable renewable capacity.
Rationale for developing this solution
• BEVs and charging infrastructure are established technologies at Technology Readiness Level 9 (system proven in operational environment). Most major OEMs have already launched or are developing BEVs.
Assessment of technology
readiness status
2. Description of battery electric vehicles
Overview
5

BEVs can be integrated into many company fleets as there is typically space to accommodate charging infrastructure in centralized parking facilities. The high utilization rate of company fleets improves the business case as fuel savings are greater and upfront costs can be slightly lower due to bulk procurement.
2. Description of battery electric vehicles
Use cases
6
Example use cases:
Company vehicle:
Used and housed with employee
Company vehicle:
Shared company car housed at company
Last mile deliveries
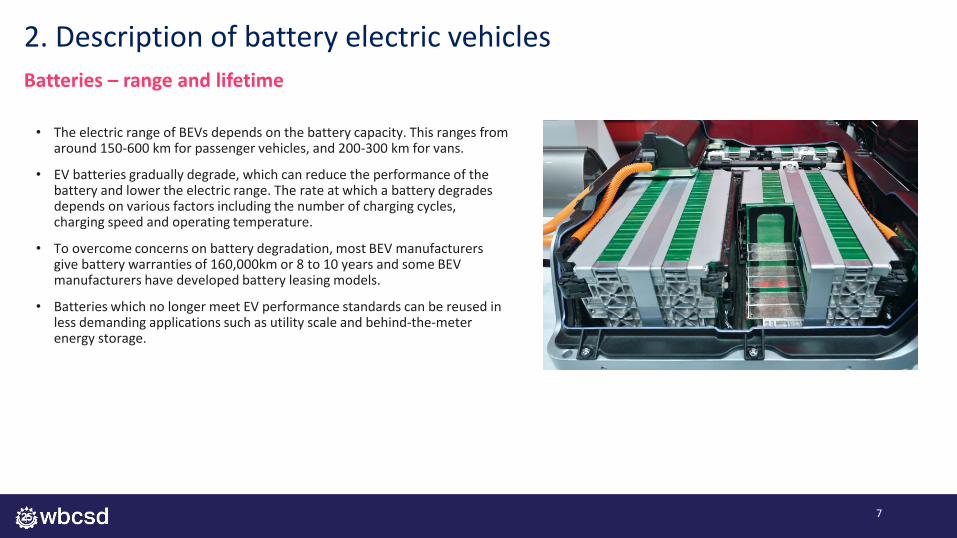
• The electric range of BEVs depends on the battery capacity. This ranges from around 150-600 km for passenger vehicles, and 200-300 km for vans.
• EV batteries gradually degrade, which can reduce the performance of the battery and lower the electric range. The rate at which a battery degrades depends on various factors including the number of charging cycles, charging speed and operating temperature.
• To overcome concerns on battery degradation, most BEV manufacturers give battery warranties of 160,000km or 8 to 10 years and some BEV manufacturers have developed battery leasing models.
• Batteries which no longer meet EV performance standards can be reused in less demanding applications such as utility scale and behind-the-meter energy storage.
2. Description of battery electric vehicles
Batteries – range and lifetime
7

2. Description of battery electric vehicles
Charging
• BEVs are charged at charging stations, which can be public (e.g. kerbside, public car parks or retail refueling stations that provide electricity station) or private (e.g. company site, home). Key characteristics which differentiate chargers are:
- Level: the power output, which determines the charging speed of the BEV
- Type: the socket and connector used for charging. Lack of standardization across vehicle manufacturers can be addressed by dual type chargers
• Two common chargers are Level 2 (L2) AC and DC fast chargers (DCFC)
• Smart charging will be important to managing peak loads. Smart chargers transfer electricity to BEVs and also transfer data bi-directionally; they optimize charging by distributing power to BEVs in an efficient and flexible manner. This includes charging when electricity is cheapest, reducing peak electricity demand and load balancing at charging points where multiple BEVs are connected.
• Vehicle-to-grid (V2G) technology enables bi-directional electricity transfer from and to BEVs, exploiting the storage potential of the batteries in BEVs to provide flexibility services to grid system operators, and an additional revenue stream for BEV owners.
Level 2 AC DCFC
Power (kW) 3.7-22 25-50
Time to charge assumed avg. daily travel (60km) 45 mins - 4 hours 20-40 minutes
8

Well-to-wheel (WTW) emissions associated with the fuel cycle, including power generation and transmission and distribution losses for BEVs, and liquid fossil fuel production, refining and transport and tail pipe emissions for ICEs.
3. Avoided GHG emissions
Avoided WTW emissions is largely dependent on the carbon intensity of a region’s power grid
9
48% 63% 65% 44%
China North America Europe Rest of the world
Well-to-wheel GHG emissions avoided by BEVs compared to equivalent ICE vehicle* by region, 2018
*The figures indicate the WTW GHG emissions saved through the substitution of an ICE vehicle with a BEV of equivalent size. The carbon intensity of the national power systems account for transmission
and distribution losses.
Source: IEA, 2019: Global EV Outlook 2019.
The avoided emissions from BEVs compared to ICEs will likely increase in the future, as countries increase the share of renewables to their power generation mix.

In addition to WTW emissions, lifecycle GHG emissions include those related to the vehicle and battery manufacturing (including materials extraction and processing) as well as end of life disposal and recycling of the vehicle. As shown below, when comparing global average mid-sized cars, BEVs result in 33% lower lifecycle GHG emissions than ICE vehicles.
10
Comparison of lifecycle GHG emissions* of global average mid-sized cars, 2018
*Assumptions: global average electricity mix with an emissions factor of 518gCO2/kWh, the ICE vehicle operates on gasoline, the BEV assumed to have 200 km range, annual mileage of 15,000 km and 10 year vehicle lifetime. Source: IEA, 2019: Global EV Outlook 2019.
For a comparison of lifecycle GHG emissions of electric vehicles compared to ICEs in Europe, refer to Transport & Environment, 2020: How clean are electric cars?
-33%
3. Avoided GHG emissions
Lifecycle emissions are mostly dependent on the power grid, but battery manufacturing is also relevant

• Upfront investment costs for BEVs are typically higher than for ICEs of a similar size/level of equipment and features; although prices are expected to reach parity in coming years. Battery capacity and therefore BEV range is a key factor influencing upfront costs. As with all cars, there is also a range depending on make and model. The IEA found that purchasing a standard medium EV is approximately 40% more expensive than a conventional ICE vehicle of a similar size.1
• In many jurisdictions, tax credits or grants reduce the upfront cost of BEVs. E.g., the UK government provides a GBP £3,500 grant, while a federal tax credit of up to USD $7,500 applies in the US, with some states also providing rebates.
Investment costs
• Depreciation is typically the largest component of TCO. The residual value of BEVs is uncertain, and could vary as the market develops a better understanding of battery lifetimes, the possibility to lease batteries, and business models are developed for second life applications of car batteries.
• The business case for electric vehicles is heavily location specific. The following factors are important to consider:government tax credits and grants; local policies such as zero emissions zones and reduced registration costs for BEVs; price differential between electricity and gasoline or diesel; and policies to phase out ICEs.
• As the electricity cost per km is generally lower than the fuel cost per km, the utilization rate (i.e. the annual mileage) of company vehicles heavily influences the length of the payback period.
• The operating costs are also influenced by type of charging used: smart charging comes at a lower cost than fast charging, and V2G services could provide owners with a new revenue stream.
Sensitivity analysis
• The business case for BEVs compared to ICEs needs to consider the total cost of ownership (TCO) across the ownership length of a vehicle, including upfront investment costs, fuel or electricity costs, maintenance, taxes and depreciation (residual value).
• Apart from the upfront cost (or depreciation), the other components of the TCO typically favor BEVs: electricity cost per km is generally lower than the fuel cost per km, maintenance costs are lower for BEVs than ICEs due to less wear on the brakes and fewer moving parts and BEVs enjoy reduced vehicle taxes in some jurisdictions. Insurance costs are higher for BEVs than the equivalent ICE as they are proportional to the vehicle replacement cost.
Return on Investment (ROI)
4. Cost assessment and value proposition
11
Source: ¹ IEA, 2019: Global EV Outlook 2019..

12
4. Cost assessment and sensitivity analysis
BEV TCO lower than TCO for other vehicles in Japan, California, Texas and the UK
• A TCO analysis of Toyota Corolla (petrol), Ford Focus (petrol and diesel), Toyota Prius (hybrid), Toyota Prius (plug-in hybrid) and Nissan Leaf (BEV) in Japan, California, Texas and the UK found that the BEV has the lowest TCO across all regions.
• All of these regions have subsidies for BEVs which helps their cost competitiveness.
• Key assumptions:
- TCO evaluated over 3 years, in line with average new vehicle ownership length in the UK. The same depreciation rate (used to calculate residual value) of 18.5% is assumed across all vehicle types.
- Region specific mileages: 6231 miles/year in Japan, 10,400 miles in the UK, 11,071 miles in California and 15,641 miles in Texas.
- Region specific vehicle costs (including subsidies), tax, and fuel costs.
TCO of different vehicle types in Japan, California, Texas and the UK
Source: Palmer et al., 2018: Total cost of ownership and market share for hybrid and electric vehicles in the UK, US and Japan.

13
4. Cost assessment and sensitivity analysis
TCO comparison for different car sizes and fuel prices
Source: IEA, 2018: Global EV Outlook 2018.
• A TCO analysis of different car sizes at different gasoline prices and different battery price levels shows:
- The TCO gap between BEVs and ICEs is smaller for vehicles with high annual mileage
- BEVs are more competitive with ICEs when gasoline price is high
Note: current battery cost US$155-360/kWh; large battery size equivalent to size expected to be used around 2030.
TCO gap between BEVs and ICEs with gasoline price of US$1.5/l
TCO gap between BEVs and ICEs with gasoline price of US$0.8/l
• Key assumptions: TCO over 3.5 years, annual depreciation rate increases with higher annual mileage, annual maintenance costs of BEVs are 20% of maintenance cost of ICEs, and electricity price of US$0.12/kWh + US$0.04/kWh charging price.
• As the charging price applies when charging is done at a public station, but not when charging at home or a workplace, the TCO could be even lower if the use case does not require charging at public stations.

14
4. Cost assessment and sensitivity analysis
Charging infrastructure
• Depending on the use case, some companies may need to invest in charging infrastructure and grid connection upgrades.
• The total deployment cost per charging point is estimated to range from €5K - 15K for Type 2 chargers, and €20K-40K for DCFC.*
• Grid connection upgrades may be needed depending on the charging energy demand (determined by number and type of chargers installed) from the company and the available capacity at the location where the chargers will be installed. Where capacity is insufficient, the distribution network operator (DNO) will need to upgrade electrical infrastructure.
• Behind-the-meter storage could facilitate the integration of an EV charger, and avoid or defer the grid upgrade cost and optimize the return-on-investment.
*Deployment cost includes charger purchase and installation costs (labor, additional materials, permitting) and exclude DNO costs. Source: Navigant Research. Source: ¹ UK EVSE Association, 2019: General procurement guidance for electric vehicle charging points.
Energy demand Up to 70kVA 200 kVA – 1,000 kVA Above 1,000 kVA
Example number of charge points
1-3 Level 2 or 1 DCFC 10-50 Level 2, 4-20 DCFC >50 Level 2 or >20 DCFC
Approximate connection cost €1,000 – €4,000 €5,000 – €89,000 €70,000 – €2.4 million
Considerations affecting cost • Street work costs • Street work costs• Legal costs
• Street work costs• Legal costs• Planning permission• Space for a substation
Illustrative example of DNO costs for grid connection upgrades¹
15
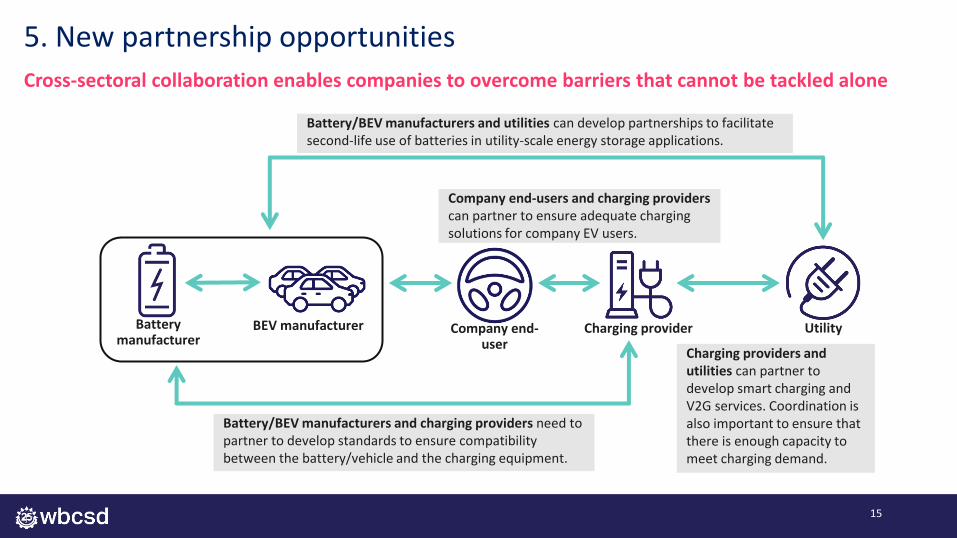
Battery manufacturer
BEV manufacturer Charging provider Utility
Battery/BEV manufacturers and charging providers need to partner to develop standards to ensure compatibility between the battery/vehicle and the charging equipment.
Company end-user
Charging providers and utilities can partner to develop smart charging and V2G services. Coordination is also important to ensure that there is enough capacity to meet charging demand.
Battery/BEV manufacturers and utilities can develop partnerships to facilitate second-life use of batteries in utility-scale energy storage applications.
Company end-users and charging providers can partner to ensure adequate charging solutions for company EV users.
5. New partnership opportunities
Cross-sectoral collaboration enables companies to overcome barriers that cannot be tackled alone

6. Battery electric vehicles SWOT analysisStrengths Opportunities
Weaknesses Threats
• Environmental benefits including no emissions (CO2 and air pollution) at point of use and reduced noise pollution
• TCO already competitive with ICEs in some cases due to lower fuel and maintenance costs.
• BEVs are typically IoT (internet of things)-enabled devices, making them compatible with a future smart city infrastructure.
• Can improve driver satisfaction due to ease of one-pedal driving and reduced noise.
• Can provides companies with positive reputation and brand benefits
• Upfront cost price parity of BEVs and ICEs expected to be achieved in coming years. The development of cobalt-free batteries could further reduce cost and reduce supply chain human rights risks.
• The end-of-life value of a BEV may be higher than that of ICEs due to the development of business models for the second life of batteries, e.g. in electricity storage
• Development of V2G technologies will enable BEVs to provide flexibility services to stabilize the electricity grid and provide BEV owners with an additional income stream.
• Regulations increasingly ban polluting vehicles in cities and provide incentives for zero emissions vehicles.
• Currently, higher upfront cost than equivalent ICEs. Some organizations do not make capex decisions based on TCO.
• Public charging infrastructure still to be developed in many areas. Co-existence of different recharging standards means consideration of interoperable public charging points are vital.
• Customer perception of the limited driving range of BEVs and charging times longer compared to ICEs.
• Uncertainty on ability to scale up the sustainable supply chain for materials needed to manufacture batteries, e.g. due to substantial human rights risks related to the scale up of cobalt production.
• Capacity to recycle batteries at end-of-life (e.g. after second life application) is currently limited.
• Transmission and distribution grids may need to be upgraded to meet increasing electricity demand from BEVs.
16

High annual mileage
High annual utilization, but daily maximum use below
250km for economic viability.
7. Success factors
17
Finance options
Business models offering battery leasing and
operating leases could help companies overcome the barrier of higher upfront
costs of BEVs.
Electricity vs gasoline/diesel price
The business case is strengthened when the price of electricity is relatively low
compared to the price of gasoline/diesel
Policies
Policies providing financial incentives e.g. economy-wide carbon pricing, vehicle purchase subsidies, and incentives for the development of charging infrastructure. Increasingly stringent vehicle emissions standards could be implemented. Cities can also apply vehicle circulation restrictions based on emissions standards. Policies supporting development of sustainable supply
chains for materials also needed for scale up.
Suitable range and availability of charging infrastructure
The most successful use cases for BEVs are those where the daily distance travelled is
within the range of the BEV on a single-charge, or when BEVs are used in areas where there is adequate, conveniently
located charging infrastructure.
Strategies to manage end of life of batteries
Including the reuse of batteries in other
applications, e.g. energy storage; and recycling of
batteries.
Implementation roadmap
Companies can use WBCSD’s EV Adoption
Guide to develop a roadmap to electrify the
vehicle fleet.

18
8. Battery electric vehicles: Case studies
Click here for more information

19
9. Summary• Light duty vehicles (LDVs) such as passenger cars and vans are responsible for 51% of CO2 emissions from the transport sector (4.8
GtCO2 on a well-to-wheel, or WTW, basis).• WTW CO2 emissions from light duty vehicles are expected to grow by 14% in the period from 2014 to 2050.• LDVs are also a major source of air pollution in cities.
Emissions and energy
• The avoided emissions from BEVs compared to conventional internal combustion engine (ICE) vehicles are largely dependent on the carbon intensity of a region’s electricity grid. On a WTW basis, the emissions reductions from a BEV compared to an equivalent ICE are on average: 65% in Europe, 63% in North America and 48% in China.
• BEVs also have lower repair and maintenance costs, and can offer flexibility services to help stabilize the electricity grid.• BEVs are not impacted by emissions regulations in cities.
Avoided GHG emissions and co-
benefits
• BEVs and charging infrastructure are established technologies. • Most major car manufacturers have already launched or are developing BEVs.
Readiness status
• The electrification of LDVs is important to reducing the environmental impacts of the transport sector.• Battery electric vehicles (BEVs) are vehicles with a fully electric drivetrain powered by electricity stored in a rechargeable battery.
Solution
• BEVs have higher upfront costs compared to ICEs. On a total cost of ownership basis, BEVs are already competitive with ICEs in some instances; however, many organizations do not make capital expenditure decisions based on total cost of ownership.
• Insufficient public charging infrastructure in many areas.Barriers
• The adoption of policies such as vehicle purchase subsidies, vehicle emissions standards and carbon pricing to strengthen thebusiness case.
• Business models offering battery leasing and operating leases to help companies overcome the barrier of higher upfront costs of BEVs.
Success factors
20
10. Key sources and references on battery electric vehicles
WBCSD guide for corporate electric vehicle (EV) fleet adoption
• The guide for corporate electric vehicle (EV) fleet adoption is the first comprehensive guide for corporate electric vehicle (EV) fleet adoption.
• This guide provides valuable information for corporate fleet managers, company strategists, procurement officers and sustainability managers in general and is designed to provide companies with:
- The most up-to-date and geographically relevant information resources on EV technologies.
- The clear steps to take in planning and adopting an EV fleet.- An overview of best practices and learnings provided by
companies who have already undergone their fleet transitions.
• Visit the guide for corporate electric vehicle (EV) fleet adoption to learn how to make the transition.

• International Energy Agency, 2018: Global EV Outlook 2018
• International Energy Agency, 2019: Global EV Outlook 2019
• International Energy Agency, 2017: Energy Technology Perspectives
• Palmer et al., 2018: Total cost of ownership and market share for hybrid and electric vehicles in the UK, US and Japan
• UK EVSE Association, 2019: General procurement guidance for electric vehicle charging points
• Transport & Environment, 2020: How clean are electric cars?
• WBCSD, 2020: Guide for corporate electric vehicle (EV) fleet adoption
10. Key sources and references on battery electric vehicles
21

WBCSD (Geneva)Maison de la Paix l CheminEugène-Rigot 2BCP 2075 1211 Geneva 1Switzerland
WBCSD (New York)747 Third Avenue Suite M205, New YorkNY 10017, United StatesUSA
WBCSD (Delhi)WBCSD India, 4th Floor, Worldmark 2,Aerocity New Delhi 110 037India
WBCSD (Singapore)WBCSD Asia Pacific2 Science Park Drive#01-03 AscentSingapore 118222Singapore
WBCSD (London)WeWork Mansion House33 Queen StreetLondon EC4R 1BRUK
22