BASICS OF EPIDEMIC MODELLING Kari Auranen Department of Vaccines National Public Health Institute...
33
BASICS OF EPIDEMIC MODELLING Kari Auranen Department of Vaccines National Public Health Institute (KTL), Finland Division of Biometry, Dpt. of Mathematics and Statistics University of Helsinki, Finland
-
Upload
magnus-stone -
Category
Documents
-
view
215 -
download
0
Transcript of BASICS OF EPIDEMIC MODELLING Kari Auranen Department of Vaccines National Public Health Institute...

BASICS OF EPIDEMIC MODELLING
Kari AuranenDepartment of VaccinesNational Public Health Institute (KTL), Finland
Division of Biometry, Dpt. of Mathematics and StatisticsUniversity of Helsinki, Finland

Outline
• A simple epidemic model to exemplify – dynamics of transmission– epidemic threshold– herd immunity threshold– basic reproduction number– the effect of vaccination on epidemic cycles – mass action principle
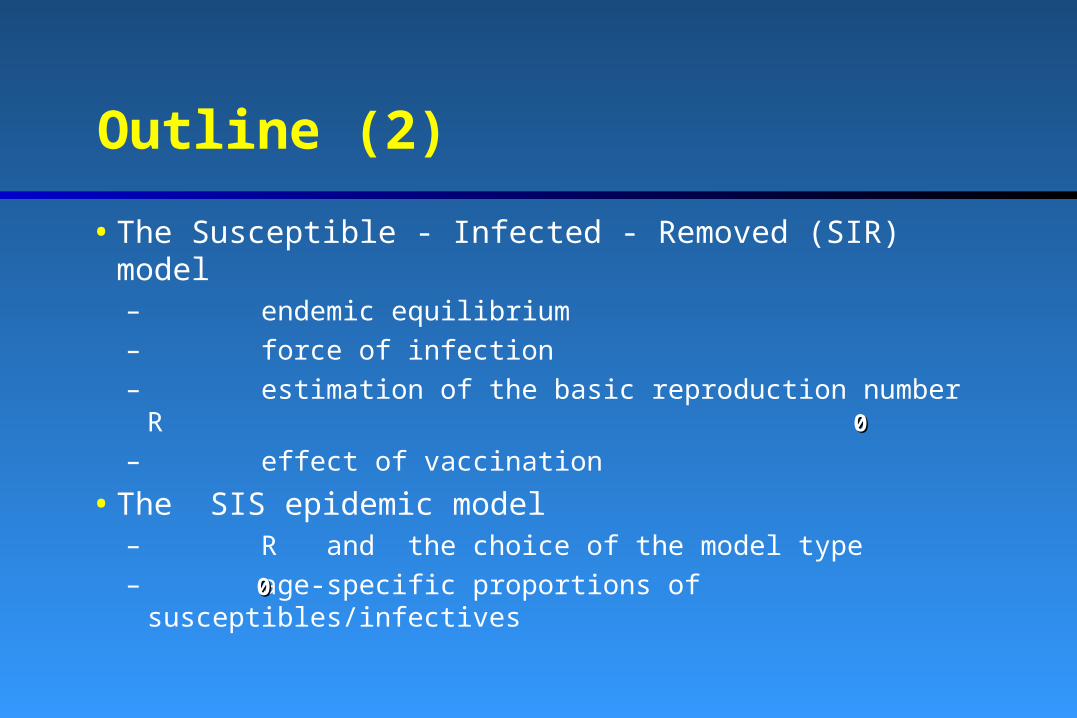
Outline (2)
• The Susceptible - Infected - Removed (SIR) model– endemic equilibrium– force of infection– estimation of the basic reproduction number R– effect of vaccination
• The SIS epidemic model– R and the choice of the model type– age-specific proportions of susceptibles/infectives
00
00

A simple epidemic model (Hamer, 1906)
• Consider an infection that– involves three states/compartments of infection:
– proceeds in discrete generations (of infection)– is transmitted in a homogeneously mixing population of
size N
SSusceptibleusceptible CCasease ImmuneImmune
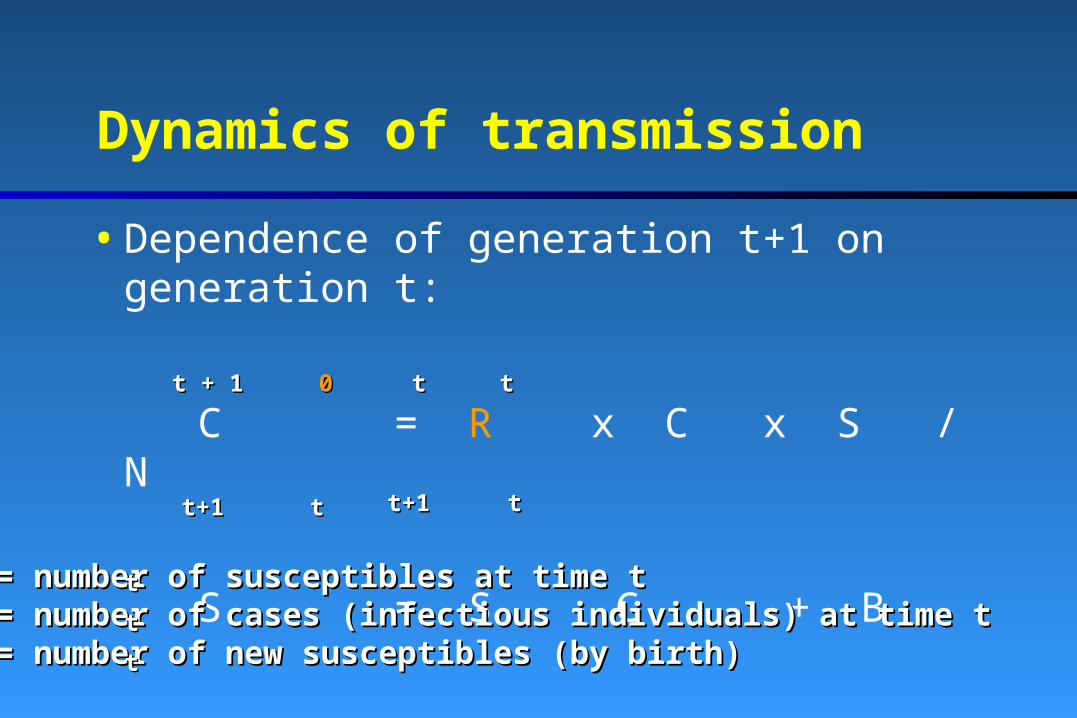
Dynamics of transmission
• Dependence of generation t+1 on generation t:
C = R x C x S / N
S = S - C + B
t + 1t + 1 00 tt tt
t+1t+1 tt t+1t+1 tt
S = number of susceptibles at time tS = number of susceptibles at time tC = number of cases (infectious individuals) at time tC = number of cases (infectious individuals) at time tB = number of new susceptibles (by birth)B = number of new susceptibles (by birth)
tt
tt
tt

Dynamics of transmission
Dynamics (Ro = 10; N = 10,000; B = 300)
0
200
400
600
800
1000
1200
1400
time period
nu
mb
ers
of
ind
ivid
ual
s
susceptibles
cases
epidemicthreshold
Epidemic threshold : S = N/REpidemic threshold : S = N/Ree 00

Epidemic threshold S
S - S = - C + B
• the number of susceptibles increases when C < B decreases when C > B• the number of susceptibles cycles around the
epidemic threshold S = N / R• this pattern is sustained as long as transmission is
possible
ee
t+1t+1 tt t+1t+1 tt
t+1t+1
t+1t+1
tt
tt
ee 00

Epidemic threshold
C / C = R x S / N = S / S
• the number of cases increases when S > S decreases when S < S
• the number of cases cycles around B (influx of new susceptibles)
t+1t+1 tt 00 tt tt ee
ee
ee
tt
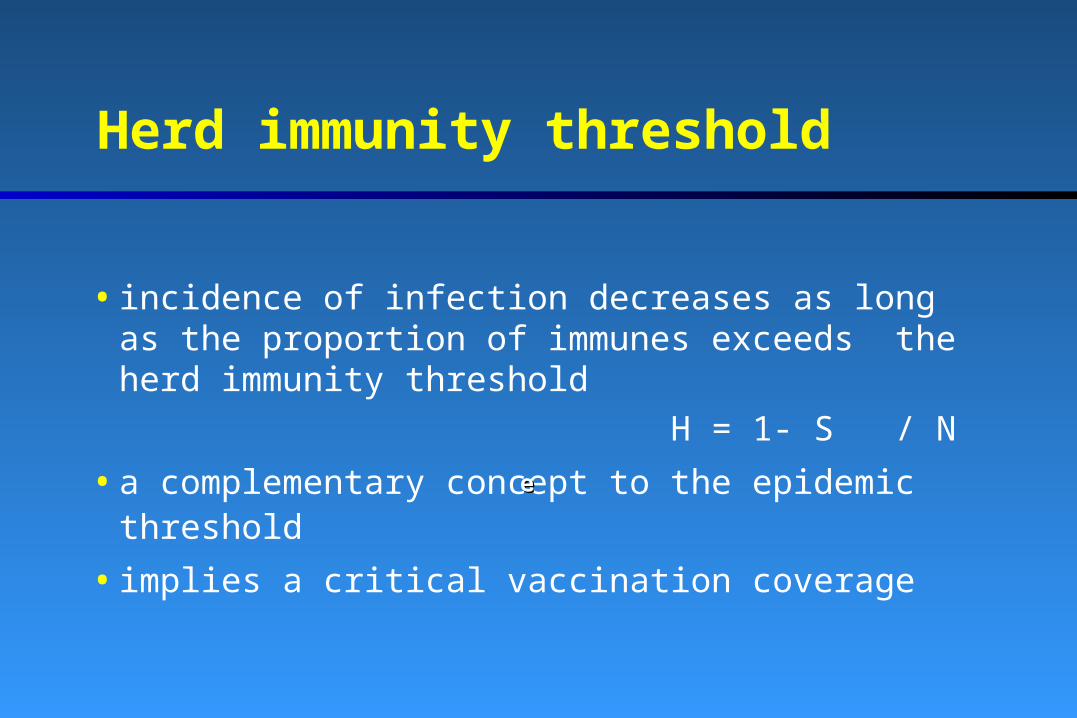
Herd immunity threshold
• incidence of infection decreases as long as the proportion of immunes exceeds the herd immunity threshold
H = 1- S / N
• a complementary concept to the epidemic threshold
• implies a critical vaccination coverage
ee

Basic reproduction number (R )
• the average number of secondary cases that an infected individual produces in a totally susceptible population during his/her infectious period
• in the Hamer model : R = R x 1 x N / N = R• herd immunity threshold H = 1 - 1 / R
• in the endemic equilibrium: S = N / R , i.e.,
00
0000
00
00ee
ee 00
00
R x S / N = 1R x S / N = 100 ee

Basic reproduction number (2)
R = 3R = 300
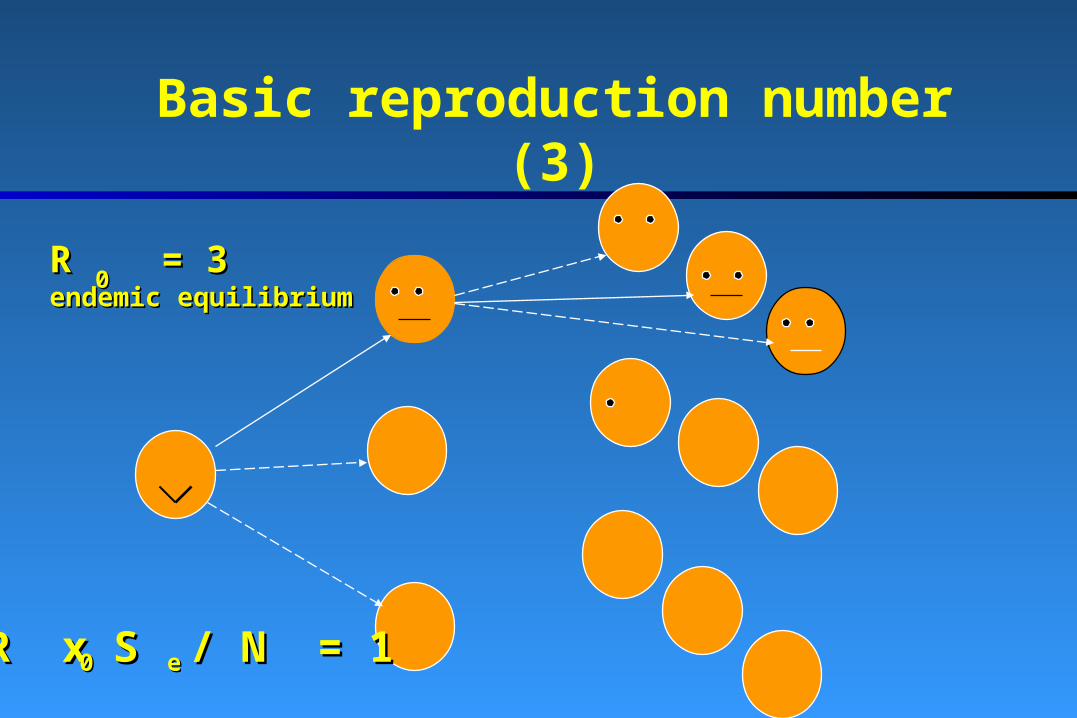
Basic reproduction number (3)
R = 3R = 3endemic equilibriumendemic equilibrium
00
R x S / N = 1R x S / N = 100 ee

Herd immunity threshold and R
0
0,1
0,2
0,3
0,4
0,5
0,6
0,7
0,8
herd immunity
threshold H
0 1 2 3 4 5
Ro
= 1-1/RHH 00
00
(Assumes homogeneous mixing)(Assumes homogeneous mixing)
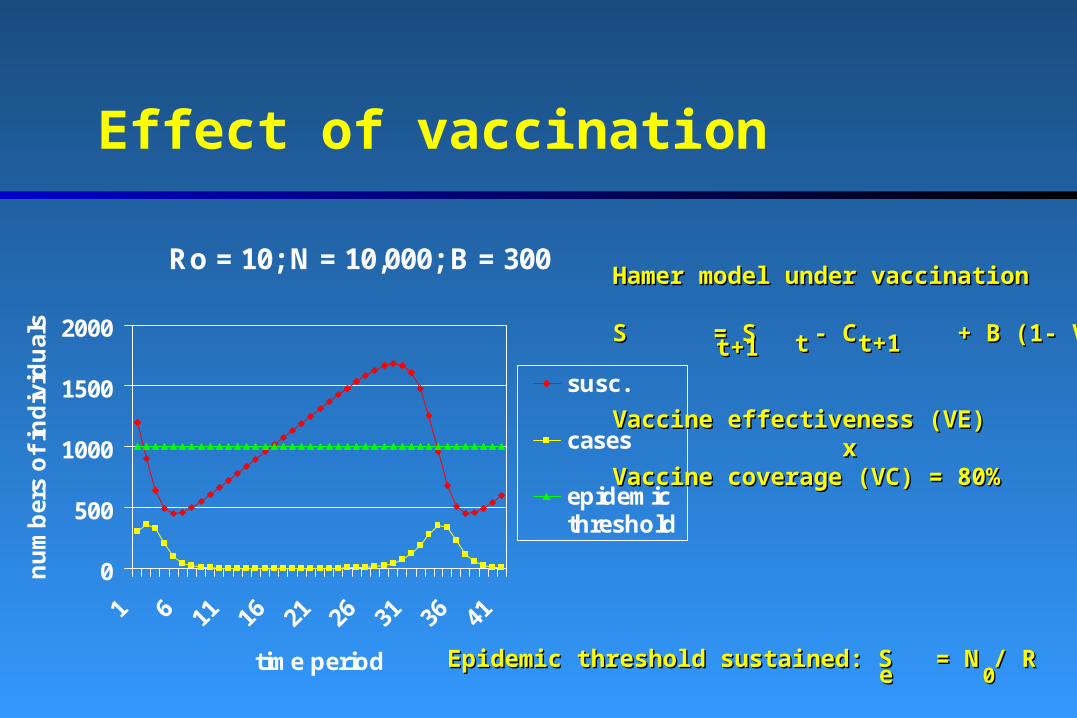
Effect of vaccination
Ro = 10; N = 10,000; B = 300
0
500
1000
1500
2000
time period
nu
mb
ers
of
ind
ivid
ual
s
susc.
cases
epidemicthreshold
Hamer model under vaccinationHamer model under vaccination
S = S - C + B (1- VCxVE)S = S - C + B (1- VCxVE)
Vaccine effectiveness (VE)Vaccine effectiveness (VE) xxVaccine coverage (VC) = 80%Vaccine coverage (VC) = 80%
t+1t+1 tt t+1t+1
Epidemic threshold sustained: S = N / R Epidemic threshold sustained: S = N / R ee 00

Mass action principle
• all epidemic/transmission models are variations of the use of the mass action principle which– captures the effect of contacts between individuals– uses the analogy to modelling the rate of chemical reactions – is responsible for indirect effects of vaccination– assumes homogenous mixing
• in the whole population• in appropriate subpopulations
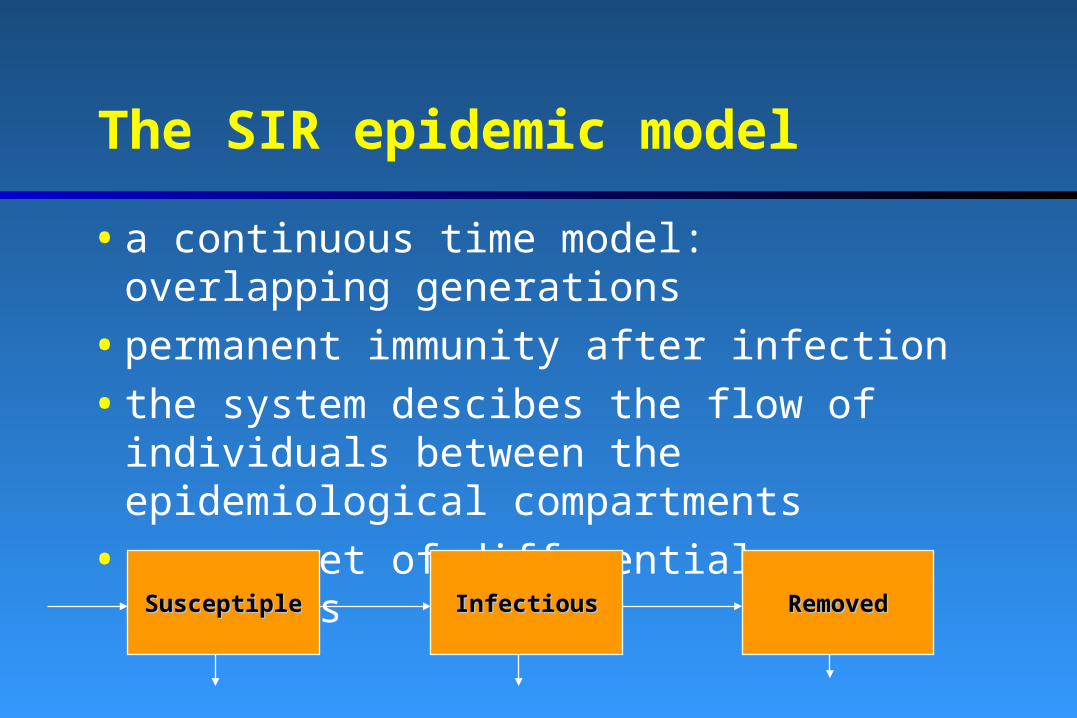
The SIR epidemic model
• a continuous time model: overlapping generations• permanent immunity after infection• the system descibes the flow of individuals between the
epidemiological compartments • uses a set of differential equations
SusceptipleSusceptiple RemovedRemovedInfectiousInfectious
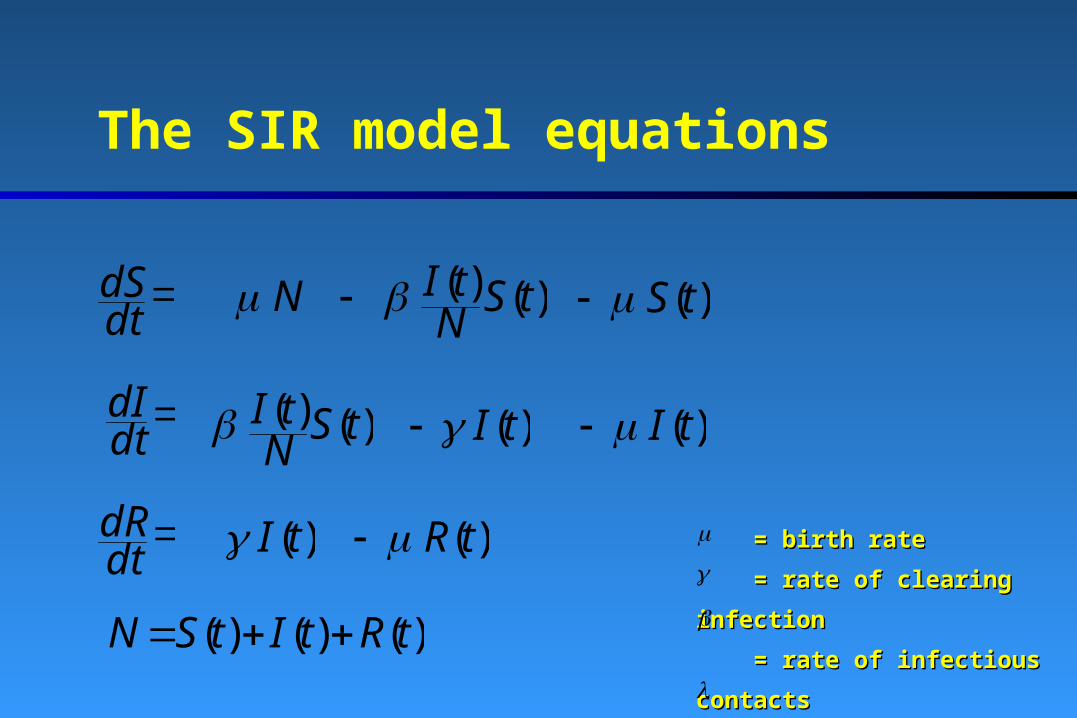
The SIR model equations
dtdI )()( tS
NtI )(tI )(tI
dtdS N )()( tS
NtI )(tS
dtdR )(tI )(tR
)()()( tRtItSN
= birth rate= birth rate
= rate of clearing infection= rate of clearing infection
= rate of infectious contacts= rate of infectious contacts
by one individual by one individual
= force of infection= force of infection
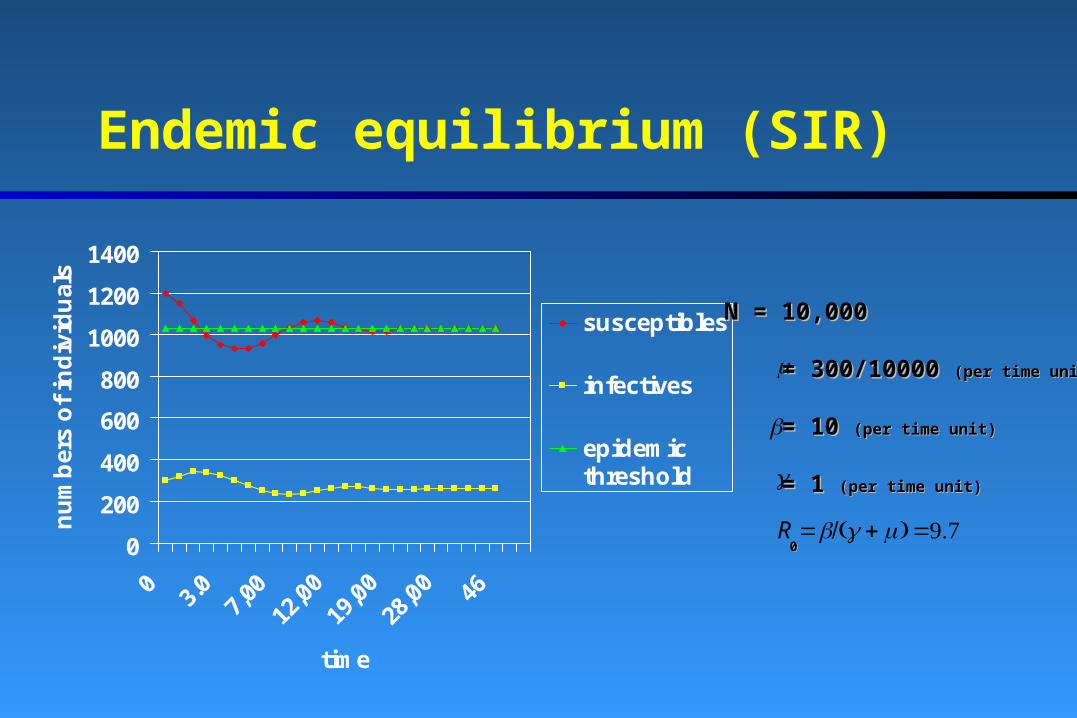
Endemic equilibrium (SIR)
0
200
400
600
800
1000
1200
1400
03.
07,
0012
,00
19,0
028
,00 46
time
nu
mb
ers
of
ind
ivid
ual
s
susceptibles
infectives
epidemicthreshold
N = 10,000N = 10,000
= 300/10000 = 300/10000 (per time unit)(per time unit)
= 10 = 10 (per time unit)(per time unit)
= 1 = 1 (per time unit)(per time unit)
R00

The basic reproduction number (SIR)
• Under the SIR model, Ro given by the ratio of two rates:
R = = rate of infectious contacts x
mean duration of infection
• R not directly observable• need to derive relations to observable quantities
00
00
)
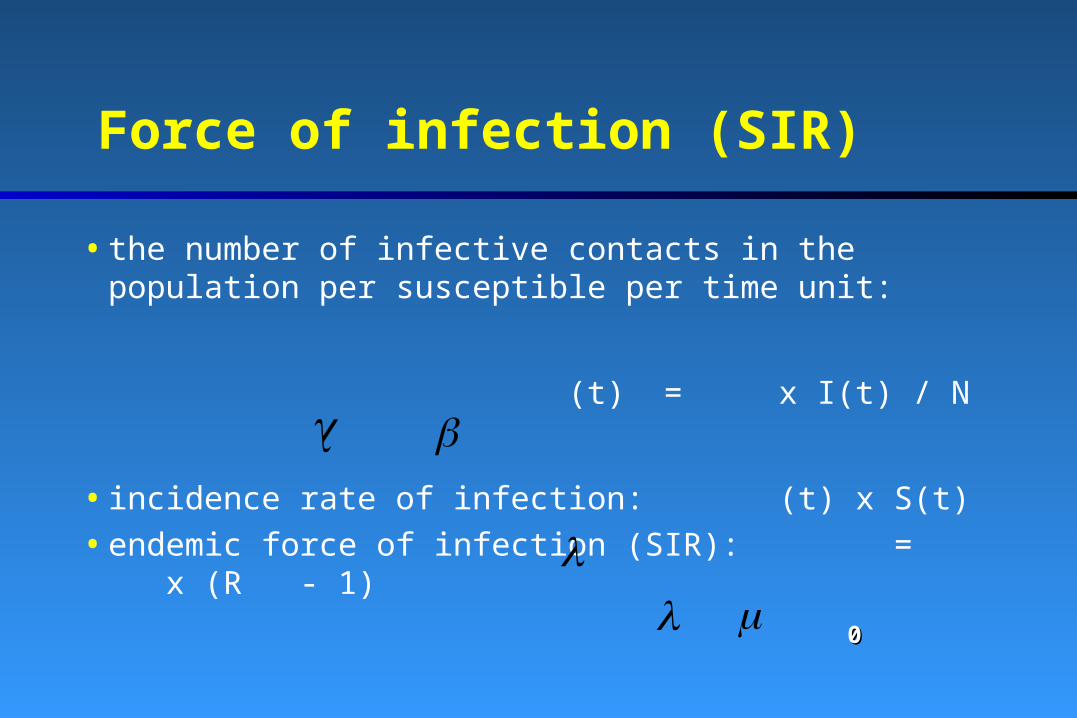
Force of infection (SIR)
• the number of infective contacts in the population per susceptible per time unit:
(t) = x I(t) / N
• incidence rate of infection: (t) x S(t) • endemic force of infection (SIR): = x (R - 1)
00
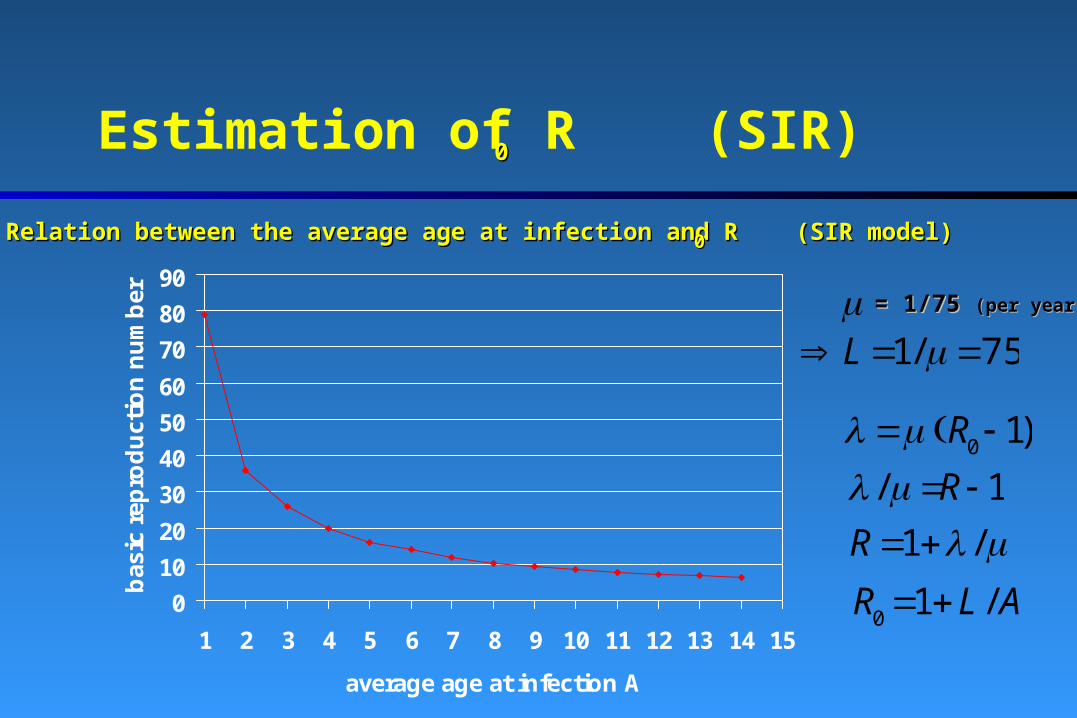
Estimation of R (SIR)
0
10
20
30
40
50
60
70
80
90
1 2 3 4 5 6 7 8 9 10 11 12 13 14 15
average age at infection A
bas
ic r
epro
du
ctio
n n
um
ber
Relation between the average age at infection and R (SIR model)Relation between the average age at infection and R (SIR model)
= 1/75 = 1/75 (per year)(per year)
)10 R
ALR /10
1/ R /1R
00
00
75/1 L

A simple alternative formula
• Assume everyone is infected at age A everyone dies at age L (rectangular age distribution)
ImmunesImmunes
AA LL
Age (years)Age (years)
SusceptiblesSusceptibles100 %100 %
Proportion of susceptibles:Proportion of susceptibles: S / N = A / LS / N = A / L
R = N / S = L / AR = N / S = L / A
ee
00 ee
ProportionProportion

Estimation of and Ro from seroprevalence data
0
10
20
30
40
5060
70
80
90
100
1 5 10 15 20 25 30
age a (years)
proportion with rubella antibodies
observed [8]
model prediction
1) Assume equilibrium 1) Assume equilibrium
2) Parameterise force of infection 2) Parameterise force of infection
3) Estimate3) Estimate
4) Calculate Ro4) Calculate Ro
Ex. constant Ex. constant Proportion not yet infected: Proportion not yet infected: 1 - exp(- a) ,1 - exp(- a) , estimate = 0.1 per year gives estimate = 0.1 per year gives reasonable fit to the datareasonable fit to the data
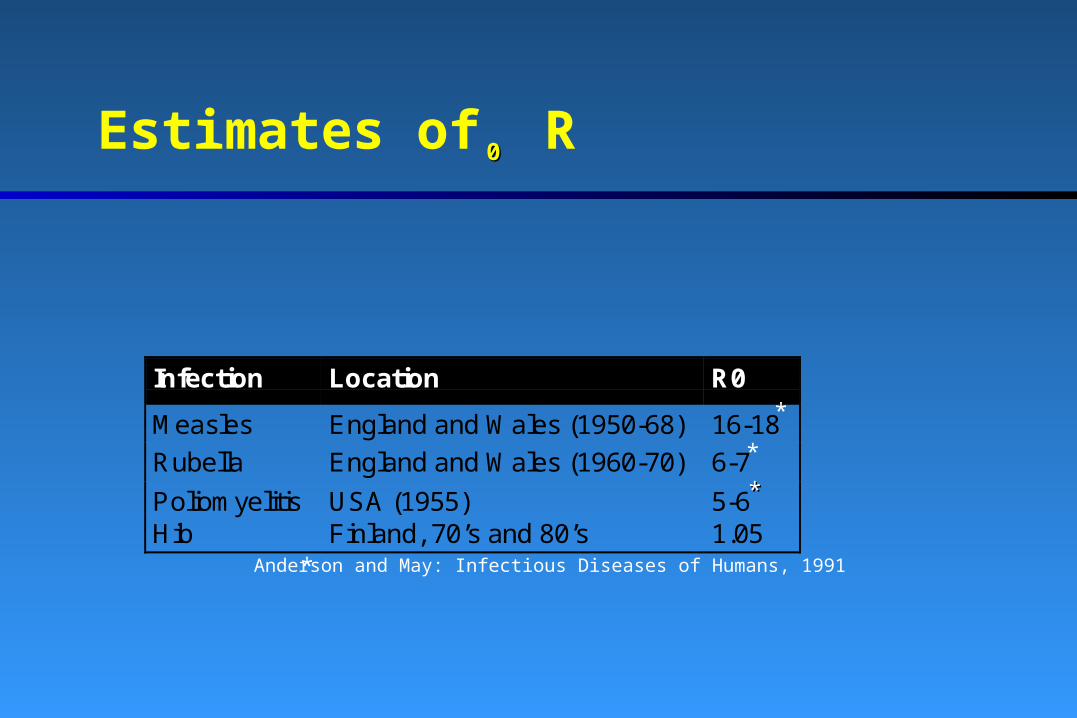
Estimates of R
Infection Location R0
Measles England and Wales (1950-68) 16-18
Rubella England and Wales (1960-70) 6-7
Poliomyelitis USA (1955) 5-6Hib Finland, 70’s and 80’s 1.05
Anderson and May: Infectious Diseases of Humans, 1991*
*
*
**
00
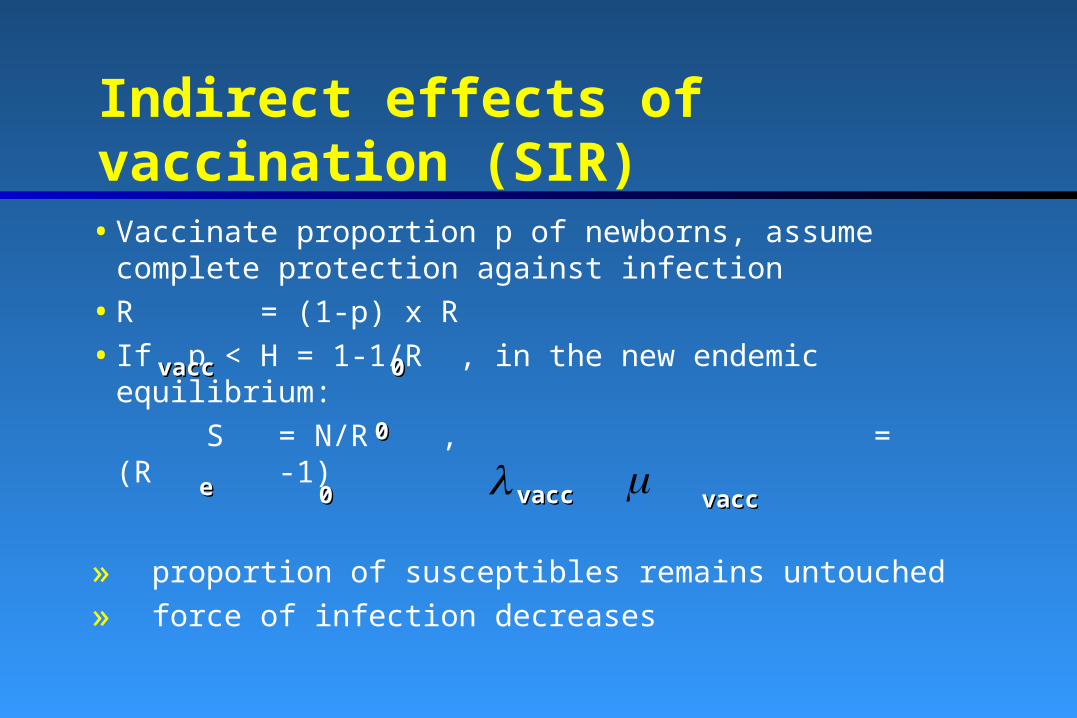
Indirect effects of vaccination (SIR)
• Vaccinate proportion p of newborns, assume complete protection against infection
• R = (1-p) x R• If p < H = 1-1/R , in the new endemic equilibrium: S = N/R , = (R -1)
» proportion of susceptibles remains untouched» force of infection decreases
vaccvacc 00
00
ee 00 vaccvacc
vaccvacc

Effect of vaccination on average age A’ at infection (SIR)
• Life length L; proportion p vaccinated at birth, complete protection • every susceptible infected at age A
SusceptiblesSusceptibles
AA LL
pp
Age (years)Age (years)
11
S / N = (1-p) A’/L S / N = (1-p) A’/L
S / N = A/ LS / N = A/ L
=> A’ = A/(1-p) => A’ = A/(1-p)
i.e., increase in thei.e., increase in the average age of average age of infectioninfection
ProportionProportion
’’
ee
ee
ImmunesImmunes
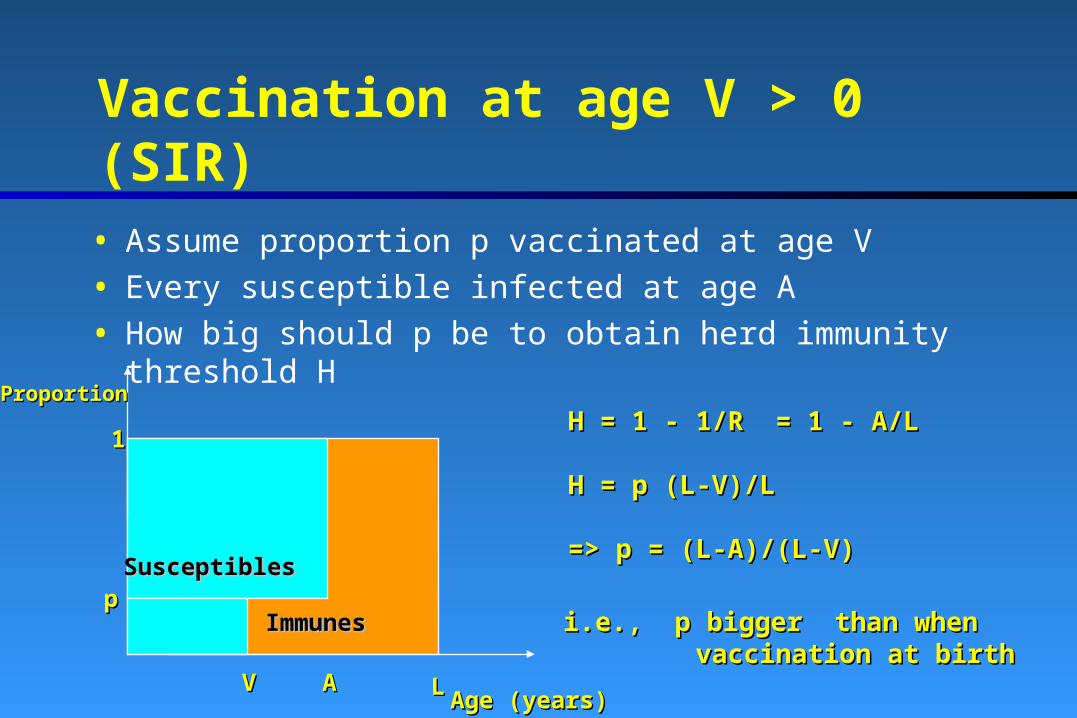
Vaccination at age V > 0 (SIR)
• Assume proportion p vaccinated at age V• Every susceptible infected at age A• How big should p be to obtain herd immunity threshold H
Age (years)Age (years)
ProportionProportion
11
pp
VV LL
H = 1 - 1/R = 1 - A/L H = 1 - 1/R = 1 - A/L
H = p (L-V)/L H = p (L-V)/L
=> p = (L-A)/(L-V) => p = (L-A)/(L-V)
i.e., p bigger than when i.e., p bigger than when vaccination at birth vaccination at birth
ImmunesImmunes
SusceptiblesSusceptibles
AA
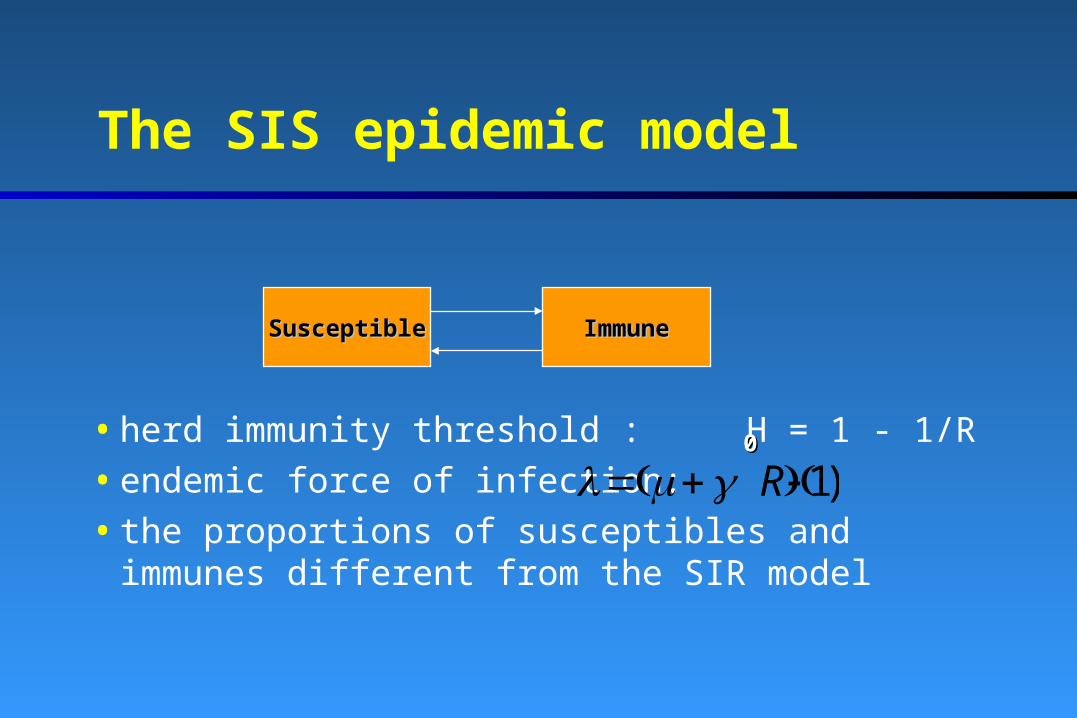
The SIS epidemic model
• herd immunity threshold : H = 1 - 1/R• endemic force of infection: • the proportions of susceptibles and immunes different
from the SIR model
SusceptibleSusceptible ImmuneImmune
00
)1 R
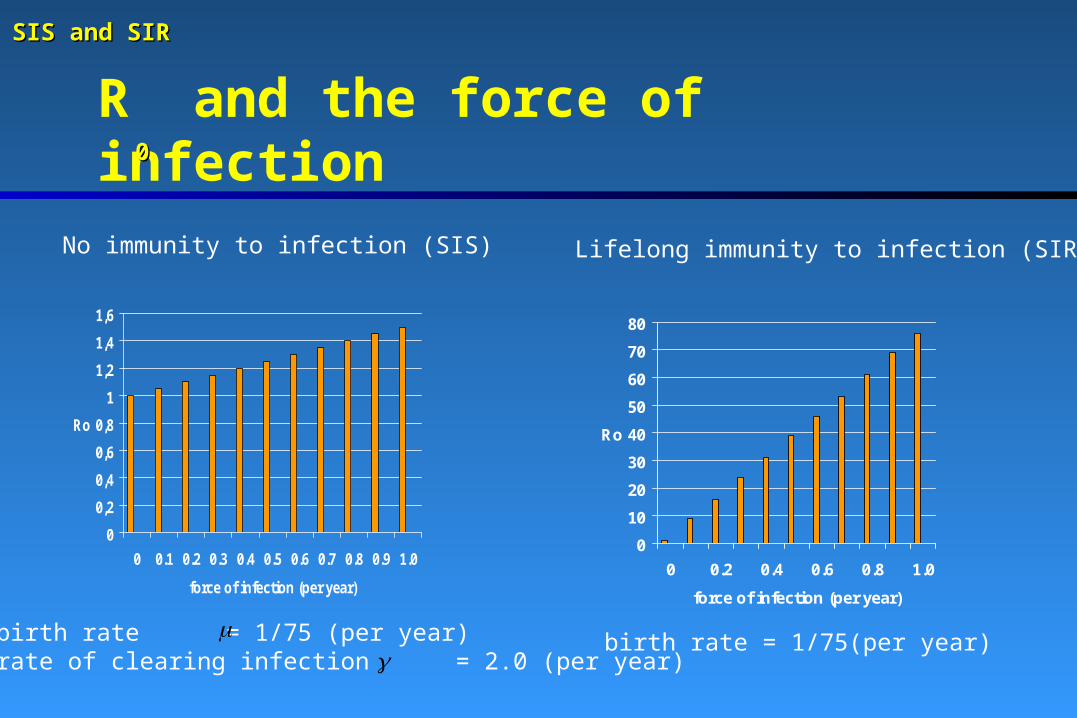
R and the force of infection
0
10
20
30
40
50
60
70
80
0 0.2 0.4 0.6 0.8 1.0
force of infection (per year)
Ro
0
0,2
0,4
0,6
0,8
1
1,2
1,4
1,6
0 0.1 0.2 0.3 0.4 0.5 0.6 0.7 0.8 0.9 1.0
force of infection (per year)
Ro
birth rate = 1/75 (per year)rate of clearing infection = 2.0 (per year)
birth rate = 1/75(per year)
No immunity to infection (SIS) Lifelong immunity to infection (SIR)
00
SIS and SIRSIS and SIR
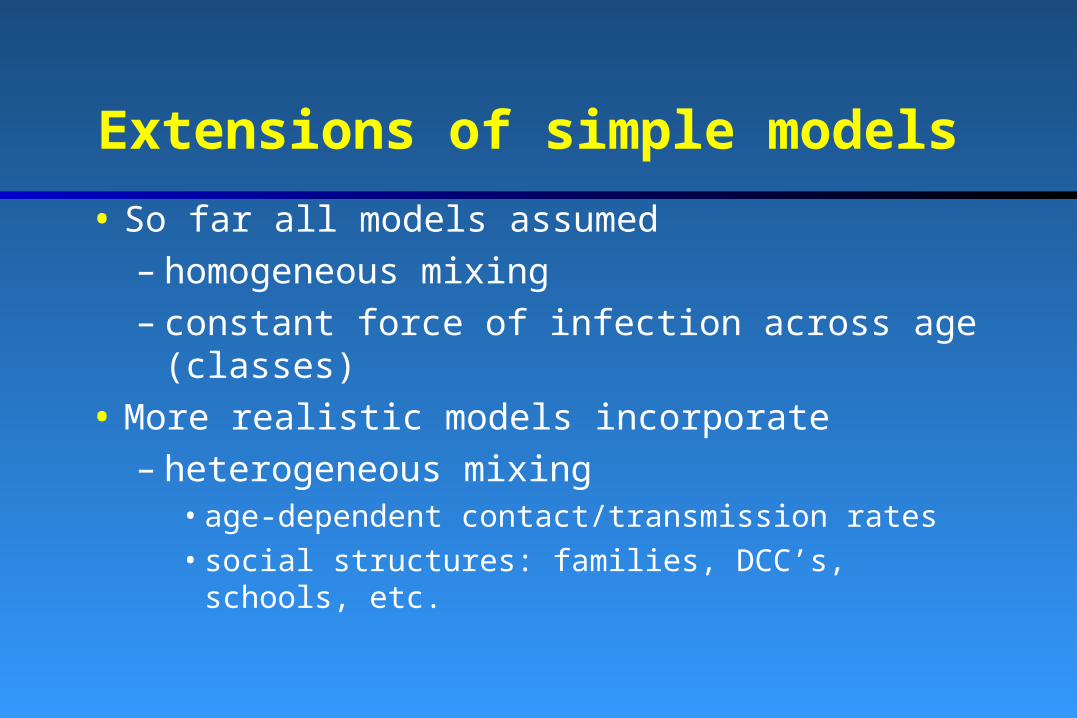
Extensions of simple models
• So far all models assumed– homogeneous mixing– constant force of infection across age (classes)
• More realistic models incorporate– heterogeneous mixing
• age-dependent contact/transmission rates• social structures: families, DCC’s, schools, etc.

Extensions of simple models (2)
– seasonal patterns in risks of infection– latency, maternal immunity etc.– different vaccination strategies– different models for vaccine effectiveness
• Stochastic models to– model chance phenomena– time to eradication– apply statistical techniques
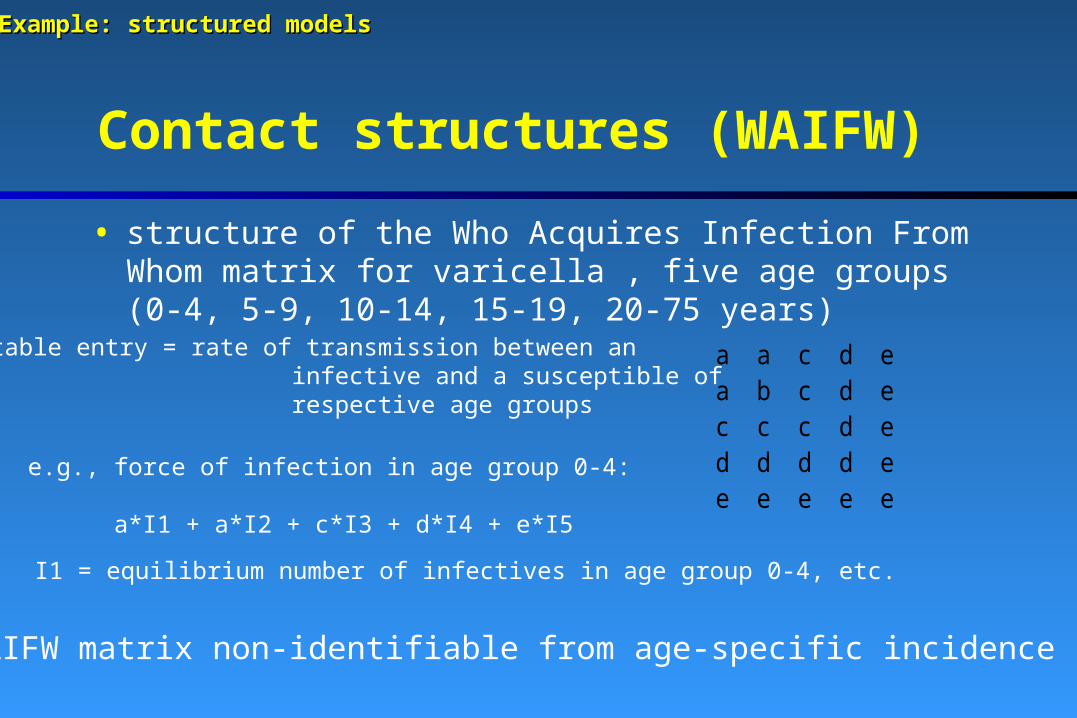
Contact structures (WAIFW)
• structure of the Who Acquires Infection From Whom matrix for varicella , five age groups (0-4, 5-9, 10-14, 15-19, 20-75 years)
a a c d ea b c d ec c c d ed d d d ee e e e e
table entry = rate of transmission between an infective and a susceptible of respective age groups
e.g., force of infection in age group 0-4: a*I1 + a*I2 + c*I3 + d*I4 + e*I5
I1 = equilibrium number of infectives in age group 0-4, etc.
• WAIFW matrix non-identifiable from age-specific incidence !
Example: structured modelsExample: structured models

References
1 Fine P.E.M, "Herd immunity: History, Theory, Practice", Epidemiologic Reviews, 15, 265-302,1993
2 Fine P.E.M., "The contribution of modelling to vaccination policy, Vaccination and World Health, Eds. F.T. Cutts and P.G. Smith, Wiley and Sons, 1994.
3 Haber M., "Estimation of the direct and indirect effects of vaccination", Statistics in Medicine, 18, 2101-2109, 1999
4 Halloran M.E., Cochi S., Lieu T.A., Wharton M., Fehrs L., "Theoretical epidemologic and mordibity effects of routine varicella immunization of preschool children in the U.S.", AJE, 140, 81-104, 1994
5 Levy-Bruhl D., lecture notes in the EPIET course, Helsinki, 1998.
6 Nokes D.J., Anderson R.M., "The use of mathematical models in the epidemiological study of infectious diseases and in the desing of mass immunization programmes", Epidemiology and Infection, 101, 1-20, 1988
7 Lipsitch M., "Vaccination against colonizing bacteria with multiple serotypes", Population Biology, 94, 6571-6576, 1997
8 Anderson R.M. and May R.M., ”Infectious Diseases of Humans”; Oxford University Press, 1992.