Basic Information Document Nigeria General Household...
37
Federal Republic of Nigeria National Bureau of Statistics Basic Information Document Nigeria General Household Survey –Panel March 2012
Transcript of Basic Information Document Nigeria General Household...

Federal Republic of Nigeria National Bureau of Statistics
Basic Information Document
Nigeria
General Household Survey –Panel
March 2012
ACRONYMS
BMGF Bill and Melinda Gates Foundation
CAPI Computer Assisted Personal Interviewing
EA Enumeration Area
FCT, Abuja Federal Capital Territory, Abuja
FMA&RD Federal Ministry of Agriculture and Rural Development
FMWR Federal Ministry of Water Resources
GHS General Household Survey
GHS-Panel General Household Survey-Panel (panel subcomponent of GHS)
GHS-Cross General Household Survey-Cross (annual cross section of GHS)
LGA Local Government Area
LSMS-ISA Living Standards Measurement Study – Integrated Surveys on Agriculture
MDA Ministries, Departments, Agencies
MSF Master Sample Frame
NASS National Agricultural Sample Survey
NBS National Bureau of Statistics
NFRA National Food Reserve Agency
NISH National Integrated Survey of Households
NHIS National Health Insurance Scheme
NPopC National Population Commission
PSU Primary Sampling Unit
SAE Small Area Estimation
WB World Bank
Table of Contents 1.0 Introduction .......................................................................................................................... 1
1.1 Expected Benefits ................................................................................................................. 2
1.2 Innovations ....................................................................................................................... 3
1.3 Coverage and Scope ......................................................................................................... 3
2.0 The Survey Instruments ....................................................................................................... 4
3.0 Sample Design ................................................................................................................... 11
4.0 Training of Field Staff and Data Entry Operators for the Survey ........................................... 13
5. 0 Field Work ............................................................................................................................. 14
5.1 Organization of Fieldwork .................................................................................................. 14
5.2 Fieldwork Monitoring and Evaluation ................................................................................ 14
6.0 Data Management and Description of Datasets ................................................................. 15
6.1 Data Management ............................................................................................................... 15
6.11 Data Entry ..................................................................................................................... 15
6.12 Data Cleaning.................................................................................................................... 15
6.13 Data Cleaning Challenges ................................................................................................. 16
6.14 Weighting of Data ............................................................................................................. 16
6.2 Description of Datasets ....................................................................................................... 17
6.21 Household Data ............................................................................................................. 17
6.22 Agriculture Data............................................................................................................ 19
6.23 Community datasets ...................................................................................................... 21
7.0 Using the Data.................................................................................................................... 22
7.1 File Structure .................................................................................................................. 22
7.2 Merging Datasets ................................................................................................................ 22
7.21 Household and Agriculture Datasets ............................................................................ 22
7.22 Post-Planting and Post-Harvest Datasets ...................................................................... 22
7.23 Community Datasets ..................................................................................................... 22
7.3 Network Roster ................................................................................................................... 23
8.0 Calculation of consumption aggregate............................................................................... 24
8.1 Derivation of Food Gifts and Home Production Expenditure ............................................ 24
8.2 Consumption Aggregate Datasets ....................................................................................... 25
8.21 Annual Dataset .............................................................................................................. 25
8.22 Commodity Grouping of Items ..................................................................................... 26
9.0 Overall Problems and Challenges Faced During the First Wave of the Survey and
Recommendations for Wave 2 of the Survey ............................................................................... 28

9.1 Sampling ............................................................................................................................. 28
9.2 Field work ........................................................................................................................... 28
9.21 Pre-filling of Questionnaires ......................................................................................... 28
9.22 Availability of Electricity ............................................................................................. 28
9.23 Flooding ........................................................................................................................ 29
9.24 GPS Units...................................................................................................................... 29
9.25 Data entry ...................................................................................................................... 29
9.26 Delay in States Responding to Data Queries ................................................................ 30
Appendix 1 : How to Obtain Copies of the Data .......................................................................... 31
Appendix 2: Agriculture land Conversion Factors ...................................................................... 32
Appendix 3: How the Consumption Aggregate was Calculated. ................................................. 33

1
1.0 Introduction
The purpose of the present document is to provide detailed information on the panel survey
component of the revised General Household Survey (GHS-Panel) fielded by the National
Bureau of Statistics in 2010-2011. This survey is the first round of a long-term project to collect
panel data on households, their characteristics, welfare and their agricultural activities. The
survey is the result of a partnership that NBS has established with the Federal Ministry of
Agriculture and Rural Development (FMA&RD), the National Food Reserve Agency (NFRA),
the Bill and Melinda Gates Foundation (BMGF) and the World Bank (WB). Under this
partnership, a method to collect agricultural and household data in such a way as to allow the
study of agriculture’s role in household welfare over time was developed. This GHS-Panel
Survey responds to the needs of the country, given the dependence of a high percentage of
households on agriculture activities in the country, for information on household agricultural
activities along with other information on the households like human capital, other economic
activities, access to services and resources. The ability to follow the same households over time,
makes the GHS-Panel a new and powerful tool for studying and understanding the role of
agriculture in household welfare over time as it allows analyses to be made of how households
add to their human and physical capital, how education affects earnings and the role of
government policies and programs on poverty, inter alia. The GHS-Panel is the first panel
survey to be carried out by NBS.
The GHS survey is a cross-sectional survey of 22,000 households carried out annually
throughout the country. Under the work of the partnership, a full revision of the questionnaire
was undertaken and, at the same time, a sub-sample of the GHS now forms a panel survey. The
panel component (GHS-Panel) applies to 5,000 households of the GHS collecting additional data
on multiple agricultural activities and household consumption. As the focus of this panel
component is to improve data from the agriculture sector and link this to other facets of
household behavior and characteristics the GHS-Panel drew heavily on the Harmonized National
Living Standards Survey (HNLSS-a multi-topic household survey) and the National Agricultural
Sample Survey (NASS-the key agricultural survey) to create a new survey instrument to shed
light on the role of agriculture in households’ economic wellbeing that can be monitored over
time. The first wave of the revised GHS and GHS-Panel was carried out in two visits to the
Panel households (post-planting visit in August-October 2010 and post-harvest visit in February-
April 2011) and one visit to the full cross-section (in parallel with the post-harvest visit to the
panel). The GHS-Panel will be carried out every two years while the GHS-Cross Section is
usually carried out annually. A schematic of data collection is shown in Figure 1. Note that a
separate document details the contents of the GHS (cross section). This document provides
details on the GHS-Panel only.

2
Figure 1: Schematic of GHS
2010 2011 2012 2013
GHS-
Cross
Sectional
22,000
GHS-
Cross
Section
(17,000)
GHS-
Cross
Sectional
22,000
GHS-
Cross
Section
(17,000)
GHS-
Panel Post
Planting
5.000
GHS-
Panel Post
Harvest
5,000
GHS-Panel
Post
Planting
5.000
GHS-
Panel Post
Harvest
5,000
This revised and expanded GHS survey (Cross and Panel) forms part of a larger, regional project
in Sub-Saharan Africa to improve agricultural statistics. Nigeria is one of seven countries being
supported by the World Bank, through funding from the Bill and Melinda Gates Foundation
(BMGF), to strengthen the production of household-level data on agriculture. The other countries
are Ethiopia, Uganda, Tanzania, Malawi, Niger, and Mali. This regional project, the Living
Standards Measurement Study-Integrated Surveys on Agriculture (LSMS_ISA) has the over-
arching objective of improving our understanding of agriculture in Sub-Saharan Africa –
specifically, its role in household welfare and poverty reduction. The data will also provide
insights into how innovation and efficiency can be fostered in the agriculture sector.
The present document is designed to provide an overview of the first Wave of data collection
under the revised GHS-Panel. The first wave consists of two visits to the household: the post-
planting visit occurred directly after the planting season to collect information on preparation of
plots, inputs used, labour used for planting and other issues related to the planting season. The
post-harvest visit occurred after the harvest season and collected information on crops harvested,
labour used for cultivating and harvest activities, and other issues related to the harvest cycle.
1.1 Expected Benefits
The specific outputs and outcomes of the revised GHS with panel component project are:
Development of an innovative model for collecting agricultural data in conjunction with
household data;
Development of a model of inter-institutional collaboration between NBS and the
FMA&RD and NFRA, inter alia, to ensure the relevance and use of the new GHS;
Strengthening the capacity to generate a sustainable system for producing accurate and
timely information on agricultural households in Nigeria.
Comprehensive analysis of poverty indictors and socio-economic characteristics.

3
1.2 Innovations
The revised GHS with panel component contains several innovative features.
Integration of agricultural data at the plot level with household welfare data;
Creation of a panel data set that can be used to study poverty dynamics, the role of
agriculture in development and the changes over time in health, education and other labor
activities, inter alia.
Use of small area estimation techniques (SAE) to generate state level poverty data by
taking advantage of the integration of the panel households into the GHS cross-section.
Collection of information on the network of buyers and sellers of goods with which
household interact;
Use of GPS units for measuring agricultural land areas;
Involvement of multiple actors in government, academia and the donor community in the
development of the survey and its contents as well as its implementation and analysis;
Use of concurrent data entry in Wave 1. In later Waves the project will develop and
implement a Computer Assisted Personal Interview (CAPI) application for the paperless
collection of the GHS-Panel;
Use of direct respondents for all sections of the questionnaires where individual level
data or specific economic activity data are collected;
Creation of publicly available micro data sets for researchers and policy makers;
Active dissemination of agriculture statistics.
1.3 Coverage and Scope
The revised GHS with the panel component, while having an intensive focus on agriculture, is a
national survey. The survey covered all the 36 states and the Federal Capital Territory (FCT),
Abuja. Both urban and rural enumeration areas (EAs) were canvassed.
The survey covered a wide range of socio-economic topics which were collected via three
different questionnaires administered to the household and the community. These are the
Household Questionnaire, the Agricultural Questionnaire and the Community Questionnaire.

4
2.0 The Survey Instruments
The survey consisted of three questionnaires for each of the visits; The Household
Questionnaire was administered to all households in the sample. The Agriculture
Questionnaire was administered to all households engaged in agriculture activities such as crop
farming, livestock rearing and other agricultural and related activities. The Community
Questionnaire was administered to the community to collect information on the socio-economic
indicators of the enumeration areas where the sample households reside.1
GHS-Panel Agriculture Questionnaire: The agriculture questionnaire solicits information on
land ownership and use; farm labor; inputs use; GPS land area measurement and coordinates of
household plots; agriculture capital; irrigation; crop harvest and utilization; animal holdings and
costs; and household fishing activities. Some information is collected at the crop level to allow
for detailed analysis for individual crops.
GHS-Panel Household Questionnaire: The household questionnaire provides information on
demographics; education; health (including anthropometric measurement for children and child
immunization); labor and time use; food and non-food expenditure; household nonfarm income-
generating activities; food security and shocks; safety nets; housing conditions; assets;
information and communication technology; and other sources of household income. Household
location is geo-referenced in order to be able to later link the GHS-Panel data to other available
geographic data sets.
GHS-Panel Community Questionnaire: The community questionnaire solicits information on
access to infrastructure; community organizations; resource management; changes in the
community; key events; community needs, actions and achievements; and local retail price
information.
The Household Questionnaire is slightly different for the two visits. Some information was
collected only in the post-planting visit, some only in the post-harvest visit, and some in both
visits. See Section 6.51 for more details.
The Agriculture Questionnaire collects different information during each visit, but for the same
plots and crops. See Section 6.52 for more details.
The Community Questionnaire collected prices during both visits, and different community level
information during the two visits. See Section 6.53 for more details.
The contents of each questionnaire for the GHS Panel post-planting and GHS Panel post-harvest
are outlined below.
1 The Community Questionnaire does not collect information from communities in the sociological sense. The data
cannot be used to represent communities in Nigeria. The data collected at the community level represent
information that is common to the households selected for inclusion in the selected sample EAs.

5
Table 2.1: GHS-Panel Household Questionnaire – Post planting visit
Section Topic Respondent Description Cover Cover Field staff Household identifier variables,
enumerator, supervisor, and data entry
clerk identifiers, date and time of
interview and data entry, and observation
notes by enumerator
regarding the interview 1 Roster HOUSEHOLD head or
spouse. Roster of individuals living in the
household, relationship to the household,
gender, year of birth, age, marital status,
spouse identification,
parental status, and place of birth. 2 Education Individuals 5 years and
above Educational attainment, school
characteristics, and expenditures for the
2009-10 academic year 3 Labour Individuals 5 years and
above Labor market participation during the last
seven days, wage work, and domestic
activities within the home 4 Credit and
Savings
Individuals 15 years and
above Savings made, loans or credit received,
insurance, and remittances by the
household during the last six months, and
conditions of the transaction 5 Household assets HOUSEHOLD head Ownership of assets and value 6 Non-farm
Enterprises
Owner or manager of
enterprise Enterprise ownership, status, labor, value
of stock, sales, and business costs. 7A Meals Away
From Home
Most knowledgeable
person Naira value of food consumed outside the
home during the last seven days. 7B Household Food
Expenditure
Person responsible for
food purchases Quantity and value of food consumed
within the household during the last seven
days. 8 Household Non-
food
Expenditures
Person responsible for
household purchases Non-food expenditure during the last
week/last month/last six months/last 12
months 9 Food Security HOUSEHOLD head or
eligible adult Food security status of households in
during the past 7 days/12 months 10 Other Income HOUSEHOLD head or
eligible adult Others sources of household income since
the new year Contact
information
HOUSEHOLD head or
eligible adult Contact information

6
Table 2.2: GHS-Panel Agriculture Questionnaire – Post planting visit
Section Topic Respondent Description
Cover Cover To be completed by field
Staff. HOUSEHOLD ID must
be copy from HOUSEHOLD
to Agriculture Questionnaire.
This section contains household location and
identification data as well as administrative
data as regards administering and managing
the questionnaire
11a Plot Roster Owner or manager of plot Information on all plots owned and/or
managed by the Household. This section
includes data on estimated area, GPS
measured area and the GPS measured
location of the plot
11b Land Inventory Owner or manager of plot Data on plot acquisition, tenure and use
11c
Input costs Owner or manager of plot Use and cost of pesticide, herbicide, animal
labor and use of machinery
11d Fertilizer acquisition Owner or manager of plot Access to, use and cost of fertilizer
11e Seed acquisition Owner or manager of plot Data on source, quantity and cost of seeds
used on the plot
11f Planted field crops Owner or manager of plot Data on crops planted on the plot, amount of
crops planted and expected harvest.
11g Planted tree crops Owner or manager of plot This section collects details on tree crops
11h Marketing of
agricultural surplus
Owner or manager of plot Marketing of agricultural surplus. Quantities
sold, value and information on purchaser
11i Animal holdings Farmer or caretaker of
animals
Data on farm animals owned by the household
and commercial activity with these animals
11j Animal costs Farmer or caretaker of
animals
Livestock farmer caretaker activities and costs
11k Agriculture by-product Farmer or caretaker of
animals
Trading activity in agricultural by-products
11l Extension owner or manager of plot Access to and utilization of technical support
from various sources (government and non-
government)
12 Network Roster Farmer, owner or manager of
plot
Roster of places or businesses where the
household sells and purchases agricultural
produce and/or supplies

7
Table 2.3: GHS-Panel Community Questionnaire – Post planting visit
Table 2.4: GHS-Panel Household Questionnaire – Post harvest visit
Section Topic Respondent Description
Cover Cover To be completed by the
field staff
Household identifier variables,
enumerator, supervisor, and data entry
clerk identifiers, date and time of
interview and data entry, and observation
notes by enumerator
regarding the interview
1 Roster To be fill by the Head of
HOUSEHOLD or spouse.
Roster of individuals living in the
household, relationship to the household,
gender, year of birth, age, marital status,
polygamous marriages, spouse
identification, parental status, place of
birth, date joined household if new,
migration.
2 (A and B) Education Individuals 5 years and
above
Educational attainment, school
characteristics, and expenditures. Section
2a collects information for new members
of the household while Sect 2b collects
follow-up and current information on
original household members for the 2010-
11 academic year
3 (A and B) Labour Individuals 5 years and
older
Section 3a collects data on labour market
activity of all household members 5 years
and older. This includes employment and
earnings information.
Section 3b collects information on
employment in one or more industries in
the past 6 months
4(A and B) Health All individuals Section 4a: general health status and
utilization and cost of health services for
those that need medical care. Data on
effect of disabilities on activity and
functioning; and anthropometrics.
Section 4b: Child immunization.
Section Topic Respondent Description
Cover Cover To be completed by the field staff Cover
C1 Respondents Characteristics Community Focus Group Respondent
Characteristics
C2 Food Prices Market Food Sellers Food Prices
C3 Labor Community Focus Group Labor
C4 Land prices and Credit Community Focus Group Land prices and credit

8
Section Topic Respondent Description
5 Information and
communication
technology
All individuals 10 years
and above
Access to and use of communication
technology, including computers and
internet
6 Remittance All individuals 10 years
and above
Remittances received from abroad by
household members 10 years and older
7 Household
Assets sale and
acquisition
Most knowledgeable
person
Household assets sale and acquisition in
the past 6 months
8 Housing Head of household or any
knowledgeable adult
Housing, facilities and cost. Access to
utilities and costs
9 Non-farm
Enterprises and
income
generating
activities
Owner or manager of
enterprise
Data on non-farm businesses owned
and/or operated by the household. Follow-
up data on the businesses from the
previous visit and new businesses that
were started since the previous visit
10 (A,B and C) Meals Away
From Home
Female in the household
responsible for food
preparation and/or food
purchases
Section 10A: Meals away from home
Section 10B: Food expenditures
Section 10C: Aggregate food consumption
11 Non-food
Expenditures
Most knowledgeable
person or person who is
responsible for household
purchases
Consumption and expenditure on non-
food items
12 Food Security HOUSEHOLD head or
eligible adult
Collects information on quantity of food,
preferred foods and variety of foods
available to household members based on
economic reasons. Also collects data on
intra-household food security dynamics .
13 Other household
Income
HOUSEHOLD head or
eligible adult
Miscellaneous income received by
household
14 Safety Nets HOUSEHOLD head or
eligible adult
Household access to and utilization of
safety nets
15(A and B) Economic
Shocks and
death
HOUSEHOLD head or
eligible adult
Section 15a: Data on economic shocks
affecting the household
Section 15b: Deaths of household
members in the past 12 months, including
age of deceased and cause of death.
9
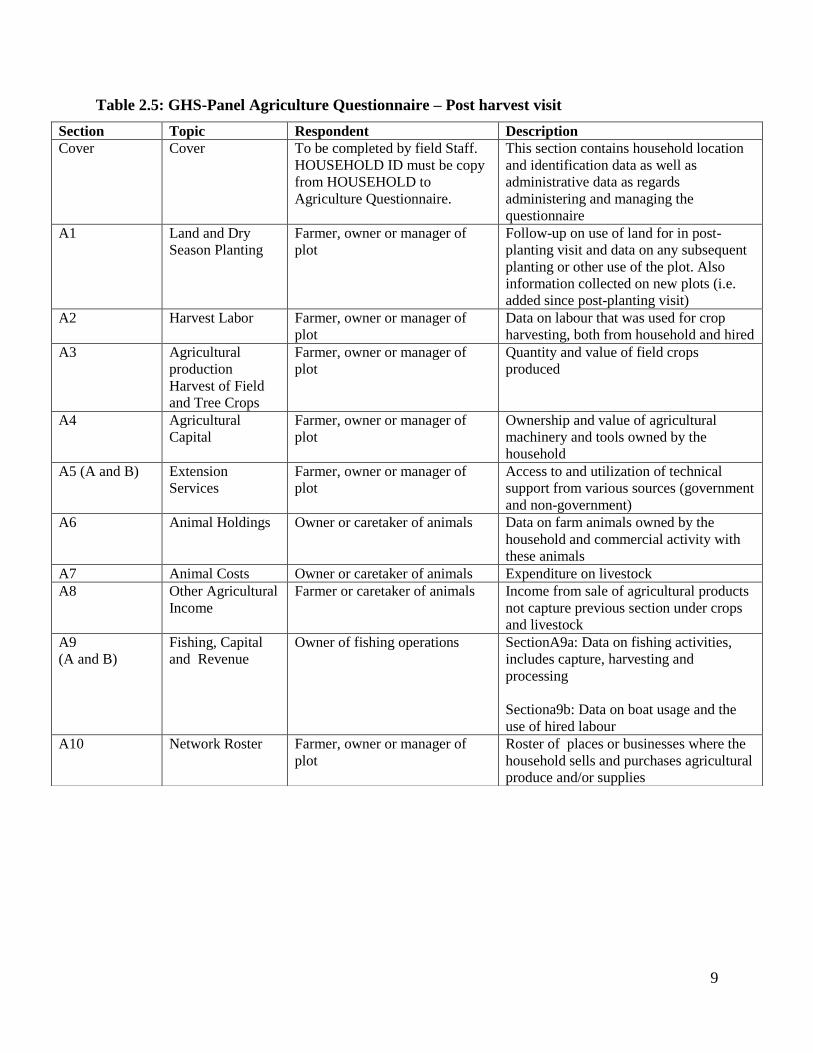
Table 2.5: GHS-Panel Agriculture Questionnaire – Post harvest visit
Section Topic Respondent Description
Cover Cover To be completed by field Staff.
HOUSEHOLD ID must be copy
from HOUSEHOLD to
Agriculture Questionnaire.
This section contains household location
and identification data as well as
administrative data as regards
administering and managing the
questionnaire
A1 Land and Dry
Season Planting
Farmer, owner or manager of
plot
Follow-up on use of land for in post-
planting visit and data on any subsequent
planting or other use of the plot. Also
information collected on new plots (i.e.
added since post-planting visit)
A2 Harvest Labor Farmer, owner or manager of
plot
Data on labour that was used for crop
harvesting, both from household and hired
A3
Agricultural
production
Harvest of Field
and Tree Crops
Farmer, owner or manager of
plot
Quantity and value of field crops
produced
A4 Agricultural
Capital
Farmer, owner or manager of
plot
Ownership and value of agricultural
machinery and tools owned by the
household
A5 (A and B) Extension
Services
Farmer, owner or manager of
plot
Access to and utilization of technical
support from various sources (government
and non-government)
A6 Animal Holdings Owner or caretaker of animals Data on farm animals owned by the
household and commercial activity with
these animals
A7 Animal Costs Owner or caretaker of animals Expenditure on livestock
A8 Other Agricultural
Income
Farmer or caretaker of animals Income from sale of agricultural products
not capture previous section under crops
and livestock
A9
(A and B)
Fishing, Capital
and Revenue
Owner of fishing operations SectionA9a: Data on fishing activities,
includes capture, harvesting and
processing
Sectiona9b: Data on boat usage and the
use of hired labour
A10 Network Roster Farmer, owner or manager of
plot
Roster of places or businesses where the
household sells and purchases agricultural
produce and/or supplies

10
Table 2.6 GHS-Panel Community Questionnaire – Post-Harvest Visit
Section Topic Respondent Description
Cover Cover To be completed by the field staff Cover
C1 Respondents Characteristics Community Focus Group Respondents
Characteristics
C2 Community Infrastructure
and Transport
Community Focus Group Community
Infrastructure and
Transport
C3 Community Organizations Community Focus Group Community
Organizations
C4 Community Resource
Management
Community Focus Group Community Resource
Management
C5 Community Changes Community Focus Group Community Changes
C6 Community Key Events Community Focus Group Community Key Events
C7 Community Needs, Actions,
and Achievements
Community Focus Group Community Needs,
Actions, and
Achievements
C8 Food Prices Market Food Sellers Food Prices

11
3.0 Sample Design
The sample is designed to be representative at the national level as well as at the zonal (urban
and rural) levels. The sample size of the GHS-Panel (unlike the full GHS) is not adequate for
state-level estimates.
The sample is a two-stage probability sample:
First Stage:
The Primary Sampling Units (PSUs) were the Enumeration Areas (EAs). These were selected
based on probability proportional to size (PPS) of the total EAs in each state and FCT, Abuja and
the total households listed in those EAs. A total of 500 EAs were selected using this method.
Second Stage:
The second stage was the selection of households. Households were selected randomly using the
systematic selection of ten (10) households per EA. This involved obtaining the total number of
households listed in a particular EA, and then calculating a Sampling Interval (S.I) by dividing
the total households listed by ten (10). The next step was to generate a random start ‘r’ from the
table of random numbers which stands as the 1st selection. Consecutive selection of households
was obtained by adding the sampling interval to the random start.
Determination of the sample size at the household level was based on the experience gained from
previous rounds of the GHS, in which 10 households per EA are usually selected and give robust
estimates.
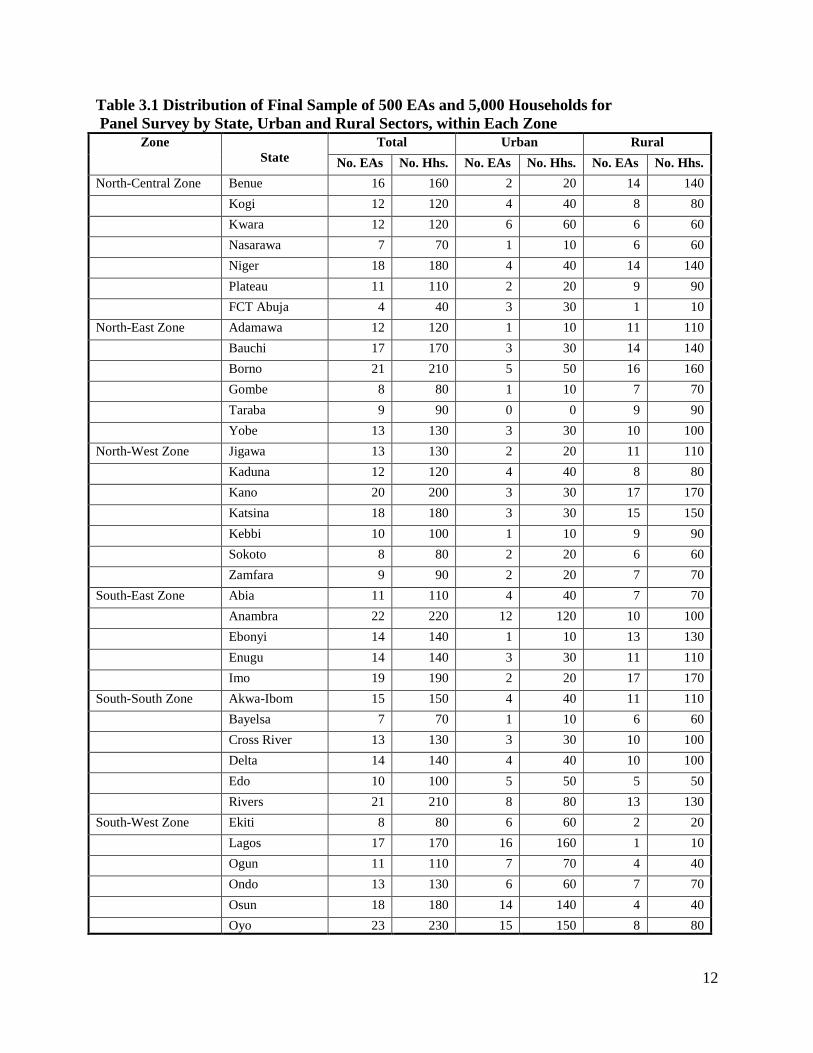
In all, 500 clusters/EAs were canvassed and 5,000 households were interviewed. These samples
were proportionally selected in the states such that different states had different samples sizes.
The distribution of the samples are shown in Table 3.1 below which shows the size of the sample
in each state, by geopolitical zone and urban/rural break-out.
Households were not selected using replacement. Thus the final number of household
interviewed was slightly less than the 5,000 eligible for interviewing. The final number of
households interviewed was 4,986 for a non-response rate of 0.3 percent. A total of 27,533
household members were interviewed. In the second, or Post Harvest Visit, some household had
moved as had individuals, thus the final number of households with data in both points of time
(post planting and post harvest) is 4,851, with 27,993 household members.
12
Table 3.1 Distribution of Final Sample of 500 EAs and 5,000 Households for
Panel Survey by State, Urban and Rural Sectors, within Each Zone
Zone
State
Total Urban Rural
No. EAs No. Hhs. No. EAs No. Hhs. No. EAs No. Hhs.
North-Central Zone Benue 16 160 2 20 14 140
Kogi 12 120 4 40 8 80
Kwara 12 120 6 60 6 60
Nasarawa 7 70 1 10 6 60
Niger 18 180 4 40 14 140
Plateau 11 110 2 20 9 90
FCT Abuja 4 40 3 30 1 10
North-East Zone Adamawa 12 120 1 10 11 110
Bauchi 17 170 3 30 14 140
Borno 21 210 5 50 16 160
Gombe 8 80 1 10 7 70
Taraba 9 90 0 0 9 90
Yobe 13 130 3 30 10 100
North-West Zone Jigawa 13 130 2 20 11 110
Kaduna 12 120 4 40 8 80
Kano 20 200 3 30 17 170
Katsina 18 180 3 30 15 150
Kebbi 10 100 1 10 9 90
Sokoto 8 80 2 20 6 60
Zamfara 9 90 2 20 7 70
South-East Zone Abia 11 110 4 40 7 70
Anambra 22 220 12 120 10 100
Ebonyi 14 140 1 10 13 130
Enugu 14 140 3 30 11 110
Imo 19 190 2 20 17 170
South-South Zone Akwa-Ibom 15 150 4 40 11 110
Bayelsa 7 70 1 10 6 60
Cross River 13 130 3 30 10 100
Delta 14 140 4 40 10 100
Edo 10 100 5 50 5 50
Rivers 21 210 8 80 13 130
South-West Zone Ekiti 8 80 6 60 2 20
Lagos 17 170 16 160 1 10
Ogun 11 110 7 70 4 40
Ondo 13 130 6 60 7 70
Osun 18 180 14 140 4 40
Oyo 23 230 15 150 8 80

13
4.0 Training of Field Staff and Data Entry Operators for the Survey
Two (2) levels of training were mounted for the survey. The 1st level was organized at NBS
Headquarters in Abuja and was called the Training of Trainers (TOT). The participants in the
TOT became the resource persons for the next level of training. The top management team of
the survey participated in the TOT which lasted for three (3) days. The persons trained in the
TOT were then sent to carry out the second level training: three (3) resource persons were sent
to each of the six training centers, Minna (Niger State) for North Central (NC), Gombe (Gombe
State) for North East(NE), Kaduna (Kaduna State) for North West(NW), Enugu (Enugu State)
for South East(SE), Calabar (Cross River State) for South-South (SS) and Ibadan (Oyo State) for
South West to perform the training. Included in the team was one (1) additional resource person
per training venue who served as an Information Technology (IT) trainer.
The second level training took 6 days with 4 days for theory and 2 days for field practice and
review. The core training materials for the 2nd
level training were harmonized and finalized
during the TOT. Participants in the training were Zonal Controllers, State Officers, Field
Supervisors, Field Interviewers and Data Entry Operators. Training instructions were given to
the field staff by the resource persons from the management team (NBS, FMS&RD, and NFRA)
with support from World Bank technical missions. The training consisted of (i) classroom
instruction on the questionnaire, concepts and definitions, (ii) interview techniques, and (iii)
methods and field practices in performing actual interviews to ensure that field interviewers fully
understood the questionnaire. In addition, participants did actual interviews in the field with
households that were not scheduled to be part of the actual survey sample. Most of the training
instructions are detailed in the interviewer’s and supervisor’s manuals which are also available.
At the end of the training session, trainees were assessed according to a test that was
administered on the material covered in the training process, and an evaluation by the resource
persons. The data entry operators were trained along with the field staff, with supplementary IT
training sessions. At the end of the training, field teams were formed of interviewers,
supervisors and data entry operators.

14
5. 0 Field Work
5.1 Organization of Fieldwork
Data were collected by teams consisting of a supervisor, between 2 and 4 interviewers and a data
entry operator. The number of teams varied from state to state depending on the sample size or
number of EAs selected. The teams moved in a roving manner and data collection lasted for
between 20 – 30 days for each of the post-planting and post-harvest visits. Additional details on
the structure of the visits is available in Section 6.
5.2 Fieldwork Monitoring and Evaluation
As an additional aid to ensuring the good quality data, extensive monitoring was done of the
field work Monitoring and evaluation guidelines and formats for fieldwork were developed.
One (1) monitor was assigned to 1 – 2 states and all the states and FCT, Abuja were covered.
There were three levels of monitoring and evaluation, the first and the third levels were carried
out by NBS state officers and zonal controllers while the second level was carried out by the
technical team which included individuals from the National Bureau of Statistics (NBS), the
Federal Ministry of Agriculture and Rural Development (FMA&RD), the National Food Reserve
Agency (NFRA) headquarter staff, and World Bank officials and consultants.
The monitors made sure that proper compliance with the procedures as contained in the manual
were followed, effected necessary corrections and tackled problems that arose. The monitoring
exercise was arranged such that the first level took place at the commencement of the fieldwork,
and the third level not later than a week before the end of the data collection exercise. In-
between these two, the technical team visited all the states of the federation and FCT, Abuja.
While NBS state officers monitored in their state, the zonal controllers monitored in at least two
(2) states (the zonal headquarters state and one other state of the same zone). The 1st and 3
rd
rounds of the monitoring exercise lasted for eight (8) days while the 2nd
round by the technical
team lasted for seven (7) days. Monitoring instruments were developed and discussed during
both training of trainers and zonal training.

15
6.0 Data Management and Description of Datasets
6.1 Data Management
6.11 Data Entry
This survey used a concurrent data entry approach. In this method, the fieldwork and data entry
were handled by each team assigned to the state. Each team consisted of a field supervisor, 2-4
interviewers and a data entry operator. Immediately after the data were collected in the field by the
interviewers, the questionnaires were handed over to the supervisor to be checked and documented.
At the end of each day of fieldwork, the questionnaires were then passed to the data entry operator
for entry. After the questionnaires were entered, the data entry operator generated an error report
which reported issues including out of range values and inconsistencies in the data. The supervisor
then checked the report, determined what should be corrected, and decided if the field team needed
to revisit the household to obtain additional information. The benefits of this method are that it
allows one to:
Capture errors that might have been overlooked by a visual inspection only,
Identify errors early during the field work so that if any correction required a revisit to the
household, it could be done while the team was still in the EA
The CSPro software was used to design the specialized data entry program that was used for the
data entry of the questionnaires.
6.12 Data Cleaning
The data cleaning process was done in a number of stages. The first step was to ensure proper
quality control during the fieldwork. This was achieved in part by using the concurrent data entry
system which was, as explained above, designed to highlight many of the errors that occurred
during the fieldwork. Errors that are caught at the fieldwork stage are corrected based on re-visits to
the household on the instruction of the supervisor. The data that had gone through this first stage of
cleaning was then sent from the state to the head office of NBS where a second stage of data
cleaning was undertaken.
During the second stage the data were examined for out of range values and outliers. The data were
also examined for missing information for required variables, sections, questionnaires and EAs.
Any problems found were then reported back to the state where the correction was then made. This
was an ongoing process until all data were delivered to the head office.
After all the data were received by the head office, there was an overall review of the data to
identify outliers and other errors on the complete set of data. Where problems were identified, this
was reported to the state. There the questionnaires were checked and where necessary the relevant
households were revisited and a report sent back to the head office with the corrections.

16
The final stage of the cleaning process was to ensure that the household- and individual-level data
sets were correctly merged across all sections of the household questionnaire. Special care was
taken to see that the households included in the data matched with the selected sample and where
there were differences these were properly assessed and documented. The agriculture data were
also checked to ensure that the plots identified in the main sections merged with the plot information
identified in the other sections. This was also done for crop-by-plot information as well.
6.13 Data Cleaning Challenges
The cleaning process at the head office was impeded by the fact that the questionnaires were not
immediately available for inspection when problems were identified in the data. The
questionnaires were retained by the state in case there was the need for household revisits. So
whenever problems were identified at the head office, the state office had to be contacted in
order to determine if the suspect data were the same as the information on the questionnaire, and
to ensure that changes were captured in both places. This was a very cumbersome and time
consuming process since communication was difficult and in many instances the response was
not timely. However, this is a necessary process to ensure that the households can be re-visited
to provide the correct information to avoid having to make imputations. Also, this process
allows the state officers to understand the key issues that arose during field work and will serve
to enhance further rounds of data collection. It will be important, nonetheless, to find a
mechanism to facilitate this process in the next round of data collection and cleaning.
A second challenge in data management and cleaning was the difficulty faced by state offices in
sending the data from the state to the head office. There were difficulties in accessing internet
facilities in many of the EAs and surrounding areas where the field teams were active. The
consequence of this was that the data were not sent to the head office until the teams returned to
state capitals where, due to the distance, it was difficult to return to the EAs for household
revisits when requested by the head office. This issue will need to be addressed for future rounds
of the survey.
6.14 Weighting of Data
When a sample of households is selected for a survey, these households represent the entire
population of the country. To accurately use the data sets, the data must be weighted to reflect
the distribution of the full population in the country. A population weight was calculated for the
panel households. This weight variable (wght) has been included in the household dataset:
Section A (secta_plantingw1 for post-planting and secta_harvestw1 for post-harvest). When
applied, this weight will raise the sample households and individuals to national values adjusting
for population concentrations in various areas.

17
6.2 Description of Datasets
The first wave of the GHS-Panel was administered in two visits: Post-planting (Aug-Oct 2010)
and Post-harvest (Feb-Apr 2011). During each visit two questionnaires were administered to the
household respondents (household questionnaire and agricultural questionnaire) and a third
questionnaire was administered at the level of the Enumeration area (community questionnaire).
The datasets are organized by visit and then by questionnaire. The household dataset corresponds
to the Household Questionnaire, the agricultural dataset corresponds to the Agricultural
Questionnaire, and the community dataset corresponds to the Community Questionnaire.
The data file naming scheme is a combination of the prefix 'sect', followed by section number,
and then followed by suffix ‘plantingw1’ for post-planting data and ‘harvestw1’ for post-harvest
data. For example, the data set that corresponds with the section 1 of the household questionnaire
in post-planting data folder is called ‘sect1_plantingw1’. The exception to this rule are sections
where the files are broken down even further due to different reference period or different levels
of recording the data. An example is section 8 of the household post-planting questionnaire on
nonfood expenditure where the section is split into 5 files with each file corresponding with the
reference period collected in the section. In this case, the name of the corresponding files will be
‘sect81_plantingw1’, ‘sect82_plantingw1’, etc.
6.21 Household Data
In the household questionnaire, some of the modules were administered in both the post planting
and post-harvest visit and others were only administered during one of the two visits. This should
be taken into account when using the datasets.
Group 1: These modules are administered in both visits but the module in the post-harvest
version is a follow up to the post-planting module. For example, for the Roster and Education
modules, additional information is gathered during the post-harvest only for individual who had
joined the household since the first, or post-planting, visit. (These people are referred to as ‘new
household members’. ) For assets and enterprises, the module attempts to update the information
from the first visit.
Roster
Education
Households assets
Nonfarm enterprises
Group 2: These modules are administered in both visits as standalone modules. For these topics
we have complete information at two points in time during the year of the survey.
Labor
Meals away from home
Food consumption and expenditure
Nonfood expenditure
Food security
Other household income

18
Group 3: These modules only appear in either the post-planting or the post-harvest visit
Post-planting only
o Credit and Savings
Post-harvest only
o Health and Child immunization
o Information and communication technology
o Remittances
o Housing
o Aggregate food consumption
o Safety nets
o Economic shocks and deaths
Tables 6.1a and 6.1b show the sections of the household questionnaire and the datasets that
correspond to these. There are 21 data files in the post-planting household data folder which
include all the modules in the questionnaire and 4 aggregate data files: household size, annual
food expenditure, annual non-food expenditure and annual total expenditure.
Table 6.1a: Post-planting household datasets
Section Section Name Dataset Filename
Cover Cover secta_plantingw1
1 Roster sect1_plantingw1
2 Education sect2_plantingw1
3 Labour sect3_plantingw1
4 Credit and Savings sect4_plantingw1
5 Household assets sect5_plantingw1
sect5b_plantingw1
6 Non-farm Enterprises sect6_plantingw1
7A Meals Away From Home sect7a_plantingw1
7B Household Food Expenditure sect7b_plantingw1
8 Household Non-food Expenditures sect81_plantingw1
sect82_plantingw1
sect83_plantingw1
sect84_plantingw1
sect85_plantingw1
9 Food Security sect9_plantingw1
10 Other Income sect10_plantingw1
Aggregate Annual total expenditure annual_plantingw1
There are 31 data files in the post-harvest household data folder which include all the modules in
the questionnaire and 4 aggregate data files: household size, annual food expenditure, annual
non-food expenditure and annual total expenditure.

19
Table 6.1b: Post-harvest household datasets
Section Section Name Dataset Filename
Cover Cover secta_harvestw1
1 Roster sect1_harvestw1
2A Education- New Member sect2a_harvestw1
2B Education – Original Household Members sect2b_harvestw1
3A Labour sect3a_harvestw1
3B Labour Activity sect3b_harvestw1
4A Health sect4a_harvestw1
4B Child Immunization sect4b_harvestw1
5 Information and Communication
Technology
sect5_harvestw1
6 Remittances sect6_harvestw1
7 Household Assets Sales and Acquisition sect7_harvestw1
8 Housing sect8_harvestw1
9 Non-farm Enterprises and Income
Generating Activity
sect9_harvestw1
10A Meals Away From Home sect10a_harvestw1
10B Food Consumption and Expenditures sect10b_harvestw1
10C Aggregate Food Consumption sect10c_harvestw1
11 Non-food Expenditures sect11a_harvestw1
sect11b_harvestw1
sect11c_harvestw1
sect11d_harvestw1
sect11e_harvestw1
12 Food Security sect12_harvestw1
13 Other Household Income sect13_harvestw1
14 Social Safety Nets sect14_harvestw1
15A Economic Shocks sect15a_harvestw1
15B Deaths sect15b_harvestw1
sect15b1_harvestw1
Aggregate Annual total expenditure annual_harvestw1
6.22 Agriculture Data
It should be noted that in the agriculture questionnaire, the plot roster and land inventory
information collected during the post-planting visit is updated during the post-harvest visit in the
Land and dry season planting section to include additional plots households may have acquired
or old plots they have disposed of since the first, post-planting visit. Information on inputs to
agricultural production was collected in the post-planting visit only. As with the household
questionnaire, some modules were administered in both visits. For these modules, during the
post-harvest visit, information was gathered on the activities since the post-planting interview.

20
There are 15 data files in the post-planting agriculture data folder corresponding to the modules
in the questionnaire.
Table 6.2a: Post-planting Agriculture datasets
Section Section Name Dataset Filename
11a Plot Roster sect11a_plantingw1
sect11a1_plantingw1
11b Land Inventory sect11b_plantingw1
11c
Input costs sect11c_plantingw1
11d Fertilizer acquisition sect11d_plantingw1
11e Seed acquisition sect11e_plantingw1
11f Planted field crops sect11f_plantingw1
11g Planted tree crops sect11g_plantingw1
11h Marketing of
agricultural surplus
sect11h_plantingw1
11i Animal holdings sect11i_plantingw1
11j Animal costs sect11j_plantingw1
11k Agriculture by-product sect11k_plantingw1
11l Extension sect11l1_plantingw1
sect11l2_plantingw1
12 Network Roster sect12_plantingw1
There are 15 data files in the post-harvest agriculture data folder corresponding to the modules in
the questionnaire.
Table 6.2b: Post-harvest Agriculture datasets
Section Section Name Dataset Filename
A1 Land and Dry Season Planting sectaa_harvestw1
secta1_harvestw1
A2 Harvest Labour secta2_harvestw1
A3 Agricultural Production – harvest of
Field and Tree Crops
secta3_harvestw1
A4 Agricultural Capital 1 secta41_harvestw1
Agricultural Capital 2 secta42_harvestw1
A5 Extension Services 1 secta5a_harvestw1
Extension Services 2 secta5b_harvestw1
A6 Animal Holdings secta6_harvestw1
A7 Animal Costs secta7_harvestw1
A8 Other Agricultural Income secta8_harvestw1
A9a Fishing secta9a1_harvestw1
secta9a2_harvestw1

21
Section Section Name Dataset Filename
A9b Fishing Capital and Revenue secta9b1_harvestw1
secta9b2_harvestw1
A10 Network Roster secta10_harvestw1
6.23 Community datasets
Tables 6.3a and 6.3b show the sections of the community questionnaire and their corresponding
data sets. There are 5 files in the post-planting data folder and 9 data files in the post-harvest
community data folder corresponding to the modules in the questionnaire.
Table 6.3a: Post-planting Community datasets
Section Section Name Dataset Filename
Cover Cover sectc_plantingw1
C1 Respondent Characteristics sectc1_plantingw1
C2 Food Prices Sectc2_plantingw1
C3 Labor Sectc3_plantingw1
C4 Land prices and credit Sectc4_plantingw1
Table 6.3b: Post-harvest Community datasets
Section Section Name Dataset Filename
Cover Community identification sectc_harvestw1
C1 Respondent Characteristics sectc1_harvestw1
C2 Community Infrastructure and
Transportation
sectc2_harvestw1
C3 Community Organizations sectc3_harvestw1
C4 Community Resource
Managements
sectc4_harvestw1
C5 Community Changes sectc5_harvestw1
C6 Community Key Events sectc6_harvestw1
C7 Community Needs, Actions and
Achievements
sectc7_harvestw1
C8 Food Prices sectc8_harvestw1
Note that, for purposes of maintaining the confidentiality of the data all names and addresses
have been removed from the datasets. Additionally, the GPS coordinates have also been removed
as these could be used to locate households and plots with accuracy. Various approaches to use
of the GPS data are available: the user who is interested in these data is requested to contact
NBS directly to discuss how these can be used. (See Appendix 1 for information on how to
contact NBS.)
.

22
7.0 Using the Data
7.1 File Structure
The data should always be used in conjunction with the questionnaire and the interviewer’s
instruction manual.
Where there are no issues of confidentiality all the variables from the questionnaire have been
included in the data sets. In some cases there is an additional variable which contains the "other
specify" information that was written in the questionnaire. So, for example, if there is a variable
with two parts question 5a and question 5b, a third variable, question 5c, might be added which
would contain the other "specify information".
7.2 Merging Datasets
7.21 Household and Agriculture Datasets
All household and agriculture datasets in both the post-planting and post-harvest files, contain a
variable (hhid) which is a unique identifier for the household. This variable is used as the unique
key variable in the merging of all household type datasets. In some of the other types of datasets,
additional key variables may be required in the merging process. In the case of individual type
files, the variable that uniquely identifies the individual in the household is indiv. So in order to
merge any two individual type files, both the variables hhid and indiv would be used. In the
agriculture datasets, plot files are merged using hhid and plotid while crop files are merged using
hhid, plotid and cropid.
7.22 Post-Planting and Post-Harvest Datasets
Post-planting and post-harvest files can be merged using the methodology explained above. That
is, the hhid is the same for a specific household in the post-planting and post-harvest visit. It
should be noted that there was some attrition of households between the post-planting and post-
harvest visits so some households in the post-planting files will not have a match in the post-
harvest data sets. Note also that people may have left the households or joined them in the time
between the two visits. Thus the number of people will vary between visits.
7.23 Community Datasets
The community questionnaire is administered at the EA level so the location variables lga and ea
are unique for each community questionnaire. Merging of community files within the round or
with community files from the other round or with any of the household or agriculture files from
either round should be done using the lga and ea variables, in that order.

23
Location variables: zone, state, lga, sector, ea and ric have not been included in all the datasets.
Instead, these variables have been included in the questionnaire cover datasets, i.e.
secta_harvestw1, secta_plantingw1, sectc_harvestw1 etc., and from there they can be merged
into any of the other datasets using the key variables as explained above.
7.3 Network Roster
A network roster is included in both the post-planting and post-harvest agriculture
questionnaires. The network roster keeps a record of the list of places (businesses, markets,
persons etc) with which the household engages in agricultural trading activities. Each place is
assigned the network code of the line in which it is in that section. Each place is recorded only
once so we have for example, network codes N1, N2 etc. which is just a serialization of the
places. This is similar to the household roster where an individual acquires the individual code
of the line in which the person's name is written.
After the information has been entered in the network roster, the network code can be used in
any section of the agriculture questionnaire where a place of trading is requested. The network
roster contains information on the type of place and its location.

24
8.0 Calculation of consumption aggregate
The consumption aggregates are computed from the expenditure sections of the questionnaire for
general food and non-food expenditures. In addition to this, educational expenditures are
obtained from the education of the questionnaire for both post-planting and post-harvest. In the
case of the post-harvest visit, a housing expense section was included in the questionnaire and
these data were used in the computation of the consumption aggregate. A housing expense
section was not included in the post-planting questionnaire.
Table 8.1: Datasets Providing Consumption Aggregate Data
Section Post-planting Dataset Post-harvest Dataset
Education expenses sect2_plantingw1
sect2a_harvestw1
sect2b_harvestw1
Meals Away from Home
expenditure
sect7a_plantingw1 sect10a_harvestw1
Housing Expenditure Not collected Sect8_harvestw1
Food Consumption sect7b_plantingw1 Sect10b_harvestw1
Non-food Expenditure sect81_plantingw1
sect82_plantingw1
sect83_plantingw1
sect84_plantingw1
sect85_plantingw1
Sect11a_harvestw1
Sect11b_harvestw1
Sect11c_harvestw1
Sect11d_harvestw1
Sect11e_harvestw1
8.1 Derivation of Food Gifts and Home Production Expenditure
The post-planting and post-harvest surveys did not collect information on the value (estimated)
of food gifts and food home production. Gift and home production data were collected in terms
of quantity consumed only.
In order to obtain a value for gifts received and home produced food consumed, the unit value of
the item was obtained from the price of purchase of the item by the household and this unit
valued applied to the quantity of gift and home production consumed. In cases where the
household did not purchase the item received as gift or consumed from home production, the
enumeration area median unit price for that item was used. If the purchase of this item did not
occur in the enumeration area, progressively larger geographic areas were examined i.e. local
government area (lga), state and national, until the purchase of the item occurred and the median
unit price could be obtained.

25
8.2 Consumption Aggregate Datasets
Expenditure data was annualized for both the post-planting visit and the post-harvest visit. The
file has the same name (annual) in the both sets of data and is differentiated by the round suffix.
8.21 Annual Dataset
The annual dataset contains all the annualized consumption expenditure variables. Table 8.3
below list the variables with a description of each.
Table 8.3: Description of Variables in the 'Annual' Dataset
Variable Description
pfood Purchased food
giftfood Value of foods received as gifts
hpfood Value of food consumed from own production
daily Daily expenditure on meals away from home
totfood pfood+giftfood+hpfood+daily
hsexp Household and housing expenses
personal Person expenditure
clothing Annual expenditure on clothing and footwear
health Value of expenditure on health
transp Annual expenditure on transportation public and private
hhdurable Value of household durable goods purchase
noncons Non-consumption expenditure
misc Miscellaneous expenditure
educ Value of expenditure on education, computed from the education section
rent Annual value of rent expenditure.
(There was not a housing section in the post-planting questionnaire so in post-
planting this was taken from the expenditure section 8 and in post harvest from
housing, Section 8)
electricity Annual expenditure on electricity
(There was not a housing section in the post-planting questionnaire so in post-
planting this was taken from the expenditure section 8 and in post harvest from
housing, Section 8)
lphone Annual expenditure on landline phones
(There was not a housing section in the post-planting questionnaire so in post-
planting this was taken from the expenditure, section 8 and in post harvest from
housing, Section 8)
cphone Annual expenditure on mobile phone credit.
(There was not a housing section in the post-planting questionnaire so in post-
planting this was taken from the expenditure section 8 and in post harvest from
housing, Section 8)
water Annual expenditure on water.
(There was not a housing section in the post-planting questionnaire so in post-
planting this was taken from the expenditure section 8 and in post harvest from
housing, Section 8)

26
Variable Description
garbdisp Annual expenditure on garbage disposal, housing section [This data is available in
post-harvest only]
nonfood POST-PLANTING:
hsexp+personal+clothing+health+transp+hhdurable+misc+educ+rent+electricity+lphone+
cphone+water
POST-HARVEST:
hsexp+personal+clothing+health+transp+hhdurable+misc+educ+rent+electricity+lphone
+cphone+water+garbdisp
cons totfood+nonfood
totexp cons+noncons
hhsize Number of household members
percap cons/hhsize
quintile Population quintile
decile Population decile
8.22 Commodity Grouping of Items
The table below shows the commodity groups and items that have been included in these groups.
The major commodity groups have been shown in the annual datasets. The other commodity
groups have been placed in the variable miscellaneous.
Table 8.4: Item Codes in Commodity Groupings
Category item_cd Group
Code
Meals away from home 1-5 1
Non-Food Expenditure
Tobacco and matches 101, 102 2
Clothing and footwear 401-417, 423 3
Rent 329 4
Mortgage 326 5
Water 312 6
Electricity 305 7
Gas and cooking fuel 301,303,304,307,308 8
Other fuel energy 309, 310 9
Furnishing and household equip maintenance 327, 328 10
Household expenses 306, 311, 313, 314, 317, 325, 419, 420,
421, 422, 424, 427, 501, 502, 503, 505,
508, 518, 519
11
Health: health costs, vitamins supplies,
mosquito nets
316, 430, 504 12
Transport: public transportation, vehicle
maintenance, bicycle servicing
104, 323, 324 13
Landline phone 320 14

27
Category item_cd Group
Code
Mobile phone credit 319, 15
Other communication 318,321 16
Recreation and personal care 322, 428, 425*, 426*, 103, 507, 506,
315, 418
17
Education From education sections 19
Food and non-alcoholic beverages
Grains and flours 10-20 20
Starchy roots, tubers & plantain 30-38 21
Pulses, nuts and seeds 40-44 22
Oil and fats 50-53, 302 23
Fruits 60-66 24
Vegetables 70-78,7 25
Poultry, poultry products, meat, fish 80-85, 90-96, 100-107 26
Milk and milk products 110-114,6 27
Coffee, tea, cocoa and the like beverages 120-122 28
Sugar, sweets and confectionary 130-133 29
Other miscellaneous foods 140 30
Non-alcoholic drinks 150-155, 8 31
Alcoholic drinks (bottle and can) 160-164, 9 32
Non-consumption expenditure 509-517, 429 45

28
9.0 Overall Problems and Challenges Faced During the First Wave of the
Survey and Recommendations for Wave 2 of the Survey
Designing and implementing a complex survey such as the GHS-Panel presents various
challenges. In this section we outline some key issues that arose, lessons learned and make
recommendations for the next Wave of the survey.
9.1 Sampling
During the post-planting round, each interviewer was provided a list of addresses of the
households in the sample that they were responsible to interview. There were some problems of
EA replacement, in cases of inaccessibility to the EA, that were not done according to plan.
One cause of this may have been the fact that the EAs listing had been done with a substantial
gap between it and the actual field work.
A re-listing exercise was done at the end of the post-harvest round and weights from this
relisting has been included in the post-planting and post-harvest data.
There were also issues on the agreement of geographical codes between. The statistical system
of the country is decentralized to some extent, with the central office of the NBS working with
six zonal offices and 36 state (plus FCT) offices. It was discovered during the field work that
there are different codes in use in the states and headquarters for LGAs and EAs.
It is recommended that for wave 2, work be done to harmonize all geographic codes before
another round of field work is done. This will benefit all surveys, not just the GHS
9.2 Field work
9.21 Pre-filling of Questionnaires
Prior to the fielding of the post-harvest survey, interviewers were required to pre-fill
questionnaires with select data from the post-planting questionnaires. The pre-filled information
was used to ask follow-up questions to those asked in the post-planting survey.
The pre-filling proved problematic in many instances. The main problem was that there were
many cases where data was prefilled into the wrong column of the post-harvest questionnaire and
in some cases in the wrong row. This resulted in data being assigned into the wrong variable or
in a mismatch of cases between the post-planting and post-harvest data
9.22 Availability of Electricity
This was required by the data entry operator to operate the laptop computer and printer when in
the field. This problem was anticipated so inverters were purchased and made available to each

29
data entry operator. The intention was that these inverters would be connected to the cigarette
lighter socket or battery of the vehicle that was providing transportation for the team. By so
doing' electrical power would be generated to run the laptop and printer. Unfortunately, in most
cases, no vehicle was available since the team was simply transported and left at the location. In
addition some of the locations could only be accessed by motorcycles which did not have the
facility to operate the inverters.
In order to alleviate this problem, special provision had to be made for the purchase or renting of
portable generators. This proved to be a satisfactory solution to the problem.
9.23 Flooding
During the post-planting visit many roads leading to the rural EAs were in very poor condition
and were flooded during the rainy season. In rural areas, movement was difficult as only
motorcycles were able to access some of the rural EAs. Using these motorcycles turned out to be
more expensive than the taxis or vans that normally travelled those routes. In addition, in the
flooded areas it was not possible to collect any information about the farms since these farms
were under water.
Special provision should be made for transportation for the post-planting round of the next wave
of the survey and it should be expected that there will be challenges in accessing some farm land
in flood prone areas.
9.24 GPS Units
In some states, a number of the allocated GPS units malfunctioned and consequently reduced the
number of farms that it was anticipated would have been covered in a given period of time.
These GPS units were eventually replaced but unfortunately not before some delays were
incurred.
In addition, only one GPS unit was allocated to each field team. Given the number of plots of
land and the needs of 2-4 interviewers to measure all of this, it was determined that one GPS unit
per team is not sufficient to collect the amount of data required.
9.25 Data entry
Overall the data entry in the field served as a useful quality control mechanism and improved the
quality of the data. There were, however, a number of problems that were encountered during
the post-planting round that were addressed before the fielding of the post-harvest visit. This
was done by providing two extra days of training and practice for the data entry persons and
supervisors only. The problems addressed included:
Some of the data entry operators found the new system challenging. Specifically
managing the laptop computers and managing issues with the data entry program.

30
There were challenges in sending data via internet to NBS headquarters, in part due to
poor connections but also due to inexperience of data entry operators with the use of the
internet.
The concurrent data entry system requires that the data from each questionnaire be
entered electronically and a list of errors, inconsistencies and missing data produced.
This list is then used by the supervisor to determine if a household needs to be re-visited
and the interviewer is responsible for correcting any errors on the list. There were some
problems in effective managing of data problems while the teams were in the field such
as printing and the correct reading of error messages
9.26 Delay in States Responding to Data Queries
In both the post-planting and post-harvest rounds, the questionnaires were entered in the state
where the survey was conducted and the questionnaires remained in that state. When data
problem were identified the state was requested to check the questionnaire and/or revisit the
household and correct errors or obtain additional data where the need arose.
The response from most states took an excessively long time and in some cases when the
information was returned the query was not properly addressed and had to be resent. This
introduced excessive delays in the data cleaning process.

31
Appendix 1 : How to Obtain Copies of the Data
The data are available through the NBS web site:
http://www.nigerianstat.gov.ng/
or through the LSMS-ISA website:
http://www.worldbank.org/lsms-isa
Users do not need to obtain the permission of the NBS to receive a copy of the data, but will be
asked to fill in a data access agreement. In this agreement, users agree to: (a) cite the National
Bureau of Statistics as the collector of the data in all reports, publications and presentations; (b)
provide copies of all reports publications and presentation to the National Bureau of Statistics
(see address below) and the Poverty and Inequality Division of the World Bank (see address
below); and (c) not pass the data to any third parties for any reasons.
Leo Sanni
Statistical Information Officer
Plot 762, Independence Avenue,
Central Business District,
FCT, Abuja
Nigeria
www.nigerianstat.gov.ng
Phone: +2348033865388
Email: [email protected]
LSMS Database Manager
Poverty and Inequality Division
The World Bank
1818 H Street, NW
MSN MC3-306
Washington, DC 20433
www.worldbank.org/lsms-isa
Email: [email protected]

32
Appendix 2: Agriculture land Conversion Factors
The table below shows the conversion factors used to convert self-reported land areas (for
agricultural land area of crops planted and harvested) into hectares.
General Conversion Factors to Hectares
Zone Unit
Conversion
Factor
All Plots 0.0667
All Acres 0.4
All Hectares 1
All Sq Meters 0.0001
Zone Specific Conversion Factors to
Hectares
Zone
Conversion Factor
Heaps Ridges Stands
1 0.00012 0.0027 0.00006
2 0.00016 0.004 0.00016
3 0.00011 0.00494 0.00004
4 0.00019 0.0023 0.00004
5 0.00021 0.0023 0.00013
6 0.00012 0.00001 0.00041
Note: All conversion is to Hectares
33
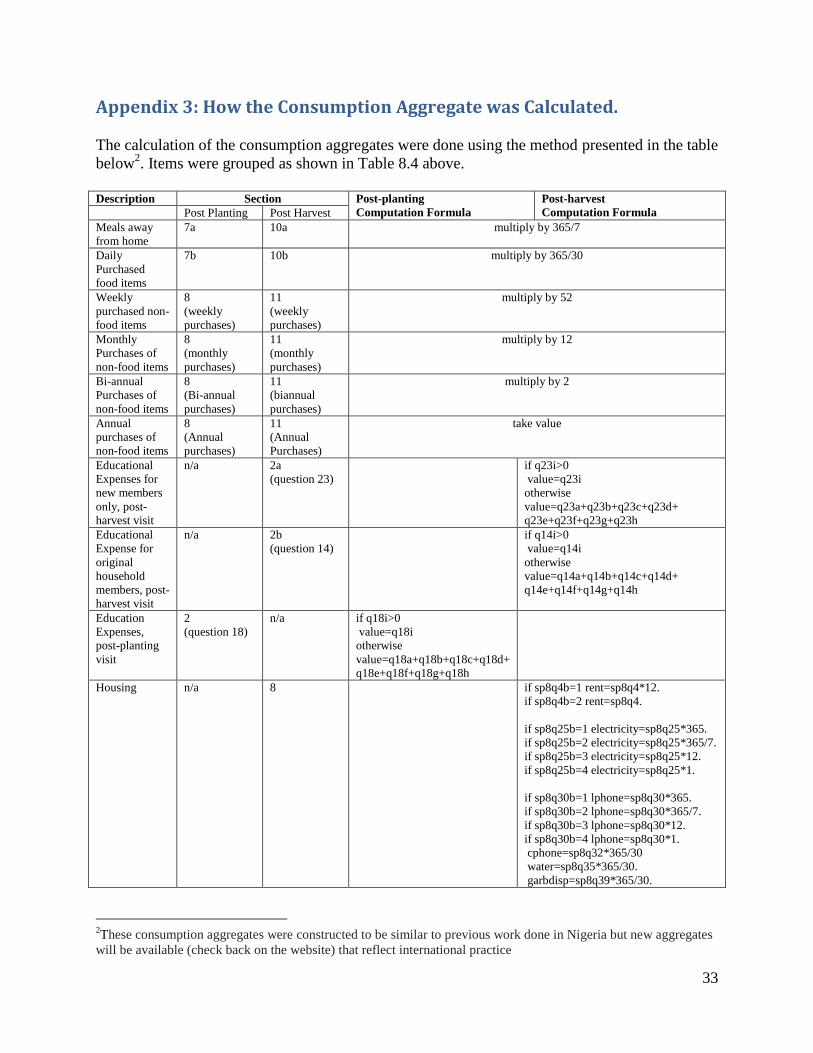
Appendix 3: How the Consumption Aggregate was Calculated.
The calculation of the consumption aggregates were done using the method presented in the table
below2. Items were grouped as shown in Table 8.4 above.
Description Section Post-planting
Computation Formula
Post-harvest
Computation Formula Post Planting Post Harvest
Meals away
from home
7a 10a multiply by 365/7
Daily
Purchased
food items
7b 10b multiply by 365/30
Weekly
purchased non-
food items
8
(weekly
purchases)
11
(weekly
purchases)
multiply by 52
Monthly
Purchases of
non-food items
8
(monthly
purchases)
11
(monthly
purchases)
multiply by 12
Bi-annual
Purchases of
non-food items
8
(Bi-annual
purchases)
11
(biannual
purchases)
multiply by 2
Annual
purchases of
non-food items
8
(Annual
purchases)
11
(Annual
Purchases)
take value
Educational
Expenses for
new members
only, post-
harvest visit
n/a 2a
(question 23)
if q23i>0
value=q23i
otherwise
value=q23a+q23b+q23c+q23d+
q23e+q23f+q23g+q23h
Educational
Expense for
original
household
members, post-
harvest visit
n/a 2b
(question 14)
if q14i>0
value=q14i
otherwise
value=q14a+q14b+q14c+q14d+
q14e+q14f+q14g+q14h
Education
Expenses,
post-planting
visit
2
(question 18)
n/a if q18i>0
value=q18i
otherwise
value=q18a+q18b+q18c+q18d+
q18e+q18f+q18g+q18h
Housing n/a 8
if sp8q4b=1 rent=sp8q4*12.
if sp8q4b=2 rent=sp8q4.
if sp8q25b=1 electricity=sp8q25*365.
if sp8q25b=2 electricity=sp8q25*365/7.
if sp8q25b=3 electricity=sp8q25*12.
if sp8q25b=4 electricity=sp8q25*1.
if sp8q30b=1 lphone=sp8q30*365.
if sp8q30b=2 lphone=sp8q30*365/7.
if sp8q30b=3 lphone=sp8q30*12.
if sp8q30b=4 lphone=sp8q30*1.
cphone=sp8q32*365/30
water=sp8q35*365/30.
garbdisp=sp8q39*365/30.
2These consumption aggregates were constructed to be similar to previous work done in Nigeria but new aggregates
will be available (check back on the website) that reflect international practice