Basic Figures: Flow of Funds for the Fourth Quarter of … 19, 2018 Research and Statistics...
17
June 27, 2018 Research and Statistics Department Bank of Japan Basic Figures Flow of Funds for the First Quarter of 2018 (Preliminary report)
Transcript of Basic Figures: Flow of Funds for the Fourth Quarter of … 19, 2018 Research and Statistics...
June 27, 2018Research and Statistics Department
Bank of Japan
Basic Figures
Flow of Funds for the First Quarter of 2018(Preliminary report)
Chart 1 Financial assets and liabilities by sector
Chart 2-1 Financial surplus and deficit by sector
Chart 2-2 Financial surplus and deficit of households and private nonfinancial corporations
Chart 3-1 Financial assets held by households
Chart 3-2 Financial assets held by households: Breakdown of debt securities,investment trust beneficiary certificates, equity, and insurance
Chart 4-1 Financial liabilities of private nonfinancial corporations
Chart 4-2 Financial assets held by private nonfinancial corporations
Chart 5 Breakdown of loans by private financial institutions
Chart 6-1 Financial liabilities of general government
Chart 6-2 Government bonds and treasury bills by holding sector
Reference 1 From-whom-to-whom of domestic debt securities
Reference 2 From-whom-to-whom of loans
Reference 3 Pension entitlements of corporate pensions (defined benefit schemes)and claims of pension funds on pension managers
Reference 4 Asset composition and pension entitlements of corporate pensions(defined benefit schemes)
Reference 5 Distributions of investment trusts
* Data used in this paper are available in the BOJ Time-Series Data Search .
Contents

Unit: trillion yen
Households (318) Households (1,829)
Others 17
(1,732)
Others 51
Loans 47
(1,178)
Others 320
Securities 418
Generalgovernment
(1,287) Others 500
Generalgovernment
(574)
Securities 208
Others 45 Others 340
Borrowings 151
Others 104 Others 262
Notes: 1. Major sectors and transaction items are selected to show the overview of the Flow of Funds Accounts.2.
3.
4.
Chart 1. Financial assets and liabilities by sector (end of March 2018)
<Domestic nonfinancial sector> <Financial institutions> <Domestic nonfinancial sector>
Depository corporations(including sole proprietorships) ( Banks, Collectively managed trusts ) (including sole proprietorships)
Privatenonfinancialcorporations Securities 430
Securities 295
Borrowings 392
Securities 92 Insurance, pensionand standardized
guarantees522
Insurance and pension funds
Borrowings 300
Loans 783
Deposits 1,468
Currency anddeposits
961
Securities 1,020 Insurance,pension andstandardizedguarantees
527
Central government, Local governments, and
Social security funds
Borrowings 159
Loans 475
Depositswith the
Fiscal LoanFund
32
(Of which: listed shares 582)
Central government,
Currency anddeposits
261
Other financial institutions
Securities investment trusts, Nonbanks,Public financial institutions,
Public captive financial institutions,and Financial dealers and brokers
Securities 377
Privatenonfinancialcorporations
Local governments, andSocial security funds
Securities 1,083
Deposits with theFiscal Loan Fund
26
Borrowings 247
Overseas (661) Overseas (972)
Securities 141Securities 460
The sum of the transaction items which are not shown individually is represented by Others in the above chart.
Loans 49 Currency 109
Loans 175
Securities 491Deposits withthe Bank of
Japan
Loans and borrowings include "Bank of Japan loans," "Call loans and bills," "Loans by private financial institutions," "Loans by public financialinstitutions," "Loans by the nonfinancial sector," "Installment credit," and "Repurchase agreement and securities lending transactions."Securities include "Equity and investment fund shares" and "Debt securities." The latter consists of "Central government securities and FILPbonds," "Bank debentures," "Industrial securities," "Trust beneficiary rights," etc. (Securities in external claims of Japan is "Outward investment insecurities.")
378
(External debts of Japan) (External claims of Japan)
Securities 381Central bank
Securities 559
<Overseas> <Overseas>
Liabilities (fund raising) Assets (investments)Assets Liabilities
Assets Liabilities
- 1 -

Chart 2-1. Financial surplus and deficit by sector
(1) Quarterly (seasonally adjusted)
(3) Fiscal year
(2) Calendar year
18.6
17.7
-10.0
-21.7
9.8
27.3
-20.3 -21.7
-60
-40
-20
0
20
40
60
06 07 08 09 10 11 12 13 14 15 16 17
(trillion yen)
Calendar year
(Financial surplus)
(Financial deficit)
Private nonfinancial corporationsHouseholds
OverseasGeneral government
-15
-10
-5
0
5
10
15
┗ 14 ┛ ┗ 1 5 ┛ ┗ 1 6 ┛ ┗ 1 7 ┛ 18
(trillion yen)
Calendar year
(Financial surplus)
(Financial deficit)
Households Private nonfinancial corporations
OverseasGeneral government
15.8
27.7
-16.9 -14.2
17.5
13.4
-20.8 -21.4
-60
-40
-20
0
20
40
60
05 06 07 08 09 10 11 12 13 14 15 16 17
(trillion yen)
Fiscal year
(Financial surplus)
(Financial deficit)
Households Private nonfinancial corporations
OverseasGeneral government
- 2 -

(日本)
(日本)
Notes: 1.
2.
Chart 2-2. Financial surplus and deficit of households and private nonfinancial corporations
(1) Financial surplus and deficit of households
(2) Financial surplus and deficit of private nonfinancial corporations
Loans by financial institutions are the sum of "Loans by private financial institutions" and "Loans by publicfinancial institutions" on the borrowing side.
Net financing in domestic securities is calculated as follows: investment in "Debt securities" and "Equity andinvestment fund shares" minus fund raising through these securities.
-60
-40
-20
0
20
40
60
05 06 07 08 09 10 11 12 13 14 15 16 17
(trillion yen)
FY
Others
Loans by financial institutions (repayment represents positive)
Outward direct investmentNet financing in domestic securities
Outward investment in securities
Currency and deposits
Financial surplus and dificit
-60
-40
-20
0
20
40
60
05 06 07 08 09 10 11 12 13 14 15 16 17
(trillion yen)
OthersInsurance, pension and standardized guaranteesLoans by financial institutions (repayment represents positive)Investment trustsEquityDebt securitiesCurrency and depositsFinancial surplus and deficit
FY
(trillion yen)
(trillion yen)
-60
-40
-20
0
20
40
60
Q216
Q3 Q4 Q117
Q2 Q3 Q4 Q118
-60
-40
-20
0
20
40
60
Q216
Q3 Q4 Q117
Q2 Q3 Q4 Q118
sum of the latest 4 quarters
sum of the latest 4 quarters
- 3 -

(図表4-3) 民間非金融法人の金融負債
Notes: 1.
2.
The sum of "Loans," "Financial derivatives and employee stock options," "Deposits money," "Trade credits andforeign trade credits," "Accounts receivable/payable," "Outward investment in securities," and "Others" in the Flow ofFunds Accounts is represented by Others in the above charts.
Chart 3-1. Financial assets held by households
(1) Amounts outstanding
(2) Changes from a year earlier
(3) Breakdown by component
The sum of "Non-life insurance technical reserves," "Life insurance reserves," and "Annuity entitlements" in the Flowof Funds Accounts is represented by insurance in the above charts.
-8
-6
-4
-2
0
2
4
6
8
┗ 0 6 ┛ ┗ 0 7 ┛ ┗ 0 8 ┛ ┗ 0 9 ┛ ┗ 1 0 ┛ ┗ 1 1 ┛ ┗ 1 2 ┛ ┗ 1 3 ┛ ┗ 1 4 ┛ ┗ 1 5 ┛ ┗ 1 6 ┛ ┗ 1 7 ┛ 18
Calendar year
Currency and deposits Debt securitiesInvestment trust beneficiary certificates EquityInsurance, pension and standardized guarantees OthersChanges from a year earlier
0
200
400
600
800
1,000
1,200
1,400
1,600
1,800
2,000
2,200
Q216
Q3 Q4 Q117
Q2 Q3 Q4 Q118
CY
(y/y % chg.)
0
200
400
600
800
1,000
1,200
1,400
1,600
1,800
2,000
2,200
04 05 06 07 08 09 10 11 12 13 14 15 16 17
(trillion yen)
FY
OthersInsurance, pension and standardized guaranteesEquityInvestment trust beneficiary certificatesDebt securitiesCurrency and deposits
(trillion yen)
2018
Q2 Q3 Q4 Q1 Q2 Q3 Q4 Q1
1,745 1,751 1,786 1,785 1,808 1,820 1,855 1,829
1 - 1.2 1.1 0.5 1.9 3.6 4.0 3.9 2.5 1,829 (100.0)
2 1.3 1.6 1.9 2.3 2.6 2.9 2.6 2.3 961 ( 52.5)
3 - 2.0 - 0.3 - 1.6 - 0.1 - 3.5 - 3.6 0.3 - 5.5 23 ( 1.3)
4 -18.3 - 9.2 - 6.5 - 1.9 7.0 8.1 4.5 1.4 73 ( 4.0)
5 -10.5 4.9 - 2.9 5.8 19.0 18.2 21.9 11.7 199 ( 10.9)
6 0.0 0.1 0.3 0.2 0.9 1.2 0.9 0.6 522 ( 28.5)
7 Of which: insurance 1.3 1.6 2.1 1.9 2.0 2.0 1.3 0.8 369 ( 20.2)
8 1.7 7.6 - 0.0 4.2 0.9 4.4 - 1.4 - 0.9 51 ( 2.8)
Amounts outstanding in March-end2018 in trillion yen
(percentage ratio in parentheses)
Amounts outstanding (End of period, t rillion yen)
20172016
Changes
(
%
)
Total assets
Currency and deposits
Debt securities
Investment trust beneficiary certificates
Equity
Insurance, pension and standardized guarantees
Others
- 4 -

Notes: 1.
2. The sum of "Non-life insurance technical reserves," "Life insurance reserves," and "Annuity entitlements" in the Flow ofFunds Accounts is represented by Insurance in the above charts.
Chart 3-2. Financial assets held by households: Breakdown of debt securities,
(1) Debt securities
(3) Equity (4) Insurance
investment trust beneficiary certificates, equity, and insurance
(2) Investment trust beneficiary certificates
Reconciliation is calculated as the difference of stock from the previous period minus the transaction flow of the relevantperiod.
-20
-10
0
10
20
┗ 14 ┛ ┗ 1 5 ┛ ┗ 1 6 ┛ ┗ 1 7 ┛ 18
Calendar year
Reconciliation
Transaction flow
Changes from a year earlier
(y/y % chg.)
-40
-20
0
20
40
┗ 14 ┛ ┗ 1 5 ┛ ┗ 1 6 ┛ ┗ 1 7 ┛ 18
Calendar year
Reconciliation
Transaction flow
Changes from a year earlier
(y/y % chg.)
-40
-20
0
20
40
┗ 14 ┛ ┗ 1 5 ┛ ┗ 1 6 ┛ ┗ 1 7 ┛ 18
Calendar year
Transaction flow
Reconciliation
Changes from a year earlier
(y/y % chg.)
-5
-4
-3
-2
-1
0
1
2
3
4
5
┗ 14 ┛ ┗ 1 5 ┛ ┗ 1 6 ┛ ┗ 1 7 ┛ 18
Calendar year
Reconciliation
Transaction flow
Changes from a year earlier
(y/y % chg.)
- 5 -

Notes: 1.
2.
(3) Breakdown by component
Chart 4-1. Financial liabilities of private nonfinancial corporations
(1) Amounts outstanding
(2) Changes from a year earlier
Figures are evaluated on either a book value or face value basis. They do not match the figures in Chart 1 whichare evaluated on a market value basis.The sum of "Insurance, pension and standardized guarantees," "Financial derivatives and employee stock options,""Accounts receivable/payable," "Other external claims and debts," and "Others" in the Flow of Funds Accounts isrepresented by Others in the above charts.
0
200
400
600
800
1,000
1,200
Q216
Q3 Q4 Q117
Q2 Q3 Q4 Q118CY
-8
-6
-4
-2
0
2
4
6
┗ 0 6 ┛┗ 0 7 ┛┗ 0 8 ┛┗ 0 9 ┛┗ 1 0 ┛┗ 1 1 ┛┗ 1 2 ┛┗ 1 3 ┛┗ 1 4 ┛┗ 1 5 ┛┗ 1 6 ┛┗ 1 7 ┛18
Calendar year
Loans Debt securities
Equity and investment fund shares Deposits money
Trade credits and foreign trade credits Others
Changes from a year earlier
(y/y % chg.)
0
200
400
600
800
1,000
1,200
04 05 06 07 08 09 10 11 12 13 14 15 16 17
(trillion yen)
FY
Loans Debt securities
Equity and investment fund shares Deposits money
Trade credits and foreign trade credits Others
(trillion yen)
2018
Q2 Q3 Q4 Q1 Q2 Q3 Q4 Q1
900 892 923 930 916 928 949 951
1 Total liabilities 0.8 0.1 0.4 1.4 1.7 4.0 2.8 2.2 951 (100.0)
2 Loans 2.9 3.3 3.4 3.9 3.8 3.5 2.6 0.6 395 ( 41.5)
3 Debt securities 3.0 3.9 7.1 8.3 6.3 7.9 8.3 7.4 69 ( 7.2)
4 Equity and investment fund shares - 0.8 - 0.9 - 0.7 - 0.1 - 0.4 - 0.0 0.6 0.0 168 ( 17.6)
5 Deposits money 0.1 0.8 - 0.9 0.8 0.1 - 0.0 2.1 - 0.6 41 ( 4.3)
6 Trade credits and foreign trade credits - 6.8 - 8.9 - 6.5 - 3.7 1.1 11.2 7.1 7.7 211 ( 22.2)
7 Others 14.9 6.2 1.4 0.9 - 5.8 - 2.3 - 8.2 - 1.6 67 ( 7.1)
Changes
(
%
)
Amounts outstanding in March-end2018 in trillion yen
(percentage rat io in parentheses)
Amounts outstanding (End of period, trillion yen)
2016 2017
- 6 -

(日本)
Note:
Chart 4-2. Financial assets held by private nonfinancial corporations
(1) Amounts outstanding
(2) Changes from a year earlier
(3) Breakdown by component
The sum of "Loans," "Investment trust beneficiary certificates," "Insurance, pension and standardized guarantees,""Financial derivatives and employee stock options," "Deposits money," "Accounts receivable/payable," "Otherexternal claims and debts," and "Others" in the Flow of Funds Accounts is represented by Others in the above charts.
0
200
400
600
800
1,000
1,200
1,400
04 05 06 07 08 09 10 11 12 13 14 15 16 17
Currency and deposits Debt securities
Equity Trade credits and foreign trade credits
Outward direct investment Outward investment in securities
Others
0
200
400
600
800
1,000
1,200
1,400
Q216
Q3 Q4 Q117
Q2 Q3 Q4 Q118
-20
-15
-10
-5
0
5
10
15
20
25
┗ 0 6 ┛┗ 0 7 ┛┗ 0 8 ┛┗ 0 9 ┛┗ 1 0 ┛┗ 1 1 ┛┗ 1 2 ┛┗ 1 3 ┛┗ 1 4 ┛┗ 1 5 ┛┗ 1 6 ┛┗ 1 7 ┛18
(y/y % chg.)
Currency and deposits Debt securities
Equity Trade credits and foreign trade credits
Outward direct investment Outward investment in securities
Others Changes from a year earlier
(trillion yen)
FY
Calendar year
(trillion yen)
CY
2018
Q2 Q3 Q4 Q1 Q2 Q3 Q4 Q1
992 1,003 1,055 1,086 1,104 1,139 1,196 1,178
1 Total assets - 4.0 0.9 0.2 4.0 11.3 13.6 13.3 8.5 1,178 (100.0)
2 Currency and deposits 6.8 6.3 6.5 5.6 5.3 6.3 5.1 3.8 261 ( 22.1)
3 Debt securities - 1.1 - 6.8 - 1.4 0.0 - 1.7 0.9 2.4 5.3 28 ( 2.4)
4 Equity -10.2 7.6 - 3.8 6.5 22.3 21.0 30.0 16.1 388 ( 32.9)
5 Trade credits and foreign trade credits - 5.6 - 6.9 - 4.7 - 1.8 3.1 11.1 7.6 7.1 238 ( 20.2)
6 Outward direct investment -10.6 - 7.3 2.4 6.2 19.0 20.7 10.8 8.6 123 ( 10.4)
7 Outward investment in securities 9.0 7.0 39.9 9.3 17.7 20.3 - 3.1 12.0 35 ( 3.0)
8 Others - 1.5 - 3.9 - 2.4 3.0 5.0 7.3 5.3 - 1.6 105 ( 8.9)
Amounts outstanding in March-end2018 in t rillion yen
(percentage rat io in parentheses)
Amounts outstanding (End of period, trillion yen)
Changes
(
%
)
2016 2017
- 7 -
Notes: 1.2.
3.
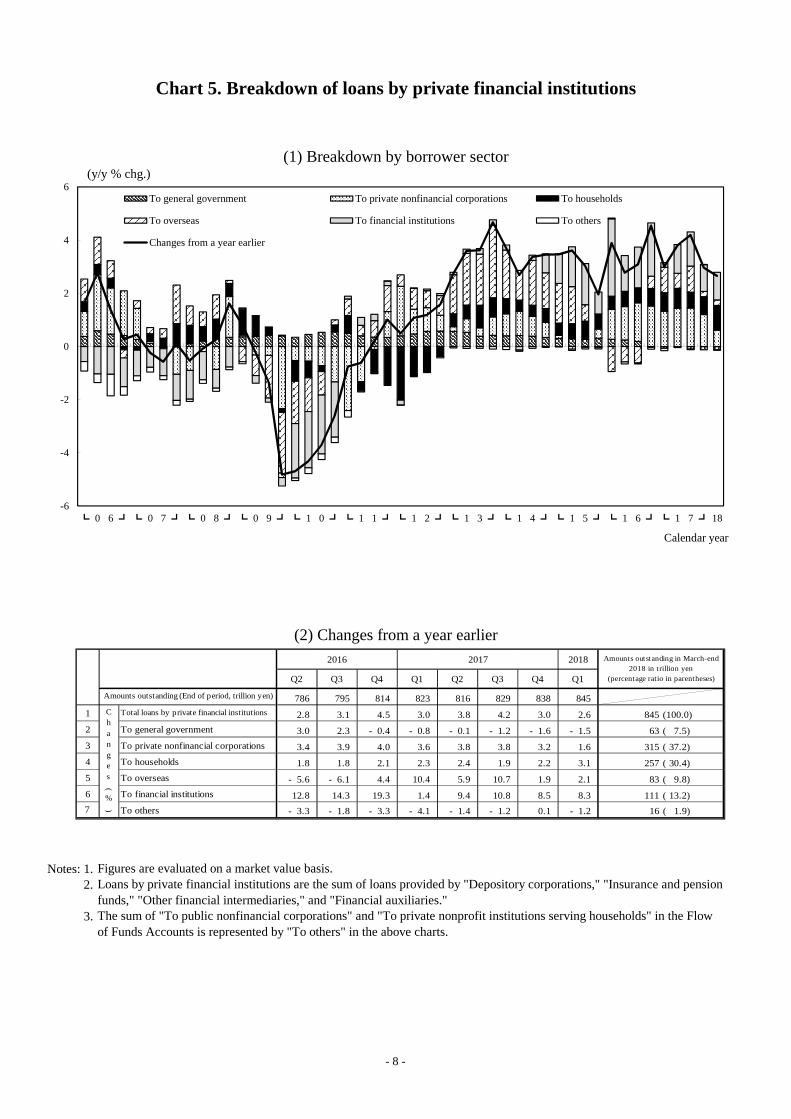
Chart 5. Breakdown of loans by private financial institutions
(1) Breakdown by borrower sector
(2) Changes from a year earlier
Figures are evaluated on a market value basis.Loans by private financial institutions are the sum of loans provided by "Depository corporations," "Insurance and pensionfunds," "Other financial intermediaries," and "Financial auxiliaries."The sum of "To public nonfinancial corporations" and "To private nonprofit institutions serving households" in the Flowof Funds Accounts is represented by "To others" in the above charts.
-6
-4
-2
0
2
4
6
┗ 0 6 ┛ ┗ 0 7 ┛ ┗ 0 8 ┛ ┗ 0 9 ┛ ┗ 1 0 ┛ ┗ 1 1 ┛ ┗ 1 2 ┛ ┗ 1 3 ┛ ┗ 1 4 ┛ ┗ 1 5 ┛ ┗ 1 6 ┛ ┗ 1 7 ┛ 18
To general government To private nonfinancial corporations To households
To overseas To financial institutions To others
Changes from a year earlier
Calendar year
(y/y % chg.)
2018
Q2 Q3 Q4 Q1 Q2 Q3 Q4 Q1
786 795 814 823 816 829 838 845
1 Total loans by private financial institutions 2.8 3.1 4.5 3.0 3.8 4.2 3.0 2.6 845 (100.0)
2 To general government 3.0 2.3 - 0.4 - 0.8 - 0.1 - 1.2 - 1.6 - 1.5 63 ( 7.5)
3 To private nonfinancial corporations 3.4 3.9 4.0 3.6 3.8 3.8 3.2 1.6 315 ( 37.2)
4 To households 1.8 1.8 2.1 2.3 2.4 1.9 2.2 3.1 257 ( 30.4)
5 To overseas - 5.6 - 6.1 4.4 10.4 5.9 10.7 1.9 2.1 83 ( 9.8)
6 To financial institutions 12.8 14.3 19.3 1.4 9.4 10.8 8.5 8.3 111 ( 13.2)
7 To others - 3.3 - 1.8 - 3.3 - 4.1 - 1.4 - 1.2 0.1 - 1.2 16 ( 1.9)
Amounts outstanding in March-end2018 in trillion yen
(percentage ratio in parentheses)
2016 2017
Amounts outstanding (End of period, trillion yen)
Changes
(
%
)
- 8 -

Notes: 1.
2.
3. The sum of "Loans by private financial institutions," "Loans by the nonfinancial sector," "Installment credit," "Repurchaseagreements and securities lending transactions," "Equity and investment fund shares," "Financial derivatives andemployee stock options," "Deposits money," "Trade credits and foreign trade credits," "Accounts receivable/payable,""Other external claims and debts," and "Others" in the Flow of Funds Accounts is represented by Others in the abovecharts.
Chart 6-1. Financial liabilities of general government
(1) Amounts outstanding
(2) Changes from a year earlier
Government bonds and treasury bills are the sum of "Treasury discount bills" and "Central government securities and FILPbonds" issued by "Central government" (in the general government sector).Debt securities other than Government bonds and treasury bills are equivalent to "Debt securities" less the amount ofGovernment bonds and treasury bills.
0
200
400
600
800
1,000
1,200
1,400
04 05 06 07 08 09 10 11 12 13 14 15 16 17
FY
Others
Loans by public financial institutions
Debt securities other than Government bonds and treasury bills
Government bonds and treasury bills
0
200
400
600
800
1,000
1,200
1,400
Q216
Q3 Q4 Q117
Q2 Q3 Q4 Q118CY
-4
-2
0
2
4
6
8
┗ 0 6 ┛┗ 0 7 ┛┗ 0 8 ┛┗ 0 9 ┛┗ 1 0 ┛┗ 1 1 ┛┗ 1 2 ┛┗ 1 3 ┛┗ 1 4 ┛┗ 1 5 ┛┗ 1 6 ┛┗ 1 7 ┛18
Calendar year
Government bonds and treasury bills
Debt securities other than Government bonds and treasury bills
Loans by public financial institutions
Others
Changes from a year earlier
(y/y % chg.)
(trillion yen) (trillion yen)
- 9 -

Notes: 1.
2. Others is the residual which is the remaining after deducting "Central bank," "Depository corporations,""Insurance and pension funds," "Public pensions," "Households," and "Overseas" from Total.
Chart 6-2. Government bonds and treasury bills by holding sector
(1) Amounts outstanding
(2) Changes from a year earlier
(3) Composition
Government bonds and treasury bills are the sum of "Treasury discount bills" and "Central governmentsecurities and FILP bonds." They include those issued by "Fiscal Loan Fund" (in the public financialinstitutions sector) together with those issued by "Central government" (in the general government sector).
0
200
400
600
800
1,000
1,200
Q216
Q3 Q4 Q117
Q2 Q3 Q4 Q118
(trillion yen)
0
200
400
600
800
1,000
1,200
04 05 06 07 08 09 10 11 12 13 14 15 16 17
(trillion yen)
FY
Overseas OthersHouseholds Public pensionsInsurance and pension funds Depository corporationsCentral bank
0
20
40
60
80
100
120
04 05 06 07 08 09 10 11 12 13 14 15 16 17
FY
Overseas OthersHouseholds Public pensionsInsurance and pension funds Depository corporationsCentral bank
(%)
0
20
40
60
80
100
120
Q216
Q3 Q4 Q117
Q2 Q3 Q4 Q118CY
(%)
CY
2018
Q2 Q3 Q4 Q1 Q2 Q3 Q4 Q1
1,108 1,097 1,084 1,084 1,086 1,088 1,093 1,097
1 6.1 4.8 4.0 0.4 - 2.0 - 0.8 0.9 1.2 1,097 (100.0)
2 Central bank 34.6 31.3 26.9 17.3 9.9 7.6 6.8 7.4 459 ( 41.8)
3 -15.7 -15.5 -13.1 -16.5 -15.4 -16.7 -13.0 - 8.7 188 ( 17.1)
4 Insurance and pension funds 10.0 6.1 3.2 - 3.4 - 7.5 - 4.3 - 1.7 - 1.2 239 ( 21.7)
5 Public pensions 1.4 - 2.5 - 5.5 - 8.0 -11.2 - 8.9 - 6.7 - 4.4 47 ( 4.3)
6 Households -15.4 -12.2 - 8.2 1.2 - 0.3 2.4 6.5 - 1.2 12 ( 1.1) 7 Overseas 17.7 13.2 5.9 5.5 4.8 5.0 6.5 2.5 120 ( 10.9)
8 Others -47.8 -50.2 -47.4 -26.6 -13.2 20.5 26.7 6.9 32 ( 3.0)
Amounts outstanding in March-end2018 in t rillion yen
(percentage rat io in parentheses)
Amounts outstanding (End of period, trillion yen)
Changes
(
%
)
Total
Depository corporations
2016 2017
- 10 -

(%)
Central bankDepository
corporationsInsurance andpension funds
Publicpensions
Households Overseas Others Total
3 13.51 36.35 18.21 7.77 2.94 3.97 17.24 100
6 13.06 36.53 18.10 7.80 3.21 4.58 16.72 100
9 13.09 36.75 18.27 7.93 3.41 4.32 16.23 100
12 12.99 36.93 18.45 8.09 3.51 4.38 15.65 100
3 12.11 37.47 18.66 8.04 3.64 4.38 15.70 100
6 10.93 37.89 18.97 8.14 3.81 5.18 15.09 100
9 10.47 37.84 19.33 8.33 4.06 5.06 14.91 100
12 10.35 37.92 19.46 8.54 4.16 5.44 14.13 100
3 9.83 37.84 19.81 8.81 4.25 5.87 13.59 100
6 9.04 38.75 19.96 8.98 4.33 5.46 13.48 100
9 9.36 38.08 20.05 9.36 4.50 6.46 12.20 100
12 9.06 37.16 19.97 9.70 4.48 7.61 12.00 100
3 8.48 37.31 19.99 9.76 4.40 7.34 12.72 100
6 8.12 38.25 20.25 10.18 4.39 7.96 10.86 100
9 8.31 37.46 20.51 10.30 4.44 8.55 10.43 100
12 7.98 39.62 20.47 10.37 4.37 6.83 10.35 100
3 8.11 40.03 21.04 10.13 4.37 6.94 9.40 100
6 8.18 41.25 20.89 9.91 4.24 6.75 8.78 100
9 8.43 41.85 21.01 9.75 4.19 6.38 8.39 100
12 8.81 42.21 21.01 9.60 4.10 5.97 8.30 100
3 8.82 42.58 21.31 9.19 4.01 5.57 8.52 100
6 8.74 41.63 21.05 8.79 3.79 6.02 9.98 100
9 8.89 41.16 21.19 8.70 3.69 6.63 9.75 100
12 8.81 41.96 21.13 8.50 3.60 6.45 9.55 100
3 8.88 42.06 21.18 8.32 3.43 7.04 9.10 100
6 8.98 40.91 21.03 7.94 3.24 7.50 10.40 100
9 9.28 39.84 21.19 7.74 3.06 8.35 10.53 100
12 9.90 40.81 21.56 7.70 2.95 8.50 8.57 100
3 9.60 41.84 22.10 7.58 2.88 8.31 7.70 100
6 10.16 40.44 21.98 7.26 2.73 8.67 8.76 100
9 10.98 38.99 22.15 7.06 2.55 9.04 9.22 100
12 11.94 38.21 22.02 6.94 2.43 8.56 9.90 100
3 13.12 38.32 23.11 7.18 2.34 8.42 7.52 100
6 15.31 35.65 22.63 7.15 2.25 8.37 8.64 100
9 17.23 34.93 22.81 7.10 2.13 8.00 7.80 100
12 18.48 33.84 22.74 7.01 2.06 8.45 7.40 100
3 20.05 32.68 22.86 6.73 2.00 8.14 7.55 100
6 21.13 31.63 22.57 6.51 1.90 8.27 7.98 100
9 22.84 31.07 22.72 6.21 1.79 8.57 6.79 100
12 24.95 29.79 23.14 5.66 1.67 9.07 5.72 100
3 26.31 28.31 22.59 5.24 1.52 9.36 6.66 100
6 28.28 27.09 22.44 5.10 1.39 9.11 6.59 100
9 30.09 25.49 22.41 5.09 1.30 9.62 6.00 100
12 31.79 23.77 22.60 5.09 1.22 10.43 5.11 100
3 33.77 22.89 23.17 4.94 1.15 10.26 3.83 100
6 35.88 21.52 23.27 4.87 1.11 10.11 3.24 100
9 37.69 20.55 22.69 4.73 1.09 10.39 2.85 100
12 38.80 19.86 22.43 4.63 1.07 10.63 2.58 100
3 39.43 19.03 22.29 4.52 1.16 10.78 2.80 100
6 40.23 18.58 21.96 4.41 1.13 10.81 2.87 100
9 40.91 17.26 21.88 4.35 1.12 11.01 3.47 100
12 41.11 17.14 21.87 4.28 1.13 11.23 3.25 100
2018 3 41.84 17.15 21.74 4.27 1.13 10.91 2.95 100
2017
2008
2012
2013
2014
(4) Time series data of composition
End of Month
2005
2006
2007
2016
2009
2010
2011
2015
- 11 -
March-end 2018(100 million yen)
Central bank Centralgovernment
Localgovernments
Social securityfunds
781,507 52,431 43,652 1,729 1,545 77,405 58,224 3,582 3,368 971,012
Short-term 103,102 20,574 18,609 0 0 6 0 0 0 121,717
Long-term 678,405 31,857 25,043 1,729 1,545 77,399 58,224 3,582 3,368 849,295
113,613 0 68,919 0 0 45 0 0 4,874 187,451
9,036,742 4,590,281 84,490 4,091 21,914 478,892 123,823 24,084 1,197,221 10,971,257
Short-term 412,518 217,490 0 23 0 0 0 0 601,910 1,014,451
Long-term 8,624,224 4,372,791 84,490 4,068 21,914 478,892 123,823 24,084 595,311 9,956,806
612,539 0 10,039 1,482 34,594 78,267 5,386 11,508 7,020 760,835
544,985 0 40,638 1,892 33,024 84,445 6,146 30,163 26,924 768,217
11,089,386 4,642,712 247,738 9,194 91,077 719,054 193,579 69,337 1,239,407 13,658,772
(100 million yen)
Central bank Centralgovernment
Localgovernments
Social securityfunds
-37,350 -1,040 -3,596 -1 0 -19 -2,810 -243 -229 -44,248
Short-term -30,599 -1,235 -2,091 0 0 1 0 0 0 -32,689
Long-term -6,751 195 -1,505 -1 0 -20 -2,810 -243 -229 -11,559
6,041 0 -2,081 0 0 -2 0 0 106 4,064
52,885 74,036 353 1,430 -1,428 324 -66 663 -30,486 23,675
Short-term -17,087 -3,764 0 -1 0 0 0 0 -10,290 -27,378
Long-term 69,972 77,800 353 1,431 -1,428 324 -66 663 -20,196 51,053
-735 0 -847 -10 571 -8 -258 -788 385 -1,690
-891 0 -113 -1 527 -18 10 591 1,133 1,238
19,950 72,996 -6,284 1,418 -330 277 -3,124 223 -29,091 -16,961
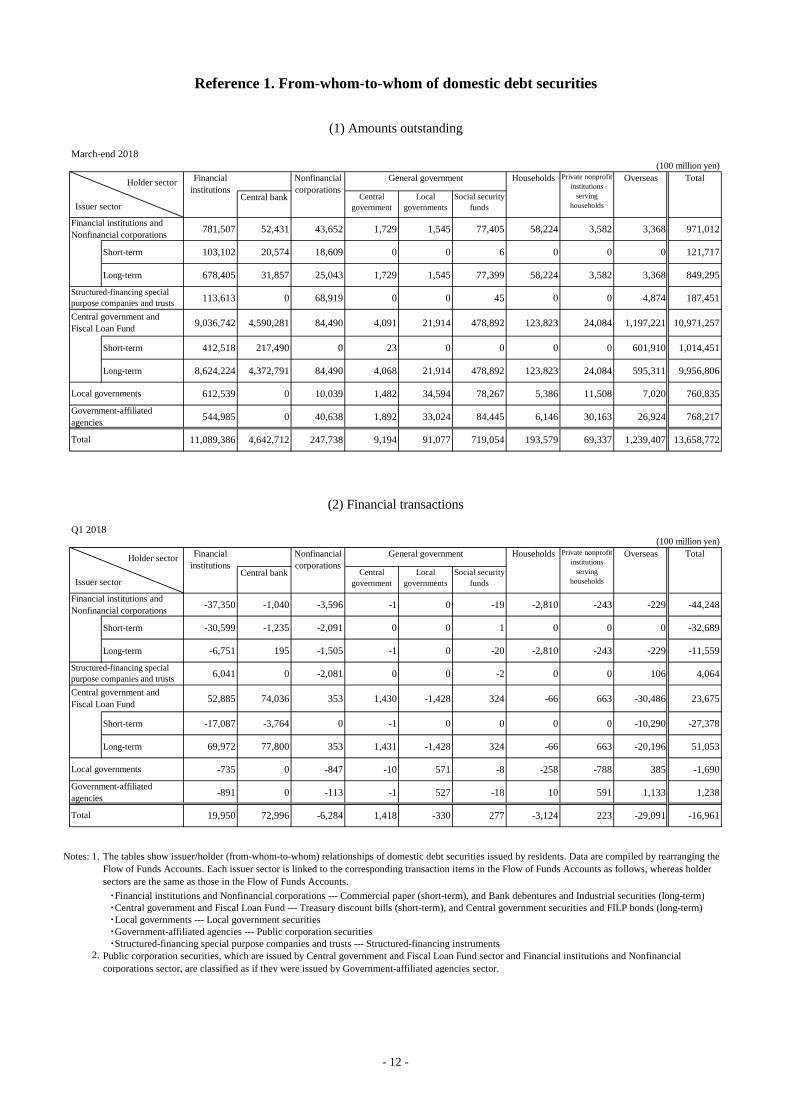
Notes: 1.
・Financial institutions and Nonfinancial corporations --- Commercial paper (short-term), and Bank debentures and Industrial securities (long-term) ・Central government and Fiscal Loan Fund --- Treasury discount bills (short-term), and Central government securities and FILP bonds (long-term) ・Local governments --- Local government securities ・Government-affiliated agencies --- Public corporation securities ・Structured-financing special purpose companies and trusts --- Structured-financing instruments
2.
Q1 2018
Financialinstitutions
Financialinstitutions
Local governments
Financial institutions andNonfinancial corporations
Structured-financing specialpurpose companies and trusts
Central government andFiscal Loan Fund
Government-affiliatedagencies
Total
(2) Financial transactions
Nonfinancialcorporations
Reference 1. From-whom-to-whom of domestic debt securities
(1) Amounts outstanding
Nonfinancialcorporations
General government Households Private nonprofitinstitutions
servinghouseholds
Overseas Total
General government Households Private nonprofitinstitutions
servinghouseholds
Overseas Total
The tables show issuer/holder (from-whom-to-whom) relationships of domestic debt securities issued by residents. Data are compiled by rearranging theFlow of Funds Accounts. Each issuer sector is linked to the corresponding transaction items in the Flow of Funds Accounts as follows, whereas holdersectors are the same as those in the Flow of Funds Accounts.
Public corporation securities, which are issued by Central government and Fiscal Loan Fund sector and Financial institutions and Nonfinancialcorporations sector, are classified as if they were issued by Government-affiliated agencies sector.
Government-affiliatedagencies
Total
Financial institutions andNonfinancial corporations
Structured-financing specialpurpose companies and trusts
Central government andFiscal Loan Fund
Local governments
Holder sector
Issuer sector
Holder sector
Issuer sector
- 12 -

March-end 2018
Financialinstitutions
Nonfinancialcorporations
Generalgovernment
HouseholdsPrivate nonprofit
institutions servinghouseholds
Overseas Total
2,057,386 3,791,670 1,558,368 2,953,817 138,937 1,053,683 11,553,861
488,786 0 0 0 0 0 488,786
859,304 2,867,971 674,033 2,285,552 100,566 756,522 7,543,948
80,267 186,046 70,167 71,771 995 7,234 416,480
447,467 737,610 814,168 596,172 37,376 264,595 2,897,388
Of which: public financial institutions 442,139 577,274 814,010 370,038 37,224 225,810 2,466,495
181,562 43 0 322 0 25,332 207,259
1,054,529 307,323 25,854 48,484 5,892 274,316 1,716,398
87,474 88,804 7,613 444 0 268,034 452,369
119,762 57,042 18,241 23,167 5,892 3,580 227,684
847,293 161,477 0 0 0 1,008,770
0 0 0 24,873 0 2,702 27,575
3,111,915 4,098,993 1,584,222 3,002,301 144,829 1,327,999 13,270,259
Notes: 1. Loans outstanding to "Government financial institutions" by "Public financial institutions" is 440,752 (100 million yen).2. "Other financial intermediaries," "Public financial institutions," and "Government financial institutions" include "Public captive financial institutions."
Financialinstitutions
Nonfinancialcorporations
Generalgovernment
HouseholdsPrivate nonprofit
institutions servinghouseholds
Overseas Total
105,114 45,245 -18,149 72,824 6,690 16,657 228,381
18,494 0 0 0 0 0 18,494
53,744 59,646 11,442 63,119 5,969 12,514 206,434
4,463 -11,703 -4,438 -2,258 -49 -433 -14,418
-391 -2,698 -25,153 11,963 770 4,576 -10,933
Of which: public financial institutions 1,014 2,612 -24,801 -3,174 744 -430 -24,035
28,804 0 0 0 0 0 28,804
-89,669 -37,703 -742 1,150 0 24,753 -102,211
-6,477 -45,558 0 0 0 24,288 -27,747
-11,692 -1,108 -742 0 0 390 -13,152
-71,500 8,963 0 0 0 -62,537
0 0 0 1,150 0 75 1,225
15,445 7,542 -18,891 73,974 6,690 41,410 126,170
Notes: 1. The change in loans to "Government financial institutions" by "Public financial institutions" is 1,732 (100 million yen).2. See note 2 of the above (1).
Central bank
Depository corporations
Insurance and pension funds
Other financial intermediaries
Reference 2. From-whom-to-whom of loans
(1) Amounts outstanding
(100 million yen)
Financial institutions
Financial auxiliaries
Nonfinancial sector
Other financial intermediaries
General government
Overseas
Households and Private nonprofitinstitutions serving households
Total
(2) Changes in amounts outstanding from March-end 2017 to March-end 2018
(100 million yen)
Nonfinancial corporations
Financial institutions
Central bank
Depository corporations
Insurance and pension funds
Total
Financial auxiliaries
Nonfinancial sector
Nonfinancial corporations
General government
Overseas
Households and Private nonprofitinstitutions serving households
Lender sector
Borrower sector
Lender sector
Borrower sector
- 13 -

Notes: 1.
2.
Reference 3. Pension entitlements of corporate pensions (defined benefit schemes) and claims of pension funds on pension managers
Amounts outstanding
Pension entitlements of defined benefit schemes up until FY2003 are the reference, calculated in the followingmethods:
FY2000-FY2003:
FY1993-FY1999:
"Pension entitlements of pension funds (b)" is a liability of defined benefit schemes and includes financialderivatives.
Retirement benefit obligations disclosed by the financial statements of individual listed companiesare aggregated. The figure is then multiplied by the ratio of pension assets of all companies tothose of listed companies.
For this period, among all pension schemes (employees' pension funds, tax-qualified retirementpension plans, and retirement lump sum grants), only figures of employees' pension funds wereavailable for retirement benefit obligations based on actuarial calculation.Hence, the estimates are conducted based on the above FY2000 figure of pension entitlements, bycarrying back year-on-year change of the retirement benefit obligations of employees' pensionfunds released by the Pension Fund Association (policy reserves are used for FY1993-FY1996).
0
50
100
150
200
93 94 95 96 97 98 99 00 01 02 03 04 05 06 07 08 09 10 11 12 13 14 15 16
(trillion yen)
FY
Pension entitlements of pension funds (b)
Assets of pension funds (a)
Claims of pension funds on pensionmanagers (b-a)
- 14 -
Note:
Notes: 1.
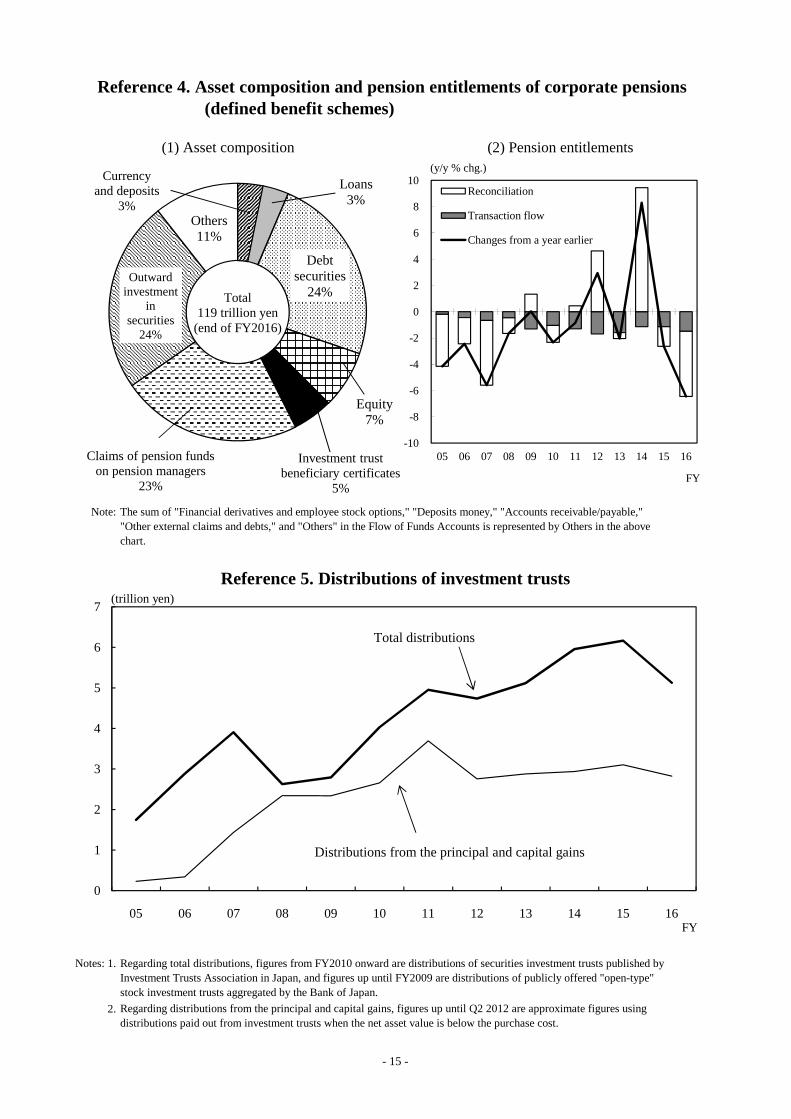
2. Regarding distributions from the principal and capital gains, figures up until Q2 2012 are approximate figures usingdistributions paid out from investment trusts when the net asset value is below the purchase cost.
The sum of "Financial derivatives and employee stock options," "Deposits money," "Accounts receivable/payable,""Other external claims and debts," and "Others" in the Flow of Funds Accounts is represented by Others in the abovechart.
Reference 4. Asset composition and pension entitlements of corporate pensions (defined benefit schemes)
(1) Asset composition (2) Pension entitlements
Reference 5. Distributions of investment trusts
Regarding total distributions, figures from FY2010 onward are distributions of securities investment trusts published byInvestment Trusts Association in Japan, and figures up until FY2009 are distributions of publicly offered "open-type"stock investment trusts aggregated by the Bank of Japan.
-10
-8
-6
-4
-2
0
2
4
6
8
10
05 06 07 08 09 10 11 12 13 14 15 16
FY
Reconciliation
Transaction flow
Changes from a year earlier
0
1
2
3
4
5
6
7
05 06 07 08 09 10 11 12 13 14 15 16FY
(trillion yen)
Total distributions
Distributions from the principal and capital gains
Loans3%
Debt securities
24%Outward
investment in
securities24%
Total119 trillion yen
(end of FY2016)
Currency and deposits
3%
Claims of pension funds on pension managers
23%
Investment trust beneficiary certificates
5%
Equity7%
(y/y % chg.)
Others11%
- 15 -