Baseline Vibration Testing for a Test Fixture
14
Research Institute Baseline Vibration Testing for a Test Fixture Greg Doud [email protected] Reliability and Failure Analysis Lab http://rfal.uah.edu
Transcript of Baseline Vibration Testing for a Test Fixture
Research Institute
Baseline Vibration Testing for a Test Fixture
Greg Doud [email protected]
Reliability and Failure Analysis Lab
http://rfal.uah.edu
Research Institute
Purpose
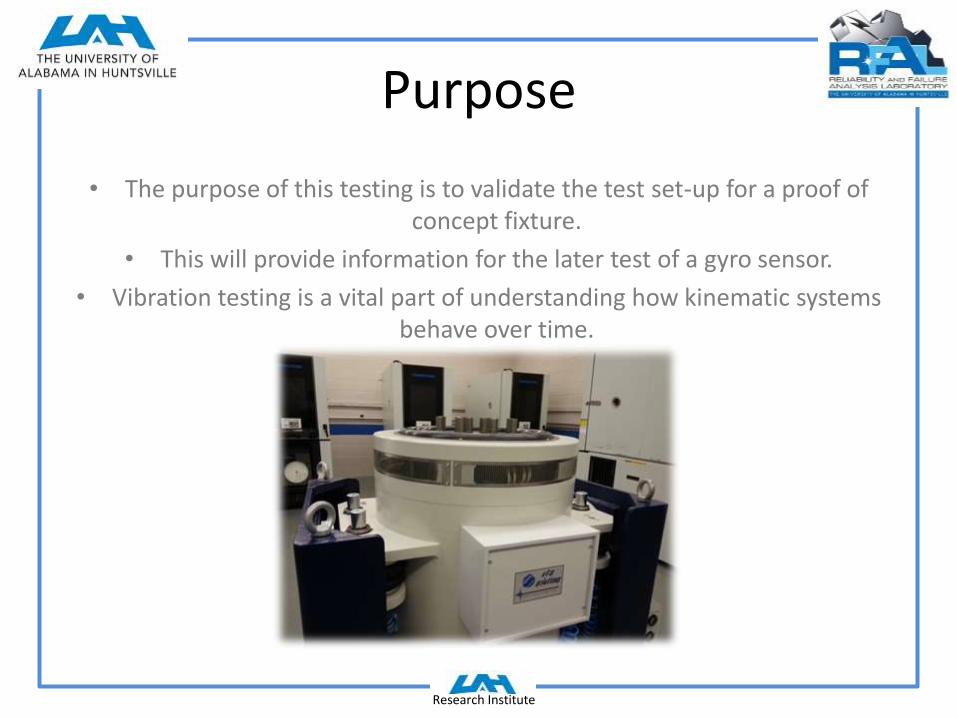
• The purpose of this testing is to validate the test set-up for a proof of concept fixture.
• This will provide information for the later test of a gyro sensor.
• Vibration testing is a vital part of understanding how kinematic systems behave over time.
Research Institute
Background
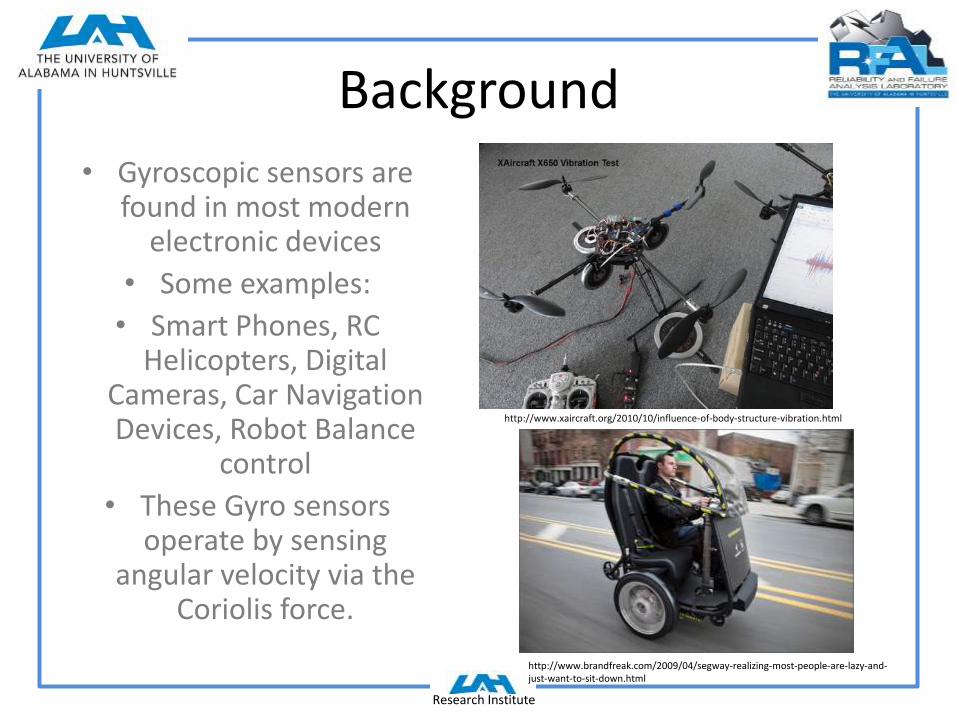
• Gyroscopic sensors are found in most modern
electronic devices
• Some examples:
• Smart Phones, RC Helicopters, Digital
Cameras, Car Navigation Devices, Robot Balance
control
• These Gyro sensors operate by sensing
angular velocity via the Coriolis force.
http://www.xaircraft.org/2010/10/influence-of-body-structure-vibration.html
http://www.brandfreak.com/2009/04/segway-realizing-most-people-are-lazy-and-just-want-to-sit-down.html
Research Institute
Theory • There are many types of gyro
sensors
• Main type uses piezoelectric crystal elements
• Piezoelectric devices operate via a phenomenon of crystals
• Output a potential difference with the application of a force
• The Stator is the piezoelectric
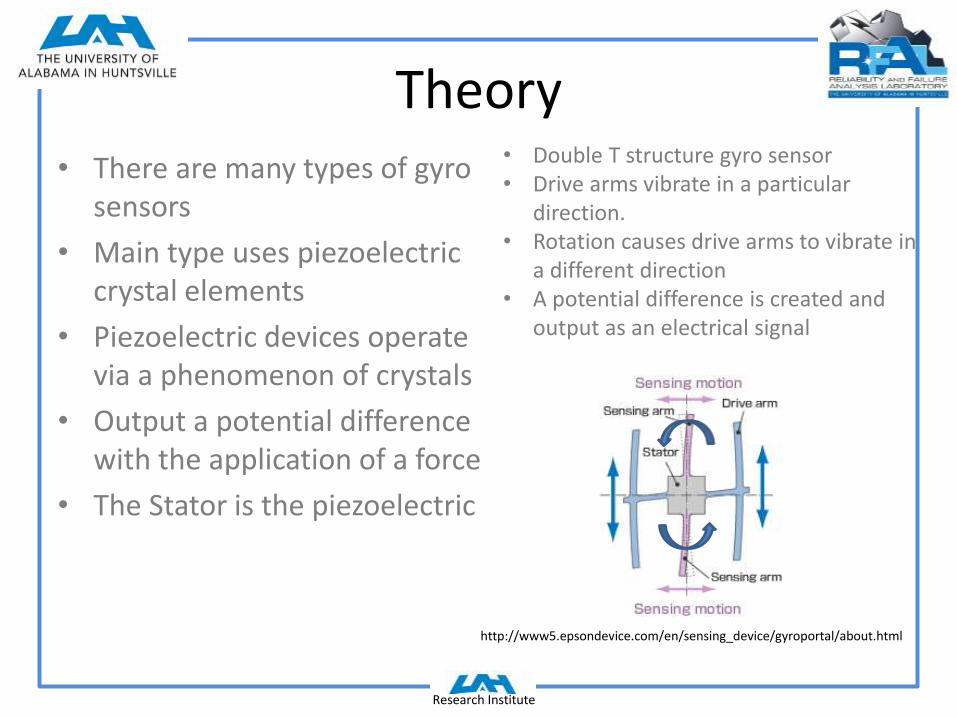
• Double T structure gyro sensor • Drive arms vibrate in a particular
direction. • Rotation causes drive arms to vibrate in
a different direction • A potential difference is created and
output as an electrical signal
http://www5.epsondevice.com/en/sensing_device/gyroportal/about.html

Research Institute
Test Plan
• To provide a baseline for design a fixture was created to mount a gyro sensor
• The fixture was created to solidly mount to a modal shaker
• It is important the stinger be mounted rigidly to the fixture
• Sensors mounted to the fixture use beeswax for mounting
• All vibration sensors are piezoelectric
Research Institute
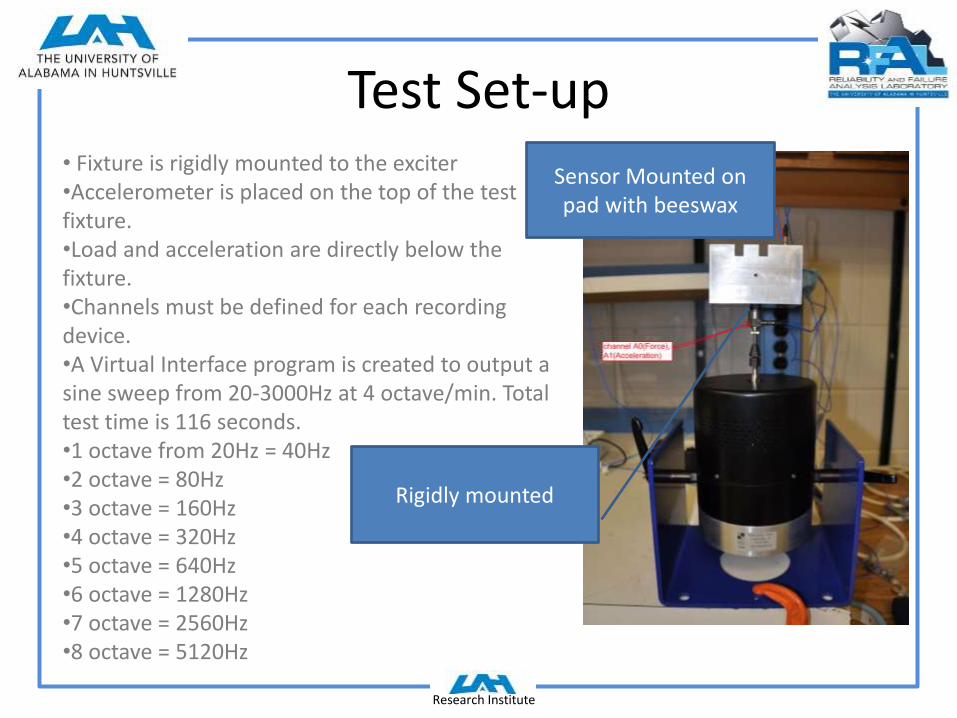
Test Set-up • Fixture is rigidly mounted to the exciter •Accelerometer is placed on the top of the test fixture. •Load and acceleration are directly below the fixture. •Channels must be defined for each recording device. •A Virtual Interface program is created to output a sine sweep from 20-3000Hz at 4 octave/min. Total test time is 116 seconds. •1 octave from 20Hz = 40Hz •2 octave = 80Hz •3 octave = 160Hz •4 octave = 320Hz •5 octave = 640Hz •6 octave = 1280Hz •7 octave = 2560Hz •8 octave = 5120Hz
Sensor Mounted on pad with beeswax
Rigidly mounted
Research Institute
Test Set-up
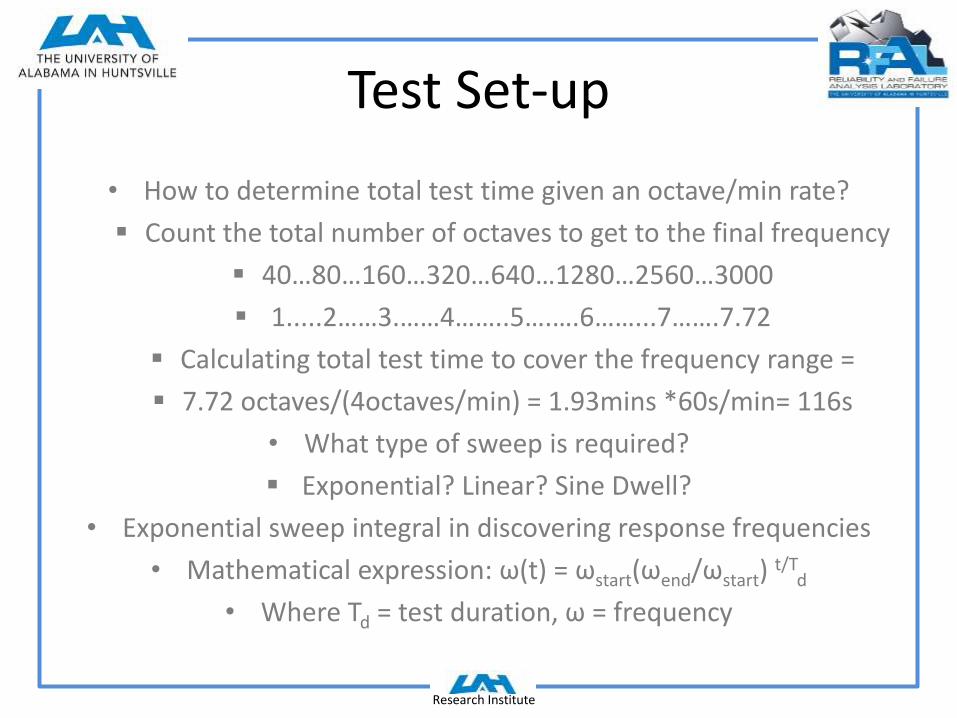
• How to determine total test time given an octave/min rate?
Count the total number of octaves to get to the final frequency
40…80…160…320…640…1280…2560…3000
1.....2……3.……4……..5….….6……...7…….7.72
Calculating total test time to cover the frequency range =
7.72 octaves/(4octaves/min) = 1.93mins *60s/min= 116s
• What type of sweep is required?
Exponential? Linear? Sine Dwell?
• Exponential sweep integral in discovering response frequencies
• Mathematical expression: ω(t) = ωstart(ωend/ωstart) t/T
d
• Where Td = test duration, ω = frequency
Research Institute
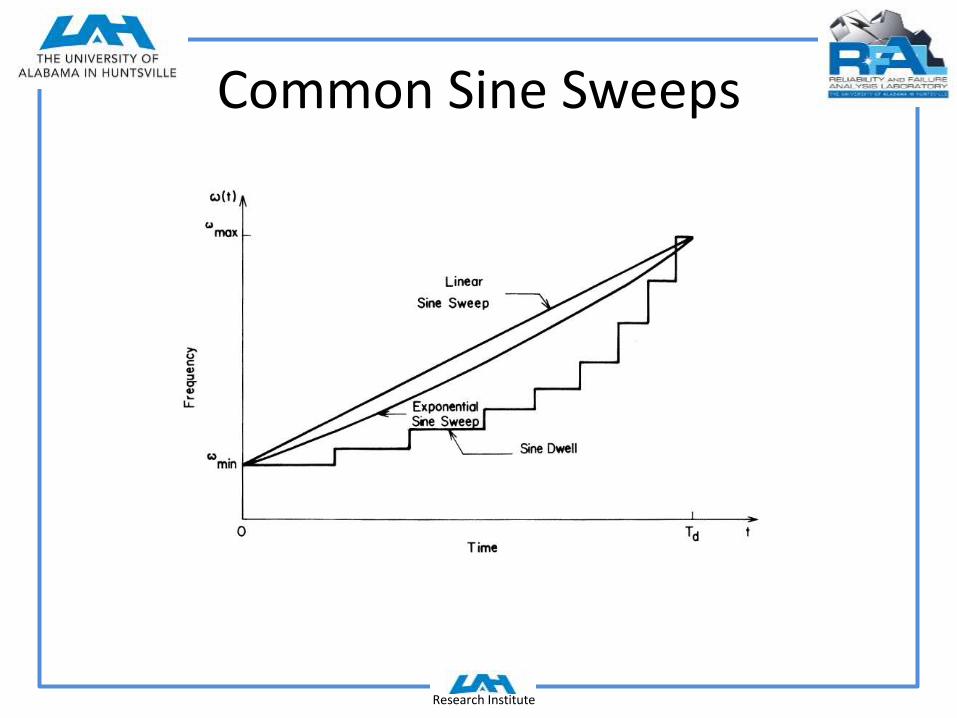
Common Sine Sweeps

Research Institute
Data Acquisition
• Data collected via National Instruments™ 9234 modules
• After data was collected it was analyzed and modified through Matlab®
• Signal is output in g’s and N per unit time
• Data is most often interpreted by amplitude of force vs. frequency applied through post processing of data
• Frequency response functions are found by applying FFT
Research Institute
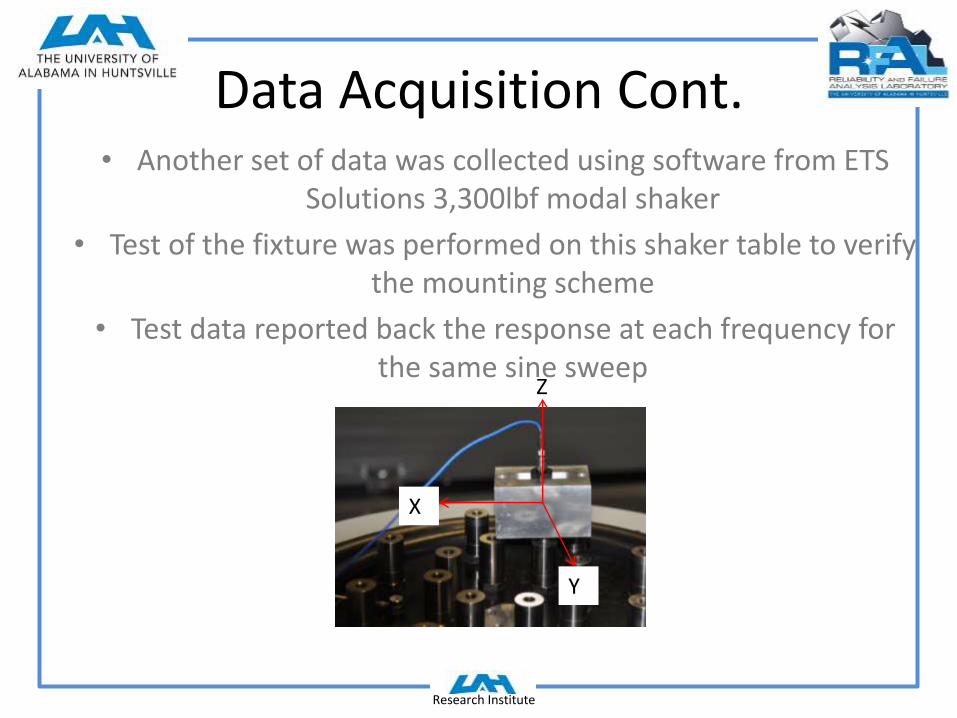
Data Acquisition Cont. • Another set of data was collected using software from ETS
Solutions 3,300lbf modal shaker
• Test of the fixture was performed on this shaker table to verify the mounting scheme
• Test data reported back the response at each frequency for the same sine sweep
Z
X
Y
Research Institute
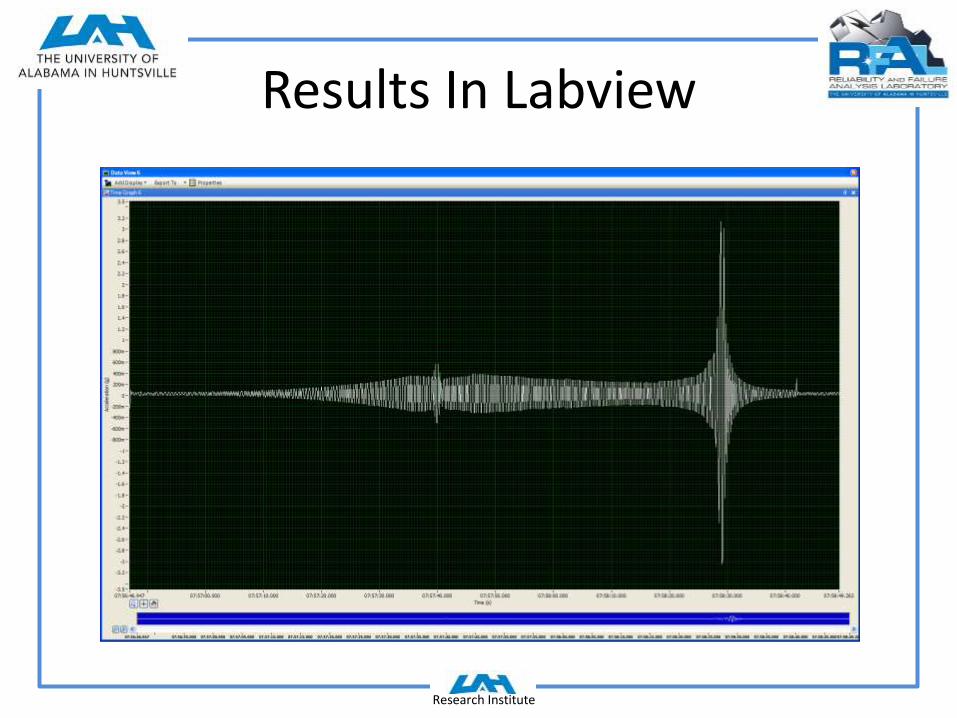
Results In Labview

Research Institute
Experimental Results
20 3000100 10000.2
2.0
1.0
Frequency (Hz)
Acce
lera
tio
n (
G p
ea
k)
Acceleration Profile
Demand
Control
• The first harmonic was seen in the fixture at 2200Hz

Research Institute
Conclusion
• Discussed some basics of vibration testing
• Why it is important to understand
• Example of a software and virtual interfaces
• Example of how to perform a test to determine frequency response of a fixture
Research Institute
Questions
?