Baseline Survey Final Report Compound 1-Edina Road ...pdf.usaid.gov/pdf_docs/PA00N4T7.pdf ·...
63
August 17, 2017 This publication was produced for review by the United States Agency for International Development (USAID). Prepared by Subah-Belleh Associates for Liberia Strategic Analysis (LSA). Disclaimer The author’s views expressed in this publication do not necessarily reflect the views of the united states agency for international development or the united states government. Baseline Survey Final Report Compound 1-Edina Road Rehabilitation Project
Transcript of Baseline Survey Final Report Compound 1-Edina Road ...pdf.usaid.gov/pdf_docs/PA00N4T7.pdf ·...

August 17, 2017 This publication was produced for review by the United States Agency for International Development
(USAID).
Prepared by Subah-Belleh Associates for Liberia Strategic Analysis (LSA).
Disclaimer
The author’s views expressed in this publication do not necessarily reflect the views of the
united states agency for international development or the united states government.
Baseline Survey Final Report
Compound 1-Edina Road Rehabilitation
Project

Table of Contents
List of Acronyms and Abbreviations ....................................................................................................................... 1
List of Tables ................................................................................................................................................................ 2
MAP of Compound 1-Edina Road Catchment Area ........................................................................................... 3
I. Executive Summary ............................................................................................................................................ 4
II. Introduction......................................................................................................................................................... 7
2.1. Background .................................................................................................................................................................. 7
2.2. USAID Program ......................................................................................................................................................... 7
2.3. Objective...................................................................................................................................................................... 7
2.4. Research/Study Questions ....................................................................................................................................... 8
III. Methodology ....................................................................................................................................................... 9
3.1. Design ........................................................................................................................................................................... 9
3.2. Sampling ....................................................................................................................................................................... 9
3.3. Survey Questionnaire and Enumeration ............................................................................................................ 10
Key Informant Interviews (KII) for Targeted Information ............................................................................................ 12
Focus Group Discussions (FGD) ......................................................................................................................................... 12
3.4. Secondary Data/Information Sources ................................................................................................................. 13
3.5. Limitations ................................................................................................................................................................. 13
IV. Findings, Conclusion and Recommendation .......................................................................................... 14
4.1. Demographic and Social Characteristics ............................................................................................................ 14
Human Settlement and Population Estimate .................................................................................. 14
Household Demographics .............................................................................................................. 14
Households Income and Sources of Income .................................................................................. 15
Households Expenditure ................................................................................................................ 16
Conclusions .................................................................................................................................... 19
4.2. Economic Characteristics of the Road Catchment Area ............................................................................... 19
Main Economic Activities ................................................................................................................ 19
Access to Markets .......................................................................................................................... 19
Business/Commerce in Area .......................................................................................................... 20
Conclusions .................................................................................................................................... 22
4.3. Transportation and Related Conditions............................................................................................................. 22
Traffic Count .................................................................................................................................. 22
Road Condition .............................................................................................................................. 23
Cost of Vehicle Operation ............................................................................................................. 24

Travel Time and Cost of Travel ..................................................................................................... 24
Conclusions .................................................................................................................................... 24
4.4. Standard Foreign Assistance Indicators .............................................................................................................. 24
Health .............................................................................................................................................. 25
Economic Growth .......................................................................................................................... 25
Education ........................................................................................................................................ 26
Democracy and Governance .......................................................................................................... 26
Recommendation .................................................................................................................................................................... 26
Annexes ....................................................................................................................................................................... 27
Annex I: Statement of Work ................................................................................................................................................ 27
Annex II: Data Collection Instruments .............................................................................................................................. 31
Annex III: Communities Visited and Data Collection Sources and Numbers Reached ......................................... 52
Annex IV: Mapping Data on All Communities in the Catchment Area ..................................................................... 54
Annex V. List of Agreed Foreign Assistance Indicators ................................................................................................. 58

1
List of Acronyms and Abbreviations
ANC Anti-Natal Care
CSPro Census and Survey Processing System
FGD Focus Group Discussions
FRAMP Feeder Roads Alternative and Maintenance Program
Km Kilometers
KII Key Informant Interviews
LSA Liberia Strategic Analysis
NGO Non-Governmental Organization
SBA Subah-Belleh Associates
SO Site Observation
SOW Scope of Work
USAID United States Agency for International Development
USG United States Government
FTF Feed the Future

2
List of Tables
Table 1:Initial Household Sample Distribution ....................................................................................... 10 Table 2: Sample Distribution for all Data Collection Components ....................................................... 12 Table 3: Demography Characteristics .................................................................................................... 15 Table 4: Household Income and Source of Income ............................................................................... 16 Table 5: Estimated Daily Household Expenditure .................................................................................. 16 Table 6: Household Expenditure ........................................................................................................... 17 Table 7: Characteristics of Housing Structures .................................................................................... 17 Table 8: Household Ownership of Assets ............................................................................................. 18 Table 9: Shop Ownership and Type and Source of Goods Sold ........................................................... 20 Table 10: Means of Transportation of Goods by Shopkeepers ............................................................. 21 Table 11: Daily Income from Shop Sales ............................................................................................... 21 Table 12: Number and % of HHs by Income Generated from Fishing ................................................. 21 Table 13: Average Daily Traffic Volume by Vehicle Type ...................................................................... 23 Table 14: Volume of Traffic by Type of Vehicle and Day of the Week ................................................ 23 Table 15: Average Monthly Vehicle Maintenance and Insurance Cost by Type of Vehicle ................... 24 Table 16: US Government Health indicators and their Baseline Values ............................................... 25 Table 17: US Government Economic Growth Indicators and their Baseline Values ............................ 25 Table 18: Government Education Indicators and their Baseline Values ............................................... 26 Table 19: Selected Governance Indicators and their Baseline Values .................................................. 26

3
Map of Compound 1-Edina Road Catchment Area

4
I. Executive Summary
Background
USAID/Liberia is currently assisting Liberia address some of its road challenges. USAID’s assistance to Liberia’s
rural road sector is the Feeder Roads Alternative and Maintenance Program (FRAMP). The program is currently
working with four counties to expand their capacities to meet annual planning, budgeting, procurement, and
reporting requirements to access resources from the Government of Liberia’s dedicated fund for road
maintenance and rehabilitation. The four counties are Bong, Lofa, Nimba and Grand Bassa. The program “is
funded with a mix of infrastructure, Food for Peace, and Feed the Future (FTF) resources”
Program activities include food and cash for work, rehabilitation of community infrastructure, contracting of
Liberian firms for the rehabilitation of specific road segments in the four counties, and quality assurance provided
by FRAMP. The rehabilitation of the Compound 1 – Edina road is one of the initial projects to be implemented
through awards to local contractors. This baseline survey was commissioned to identify indicators for impact
measurement of the project. This report presents the findings, conclusions, and recommendations of the survey.
1.1. Methodology
A mixed-methods approach was used for conducting the baseline survey. This meant implementing a variety of
methods and tasks, as required and informed by the objectives of the survey. Prominent among the activities
undertaken was the conduct of a one-day reconnaissance visit to the road, followed by a mapping exercise by a
team led by a cartographer with GPS expertise, literature reviews, training of field staff, pre-testing of survey
instruments, three-day traffic count exercise, interviews with 15 drivers, 30 passengers, 15 shop keepers, 15 key
informants, and 362 households. Sixteen (16) focus group discussants and some direct observations by the data
collection teams were also carried out.
The traffic counts were undertaken concurrently at five (5) points between the beginning and the end of the
road, including the junctions of two roads adjoining the main Compound 1-Edina Road for three consecutive
days, from 6 a.m. to 6 p.m. The third of the three days was a market day, when people from both inside and
outside of the catchment area converge at a specific market, located at Compound 1, to buy and sell goods,
including farm produce. Traffic is usually heaviest on market days.
The baseline data that was collected under this study has been organized into four main categories, based on
indicators the project seeks for measuring the impact of the road on the catchment area: social and demographic
indicators; economic indicators; transportation related indicators; and Standard Foreign Assistance Indicators
covering the thematic areas of health, education, democracy and governance, and economic growth.
1.2. Key Findings
Social and Demographic Characteristics: There are 64 towns and villages in the catchment area. Within
the 64 towns and villages are 1,214 dwelling units. Living within these dwelling units are 1,690 households,
containing a population of 8,654 persons. Average household size is 5.1 which compares favorably with the
national average of 5.2 persons per household. The Bassa tribe is the dominant ethnic group, while Christianity
is the predominant religious practice. Household’s ownership of durable consumer goods is low, although a
substantive number of household members owned mattresses and mobile phones.
Economic Characteristics: The main economic activities of the catchment area were farming (61% of
household members 16 and above) and fishing (14%), with hunting, handicraft making, charcoal production,
among others, representing the other economic activities. Fish produced in the road catchment area attract

5
commercial buyers from Monrovia, Buchanan, and other locations. The only market is located at Compound 1.
A new market has been constructed at Little Bassa, but is not yet commissioned for use. Most households
travelled at least 4 kilometers to access the market. More than half (53.3%) of households had members who
sold at the market.
Small trading enterprises (shops) and the selling of agricultural consumer produce were the predominant types
of business establishments in the area. Most of the shops were owned and operated by local businessmen. The
fish trade was active, but most transactions were informal, occurring on the beach as the canoes arrived from
fishing expeditions at sea. Most shops sold dry goods, with nearly half (46.7%) sourcing their goods from
Monrovia, followed by Buchanan (40%) and Harbel (13.3%), with nearly all (93.3%), using the project road to
transport their goods). Most shopkeepers (87%) said they earned between L$500 and L$3,000 daily from sales,
while 13 percent said they earned between L$3,001 and L$8,000 daily.
Transportation Related Characteristics: The Edina Road is narrow, sandy and muddy with potholes,
ditches, unsafe bridges which makes it difficult to navigate, especially during the rainy season. Traffic volume is
highest on the Compound #1 side of the road, followed by the Little Bassa primary road. Vehicle type most
common in the catchment area was motorcycle, which accounted for 81.3 percent of all vehicular movements
recorded. Traffic volume tended to be considerably higher on market days, accounting for 50.3% of all vehicular
movements recorded over the three days of recording, compared to non-market days (26.4% Day 1 and 23.3%
on Day 2), and particularly at Compound #1, where the market is located.
Bad road conditions negatively impact monthly vehicle maintenance costs, transportation fares, and travel time.
Most vehicles (80%) plying the route, as well as primary roads joining the road were not insured. Maintenance
costs for various vehicles recorded ranges from as low as L$150 to L$12,000 per month. Transportation fares
for various destinations along the road recorded ranges from L$50 to L$450. Travel time to and from various
places along the road recorded ranged from 15 minutes to over an hour.
Selected Standard Foreign Assistance Indicators:
Health
Eighty-three percent (83%) of households had no sanitary facilities (mainly latrines) or convenient access to one,
leaving 8 out of every 10 households to use the bushes and fields for excretal waste disposal. Additionally, nearly
all (92.5%)of households used unsafe means of solid waste disposal, the most common disposal practice (88.5%)
being dumping garbage into bushes, empty areas nearby, or in the swamps.
The primary sources of drinking water in the road catchment area were running creek water, open wells, and
hand pumps. There were only 10 hand pumps within the road catchment area. A slight majority of households
(50.3%) accessed their drinking water from protected sources such as public tap, tube well or boreholes, and
bottles or sachet water. However, access to adequate safe drinking water is a problem that concerned many,
including community leaders.
Economic Growth
An estimated 1,690 households and an estimated population of 8,654 persons will benefit from the rehabilitation
of the 35-km Compound 1-Edina Road. In fact, most believed that the road rehabilitation will benefit their
households and the broader community, with the most commonly expected benefits to be reduction on
transportation fares, increase flow of transportation, increased business activity, and increased access to basic
social services.
With respect to agriculture, approximately 56.6% of households owned farmland. However, only 12.7 percent
had deeds for their land; 37.6 percent did not. Twenty-two percent (22%) said they had customary titles to their
farmland. The rest either claimed ownership arrangement of one kind or the other or did not have any at all.

6
Approximately 46 percent of households owning farmland, cultivate their farmland by themselves. The main
crops are rice and cassava. Only 6.6 percent of households who owned farmland claimed that the farmland
occupied/owned by them was irrigated.
Education
There are five schools in the area: one Junior High School in Compound #1 and four primary schools: two
located in Little Bassa (one public, one private/religious), one in Kingsville, and one in Edina City. Access to
education is limited because of the small number of schools and the long distances that children travel to access
these schools. Additionally, there is generally a lack of qualified instructors, playgrounds, instructional materials,
libraries/reading rooms, and laboratories. As a result, the net primary school enrollment rate was estimated to
be under 50 percent.
1.3. Key Conclusions and Recommendation
Main Conclusions
The road catchment area is a sparsely populated, low-income region of Grand Bassa. Farming, fishing and petty
trade are the main economic activities of the people, incomes from these activities are, generally, low. With low
household incomes, poverty is widespread, with most households considering themselves to be either poor or
very poor. As mentioned earlier, the Edina Road is narrow, sandy and muddy with potholes, ditches, unsafe
bridges which makes it difficult to navigate, especially during the rainy season. Most transport service providers
and household members reported that the current conditions of the road were having a negative impact on the
cost of vehicle maintenance, transportation fares, and travel time.
The population is largely illiterate on account to low access to educational services. The quality of education is
also a major concern, especially with respect to the inadequacy of qualified teachers and educational materials.
Low access to health and safe drinking water and sanitation are impacting the wellbeing of the population. Most
households had at least one member sick in the month prior to the survey.
The low exposure of households to the media is instructive for a society that thrives on the “grapevine”. This is
not good for a democracy wanting an informed citizenry for peace and stability, as well as shared economic
growth and development.
Farming being the main economic activity in the area, the relatively low access of households to agriculture land
and improved methods of production and marketing is problematic and leaves the majority of the population
poor.
Despite these conditions, the population of the area and those who do business there expect the road to bring
change—in the level of access to basic social services and economic opportunities. The road will enhance trade,
increase income generating opportunities, reduce the cost of living for the residents.
Key Recommendations
1. In order to achieve the maximum impact from rehabilitating the Compound 1-Edina Road, the road linking
Buchanan to Upper Buchanan, which is linked to Edina by water transportation should also be rehabilitated.
The idea is that if people and goods can easily flow to and from Edina from Buchanan, then economic activities
will increase in the road catchment area. As it is right now, the flow is limited to Edina-Upper Buchanan and
not the more affluent, business active Buchanan City center due to the very bad road between Upper
Buchanan and Central Buchanan.

7
II. Introduction
2.1. Background
The poor condition of roads in Liberia is a major constraint to private sector investment, poverty reduction and
economic growth and development. (Liberia Constraints Analysis). The mileage of paved road in Liberia is limited
and most of the roads have deteriorated over the years because of the lack of sustained maintenance. Liberia’s
total length of primary and secondary roads is around 12,000 kilometers, which amounts to one of the lowest
road densities in the West African Sub-region. Poor road conditions in rural Liberia are increasing transportation
fares, vehicle maintenance costs, and compromising food production as farmers have limited access to markets.
USAID hypothesis that challenging road conditions also make it difficult for rural dwellers to access administrative
centers, health-care facilities, educational institutions, and goods and services from urban centers (Edina Road
Baseline RFP No. SI-01/17).
Road construction and sustained maintenance are expensive ventures. The situation is exacerbated with declining
public finances. Limited funds available for roads are usually allocated for the maintenance of tertiary roads,
leaving the rehabilitation and maintenance of farm-to-market roads unattended. To address these challenges, the
Legislature passed in 2016 a Road Maintenance Act, under which levies are placed on petroleum products and
excessive axle loads to raise money for road maintenance and rehabilitation. Funds are placed in a dedicated
fund for road maintenance (60 percent) and road rehabilitation (40 percent). The Fund is managed by a Road
Fund Manager situated in the Ministry of Finance and Development Planning (MFDP) (Edina Road Baseline RFP No.
SI-01/17).
2.2. USAID Program
The United States Government, through USAID, is currently assisting Liberia address some of its road challenges.
USAID’s assistance to Liberia’s rural road sector is the Feeder Roads Alternative and Maintenance program
(FRAMP). The program is currently working “with four counties to expand their capacities to meet annual
planning, budgeting, procurement, and reporting requirements to access resources from the Fund”. The four
counties are Bong, Lofa, Nimba and Grand Bassa. The program “is funded with a mix of infrastructure, Food for
Peace, and Feed the Future (FTF) resources” (Edina Road Baseline RFP No. SI-01/17).
Program activities include food and cash for work, rehabilitation of community infrastructures, contracting of
Liberian firms for the rehabilitation of specific road segments in the four counties, and quality assurance provided
by FRAMP. The rehabilitation of the Compound 1 – Edina road is one of the initial projects to be implemented
through awards to local contractors (Edina Road Baseline RFP No. SI-01/17).
2.3. Objective
The baseline survey was commissioned to provide comprehensive quantitative and qualitative data on
demographic, socio-economic and transportation-related conditions along the 35-km Compound 1 to Edina rural
road in Grand Bassa County. The ultimate purpose is to be able to measure the impact of USAID’s rural road
investments in this road. The road will be rehabilitated under USAID/Liberia’s Feeder Roads Alternative and
Maintenance Program (FRAMP).
USAID hypothesizes that road rehabilitation investments will improve access to markets, particularly for farmers,
reduce direct and indirect travel costs and time, increase economic activity, and increase social benefits (e.g.,
access to health care, increased educational attendance, voting, security). This baseline will also recommend
Standard Foreign Assistance Indicator(s) across each technical area (Health, Education, Democracy &
Governance, and Economic Growth that will measure the impact of roads.

8
The baseline survey gathered data on the community (towns and villages along and 5km off) the road, households
in these communities, and transportation and traffic situation on the 35km road.
2.4. Research/Study Questions
The Baseline survey will answer the following research questions.
1. What are the social and demographic characteristics of the road catchment area?
2. What are the economic characteristics of the road catchment area?
3. What are the transportation-related conditions of the road catchment area?
4. What Standard Foreign Assistance Indicator(s) and custom indicators across each technical area (Health,
Education, Democracy & Governance, Agriculture (Feed the Future)) will best measure the impact of the
roads? And, what are baseline values for the selected indicators?

9
III. Methodology
3.1. Design The baseline survey was undertaken using a mixed-methods approach--a combination of quantitative and
qualitative data collection methods, all designed to collect data to satisfy some key indicators that will be used
to measure the impact of the rehabilitated road on its catchment communities. Quantitative and qualitative field
data collection approaches included surveys, key informant interviews, and focus group discussions. They were
applied appropriately to (i) scoping/mapping surveys of the towns and villages in road catchment communities,
(ii) household surveys, (iii) settlement demographic surveys (mapping), (iv) shopkeeper/business surveys, (vi)
drivers‟ surveys, (vii) passenger surveys, and (viii) traffic counts. The results of the mapping exercise were used
to design the household survey, especially the sample size and overall sampling plan.
3.2. Sampling Population-Related Mapping Results
The mapping exercise covered the entire community along the length of the Compound 1-Edina Road and
involved among other things, the identification of all towns and villages up to 5km to the right of the road and
up to the banks of the St. John and Mechlin Rivers to the left side of the road. The results of the mapping exercise
relevant for the sampling design of the household survey include the number of towns and villages and their
populations and numbers of households. The number of towns and villages mapped totaled 64, with a total
population estimate of 8,654. The total number of households counted was 1,690.
Target Population and Sample Size
The household survey sample was drawn from the total number of households enumerated within the catchment
areas by the mapping exercise (1,690). To determine the sample size from this population, a sample size
estimation table (Israel, 2012)1 was used. This table provides the sample size for given population sizes based on
the desired margin of error. Thus, using the table (Israel, 2012), and considering our desired margin of error of
±5%, with a 95% confidence level, the appropriate representative sample size for a population of 1,690 (which
when rounded up to the nearest 1000), is 333. This is further adjusted to 350, which will increase the coverage,
validity, and precision of results of the household survey, as well as account for possible non-response.
Sampling Technique
The selection of the sample was done in two stages. At the first stage, settlements (towns/villages) were selected
from the list of towns and villages identified during the mapping exercise. The next stage was the selection of
households for interview.
Stage 1: At this stage, communities (towns/villages) were divided into three strata (Large, Medium, Small), based
on the numbers of households of the various towns and villages. When these strata are drawn up or demarcated,
the 350 samples will be proportionally allocated to them based on the cumulative size (number of all households)
of each stratum. This was determined, as follows:
1Israel, G D 2012, Determining Sample Size, University of Florida. Accessed December 3, 2016
<www.soc.uoc.gr/socmedia/papageo/.../samplesize/samplesize1.pdf>

10
Table 1:Initial Household Sample Distribution
Strata
Households and Sample Distribution
№ of
Localities Households Proportion Sample
Stratum 1 (Large) 8 722 43% 149
Stratum 2 (Medium) 18 564 33% 117
Stratum 3 (Small) 36 404 24% 84
All 62 1690 100% 350
Note that this mapping exercise was unable to gather information on 3 small
locations, including the Road Site Office and Gbayu, which has only 2 housing units
The selection of towns/villages for the survey was based on the following criteria:
• All towns in Stratum 1 were selected because of their large sizes.
• Towns/villages in Stratum 2 and Stratum 3 were randomly selected to ensure representation of the
catchment area.
The distribution of respondents among the selected towns and villages (sample) was based on a proportional-
to-size approach.
Stage 2: When a town or village was selected for the survey, household sample selection then involved the
selection of households for interview. To do a scientific selection process, as the survey team entered the
selected towns or villages, they canvassed to ascertain its demarcation and do a quick count of dwelling units to
enable them to determine valid skip pattern and establish a random start. These were established to select
dwelling units at first and then selecting households within selected units. In each dwelling unit selected, all
households were interviewed until the required interviews for the selected settlements (Towns or Villages) were
completed.
3.3. Survey Questionnaire and Enumeration
To answer the four (4) research questions, seven (7) different sets of questionnaires were developed in English
by the research team. The approved questionnaires were pre-tested in a field test on 29 March on the Krubono
Shop - Moulton Corner Road in Brewerville, just outside Monrovia. This road was selected for the pre-testing
because it was determined to be one of the few roads the research team could find in close proximity, that
possessed some of the same features of the Compound 1 – Edina Road:
• It was an unpaved bad road that needed rehabilitation;
• A good number of inhabitants lived along the road;
• It had limited access to health care and education services;
• It linked farmers to different market sites; and
• Transportation services available on the road were mostly motorcycles, though trucks and buses also ply
the route.
The baseline survey field work commenced with the conduct of a community mapping exercise, designed to
gather general information on the catchment area, including information on settlements, population, and
infrastructure, among others. The results of the mapping exercise were used to inform the sampling design of
the survey, especially the household survey. The actual field data collection then kicked off with the conduct of

11
three days orientation training for the selected data collectors. Following the training, the field teams were
deployed on April 18th. The training focused on assisting field staff to understand the various field instruments,
through thorough review and practice. The training was also designed to assist them to understand field
protocols, including community entry procedures, sample selection, the conduct of interviews, and enumerators’
and supervisors’ roles, responsibilities, conduct, and relationship in the field.
The survey team was composed of 26 individuals: One team leader, two supervisors, one surveyor, one survey
technician, two focus group discussion facilitators, four note takers, six enumerators, and ten traffic monitors.
The SBA project manager organized the field research team and provided the requisite technical and
administrative support needed to facilitate their work. The twenty-six (26) field staff were structured into 3
teams. One team of 9 persons was assigned the household interview component of the survey. The second team
of 10 carried out the traffic count, while the third team of 4 persons undertook the key informant interviews
and focus group discussions. Supervisors provided leadership for their assigned teams. They were also
responsible for coordination and liaison with FRAMP, MPW, and local government authorities, community
leaders, and other relevant entities in the road catchment area. The supervisors, in addition to reviewing the
work of enumerators daily and assisting them with technical problems, regularly consulted with the teams in
team meetings to identify general challenges and resolve any difficulties encountered. Field quality assurance staff,
including the project manager, provided overall guidance and support to the teams in the field. The work of the
field teams is reflected in the description of the following data collection activities:
o Settlement Mapping and Demographic Survey
This instrument was administered at the time of the mapping exercise. It collected general socio-demographic
information about the communities in the road catchment area: distance from and access to the road, population,
the availability and location of health facilities, schools, agricultural land, and amenities available in the area, roads,
bridges, etc. The settlement demographic survey instrument was administered to community leaders, traditional
authorities, religious leaders, women’s group leaders, youth representatives/leaders, health care providers,
teachers, district engineers, extension agents, and community volunteers.
o Household Survey
Because households are the basic socio-economic units of a community, they were targeted for questions
regarding socioeconomic condition of the population, through structured questionnaires, administered to heads
of households or senior members of households on employment status, wealth and assets, education, access to
health facilities, and mode of travel.
o Shopkeeper/Business Survey
In each community selected for sampling, shops and shopkeepers were targeted for interview. This is because
shopping is a major indicator of community economic activity and the situation of shop merchandise supply will
be a key indicator for measuring the utility of the road and transportation, as far as impact measurement of road
rehabilitation is concerned. Thus, using a shopkeeper questionnaire, information was collected from 15
shopkeepers on shop ownership, type of goods sold, and source of supply, type and cost of transportation of
goods from source to the shop.
o Driver Survey
Drivers were also targeted as respondents for the driver survey. Thirty (30) drivers were asked to provide
information on the frequency of travel on the road, normal routes of travel (full length of road or sections of
road), vehicle ownership, transportation fares, maintenance and other operational costs, income, and the current
organization and management of the transportation system on the road in terms of union and non-union activities
12
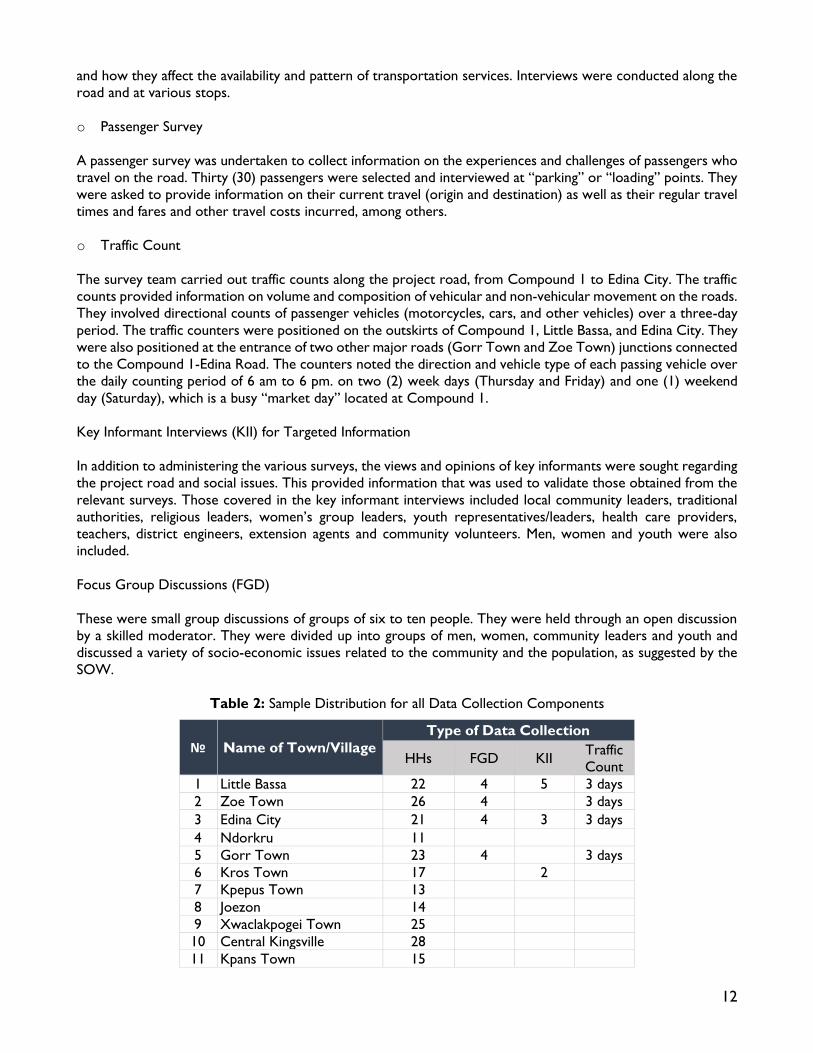
and how they affect the availability and pattern of transportation services. Interviews were conducted along the
road and at various stops.
o Passenger Survey
A passenger survey was undertaken to collect information on the experiences and challenges of passengers who
travel on the road. Thirty (30) passengers were selected and interviewed at “parking” or “loading” points. They
were asked to provide information on their current travel (origin and destination) as well as their regular travel
times and fares and other travel costs incurred, among others.
o Traffic Count
The survey team carried out traffic counts along the project road, from Compound 1 to Edina City. The traffic
counts provided information on volume and composition of vehicular and non-vehicular movement on the roads.
They involved directional counts of passenger vehicles (motorcycles, cars, and other vehicles) over a three-day
period. The traffic counters were positioned on the outskirts of Compound 1, Little Bassa, and Edina City. They
were also positioned at the entrance of two other major roads (Gorr Town and Zoe Town) junctions connected
to the Compound 1-Edina Road. The counters noted the direction and vehicle type of each passing vehicle over
the daily counting period of 6 am to 6 pm. on two (2) week days (Thursday and Friday) and one (1) weekend
day (Saturday), which is a busy “market day” located at Compound 1.
Key Informant Interviews (KII) for Targeted Information
In addition to administering the various surveys, the views and opinions of key informants were sought regarding
the project road and social issues. This provided information that was used to validate those obtained from the
relevant surveys. Those covered in the key informant interviews included local community leaders, traditional
authorities, religious leaders, women’s group leaders, youth representatives/leaders, health care providers,
teachers, district engineers, extension agents and community volunteers. Men, women and youth were also
included.
Focus Group Discussions (FGD)
These were small group discussions of groups of six to ten people. They were held through an open discussion
by a skilled moderator. They were divided up into groups of men, women, community leaders and youth and
discussed a variety of socio-economic issues related to the community and the population, as suggested by the
SOW.
Table 2: Sample Distribution for all Data Collection Components
№ Name of Town/Village
Type of Data Collection
HHs FGD KII Traffic
Count
1 Little Bassa 22 4 5 3 days
2 Zoe Town 26 4 3 days
3 Edina City 21 4 3 3 days
4 Ndorkru 11
5 Gorr Town 23 4 3 days
6 Kros Town 17 2
7 Kpepus Town 13
8 Joezon 14
9 Xwaclakpogei Town 25
10 Central Kingsville 28
11 Kpans Town 15

13
12 Pitos Town 24
13 Tarr’s Town 21
14 Varmah 8
15 Three Houses 12
16 Barkar 14 1
17 Barlakor 19 1
18 Central Edina 3
19 Duncan Town 7
20 Maleskore 3
21 Bobor Village 5
22 Juah’s Town 4
23 Troublegar Village 3
24 Noryou 24
25 Compound 1 3 3 days
Total 362 16 15 3 days
3.4. Secondary Data/Information Sources The design of the baseline survey, including the development of this report, was supported by numerous reviews
of secondary data/information, gained through literature reviews and observation. For instance, a reconnaissance
visit was made to the project area by the team during this inception period. This greatly assisted the research
team to properly conceptualize and contextualize the issues and plan and conduct the baseline survey, mainly
learning from the experiences of others. A prioritized list of key relevant documents required was drawn up by
the SBA team, many of which were obtained and reviewed.
3.5. Limitations A key factor to note with this baseline survey is that it actually commenced after the road rehabilitation work
had already begun. This was due to some inadvertent work planning and execution delays. This late start may
have affected the reliability of some baseline data since portions of the road were already improved, even though
most persons interviewed still considered the road to be “bad.”
In addition, the very short time committed to data collection, following the completion of the mapping exercise,
meant that the team had to collect data from a relatively small sample and did not allow for in-depth investigation
of some issues covered under the survey such as verification of information on farming, cattle ownership, etc.
as well as market investigation of trade information provided.

14
IV. Findings, Conclusion and Recommendation
4.1. Demographic and Social Characteristics
Human Settlement and Population Estimate
The settlement mapping exercise found that there were 64 settlements (towns and villages) in the catchment
area. These towns and villages are spread over 5 clans that make up the road catchment area. The clans include
Sonewein, Gbasohn, Gowengbo, Wenzohn, and Loveville.
The population of the catchment area was estimated to be 8,654. These are distributed among approximately
1,214 dwelling units and made up a total of 1,690 households, with an average household size of 5.1 (national
average is 5.2). The population estimates were developed by working with community authorities to review
updated records of the populations, which they maintain. Community authorities record the names of all
residents of the community and update such records as new people come in and others leave the community.
These records were sampled through random physical counts. In most instances, it was easy to count the number
of dwelling units and inquire about the number of people residing in each. Details of settlements and household
and population estimates of the road catchment area are presented in Annex IV.
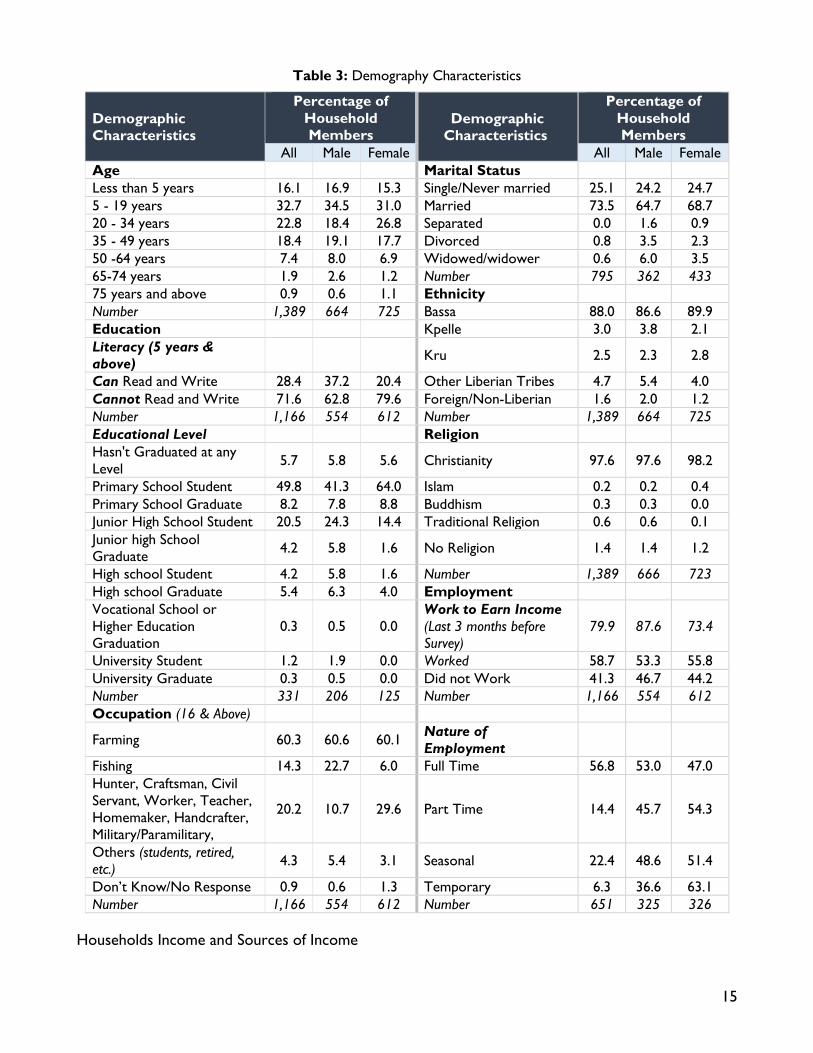
Household Demographics
The household survey was conducted with 362 households. A roster of all household members in each
household was generated during the interview. The demographic characteristics of the household population
covered in the survey are presented in Table 3. It shows that the 362 households contained a total population
of 1,389 persons, with more females (52%) than males (48%) and a youth population, with 72 percent of all
household members falling below the age of 35.
The predominant religion of household members was Christianity (98%), followed by “no religion” and Islam
(0.4%). To support this, there were a total of 12 churches and no other religious institutions in the area. In terms
of ethnicity, the Bassa Tribe dominated, with 88 percent of household members affiliated with this tribe. Next
to Bassa were the Kpelles, who accounted for 3 percent, followed by Kru (3%). Foreign/Non-Liberian tribes
made up 2 percent. The remaining 4 percent were scattered among other Liberian tribes in very small
proportions.
In terms of educational profile, only 28 percent (37.2% males and 20.4% females) of household members aged 5
and above could read and write (literate). The rest (72%) could not. Of those who could read and write, half
(50%) had only some primary school education, while 8.2% completed primary school. A further 20.5 percent
were junior high school students, with actual junior high graduates accounting for only 4.2 percent. Only 5.4
percent completed high school and 1 was college graduate.
The survey also gathered information on the employment status of household members aged 16 and above. The
results show that the main occupation of household members was farming (60.3%), followed by fishing (14.3%).
Others included hunters, craftsmen, civil servants, teachers, homemakers, charcoal producers, cane juice
producers and sellers, and commercial transport workers, among others. In terms of employment, most
individuals (80%) performed jobs that earned them income in the 3 months prior to the survey. Of these, over
half (57%) were full-time engagements, while close to a quarter (23%) were seasonal jobs. The rest were part-
time (14%) and temporary workers (6%).
15
Table 3: Demography Characteristics
Demographic
Characteristics
Percentage of
Household
Members Demographic
Characteristics
Percentage of
Household
Members
All Male Female All Male Female
Age Marital Status
Less than 5 years 16.1 16.9 15.3 Single/Never married 25.1 24.2 24.7
5 - 19 years 32.7 34.5 31.0 Married 73.5 64.7 68.7
20 - 34 years 22.8 18.4 26.8 Separated 0.0 1.6 0.9
35 - 49 years 18.4 19.1 17.7 Divorced 0.8 3.5 2.3
50 -64 years 7.4 8.0 6.9 Widowed/widower 0.6 6.0 3.5
65-74 years 1.9 2.6 1.2 Number 795 362 433
75 years and above 0.9 0.6 1.1 Ethnicity
Number 1,389 664 725 Bassa 88.0 86.6 89.9
Education Kpelle 3.0 3.8 2.1
Literacy (5 years &
above) Kru 2.5 2.3 2.8
Can Read and Write 28.4 37.2 20.4 Other Liberian Tribes 4.7 5.4 4.0
Cannot Read and Write 71.6 62.8 79.6 Foreign/Non-Liberian 1.6 2.0 1.2
Number 1,166 554 612 Number 1,389 664 725
Educational Level Religion
Hasn't Graduated at any
Level 5.7 5.8 5.6 Christianity 97.6 97.6 98.2
Primary School Student 49.8 41.3 64.0 Islam 0.2 0.2 0.4
Primary School Graduate 8.2 7.8 8.8 Buddhism 0.3 0.3 0.0
Junior High School Student 20.5 24.3 14.4 Traditional Religion 0.6 0.6 0.1
Junior high School
Graduate 4.2 5.8 1.6 No Religion 1.4 1.4 1.2
High school Student 4.2 5.8 1.6 Number 1,389 666 723
High school Graduate 5.4 6.3 4.0 Employment
Vocational School or
Higher Education
Graduation
0.3 0.5 0.0
Work to Earn Income
(Last 3 months before
Survey)
79.9 87.6 73.4
University Student 1.2 1.9 0.0 Worked 58.7 53.3 55.8
University Graduate 0.3 0.5 0.0 Did not Work 41.3 46.7 44.2
Number 331 206 125 Number 1,166 554 612
Occupation (16 & Above)
Farming 60.3 60.6 60.1 Nature of
Employment
Fishing 14.3 22.7 6.0 Full Time 56.8 53.0 47.0
Hunter, Craftsman, Civil
Servant, Worker, Teacher,
Homemaker, Handcrafter,
Military/Paramilitary,
20.2 10.7 29.6 Part Time 14.4 45.7 54.3
Others (students, retired,
etc.) 4.3 5.4 3.1 Seasonal 22.4 48.6 51.4
Don’t Know/No Response 0.9 0.6 1.3 Temporary 6.3 36.6 63.1
Number 1,166 554 612 Number 651 325 326
Households Income and Sources of Income

16
Household income was found to be generally low. Most households (58.3%) received between L$100 and
L$5,000 a month. Slightly over a fourth (26.4%) received between L$5,001 and L$ 10,000 per month, while a
little more than 12 percent recalled receiving between L$10,001 and L$20,000. Only 2.8 percent received over
L$20,000, mostly from farming, trading, and fishing. The average monthly household income was calculated to
be L$10,978.30. However, this number is inflated by the estimated 15 percent of households that received over
L$10,000, since most households (58.3%) received between L$100 and L$5000/month As Table 4 shows, the
most common source of income for the majority of households (close to 55%) was farming. Next to farming
was fishing (17.8%), trading (11.1%), and others, including the sale of coal and other locally-produced non-
agricultural products (6.7%).
. .
Table 4: Household Income and Source of Income
Source of Income
Income Range (in L$)
100-
1,000
1,001-
5,000
5,001-
10,000
10,001-
15,000
15,001-
20,000 20,000+ Total %
Farming 18 105 48 15 7 4 197 54.7
Fishing 7 30 18 2 4 3 64 17.8
Trading 4 18 10 5 0 3 40 11.1
Wage/salary 0 4 7 2 2 0 15 4.2
Assistance of relatives 4 6 0 0 0 0 10 2.8
Wood and wood
products 0 1 3 1 1 0 6 1.7
In-kind aids from the
government and Others 0 4 0 0 0 0 4 1.1
Others 2 7 9 5 1 0 24 6.7
Total 35 175 95 30 15 10 360 100.0
% 9.7 48.6 26.4 8.3 4.2 2.8 100.0
No response 2
Households Expenditure
Household expenditure information was collected from all households to determine the value of their
consumption and ultimately their level of poverty, even though 59 percent of households interviewed considered
themselves poor or very poor. Table 5 presents the value of daily expenditure reported by households
interviewed. It shows that the largest proportion of households (74.3%) spent between L$0.00 and L$250/day
on household expenditures. In fact, slightly over 90 percent of all households spent between nothing and
L$350/day. Only a small proportion of households spent close to L$500 and above.
Table 5: Estimated Daily Household Expenditure
Expenditure
Range
(in L$)
№ of
Households %
Accumulated and Average Expenditure
Accumulated
Amount (L$) Average
In US$
(US$1: L$110)
0.00 – 75.00 17 4.8 893.33 52.55 0.48
80.00 – 150.00 93 25.6 12,211.67 131.31 1.19
155.00 – 250.00 159 43.9 33,688.33 211.88 1.93
255.00– 350.00 58 15.9 17,676.67 304.77 2.77
355.00– 450.00 18 5.0 7,395.00 410.83 3.73

17
455.00 - 650.00 13 3.7 7,016.67 539.74 4.91
655.00– 850.00 2 0.6 1,500.00 750.00 6.82
More than 855.00 2 0.6 2,833.33 1,416.67 12.88
Total 362 100.0 83,215.00 229.88 2.09
All households (100%) obviously spent portions of their income on food/meals, with most (78%) spending at
least L$155 daily. In terms of the number of households spending their income, Table 6 shows that transportation
came next to meals, with 83 percent claiming to spend on transportation, most of whom (93%) claimed to spend
at least $155 daily whenever a member of the household utilized transportation services. Over two-thirds spent
on healthcare. However, less than a third (32.3%) spent on education, even though 62 percent of households
have children of school-going age (5 to 17 years).
Table 6: Household Expenditure
Items
Households Estimated Range of Daily
Expenditure (L$)
№ % $5-75 L$80-
150
L$155 &
Above
Meal 362 100.0 1.1 21.0 77.9
Leisure 111 30.9 29.7 29.7 40.5
Transportation 300 82.9 2.3 4.7 93.0
Health 243 67.1 11.6 9.5 79.9
Education 117 32.3 1.7 2.6 95.7
Housing Condition
Housing Ownership and Structure. Seventy-one percent (71%) of households owned the houses they lived in,
free of mortgage or loan, while 3.3 percent owned the houses through loan or mortgage of some kind and 2.8
percent were paying rent for their houses. On the other hand, close to 23 percent of households did not own
the units they lived in, but lived in them free of charge, including rent. Most structures (59%) occupied by
households were semi-permanent structures (walls of dirt bricks with metal roofs), while 40 percent lived in
temporary structures (walls of stick and mud with straw/grass roof). Only 1.4 percent lived in permanent
structures (concrete walls, floors & metal roofs).
Rooms and Amenities. Houses occupied by households had between 1 and 8 rooms. However, most (close
to 62%) had between 1 and 3 rooms and a quarter (25%) had 4 rooms. Only 13.3 percent of all structures had
more than 4, or between 5 and 8, rooms.
Table 7: Characteristics of Housing Structures
Characteristics/Feature of Housing Structure % of Households
(n=262)
Ownership of Structure
Owned by household free and clear 71.0
Owned by household with a mortgage or loan? 3.3
Rented for cash rent? 2.8
Occupied without payment of cash rent 22.9
100.0
Type of Structure
Permanent (Concrete wall, floor & metal roof) 1.4

18
Characteristics/Feature of Housing Structure % of Households
(n=262)
vSemi-permanent (Dirt/bricks walls & metal
roof) 58.6
Temporary (Dirt/bricks walls & straw/grass roof) 40.1
100.0
Rooms
1-2 Rooms 29.2
3 Rooms 32.6
4 Rooms 24.9
More than 4 (5-8) 13.3
100.0
Amenities
Living Room 23.2
Bathroom 1.1
Kitchen 1.7
Pipe-borne Water 0.3
Flush/Pour-Flush Toilet 0.6
Electricity 1.9
28.8
Household Assets
Household assets provide an important measure of economic wellbeing. They can also provide individuals and
families with security and the capacity to increase their living standards, due to their financial and economic value.
Accordingly, the survey sought to gather information on the ownership of basic household assets (consumption
and production) by households covered in the survey. Table 8 presents a list of these assets, as indicated by the
households. As shown in the table, households owned a variety of various basic household assets—both
consumption and production assets. Eating utensils (99%, cooking utensils (98%), water containers (81%),
mattresses (70%), chairs (54%), mobile phones (42%), and tape recorders were the most commonly owned
household assets.
With regards to production assets, household ownership was found to be very low. Only five households (1.4%)
owned sugar cane mills, which are used for the production of the local brew (spirit) called cane juice. Another
five households owned power saws, while one (0.3%) owned a rice mill.
Table 8: Household Ownership of Assets
Name of Asset
Household Ownership
№ of
Households
% of
Households
Consumption
Eating Utensils-Dishes 358 98.9
Cooking Utensils 356 98.3
Water Containers 295 81.5
Mattress 252 69.6
Chairs 194 53.6
Tables 180 49.7
Mobile Phone 153 42.3
Radio/Tape Recorder 116 32.0

19
Name of Asset
Household Ownership
№ of
Households
% of
Households
Bed 60 16.6
Another House 45 12.4
Motorbikes 22 6.1
Wheelbarrow 14 3.9
Generator 10 2.8
Television 9 2.5
Bicycle 7 1.9
DVD Player 5 1.4
DSTV 3 0.8
Refrigerator 2 0.6
Car 2 0.6
Production Assets
Sugar Cane Mil 5 1.4
Power Saw 5 1.4
Rice mill 1 0.3
Cassava Grinder 0 0.0
Tractor 0 0.0
Conclusions
The Edina Road Catchment area is a sparsely populated, low income region of Grand Bassa, with a youthful
population. The low-income status of the area is reflected in the fact that the predominant activity of the people
is farming, most of which is for subsistence. Poverty and economic challenges are exacerbated by the low
educational profile and access to education. However, there are economic potentials that can increase household
income and wealth such as improvements in education, access to markets, and improved production technology
and business skills.
4.2. Economic Characteristics of the Road Catchment Area
Main Economic Activities
As already indicated, farming and fishing are the main economic activities of the road catchment area. While
most households engaged in farming, the fish trade in the area attracted commercial buyers from as far as
Monrovia and Buchanan. Buyers from Monrovia included fish sellers themselves, who would stay over for days
to buy fresh and dried fish for sale mostly in markets in Monrovia, Harbel, and Buchanan. Little Bassa was
identified to be the most active center of the fish trade. Farming activities were scattered across the entire area.
Access to Markets
Daily markets, where buyers and sellers meet and exchange goods, were non-existent in the catchment area
along the entire length of the 35-km road. The only accessible market was at Compound 1. It is a weekly market,
held on Saturdays. Most households surveyed in the road catchment area attended this one-day weekly market.
However, most have to travel at least 4 kilometers to access this market. Notwithstanding the existence of only
one (weekly) market on the outskirts of the road catchment area, there are shops and mini-market stalls in
virtually every locality in the area, the most active being in Little Bassa, where a new market has also been
constructed, but is yet to be commissioned.

20
Slightly more than half (53.3%) of households had members who sold in the weekly market regularly or
occasionally. The most common commodities sold were rice, cassava, vegetables, fish, and local brew (palm wine
and cane juice).
Business/Commerce in Area
Type and Ownership of Shops
Small trading enterprises (shops) and the selling of agricultural consumer produce were the predominant types
of business establishments in the area. Most shops were owned by those managing them (93%) and they resided
close to their shops. Most of the owners were men (80%), with women owning the remaining 20 percent.
The fish business, on the other hand, is active, but not housed in any formal sale infrastructure. Most transactions
are done on the beach, when the canoes arrive from sea. Only a small portion is brought to town and sold. Even
when this is done, it is likely at the home of the fisherman or the sponsor of the fishing expedition. A typical
fishing trip overnight will fetch 3 to 4 bags of fish.
Type and Sources of Goods Sold
The shops sold a variety of goods, but the most common was “dry goods” (food and non-food items). However,
shops selling food items exclusively accounted for 20 percent, a mixture of food and non-food items (40%), and
other goods, including gasoline and vehicle oil (27%), and drinks only (6.7%). The main sources of goods sold in
the shops were said to be Monrovia (47%), Buchanan (40%), and Harbel (13%).
Table 9: Shop Ownership and Type and Source of Goods Sold
Shop Ownership and Information
on Goods Sold
% of Shops
(n=15)
Shopkeeper’s Ownership of Shops
Owned shop 93.0
Did not own shop (selling for relatives) 7.0
Gender of Shop Owners
Male 80.0
Female 20.0
Type of Goods Sold
Food Items only 20.0
Food and Non-Food 40.0
Other Goods 20.0
Drinks 6.7
Gasoline and Oils (and limited of other goods) 6.7
Tea shop 6.7
Sources of Goods Sold
Monrovia 46.7
Buchanan 40.0
Harbel 13.3
Transportation of Goods
Ninety-three percent (93%) of shopkeepers/owners said they regularly used the Compound 1-Edina Road to
transport their goods. The other seven percent used mostly the river crossing from Buchanan to Edina. This
means that various modes of transportation were used to convey shopkeepers’ goods from purchase to the
points of sale. These include mostly bikes (53.3%), cars (40%), and canoe (6.7%). The cost of transporting goods

21
was based on several factors, including the types and size of the goods being conveyed, road condition, distance
travelled, and the type of vehicle used. From the interviews conducted with passengers, the cost of transporting
goods from the three main sources ranged from L$500 – L$4,000.
Table 10: Means of Transportation of Goods by Shopkeepers
Means of Transportation %
Canoe 6.7
Bikes 53.3
Car/Van 40.0
Shopkeepers’ Income from Sale
The total monthly sales revenues generated by the fifteen shopkeepers surveyed for the month (twenty-six days
excluding Sundays) just prior to the survey was L$795,600. The average monthly sales revenues per shop for
the period was calculated at L$53,040. Most shopkeepers (87%) earned between L$500 and L$3,000 from their
daily sales. This included all female shopkeepers and 70 percent of the male shopkeepers.
Table 11: Daily Income from Shop Sales
Range of Daily Income
from Shop Sales
Gender of Shopkeeper (n=15)
Male (n=10) Female (n=5)
№ % № %
L$500 – L$3,000 7 70.0 5 100.0
L$3,001 – L$8,000 3 30.0 0 0.0
Total 10 100.0 5 100.0
Prices of essential goods/commodities:
The survey captured the prices of a few commodities. Prices of essential commodities captured in catchment
area were as follows: (i) a 50lb. bag of rice L$1,850; a one-pound cup of rice L$30; a gallon of gasoline L$400;
and a one hundred fifty milliliter of imported cooking oil L$30.
Income from Fishing
Sixty-four of the 362 households interviewed mentioned association with fishing as a source of income. The
combined income from sales reported by these households from a single fishing expedition (overnight or daily)
was an estimated L$423,015. This ranged from L$2,850 to L$151,000, with half (50%) earning on average
L$2,383. As shown in Table 12, the total average income from the sale of fish from one fishing expedition was
estimated to be L$6,610.
Table 12: Number and % of HHs by Income Generated from Fishing
Range Households Income (in L$)
№ % Total Avg.
Less than 1000 5 7.8 2,850 570

22
1000-4999 27 42.2 7,3415 2,719
5000-9999 17 26.6 11,0750 6,515
10000-14999 8 12.5 85,000 10,625
15000 and above 7 10.9 151,000 21,571
Total 64 100.0 423,015 6,610
Conclusions
The main economic activities in the area are farming, fishing and petty trading. The fishing trade, which attracts
buyers from as far as Monrovia, makes the area an active economic zone, in terms of activity. However, farming
and fishing are traditionally low-income generators, especially as practiced in this area. These activities neither
employ modern methods or are undertaken on a large-scale, mechanized or commercial manner. They are
mostly undertaken for the subsistence of households. For example, only 20 of 49 rice farmers, who harvested
rice, sold portions of the rice they produced. Petty traders (shop owners) also earn low incomes, due generally
to the low purchasing power of residents. The average daily income from sales is L$2,040, which ranges from
an estimated L$500 to L$8,000, notwithstanding 73 percent of traders earning only between L$500 and L$2,000.
Income from fishing, on the other hand, averages around L$6,610 per overnight catch or fishing trip, even though
half (50%) average between L$570 and L$6,515 from the portion of their catch sold. Accordingly, farming, fishing
and petit trading, as currently undertaken, are not adequate to create sufficient wealth to impact the living
standard of the people. Improved methods of farming, fishing, and marketing that increase productivity will be
needed to increase of farmers, fishermen and traders.
4.3. Transportation and Related Conditions
Traffic Count
The traffic counts provide a measure of the volume and composition of traffic on the Compound #1 – Edina
City Road and the main primary roads adjoining it. It also provides baseline data for measuring the potential
impact of the road rehabilitation on transportation on the road, in terms of volume, cost, and traffic time. The
traffic count tally was taken over a three-day period, from 6:00 a.m. to 6:00 p.m. Two of the three days were
regular week days, while the third (Saturday) was the only weekly “market day” in the road catchment area. The
“market day”, which is held at Compound 1 each week, brings together buyers and sellers from all over the area
to buy and sell all types of goods available in the area, from agricultural to household items to local brew and a
variety of imported items. As shown in Table 13, there are different types of traffic on the Compound 1 – Edina
Road. They include bikes, the most dominant type of vehicle on the road, taxis, pick-ups, and bicycles, among
others.
Table 13 provides a summary of the daily traffic recorded over the three days of count at the five locations of
count along the project road. It shows that traffic was most intense on the Compound #1 side of the road (53%),
followed by the Little Bassa (23%), Gorr and Zoe Roads (10% each), and Edina City (4%). Vehicle types most
common on the road were jeeps, taxis, and pickups. Trucks, primarily used for freight, are the least common.
The data further shows that the most common form of transportation on the road was found to be the
motorcycle., which accounted for 82 percent of all vehicular traffic, followed by taxi (6%), pickup (4.2%), and
SUV (3.3%). Other forms of traffic included truck, push-push, wheelbarrow, and tricycle.

23
Table 13: Average Daily Traffic Volume by Vehicle Type
Location
Direction
of Traffic
Type of Traffic Total
Taxi SUV Pickup Truck Motor-
cycle
Push-
Push
Wheel-
barrow Bicycle № %
Little Bassa In 19 25 16 0 300 1 1 17 379 12.3
Out 19 21 15 0 289 1 1 16 362 11.7
Edina City In 0 8 1 0 82 0 1 0 92 3.0
Out 0 8 1 0 72 0 1 0 82 2.7
Compound
1
In 49 43 43 8 701 0 9 15 868 28.2
Out 47 37 32 6 632 0 5 13 772 25.1
Zoe Town
Junction
In 9 12 4 1 99 0 9 15 149 4.8
Out 9 10 3 0 92 0 5 13 132 4.3
Gorr Town
Junction
In 12 8 4 2 94 0 0 8 128 4.2
Out 12 8 2 2 88 0 0 5 117 3.8
Total 176 180 121 19 2,449 2 32 102 3081 100
% of Total 5.7 5.8 3.9 0.6 79.5 0.1 1.0 3.3 100
The data on vehicular movements recorded over the three days of traffic count show that traffic was
considerably higher on “market day” (Saturday), compared to the other two days. In fact, as shown in Table 14,
over half (52%) of all movements counted occurred on “market day”. Traffic movements recorded for Day 1
made up 26 percent, followed by 22 percent for Day 2. accounted market days were higher than non- market
days.
Table 14: Volume of Traffic by Type of Vehicle and Day of the Week
Vehicle Type
Vehicular Volume by Market and Non-Market Days Total
Day 1-
Non-Market Day
Day 2-
Non-Market Day
Day 3-
Market Day № %
Taxis 29 26 41 96 5.9
Jeep 28 16 36 80 4.9
Pickup 18 30 27 75 4.6
Truck 4 4 6 14 0.9
Motor Bike 350 289 694 1333 81.3
Push-Push/Wheelbarrow 2 5 7 14 0.9
Bicycle 2 12 14 28 1.7
Total 433 382 825 1640 100.0
% 26.4 23.3 50.3 100.0
Road Condition
The condition of the Compound 1-Edina Road was generally assessed by most residents and drivers to be
impassable during the rainy season. They pointed to potholes, ditches, and unsafe bridges to justify their
assessment. For instance, an overwhelming majority of drivers (97%) interviewed indicated that their cars are
affected by the “condition” of the road, especially during the rainy season. The research team did observe
numerous bad patches along the road, including bad bridges, potholes, and ditches, which made travel a little
difficult, and predictably worse during the rainy season, when the wooden bridges become more dangerous to
cross and fragile portions of the road, where water settles, became less stable and turned into mud. The road
was also found to be narrow in width, almost limited to one-way traffic in most places.

24
Cost of Vehicle Operation
The cost of vehicle operation on the project road was assessed by asking vehicle operators to estimate vehicle
operation costs relative to maintenance and insurance. Responses of drivers/vehicle operators show that the
average monthly vehicle maintenance costs varied with the type of transport vehicle, as shown in Table 15. Based
on estimates provided by drivers during the drivers’ interview, the average monthly maintenance cost of vehicles
plying the various routes in the survey catchment area was calculated to be L$3,338.90 for cars and L$2,117.85
for motor bikes.
The cost of insurance reported was generally inconsistent and did not reflect the varying cost of insurance for
different categories of vehicle. It is assumed that the reason for this questionable reporting of insurance costs
was because most vehicles were generally uninsured and/or the operators of the vehicles just did not now the
cost of insurance coverage. Notwithstanding, Table 15 shows that from the costs reported, average insurance
cost for vehicles was L$8,575 for cars and L$8,210 for bikes.
Table 15: Average Monthly Vehicle Maintenance and Insurance Cost by Type of Vehicle
Vehicle Type Vehicle Insurance and Maintenance
Avg. Insurance Cost Avg. Repairs Cost
Car L8,575 L$3,338.90
Motor Bike L$8,210 L$2,117.85
Availability and Price of Fuel. Most drivers (97%) bought fuel along the road. Most of the fuel are purchased
from “can boys” (97%); no driver indicated buying fuel from either modern filling stations or “mixed-shift
stations”. The cost of fuel on the road ranges between L$340 – L$500 per gallon. There is reliability in the
availability of fuel on the road. All drivers interviewed said “yes”, fuel was always available for purchase.
Travel Time and Cost of Travel
Travel time varied between destinations along the road. Travel time is generally a factor of the road conditions,
destinations, and transportation mode. Travel times of passengers surveyed ranged from fifteen minutes to over
one hour in most cases. Average travel time surveyed was 35 minutes 8 seconds. Like cost, travel time varied
according to vehicle type, distance and road conditions. Difficult to navigate roads were higher in fare, compared
to easily navigable roads. From the passengers interviewed, travel fares ranged from L$50 to L$450. The average
fare calculated was L$146.72.
Conclusions
Road conditions impact the movement of people and goods in the area, especially during the raining season.
Road conditions are also affecting vehicle maintenance costs and transportation fares. Given the road conditions,
residents have adopted alternative means of transportation and movement of goods over short distances and
destinations. These include the use of motor bikes, bicycles and wheelbarrows, and their local adaptations, called
“push-push”. Road conditions, influence the non-insurance of most vehicles. Improved road conditions will
enhance the movement of people and goods, enhance access to social services and markets, and contribute to
the socio-economic development of the catchment area.
4.4. Standard Foreign Assistance Indicators
LSA in consultation with the EG team agreed on a list of US Government foreign assistance indicators (See
Annex V) to guide data collection for the study. These indicators were given to SBA to guide the development

25
of the survey questionnaire to response to the fourth research question. Accordingly, the research team
gathered baseline data on most of these indicators. They covered measurements of the impact of US
Government assistance in health, economic growth, and education. The research team also included issues in
governance and the rule of law.
The indicators that will best measure the impact of the road as determined by the baseline study are:
1. 4.7-4 Prevalence of households with moderate or severe hunger
2. EG.3-1 Number of households benefiting directly from USG assistance under Feed the Future
3. EG.3.1-1 Kilometers of roads improved or constructed as a result of USG assistance
4. 3.2.1-30 Primary Net Enrollment Rate (NER)
5. Main Security Problem
The study has outlined all indicators for this study per USAID/Liberia Development Objective along with their
baseline values in the below section.
Health
Table 16 below lists the six US Government health indicators and their baseline values.
Table 16: US Government Health indicators and their Baseline Values
Standard F Indicator Baseline Value
3.1.8.2-1 Percent of households using an improved sanitation facility 14.7
4.7-4 Prevalence of households with moderate or severe hunger 37.7
HL.7.2-1 Percent of audience who recall hearing or seeing a specific USG-
supported Family Planning/Reproductive Health (FP/RH) 65.5
HL.8.1-1 Number of people gaining access to basic drinking water services
as a result of USG assistance
50.3% of households access
their drinking water from
Protected or safe sources
HL.8.2-5 Percentage of households with soap and water at a handwashing
station commonly used by family members (10 hand pumps in catchment
area)
9.8
HL.8.2-6 Percentage of households in target areas practicing correct use of
recommended household water treatment technologies 14.7
Economic Growth
Standard F economic growth indicators generated from the baseline survey are presented in Table 17.
Table 17: US Government Economic Growth Indicators and their Baseline Values
Standard F Indicator Baseline
Value
EG.3-1 Number of households benefiting directly from USG assistance under Feed the Future 0
EG.3.1-1 Kilometers of roads improved or constructed as a result of USG assistance 0
EG.3.1-2 Hectares under new or improved/rehabilitated irrigation or drainage services as a
result of USG assistance 0
EG.3.1-13 Number of households with formalized land with USG assistance 0
EG.3.2-19 Value of smallholder incremental sales generated with USG assistance 0
EG.3-6 Farmer's gross margin per hectare obtained with USG assistance 0
EG.3-7 Farmer's gross margin per animal obtained with USG assistance 0

26
Education
The following table shows the baseline indicator for education, which basically covers one item: net primary
school enrollment.
Table 18: Government Education Indicators and their Baseline Values
Standard F Indicator Baseline
Value
3.2.1-30 Primary Net Enrollment Rate (NER) 47.3
Democracy and Governance
Table 19: Selected Governance Indicators and their Baseline Values
Standard F Indicator Baseline Value
Police Presence Yes
Judicial Presence No
Main Security Problem Fighting (41.1); Stealing (37.2);
GBV, including Rape (12.6)
Main Source of Redress for residents in the case of an offense
committed against them
Community Leaders (80.0);
Police (13.0); Tribal Court (4.0);
Government Court (2.0)
Satisfaction with Redress 99.7
Recommendation
1. In order to achieve the maximum impact from rehabilitating the Compound 1-Edina Road, the road linking
Buchanan to Upper Buchanan, which is linked to Edina by water transportation should also be rehabilitated.
The idea is that if people and goods can easily flow to and from Edina from Buchanan, then economic activities
will increase in the road catchment area. As it is right now, the flow is limited to Edina-Upper Buchanan and
not the more affluent, business active Buchanan City center due to the very bad road between Upper
Buchanan and Central Buchanan.

27
Annexes
Annex I: Statement of Work
Objectives
On behalf of USAID, LSA will procure the services to conduct a baseline survey to provide comprehensive
quantitative and qualitative data on demographic, socio-economic and transportation-related conditions along
the 35-km Compound 1 to Edina rural road in Grand Bassa County to measure the impact of USAID rural roads
investments.
USAID hypothesizes that road rehabilitation investments will improve access to markets, particularly for
farmers, reduce direct and indirect travel costs and time, increase economic activity, and increase social benefits
(e.g., access to health care, increased educational attendance, voting, security). This baseline will also recommend
Standard Foreign Assistance Indicator(s) across each technical area (Health, Education, Democracy &
Governance, Agriculture (Feed the Future)) and throughout USG that will measure the impact of roads.
Research Questions
The successful offeror will address the following research questions with findings, conclusions, and
recommendations to efficiently rehabilitate and maintain the 35-km Compound 1 to Edina rural road in Grand
Bassa County:
1. What are the social and demographic characteristics of the road catchment area?
2. What are the economic characteristics of the road catchment area?
3. What are the transportation-related conditions of the road catchment area?
4. What Standard Foreign Assistance Indicator(s) and custom indicators across each technical area (Health,
Education, Democracy & Governance, Agriculture (Feed the Future)) will best measure the impact of the roads?
And, what are baseline values for the selected indicators?
Background
Lack of rural transport infrastructure is a major constraint to agricultural development and economic growth in
Liberia. The Constraints Analysis jointly conducted by the USG Millennium Challenge Corporation (MCC) and the
GOL to underpin the MCC Compact for Liberia identifies inadequate road infrastructure as one of the two top
binding constraints to growth. While donors and the GOL together have provided significant resources (in
excess of $500 million over the past five years) for repair and upkeep of the primary road network, farm to
market roads have in comparison been shortchanged. Most tertiary roads are either not impassable at all, or
can be navigated only during the dry season.
As a consequence, about three-quarters of Liberia’s rural population remains poorly connected to local markets,
administrative centers, health care, education, other goods and services, and national transportation networks.
Responsibility for public road infrastructure construction and maintenance in Liberia lies under the jurisdiction
of the Ministry of Public Works (MPW), within which the Bureau of Rural Development is specifically responsible
for the construction and maintenance of feeder and farm-to-market roads. The Ministry of Transport also plays
a supervisory and regulatory role with regard to road transport.
Resources to fund rehabilitation and maintenance of farm to market roads historically have been very limited.
In FY 2016 both houses of the Liberian legislature passed the Road Maintenance Act under which levies will be
placed on petroleum products and excessive axle loads to provide a dedicated fund for road maintenance (60
percent of the resources raised) and rehabilitation (40 percent), under the oversight of a road fund manager in
the Ministry of Finance and Economic Planning.
USAID/Liberia’s Feeder Roads Alternative and Maintenance Program (FRAMP) is currently working with four
counties to expand their capacities to meet annual planning, budgeting, procurement, and reporting
requirements to access resources from the fund. Also, the Mission completed a qualitative road assessment that
can provide background on the impact of improved roads (Qualitative Assessment of Farm-To-Market Road

28
Rehabilitation: Effects of Improved Road Conditions on Road Catchment Communities in Bong, Lofa, And Nimba
Counties, August 2016.
USAID Program
USAID/Liberia’s assistance to the rural roads sector is funded with a mix of infrastructure, Food for Peace, and
Feed the Future (FTF) resources. Activities have included food and cash for work, a multi-year community
infrastructure rehabilitation award, and direct contracts with Liberian firms for rehabilitation of specific road
segments in four counties with oversight and quality assurance provided through FRAMP. The FRAMP
contractor will develop systems to efficiently rehabilitate and maintain feeder roads in Liberia and build the
capacity of the Liberian Government, county governments, Liberian engineers and contractors, and civil society
organizations/ microenterprises to implement these systems.
FRAMP will be complemented by a construction Indefinite Delivery, Indefinite Quantity Contract (IDIQC) yet
to be awarded under which up to 450 km of farm to market roads in the target counties of Bong, Lofa, Nimba
and Grand Bassa will be rehabilitated and maintained. Rehabilitation of the Compound 1 - Edina road is one of
the initial task orders planned to be awarded to local contractors under the IQC.
Methodology
The successful offeror will propose to utilize and adapt the following methods recommended by USAID:
1. Mapping. Working with MPW and FRAMP, develop a detailed map of the entire road length and catchment
area (approximately 5 km along both sides) to include GPS coordinates for all communities, connecting
roads and spurs, schools, health facilities and other public infrastructure, markets, bridges, bodies of water,
and prominent landmarks, and an estimate of the total population within the catchment area.
Community leaders such as clan chiefs, school head teachers and health facility staff should be consulted to
ensure that communities and households accessible only by footpath are included in the count.
1. Data collection plan. The mapping exercise will provide the basis for calculating a sample size for the
household survey (see below) and developing a data collection plan, including estimates of number of key
informant interviews and focus group discussions to be held and a data collection calendar.
2. Traffic counts. Once the mapping is done, traffic counts to document all vehicular and non-vehicular
movement of people and goods along the road will be carried out at points to be determined based on the
mapping. The counts should be done from 6 a.m. to 6 p.m. for a minimum of three full days at each selected
point, to include both market days and non-market days. If connecting roads are served by vehicle traffic
these movements should also be captured.
3. Transport costs and times. The traffic counts will also afford an opportunity to collect data on passenger
fares, costs for movement of goods (using commonly-accepted units of measure such as 20-liter containers
and 50 kg bags of produce), vehicle transport and repair costs, travel times by point of origin and destination,
and impact on other forms of transportation such as by canoe.
4. Household survey. The survey instrument must be built on tools used in other population-based surveys
and studies in Liberia, including the Household Income and Expenditure Survey (HIES), the Demographic
and Health Survey (DHS), and the Feed the Future Population-Based Survey (PBS). The key indicators and
variables for which data are to be collected will be defined in consultation with USAID/Liberia and must
reflect the reporting requirements of Feed the Future, USAID/Liberia’s Country Development Cooperation
Strategy (CDCS) and other technical offices reporting requirements (i.e. Standard Foreign Assistance
Indicators). The mapping component affords an opportunity to identify the most important economic and
socio-economic activities for people living along the road and to tailor the questionnaire to local conditions.
Data must be disaggregated by sex of respondent and age cohort. Please see the attached Annex B:
Suggested Guidelines for Methodology.
5. Key informant interviews. Please see the attached Annex B: Suggested Guidelines for Methodology.
6. Focus group discussions. Please see the attached Annex B: Suggested Guidelines for Methodology.
Tasks

29
The successful offer will propose to conduct and adapt the following tasks recommended by USAID:
1. Document review. USAID/Liberia CDCS; FTF/Liberia MYS; DHS, PBS and HIES; FRAMP reports; studies
and reports by other donors engaged in farm to market road rehabilitation and maintenance (SIDA, GIZ);
any other relevant data sources identified by USAID/Liberia
2. In brief meeting with USAID/Liberia technical teams including FTF, Infrastructure, Program Office M&E,
FRAMP, MPW
3. Familiarization visit to road site and meetings with MPW and other County officials
4. Task 1, Mapping including recruitment/training for mapping team and consultations with local and
traditional authorities in collaboration with MPW and FRAMP
5. Task 2, data collection plan. Draft and finalize comprehensive data collection protocol with data
collection instruments for household survey
6. Tasks 3 and 4, traffic counts and transport times/costs data collection (this can be done
simultaneously with finalization of the data collection plan using the mapping team).
7. Translation of data collection instruments into Bassa, if needed
8. Training of enumerators (who may include some/all members of the mapping team) in interview techniques
and data entry using computer-assisted personal interviewing (CAPI). The enumeration team must include
both men and women and should have previous experience with household surveys in rural Liberia
9. Field-testing of data collection instruments
10. Revision of data collection instruments based on field testing
11. Deployment of core team for data collection
12. Tasks 5, 6 and 7: data collection: household survey, KIIs, FGDs. The time required for data
collection in the field depends on the sample size.
13. Task 8 report drafting
14. Task 9 final report
Personnel Requirements
Key personnel for the baseline survey include:
1. Team Leader. Minimum of seven years of experience in social science research and data collection and
analysis in rural settings. Experience leading similar studies preferably in environments similar to Liberia. Fluent
spoken and written English. Excellent writing and analysis skills. Experience and capacity to manage a diverse
team under challenging field conditions. Knowledge of Liberian languages desirable but not required. Advanced
degree in social science desirable.
2. Field Supervisor/Quality Control. Minimum of a good first degree in social science or statistics. Four or
more years of experience with data collection and management in field settings. Excellent local and English
language skills. The position requires an individual who is meticulous and well-organized.
A CAPI specialist should also be considered for the team. The baseline may also require enumerators and
potentially a translator to apply the methods discussed earlier in this SOW.
Budget & Mechanism
The maximum level of funding is USD $86,000 subject to a proposed and detailed budget with budget notes.
LSA will partner with the successful offeror through a subcontract to conduct the study. The subcontractor
may be a firm from Liberia, the US, or a non-prohibited country, per LSA’s USAID Principal Geographic Code
935. Geographic Code 935 authorizes procurement of commodities and services from “any area or country
including the recipient country, but excluding any country that is a prohibited source”.
Deliverables
USAID envisions the following deliverables schedule for the study. All deliverables are subject to approval by
USAID and LSA

30
No. Deliverable Description Proposed
Completion
Date
1. • Draft inception report in Microsoft Word specifying how each of the
research questions will be answered, outlining the study’s methodology,
approach, limitations, data collection and analysis plan, and team roles and
responsibilities. The report should be 30 pages or less, excluding annexes.
Annexes must include, among others:
o Data collection instruments
o All training materials for enumerators
o Comprehensive quality control plan
o Detailed work plan
• Final inception report addressing all feedback, comments, and edits made by
USAID and LSA.
• In-brief presentation in Microsoft PowerPoint to USAID and LSA outlining
the research questions, methodology, limitations, team composition, and
work plan
TBD
2. • Matrix in Microsoft Word with preliminary findings, analysis, conclusions and
recommendations that directly and fully address the research questions
• Preliminary findings presentation to USAID and LSA in Microsoft
PowerPoint
TBD
3. • Draft report in Microsoft Word of no more than 30 pages. It should include
a 3-5-page standalone executive summary, description of the activity, a
limitation and methodology section, and sections answering each of the
research questions with findings, conclusions, and recommendations. The
report must use data visualizations, such as maps, graphs, tables, and
infographics. Findings should be specific, concision and support by analysis,
and recommendations should be specific and practical. The 35-page limit
does not pertain to annexes, which should include all maps, datasets,
transcripts, instruments, work plan, sample frames, etc.
• Final report addressing all feedback, comments, and edits made by USAID
and LSA.
• Presentation of the final report to LSA and USAID in
TBD

31
Annex II: Data Collection Instruments
Household Survey Questionnaire
Module A. Identification
No. Question Response
codes Response
A1 Date of interview DAY MONTH YEAR
A2
Cluster Number
A5 Village Name
A6 Household Number
A7 Enumerator Name/Code
A8 Reviewed by
INSERT SUPERVISOR NAME
A9 Reviewed by
INSERT TEAM LEADER NAME
A10 Data Entry by
INSERT CLERK NAME
A11 Data Entry
INSERT DATE
DAY MONTH YEAR
A12 Data Entry Checked by INSERT
NAME
A13 Data Entry Checked INSERT
DATE
DAY MONTH YEAR

32
Module B. Household Roster
No. Question Response codes Responses
ASK OF THE HEAD OF HOUSEHOLD OR ANOTHER
RESPONSIBLE ADULT MEMBER OF THE HOUSEHOLD.
B1
Hello. My name is _________ and I work for Subah-Belleh Associates
(SBA), a Liberian company based in Monrovia. You may have heard
that USAID is about to work on the Edina Road to make it better for
transporting people and goods. But USAID wants to know how the
improvement of the road condition (explain in simple English) will help
the people living in the towns and villages along the road, from
Compound 1 to Edina. This is because most people believe and have
seen that roads can bring many changes to people and their
community. When the road is good, people will come to buy and sell,
you will travel easily, people will come to your area and do things that
will bring jobs and schools, and health facilities, etc. and you and your
family will benefit. So, before the road work starts, we want to know
about your present condition so that when the road is finished and
you and others start using it, we can come back later and see how
your living condition will change.
You have been selected by chance for this survey and we would very
much appreciate your participation. The survey usually takes about
___ minutes. Your participation is voluntary and you may end the
survey at any time or decide not to answer a particular question.
Your answers will be kept confidential.
Do you agree to participate in the survey?
0 = No >> end
module
0 = Yes
B2
Do you have any questions for me about the survey before we
begin?
ANSWER THEIR QUESTIONS

33
B2. Total Number of Household Members: _____________________
MODULE B3. HOUSEHOLD ROSTER (HEAD OF HH OR RESPONSIBLE ADULT START TIME: HOUR MINUTE
Please tell me the name and sex of each person who lives here, starting with the head of the household. For our purposes today, members of a household are adults
or children that live together and eat from the "same pot". It should include anyone who has lived in your house for 6 of the last 12 months, but it does not include
anyone who lives here but eats separately. AFTER LISTING NAMES, RELATIONSHIP, AND SEX FOR EACH PERSON, ASK QUESTIONS 2A-2C TO BE SURE THAT
THE LISTING IS COMPLETE. THEN ASK APPROPRIATE QUESTIONS IN COLUMNS 1-13 FOR EACH PERSON.
B3. H
ouse
hold
Mem
ber №
B4.
Name
B5.
Gender
1.
Female
2. Male
B6.
Age
B7.
Relationship to HH
Head
1. Household Head
2. Wife/Husband
3. Son
4. Daughter
5. Son/daughter In-
Law
6. Grandchild
7. Parent
8. Brother/Sister
9. Grandparent
10. Others (Specify)
999. I do not know
B8.
Marital Status
1. Single/Never
married
2. Married
3. Separated
4. Devoiced
5. Widow/widower
B9.
ASK FOR AGE 5
& ABOVE:
Is the family
member
literate or
illiterate?
1. Illiterate
2. Literate
B10.
What is the current/last
school that the family
member is attending/has
graduated?
1. Below school age
2. Hasn’t graduated from
any institution
3. Primary School Student
4. Primary School graduate
5. Junior High School
Student
6. Junior high school
graduate
7. High School student
8. High School graduate
9. Vocational School of
Higher Education Student
10. Vocational School of
Higher Education
Graduate
11. University Student
12. University Graduate
13. Masters Student
14. Masters Graduate
15. Doctorate Student
16. Doctorate Graduate
B11.
Ask 16 years and above
What is [NAME] religious
affiliation?
1. Christianity
2. Islam
3. Buddhism
4. Hinduism
5. Traditional Religion
6. No Religion
7. Other (specify)
1
2
3

34
4
5
6
7
8
9
B3. H
ouse
hold
Mem
ber №
B12.
What is [NAME]
Ethnic affiliation?
1. Kpelle
2. Bassa
3. Gio
4. Mano
5. Kru
6. Grebo
7. Mandingo
8. Krahn
9. Gola
10. Gbandi
11. Lorma
12. Kissi
13. Vai
14. Belle
15. Mende
16=Dei
16. Another
Liberian
17. Foreign/Non-
Liberian
B13.
ASK FOR AGE
16 & ABOVE:
Has the
household
member
worked in an
occupation
which
brings income
in the
last 3 months?
1. Yes
2. No
999. Don’t
know
SEE
DEFINITION
FOR “WORK”
BELOW
B14.
If YES, what kind
of Employment
is (NAME)
currently
engaged in?
1. Full-time
2. Part-time
3. Seasonal
4. Temporary
B15.
If household member is not
working, please mention the
reason.
1. Retired
2. Student
3. Housewife (Only for
female spouses)
4. Cannot find a job
5. Pregnant
6. So, ill that he/she cannot
work
7. Too old
8. Too young
9. Handicapped
10. Does not need to work
11. Looks after house works
12. Looks after elderly
13. Looks after children
14. Not allowed to work (e.g.
female members)
15. Does not want to work
16. Other (please specify)
B16.
What is the household
Member’s MAIN
occupations?
1. Farmer
1. Fisherman
2. Livestock breeder
3. Hunter
4. Retired
5. Craftsman
6. Merchant
7. Civil Servant
8. Worker
9. Teacher
10. Student
11. Homemaker
12. Handcrafter
13. Military/Paramilitary
14. Mechanic
15. Repairman
16. Doctor
17. Healer
18. Other (please
specify
998. Not applicable
999. I do not know
B17.
Who is s/he working for?
1. His/her own business
(gets all or a share of
the profits)
2. Family business
(Works with a wage)
3. Family business
(unpaid)
4. Employed by Others in
a business
5. Government Worker
6. NGO Worker
7. Other (specify)
998. Not applicable
999. I do not know
B18.
Does s/he need
to live
outside the
village to do this
job?
If YES, please
state how many
months a year,
If NO, please
enter zero.
999. I do not
know
1
2
3

35
4
5
6
7
8
9
WORK includes jobs in the formal and/or informal sector, full time, part time, or seasonal work that is done within and/or outside the home. Work includes, but is not limited to agricultural daily wage labor, off-farm daily wage labor, income generation activities, sale of goods produced or processed outside the home or at the home, homestead garden or farm (e.g., vegetables, eggs, fish, milk, livestock, artisanal goods), or petty trading. For this indicator, work does not include participating in cash for work, food for work, or conditional transfers and/or productive safety net programs. It does not include either caring for own children, cooking, cleaning or doing other routine chores for own household (e.g., fetching water, collecting firewood) or being involved in agricultural production solely for household consumption.

36
Module C: Housing and Amenities
# Questions and Enumerator
Instructions
Responses and Response
Code Instructions
Resp.
Codes
G
O
T
O
Sup
Please answer the following questions about the house or apartment you and your household currently live
in:
C1 Is this house/apartment:
1=Owned by you or someone in
this household with a mortgage or
loan?
2=Owned by you or someone in
this household free and clear
(without a mortgage or loan)?
3=Rented for cash rent?
4=Occupied without payment of
cash rent?
C2
Which best describes this building?
Include all apartments, flats, etc., even if
vacant.
1=A one-family house detached
from any other house
2=A one-family house attached to
one or more houses
3=A building with 2 apartments
4=A building with 3 or 4
apartments
5=A building with 5 to 9
apartments
C3 Is this house, apartment:
1=Owned by you or someone in
this household with a mortgage or
loan?
2=Owned by you or someone in
this household free and clear
(without a mortgage or loan)?
3=Rented for cash rent?
4=Occupied without payment of
cash rent?
C4 What type of housing structure
does your household live in?
1=Permanent (Concrete wall, floor
& metal roof)
2=Semi-permanent (Walls of dirt
bricks and metal roof)
3=Temporary (Walls of stick and
mud with straw/grass roof)
C5 About when was this building first
built?
C6 How many lots of land is this house
home on?
1=Less than 1 lot
2=1 lot
3=1½ lots
4=2 lots
5=3 lots
6=4 lots

37
7=More than 4 lots
C7
How many separate rooms
are in this
house/apartment?
Rooms must be separated by built-in
archways or walls that extend out at
least 6 inches and go from floor to
ceiling.
• INCLUDE bedrooms, kitchens, etc.
• EXCLUDE bathrooms, porches,
balconies, foyers, halls, or unfinished
basements.
Number of rooms
C8
How many of these rooms are
bedrooms?
Count as bedrooms those rooms you
would list if this house, apartment, or
mobile home were for sale or rent. If
this is an efficiency/studio apartment,
print 0".
Number of bedrooms
C9
How many of these
bedrooms does your
household occupy?
Number of bedrooms
C10
Which of these facilities does your
home contain?
(multiple response)
1=Living room
2=Bathroom
3=Kitchen
4=Pipe-borne water
5=Flush/pour flush toilet
6=Electricity
7=All of the above
8=None

38
Module D. Household Income, Expenditure, and Savings
MODULE D-I. HOUSEHOLD INCOME
№ Questions and Enumerator
Instructions
Responses and Response
Code Instructions
Resp.
Codes
G
O
T
O
Sup
Now, I would like to ask you questions about the money you and your household receive and what you
spend it on. Please try to remember as much as you can.
D1
What are the main income sources
of your family?
(read all the options to the interviewee. 1
important, 2 less important, 3 least
important, 0 none)
•
Source Importance
1.Wage/salary
2.Farming
3. Fishing
3.Husbandry
4.Wood and wood products
5.Tourism
6.Trading
7.Rental income
8.Assisstance of relatives
9.Pensions
10.Poverty funds (State which
one…………………….)
11.Other governmental aids/assistance
(i.e. unemployment wage)
12.In kind aids from the government
(coal etc.)
13. Aids/assistance from NGOs
14.Allowances for elderly
15. Other (please specify)
D2 What is the average monthly
income of the household? •
D3 What is the average yearly income
of the household? •
MODULE D-II. POVERTY
D4 How do you consider yourself?
1. Very poor
2. Poor
3. Lower middle-income level
4. Middle income level
5. Higher middle-income level
6. Rich
7. Very rich
MODULE D-III. HOUSEHOLD EXPENDITURE
D5
How much did your household spend on
food each day during the last week (in
L$)?
Day Amount in
L$
Avg.
Spent
One (1)

39
(Ask about the days starting with
previous day/yesterday continue
asking about days backward up to 7
days)
Two (2)
Three (3)
Four (4)
Five (5)
Six (6)
Seven (7)
D6
Did you or any member of your
household spend money to eat food
other than the household general meal
during the last seven days?
1= Yes 2 = No
D7 If yes, how much was spent in L$?
D8
How much did your household spend on
leisure such as beverages and other
recreation during the last week in L$?
D9
How much money did your household
spend on clothing for the last month in
L$?
D10
How much did your household spend on
transportation during the last month in
L$?
D11 How much did your household spend on
health during the last month in L$?
D12
How much money did your household
spend on education during the last school
year (in L$?)
Note: This include school fees, book bags,
copy books, pencils, uniform, recess, tutorial
classes, etc.
D13
How often does your household pay
rent for the dwelling you live in?
ASK HOUSEHOLDS WHO RENT (Q__)
1=Do not pay rent
2=Pay rent per month
3=Pay rent every six months
4=Pay rent per year
D14 How much do you pay in L$?
MODULE D-IV. SAVINGS
D15
Do you and/or any member of
your household engage in (or
have) savings?
1= Yes 2 = No
D16 How much do you save yearly?
D17
What do you and/or members of
your household do, or plan to do,
with the money you/he/she/they
save each year?
1 Engage in business
2 Build House
3 Buy other properties
4 Reserve for emergency
5 Bank for interest
6 Pay for children’s education
7 Other (please specify)

40
Module E. Household Ownership of Assets
MODULE E-I: BASIC HOUSEHOLD ASSETS
№ Questions and Enumerator
Instructions
Responses and Response
Code Instructions
Resp.
Codes
GO
TO Sup
E1 Which of the below listed items is owned by you or any member of your
household?
E1a Bed 1= Yes 2 = No
E1b Mattress 1= Yes 2 = No
E1c Radio/Tape Recorder 1= Yes 2 = No
E1d Mobile Phone 1= Yes 2 = No
E1e TV 1= Yes 2 = No
E1f Chairs 1= Yes 2 = No
E1g Tables 1= Yes 2 = No
E1h DVD Player 1= Yes 2 = No
E1i DSTV 1= Yes 2 = No
E1m Cooking Utensils 1= Yes 2 = No
E1n Eating Utensils-Dishes (bowls, plates,
spoons, cups/glasses, etc.) 1= Yes 2 = No
E1o Water Containers 1= Yes 2 = No
E1p Refrigerator 1= Yes 2 = No
E1q Generator 1= Yes 2 = No
E1r Bicycle 1= Yes 2 = No
E1s Motorbikes 1= Yes 2 = No
E1t Car 1= Yes 2 = No
E1u House (other than the one currently
occupied) 1= Yes 2 = No
MODULE E-II: PRODUCTION ASSETS (OTHER THAN LAND)
E2 Which of the below listed items is owned by you or any member of your
household?
E2a Wheelbarrow 1= Yes 2 = No
E2b Sugar Cane Mil 1= Yes 2 = No
E2c Cassava Grinder 1= Yes 2 = No
E2d Rice mill 1= Yes 2 = No
E2e Power Saw 1= Yes 2 = No
E2f Tractor
MODULE E-III: LAND FOR HOUSING
E3 Does your household own vacant land
for housing? 1= Yes 2 = No
E4 If YES, how much land (in lots)?
E5
What type of ownership or access
does your household have to the
farmland?
1=Deed
2=Tribal certificate
3=Customary land
4=Inheritance
5=Rented
5=Squatters
6=Other (specify):
MODULE E-IV: LAND FOR FARMING
E6
Do you or any member of your
household has any agricultural
land or do farming?
1= Yes 2 = No Section
?

41
E7 How many parcels do you own?
E8 How many parcels do you
cultivate?
E9 What is the size of the parcel
cultivated (in hectares)?
E10 What is the ownership status of
the land?
1. I own and cultivate this land
2. I own but don’t cultivate this
land
3. I rent this land from
someone else
4. I rent out this land
5. I have a shareholder
6. Other (please specify
E11 What is the title deed status of
this land?
1. With title deed
2. Without title deed
3. Customary
4. Other
5. 999. I do not
6. know
Is the land irrigated? 1. Yes 2. No 999. I do not
know
E12 If cultivating the land, what do
you cultivate?
E13
How much did it cost to cultivate
all the crops you grow during the
last farming season (in L$)?
E14
How much of each product did
you harvest the last farming
season?
(Measure by 100-lb bag)
E15 How do you use the products?
(Multiple Response)
1. For subsistence
2. Selling at internal markets
3. Selling at external markets
4. Other
999. I do not know
E16
If products were used for both
subsistence and sale, what
portion (%) was set aside for
consumption and what portion
for sale?
Subsistence/Consumption:
______
Sale: _______
E17
What is the approximate value
received from the sale of
products harvested?
MODULE E-V: OWNERSHIP OF CATTLE AND OTHER DOMESTIC ANIMALS
E18 Does your household own any of the
following cattle?
E18a Goats 1= Yes 2 = No
E18b Sheep 1= Yes 2 = No

42
E18c Cows 1= Yes 2 = No
E18d Pigs 1= Yes 2 = No
E18e Chicken 1= Yes 2 = No
E18f Ducks 1= Yes 2 = No
E19 Are the animals your household owns
for:
1. Household Consumption
2. Sale
3. Both consumption and sale
E20
Please estimate how much does it cost
to take care of all of the cattle each
month?
E21
If sold from time to time, how much
did you receive, on average, each
year?

43
Module F. Household Access to Healthcare, Water, and Sanitation
MODULE E-I: ACCESS TO HEALTHCARE
№ Questions and Enumerator
Instructions
Responses and Response Code
Instructions
Resp.
Codes
GO
TO Sup
F1
In the past month, did any of
your household members attend
a health facility
1= Yes 2 = No
F2 If yes, how far is that facility?
1=Less than 1 Km (Less than 12 minutes’
walk)
2=2-3 Km (About 30 minutes’ walk)
3=4-6 Km (A little over 1 hour walk)
4=7-10 Km (About 2 or more hours
walk)
F3 How did the family member get
there?
1. Walk
2. Motorbike
3. Vehicle
4. Bicycle
5. Canoe
F4 How much did it cost to get
there (in L$)
MODULE F-II: WATER AND SANITATION
F5
What is the main source of
drinking water for members of
your household?
Protected Sources
1 = Piped into dwelling
2 = Piped to yard/plot
3 = Public Tap/Standpipe
4 = Tube Well or Borehole
5 = Hand pump, Protected Well
6 = Protected Spring
7 = Water from Spring
8 = Bottled Water
Unprotected Sources
9 = Unprotected Spring
10= Rainwater
11= Unprotected Well
12= Surface Water
(River//Stream/Canal/Irrigation Channel)
Other specify
F6 What type of toilet do you use
here?
1 = Flush or pour Flush Toilet
2 = Flush to Septic Tank
3 = Flush to Pit Latrine
4 = Ventilated Improved Pit Latrine
5 = Pit Latrine with Slab
6 = Compositing Toilet
7 = Bucket Toilet
8 = Hanging Toilet/Hanging Latrine
9 = No Facility/Bush/Field
F7 How does your household
dispose of its garbage?
1 = Use services of waste collectors
2 = Bury it
3 = Burn it

44
4 = Dump into Bushes, empty areas
nearby, or swamp
5 = Dump in river, lake, on beach
6 = Dump into drainage
7 = Dump at community dumpsite or
communal bin
8 = Other (specify):
9 = Don’t know
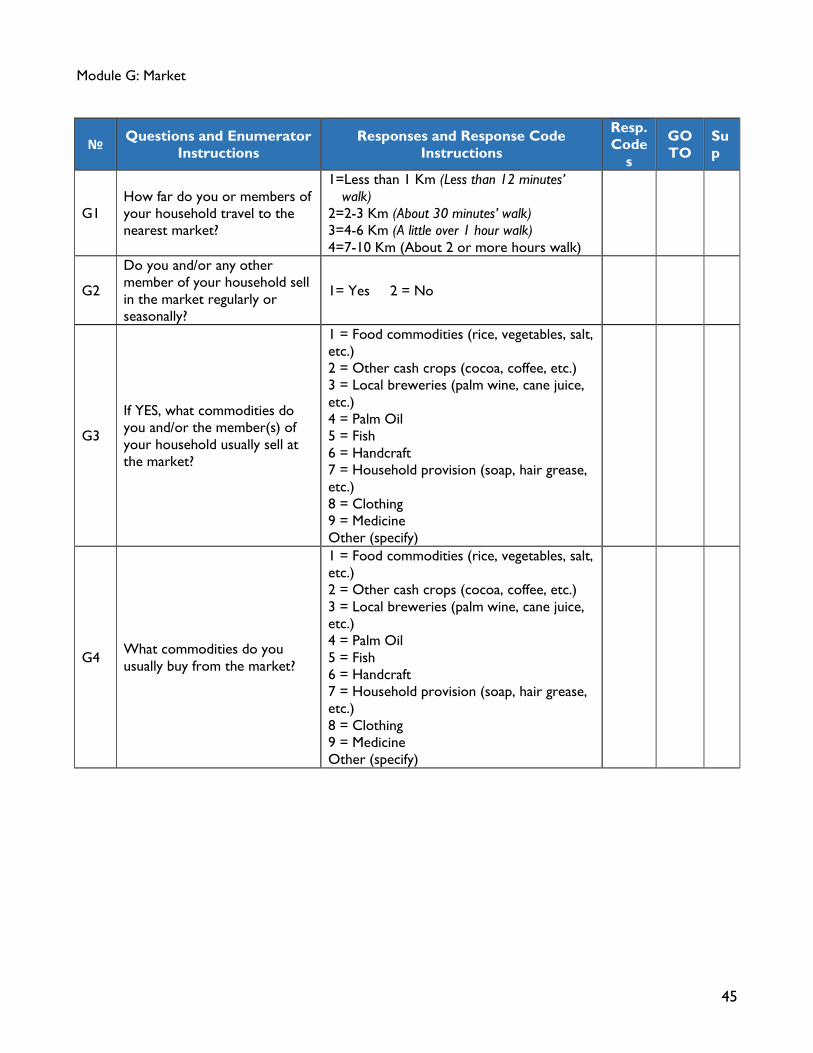
45
Module G: Market
№ Questions and Enumerator
Instructions
Responses and Response Code
Instructions
Resp.
Code
s
GO
TO
Su
p
G1
How far do you or members of
your household travel to the
nearest market?
1=Less than 1 Km (Less than 12 minutes’
walk)
2=2-3 Km (About 30 minutes’ walk)
3=4-6 Km (A little over 1 hour walk)
4=7-10 Km (About 2 or more hours walk)
G2
Do you and/or any other
member of your household sell
in the market regularly or
seasonally?
1= Yes 2 = No
G3
If YES, what commodities do
you and/or the member(s) of
your household usually sell at
the market?
1 = Food commodities (rice, vegetables, salt,
etc.)
2 = Other cash crops (cocoa, coffee, etc.)
3 = Local breweries (palm wine, cane juice,
etc.)
4 = Palm Oil
5 = Fish
6 = Handcraft
7 = Household provision (soap, hair grease,
etc.)
8 = Clothing
9 = Medicine
Other (specify)
G4 What commodities do you
usually buy from the market?
1 = Food commodities (rice, vegetables, salt,
etc.)
2 = Other cash crops (cocoa, coffee, etc.)
3 = Local breweries (palm wine, cane juice,
etc.)
4 = Palm Oil
5 = Fish
6 = Handcraft
7 = Household provision (soap, hair grease,
etc.)
8 = Clothing
9 = Medicine
Other (specify)

46
Module H: Media Exposure
№ Questions and Enumerator
Instructions
Responses and Response Code
Instructions
Resp.
Codes
GO
TO Sup
H1
Do any member of your
household listen to radio
regularly?
1= Yes 2 = No
H2
If yes, which program do
you/members of your
household listen to?
Multiple response
1. Health program
2. Political program
3. Development program
4. Social program
5. Advocacy program
6. Agriculture program
7. Education program
8. Other
H3
Do any member of your
household watch TV
regularly?
1= Yes 2 = No
H4 If yes, which programs do they
watch most?
1. Health program
2. Political program
3. Development program
4. Social program
5. Advocacy program
6. Agriculture program
7. Education program
8. Other
H5
Do any member of your
household read newspapers
regularly?
1= Yes 2 = No
H6 Which paper(s) do you/they
buy?
H7 How do
you/they get it?
1. From transport driver
2. From travelers coming in
3. From marketers
4. From students who come for weekend
H8
How do you learn about the
local news? Please state the 5
most important channels in
order.
1. National television channels
2. Local radio channels
3. National radio channels
4. Local (county) press
5. National press
6. Internet
7. Posters
8. Brochures
9. Village/Community
announcer/meetings
10. Religious Leader/Place of Worship
11. Teacher
12. Neighbors/friends
13. Other – (please specify)

47
H9
Did you know anything about
the Compound 1-Edina Road
Rehabilitation Project before
today?
1= Yes 2 = No
H10 If Yes, how did you learn about
the project?
1. Local radio channels
2. National radio channels
3. Local (county) press
4. National press
5. Internet
6. Posters
7. Brochures
8. Village/Community
announcer/meetings
9. Religious Leader/Place of Worship
10. Teacher
11. Neighbors/friends
12. Other – (please specify)

48
Module I: Peace and Security
№ Questions and Enumerator
Instructions
Responses and Response Code
Instructions
Resp.
Codes
GO
TO Sup
I1
What kind of crime is common in
this
community?
1. Stealing
2. Raiot/fighting
3. Murder
4. Rape
5. GBV
6. Armed robbery
7. Other (specify)
I2 Where do you go to seek redress
when these crimes are committed?
1. Community grievance committee
2. Community watch team
3. Community leaders
4. Trabal court
5. Police station
6. Civil Court
7. Others
I3 How far is the nearest police
station?
1. Less than 1 Km (Less than 12
minutes’ walk)
2. 2–3 Km (About 30 minutes’ walk)
3. 4–6 Km (A little over 1 hour walk)
4. 7–10 Km (About 2 or more hours
walk)
I4 How do you go there?
1. Walk
2. Motorbike
3. Vehicle
4. Bicycle
5. Canoe
I5
Are you satisfied with the handling
of your cases when you report
them to the police station?
1. Very satisfied
2. Somewhat satisfied
3. Sometimes satisfied
Not satisfied
I6 How far is the nearest court?
1. Less than 1 Km (Less than 12
minutes’ walk)
2. 2–3 Km (About 30 minutes’ walk)
3. 4–6 Km (A little over 1 hour walk)
4. 7–10 Km (About 2 or more hours
walk)
I7 How do you go there?
1. Walk
2. Motorbike
3. Vehicle
4. Bicycle
5. Canoe
I8
Are you satisfied with the handling
of your cases when you report
them to the court?
1. Very satisfied
2. Somewhat satisfied
3. Sometimes satisfied
Not satisfied
I9
Are there service providers in your
community providing services such
as:
1. Women rights advocacy
2. Child rights advocacy
3. Health training
4. Agriculture training

49
5. Awareness on immunization
6. Others

50
Module J: Peace and Security
№ Questions and Enumerator
Instructions
Responses and Response Code
Instructions
Resp.
Codes
GO
TO Sup
J1 Do any of your household
members go to the market? 1= Yes 2 = No
1
2
J2 If yes, how far is the market?
1. Less than 1 Km (Less than 12 minutes’
walk)
2. 2–3 Km (About 30 minutes’ walk)
3. 4–6 Km (A little over 1 hour walk)
4. 7–10 Km (About 2 or more hours walk)
1
2
3
4
J3 How do they get there?
1. Walk
2. Motorbike
3. Vehicle
4. Bicycle
5. Canoe
1
2
3
4
5
J4 How much do they pay to get
there in L$
J5 Do any of your household
members go to the bank? 1= Yes 2 = No
1
2
J6 If yes, how far is the bank?
1. Less than 1 Km (Less than 12 minutes’
walk)
2. 2–3 Km (About 30 minutes’ walk)
3. 4–6 Km (A little over 1 hour walk)
4. 7–10 Km (About 2 or more hours walk)
1
2
3
4
J7 How do they get there?
1. Walk
2. Motorbike
3. Vehicle
4. Bicycle
5. Canoe
1
2
3
4
5
J8 How much do they pay to get
there in L$
J9
Do any of your household
members go to the GOL
service center?
1= Yes 2 = No
1
2
J10 If yes, how far is the GOL
service center?
Less than 1 Km (Less than 12 minutes’
walk)
2 – 3 Km (About 30 minutes’ walk)
4 – 6 Km (A little over 1 hour walk)
7 – 10 Km (About 2 or more hours walk)
1
2
3
4
J11 How do they get there?
1. Walk
2. Motorbike
3. Vehicle
4. Bicycle
5. Canoe
1
2
3
4
5
J12 How much do they pay to get
there in L$

51
Module K: Perceptions and Expectations
K1. In your perception, what are the most important four problems (development) issues in your
community/village?
1. …………………………………………..
2. …………………......................................
3. …………………………………………..
4……………………………………………….
K2. How was your income status, standard of living when compared to 5 years ago?
1. Better 2. The same 3. Worse
K3. What is the reason for this?
K4. What do you think would be the benefits of the project?
1.For your family 2. For the village 3.For the country
K5. What kind of adverse effects can the project cause?
1.For your family 2. For the village 3.For the country
Thank you very much for your time.

52
Annex III: Communities Visited and Data Collection Sources and Numbers Reached
Community
Types of Data Collection Activities and Numbers Reached
№ of
Household
s
Interviewe
d
№ of
FGDs
conducte
d
№ of KII
conducte
d
№ of
Drivers
Interviewe
d
№ of Shop
Keepers
Interviewe
d
№ of
Passengers
Interviewe
d
№ of
Market
Stalls
observe
d
Days
of
Traffi
c
Coun
t
STRATUM
ONE
Little Bassa 22 4 4 7 6 7 1 3
Zoe Town 26 4 1 3
Edina City 21 4 2 1 3 3
Ndorkru 11 2
Gorr Town 23 4 3
Kros Town 17
Kpepus
Town 17
Joezon 14
Noryou 20 1
171
STRATUM
TWO
Xwaclakpoge
i Town 25
Central
Kingsville 28 5
Kpans town 15
Pitos Town 24
Tarrs Town 21
Varmah 8
121
STRATUM
THREE
Three
Houses 12
Barkar 14
Barlakor 19 1
Central Edina 3
Duncan
Town 7
Maleskore 3
Borbor
Village 5
Juahs Town 4 1
Troublegar
Village 3
70
Compound 1 2 23 3 19 2 3

53
GRAND
TOTAL 362 16 11 30 15 30 3 3

54
Annex IV: Mapping Data on All Communities in the Catchment Area
POLITICAL DEMORGRAPHY GENERAL SERVICE FACILITIES RELIGION
UTM GPS
COORDINATES
SETTLEMEN
T CLAN
DW
EL
UNI
TS
POPUL
ATION
HOUS
EHOL
D
DRINK
WATER
HEA
LTH
SC
HO
OL MILL S
POL
ICE
CHU
RCH
MOS
QUE
EASTIN
G
NORTHI
NG
1 LITTLE BASSA
SONEWEI
N 118 2378 137 Hand Pump Clinic
prim
ary No 3 0
365427.6
0 667066.69
2 KPAIN TOWN
SONEWEI
N 21 315 29
Running
Water No No No 1 0
368131.9
2 667528.41
3 JUAHS TOWN
SONEWEI
N 4 11 4
Running
Water No No No 0 0
369067.0
7 666694.26
4 GAYE TOWN
SONEWEI
N 9 35 10
Running
Water No No
Sugar
Cane No 0 0
369624.3
4 667650.00
5 TARRS TOWN
SONEWEI
N 21 95 25
Running
Water No No
Sugar
Cane No 1 0
371750.1
7 667086.53
6 KPORS TOWN
SONEWEI
N 10 45 15
Running
Water No No
Sugar
Cane No 2 0
372951.3
3 667668.54
7
WILLIAM
MISSION
TOWN
SONEWEI
N 9 90 23
Running
Water No No
Sugar
Cane No 1 0
372424.6
9 665621.11
8
GARJAY
TOWN
SONEWEI
N 3 11 4
Running
Water No No No No 0 0
372128.6
7 664712.56
9 SOMA VILLAGE
GBASOH
N 1 15 4
Running
Water No No No No 0 0
372335.2
5 664517.42
10 PITOS TOWN
GBASOH
N 11 58 29
Running
Water No No No No 1 0
372306.6
3 663384.52
11
CENTRAL
EDINA
GOWEN
GBO 9 50 14 Open Well
379857.5
6 655602.00
12 VARMAH
SONEWEI
N 20 66 22
Running
Water No No No No 1 0
370725.8
2 661089.88
13 SAND TOWN
GOWEN
GBO 18 92 18
Running
Water No No No No No
376638.6
1 657577.29

55
14
CENTER
KINGSVILLE
GOWEN
GBO 23 118 36
Running
Water No No No No 1 0
375868.0
6 658349.08
15
BENYONS
TOWN
WENZO
HN 10 41 11 No No No No 0 0
362213.5
7 672387.77
16 KROS TOWN
WENZO
HN 45 195 70 Pump/Water No No No No 1 0
364449.1
8 673367.93
17 JAHN TOWN
SONEWEI
N 13 96 23 Open Well No No No No 0 0
365882.6
9 673234.01
18 BEN LOGAN
SONEWEI
N 22 102 15 Open Well No No No No 1 0
366756.2
0 673408.63
19 SAYE TOWN
SONEWEI
N 18 105 22 Hand Pump No No No No 1 0
367910.3
3 673310.09
20
MYUAH
TOWN
SONEWEI
N 25 130 27 Hand Pump No No No No 1 0
369036.8
4 673639.09
21
OLD LADY
VILLAGE
SONEWEI
N 9 37 15
Running
Water No No No No 0 0
370084.7
0 674300.20
22
ROAD SITE
OFFICE
construct
ion site
office
366825.5
7 672802.79
23
JACKSON
VILLAGE
WENZO
HN 9 63 17 Open Well No No No No 0 0
365729.4
5 675370.63
24 GARANIE
SONEWEI
N 6 27 6
Running
Water No No No No 0 0
365516.8
5 675616.35
25
MASSA
VILLAGE
WENZO
HN 4 23 4 Open Well No No No No 0 0
365313.4
7 675926.39
26
JAYWEE
TOWN
SONEWEI
N 5 14 5 Open Well No No No No 0 0
366789.6
6 676146.31
27 JOEZON
SONEWEI
N 23 135 60
Running
Water No No No No 1 0
365856.7
7 677355.25
28
BOBOR
VILLAGE
SONEWEI
N 6 15 6
Running
Water No No No No 1 0
364160.2
3 671964.93
29 GBAH TOWN
SONEWEI
N 6 24 6
Running
Water No No No No 0 0
365428.0
0 672015.00
30 GORR TOWN
SONEWEI
N 50 194 75 Hand Pump No No No No 1 0
364743.5
1 671527.97

56
31
NORYOU
TOWN
SONEWEI
N 27 121 33
Running
Water No
prim
ary Rice No 1 0
366735.5
5 671539.98
32 ZOE TOWN
SONEWEI
N 65 408 117 Hand Pump No
prim
ary
Sugar
Cane No 1 0
369138.0
0 669614.00
33 ZEON TOWN
SONEWEI
N 20 163 30 Hand Pump No No
Sugar/Ric
e No 1 0
370437.9
3 670909.60
34
GARKONDO
VILLAGE
SONEWEI
N 6 22 11
Running
Water No No No No 0 0
370589.5
8 670663.70
35
GURKPAH
TOWN
SONEWEI
N 15 43 18
Running
Water No No
Sugar
Cane No 1 0
371646.9
0 669939.77
36
YORCEE
TOWN
SONEWEI
N 17 63 26
Running
Water No No
Sugar
Cane No 1 0
372052.0
2 669279.83
37
TROUBLEGAR
VILLIAGE
SONEWEI
N 4 8 4
Running
Water No No No No 0 0
370307.7
9 668203.23
38
CEEGAR
TOWN
SONEWEI
N 5 13 8
Running
Water No No
Sugar
Cane No 1 0
370605.1
1 668159.36
39 PAYTO TOWN
370585.2
1 669254.66
40 NDORKRU
SONEWEI
N 81 140 81
Running
Water No No No No 1 0
372718.2
2 660494.61
41 PLUNKOR
GOWEN
GBO 17 75 17 Hand Pump No No No No 1 0
377051.2
1 657255.5
42 GBAYU
SONEWEI
N 2
House is
always
closed
366825.6
7 672597.35
43 WOE TOWN
SONEWEI
N 6 24 8
Running
Water No No No No 0 0
372205.8
0 661336.52
44 BARKAR
SONEWEI
N 18 71 17
Running
Water No No No No 0 0
373338.9
5 659989.25
45
JOHNNY
TOWN
GOWEN
GBO 9 43 13 Open Well No No No No 0 0
374160.0
7 659272.97
46
DUNCAN
TOWN
GOWEN
GBO 11 38 11
Running
Water No No No No 1 0
375453.8
4 658588.81
47
NYENHEYAN
VILLAGE
SONEWEI
N 17 67 17
Running/Open
well No No No No 0 0
367758.0
0 664423.00

57
48 BARLAKOR
SONEWEI
N 14 80 16
Running
Water No No No No 1 0
368803.7
8 663342.46
49
THREE
HOUSES
SONEWEI
N 11 79 18 Hand Pump No No No No 1 0
365759.6
0 666589.65
50
XWACLAKPO
GEI TOWN
SONEWEI
N 44 284 44
Running/Hand
Pump No No No No 0 0
365034.7
1 667633.01
51
BARNES
TOWN
GOWEN
GBO 7 25 6 Open Well No No No No 0 0
374395.8
3 659799.21
52 GODBA
GOWEN
GBO 5 14 4 Open Well No No No No 0 0
374651.2
2 660125.29
53 MALESKORE
SONEWEI
N 12 46 9 Open Well No No No No 1 0
366074.0
0 666131.00
54 EDINA CITY
GOWEN
GBO 32 415 112 Hand Pump 1
2-
prim
ary cassava 1 2
380980.1
8 654906.15
55 GUES TOWN
LOVEVILL
E 9 50 11
Running
Water
371752.2
5 675197.04
56
BARWIN
TOWN
SONEWEI
N 14 127 17
Running
Water
366784.3
1 669933.97
57
SOMAYOU
TOWN
SONEWEI
N 14 67 17
Running
Water
368460.8
3 672004.08
58
SAYWLACON
VILLAGE
SONEWEI
N 8 39 10
Running/Open
well
370620.7
9 672560.17
59 KPANS TOWN
LOVEVILL
E 24 192 31
Protected
Well
372827.6
8 671736.15
60 TITOS TOWN 12 51 18
Running
Water 371611.5 673511.33
61
SOUCON
TOWN
LOVEVILL
E 34 170 40
Running
Water
371659.5
5 674345.99
62 WLAKON
LOVEVILL
E 28 208 36
Running/Hand
Pump
371579.3
1 671614.32
63 TAKPA TOWN
SONEWEI
N 21 160 47
Running
Water
369559.4
6 672280.97
64
KPEPUS
TOWN
LOVEVILL
E 36 250 70 Hand Pump
371973.6
5 672879.52

58
65
COMPOUND
ONE
SONEWEI
N 41 518 41
Running/Hand
/Open
365716.3
2 678203.03
1214 8654 1690
Annex V. List of Agreed Foreign Assistance Indicators
USAID requested LSA to select indicators from across the USAID/Liberia portfolio to measure the effects of the Compound 1 – Edina Road
Rehabilitation. The indictors will include standard F indicators and custom indicators. Based on discussions between LSA and USAID on May 11, 2017, the
Edina Road Rehabilitation Project Baseline Survey will take baseline measurements for the following indicators:
Indicator Origin Data Collection Method Comments
EG.3-6 Farmer's gross margin
per hectare obtained with
USG assistance
New and Updated F Indicator Household survey, per
Performance Indicator
Reference Sheet (PIRS)
Subcontract SBA will
measure through
household survey
questionnaire and
according to PIRS
EG.3-7 Farmer's gross margin
per animal obtained with USG
assistance
New and Updated F Indicator Household survey, per PIRS Subcontract SBA will
measure through
household survey
questionnaire and
according to PIRS
EG.3.2-19 Value of smallholder
incremental sales generated
with USG assistance
New and Updated F Indicator Household survey, per PIRS Subcontract SBA will
measure through
household survey
questionnaire and
according to PIRS
Prices of staple goods at the
market
Custom indicator based on
Qualitative Assessment of Farm-
to-Market Road
Rehabilitation by LSA in August
2016
Household survey Subcontractor SBA will
develop a related question
in the household survey
questionnaire to measure
this indicator
USD profits from sales of
select goods
Custom indicator based on
Qualitative Assessment of Farm-
to-Market Road
Rehabilitation by LSA in August
2016
Household survey Subcontractor SBA will
develop a related question
in the household survey
questionnaire to measure
this indicator
USD savings from sales of
select goods
Custom indicator based on
Qualitative Assessment of Farm-
to-Market Road
Household survey Subcontractor SBA will
develop a related question
in the household survey

59
Rehabilitation by LSA in August
2016
questionnaire to measure
this indicator
Price of fuel Custom indicator based on
Qualitative Assessment of Farm-
to-Market Road
Rehabilitation by LSA in August
2016
Household survey Subcontractor SBA will
develop a related question
in the household survey
questionnaire to measure
this indicator
Transportation cost for goods Custom indicator based on
Qualitative Assessment of Farm-
to-Market Road
Rehabilitation by LSA in August
2016
Household survey Subcontractor SBA will
develop a related question
in the household survey
questionnaire to measure
this indicator
Transportation cost for people Custom indicator based on
Qualitative Assessment of Farm-
to-Market Road
Rehabilitation by LSA in August
2016
Household survey Subcontractor SBA will
develop a related question
in the household survey
questionnaire to measure
this indicator
Frequency of student
attendance
Custom indicator based on
Qualitative Assessment of Farm-
to-Market Road
Rehabilitation by LSA in August
2016
Household survey Subcontractor SBA will
develop a related question
in the household survey
questionnaire to measure
this indicator
Number of school supply
deliveries per quarter
Custom indicator based on
Qualitative Assessment of Farm-
to-Market Road
Rehabilitation by LSA in August
2016
Household survey Subcontractor SBA will
develop a related question
in the household survey
questionnaire to measure
this indicator
Number of visits by
supervisory county-level
government staff
Custom indicator based on
Qualitative Assessment of Farm-
to-Market Road
Rehabilitation by LSA in August
2016
Household survey Subcontractor SBA will
develop a related question
in the household survey
questionnaire to measure
this indicator
Number of visits by supervisory district-level
government staff
Custom indicator based on Qualitative Assessment of Farm-
to-Market Road
Rehabilitation by LSA in August
2016
Household survey Subcontractor SBA will develop a related question
in the household survey
questionnaire to measure
this indicator
Number of patients brought by
ambulance, car, motorbike,
wheelbarrow, and foot
Custom indicator based on
Qualitative Assessment of Farm-
to-Market Road Rehabilitation by LSA in August
2016
Household survey Subcontractor SBA will
develop a related question
in the household survey questionnaire to measure
this indicator
Number of ANC visits Custom indicator based on
Qualitative Assessment of Farm-
to-Market Road
Household survey Subcontractor SBA will
develop a related question
in the household survey
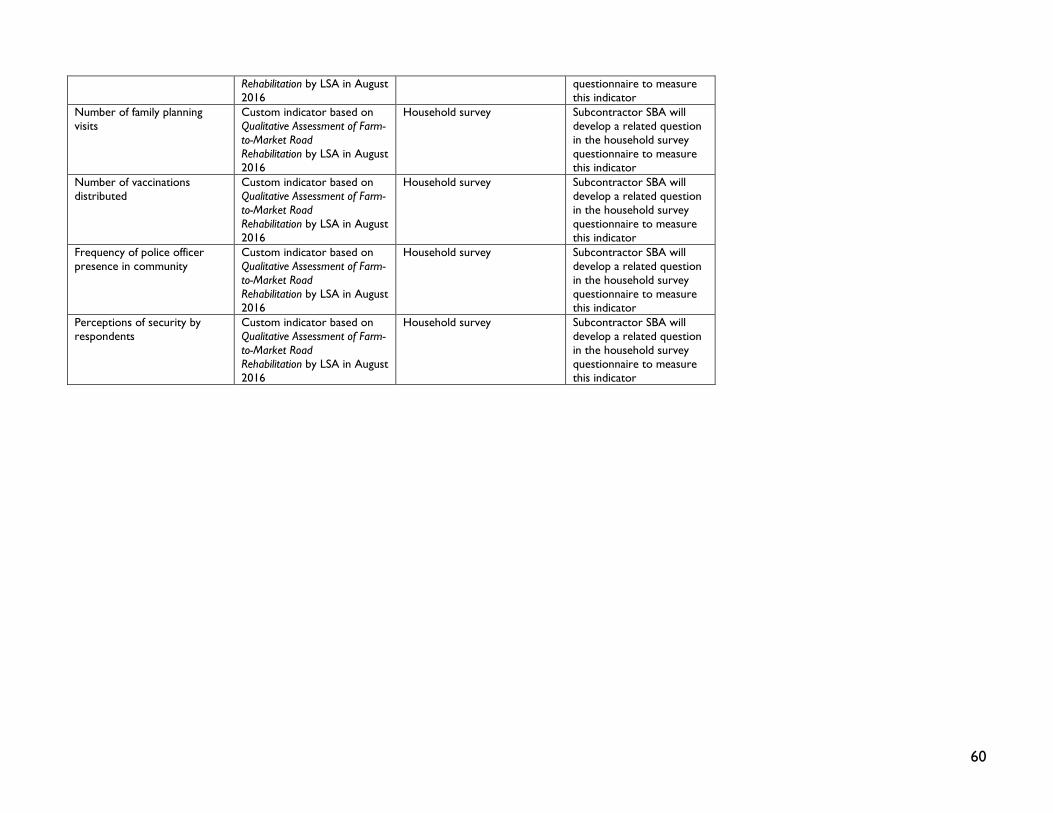
60
Rehabilitation by LSA in August
2016
questionnaire to measure
this indicator
Number of family planning
visits
Custom indicator based on
Qualitative Assessment of Farm-
to-Market Road
Rehabilitation by LSA in August
2016
Household survey Subcontractor SBA will
develop a related question
in the household survey
questionnaire to measure
this indicator
Number of vaccinations
distributed
Custom indicator based on
Qualitative Assessment of Farm-
to-Market Road
Rehabilitation by LSA in August
2016
Household survey Subcontractor SBA will
develop a related question
in the household survey
questionnaire to measure
this indicator
Frequency of police officer
presence in community
Custom indicator based on
Qualitative Assessment of Farm-
to-Market Road
Rehabilitation by LSA in August
2016
Household survey Subcontractor SBA will
develop a related question
in the household survey
questionnaire to measure
this indicator
Perceptions of security by
respondents
Custom indicator based on
Qualitative Assessment of Farm-
to-Market Road
Rehabilitation by LSA in August
2016
Household survey Subcontractor SBA will
develop a related question
in the household survey
questionnaire to measure
this indicator