Baseline Household Survey January 2008 - Guardian
46
Katine Community Partnerships Project 1 Katine Community Partnerships Project Baseline Household Survey January 2008
Transcript of Baseline Household Survey January 2008 - Guardian

Katine Community Partnerships Project
1
Katine Community Partnerships Project
Baseline Household Survey
January 2008

Katine Community Partnerships Project
2
Katine Sub County, Soroti District

Katine Community Partnerships Project
3
Acknowledgements
We would like to express our thanks to all of the families in Katine sub county whose participation made this survey possible. We would also like to thank the local village councillors (LC 1) and other community members for their efforts to inform village residents about the survey and to assist the field teams in mapping villages and households. We are also grateful for the continuous support and cooperation of the Soroti District officials.
We would like to thank the experienced team from the Uganda Bureau of Statistics for their excellent work in training and supervising the field teams ensured the high level of success and accuracy of the survey. Thanks are also due to Katine project staff for organizing and coordinating the survey and to Ms. Rebecca Copeland for her assistance in analyzing the data and preparing this report.
Joshua Kyallo Country Director, AMREF Uganda

Katine Community Partnerships Project
4
Table of Contents
Executive Summary .............................................................................................5
I. Background .....................................................................................................10
2. Household Characteristics............................................................................14
3. Household Water Sources ............................................................................15
4. Household Sanitation and Hygiene ..............................................................20
5. Reproductive Health ......................................................................................23
6. HIV/AIDS Knowledge .....................................................................................26
7. Fever/Malaria .................................................................................................31
8. Home-based care and community sensitization -- Village Health Teams.34
9. Household Food Security and Livelihood ...................................................35
10.Conclusions and Recommendations ..........................................................39

Katine Community Partnerships Project
5
Executive Summary
Katine Baseline Household Survey In January, 2008, the Katine Community Partnerships Project (KCPP carried out a household survey to assess baseline conditions and identify priority areas for intervention in Katine sub county and its six parishes. Information was collected from households about areas targeted for improvement by KCPP including knowledge and use of health services, access to safe water and sanitation facilities, food security and access to livelihoods support. This same survey will be conducted again in 2010 in the same households to assess what improvements have occurred as a result of project interventions.
Information was obtained from 95 households randomly selected from the 66 villages in Katine sub county using a sampling method, the Lot Quality Assurance Technique (LQAS) that is designed to ensure that:
! every household in every village in Katine sub county had an equal chance of being selected; and
! the sample, though small, provides reliable estimates of coverage of indicators for a project area and identifies priority areas for intervention within the project area with 90 percent confidence.
A general household questionnaire was administered to all 95 households and separate individual questionnaires administered to specific groups of interest: women of reproductive age 15-49 years, caretakers of children under five years and men aged 15-49 years. Table 1 shows the sample sizes obtained in each parish.
Table 1. Household and individual interviews Parish
Merok Olwelai Ojom Katine/ Ojama
Ochuloi Total
sample Number of households 19 19 19 19 19 95 Children < five years (U5) 41 35 32 39 38 185 Women 15-49 years 22 22 23 22 29 118 Men 15-49 years 25 23 24 23 24 119
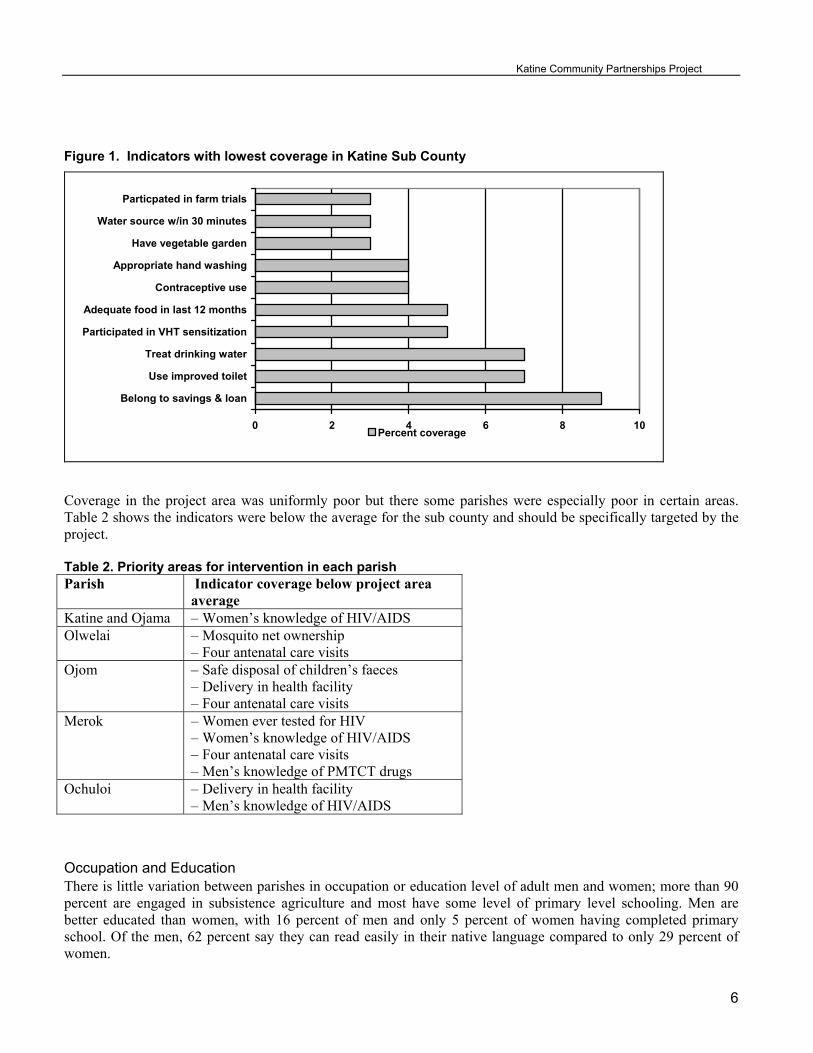
Summary of Findings Overall baseline conditions in Katine sub county were uniformly poor with regard in access to safe water, latrine coverage, hygiene practices, prevalence of malaria and diarrhoea in young children, delivery in health facilities, food security, and use of livelihood support services. A comparison of Katine indicators with that from the 2006 Uganda Demographic and Health Survey shows that overall baseline conditions for the Katine population are worse than the average for rural areas of the country. Indicators that were particularly poor across the entire sub county are shown in Figure 1. Improving coverage of any one of these basic indicators would contribute to improving the health and lives of Katine residents. The fact that these basic indicators are so low suggests a community in critical need of empowerment with information, tools, and basic inputs so that they can improve their own capacity for making a positive difference in their lives.
Katine Community Partnerships Project
6
Figure 1. Indicators with lowest coverage in Katine Sub County
0 2 4 6 8 10
Belong to savings & loan
Use improved toilet
Treat drinking water
Participated in VHT sensitization
Adequate food in last 12 months
Contraceptive use
Appropriate hand washing
Have vegetable garden
Water source w/in 30 minutes
Particpated in farm trials
Percent coverage
Coverage in the project area was uniformly poor but there some parishes were especially poor in certain areas. Table 2 shows the indicators were below the average for the sub county and should be specifically targeted by the project. Table 2. Priority areas for intervention in each parish Parish Indicator coverage below project area
average Katine and Ojama – Women’s knowledge of HIV/AIDS Olwelai – Mosquito net ownership
– Four antenatal care visits Ojom – Safe disposal of children’s faeces
– Delivery in health facility – Four antenatal care visits
Merok – Women ever tested for HIV – Women’s knowledge of HIV/AIDS – Four antenatal care visits – Men’s knowledge of PMTCT drugs
Ochuloi – Delivery in health facility – Men’s knowledge of HIV/AIDS
Occupation and Education There is little variation between parishes in occupation or education level of adult men and women; more than 90 percent are engaged in subsistence agriculture and most have some level of primary level schooling. Men are better educated than women, with 16 percent of men and only 5 percent of women having completed primary school. Of the men, 62 percent say they can read easily in their native language compared to only 29 percent of women.
Katine Community Partnerships Project
7
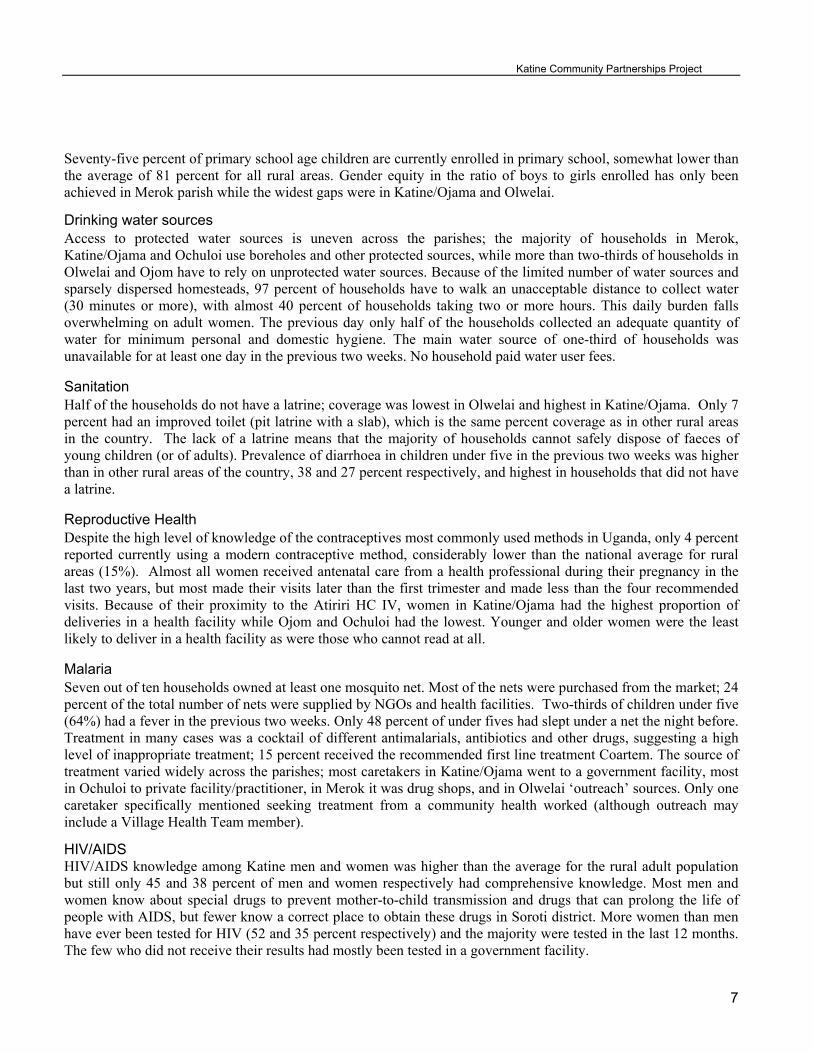
Seventy-five percent of primary school age children are currently enrolled in primary school, somewhat lower than the average of 81 percent for all rural areas. Gender equity in the ratio of boys to girls enrolled has only been achieved in Merok parish while the widest gaps were in Katine/Ojama and Olwelai.
Drinking water sources Access to protected water sources is uneven across the parishes; the majority of households in Merok, Katine/Ojama and Ochuloi use boreholes and other protected sources, while more than two-thirds of households in Olwelai and Ojom have to rely on unprotected water sources. Because of the limited number of water sources and sparsely dispersed homesteads, 97 percent of households have to walk an unacceptable distance to collect water (30 minutes or more), with almost 40 percent of households taking two or more hours. This daily burden falls overwhelming on adult women. The previous day only half of the households collected an adequate quantity of water for minimum personal and domestic hygiene. The main water source of one-third of households was unavailable for at least one day in the previous two weeks. No household paid water user fees.
Sanitation Half of the households do not have a latrine; coverage was lowest in Olwelai and highest in Katine/Ojama. Only 7 percent had an improved toilet (pit latrine with a slab), which is the same percent coverage as in other rural areas in the country. The lack of a latrine means that the majority of households cannot safely dispose of faeces of young children (or of adults). Prevalence of diarrhoea in children under five in the previous two weeks was higher than in other rural areas of the country, 38 and 27 percent respectively, and highest in households that did not have a latrine.
Reproductive Health Despite the high level of knowledge of the contraceptives most commonly used methods in Uganda, only 4 percent reported currently using a modern contraceptive method, considerably lower than the national average for rural areas (15%). Almost all women received antenatal care from a health professional during their pregnancy in the last two years, but most made their visits later than the first trimester and made less than the four recommended visits. Because of their proximity to the Atiriri HC IV, women in Katine/Ojama had the highest proportion of deliveries in a health facility while Ojom and Ochuloi had the lowest. Younger and older women were the least likely to deliver in a health facility as were those who cannot read at all.
Malaria Seven out of ten households owned at least one mosquito net. Most of the nets were purchased from the market; 24 percent of the total number of nets were supplied by NGOs and health facilities. Two-thirds of children under five (64%) had a fever in the previous two weeks. Only 48 percent of under fives had slept under a net the night before. Treatment in many cases was a cocktail of different antimalarials, antibiotics and other drugs, suggesting a high level of inappropriate treatment; 15 percent received the recommended first line treatment Coartem. The source of treatment varied widely across the parishes; most caretakers in Katine/Ojama went to a government facility, most in Ochuloi to private facility/practitioner, in Merok it was drug shops, and in Olwelai ‘outreach’ sources. Only one caretaker specifically mentioned seeking treatment from a community health worked (although outreach may include a Village Health Team member).
HIV/AIDS HIV/AIDS knowledge among Katine men and women was higher than the average for the rural adult population but still only 45 and 38 percent of men and women respectively had comprehensive knowledge. Most men and women know about special drugs to prevent mother-to-child transmission and drugs that can prolong the life of people with AIDS, but fewer know a correct place to obtain these drugs in Soroti district. More women than men have ever been tested for HIV (52 and 35 percent respectively) and the majority were tested in the last 12 months. The few who did not receive their results had mostly been tested in a government facility.

Katine Community Partnerships Project
8
Food security and Livelihoods Almost all households (95%) experienced food shortages in the previous 12 months, with younger households and those in Merok experiencing the longest shortages. Fifteen percent of households have only one meal a day. Although almost all households rear small animals and/or poultry, only a few households have a vegetable garden to supplement their diet. Only a minority of households used available services such as community animal health workers (19%) or had a member who belonged to a savings and loan group (9%)
A summary of the percent coverage of key indicators is shown on the following page.
Recommendations The survey found that the population of Katine sub county is in great need of better access to basic preventive and support services to improve household health and livelihoods. AMREF and partners will use these findings to target their project interventions to where they are most needed as part of their efforts to improve health in Soroti district.
1. Efforts should continue to focus on increasing the proportion of households that have access to safe water
throughout the year. Reducing the distance that households have to go to collect water should have a major positive effect on women’s lives in particular.
2. Sanitation and hygiene levels are very poor and contributing to the poor health of young children. Improvements in latrine coverage must be complemented by education on appropriate hand washing and other hygiene practices for the full health impact of sanitation improvements to be realized. Disseminating information on how to treat water to make it safer will also contribute to improved health.
3. Strategies must be developed for reaching women who, because of age, lack of education or place of residence, face greater obstacles in accessing reproductive health services, particularly family planning, assistance during delivery, and postpartum care. Health providers must ensure all women receive quality antenatal care plus intermittent preventive treatment for malaria and PMTCT services.
4. To reduce the high prevalence of malaria, partners need to obtain the free insecticide-treated mosquito nets available from the MOH and NGOs to increase the proportion of young children (and pregnant women) sleeping under nets. Local health workers (government health workers and private practitioners) and owners of drug shops need to be trained on the importance of correct diagnosis and treatment for malaria.
5. Efforts should continue to train and equip Village Health Teams to enable them to provide the full range of community-based treatment and sensitization activities as intended by the MOH. Systems and procedures must be in place to ensure the teams are regularly supervised and supplied with basic medicines and other commodities.
6. Further information must be collected on what agricultural and financial support services are available and how they can be accessed by Katine households. Without these essential inputs, households, particularly young families and those with ten or more members, will continue to be vulnerable to shortages of food and other necessities.
7. Despite the gains of the Universal Primary Education program, a significant proportion of primary-school age children are not enrolled in school and girls are still less likely to attend school than boys. Increasing school enrolment may be contingent upon improvements in areas such as household access to water and income-generating opportunities, as well as the planned sanitation facilities especially for girls.

Katine Community Partnerships Project
9
SUMMARY OF
PERCENT COVERAGE OF KEY PROGRAM INDICATORS
Water, Sanitation and Hygiene
Percentage of
Households
Fever/malaria Percentage of children < 5 years of age
Households use improved source of drinking water
52% Had fever in previous two weeks
64
Households within acceptable distance to water source (takes less than 30 minutes)
3% Sought outside treatment for fever 79
Quantity of water collected previous day meets minimum standard (15 litres+ pp/pd)
48% Child slept under mosquito net previous night
48
Household water source available every day in previous two weeks
67% Reproductive Health Percentage of Women
(15-49 years)
Households use improved latrine facility
7% Know a place to obtain 86
Child <5 years had diarrhoea in previous two weeks
38% Currently using a modern
contraceptive
4
Safe disposal of children’s faeces 42% Made recommended four antenatal care visits during pregnancy in previous two years
36
Livelihoods Percentage of
Households
Delivered in health facility 33
Experienced food shortage in previous 12 months
95 HIV/AIDS % of Women
15-49
% of Men
15-49
Have two or more meals a day 85 Have comprehensive knowledge of HIV/AIDS
38 45
Have vegetable garden 3 Ever tested for HIV 52 35
Own small animals or birds (goats, chickens, pigs etc.)
94 Tested in previous 12 months 80 79
Used services of community animal health worker in previous 12 months
19 Know about drug for prevention of mother-to-child transmission of HIV
82 77
Household has member who belongs to savings and loan group
9 Know about drugs for treating AIDS 84 98

Katine Community Partnerships Project
10
I. Background
1.1 Introduction
The African Medical and Research Foundation (AMREF), in partnership with the Guardian and Barclays, is implementing a three-year community-based development project in Katine sub county, Soroti District to improve the lives of the estimated 30,000 Katine residents while simultaneously giving Guardian readers and AMREF supporters the chance to see how long-term community development works throughout the lifetime of one project.
The overall goal of the project is to improve the health of the population of Katine sub county by increasing the population’s access to and use of health and other basic services to which they have a right.
The KCPP goal and design is aligned with Uganda’s Poverty Eradication Action Plan (PEAP) 2004/5-2007/8 which provides the overarching framework for national development and achieving the Millennium Development Goals. The human development pillar of the PEAP recognises that a healthy and well educated population is a necessary condition for development and prioritises improving health outcomes through the involvement of various sectors, primary and secondary education, increasing people’s ability to plan their family size, and community empowerment
The project’s five project components all directly affect the health of a population: health services, education, water and sanitation, livelihoods, and empowerment. Each component has a primary objective which contributes to the overall goal:
Component Objective
Health services Improved knowledge, access and utilization of health services
Education Improved access to and quality of education
Water and sanitation Improved access to safe water and sanitation and better hygiene practices
Livelihoods Improved economic opportunities
Empowerment Communities empowered to engage in local governance
The project goal and objectives of each component will be achieved through two common strategies to bring about effective and sustainable improvements in the Katine communities:
! Establishment of community partnerships to enable residents to better communicate their strengths and needs to the formal sector, specifically health services. Through partnerships, communities are linked to each other and to the chain of decision-makers and resources at higher levels of the formal system.
! Building capacity of community-owned structures and local services to effectively respond to the health
problems and better meet the needs of the Katine community. Improving the skills and knowledge community-based workers and those in the formal sector, and improving their organisational management and information systems, is essential for improving the quality and delivery of basic services.

Katine Community Partnerships Project
11
Katine sub county was selected because of the high levels of poverty, low health and education indicators, the negative impacts civil war and rural–urban migration are having on the area, and because, as an area reliant on agriculture, it is being badly affected by changing climate patterns. Like most of rural Uganda, there is a gap between the formal services being provided by government structures and the local community.
Launched in early October 2007, the Katine Community Partnerships Project (KCPP) is being implemented through partnerships with local government structures at district, sub county and parish level and community organisations including Farmers Groups, Village Health Teams, Parent Teacher Associations, and Water Source Committees. The project will develop the skills of both formal workers (teachers, health workers, government employees) and community volunteers who are delivering essential services to the community. The KCPP will also provide essential inputs such as new and rehabilitated water sources, materials for building improved latrine facilities, new classrooms and educational materials, funds for sensitization activities, mosquito nets and bicycles for Village Health Teams, laboratory equipment and supplies for health facilities.
With the community and local stakeholders, the project will use a variety of methods to monitor progress and assess the effectiveness of project activities throughout the life of the project. This baseline Household Survey is the first measurement of a set of household-level project indicators. The Household Survey focuses primarily on indicators related to health (knowledge and practice), water and sanitation (access), and household food security and livelihoods (assets, access). This same survey will be repeated again at the end of the project in the same households to assess what changes have taken place during the intervening period. The Household Survey is only one of the tools being used for monitoring and evaluation.
A baseline Community Survey, conducted in November 2007, obtained information on infrastructure, services and resources available in all of Katine’s 66 villages, 13 schools and three health facilities. The school component of the Community Survey is the primary tool for monitoring change in schools as a result of project interventions and it will be repeated annually, as will the health facility component which looks at service utilization and facility improvements. The activities and performance of community groups will be monitored as an indicator of community empowerment and the project will also document case studies, success stories, and testimonies to show how project inputs and the twin strategies of community partnerships and capacity building have affected Katine communities.
1.2 Survey Objectives The primary objectives of the household survey were to provide KCPP project managers, local government and community partners with:
! up-to-date information on the percent coverage of key indicators in health, water and sanitation, hygiene, and livelihoods;
! knowledge of the intervention areas that require priority attention; ! baseline measures that can be used to document change over time as a result of project interventions.
.
1.3 Sample and Survey Methodology
Survey Sample The sample for the baseline household survey was designed to provide estimates of selected indicators for Katine sub county which includes six parishes and 65 villages. The Lot Quality Assurance Sampling (LQAS) technique was used in the household survey because it has many of the advantages of random sampling but simplifies the process and is less costly because of the small sample sizes needed.

Katine Community Partnerships Project
12
Following the LQAS method, Katine sub county was divided into five ‘lots’: four of the lots followed the existing parish boundaries (Merok, Ochuloi, Ojom, Olwelai) and for the fifth lot two neighbouring parishes were combined (Katine and Ojama) into one lot. 1A sampling frame was developed using village population estimates obtained in a November 2007 community survey of Katine sub county. The locations of the 19 households to be interviewed in each parish/lot were identified using a process that produced a random sample proportional to size of village population (see Appendix A). The process ensured that every household in every village in Katine sub county had an equal chance of being selected. At the interview location, field interviewers were assisted by village leaders to draw maps of the village and, using random numbers, select the households to interview.
The total sample of 95 households provides sufficient data to estimate the level of coverage of an indicator for the project area with 90 percent confidence; a margin of error of 10 percent was considered reasonable given the costs of increasing the sample size and the marginal gains in statistical precision. The LQAS technique provides reliable estimates of indicator coverage for a program area and can also identify whether specific indicators within a lot/parish are below average and in need of additional support. The overall coverage in the program area population was estimated by weighting the indicator percentages from each of the five areas by their percentage of the total population size. 2To identify which indicators in a parish/lot were below average, i.e. should be targeted for support, a specially developed LQAS Decision Rule table was used which provides cut-off points depending up sample sizes and project area coverage.
In this report, all core program indicators with sample sizes of 30 or less in each area are presented in tables identified with (LQAS) in the title to show that the results were weighted and subjected to the LQAS Decision Rule table. Indicators with sample sizes of more than 30 in each area are weighted but not subject to the LQAS Decision Rule test, as sample sizes are large enough in each area for coverage estimates to be made using straight percentages.
Questionnaires The questionnaires were developed based on KCPP monitoring and evaluation indicators. Most of the questions regarding health were based on the 2006 Uganda Demographic and Health Survey (UDHS) questionnaire; water, sanitation and hygiene questions are based on WHO/UNICEF model questionnaires; and questions related to livelihood and education were selected by the KCPP team.
Four types of questionnaires were administered in each household covering different topic areas:
! household questionnaire ! women 15-49 years ! men 15-49 years ! caretakers of children under five years of age
The questionnaires were developed, translated and pre-tested by a team of experienced survey personnel contracted from the Uganda Bureau of Statistics (UBOS). The team was also responsible for training field interviewers and supervisors and providing overall supervision of the field work.
The English versions of the questionnaires were translated into two languages, Ateso and Kumam, and pre-tested in December 13-15, 2007. Based on the results of the pre-test revisions were made to the wording and translation of the questionnaires.
1 Until Oct 2007, Katine and Ojama were one parish. For the purpose of this survey, these two parishes combined to make a fifth ‘lot’. 2
Katine Community Partnerships Project
13
Fieldwork Ten field staff (five native Kumam speakers and five Ateso speakers) were trained for six days from 14-20 January 2008 by three experienced UBOS trainers. The training included a one-day field practice session. Field work took place in the week of January 21-27, 2008. The field personnel were divided into two teams each with four interviewers, one supervisor and one driver. Two UBOS supervisors provided overall supervision
Data Processing Data were entered in SPSS files by two KCPP staff who participated in developing the questionnaires. For quality control, all data entry records were checked manually against the original questionnaires by the same two staff and internal consistency checks were carried out. Data processing took place from 29 January to 27 February, 2008.
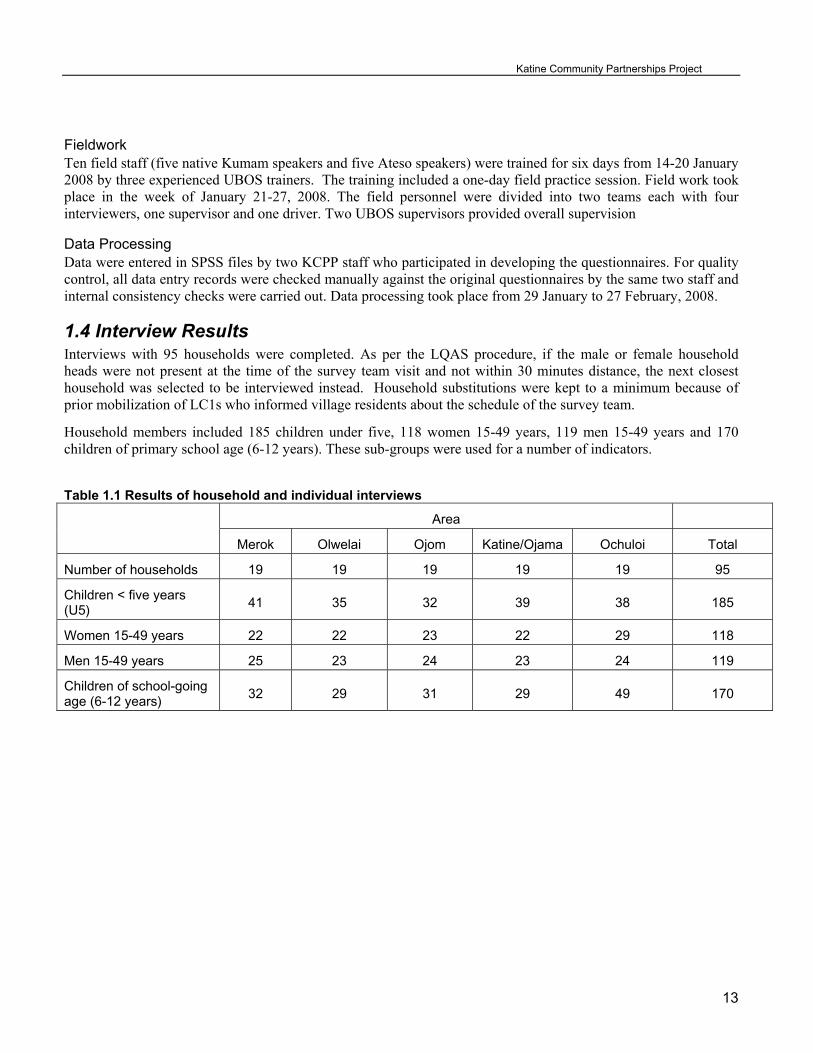
1.4 Interview Results Interviews with 95 households were completed. As per the LQAS procedure, if the male or female household heads were not present at the time of the survey team visit and not within 30 minutes distance, the next closest household was selected to be interviewed instead. Household substitutions were kept to a minimum because of prior mobilization of LC1s who informed village residents about the schedule of the survey team.
Household members included 185 children under five, 118 women 15-49 years, 119 men 15-49 years and 170 children of primary school age (6-12 years). These sub-groups were used for a number of indicators.
Table 1.1 Results of household and individual interviews
Area
Merok Olwelai Ojom Katine/Ojama Ochuloi Total
Number of households 19 19 19 19 19 95
Children < five years (U5)
41 35 32 39 38 185
Women 15-49 years 22 22 23 22 29 118
Men 15-49 years 25 23 24 23 24 119
Children of school-going age (6-12 years)
32 29 31 29 49 170

Katine Community Partnerships Project
14
2. Household Characteristics
2.1 Household Composition Table 2.1 shows the household population is very young. Of the total 684 usual household residents, 62 percent were under the age of 15 and only 2 percent were 50 or older. This is a young population in comparison even to the total rural population for the country where 54 percent are under 15 years (UDHS 2006). Children under five years of age accounted for 27 percent of household members. Women of reproductive age 15-49 years and men age 15-49 accounted for 36 percent. Males outnumbered females, 54 percent to 46 percent respectively.
Table 2.1 Distribution of survey household population by age group and sex
101 87 188
28% 27% 27%
137 100 237
37% 32% 35%
122 121 243
33% 38% 36%
7 9 16
2% 3% 2%
367 317 684
100% 100% 100%
0-4 yrs
5-14
15-49
50+
Agegroup
Total
Male Female
Sex
Total
The average number of household members was seven; the minimum was three members and maximum 21 members. One in five households had less than five members, 49 percent have between five and eight members and 30 percent have nine or more members. One household had 21 members because a daughter separated from her husband and brought all her children to live with her parents.
Two-thirds of households contain parents and their children, no other relatives. Of the 35 percent of households that do have other relatives living with them, most are grandchildren (32%) or nieces or nephews by blood (28%). Other relatives include parents or parents in law, niece or nephew by marriage, sons or daughter in law. Only three households had adopted/foster/step children.
2.2 Household Head Education and Occupation Only three of the 95 households are headed by women, the other 92 are headed by men. The great majority of household heads (97%) had some education: 61 percent had some primary schooling, 16 percent completed primary level and 25 percent had some secondary school level or higher. Eighty percent of spouses attended school, 93 percent primary level, of which 5 percent completed, and 7 percent attended O level or higher. There was little difference by area in educational level attained by household heads and spouses except that both Olwelai and Ochuloi had a higher proportion of spouses (32%) that had never attended school.
Nine out of ten household heads gave their primary occupation as subsistence farming and 99 percent of their spouses also are engaged in subsistence farming. Other occupations for household heads included teacher, nurse, motorcycle driver (boda boda), and fishing.

Katine Community Partnerships Project
15
2.3 Primary School Attendance There were a total of 170 children of primary school age (6 to 12 years) in the household population. Overall, 75 percent of the primary school age children are currently attending school, somewhat lower than the 81 percent for all rural areas of the country (UDHS 2006).
In Katine fewer girls (68%) than boys (79%) are currently enrolled in primary school. The figure below shows this to be the case in every area except for Merok, which had the same proportion of boys and girls in school (75%). Overall, Ochuloi has the lowest levels of 6-12 year olds in school and Katine/Ojama and Olwelai had the widest gaps between girl and boy enrolment (19 percentage points).
Figure 2.2 Percentage of 6-12 years olds currently attending school
79 79
94
74 7968
7561
757160
75
0
20
40
60
80
100
Merok (n=32) Olwelai (n=29) Ojom (n=31) Katine/Ojama(n=29)
Ochuloi (n=49) All areas
Per
cen
t
Male Female
As an indicator of parental involvement in education, parents were asked if their children ever did homework outside of school and whether they or someone else helped the child with their homework. Roughly one out of three children (35%) was reported to do homework outside of school and of the great majority were helped frequently or sometimes (70%); the remaining 30 percent were “never” helped with their homework.
3. Household Water Sources
3.1 Type of water source Improved water sources include boreholes, protected wells and springs, and rainwater; unimproved are unprotected wells and springs and surface water from streams, canals, and swamps. The majority of households in Merok,, Katine and Ochuloi use boreholes and protected wells and springs for their drinking water. The opposite is true in Olwelai and Ojom where at least two-thirds of households rely on unprotected water sources for their drinking water.
Table 3.1 Percentage of households by type of main drinking water source, by area
Area Main source of drinking water Merok Olwelai Ojom Katine/Ojama Ochuloi
Total
Protected well/spring 0 11 11 5 0 5

Katine Community Partnerships Project
16
Area Main source of drinking water Merok Olwelai Ojom Katine/Ojama Ochuloi
Total
Borehole 63 21 21 53 74 46
Unprotected spring 5 5 16 0 0 5
Unprotected well 16 63 53 42 26 40
Surface water, stream, canal
11 0 0 0 0 2
Other 5 0 0 0 0 1
Total 100 100 100 100 100 100
Overall, 52 percent of the households surveyed used a protected water source for their drinking water. Ochuloi had the highest household coverage of protected water sources, and Olwelai and Ojom had the worst coverage. These two parishes were right on the borderline of being below average (below average cut off is 6).
Table 3.2 Households using protected water source for drinking water (LQAS 1)
Area Main source of drinking water Merok Olwelai Ojom Katine/Ojama Ochuloi
Total
Improved source 12 6 6 11 14 49
Unimproved source 7 13 13 8 5 46
No. of households 19 19 19 19 19 95
63% 32% 32% 58% 74%
Percent coverage in project area (weighted) 52%
3.2 Distance to source Almost all households had to walk too far to obtain their water: 44 percent took from one up to two hours and 37 percent of households take two or more hours to get collect water from their main source.
Table 3.3 Distribution of households by time taken to collect water Minutes Frequency Percent
<30 minutes 3 3
30-59 15 16
60-119 42 44
120-179 25 26
180 or more 10 11
Total 95 100

Katine Community Partnerships Project
17
Only 3 percent of households were within acceptable reach of their main drinking water source, defined by WHO/UNICEF as less than 30 minutes to go to the source, collect water and return home.
Table 3.4 Households within acceptable reach of drinking water source (LQAS 2)
Area Time taken to collect water Merok Olwelai Ojom Katine/Ojama Ochuloi
Total
Less than 30 minutes
2 0 0 1 0 3
30 minutes or more 17 19 19 18 19 92
No. of households 19 19 19 19 19 95
11% 0% 0% 5% 0%
Percent coverage in project area (weighted) 3%
The figure below shows that in each area the taken by households to collect water varies considerably, presumably because of the limited number of water sources and the varying distances of households and village from the sources. Overall, more households Katine/Ojama take less than an hour to collect water than any other area, and more households in Ochuoli take three or more hours to get water.
Figure 3.1 Time taken to collect water for household
0%20%40%60%80%
100%
Merok Ojom Olwelai Katine &Ojama
OchuloiPer
cen
tag
e o
f h
ou
seh
old
s
<1 hr 1-2hrs 2-3hrs 3 hrs or more
A comparison across supervision areas of the average time for households to collect water shows that Ojom households had the lowest average of 85 minutes per trip and Ochuloi and Olwelai had the highest with 118 minutes.
Only two households used a protected water source and were able to collect water in less than 30 minutes.
Table 3.5 Households using a protected water source and within acceptable reach of drinking water source (LQAS 3)
Area
Merok Olwelai Ojom Katine/Ojama Ochuloi
Total
Improved source and takes less than 30 minutes
1 0 0 1 0 2

Katine Community Partnerships Project
18
Area
Merok Olwelai Ojom Katine/Ojama Ochuloi
Total
No. of households 19 19 19 19 19 95
5% 0% 0% 5% 0%
Percent coverage in project area (weighted) 2%
3.3 Quantity of water Fifteen litres of water per household member per day is the minimum standard quantity necessary for adequate personal and domestic hygiene including drinking water, cooking, cleaning and bathing. It is assumed that the amount collected is the amount used by household members during that day (24 hours).
The calculation was made by dividing the total quantity of water said to have been collected the previous day (estimated in jerry can and other container sizes) by the number of usual residents in the household; if the result was equal to or more than 15 litres or more per person it is defined as adequate, less than that was inadequate Almost half of the households in the survey met that standard. Households in Ojom and Katine/Ojama had the lowest coverage with adequate water (although they were not below the area average).
Table 3.6 Adequate quantity of water collected in previous day (LQAS 4)
Area Quantity of water collected per household member Merok Olwelai Ojom Katine/Ojama Ochuloi
Total
15 litres or more pp/pd 10 10 7 8 11 46
Less than 15 litres pp/pd 9 9 12 11 8 49
No. of households 19 19 19 19 19 95
53% 53% 37% 42% 58%
Percent coverage in project area (weighted) 48%
Adult women (15 years and older) usually collect water in 94 percent of households, followed by female children (43% of households), adult men (27%) and finally male children (24%). In two areas, the proportion fell below the average for the project area: the number male children in Merok who collect water and the number of adult men in Oculoi who collect water. In both areas the majority of households use boreholes; many households in Katine/Ojama also use a borehole and the number of male children who usually collect water also is lower than in the other areas which mainly rely on other types of water sources.
Table 3.7 Household members that usually collect water
Number of household responses on which members usually collect water
Supervision Area No. of
households Adult women Adult men Female children Male
children
Merok 19 17 6 10 0
Olwelai 19 18 5 6 7
Ojom 19 18 7 6 7

Katine Community Partnerships Project
19
Number of household responses on which members usually collect water
Supervision Area No. of
households Adult women Adult men Female children Male
children
Katine/Ojama 19 18 6 10 3
Ochuloi 19 18 2 9 6
Total 95 89 26 41 23
94% 27% 43% 24%
3.4 Water source availability One-third of households had their main water source unavailable for at least one day in the two weeks prior to the survey. Olwelai households had the least disruption to their water source(s) as most households use unprotected wells/springs. Ochuloi, where most use a borehole as their main water source, had the highest percentage of households affected by unavailability of water. Comments from respondents indicated that the borehole(s) were undergoing rehabilitation at the time of the survey.
Table 3.8 Water source availability (LQAS 5)
Area Water source available in previous two weeks
Merok Olwelai Ojom Katine/Ojama Ochuloi
Total
Unavailable for at least one day
6 3 7 7 8 31
Available every day 13 16 12 12 11 64
No. of households 19 19 19 19 19 95
32% 16% 37% 37% 42%
Percent coverage in project area (weighted) 33%
3.5 Water treatment The majority of households do not treat their water in any way; only seven households said they did something to their water to make it safer before drinking it. Three of the seven households boiled their water, two filtered it using sand, one let it settle before drinking, and one exposed it to the sun. More households in Ojom reported treating their water than in other areas (all of which had only one household that treated their water).
Table 3.9 Treat drinking water to make it safer (LQAS 6)
Area Treat drinking water Merok Olwelai Ojom Katine/Ojama Ochuloi
Total
Treat 1 1 3 1 1 7
Don’t treat 18 18 16 18 18 88
No. of households 19 19 19 19 19 95
5% 5% 16% 5% 5%
Percent coverage in project area (weighted) 7%

Katine Community Partnerships Project
20
3.6 Water user fees Respondents were asked if they paid regular water user fees and if so, how much they paid. No households in any of the five areas reported paying regular fees for water. This result is different from that found in a November 2007 village survey carried by KCPP where some households reported they paid fees of between 1,000-1,500 Ush. According to a project source, households that draw water from boreholes are required to pay 1,000 Ush per month. The reason for this discrepancy will be followed-up by the project.
4. Household Sanitation and Hygiene
4.1 Latrine coverage Half of the surveyed households do not have a latrine and use the bush or plastic bag. Of the households that do have a toilet facility, the great majority have a pit latrine without a slab and only six households had a pit latrine with a slab (improved facility). Latrine coverage was highest in Katine/Ojama and lowest in Olwelai.
Table 4.1 Household sanitation facilities by supervision area
1 1 4 6
5% 5% 21% 6%
10 6 7 9 8 40
53% 32% 37% 47% 42% 42%
7 13 11 5 11 47
37% 68% 58% 26% 58% 49%
1 1 2
5% 5% 2%
19 19 19 19 19 95
100% 100% 100% 100% 100% 100%
Pit with slab
Pit without slab
Field/bush/bag
Other
Type of toilet
Total
Merok Olwelai OjomKatine &Ojama Ochuloi
Supervision area
Total
Overall, only 7 percent of households in the project area had an improved toilet facility, defined as either a pit latrine with slab, ventilated improved (VIP) latrine or composting toilet. Of the six households with an improved toilet, only one shared the toilet with other households. The hygiene conditions of a shared toilet are more likely to be worse than a toilet that is not shared.
Table 4.2 Use of improved toilet facility (LQAS 7)
Area
Type of latrine Merok Olwelai Ojom Katine/Ojama Ochuloi
Total
Improved facility 1 0 1 4 0 6
Not improved facility 18 19 18 15 19 89
No. of households 19 19 19 19 19 95
5% 0% 5% 21% 0%

Katine Community Partnerships Project
21
Percent coverage in project area (weighted) 7%
4.2 Hygiene To maximize health benefits in households and the wider population, improvements in water and sanitation should be accompanied by hygiene education. Hand washing and the proper disposal of faeces are the most important hygiene messages.
The proper disposal of faeces is critical for reducing the pathogen load in the environment. Caretakers were asked where they disposed of the faeces of their youngest child under five the last time s/he defecated. Safe disposal includes the child using the toilet or if the faeces were disposed of in the toilet; other places or methods, e.g. burying it, are categorized as unsafe disposal.
Overall, 42 percent of caretakers safely disposed of their young child’s faeces. Obviously, if a household does not have a latrine they cannot practice safe disposal. Where they do, have a latrine, the type appears to make a difference: all caretakers in households using an improved latine reported safe disposal whereas only 80 percent using a latine without a slab did so. Age also was a factor, very few children older than two years had their faeces disposed of safely. Ojom was below the program average on this indicator.
Table 4.3 Safe disposal of child’s faeces (LQAS 8)
Area Disposal of child faeces Merok Olwelai Ojom Katine/Ojama Ochuloi
Total
Safe 9 6 4 13 8 40
Unsafe 10 14 17 7 12 60
No. of caretakers 19 20 21 20 20 100
47% 30% 19% 65% 40%
Percent coverage in project area (weighted) 42%
Studies have shown that frequent hand washing, with and without soap, can result in a 33 percent reduction in diarrhoea. The majority of caretakers (85%) reportedly used soap either the day of survey or previous day. Ojom was an exception, however, with 38 percent of caretakers reporting they did not use soap. Although use of soap is not a key project indicator the importance of using soap needs to highlighted in this and all other areas.
Only five of 110 caretakers (5%) of the youngest children washed their hands at two critical times or more in previous 24 hours (after defecation and one of the following: after cleaning a young child, before food preparation, before eating, and before feeding a child). This percentage is too low to accurately estimate using LQAS and is clearly a top priority area for intervention.
4.3 Diarrhoea prevalence among children Caretakers of young children were asked if their youngest child had diarrhoea in the two weeks prior to the survey. Diarrhoea was defined as more than three loose stools passed in a 24 period. Overall, 38 percent of young children had diarrhoea. Ochuloi had the lowest prevalence with 26 percent while in Merok and Olwelai, half of the youngest children had diarrhoea,
The high diarrhoea prevalence in Olwelai is not surprising as this SA ranked the lowest on a number of indicators including latrine coverage, time taken to collect water (average of two hours), use of improved water sources, and

Katine Community Partnerships Project
22
appropriate hand washing. In Merok, however, it is not clear what factors contributed to the high prevalence as this area did not rank lowest on any of the key water and sanitation indicators.
Table 4.4 Diarrhoea in youngest child in previous two weeks
20 17 12 12 10 71
49% 49% 38% 31% 26% 38%
21 18 20 27 28 114
51% 51% 63% 69% 74% 62%
41 35 32 39 38 185
100% 100% 100% 100% 100% 100%
yes
no
Had diarrhea
Total
Merok Olwelai Ojom Katine/Ojama Ochuloi
Supervision area
Total
Diarrhoea prevalence varied by area of residence, the age and sex of the child, and the type of household toilet. Diarrhoea was most common in children under one year of age (53%), male children (50%) and if the household had no latrine.
Table 4.5 Diarrhoea prevalence by age, sex, water and sanitation facilities
Diarrhoea in the two weeks prior to the
survey
Total number of children
Age in months
<6 44% 23*
6-11 65% 17*
12-23 52% 48
24-35 39% 33
36-47 25% 36
48-59 11% 28*
Sex
Male 50% 95
Female 27% 90
Source of drinking water
Improved 37% 105
Not improved 40% 80
Toilet facility
Improved 33% 15*
Not improved 39% 170
Type of toilet
Pit latrine with slab 36% 14*
Pit latrine without slab 31% 82

Katine Community Partnerships Project
23
Diarrhoea in the two weeks prior to the
survey
Total number of children
Field/bush/bag 46% 85
* sample size in cell too small for accuracy
4.4 Katine compared to other rural areas The poor conditions of households in Katine sub county is confirmed by a comparison of the same water and sanitation indicators measured in Katine and the 2006 Uganda Demographic and Health Survey. Compared to other rural areas in the country, Katine households have less access to improved water sources and very few sources are within reasonable reach; simple water treatment methods are rarely used; more adult females bear the burden of collecting water; and more children under five are prone to diarrhoea. Only the proportion of households using improved latrine facilities is the same as in other rural areas.
Table 4.6 Comparison of water and sanitation indicators: Katine 2008 and Uganda Demographic and Health Survey, 2006
Indicator Katine Household Survey, 2008
UDHS, 2006
Households use improved source for drinking water 52% 63% (Rural)
Time to obtain water less than 30 minutes
3% 30% (Rural)
Adult females collect water 94%
68% (Rural)
Water treated before drinking
7% 37% (Rural)
Improved latrine facility
7% 8% (Rural)
Diarrhoea in previous two weeks
38% 27% (Rural)
5. Reproductive Health
5.1 Respondent characteristics In the sampled households there were 118 adult women of reproductive age (15-49 years). The majority of women were 20-34 years of age (59%), had attended school (83%) and had had a live birth in the two years prior to the survey (81%). Of those who attended school, only 13 percent completed primary school and less than one in three women say they can read easily in their native language.

Katine Community Partnerships Project
24
Table 5.1 Characteristics of women of reproductive age (15-49)
Merok Olwelai Ojom Katine/Ojama Ochuloi Total
No. of women 22 22 23 22 29 118
Age: < 20 years 14% 18% 13% 14% 28% 18%
20-34 73% 77% 61% 55% 38% 59%
35-49 14% 5% 26% 32% 35% 23%
Attended school 96% 73% 78% 91% 79% 83%
Can read easily 14% 29% 27% 36% 38% 29%
Live birth in last two years
82% 91% 83% 86% 66% 81%
5.2 Contraceptive knowledge and use Knowledge of modern methods of contraception is very similar across the five areas, with most women knowing about female sterilization, oral contraceptive pills, injectables and condoms. The great majority (86%) know a place in Soroti district for obtaining contraceptives.
Table 5.2 Knowledge of contraceptive methods among women 15-49 years
Method Percentage of
women
Female sterilization Male sterilization Contraceptive pill IUD Injectable Implant Condoms LAM Rhythm method Withdrawal Emergency contraception Other (traditional)
88 61 94 31 98 65 94 12 81 46 20
16
Despite the high level of knowledge of the most commonly used methods in Uganda, only five women (4%) reported currently using a modern contraceptive method: female sterilization (1), injectable (1) and condoms (3). The percentage for this indicator is too low to analyze by supervision area. The contraceptive prevalence rate is lower than the national average seen in the 2006 UDHS for a rural area (15%) or the Eastern region (17%).
5.3 Antenatal care Almost all of the 95 women who delivered in the previous two years received antenatal care (ANC) from a health professional (97%). Most women received ANC from a nurse/midwife (96%) at a government health centre (85%)

Katine Community Partnerships Project
25
or government hospital (12%). The MOH, in line with WHO guidelines, recommends that a woman having a normal pregnancy make four ANC visits and that the first visit should be made during the first trimester.
The majority of Katine women (59%) made two to three visits, and a small proportion (8%) made just one visit. Slightly more than one-third of women (36%) made four or more ANC visits during their last pregnancy. This is lower than in other rural areas of the country where 45 percent made four or more visits (UDHS, 2006). Only 13 percent of women made their first visit during the first three months of pregnancy. Katine/Ojama had the highest proportion of women who made four visits and the proportion was below average in Merok, Olwelai and Ojom.
Table 5.2 Made recommended four antenatal care visits during pregnancy in two years prior to survey (LQAS 10)
Area Number of ANC visits Merok Olwelai Ojom Katine/Ojama Ochuloi
Total
4 or more visits 4 4 4 12 7 62
Less than 4 14 16 14 7 11 31
No. of women 18 20 18 19 18 93
22% 20% 22% 63% 39%
Percent coverage in project area (weighted) 36%
Antenatal care visits are also important for the woman to receive intermittent preventive treatment (IPT) for malaria and to test for HIV in order to provide Nevirapine to HIV+ pregnant women to reduce the risk of transmission to their babies.
5.4 Assistance at delivery One-third of deliveries in the previous two years took place in a government health facility (only one delivery took place in a private health facility). Again, this is similar to other rural areas in the country (36 percent) and somewhat lower than in other parts of the Eastern region (40%). Katine/Ojama had the highest percentage of deliveries in a health facility with 63 percent; both Ojom and Ochuloi were below the project area average with only 16 percent, indicating this is a priority area for intervention.
Table 5.3 Delivery in health facility (LQAS 11)
Area
Place of delivery Merok Olwelai Ojom Katine/Ojama Ochuloi
Total
Health facility 5 6 3 12 3 29
Elsewhere 13 14 16 7 16 66
No. of women 18 20 19 19 19 95
28% 30% 16% 63% 16%
Percent coverage in project area (weighted) 33%

Katine Community Partnerships Project
26
The chart below shows that women between the ages of 20-34 years were more likely to deliver in a health facility than younger or older women. Women who can read easily (a proxy for education level) were also more likely to deliver in a health facility than women who could not read at all.
Figure 5.3 Proportion of women delivered in health facility by age and reading ability
<20 yrs
Read easily
20-34 yrs
35-49 yrs
Read with difficulty
Cannot read at all
0
10
20
30
40
50
Per
cen
t o
f w
om
en
The majority of births were assisted by traditional birth attendants (38%) and relatives (37%), followed by nurse/midwife (31%), no one/self (4%), and doctor (1%). Virtually all women who delivered in a health facility would have been assisted by a skilled provider (2006 UDHS).
The main reasons women gave for not delivering in a health facility was that onset of labour was abrupt and they could not get to the facility in time (74% of cases) and/or facility too far/ no transport (53%). Nine percent said that it was not necessary to deliver in a health facility. One case said it cost too much and another case said they were not allowed.
6. HIV/AIDS Knowledge
6.1 HIV/AIDS knowledge among women and men 15-49 years All adult women and men in Katine had heard of AIDS and the majority knew of ways of preventing transmission and rejected common misconceptions. Table 6.1 shows that HIV/AIDS knowledge among Katine men and women was higher in many cases than the average for the rural adult population.
Table 6.1 HIV/AIDS knowledge among women and men in Katine compared to other rural areas
Percentage of adults 15-49 years
Katine women
Rural women UDHS 2006 Katine men
Rural men
UDHS 2006
Heard of AIDS 100 99 100 100
Comprehensive knowledge3 38 28 45 40
3 Comprehensive knowledge is knowing that consistent use of condoms during sexual intercourse and having just one uninfected faithful partner can reduce risk of getting the AIDS virus, knowing that a healthy-looking person

Katine Community Partnerships Project
27
Percentage of adults 15-49 years
Katine women
Rural women UDHS 2006 Katine men
Rural men
UDHS 2006
Can be prevented by:
Limiting sexual intercourse to one uninfected partner
86 89 90 95
Using condoms 75 69 79 84
Abstaining from sexual intercourse 79 86 90 82
Percent who say:
Healthy-looking person can have the AIDS virus 89 83 90 89
People cannot get AIDS virus from mosquito bites 70 51 71 59
People cannot get AIDS virus because of witchcraft or other supernatural means
87 83 91 92
People cannot get AIDS virus by sharing food with a person who has AIDS
90 76 91 83
Table 6.2 shows the proportion of Katine women in each area that had comprehensive AIDS knowledge. In Merok and Katine/Ojama the proportion of women with comprehensive knowledge was lower than the project area average (cut off is 5) and thus this should be a priority area for intervention. There was no evident difference in comprehensive AIDS knowledge across age groups but there was a marked difference according to reading ability; 62 percent of women who can read easily had comprehensive knowledge compared to 30 percent with lower reading levels.
Table 6.1 Comprehensive knowledge of HIV/AIDS among women 15-49 (LQAS 13)
Area Total Women comprehensive AIDS knowledge Merok Olwelai Ojom Katine/Ojama Ochuloi
Yes 7 12 10 7 9 45
No 15 10 13 15 20 73
No. of women 22 22 23 22 29 118
32% 55% 44% 32% 31%
Percent coverage in project area (weighted) 38%
A somewhat higher proportion of men, 45 percent, had comprehensive AIDS knowledge (Table 6.2. Men age 20-34 years and those who can read easily were the most knowledgeable about HIV/AIDS. Ochuloi was below the project area average (cut off point is 7).
can have the AIDS virus, and rejecting the two most common misconceptions that AIDS can be transmitted by mosquito bites and sharing food with a person who has AIDS.

Katine Community Partnerships Project
28
Table 6.2 Comprehensive knowledge of HIV/AIDS among men 15-49 (LQAS 14)
Area Men comprehensive AIDS knowledge Merok Olwelai Ojom Katine/Ojama Ochuloi
Total
Yes 10 12 14 10 8 54
No 15 11 10 13 16 65
No. of men 25 23 24 23 24 119
40% 52% 58% 44% 33%
Percent coverage in project area (weighted) 45%
6.3 Knowledge of prevention of mother-to-child transmission of HIV Eight out of ten (82%) of women knew about special drugs to prevent that a doctor or nurse can give to a pregnant woman who is infected with the AIDS virus to reduce the risk of transmission to the baby. Knowledge of PMTCT drugs was highest among women who can read easily, 94 percent compared to 77 percent of those who read with difficulty or not at all, and older women, 93 percent among those 34-49 years compared to 61 percent of women under 20.
Among the women who know of a special PMTCT drug, 74 percent correctly mentioned a place in Soroti district where they can obtain the drug, namely Soroti district hospital or a government health centre, e.g. Atirir HC IV (data not shown, sample sizes were less in 19 in four out of five areas).
Table 6.5 Women who know of special drugs for PMTCT (LQAS 15)
Area Know about PMTCT drugs Merok Olwelai Ojom Katine/Ojama Ochuloi
Total
Yes 17 18 18 19 25 97
No 5 4 5 3 4 21
No. of women 22 22 23 22 29 118
77% 82% 78% 86% 86%
Percent coverage in project area (weighted) 82%
Not surprisingly, women know more about PMTCT drugs and where to obtain them than do men because of the PMTCT services provided as part of antenatal care. However, only 26 percent of women mentioned the government health centre perhaps Atiriri HC IV only started their PMTCT programme in Oct/Nov 2007.
Three-fourths of men (77%) of adult men know about PMTCT drugs. Knowledge of the PMTCT drugs among the men in Merok was lower than the project area average (cut off is 17) and thus this is a priority area for intervention. Older men were somewhat more likely to know about PMTCT drugs than younger men and a greater proportion of men who can read easily (81%) know about the drugs than do those who cannot read at all (57%).
Among the men who know of a special PMTCT drug, 62 percent correctly mentioned that the drugs can be obtained either the government hospital or government health centre in Soroti district. Again, the LQAS Decision

Katine Community Partnerships Project
29
Rule table cannot be used to determine if an area is below the cut off point because sample sizes are less than 19 in some areas.
Table 6.6 Men who know of special drugs for PMTCT (LQAS 16)
Area Know about PMTCT drugs Merok Olwelai Ojom Katine/Ojama Ochuloi
Total
Yes 15 18 19 19 20 91
No 10 5 5 4 4 28
No. of men 25 23 24 23 24 119
60% 78% 79% 83% 83%
Percent coverage in project area (weighted) 77%
Among men, TASO was the most frequently mentioned source for PMTCT drugs (78%) followed by the government hospital (57%); only 15% of men said they could be obtained at the government health centre.
6.4 Treatment for AIDS Adult women and men were asked if they know about drugs that can be given to people with HIV/AIDS to enable them to live longer and if they knew a place where treatment can be obtained in Soroti district. Women’s and men’s knowledge of drugs to treat AIDS was almost universal (both 98%). More men knew of a place to get the AIDS drugs in Soroti district than women, 96 percent and 84 percent respectively
Table 6.7 Women know source of HIV/AIDS treatment in Soroti district (LQAS 17)
Area Know source of HIV/AIDS treatment in Soroti district Merok Olwelai Ojom Katine/Ojama Ochuloi
Total
Yes 19 18 18 20 21 96
No 3 5 5 2 5 20
No. of women 22 23 23 22 26 116
86% 78% 78% 91% 81%
Percent coverage in project area (weighted) 84%
Table 6.8 Men know source of HIV/AIDS treatment in Soroti district (LQAS 18)
Area Know source of HIV/AIDS treatment in Soroti district Merok Olwelai Ojom Katine/Ojama Ochuloi
Total
Yes 25 20 23 22 22 112
No 0 2 1 1 1 5
No. of men 25 22 24 23 23 117
100% 91% 96% 96% 96%
Percent coverage in project area (weighted) 96%

Katine Community Partnerships Project
30
Among those who knew a place, 97 percent of men and 99 percent of women correctly mentioned government hospital or TASO (data not shown). 4 A few respondents also mentioned the non-governmental organization Uganda Cares, which receives their drug supplies from TASO and is currently treating a small number of patients
6.5 HIV testing Slightly more than half of women (52%) have ever been tested for HIV. The proportion tested was similar across the sub county except for Merok which had a below-average percentage for the project area indicating this is a priority area for intervention.
Table 6.9 Women ever tested for HIV (LQAS 19)
Area
Ever tested for HIV Merok Olwelai Ojom Katine/Ojama Ochuloi
Total
Yes 8 12 12 12 17 61
No 14 10 11 10 12 57
No. of women 22 22 23 22 29 118
36% 55% 52% 55% 59%
Percent coverage in project area (weighted) 52%
Older women were more likely to have been tested: 67 percent of those 35-49 years had been tested compared to 56 percent of 20-34 year olds and 19 percent of women under 20 years. Eighty percent of the women who were tested did so within the last 12 months. Slightly more than half (52%) were tested in a government health centre and 22 percent through private outreach (only in Ojom, Olwelai and Ochuloi). Ochuloi respondents reported the widest variety of sources for testing including govt hospital and health centre, community health workers, private facilities, TASO, AIC and other sources such as NGO. Ninety percent of women tested received their results. Those that did not receive their results had all been tested at a government facility.
One-third of men (35%) have ever been tested for HIV. The proportion tested was similar across the sub county except for Olwelai where twice the proportion of men (61%) had been tested compared to the other areas. Of those tested, 79 percent did so within the last 12 months. Almost all of those tested received their results (93%).
Table 6.10 Men ever tested for HIV (LQAS 20)
Area
Ever tested for HIV Merok Olwelai Ojom Katine/Ojama Ochuloi
Total
Yes 6 14 8 7 7 42
No 19 9 16 16 17 77
No. of men 25 23 24 23 24 119
24% 61% 33% 30% 29%
4 The 2006 UDHS report notes that ‘medications that help people live longer’ could include Septrin (cotrimoxazole) which is used to prevent opportunistic infections as well as anti-retroviral drugs. In this survey respondents were not asked which specific drugs they knew about, only if they knew any medications for HIV/AIDS.

Katine Community Partnerships Project
31
Area
Ever tested for HIV Merok Olwelai Ojom Katine/Ojama Ochuloi
Total
Percent coverage in project area (weighted) 35%
Men were tested in a wide range of places with the most common places being private outreach (33%), AIDS Information Centre (18%), government hospital (14%) and government outreach (12%).
Men between the ages of 20-34 were somewhat more likely to have been tested than those older than 35 years; only a small proportion (16%) of men under 20 years had been tested. There was little or no difference in the proportion tested by reading ability.
7. Fever/Malaria
7.1 Fever in Under Fives Two-thirds of children (64%) under five had a fever in the two weeks prior to the survey. A higher proportion of children under three years of age had fever (74%) than did older children (47%). There was slight variation in prevalence across the areas with a high in Merok of 73 percent and a low of 56 percent in Katine/Ojama.
Table 7.1 Occurrence of fever among Under Fives during two weeks prior to survey
Area Fever in two weeks prior to survey Merok Olwelai Ojom Katine/Ojama Ochuloi
Total
Yes 30 24 21 22 22 119
No 11 11 11 17 16 66
No. of U5s 41 35 32 39 38 185
73% 69% 66% 56% 58%
Percent coverage in project area (weighted) 64%
If a child had fever, the caretaker was asked if they had sought treatment, where, how soon after the fever started, and what medications were given to the child. Eight out of ten caretakers (79%) sought treatment outside and almost half (49%) said treatment was sought on the same or next day. Caretakers sought treatment from a variety of places. Private facilities/doctors were the most common source of treatment (35%), followed closely by government health facility (27%) and drug shop or shop (23%). Only one child was reported to have received treatment from a community health worker (village health team). It is not clear what respondents meant by “outreach” as a source of treatment.
Among the 96 fever cases treated, there were differences across areas about where caretakers sought treatment. In Katine/Ojama the majority of fever cases were taken to a government facility (hospital or health centre) whereas in Ochuloi and Olwelai treatment was sought at a private facility or other source, in this case “outreach”. In Merok drug shops were the most common source of treatment.

Katine Community Partnerships Project
32
Figure 7.1 Sources of treatment for fever in Under Fives
0
5
10
15
20
25
30
Merok Olwelai Ojom Katine/Ojama Ochuloi
Per
cen
t o
f ca
ses
Govt facility Private facility/doctor Drug shop/shop Other
The most commonly administered antimalarial drug was chloroquine (21% of cases). Fifteen percent of cases received the recommended first line treatment for malaria, Coartem. Many children received a cocktail of medications: for example, one child for example was treated with chloroquine, chloroquine with Fansidar, and antibiotics and another child Coartem, chloroquine and Flagyl5. Irrational use of medicines in this way contributes to increasing resistance to the drugs’, is not effective in treating the illness and it is a waste of consumers money.
Table 7.2 Types of drugs used to treat fever in Under Fives
Type of drug Percent of
responses
SP/Fansidar 5
Chloroquine 21
Chloroquine with Fansidar 5
Homapak green 2
Coartem 15
Other antimalarial drugs 24
Antibiotic drugs (pills/syrup 30
Other drugs 88
Don’t know 6
5 According to the 2006 UDHS, up until 2002 chloroquine was the first line treatment; because of growing resistance this was changed to chloroquine and fansidar (CQ +SP); then in 2004 artemether/lumefantrin (Coartem) became first line treatment therapy, along with artesunate+amodiaquine in the private sector. Since 2002, Homapak (CQ+SP) was distributed through the home-based management of fever; this is now being replaced with Coartem. Quinine, with cotrimoxazole, is the first line treatment for very severe febrile disease

Katine Community Partnerships Project
33
The prevalence of fever in Katine (68%) was considerably higher than the 43 percent reported among rural children in the 2006 UDHS. This could, however, be due to differences in timing of the two surveys and whether or not it was in high malaria season, which generally occurs 2-3 months after the rainy season. The proportion of caretakers in Katine who sought treatment on the same or next day (49%) was also much higher than the 29 percent seen in all rural areas in the 2006 UDHS.
7.2 Use of mosquito nets
To reduce malaria-related morbidity and mortality, particularly among young children and pregnant women, long-lasting insecticide-treated nets are currently being distributed free by the MOH and partners in antenatal care clinics and communities as part of the National Malaria Control Program. The nets are also available in the private sector. The survey collected information on household ownership of any mosquito (not whether the net was insecticide-treated or long-lasting net), the number of nets owned, the source of the nets, and who in the household slept under them the previous night.
Seven out of ten households (71%) own one or more mosquito nets. Households in Katine/Ojama had the highest coverage of net ownership while the proportion in Olwelai is below the programme average, indicating this is a priority area for intervention in the parish.
Table 7.3 Household owns mosquito net (LQAS 21)
Area Household owns at least one net Merok Olwelai Ojom Katine/Ojama Ochuloi
Total
Yes 15 9 11 17 14 66
No 4 10 8 2 5 29
No. of households 19 19 19 19 19 95
79% 47% 58% 89% 74%
Percent coverage in project area (weighted) 71%
Three out of four mosquito nets (76%) were purchased from the market; health facilities provided 9 percent of household nets (presumably through antenatal care clinics as part of the prevention of malaria in pregnancy program), NGOs provided 14 percent, and VHTs only 1 percent.
Overall, 48 percent of children under five, and 56 percent of women age 15-49, slept under a mosquito net the previous night. The highest proportion of women and children sleeping under a net was in Katine/Ojama and the lowest in Olwelai.

Katine Community Partnerships Project
34
Figure 7.2 Proportion of children under five sleeping under a mosquito net
55
2936
62 5648
0
20
40
60
80
100
Merok Olwelai Ojom Katine/Ojama Ochuloi Katine subcounty
Per
cen
t
8. Home-based care and community sensitization -- Village Health Teams Sixty percent of all household members had received some type of care from a VHT in the three months prior to the survey. The great majority (87%) of those received treatment for elephantiasis and de-worming medication, 16 percent also received malaria treatment. VHT coverage was highest in Merok (71%) and lowest in Ojom (50%).
Table 8.1 Proportion of household members that received care from VHT in previous three months
Area HH member received VHT care Merok Olwelai Ojom Katine/Ojama Ochuloi
Total
Yes 86 79 63 69 103 400
No 35 40 62 65 545 256
No. of household members
121 119 125 134 157 656
71% 66% 50% 52% 66%
Percent coverage in project area (weighted) 60%
Forty-five percent of the under fives received VHT care, again primarily de-worming and elephantiasis. Only 8 percent of under fives received malaria treatment. This should be a very high priority area for intervention given the high incidence of fever/malaria in the sub county and the critical role that VHTs are meant to play in providing home-based management of fever.

Katine Community Partnerships Project
35
Figure 8.1 Percentage of Under Fives that received any VHT care in previous three months
60
3933
37
56
45
0
10
20
30
40
50
60
70
Merok Olwelai Ojom Katine/Ojama Ochuloi Katine subcounty
Adult members of the household age 15-49 years were asked if they had participated in a VHT community sensitization activity in the previous three months and if so what was the topic. The level of attendance was very low, only 5 percent (14 individuals) had participated in a sensitization activity. Coverage was highest in Ojom with 13 percent of members having attended an activity. The topics covered in the VHT community sensitisation included HIV/AIDS, childhood illnesses, hygiene, and health planning. In Ochuloi, not one adult household member had attended any event.
Table 8.2 Proportion of household members that attended a VHT sensitisation activity in previous three months
Area Attended VHT sensitization activity Merok Olwelai Ojom Katine/Ojama Ochuloi
Total
Yes 3 3 6 2 0 14
No 50 55 42 47 51 245
No. of adult household members
53 58 48 49 51 259
6% 5% 13% 4% 0%
Percent coverage in project area (weighted) 5%
9. Household Food Security and Livelihood
The great majority of households (95%) experienced one or more months of food shortage in the 12 months prior to the survey. There were no differences between the areas in the proportion of households that had had food shortages.

Katine Community Partnerships Project
36
Table 9.1 Households that had food shortage in past year (LQAS 22)
Area Household food shortage Merok Olwelai Ojom Katine/Ojama Ochuloi
Total
Yes 18 18 18 18 18 90
No 1 1 1 1 1 5
No. of households 19 19 19 19 19 95
95% 95% 95% 95% 95%
Percent coverage in project area (weighted) 95%
Figure 10.1 shows that the majority of households (52%) experienced a food shortage for three to four months, but one in four households (24%) were short of food for longer, five or more months.
Figure 10.1 Duration of household food shortages in previous 12 months
6%
18%
52%
24%
010
2030
40
5060
1-2 mths 3-4 mths 5-6 mths 7 or more mths
Months of food shortage
Per
cen
t o
f h
ou
seh
old
s
Households with five or less members had on average more months of food shortage than did larger families, until the number of members reached 12 or more persons when the average months of food shortage increases. Households in Merok had the highest average months of food shortage and Ochuloi had the lowest.
Table 9.2 Mean months of food shortage by household size and supervision area
Number of
household
members
Mean months
of food
shortage
Number of
households
Area Mean months
of food
shortage
Number of
households
3-5 4.03 30 Merok 3.74 19
6-8 3.19 36 Olwelai 3.37 19
9-11 3.22 23 Ojom 3.63 19
12 + 3.67 6 Katine/Ojama 3.58 19
Total 3.49 95 Ochuloi 3.16 19
Total 3.49 95

Katine Community Partnerships Project
37
Although the majority of households (85%) have two or more meals a day, a sizeable proportion of households (15%) have only one meal a day. Only 6 percent of households had three meals a day. Ochuloi is on the border of being below project area average (cut off is 14).
Table 9.3 Households with two or more daily meals (LQAS 23)
Area Two or more meals a day Merok Olwelai Ojom Katine/Ojama Ochuloi
Total
Yes 15 17 16 18 14 80
No 4 2 3 1 5 15
No. of households 19 19 19 19 19 95
79% 89% 84% 95% 74%
Percent coverage in project area (weighted) 85%
Only three of the surveyed households (3%) had a vegetable garden.
Table 9.4 Household has vegetable garden (LQAS 24)
Area
Has garden Merok Olwelai Ojom Katine/Ojama Ochuloi
Total
Yes 1 1 0 1 0 3
No 18 18 19 18 19 92
No. of households 19 19 19 19 19 95
5% 5% 0% 5% 0%
Percent coverage in project area (weighted) 3%
Members in only two households have ever participated in farm trials and both of the households are in Katine/Ojama.
Table 9.5 Households with members who ever participated in farm trials (LQAS 25)
Area Participated in farm trial Merok Olwelai Ojom Katine/Ojama Ochuloi
Total
Yes 0 0 0 2 0 3
No 19 19 19 18 19 92
No. of households 19 19 19 19 19 95
0% 0% 0% 5% 0%
Percent coverage in project area (weighted) 3%

Katine Community Partnerships Project
38
Membership in a savings and loan group was very low; only 9 percent of households had one or more persons who belonged to a group. Of the nine individuals who were a member of a group, seven said they were actively saving at the time of the survey.
Table 9.6 Households with members who belong to a savings and loan group (LQAS 26)
Area Member of savings and loan group Merok Olwelai Ojom Katine/Ojama Ochuloi
Total
Yes 1 2 2 2 1 8
No 18 17 17 17 18 87
No. of households 19 19 19 19 19 95
0% 0% 0% 5% 0%
Percent coverage in project area (weighted) 9%
The great majority of households (94%) rear small animals for household consumption and/or sale of produce. Among those households that rear animals, most own one or more types of animals. Most households rear chickens (92%), followed by goats (65%) and pigs (60%). One-third of households own a sheep. Few households’ rear ducks, guinea fowl or pigeons, and no households reared turkeys or rabbits.
The types of animals reared varied somewhat by area. More households in Ochuloi reared sheep than in other areas, more households in Ojom had goats, and Olwelai households had more goats than in the other others.
Table 9.7 Percentage of households that own type of animal, Katine 2008
Merok Olwelai Ojom Katine/Ojama Ochuloi Total
Goat 56 61 74 67 67 65
Sheep 38 33 26 22 56 35
Pig 67 72 47 50 61 60
Chicken 100 83 90 100 89 92
Duck 6 0 5 11 11 7
Pigeon 0 11 5 11 0 6
Guinea fowl
5 0 0 0 5 2
Among the households that owned animals, 19 percent had used the services of a community animal health worker in the previous year. Use of animal health services did not differ by area.
Table 9.8 Households with animals that used services of community animal health worker in previous year (LQAS 27)
Area Used animal health services Merok Olwelai Ojom Katine/Ojama Ochuloi
Total
Yes 3 4 4 3 4 18
No 13 14 15 15 14 71

Katine Community Partnerships Project
39
No. of households 16 18 19 18 18 89
19% 22% 21% 17% 22%
Percent coverage in project area (weighted) 19%
10. Conclusions and Recommendations
Overall, the findings confirm the appropriateness of the Katine Community Partnerships Project approach and selected interventions. The survey found that the population of Katine sub county is in great need of better access to basic services to improve household health and livelihoods.
The following general recommendations were made based upon findings of the Household Survey:
1. Efforts should continue to focus on increasing the proportion of households that have access to safe water throughout the year. Reducing the distance that households have to go to collect water should have a major positive effect on women’s lives in particular.
2. Sanitation and hygiene levels are very poor and contributing to the poor health of young children. Improvements in latrine coverage must be complemented by education on appropriate hand washing and other hygiene practices for the full health impact of sanitation improvements to be realized.
3. Strategies must be developed for reaching women who, because of age, lack of education or place of residence, face greater obstacles in accessing reproductive health services, particularly family planning, assistance during delivery, and postpartum care. Health providers must ensure all women receive quality antenatal care plus intermittent preventive treatment for malaria and PMTCT services.
4. To reduce the high prevalence of malaria, partners need to work on obtaining the free insecticide-treated mosquito nets available from the MOH and NGOs to increase the proportion of young children (and pregnant women) sleeping under nets. Local health workers (government health workers and private practitioners) and owners of drug shops need to be trained to increase the proportion of young children receiving correct diagnosis and treatment for malaria.
5. Efforts should continue to train and equip Village Health Teams to enable them to provide the full range of community-based treatment and sensitization activities as intended by the MOH. Systems and procedures must be in place to ensure the teams are regularly supervised and supplied with basic medicines and other commodities.
6. Further information must be collected on what agricultural and financial support services are available and how they can be accessed by Katine households. Without these essential inputs, households, particularly young families and those with ten or more members, will continue to be vulnerable to shortages of food and other necessities.
7. Despite the gains of the Universal Primary Education program, a significant proportion of primary-school age children are not enrolled in school and girls are still less likely to attend school than boys. Increasing school enrolment may be contingent upon improvements in areas such as household access to water and income-generating opportunities, as well as the planned sanitation facilities especially for girls.
Specific interventions that are needed in each of the five areas (‘lots’ in LQAS terminology) are shown in Appendix B which has a summary list of all of the individual LQAS indicators. If an indicator in an area was

Katine Community Partnerships Project
40
below the project area average—below the LQAS Decision Rule-- it was given a score of 1; if the indicator coverage was equal to or above the area average it was given a zero. The summary list shows that Merok had the highest number of below average scores (4) and Katine/Ojama had the fewest (1). The indicator with the highest number of areas with below average scores was the percentage of women who made four or more antenatal care visits.
Of more importance, however, are the many indicators which had very low coverage across all the areas. The indicators with less than 10 percent coverage included:
Household participated in farm trials 3% Household can collect water in less than 30 minutes 3% Household has vegetable garden 3% Caretaker has appropriate hand washing practices 4% Use of modern contraceptive methods 4% Household had adequate food for last 12 months 5% Adult participated in VHT sensitization activity 5% Household treats drinking water 7% Household uses improved latrine 7% Household member in savings & loan group 9% Improving coverage of any one of these basic indicators would contribute to improving the health and lives of Katine residents. The fact that these basic indicators are so low suggests a community in critical need of empowerment with information, tools, and basic inputs so that they can improve their own capacity for making a positive difference in their lives.

Katine Community Partnerships Project
41
Appendix A
Katine 2008 Baseline Household Survey: Sampling Frame
Area A Interview locations = random starting number + sampling interval
Parish Village name
Estimated
Population
Cumulative
Population
SA sampling
interval
(Pop/19)
Household
interview
locations
Katine Obiol 617 617 1
Katine 431 1048 1
Ajobi 560 1608 2
Olocoi 600 2208 1
Omulai 500 2708 1
Awidiang B 350 3058 1
Omariai 726 3784 2
Ojama Obalanga 424 4208 1
Ojama 524 4732 1
Oomai 486 5218 1
Abia 488 5706 1
Atirir B 572 6278 2
Atirir A 432 6710 1
Orieta 480 7190 1
Abarilela 769 7958 2
7958 % of total pop.-
26.1
418.9 19
Area B
Merok Agora A 650 650 2
Aputon 405 1055 2
Abata 478 1533 1
Agule 314 1847 2

Katine Community Partnerships Project
42
Omolokony 800 2647 2
Ojwiny 690 3337 3
Merok 650 3987 2
Aber 250 4237 1
Oyimai 700 4937 2
Orechoi 420 5357 2
5357
% of total pop-
17.6% 281.95 19
Area C
Ochuloi Acam 625 625 2
Awidiang A 480 1105 2
Agaja 442 1547 1
Abari A 400 1947 1
Abari B 133 2080 1
Ajonyi A 376 2456 1
Ajonyi B 259 2714 1
Obyarai B 379 3093 1
Obyarai A 413 3506 1
Ogur 256 3762 1
Adamai 255 4017 1
Olano 425 4442 1
Ojago 407 4849 1
Omodoi 210 5059 1
Awaca 452 5511 2
Ocholai 480 5991 1
Sub-total 5991
% of total pop –
19.7% 315.32 19
Area D

Katine Community Partnerships Project
43
Parish Village name
Estimated
Population
Cumulative
Population
SA sampling
interval
(Pop/19)
Interview
locations
Ojom Oyama 304 304 1
Ominit 301 605 1
Onongo 387 992 1
Odwogai 963 1955 3
Ojemorun 327 2282 1
Obongoi 598 2880 2
Agora 498 3378 2
Adamasiko 452 3830 2
Obochoi 507 4337 1
Olusai 358 4695 2
Matali 507 5202 1
Alungar 403 5605 2
5605
% of total pop.-
18.4% 294.98 19
Area E
Olwelai Olwelai 601 601 2
Amorikot 500 1101 2
Samuk 594 1695 2
Oderai 403 2098 2
Alere 472 2570 1
Agora C 387 2957 2
Ojiji 413 3370 1
Amutur 595 3965 2
Kalela 362 4327 1
Oburitok 425 4752 2

Katine Community Partnerships Project
44
Ogwolo 452 5204 1
Kadinya 350 5554 1
5554
% of total pop-
18.2% 292.32 19
Total
population 30,465
Total sample
size 95

Katine Community Partnerships Project
45
APPENDIX B
Summary of LQAS Indicators: Scores for Below-Average Coverage by Indicator and Area
Area
Indicator (LQAS)
Merok Olwelai Ojom Katine &
Ojama
Ochuloi
Total of below
average scores for
indicator
Comments
Use improved water
source
Less than 30 minutes to
collect water
Coverage too low for
LQAS
Use improved water
source and takes less
than 30 minutes
Coverage too low for
LQAS
15 litres or more pp/pd
None under project
area average
Treat water
Coverage too low for
LQAS
Use improved latrine
facility
Coverage too low for
LQAS
Safe feces disposal 1 2
4 or more ANC visits 1 1 1 3
Delivery in health facility 1 1 2
Women comprehensive
AIDS knowledge 1 1
2
Men comprehensive
AIDS knowledge 1
1 None under project
area average
Women know PMTCT
drugs
None under project
area average
Men know PMTCT drugs 1 1
Women know source of
AIDS treatment
None under project
area average
Men know source of None under project

Katine Community Partnerships Project
46
Area
Indicator (LQAS)
Merok Olwelai Ojom Katine &
Ojama
Ochuloi
Total of below
average scores for
indicator
Comments
AIDS treatment area average
Women ever tested for
HIV 1
1
Men ever tested for HIV
None under project
area average
Household owns at least
one mosquito net 1
1
Household food shortage
None under project
area average
Two or more meals a day
None under project
area average
Has vegetable garden
Coverage too low for
LQAS
Participated in farm trial
Coverage too low for
LQAS
Member of savings and
loan group
Coverage too low for
LQAS
Used animal health
services
None under project
area average
Total under-average
scores 4 2 3 1 2


![Guiding focus group discussions [manual] · Baseline Household Level Questionnaire (CCAFS Household Baseline Survey 2010-12, ... class and age. In focus group discussions farmers](https://static.fdocuments.in/doc/165x107/5f4d59d4f0cfab39f828da03/guiding-focus-group-discussions-manual-baseline-household-level-questionnaire.jpg)