Household Baseline Survey for Enhancing Disaster …pdf.usaid.gov/pdf_docs/PA00JRFV.pdf · i...
42
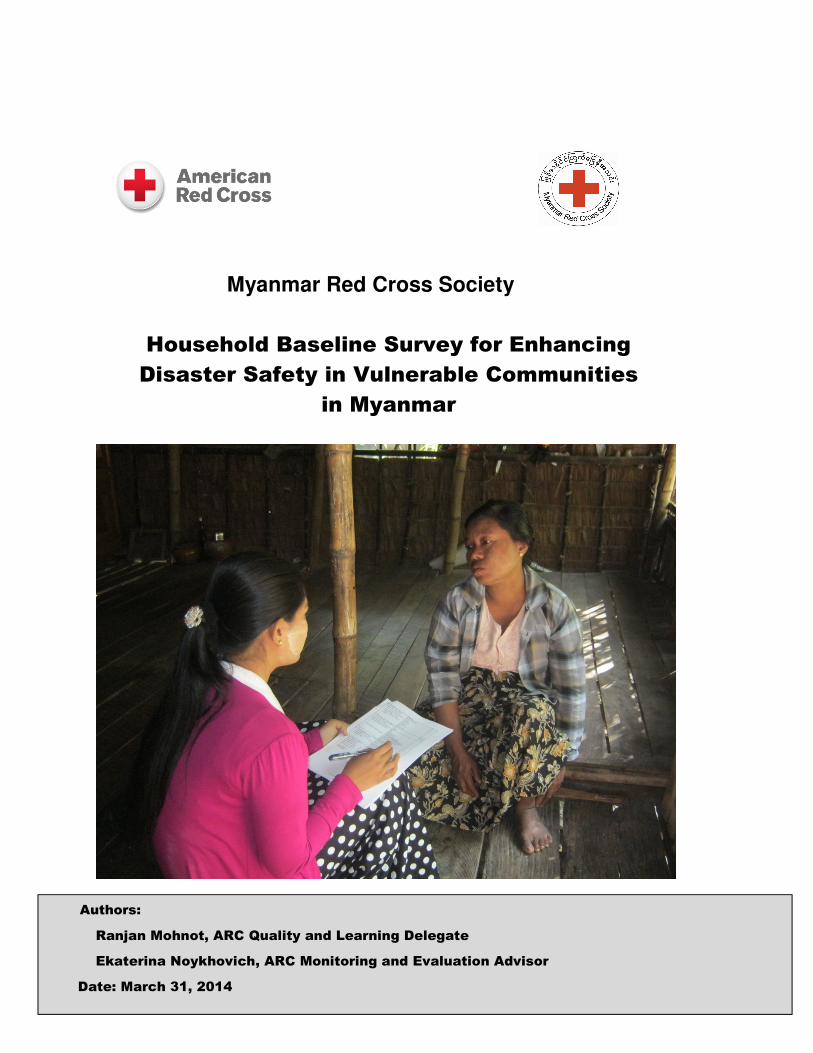
i Myanmar Red Cross Society Household Baseline Survey for Enhancing Disaster Safety in Vulnerable Communities in Myanmar Authors: Ranjan Mohnot, ARC Quality and Learning Delegate Ekaterina Noykhovich, ARC Monitoring and Evaluation Advisor Date: March 31, 2014
Transcript of Household Baseline Survey for Enhancing Disaster …pdf.usaid.gov/pdf_docs/PA00JRFV.pdf · i...
i
Myanmar Red Cross Society
Household Baseline Survey for Enhancing
Disaster Safety in Vulnerable Communities
in Myanmar
Authors:
Ranjan Mohnot, ARC Quality and Learning Delegate
Ekaterina Noykhovich, ARC Monitoring and Evaluation Advisor
Date: March 31, 2014
Baseline Survey for Enhancing Disaster Safety in Vulnerable Communities in Myanmar ii
Table of Contents List of Acronyms and Abbreviations ........................................................................................... iii
List of Figures and Tables ........................................................................................................... v
Executive Summary .................................................................................................................. vii
1. Introduction and Context ..................................................................................................... 1
a. Project Overview ............................................................................................................. 1
a. About American Red Cross ............................................................................................. 1
b. About Myanmar Red Cross Society ................................................................................. 1
c. American Red Cross’ work in Myanmar ........................................................................... 2
2. Baseline Survey .................................................................................................................. 2
a. Survey Objectives and Approach..................................................................................... 2
b. Survey Locations ............................................................................................................. 3
c. Sample size and calculations .......................................................................................... 3
d. Sampling Method ............................................................................................................ 4
e. Research tools ................................................................................................................ 4
f. Pilots ............................................................................................................................... 5
g. Trainings ......................................................................................................................... 5
h. Data Collection process ................................................................................................... 6
i. Data entry and analysis ................................................................................................... 6
j. Limitations ....................................................................................................................... 6
3. Analysis and Results .............................................................................................................. 7
a. Response rate .................................................................................................................... 7
b. Sample distribution and demographics ............................................................................... 7
Ethnicity and Religion ........................................................................................................10
Education ...........................................................................................................................10
Occupation .........................................................................................................................11
Housing .............................................................................................................................12
c. Knowledge and attitudes about disasters ...........................................................................13
Household knowledge of disasters and perceptions of vulnerability ...................................13
Early warning systems .......................................................................................................14
Attitudes towards disasters ................................................................................................15
d. Disaster preparedness actions ..........................................................................................17
Disaster preparedness activities ........................................................................................17

Baseline Survey for Enhancing Disaster Safety in Vulnerable Communities in Myanmar iii
e. Community preparedness planning and activities ..............................................................22
Community preparedness ..................................................................................................22
Community training and activities .......................................................................................25
Environmental protection ...................................................................................................28
Red Cross awareness ........................................................................................................29
4. Conclusions ..........................................................................................................................31
5. Recommendations ................................................................................................................33
Appendix
Appendix 1: Village Profiles
Appendix 2: Community and school selection process
Appendix 3: Sampling Instructions
Appendix 4: Survey questionnaire
Appendix 5: Respondent tracking sheet
Appendix 6: Field supervision sheet
Appendix 7: Training agenda
Appendix 8: Roles and Responsibilities of the Supervision Team
Appendix 9: Field Plan for Data Collection
Appendix 10: List of interviewers and supervisors
Appendix 11: Local consultant TOR
Appendix 12: Data Analysis Plan
Appendix 13: Village Maps
Appendix 14: Project Logical Framework
Baseline Survey for Enhancing Disaster Safety in Vulnerable Communities in Myanmar iv
List of Acronyms and Abbreviations
ARC American Red Cross
CBDRR Community Based Disaster Risk Reduction
DRR Disaster Risk Reduction
HFA Hyogo Framework for Action
MAPDRR Myanmar Action Plan for Disaster Risk Reduction
MRCS Myanmar Red Cross Society
TOR Terms of Reference
VDMC Village Disaster Management Committees
VDSC Village Development Support Committee
Baseline Survey for Enhancing Disaster Safety in Vulnerable Communities in Myanmar v
List of Figures and Tables Figure 1: Distribution of respondents across villages ................................................................. 7
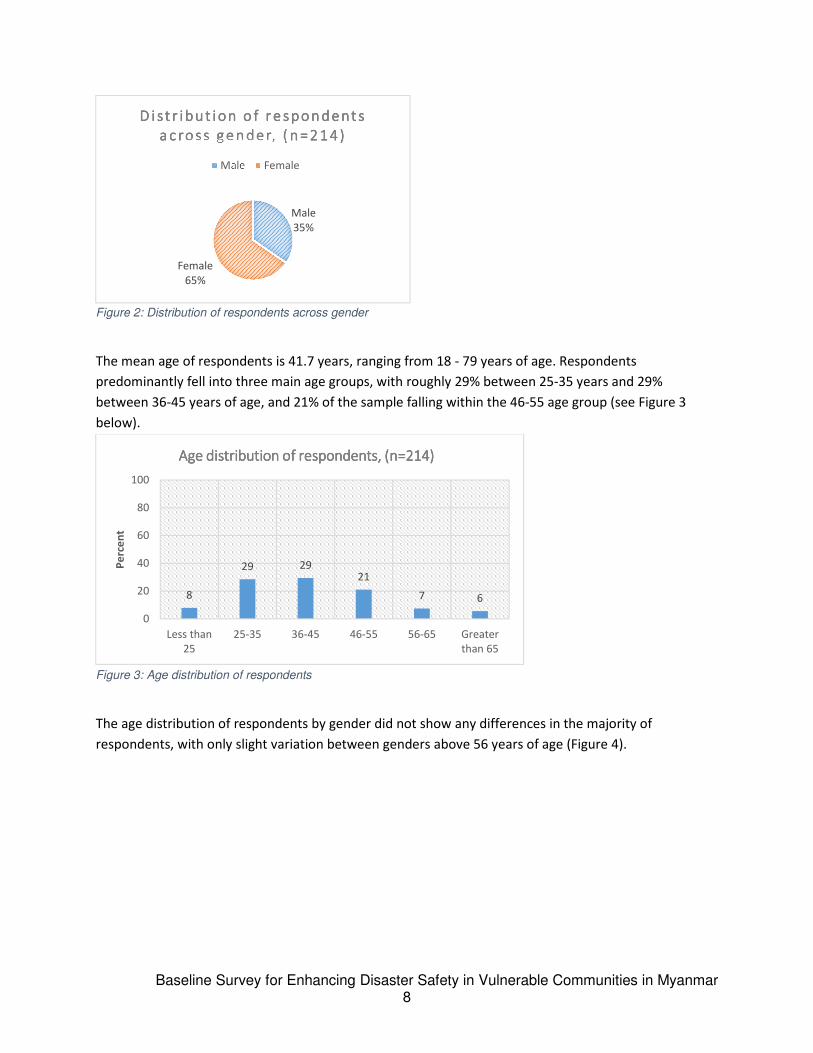
Figure 2: Distribution of respondents across gender .................................................................. 8
Figure 3: Age distribution of respondents ................................................................................... 8
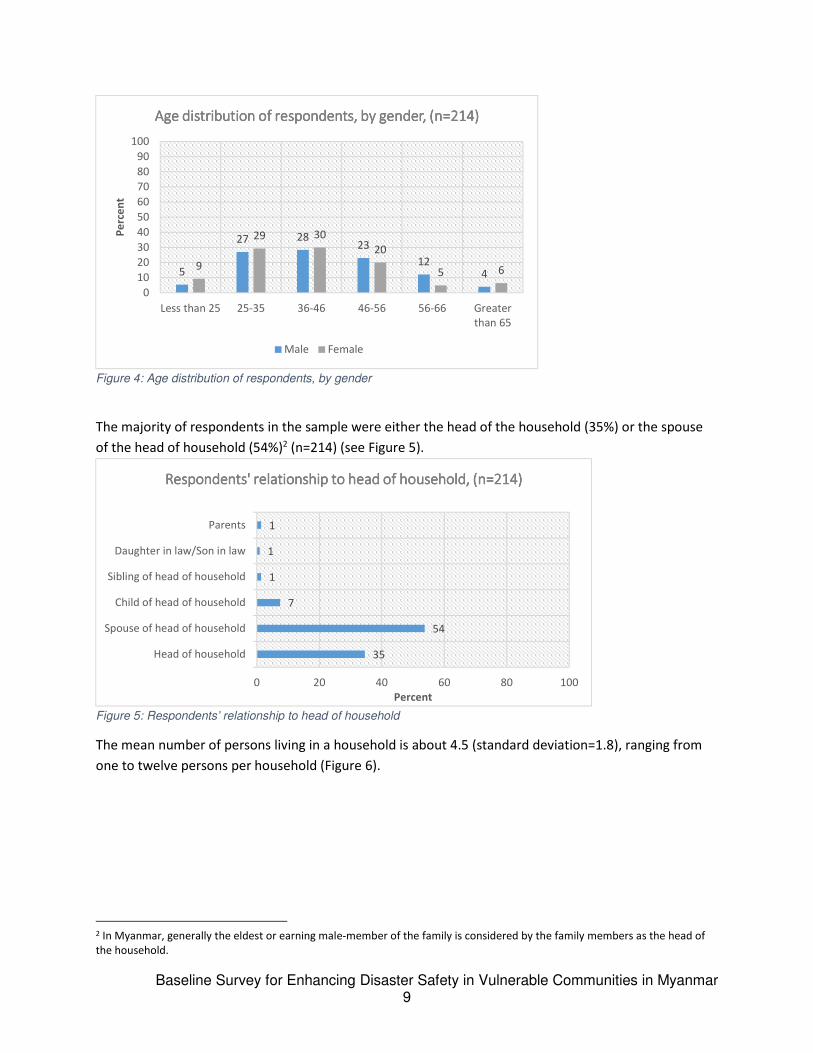
Figure 4: Age distribution of respondents, by gender ................................................................. 9
Figure 5: Respondents’ relationship to head of household ......................................................... 9
Figure 6: Number of people living in a household ......................................................................10
Figure 7: Vulnerability within households ..................................................................................10
Figure 8: Highest education level ..............................................................................................11
Figure 9: Highest education level by village ..............................................................................11
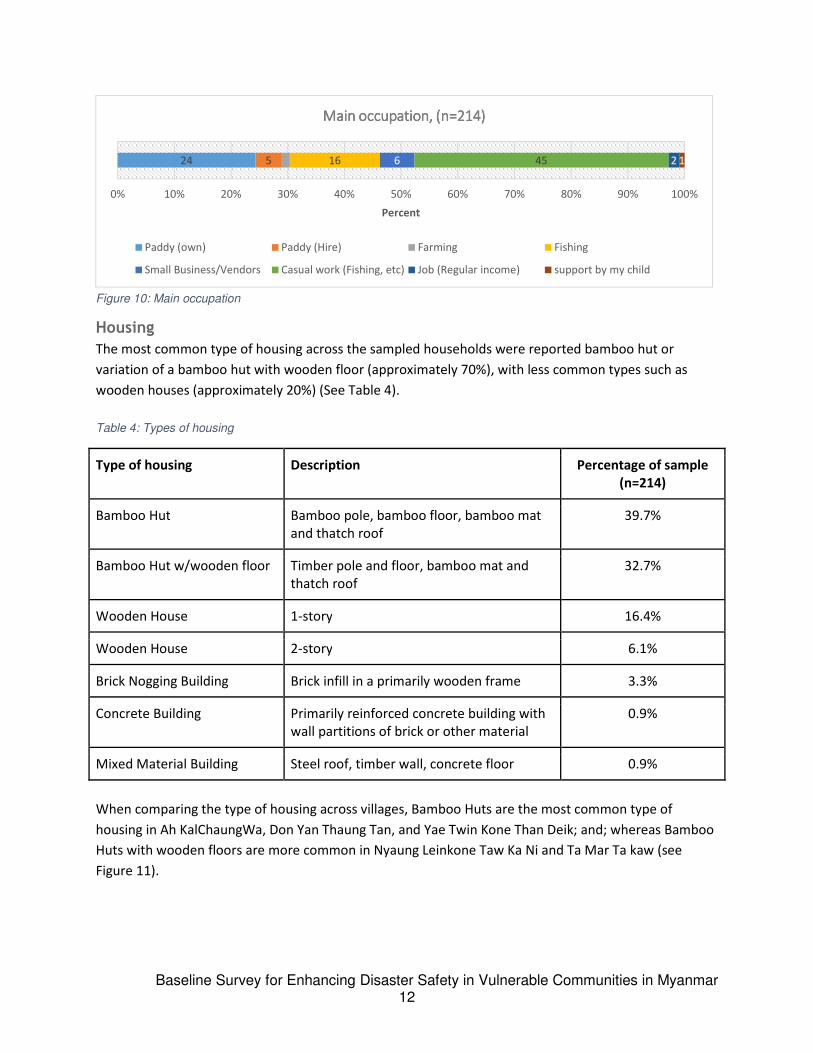
Figure 10: Main occupation .......................................................................................................12
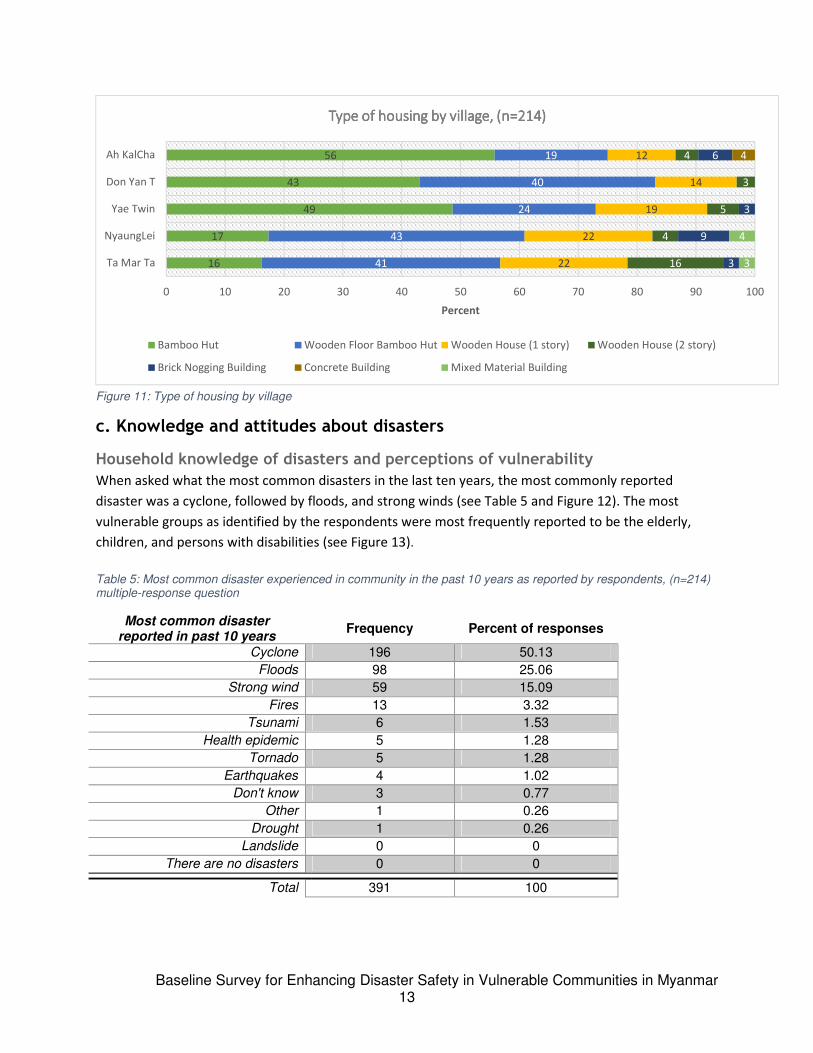
Figure 11: Type of housing by village ........................................................................................13
Figure 12: Most common disaster experienced in community in the past 10 years as reported by
respondents, (n=214) multiple-response question .....................................................................14
Figure 13: Most vulnerable groups to disasters .........................................................................14
Figure 14: Respondents who report receiving an early warning prior to a natural disaster ........15
Figure 15: Method of early warning reported .............................................................................15
Figure 16: Extent to which natural disasters affect respondents and respondents' family ..........16
Figure 17: Frequency of worries about natural disasters ...........................................................16
Figure 18: Frequency of other worries with natural disasters.....................................................17
Figure 19: Frequency of reported action to prepare before a natural disaster ...........................17
Figure 20: Reasons why respondents do not prepare for natural disaster .................................18
Figure 21: Actions taken during a natural disaster .....................................................................18
Figure 22: Other actions taken during a natural disaster ...........................................................19
Figure 23: Frequency of reported actions respondents will take after a natural disaster ............19
Figure 24: Other actions after a natural disaster ........................................................................19
Figure 25: Frequency of actions reported if respondents’ house is located in a river/flood area 20
Figure 26: Frequency of reported actions if respondents’ house is located in a cyclone area ....20
Figure 27: What will respondents do if an earthquake occurs ....................................................21
Figure 28: Households who report preparing an emergency kit/grab bag ..................................21
Figure 29: Households with a grab bag by village .....................................................................21
Figure 30: Contents of a grab bag .............................................................................................22
Figure 31: Percent of respondents who know of disaster preparedness organization in their
community ................................................................................................................................22
Figure 32: Frequency of community disaster preparedness organization named by respondents
.................................................................................................................................................23
Figure 33: Percent of respondents who report a village disaster management plan ..................23
Figure 34: Percent of households reporting a village disaster management plan ......................24
Figure 35: Frequency of respondents' role in preparation of disaster management plan ...........24
Figure 36: Percent of respondents reporting a community fund for disasters, by village ............25
Figure 37: Frequency of reported use of the community fund ....................................................25
Figure 38: Percent of respondents who know someone in community who can provide first aid
.................................................................................................................................................26
Figure 39: Frequency of first aid kits in the community ..............................................................26

Baseline Survey for Enhancing Disaster Safety in Vulnerable Communities in Myanmar vi
Figure 40: Frequency of households with a first aid kit ..............................................................27
Figure 41: Frequency of respondents who have participated in a simulation .............................27
Figure 42: Frequency of last time a respondent participated in a simulation ..............................27
Figure 43: Frequency of confidence level of respondent who participated in simulation ............28
Figure 44: Percent respondents who report a dyke/levee in their community, by village ...........28
Figure 45: Percent of respondents who reported a dyke/levee in their community describe the
role of dykes/levees ..................................................................................................................29
Figure 46: Frequency of respondents talking to someone with MRCS shirt ...............................29
Figure 47: Reported role of MRSC affiliated person ..................................................................30
Figure 48: Most effective communication channels about natural disasters ..............................30
Figure 49: Frequency of reported sources for weather related news .........................................31
Table 1: Sample size calculation ................................................................................................ 3
Table 2: Sample size per village ................................................................................................ 4
Table 3: Response rate per village ............................................................................................. 7
Table 4: Types of housing .........................................................................................................12
Table 5: Most common disaster experienced in community in the past 10 years as reported by
respondents, (n=214) multiple-response question .....................................................................13

Baseline Survey for Enhancing Disaster Safety in Vulnerable Communities in Myanmar vii
Executive Summary
Myanmar is prone to several natural hazards including cyclones, earthquakes, floods, storm surges,
droughts, tsunamis and fires. In 2008, cyclone Nargis claimed 138,373 lives and affected an estimated
2.4 million people. The American Red Cross (ARC), with financial assistance from OFDA, supporting the
Myanmar Red Cross Society (MRCS) in implementing a new project entitled, “Enhancing Disaster Safety
in Vulnerable Communities and Schools in Myanmar”. The project aims to reduce the number of deaths,
injuries and impact from disasters by increasing safety and resilience in Myanmar. This project will
directly benefit 8,700 people (children, women, and other vulnerable groups including MRCS staff and
volunteers) and indirectly benefit 214,000 individuals. The purpose of a baseline survey is to provide a
measure of relevant project indicators and inform project’s target setting.
Overall, there was a high response rate from the sampled population (214 of 230) with females making
up two-thirds of the sample. About two-thirds of the sampled households have family members who fall
into the vulnerable categories (elderly, person with disability, pregnant women, and children under
five).
The most common disasters reported were cyclones, floods and strong winds, with the elderly and
children named as the most vulnerable groups to disasters. The majority of respondents receive an
early warning via radio (80%) followed by television and village head/leaders. The majority of sampled
households believe that natural disasters are extremely serious in their effects to the respondents and
their families. In preparations for a disaster, only 24% of the sampled households have an emergency
grab bag ready.
Before a natural disaster, sampled households most frequently reported that they “did nothing”,
followed by less frequently reported stockpiling food and storing drinking water. The main reason
behind the 113 respondents (of 213) who stated they did nothing was because they did not know or
think a disaster would happen, and lesser number did not know what should be prepared. During a
natural disaster, the most frequently reported action was that the sampled households “did nothing”.
After a natural disaster, over half of the respondents reported that they would fix their house, and less
than a quarter would participate in clean-up operations and find food.
There is an overall low awareness of disaster preparedness knowledge as well as following practices.
Despite being affected by Cyclone Nargis in 2008, a large number of respondents don’t think a disaster
would happen or are unaware of proper steps to take to enhance safety and preparedness.
Approximately half of the sampled households across all villages know of a community
organization/institution that helps their community prepare for a disaster. Only 25% of sampled
households were aware of a village disaster management plan, with less than half having played a role in
preparing it. In first aid, about 75% of sampled households know of someone who can provide first aid
within their community, and 39% of sampled households know of a first aid kit available in their
Baseline Survey for Enhancing Disaster Safety in Vulnerable Communities in Myanmar viii
community. Almost all (208 of 214) households sampled do not have a first aid kit in the home. Very
few (19 of 214) of the sampled households have participated in a community simulation exercise in
preparation for a disaster. The most effective means of communication about natural disasters was
reported to be via radio by over three-fourths of the sampled households.
Based on the findings of this survey, while a good majority of sampled households have knowledge on
what to do before and during a natural disaster (especially floods, cyclones), respondents showed a lack
of taking action regarding disaster practices. Several indicators are lagging in terms of attitudes and
practices towards disaster preparedness.
Key recommendations:
� Further explorations should be conducted to determine the reasons behind lack of actions
regarding attitudes and practices towards disasters. For example, use a barrier analysis to study,
identify, and subsequently develop activities to address the barriers households face in changing
their behaviors (attitudes and practices) in disaster preparedness.
� It is recommended that the project aim to address other vulnerabilities in programming such as
targeting elderly individuals and households with children under five, as these vulnerable groups
were more prominent in this survey.
� Furthermore, the project would benefit from the indicators of the baseline and should aim to
set appropriate targets to measure its progress.

1
1. Introduction and Context
a. Project Overview
Myanmar is prone to several natural hazards including cyclones, earthquakes, floods, storm surges,
droughts, tsunamis and fires. In 2008, cyclone Nargis claimed 138,373 lives and affected an estimated
2.4 million people. The education sector was also severely impacted damaging or destroying
approximately 60% of the total number of schools in the affected areas. The devastation caused by
cyclone Nargis was not caused by a technical failure in the early warning service–warnings were
provided by the Myanmar Meteorological Service–but the failure of other elements of effective early
warning systems especially communications networks and adequate preparedness initiatives enabling
rapid response (World Disaster Report, 2009).
The American Red Cross (ARC), with financial assistance from OFDA, supporting the Myanmar Red Cross
Society (MRCS) in implementing a new project entitled, “Enhancing Disaster Safety in Vulnerable
Communities and Schools in Myanmar”. The project aims to reduce the number of deaths, injuries and
impact from disasters by increasing safety and resilience in Myanmar. Its strategic objectives are to
build the internal capacity of the MRCS (at national and branch levels) to ensure the efficient delivery of
disaster response and preparedness programs, as well as design and conduct disaster risk reduction
education in targeted areas of Myanmar.
This project will directly benefit 8,700 people (children, women, and other vulnerable groups including
MRCS staff and volunteers) and indirectly benefit 214,000 individuals. It is anticipated that MRCS
targeted communities and schools will have increased capabilities to mitigate, prepare for, and respond
to disasters.
a. About American Red Cross
The ARC is a volunteer-led organization that extends its humanitarian mission around the world through
participation in the global Red Cross and Red Crescent network and through resource centers such as
Global Disaster Preparedness Center. ARC has amassed over 125 years of experience in disaster
management, responding to its first international disaster in 1892 to the Russian Famine. ARC and its
Red Cross and Red Crescent partners are uniquely positioned to provide urgent humanitarian assistance
to the world’s hardest to reach and most vulnerable populations. During 2013, ARC’s International
Services Division, assisted over 5.6 million people in disaster response and recovery activities and carried
out disaster preparedness and risk reduction in 32 countries.
b. About Myanmar Red Cross Society
As the leading and oldest humanitarian organization in Myanmar, the MRCS is committed to
improving the health and well-being of vulnerable people. MRCS strives to maintain excellent
partnerships with UN Agencies, non-governmental organizations, the press and other public information
media. News coverage of Red Cross activities in the whole country is continually featured in the press,
Baseline Survey for Enhancing Disaster Safety in Vulnerable Communities in Myanmar 2
radio and television news broadcasts. MRCS strive to be the leading humanitarian organization in
Myanmar, acting with and for the most vulnerable at all times through its 330 branches. With a
nationwide network of volunteers, the Myanmar Red Cross Society works to promote a more healthy
and safe environment for the people in Myanmar, giving priority to most vulnerable communities and
individuals. In times of distress and disaster, MRCS will assist those affected to help them return to their
normal lives.
MRCS’ Disaster Preparedness and Response initiatives focus on reducing deaths, injuries, and
impacts from natural disasters. The provision of timely and effective relief assistance to disaster areas is
achieved through improved organizational preparedness. Priorities for the organization include
improving logistics, particularly warehouse capacity, establishing emergency response teams,
strengthening communication and early warning systems, promoting coordination and collaboration
with partners and local authorities, among other priorities. In terms of DRR, MRCS’s programmatic
approach employs a successful local-level model that reduces deaths, injuries, and impact from
disasters. The lives of targeted vulnerable communities are improved through increased community
participation in risk reduction activities.
c. American Red Cross’ work in Myanmar
The ARC is currently supporting MRCS in areas of disaster risk reduction and organizational
development. A history of collaboration between ARC and MRCS exists since 1992 and has expanded in
the last two years including the signing of a Memorandum of Cooperation (MOC) in September 2013.
An American Red Cross Disaster Risk Reduction Delegate is based in Yangon along with administrative,
financial and programmatic local staff. ARC also has a regional office in Bangkok with a full
administrative, programmatic and financial support staff including a Regional Quality and Learning
Delegate, a Regional Disaster Risk Reduction Advisor and a Regional Representative.
2. Baseline Survey
a. Survey Objectives and Approach
The purpose of a baseline survey is to provide a measure of relevant project indicators and inform
project’s target setting. The baseline gathered a range of information on the relevant disaster
preparedness and risk reduction activities as well as knowledge of households and communities in
project locations. It also provides benchmark values against which the project performance will be
measured, especially at the end of the project through an end line survey. MRCS project implementation
team will also use baseline data and its analysis for informing the design of project activities.
The main objectives of the baseline survey are:
1. To have quantitative measure of key project indicators for assessing progress at the end of the
project.
2. To measure knowledge, attitude and practices in order to inform project interventions.
Baseline Survey for Enhancing Disaster Safety in Vulnerable Communities in Myanmar 3
b. Survey Locations
The sampling frame included all five project villages from Dedaye Township. This area is highly disaster
prone and was affected by cyclone Nargis in 2008. This delta area is not only exposed to hydrological
hazards (cyclone, floods, surges and tornados) but also prone to seismic hazards like earthquakes and
tsunamis. Other prevailing factors are pervasive such as poverty, poor accessibility of basic services,
environmental degradation, and vulnerability to changing climate. Despite the recovery initiatives in
the delta, it continues to remain one of the vulnerable areas in Myanmar. A profile of each of the
villages is enclosed in Appendix 1.
A thorough two-step selection process was conducted by MRCS with ARC support in order to select
project communities (five villages). [See Appendix 2 for community selection process information]. The
resulting project sites selected for this intervention are:
1. Ta Mar Ta kaw
2. Nyaung Lein kone Taw Ka Ni
3. Yae Twin Kone Than Deik
4. Don Yan Thaung Tan
5. Ah Kal Chaung Wa
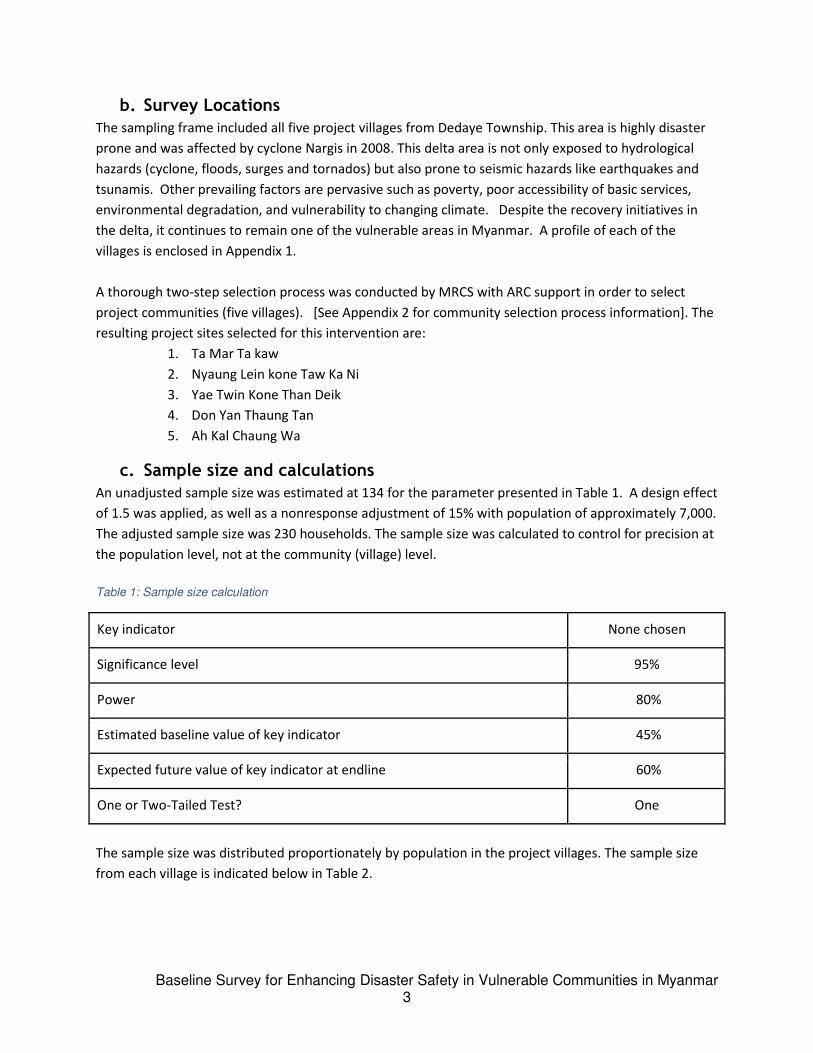
c. Sample size and calculations
An unadjusted sample size was estimated at 134 for the parameter presented in Table 1. A design effect
of 1.5 was applied, as well as a nonresponse adjustment of 15% with population of approximately 7,000.
The adjusted sample size was 230 households. The sample size was calculated to control for precision at
the population level, not at the community (village) level.
Table 1: Sample size calculation
Key indicator None chosen
Significance level 95%
Power 80%
Estimated baseline value of key indicator 45%
Expected future value of key indicator at endline 60%
One or Two-Tailed Test? One
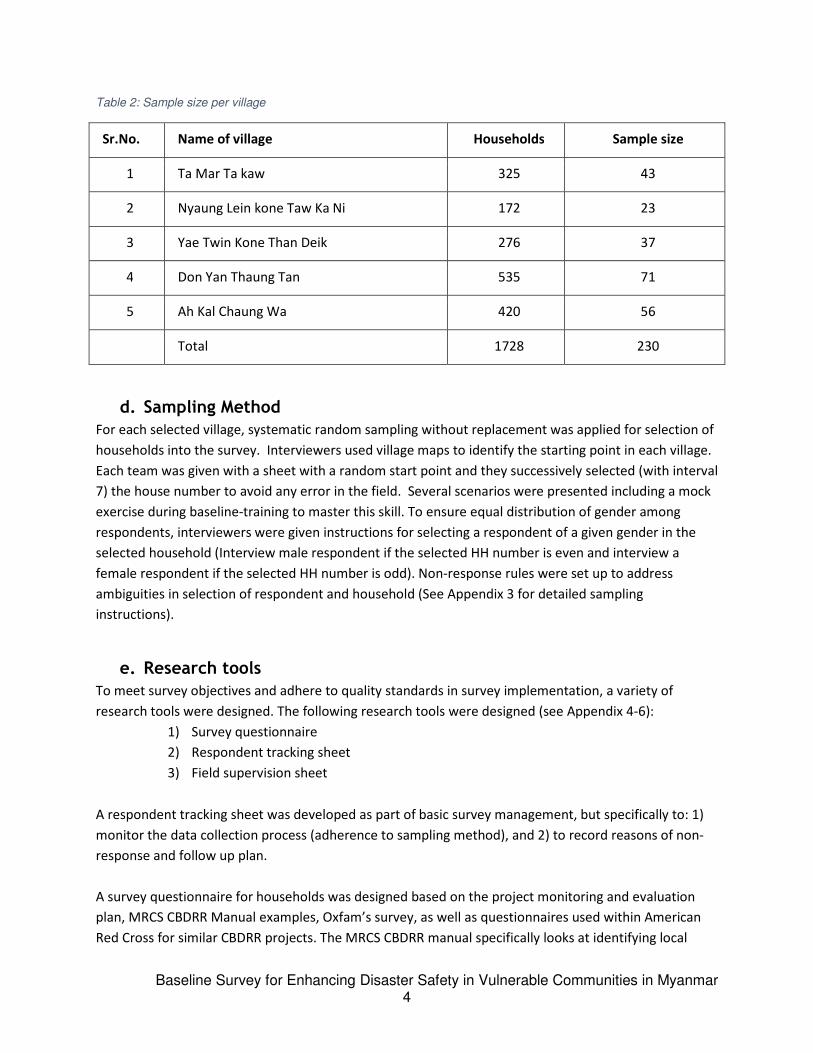
The sample size was distributed proportionately by population in the project villages. The sample size
from each village is indicated below in Table 2.
Baseline Survey for Enhancing Disaster Safety in Vulnerable Communities in Myanmar 4
Table 2: Sample size per village
Sr.No. Name of village Households Sample size
1 Ta Mar Ta kaw 325 43
2 Nyaung Lein kone Taw Ka Ni 172 23
3 Yae Twin Kone Than Deik 276 37
4 Don Yan Thaung Tan 535 71
5 Ah Kal Chaung Wa 420 56
Total 1728 230
d. Sampling Method
For each selected village, systematic random sampling without replacement was applied for selection of
households into the survey. Interviewers used village maps to identify the starting point in each village.
Each team was given with a sheet with a random start point and they successively selected (with interval
7) the house number to avoid any error in the field. Several scenarios were presented including a mock
exercise during baseline-training to master this skill. To ensure equal distribution of gender among
respondents, interviewers were given instructions for selecting a respondent of a given gender in the
selected household (Interview male respondent if the selected HH number is even and interview a
female respondent if the selected HH number is odd). Non-response rules were set up to address
ambiguities in selection of respondent and household (See Appendix 3 for detailed sampling
instructions).
e. Research tools
To meet survey objectives and adhere to quality standards in survey implementation, a variety of
research tools were designed. The following research tools were designed (see Appendix 4-6):
1) Survey questionnaire
2) Respondent tracking sheet
3) Field supervision sheet
A respondent tracking sheet was developed as part of basic survey management, but specifically to: 1)
monitor the data collection process (adherence to sampling method), and 2) to record reasons of non-
response and follow up plan.
A survey questionnaire for households was designed based on the project monitoring and evaluation
plan, MRCS CBDRR Manual examples, Oxfam’s survey, as well as questionnaires used within American
Red Cross for similar CBDRR projects. The MRCS CBDRR manual specifically looks at identifying local

Baseline Survey for Enhancing Disaster Safety in Vulnerable Communities in Myanmar 5
hazard experiences, perceptions of natural hazards, and current levels of natural disaster preparedness
and response and the questionnaire aims to collect this information.
The survey questionnaire specifically captures basic demographic information, knowledge of disasters,
attitudes towards disasters, practices related to disasters, disaster preparedness activities, as well as
appropriate communication channels related to disasters.
A field supervision sheet was developed as part of basic survey management to identify and to give
feedback to interviewers and survey managers on the overall quality of the event, and identify
promising practices and challenges of surveys in Myanmar for future reference, especially as a tool for
MRCS.
f. Pilots
A pilot survey was conducted as part of the training in a community outside of the project intervention
area, with approximately 30 households interviewed (equal representation from both male and female
respondents). No major issues were encountered during the pilot. Based on interviewer feedback,
options were added for few questions in the questionnaire to address additional responses that may
come up in the survey.
g. Trainings
Two trainings, one for interviewer and one for supervisors, were conducted to ensure adequate
preparation and support for the survey (see Appendix 7-8).
All the interviewers and supervisors recruited for the survey received an intensive three-day training by
a consultant from the Focus Point Research Services Company. Ten interviewers consisted of five MRCS
volunteers and five community mobilizers. Six supervisors consisted of MRCS staff including two field
officers, one program coordinator, one township branch leader, and two consultants. The training was
conducted in local Myanmar language. The training was organized from February 25-27, 2014 at Kan
Chaung Monastery, Dedaye including one field pilot and debriefing session. MRCS and ARC staff actively
participated in the training. The training of interviewers comprised of both classroom and field practice.
The first day of training covered basic survey methodology, “do’s and don’ts” during surveys, and a
review of questionnaires in the classroom setting. The second day, the interviewers and the supervisors
were taken to the field (Ta Nyin Kone Village) and were asked to complete at least three interviews with
households in the morning. Following this pilot in a non-project village, a debrief session was held to
discuss and resolve the problems encountered with the questionnaires in the field. On the third day,
interviewers were trained on the sampling of households, and also conducted a mock survey. The
supervisors were given separate and specific training to carry out their respective work. The training
helped supervisors develop skills on field supervision, carrying out spot checks and back checks1,
1 Spot checks are quality checks wherein the supervisor observes when the interview is happening and provides feedback to
interviewer soon after its completion. In case there is an important quality gap, the supervisor intervenes during the interview.
Back checks are for quality verification wherein the supervisor takes random filled-up questionnaire and visits the household
again to check data authenticity and quality.
Baseline Survey for Enhancing Disaster Safety in Vulnerable Communities in Myanmar 6
accompanying the interviewers, field editing for consistency checks, and managing the monitoring
sheets.
h. Data Collection process
Data collection occurred over three days, from February 28 to March 2, 2014. Five teams (two
interviewers per team) were responsible for the data collection across the five villages, divided up based
upon the sample size for each village (see Appendix 9-10). The following steps were completed during
field work:
Step 1: Set up the team and approach the field
Step 2: Conduct transect walk. Each supervisor and/or team conducted a transect walk to become
familiar with the geography of the village and to mark the boundary for team members
Step 3: Data collection
Step 4: Quality control
In general, supervisors were responsible for developing a thorough understanding of the survey tools,
guiding interviewers on sampling as well as randomly checking (through spot and back checks) and
taking corrective actions when needed, observing data collection and interviews, checking the filled-out
questionnaires for internal consistency, and checking the respondent tracking sheet, as well as
informing ARC and MRCS about observations and/or questions in the field.
i. Data entry and analysis
To manage the data entry process of over 200 paper-based questionnaires, a local consultant – the
same consultant hired for training - was recruited by MRCS (see Appendix 11). Data entry was carried
out in CS Pro 5 and analysis was done in SPSS 21 and Stata 12 (see Appendix 12).
All the completed questionnaires were thoroughly reviewed by the supervisor in the field for
completeness and consistency. Other responses were coded before data entry. Appropriate range and
checks were built in the data entry package to avoid data entry error (out of range value). No further
data cleaning was undertaken during data entry.
j. Limitations
Due to the nature of the project and community selection process, a basic yet strong sampling design
was employed at the household level (one-stage sampling was employed) with systematic random
sampling at every 7th household. No weights are required as the sample was self-weighted (i.e.
proportionate to the number of households in the village). There is minimal weight at the household
level based on the number of eligible respondents (male/female adults), and would not impact the
analysis and interpretation.
Baseline Survey for Enhancing Disaster Safety in Vulnerable Communities in Myanmar 7
3. Analysis and Results
a. Response rate
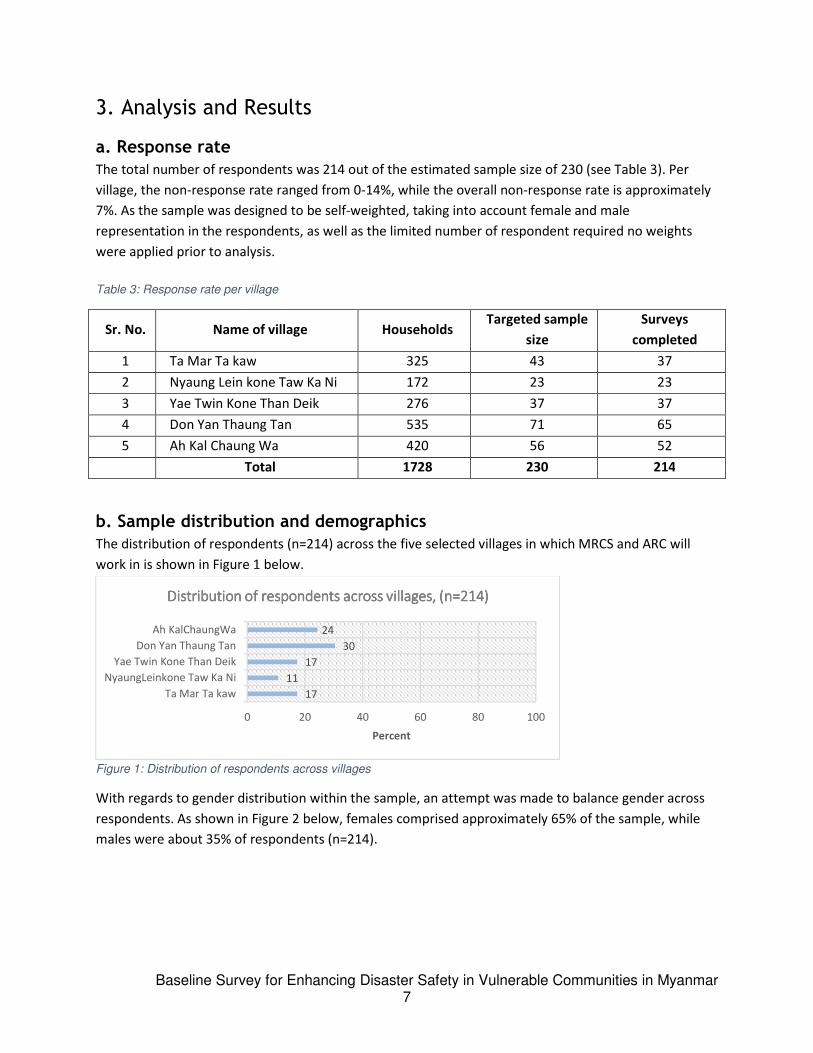
The total number of respondents was 214 out of the estimated sample size of 230 (see Table 3). Per
village, the non-response rate ranged from 0-14%, while the overall non-response rate is approximately
7%. As the sample was designed to be self-weighted, taking into account female and male
representation in the respondents, as well as the limited number of respondent required no weights
were applied prior to analysis.
Table 3: Response rate per village
Sr. No. Name of village Households Targeted sample
size
Surveys
completed
1 Ta Mar Ta kaw 325 43 37
2 Nyaung Lein kone Taw Ka Ni 172 23 23
3 Yae Twin Kone Than Deik 276 37 37
4 Don Yan Thaung Tan 535 71 65
5 Ah Kal Chaung Wa 420 56 52
Total 1728 230 214
b. Sample distribution and demographics
The distribution of respondents (n=214) across the five selected villages in which MRCS and ARC will
work in is shown in Figure 1 below.
Figure 1: Distribution of respondents across villages
With regards to gender distribution within the sample, an attempt was made to balance gender across
respondents. As shown in Figure 2 below, females comprised approximately 65% of the sample, while
males were about 35% of respondents (n=214).
17
11
17
30
24
0 20 40 60 80 100
Ta Mar Ta kaw
NyaungLeinkone Taw Ka Ni
Yae Twin Kone Than Deik
Don Yan Thaung Tan
Ah KalChaungWa
Percent
Distribution of respondents across villages, (n=214)Distribution of respondents across villages, (n=214)Distribution of respondents across villages, (n=214)Distribution of respondents across villages, (n=214)
Baseline Survey for Enhancing Disaster Safety in Vulnerable Communities in Myanmar 8
Figure 2: Distribution of respondents across gender
The mean age of respondents is 41.7 years, ranging from 18 - 79 years of age. Respondents
predominantly fell into three main age groups, with roughly 29% between 25-35 years and 29%
between 36-45 years of age, and 21% of the sample falling within the 46-55 age group (see Figure 3
below).
Figure 3: Age distribution of respondents
The age distribution of respondents by gender did not show any differences in the majority of
respondents, with only slight variation between genders above 56 years of age (Figure 4).
Male
35%
Female
65%
D i st r i bu t i on D i st r i bu t i on D i st r i bu t i on D i st r i bu t i on o f r e s po n de nt s o f r e s po n de nt s o f r e s po n de nt s o f r e s po n de nt s
a c ro s s g e n de r, ( n =2 1 4 )a c ro s s g e n de r, ( n =2 1 4 )a c ro s s g e n de r, ( n =2 1 4 )a c ro s s g e n de r, ( n =2 1 4 )
Male Female
8
29 2921
7 6
0
20
40
60
80
100
Less than
25
25-35 36-45 46-55 56-65 Greater
than 65
Pe
rce
nt
Age distribution of respondents, (n=214)Age distribution of respondents, (n=214)Age distribution of respondents, (n=214)Age distribution of respondents, (n=214)
Baseline Survey for Enhancing Disaster Safety in Vulnerable Communities in Myanmar 9
Figure 4: Age distribution of respondents, by gender
The majority of respondents in the sample were either the head of the household (35%) or the spouse
of the head of household (54%)2 (n=214) (see Figure 5).
Figure 5: Respondents’ relationship to head of household
The mean number of persons living in a household is about 4.5 (standard deviation=1.8), ranging from
one to twelve persons per household (Figure 6).
2 In Myanmar, generally the eldest or earning male-member of the family is considered by the family members as the head of
the household.
5
27 2823
124
9
29 30
20
5 6
0
10
20
30
40
50
60
70
80
90
100
Less than 25 25-35 36-46 46-56 56-66 Greater
than 65
Pe
rce
nt
Age distribution of respondents, by gender, (n=214)Age distribution of respondents, by gender, (n=214)Age distribution of respondents, by gender, (n=214)Age distribution of respondents, by gender, (n=214)
Male Female
35
54
7
1
1
1
0 20 40 60 80 100
Head of household
Spouse of head of household
Child of head of household
Sibling of head of household
Daughter in law/Son in law
Parents
Percent
Respondents' relationship to head of household, (n=214)Respondents' relationship to head of household, (n=214)Respondents' relationship to head of household, (n=214)Respondents' relationship to head of household, (n=214)

Baseline Survey for Enhancing Disaster Safety in Vulnerable Communities in Myanmar 10
Figure 6: Number of people living in a household
When asked if any family member is a) over 60 years old, b) person with disability, c) pregnant, or d)
under 5-years old, about a third of respondents (37%) reported a family member under 5 years old, and
about 20% of respondents reported a family member over age 60; the remaining categories were less
frequent across the sample (see Figure 7).
Figure 7: Vulnerability within households
Ethnicity and Religion
Almost all respondents in the sample associate themselves with the Burma ethnic group, with only one
household belonging to the Chin group. With regards to religion, all respondents (n=214) in the sample
identified themselves as Buddhist.
Education
Approximately 36% of respondents reported primary school as the highest level of education attained;
another 28% have completed middle school, and another 22% completed monastery school, with 10%
of respondents who reported completion of high school, undergraduate, and graduate education (see
Figure 8). Highest education level attained differs widely by village, with primary level studies as the
most common level attained as a percentage of all respondents within Ah Kal Chaung Wa (54%) village.
Ta Mar Ta kaw village has a higher proportion of respondents who completed primary education (38%),
110
1826
2113
5 4 1 0 0 00
20
40
60
80
100
1 2 3 4 5 6 7 8 9 10 11 12
Pe
rce
nt
of
ho
use
ho
lds
Number of people
Number of people living in a household, (n=214)Number of people living in a household, (n=214)Number of people living in a household, (n=214)Number of people living in a household, (n=214)
22
6 2
37
0
20
40
60
80
100
Pe
rce
nt
Vulnerability within households, (n=142)Vulnerability within households, (n=142)Vulnerability within households, (n=142)Vulnerability within households, (n=142)
Over 60 years old Person with disability Pregnant Under 5 years old

Baseline Survey for Enhancing Disaster Safety in Vulnerable Communities in Myanmar 11
followed by about a third (32%) who completed Monastery education. Nyaung Lein Kone Ta ka has a
large percentage of respondents who report completing Monastery education (39%), with about a third
(30%) who completed primary education. Of the five villages, Yae Twin Kone Than De (32%) and Don Yan
Thaung Tan (42%) have a higher percentage of respondents who report completion of middle school
(see Figure 9).
Figure 8: Highest education level
Figure 9: Highest education level by village
Occupation
The majority of respondents report casual work (such as fishing), as their primary occupation, followed
by owning a Paddy, then Fishing, and small business vendors (see Figure 10).
3 22 36 29 6 2 2
0% 10% 20% 30% 40% 50% 60% 70% 80% 90% 100%
Percent
Highest education level, (n=214)Highest education level, (n=214)Highest education level, (n=214)Highest education level, (n=214)
Never went to school Monastery Primary Middle High School Undergradute Graduate
3
5
4
32
39
16
22
13
38
30
35
25
54
22
17
32
42
19
9
11
6
4
4
5
2
5
2
4
0% 10% 20% 30% 40% 50% 60% 70% 80% 90% 100%
Ta Mar Ta kaw
NyaungLeinkone Taw Ka
Yae Twin Kone Than De
Don Yan Thaung Tan
Ah KalChaungWa
Education level by village, (n=214)Education level by village, (n=214)Education level by village, (n=214)Education level by village, (n=214)
Never went to school Monastery Primary Middle High School Undergraduate Graduate
Baseline Survey for Enhancing Disaster Safety in Vulnerable Communities in Myanmar 12
Figure 10: Main occupation
Housing
The most common type of housing across the sampled households were reported bamboo hut or
variation of a bamboo hut with wooden floor (approximately 70%), with less common types such as
wooden houses (approximately 20%) (See Table 4).
Table 4: Types of housing
Type of housing Description Percentage of sample
(n=214)
Bamboo Hut Bamboo pole, bamboo floor, bamboo mat
and thatch roof
39.7%
Bamboo Hut w/wooden floor Timber pole and floor, bamboo mat and
thatch roof
32.7%
Wooden House 1-story 16.4%
Wooden House 2-story 6.1%
Brick Nogging Building Brick infill in a primarily wooden frame 3.3%
Concrete Building Primarily reinforced concrete building with
wall partitions of brick or other material
0.9%
Mixed Material Building Steel roof, timber wall, concrete floor 0.9%
When comparing the type of housing across villages, Bamboo Huts are the most common type of
housing in Ah KalChaungWa, Don Yan Thaung Tan, and Yae Twin Kone Than Deik; and; whereas Bamboo
Huts with wooden floors are more common in Nyaung Leinkone Taw Ka Ni and Ta Mar Ta kaw (see
Figure 11).
24 5 16 6 45 2 1
0% 10% 20% 30% 40% 50% 60% 70% 80% 90% 100%
Percent
Main occupation, (n=214)Main occupation, (n=214)Main occupation, (n=214)Main occupation, (n=214)
Paddy (own) Paddy (Hire) Farming Fishing
Small Business/Vendors Casual work (Fishing, etc) Job (Regular income) support by my child
Baseline Survey for Enhancing Disaster Safety in Vulnerable Communities in Myanmar 13
Figure 11: Type of housing by village
c. Knowledge and attitudes about disasters
Household knowledge of disasters and perceptions of vulnerability
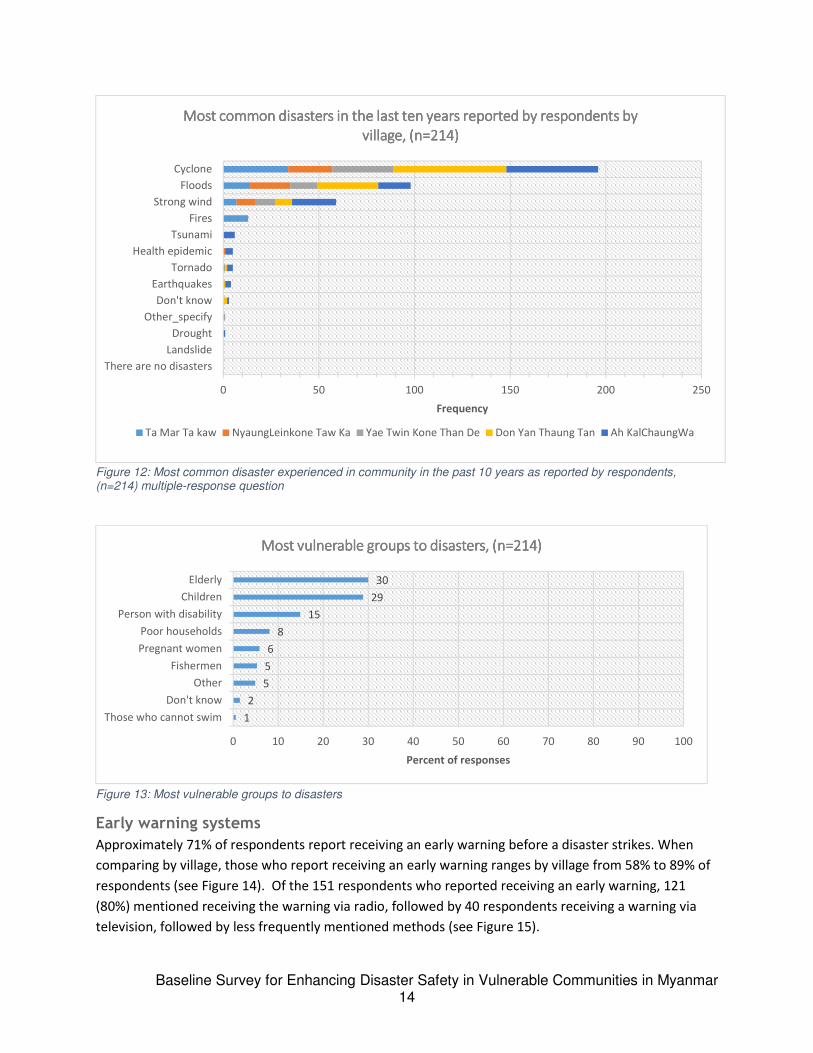
When asked what the most common disasters in the last ten years, the most commonly reported
disaster was a cyclone, followed by floods, and strong winds (see Table 5 and Figure 12). The most
vulnerable groups as identified by the respondents were most frequently reported to be the elderly,
children, and persons with disabilities (see Figure 13).
Table 5: Most common disaster experienced in community in the past 10 years as reported by respondents, (n=214) multiple-response question
Most common disaster reported in past 10 years
Frequency Percent of responses
Cyclone 196 50.13
Floods 98 25.06
Strong wind 59 15.09
Fires 13 3.32
Tsunami 6 1.53
Health epidemic 5 1.28
Tornado 5 1.28
Earthquakes 4 1.02
Don't know 3 0.77
Other 1 0.26
Drought 1 0.26
Landslide 0 0
There are no disasters 0 0
Total 391 100
16
17
49
43
56
41
43
24
40
19
22
22
19
14
12
16
4
5
3
4
3
9
3
6 4
3
4
0 10 20 30 40 50 60 70 80 90 100
Ta Mar Ta
NyaungLei
Yae Twin
Don Yan T
Ah KalCha
Percent
Type of housing by village, (n=214)Type of housing by village, (n=214)Type of housing by village, (n=214)Type of housing by village, (n=214)
Bamboo Hut Wooden Floor Bamboo Hut Wooden House (1 story) Wooden House (2 story)
Brick Nogging Building Concrete Building Mixed Material Building
Baseline Survey for Enhancing Disaster Safety in Vulnerable Communities in Myanmar 14
Figure 12: Most common disaster experienced in community in the past 10 years as reported by respondents, (n=214) multiple-response question
Figure 13: Most vulnerable groups to disasters
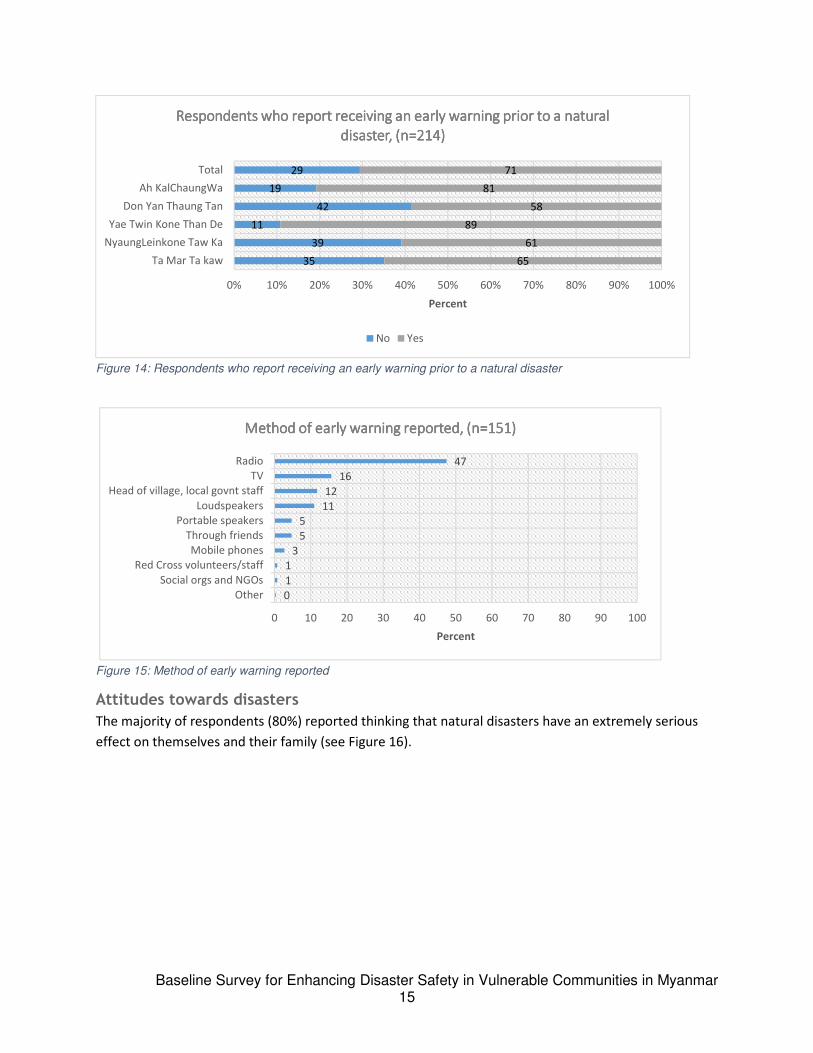
Early warning systems
Approximately 71% of respondents report receiving an early warning before a disaster strikes. When
comparing by village, those who report receiving an early warning ranges by village from 58% to 89% of
respondents (see Figure 14). Of the 151 respondents who reported receiving an early warning, 121
(80%) mentioned receiving the warning via radio, followed by 40 respondents receiving a warning via
television, followed by less frequently mentioned methods (see Figure 15).
0 50 100 150 200 250
There are no disasters
Landslide
Drought
Other_specify
Don't know
Earthquakes
Tornado
Health epidemic
Tsunami
Fires
Strong wind
Floods
Cyclone
Frequency
Most common disasters in the last ten years reported by respondents by Most common disasters in the last ten years reported by respondents by Most common disasters in the last ten years reported by respondents by Most common disasters in the last ten years reported by respondents by
village, (n=214)village, (n=214)village, (n=214)village, (n=214)
Ta Mar Ta kaw NyaungLeinkone Taw Ka Yae Twin Kone Than De Don Yan Thaung Tan Ah KalChaungWa
1
2
5
5
6
8
15
29
30
0 10 20 30 40 50 60 70 80 90 100
Those who cannot swim
Don't know
Other
Fishermen
Pregnant women
Poor households
Person with disability
Children
Elderly
Percent of responses
Most vulnerable groups to disasters, (n=214)Most vulnerable groups to disasters, (n=214)Most vulnerable groups to disasters, (n=214)Most vulnerable groups to disasters, (n=214)
Baseline Survey for Enhancing Disaster Safety in Vulnerable Communities in Myanmar 15
Figure 14: Respondents who report receiving an early warning prior to a natural disaster
Figure 15: Method of early warning reported
Attitudes towards disasters
The majority of respondents (80%) reported thinking that natural disasters have an extremely serious
effect on themselves and their family (see Figure 16).
35
39
11
42
19
29
65
61
89
58
81
71
0% 10% 20% 30% 40% 50% 60% 70% 80% 90% 100%
Ta Mar Ta kaw
NyaungLeinkone Taw Ka
Yae Twin Kone Than De
Don Yan Thaung Tan
Ah KalChaungWa
Total
Percent
Respondents who report receiving an early warning prior to a natural Respondents who report receiving an early warning prior to a natural Respondents who report receiving an early warning prior to a natural Respondents who report receiving an early warning prior to a natural
disaster, (n=214)disaster, (n=214)disaster, (n=214)disaster, (n=214)
No Yes
0
1
1
3
5
5
11
12
16
47
0 10 20 30 40 50 60 70 80 90 100
Other
Social orgs and NGOs
Red Cross volunteers/staff
Mobile phones
Through friends
Portable speakers
Loudspeakers
Head of village, local govnt staff
TV
Radio
Percent
Method of early warning reported, (n=151)Method of early warning reported, (n=151)Method of early warning reported, (n=151)Method of early warning reported, (n=151)

Baseline Survey for Enhancing Disaster Safety in Vulnerable Communities in Myanmar 16
Figure 16: Extent to which natural disasters affect respondents and respondents' family
When asked what respondents worry most about when it comes to natural disasters, about half of the
respondents worry about wasting money necessary to re-establish their lives, another third worry about
a variety of other issues, and another third worry about water pollution, with less frequently reported
worries across the other items (see Figure 17). The most frequently mentioned concern is primarily
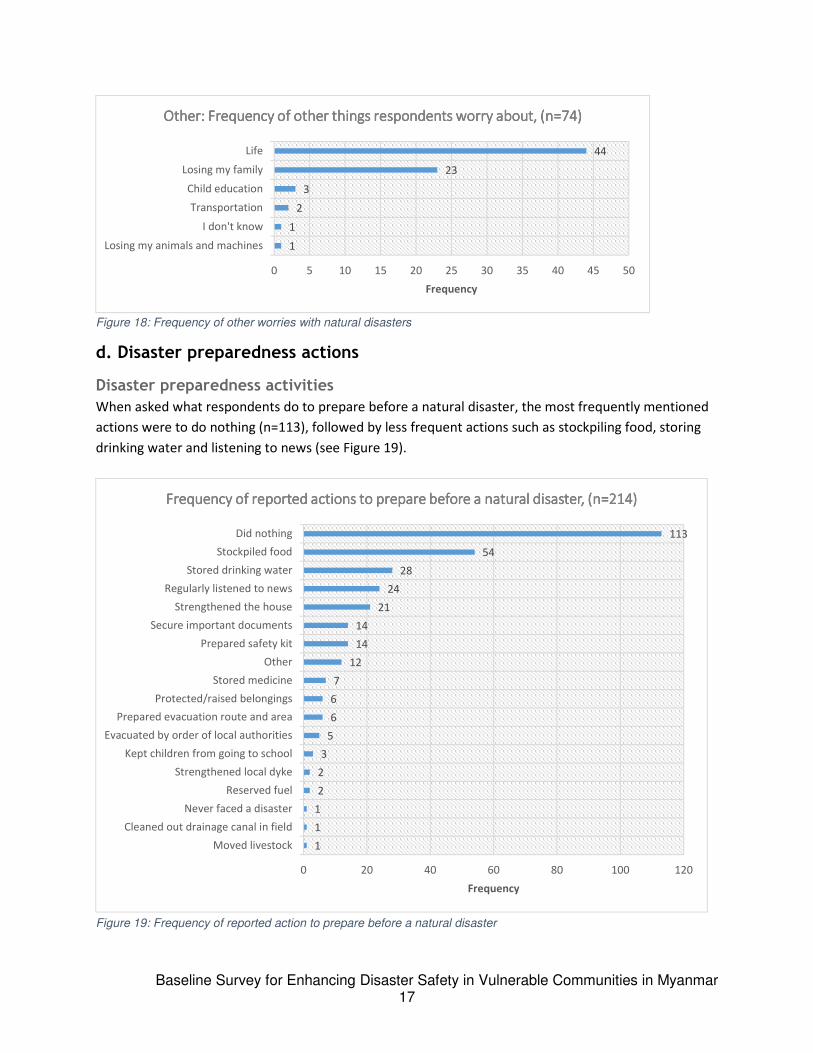
related to livelihoods, followed by environmental concerns, and life. Of those who reported “other”
worries (n=74) about natural disasters, the two major concerns that that were revealed are about life
and loss of family (see Figure 18).
Figure 17: Frequency of worries about natural disasters
0 315
79
1
0
20
40
60
80
100
No impacts Mild Impact Serious Impact Extremely
Serious
Don't know
Pe
rce
nt
To what extent do natural disasters affect you and your To what extent do natural disasters affect you and your To what extent do natural disasters affect you and your To what extent do natural disasters affect you and your
family, (n=214) family, (n=214) family, (n=214) family, (n=214)
2
2
2
3
3
5
9
10
12
25
27
30
33
68
74
117
0 20 40 60 80 100 120 140
More pests and diseases
Shortage of fresh water
More diseases
Effects work and reduce income
Saline intrusion
Collapsed houses
More disasters
Environment pollution
Low crop yield
Losing land
Crop failures
Losing jobs
Unusual weather conditions
Water pollution
Other
Waste money to re-establish lives
Frequency
Frequency of what respondents worry about with natural disasters, (n=214)Frequency of what respondents worry about with natural disasters, (n=214)Frequency of what respondents worry about with natural disasters, (n=214)Frequency of what respondents worry about with natural disasters, (n=214)
Baseline Survey for Enhancing Disaster Safety in Vulnerable Communities in Myanmar 17
Figure 18: Frequency of other worries with natural disasters
d. Disaster preparedness actions
Disaster preparedness activities
When asked what respondents do to prepare before a natural disaster, the most frequently mentioned
actions were to do nothing (n=113), followed by less frequent actions such as stockpiling food, storing
drinking water and listening to news (see Figure 19).
Figure 19: Frequency of reported action to prepare before a natural disaster
1
1
2
3
23
44
0 5 10 15 20 25 30 35 40 45 50
Losing my animals and machines
I don't know
Transportation
Child education
Losing my family
Life
Frequency
Other: Frequency of other things respondents worry about, (n=74)Other: Frequency of other things respondents worry about, (n=74)Other: Frequency of other things respondents worry about, (n=74)Other: Frequency of other things respondents worry about, (n=74)
1
1
1
2
2
3
5
6
6
7
12
14
14
21
24
28
54
113
0 20 40 60 80 100 120
Moved livestock
Cleaned out drainage canal in field
Never faced a disaster
Reserved fuel
Strengthened local dyke
Kept children from going to school
Evacuated by order of local authorities
Prepared evacuation route and area
Protected/raised belongings
Stored medicine
Other
Prepared safety kit
Secure important documents
Strengthened the house
Regularly listened to news
Stored drinking water
Stockpiled food
Did nothing
Frequency
Frequency of reported actions to prepare before a natural disaster, (n=214)Frequency of reported actions to prepare before a natural disaster, (n=214)Frequency of reported actions to prepare before a natural disaster, (n=214)Frequency of reported actions to prepare before a natural disaster, (n=214)

Baseline Survey for Enhancing Disaster Safety in Vulnerable Communities in Myanmar 18
Of those respondents who did nothing (n=113), 79 did not know or think the disaster would happen,
and another large group (35 respondents) did not know what actions to take to prepare (see Figure 20).
Figure 20: Reasons why respondents do not prepare for natural disaster
When respondents were asked about actions they would take during a natural disaster, about half of
respondents stated that they would do nothing, with less than a quarter of respondents stating other
options such as running to a safe place and strengthening their house (see Figure 21). Of those who
stated “other” options (n=49), 35 of them would run to a safe place (see Figure 22).
Figure 21: Actions taken during a natural disaster
1
2
3
35
79
0 10 20 30 40 50 60 70 80 90
Other
Did not have the time and/or money
Felt that there was no way of preparing
Did not know what should be prepared
Didn't know or think it would happen
Frequency
Reasons why respondents did not prepare for natural disaster, (n=113)Reasons why respondents did not prepare for natural disaster, (n=113)Reasons why respondents did not prepare for natural disaster, (n=113)Reasons why respondents did not prepare for natural disaster, (n=113)
47
21
16
6
6
3
2
0 10 20 30 40 50 60 70 80 90 100
Did nothing
Other
Strengthened the house
Helped vulnerable people
Did not allow children to play near risk areas
Regularly listened to news on disaster situation
Participated in rescue work when needed
Percent
Frequency of actions reported during a natural disaster, (n=213)Frequency of actions reported during a natural disaster, (n=213)Frequency of actions reported during a natural disaster, (n=213)Frequency of actions reported during a natural disaster, (n=213)

Baseline Survey for Enhancing Disaster Safety in Vulnerable Communities in Myanmar 19
Figure 22: Other actions taken during a natural disaster
When respondents were asked what they would do after a natural disaster, the majority responded that
they would fix their house, followed by a large response for other options such as finding food,
participating in clean-up operations, and participate in relief work (see Figures 23 and 24).
Figure 23: Frequency of reported actions respondents will take after a natural disaster
Figure 24: Other actions after a natural disaster
35
5
3
3
2
1
0 5 10 15 20 25 30 35 40
Ran to safe place
Live together family
Saved food
Stayed in a big building
Held a life jacket
Went to a tree
Frequency
Frequency of other actions during a natural disasters (n=49)Frequency of other actions during a natural disasters (n=49)Frequency of other actions during a natural disasters (n=49)Frequency of other actions during a natural disasters (n=49)
139
5743
27 264 2 1 1
0
50
100
150
200
Fix the house Other
(specify)
Participate in
cleanup
operations
Participate in
relief work
Do nothing Participate in
village mtgs.
on disaster
preparedness
and response
Report to
local
government
about the
effects of
disaster
Cleaning
water sources
Proactively
prevent
diseases
Fre
qu
en
cy
Frequency of reported actions respondents will take after a natural disaster Frequency of reported actions respondents will take after a natural disaster Frequency of reported actions respondents will take after a natural disaster Frequency of reported actions respondents will take after a natural disaster
3813 5 1
0
50
100
150
200
Finding food Reestablishing life Finding lost people Repairing my shop
Fre
qu
en
cy
Frequency of other reported actions after a natural disaster, (n=57)Frequency of other reported actions after a natural disaster, (n=57)Frequency of other reported actions after a natural disaster, (n=57)Frequency of other reported actions after a natural disaster, (n=57)

Baseline Survey for Enhancing Disaster Safety in Vulnerable Communities in Myanmar 20
If the respondents’ homes were located in a river flood area, many respondents stated that they would
re-elevate their house, prepare life jackets/boats, and evacuate to safe shelter (see Figure 25). Other
options mentioned included going ashore.
Figure 25: Frequency of actions reported if respondents’ house is located in a river/flood area
If the respondents’ home was located in a cyclone prone area, the most common responses were that
they would move to a relative’s house, and evacuate to a community shelter after an early warning (see
Figure 26).
Figure 26: Frequency of reported actions if respondents’ house is located in a cyclone area
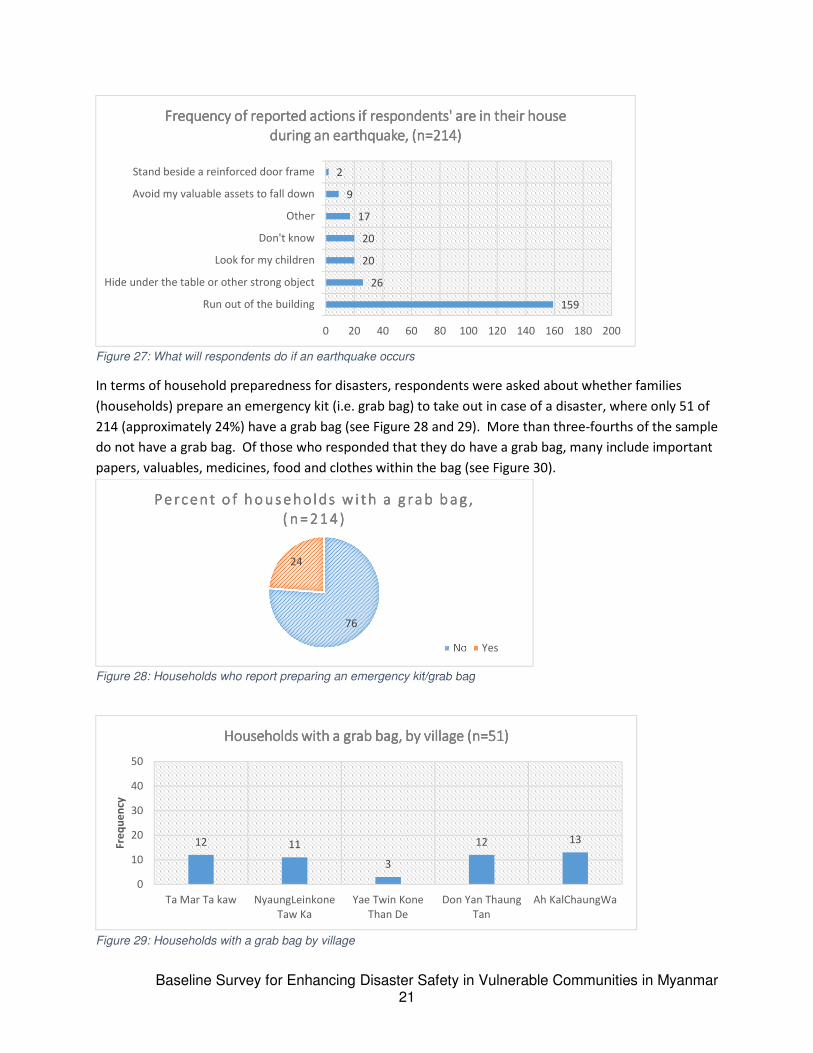
Regarding earthquakes, the majority of respondents stated that they would run out of the building if an
earthquake were to occur (see Figure 27).
56
54
51
50
40
27
15
0 20 40 60 80 100 120 140 160 180 200
Re-elevate house on stilt
Prepare life jacket/boat
Evacuating to the community shelter when the water level is rising
Putting belongings to upper level (shelf)
Moving to relative house
Other
Don't know
Frequency
Frequency of actions reported if respondents' house is located in river flood Frequency of actions reported if respondents' house is located in river flood Frequency of actions reported if respondents' house is located in river flood Frequency of actions reported if respondents' house is located in river flood
area? (n=214)area? (n=214)area? (n=214)area? (n=214)
88
77
40
22
18
14
1
0 20 40 60 80 100 120 140 160 180 200
Moving to a relative's house
Evacuating to the community shelter after receiving the early…
Stockpiling food items, water and securing important document
Inspect house and yard for heavy items and secure them
Other
Don't know
Listening to the radio to get latest weather update
Frequency
Frequency of reported actions if respondents' house is located in an area to Frequency of reported actions if respondents' house is located in an area to Frequency of reported actions if respondents' house is located in an area to Frequency of reported actions if respondents' house is located in an area to
be affected by a cyclone? (n=214)be affected by a cyclone? (n=214)be affected by a cyclone? (n=214)be affected by a cyclone? (n=214)
Baseline Survey for Enhancing Disaster Safety in Vulnerable Communities in Myanmar 21
Figure 27: What will respondents do if an earthquake occurs
In terms of household preparedness for disasters, respondents were asked about whether families
(households) prepare an emergency kit (i.e. grab bag) to take out in case of a disaster, where only 51 of
214 (approximately 24%) have a grab bag (see Figure 28 and 29). More than three-fourths of the sample
do not have a grab bag. Of those who responded that they do have a grab bag, many include important
papers, valuables, medicines, food and clothes within the bag (see Figure 30).
Figure 28: Households who report preparing an emergency kit/grab bag
Figure 29: Households with a grab bag by village
159
26
20
20
17
9
2
0 20 40 60 80 100 120 140 160 180 200
Run out of the building
Hide under the table or other strong object
Look for my children
Don't know
Other
Avoid my valuable assets to fall down
Stand beside a reinforced door frame
Frequency of reported actions if respondents' are in their house Frequency of reported actions if respondents' are in their house Frequency of reported actions if respondents' are in their house Frequency of reported actions if respondents' are in their house
during an earthquake, (n=214)during an earthquake, (n=214)during an earthquake, (n=214)during an earthquake, (n=214)
76
24
Pe rc e nt o f h o u s e ho l ds w i t h a g ra b b a g , Pe rc e nt o f h o u s e ho l ds w i t h a g ra b b a g , Pe rc e nt o f h o u s e ho l ds w i t h a g ra b b a g , Pe rc e nt o f h o u s e ho l ds w i t h a g ra b b a g ,
( n = 2 1 4 )( n = 2 1 4 )( n = 2 1 4 )( n = 2 1 4 )
No Yes
12 11
3
12 13
0
10
20
30
40
50
Ta Mar Ta kaw NyaungLeinkone
Taw Ka
Yae Twin Kone
Than De
Don Yan Thaung
Tan
Ah KalChaungWa
Fre
qu
en
cy
Households with a grab bag, by village (n=51)Households with a grab bag, by village (n=51)Households with a grab bag, by village (n=51)Households with a grab bag, by village (n=51)

Baseline Survey for Enhancing Disaster Safety in Vulnerable Communities in Myanmar 22
Figure 30: Contents of a grab bag
e. Community preparedness planning and activities
Community preparedness
Approximately, 51% of respondents know of a group or institution in their community that helps
prepare the community for disasters. When compared across villages, more than 50% of households
sampled within NyaunLeinkone Taw Ka and Ah KalChaungWa know of such an institution (see Figure
31).
Figure 31: Percent of respondents who know of disaster preparedness organization in their community
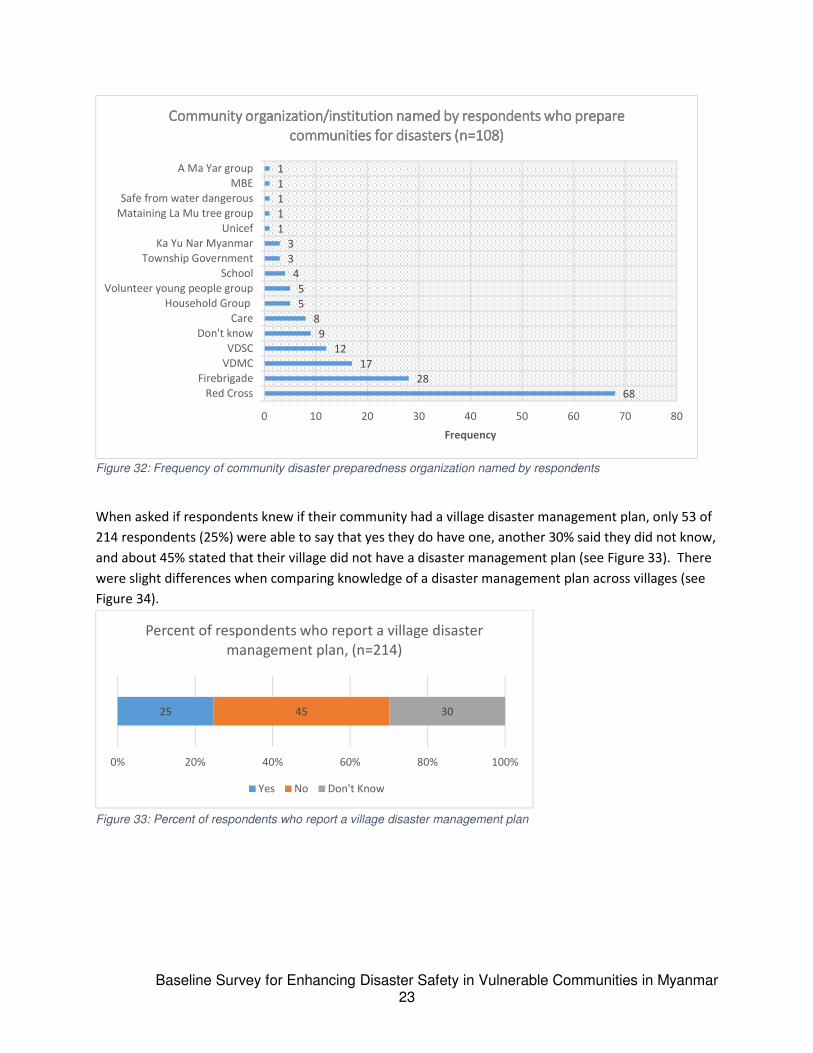
Of the 108 respondents who knew of an organization or institution in their community that works to
prepare for disasters, almost 70 mentioned the Red Cross, followed by the Fire Brigade, VDMC, VDSC,
and others (see Figure 32).
32
14
11
11
11
6
1
1
0 5 10 15 20 25 30 35 40 45 50
Important Paper
Valuable
Medicine
Food
Food,clothes,blanket
Clothes
Life jacket
Money
Frequency
Contents of grab bag of households who report having a grab bag, (n=51)Contents of grab bag of households who report having a grab bag, (n=51)Contents of grab bag of households who report having a grab bag, (n=51)Contents of grab bag of households who report having a grab bag, (n=51)
38
78
4938
63
0
20
40
60
80
100
Ta Mar Ta kaw NyaungLeinkone
Taw Ka
Yae Twin Kone Than
De
Don Yan Thaung Tan Ah KalChaungWa
Pe
rce
nt
Percent of respondents who know of a disaster preparedness org. in their Percent of respondents who know of a disaster preparedness org. in their Percent of respondents who know of a disaster preparedness org. in their Percent of respondents who know of a disaster preparedness org. in their
community, by village (n=214)community, by village (n=214)community, by village (n=214)community, by village (n=214)
Baseline Survey for Enhancing Disaster Safety in Vulnerable Communities in Myanmar 23
Figure 32: Frequency of community disaster preparedness organization named by respondents
When asked if respondents knew if their community had a village disaster management plan, only 53 of
214 respondents (25%) were able to say that yes they do have one, another 30% said they did not know,
and about 45% stated that their village did not have a disaster management plan (see Figure 33). There
were slight differences when comparing knowledge of a disaster management plan across villages (see
Figure 34).
Figure 33: Percent of respondents who report a village disaster management plan
68
28
17
12
9
8
5
5
4
3
3
1
1
1
1
1
0 10 20 30 40 50 60 70 80
Red Cross
Firebrigade
VDMC
VDSC
Don't know
Care
Household Group
Volunteer young people group
School
Township Government
Ka Yu Nar Myanmar
Unicef
Mataining La Mu tree group
Safe from water dangerous
MBE
A Ma Yar group
Frequency
Community organization/institution named by respondents who prepare Community organization/institution named by respondents who prepare Community organization/institution named by respondents who prepare Community organization/institution named by respondents who prepare
communities for disasters (n=108)communities for disasters (n=108)communities for disasters (n=108)communities for disasters (n=108)
25 45 30
0% 20% 40% 60% 80% 100%
Percent of respondents who report a village disaster
management plan, (n=214)
Yes No Don't Know

Baseline Survey for Enhancing Disaster Safety in Vulnerable Communities in Myanmar 24
Figure 34: Percent of households reporting a village disaster management plan
Of the total respondents who knew of disaster management plans (n=53), only 18 had participated in
the preparation of the plan. The 18 respondents who participated in the preparation of the disaster
management plan had various roles, such as VDMC member, community member, VDC member, and
others (see Figure 35).
Figure 35: Frequency of respondents' role in preparation of disaster management plan
With regards to a community fund for support to deal with disasters, only 31 of 214 (approximately
15%) of respondents stated that their community has such a fund, with 45 respondents unsure if such a
fund exists, and 138 reporting that there is no such fund. There are no major differences when
comparing across villages (see Figure 36).
14
35 38
11
37
49
30
46
68
21
38 35
1622
42
0
10
20
30
40
50
60
70
80
90
100
Ta Mar Ta kaw NyaungLeinkone
Taw Ka
Yae Twin Kone
Than De
Don Yan Thaung
Tan
Ah KalChaungWa
Pe
rce
nt
Percent of households reporting if there is a village disaster management Percent of households reporting if there is a village disaster management Percent of households reporting if there is a village disaster management Percent of households reporting if there is a village disaster management
plan, (n=214)plan, (n=214)plan, (n=214)plan, (n=214)
Yes
No
Don't Know
6
4
4
2
1
1
0 2 4 6 8 10 12 14 16 18 20
VDMC member
Participated as community member
Other
VDC member
RC volunteers
Community volunteers
Frequency
Role of respondent in prepartion of disaster management plan (n=18)Role of respondent in prepartion of disaster management plan (n=18)Role of respondent in prepartion of disaster management plan (n=18)Role of respondent in prepartion of disaster management plan (n=18)
Baseline Survey for Enhancing Disaster Safety in Vulnerable Communities in Myanmar 25
Figure 36: Percent of respondents reporting a community fund for disasters, by village
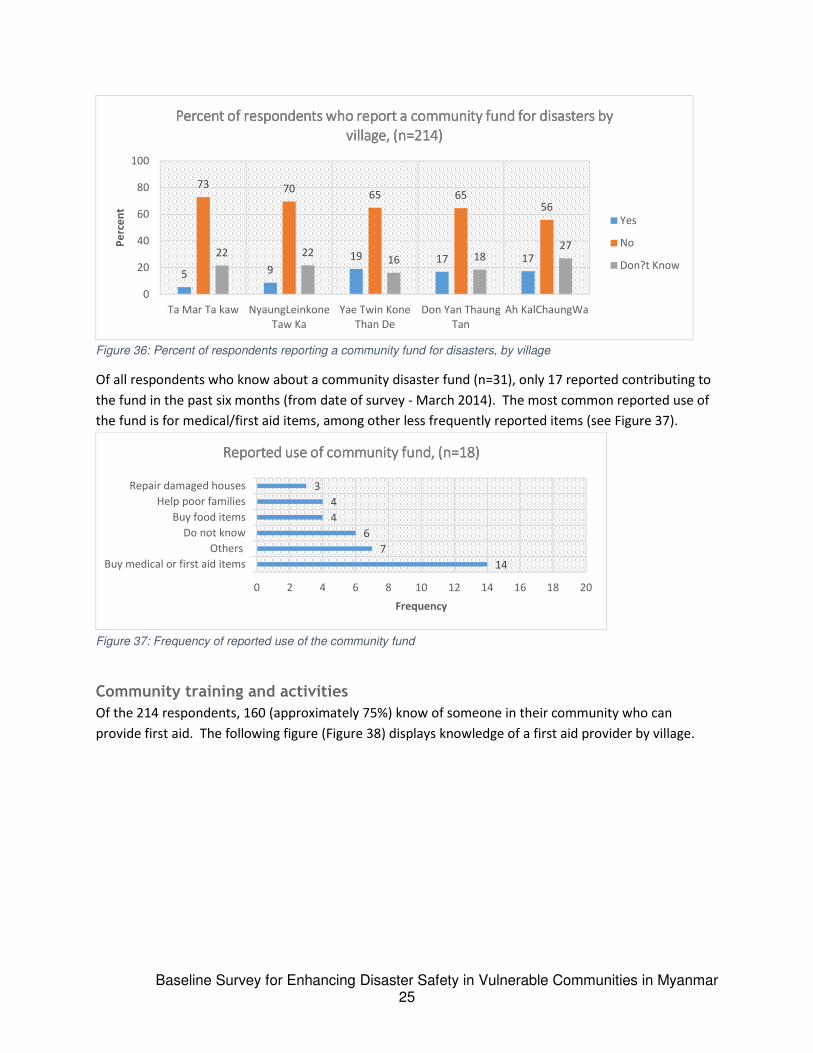
Of all respondents who know about a community disaster fund (n=31), only 17 reported contributing to
the fund in the past six months (from date of survey - March 2014). The most common reported use of
the fund is for medical/first aid items, among other less frequently reported items (see Figure 37).
Figure 37: Frequency of reported use of the community fund
Community training and activities
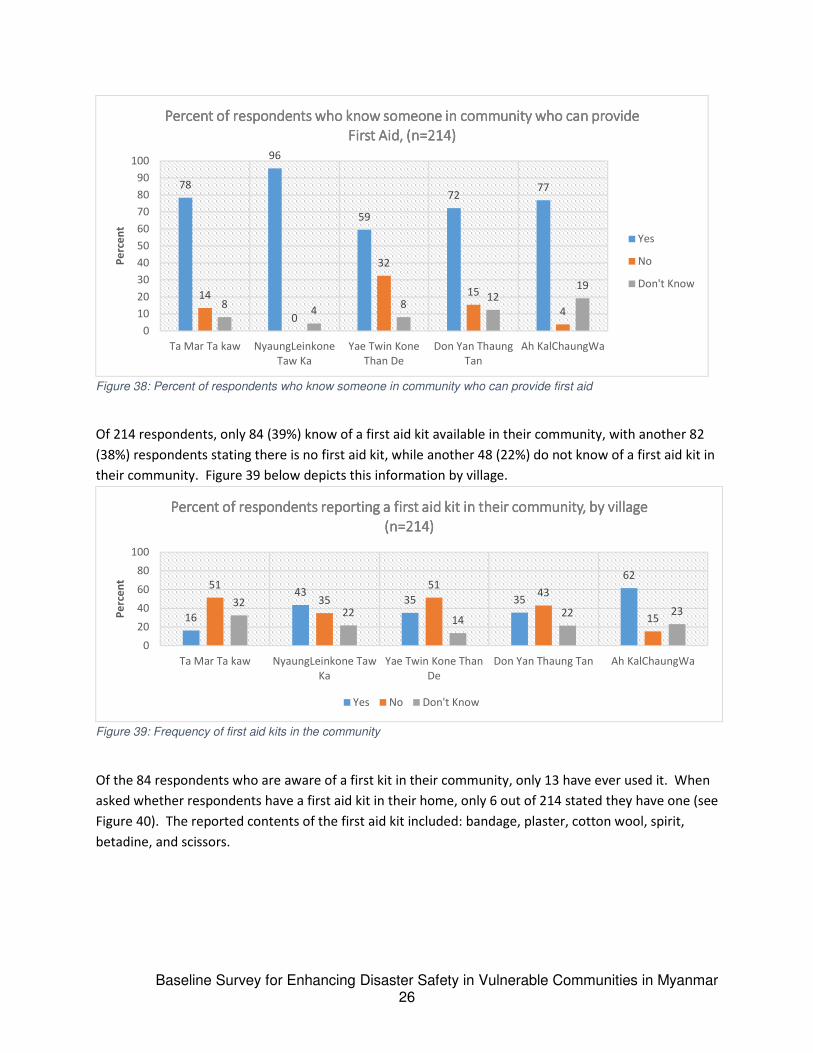
Of the 214 respondents, 160 (approximately 75%) know of someone in their community who can
provide first aid. The following figure (Figure 38) displays knowledge of a first aid provider by village.
5 9
19 17 17
73 7065 65
56
22 2216 18
27
0
20
40
60
80
100
Ta Mar Ta kaw NyaungLeinkone
Taw Ka
Yae Twin Kone
Than De
Don Yan Thaung
Tan
Ah KalChaungWa
Pe
rce
nt
Percent of respondents who report a community fund for disasters by Percent of respondents who report a community fund for disasters by Percent of respondents who report a community fund for disasters by Percent of respondents who report a community fund for disasters by
village, (n=214)village, (n=214)village, (n=214)village, (n=214)
Yes
No
Don?t Know
14
7
6
4
4
3
0 2 4 6 8 10 12 14 16 18 20
Buy medical or first aid items
Others
Do not know
Buy food items
Help poor families
Repair damaged houses
Frequency
Reported use of community fund, (n=18)Reported use of community fund, (n=18)Reported use of community fund, (n=18)Reported use of community fund, (n=18)
Baseline Survey for Enhancing Disaster Safety in Vulnerable Communities in Myanmar 26
Figure 38: Percent of respondents who know someone in community who can provide first aid
Of 214 respondents, only 84 (39%) know of a first aid kit available in their community, with another 82
(38%) respondents stating there is no first aid kit, while another 48 (22%) do not know of a first aid kit in
their community. Figure 39 below depicts this information by village.
Figure 39: Frequency of first aid kits in the community
Of the 84 respondents who are aware of a first kit in their community, only 13 have ever used it. When
asked whether respondents have a first aid kit in their home, only 6 out of 214 stated they have one (see
Figure 40). The reported contents of the first aid kit included: bandage, plaster, cotton wool, spirit,
betadine, and scissors.
78
96
59
7277
14
0
32
15
48
48
1219
0
10
20
30
40
50
60
70
80
90
100
Ta Mar Ta kaw NyaungLeinkone
Taw Ka
Yae Twin Kone
Than De
Don Yan Thaung
Tan
Ah KalChaungWa
Pe
rce
nt
Percent of respondents who know someone in community who can provide Percent of respondents who know someone in community who can provide Percent of respondents who know someone in community who can provide Percent of respondents who know someone in community who can provide
First Aid, (n=214)First Aid, (n=214)First Aid, (n=214)First Aid, (n=214)
Yes
No
Don't Know
16
4335 35
6251
35
5143
15
3222
1422 23
0
20
40
60
80
100
Ta Mar Ta kaw NyaungLeinkone Taw
Ka
Yae Twin Kone Than
De
Don Yan Thaung Tan Ah KalChaungWa
Pe
rce
nt
Percent of respondents reporting a first aid kit in their community, by village Percent of respondents reporting a first aid kit in their community, by village Percent of respondents reporting a first aid kit in their community, by village Percent of respondents reporting a first aid kit in their community, by village
(n=214)(n=214)(n=214)(n=214)
Yes No Don't Know

Baseline Survey for Enhancing Disaster Safety in Vulnerable Communities in Myanmar 27
Figure 40: Frequency of households with a first aid kit
When asked about community simulation exercises in preparation for a disaster, only 19 of 214 (9%)
respondents stated that they had participated in such an exercise. At least one respondent per selected
village reported participating in a simulation exercise (see Figure 41).
Figure 41: Frequency of respondents who have participated in a simulation
Of those who had participated in a simulation exercise (n=19), 12 had participated more than one year
ago, and seven within the past year (see Figure 42).
Figure 42: Frequency of last time a respondent participated in a simulation
208
6
0
50
100
150
200
250
No Yes
Fre
qu
en
cyFrequency of households with a First Aid Kit, (n=214)Frequency of households with a First Aid Kit, (n=214)Frequency of households with a First Aid Kit, (n=214)Frequency of households with a First Aid Kit, (n=214)
16
1 38
36
17
36
62
44
0
20
40
60
80
100
Ta Mar Ta kaw NyaungLeinkone
Taw Ka
Yae Twin Kone
Than De
Don Yan Thaung
Tan
Ah KalChaungWa
Fre
qu
en
cy
Frequency of respondents who have participated in simulation Frequency of respondents who have participated in simulation Frequency of respondents who have participated in simulation Frequency of respondents who have participated in simulation
exercise, (n=214)exercise, (n=214)exercise, (n=214)exercise, (n=214)
Yes
No
4 3
12
0
5
10
15
20
In the past 6 months 6-12 months, less than
one year ago
More than one year ago
Fre
qu
en
cy
Last time respondent participated in simulation exercise, Last time respondent participated in simulation exercise, Last time respondent participated in simulation exercise, Last time respondent participated in simulation exercise,
(n=19)(n=19)(n=19)(n=19)
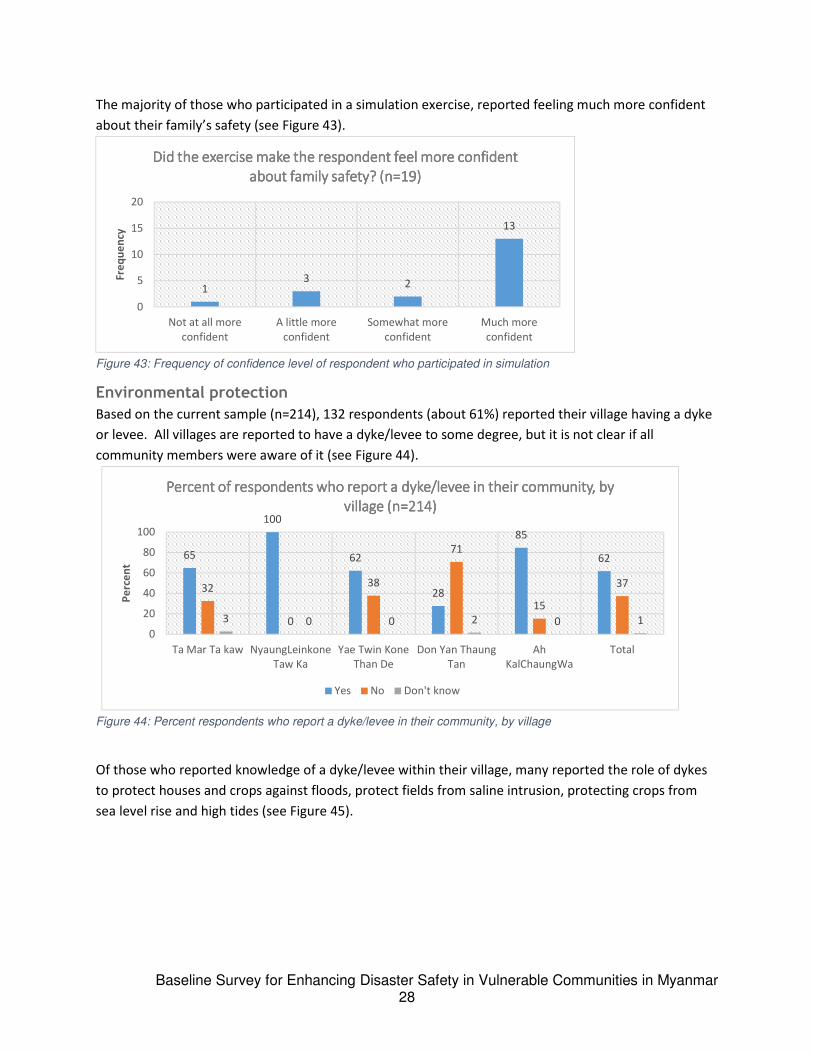
Baseline Survey for Enhancing Disaster Safety in Vulnerable Communities in Myanmar 28
The majority of those who participated in a simulation exercise, reported feeling much more confident
about their family’s safety (see Figure 43).
Figure 43: Frequency of confidence level of respondent who participated in simulation
Environmental protection
Based on the current sample (n=214), 132 respondents (about 61%) reported their village having a dyke
or levee. All villages are reported to have a dyke/levee to some degree, but it is not clear if all
community members were aware of it (see Figure 44).
Figure 44: Percent respondents who report a dyke/levee in their community, by village
Of those who reported knowledge of a dyke/levee within their village, many reported the role of dykes
to protect houses and crops against floods, protect fields from saline intrusion, protecting crops from
sea level rise and high tides (see Figure 45).
13 2
13
0
5
10
15
20
Not at all more
confident
A little more
confident
Somewhat more
confident
Much more
confident
Fre
qu
en
cy
Did the exercise make the respondent feel more confident Did the exercise make the respondent feel more confident Did the exercise make the respondent feel more confident Did the exercise make the respondent feel more confident
about family safety? (n=19)about family safety? (n=19)about family safety? (n=19)about family safety? (n=19)
65
100
62
28
85
62
32
0
38
71
15
37
3 0 0 2 0 1
0
20
40
60
80
100
Ta Mar Ta kaw NyaungLeinkone
Taw Ka
Yae Twin Kone
Than De
Don Yan Thaung
Tan
Ah
KalChaungWa
Total
Pe
rce
nt
Percent of respondents who report a dyke/levee in their community, by Percent of respondents who report a dyke/levee in their community, by Percent of respondents who report a dyke/levee in their community, by Percent of respondents who report a dyke/levee in their community, by
village (n=214)village (n=214)village (n=214)village (n=214)
Yes No Don't know
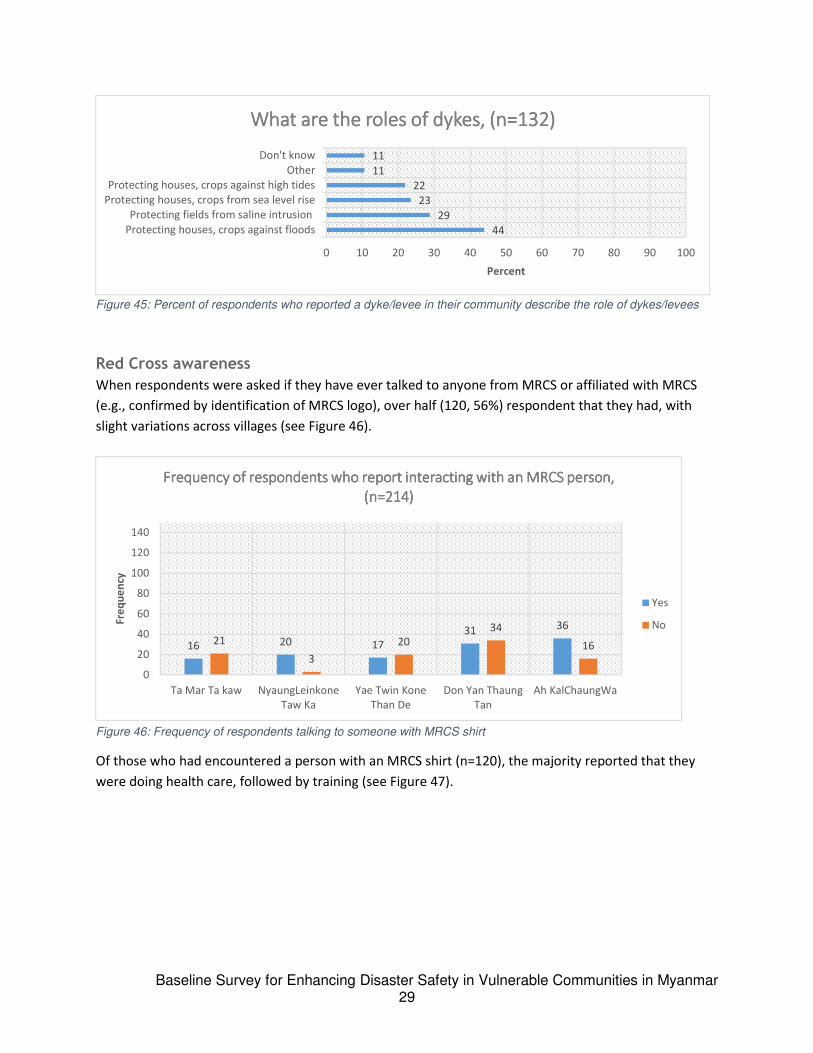
Baseline Survey for Enhancing Disaster Safety in Vulnerable Communities in Myanmar 29
Figure 45: Percent of respondents who reported a dyke/levee in their community describe the role of dykes/levees
Red Cross awareness
When respondents were asked if they have ever talked to anyone from MRCS or affiliated with MRCS
(e.g., confirmed by identification of MRCS logo), over half (120, 56%) respondent that they had, with
slight variations across villages (see Figure 46).
Figure 46: Frequency of respondents talking to someone with MRCS shirt
Of those who had encountered a person with an MRCS shirt (n=120), the majority reported that they
were doing health care, followed by training (see Figure 47).
44
29
23
22
11
11
0 10 20 30 40 50 60 70 80 90 100
Protecting houses, crops against floods
Protecting fields from saline intrusion
Protecting houses, crops from sea level rise
Protecting houses, crops against high tides
Other
Don't know
Percent
What are the roles of dykes, (n=132)What are the roles of dykes, (n=132)What are the roles of dykes, (n=132)What are the roles of dykes, (n=132)
16 20 17
31 36
21
3
20
34
16
0
20
40
60
80
100
120
140
Ta Mar Ta kaw NyaungLeinkone
Taw Ka
Yae Twin Kone
Than De
Don Yan Thaung
Tan
Ah KalChaungWa
Fre
qu
en
cy
Frequency of respondents who report interacting with an MRCS person, Frequency of respondents who report interacting with an MRCS person, Frequency of respondents who report interacting with an MRCS person, Frequency of respondents who report interacting with an MRCS person,
(n=214)(n=214)(n=214)(n=214)
Yes
No

Baseline Survey for Enhancing Disaster Safety in Vulnerable Communities in Myanmar 30
Figure 47: Reported role of MRSC affiliated person
For the most effective communication about natural disasters, the most common method reported was
via radio, followed by other less common methods (see Figure 48).
Figure 48: Most effective communication channels about natural disasters
Respondents report source of weather related information from radio as well as television; fewer
respondents mentioned heads of villages, mobile phones, loudspeakers, among others (see Figure 49).
68
44
18
13
7
6
4
4
0 20 40 60 80 100 120 140
Health care
Training
Don't know/don't remember
Awareness campaign
Disaster drill
House visit
VCA/Mapping
Other
Frequency
Reported role of MRSC affiliated person(n=120)Reported role of MRSC affiliated person(n=120)Reported role of MRSC affiliated person(n=120)Reported role of MRSC affiliated person(n=120)
181
70
49
29
27
24
13
5
3
3
3
3
2
0 20 40 60 80 100 120 140 160 180 200
Radio
TV
Mobile phone/SMS
Head of villages, or local government staff
Loudspeakers
Red cross
Family members, friends
Internet
Books, newspaper
From social organizations
Don't know
Other
Other NGOs
Frequency
Most effective communication channels about natural disasters, (n=214)Most effective communication channels about natural disasters, (n=214)Most effective communication channels about natural disasters, (n=214)Most effective communication channels about natural disasters, (n=214)

Baseline Survey for Enhancing Disaster Safety in Vulnerable Communities in Myanmar 31
Figure 49: Frequency of reported sources for weather related news
4. Conclusions Overall, there was a high response rate from the sampled population (214 of 230) with females making
up two-thirds of the sample. About two-thirds (66%) of the sampled households have family members
who fall into the vulnerable categories (22% elderly, 6% person with disability, 2% pregnant women, and
37% children under five). The majority of respondents were between the 25-45 age group with roughly
20% between 46-55 years of age. About half of the respondents were the spouse of the head of
household, and a third was the head of household. The majority of respondents are educated, either
through monastery school, primary, or middle school; for primary occupation, almost half of the sample
rely on casual work (45%) such as fishing and about 24% own their own paddy. About 70% of the
households sampled live in a type of bamboo hut with or without a wooden floor. Knowledge The most common disasters reported were cyclones, floods and strong winds, with the elderly and
children named as the most vulnerable groups to disasters. Regarding early warning systems, about
71% of respondents report receiving an early warning prior to a disaster; however the percentage of
respondents per village who receiving an early warning varies greatly. The majority of respondents
receive an early warning via radio (80%) followed by television and village head/leaders. Attitudes The majority of sampled households believe that natural disasters are extremely serious in their effects
to the respondents and their families. The most frequently mentioned concern about natural disaster
was the wasting of money to re-establish their lives, water contamination and loss of life. In
preparations for a disaster, only 24% of the sampled households have an emergency grab bag ready,
and of those that have one, the most common items include important papers, valuables, medicine,
food and clothes. Practices
Before a natural disaster, the most frequently mentioned action that sampled households reported was
that they “did nothing”, followed by less frequently reported stockpiling food and storing drinking
water. The main reason behind the 113 respondents (of 213) who stated they did nothing was because
201
82
28
23
9
8
6
5
0
0 50 100 150 200
Radio
TV
Head of villages, or local government staff
Mobile phone/SMS
Loudspeakers
Family members, friends
Internet
Other
Newspaper
Frequency
Reported sources for weatherReported sources for weatherReported sources for weatherReported sources for weather----related news, (n=214)related news, (n=214)related news, (n=214)related news, (n=214)

Baseline Survey for Enhancing Disaster Safety in Vulnerable Communities in Myanmar 32
they did not know or think a disaster would happen, and lesser number did not know what should be
prepared. During a natural disaster, the most frequently reported action was that the sampled households “did
nothing”, with less frequently (less than a quarter of the sample) reported strengthening their house
and running to a safe place. When posed with the situation if households were in a river flood area,
over a quarter of the sample would re-elevate their house, prepare life jackets/boats and evacuate. If
households were in an area to be affected by a cyclone, almost half of the respondents would move to a
relative’s house, and slightly less than half would evacuate to a community shelter. If households were
to be affected by an earthquake, about three-fourths of the sample would run out of the building. There is an overall low awareness of disaster preparedness knowledge as well as following practices.
Despite being affected by Cyclone Nargis in 2008, a large number of respondents don’t think a disaster
would happen or are unaware of proper steps to take to enhance safety and preparedness.
After a natural disaster, over half of the respondents reported that they would fix their house, and less
than a quarter would participate in clean-up operations and find food.
Community Disaster Preparedness Approximately half of the sampled households across all villages know of a community
organization/institution that helps their community prepare for a disaster, with the most frequently
mentioned organizations being the Red Cross, fire brigade, VDMC, VDSC and others. Only 25% of
sampled households were aware of a village disaster management plan, with less than half having
played a role in preparing it. Regarding community funds for disasters, only 15% (31 of 214) of sampled
households reported that such a fund existed, and of those, only half (17 households) report
contributing to it. About 61% (132 of 214) of sampled households reported that their village has a
dyke/levee, and of those who report one, the majority stated that the role is to protect houses, crops,
and fields against floods and high waters. In first aid, about 75% of sampled households know of someone who can provide first aid within their
community, and 39% of sampled households know of a first aid kit available in their community. Almost
all (208 of 214) households sampled do not have a first aid kit in the home. Very few (19 of 214) of the sampled households have participated in a community simulation exercise in
preparation for a disaster, with at least half (12 of 19) of those who participated feeling much more
confident about family safety afterwards. Red Cross awareness and communication Over half of the sampled households (120 of 214) report speaking to someone with an MRCS shirt, with
the majority of that half reporting that the MRCS person was doing health care, and training. This
finding reinforces the commonly held belief that the MRCS, as one of the largest humanitarian
organizations, has extensive grassroots network and presence on the ground. Also the visibility of MRCS
can be attributed to the significant relief and recovery programs implemented by MRCS in the program
villages. It is, therefore, timely that through the project, MRCS will be able to spread knowledge and
skills on disaster preparedness and further solidify its image in the community.
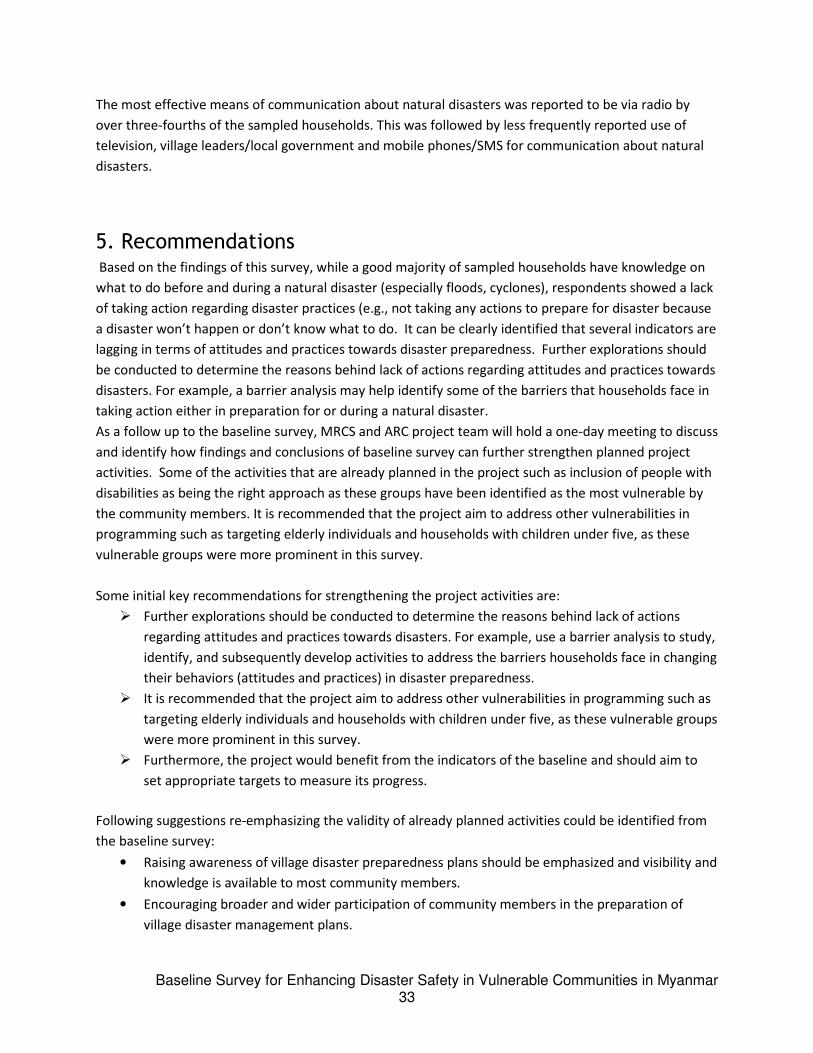
Baseline Survey for Enhancing Disaster Safety in Vulnerable Communities in Myanmar 33
The most effective means of communication about natural disasters was reported to be via radio by
over three-fourths of the sampled households. This was followed by less frequently reported use of
television, village leaders/local government and mobile phones/SMS for communication about natural
disasters.
5. Recommendations Based on the findings of this survey, while a good majority of sampled households have knowledge on
what to do before and during a natural disaster (especially floods, cyclones), respondents showed a lack
of taking action regarding disaster practices (e.g., not taking any actions to prepare for disaster because
a disaster won’t happen or don’t know what to do. It can be clearly identified that several indicators are
lagging in terms of attitudes and practices towards disaster preparedness. Further explorations should
be conducted to determine the reasons behind lack of actions regarding attitudes and practices towards
disasters. For example, a barrier analysis may help identify some of the barriers that households face in
taking action either in preparation for or during a natural disaster.
As a follow up to the baseline survey, MRCS and ARC project team will hold a one-day meeting to discuss
and identify how findings and conclusions of baseline survey can further strengthen planned project
activities. Some of the activities that are already planned in the project such as inclusion of people with
disabilities as being the right approach as these groups have been identified as the most vulnerable by
the community members. It is recommended that the project aim to address other vulnerabilities in
programming such as targeting elderly individuals and households with children under five, as these
vulnerable groups were more prominent in this survey.
Some initial key recommendations for strengthening the project activities are:
� Further explorations should be conducted to determine the reasons behind lack of actions
regarding attitudes and practices towards disasters. For example, use a barrier analysis to study,
identify, and subsequently develop activities to address the barriers households face in changing
their behaviors (attitudes and practices) in disaster preparedness.
� It is recommended that the project aim to address other vulnerabilities in programming such as
targeting elderly individuals and households with children under five, as these vulnerable groups
were more prominent in this survey.
� Furthermore, the project would benefit from the indicators of the baseline and should aim to
set appropriate targets to measure its progress.
Following suggestions re-emphasizing the validity of already planned activities could be identified from
the baseline survey:
• Raising awareness of village disaster preparedness plans should be emphasized and visibility and
knowledge is available to most community members.
• Encouraging broader and wider participation of community members in the preparation of
village disaster management plans.

Baseline Survey for Enhancing Disaster Safety in Vulnerable Communities in Myanmar 34
• Supporting the community to ensure first aid kits are available in the community with
community volunteers, and other community leaders during and after the project. The
community should have a mechanism of sharing information about the location of first aid kits
as well as a plan for regular replenishment.
• Strengthening community level initiatives that stockpile food, water instead of such stockpiling
at an individual level. The community emergency fund planned in the project could be a
supplement to this community level initiative.
• Conducting already planned simulation exercises as the role and benefit of simulation exercises
is well-appreciated by community members, and ensuring vulnerable members of the
community are included.
![HPTN 068 Study Household Baseline Questionnaire …...Household Baseline Questionnaire 31 JANUARY 2011-- FINAL -- v1.0 [ ] [ ] Caregiver Relationship Codes Coding: List all household](https://static.fdocuments.in/doc/165x107/5f3b3afb5990ba394b68f5ae/hptn-068-study-household-baseline-questionnaire-household-baseline-questionnaire.jpg)