Based on Natural Melanin Nanoparticles Superior...
29
Subscriber access provided by CORNELL UNIVERSITY LIBRARY Biomacromolecules is published by the American Chemical Society. 1155 Sixteenth Street N.W., Washington, DC 20036 Published by American Chemical Society. Copyright © American Chemical Society. However, no copyright claim is made to original U.S. Government works, or works produced by employees of any Commonwealth realm Crown government in the course of their duties. Article Superior Performance of Polyurethane Based on Natural Melanin Nanoparticles Yang Wang, Ting Li, Xuefei Wang, Piming Ma, Huiyu Bai, Weifu Dong, Yi Xie, and Mingqing Chen Biomacromolecules, Just Accepted Manuscript • DOI: 10.1021/acs.biomac.6b01298 • Publication Date (Web): 17 Oct 2016 Downloaded from http://pubs.acs.org on October 19, 2016 Just Accepted “Just Accepted” manuscripts have been peer-reviewed and accepted for publication. They are posted online prior to technical editing, formatting for publication and author proofing. The American Chemical Society provides “Just Accepted” as a free service to the research community to expedite the dissemination of scientific material as soon as possible after acceptance. “Just Accepted” manuscripts appear in full in PDF format accompanied by an HTML abstract. “Just Accepted” manuscripts have been fully peer reviewed, but should not be considered the official version of record. They are accessible to all readers and citable by the Digital Object Identifier (DOI®). “Just Accepted” is an optional service offered to authors. Therefore, the “Just Accepted” Web site may not include all articles that will be published in the journal. After a manuscript is technically edited and formatted, it will be removed from the “Just Accepted” Web site and published as an ASAP article. Note that technical editing may introduce minor changes to the manuscript text and/or graphics which could affect content, and all legal disclaimers and ethical guidelines that apply to the journal pertain. ACS cannot be held responsible for errors or consequences arising from the use of information contained in these “Just Accepted” manuscripts.
Transcript of Based on Natural Melanin Nanoparticles Superior...

Subscriber access provided by CORNELL UNIVERSITY LIBRARY
Biomacromolecules is published by the American Chemical Society. 1155 SixteenthStreet N.W., Washington, DC 20036Published by American Chemical Society. Copyright © American Chemical Society.However, no copyright claim is made to original U.S. Government works, or worksproduced by employees of any Commonwealth realm Crown government in the courseof their duties.
Article
Superior Performance of PolyurethaneBased on Natural Melanin Nanoparticles
Yang Wang, Ting Li, Xuefei Wang, Piming Ma, Huiyu Bai, Weifu Dong, Yi Xie, and Mingqing ChenBiomacromolecules, Just Accepted Manuscript • DOI: 10.1021/acs.biomac.6b01298 • Publication Date (Web): 17 Oct 2016
Downloaded from http://pubs.acs.org on October 19, 2016
Just Accepted
“Just Accepted” manuscripts have been peer-reviewed and accepted for publication. They are postedonline prior to technical editing, formatting for publication and author proofing. The American ChemicalSociety provides “Just Accepted” as a free service to the research community to expedite thedissemination of scientific material as soon as possible after acceptance. “Just Accepted” manuscriptsappear in full in PDF format accompanied by an HTML abstract. “Just Accepted” manuscripts have beenfully peer reviewed, but should not be considered the official version of record. They are accessible to allreaders and citable by the Digital Object Identifier (DOI®). “Just Accepted” is an optional service offeredto authors. Therefore, the “Just Accepted” Web site may not include all articles that will be publishedin the journal. After a manuscript is technically edited and formatted, it will be removed from the “JustAccepted” Web site and published as an ASAP article. Note that technical editing may introduce minorchanges to the manuscript text and/or graphics which could affect content, and all legal disclaimersand ethical guidelines that apply to the journal pertain. ACS cannot be held responsible for errorsor consequences arising from the use of information contained in these “Just Accepted” manuscripts.

1
Superior Performance of Polyurethane Based on
Natural Melanin Nanoparticles
Yang Wang, Ting Li, Xuefei Wang, Piming Ma, Huiyu Bai, Weifu Dong*, Yi Xie, Mingqing
Chen*
*E-mail: [email protected], [email protected].
Tel.: +86-510-8532-6290. Fax: +86-510-8591-7763.
The Key Laboratory of Food Colloids and Biotechnology, Ministry of Education, School of
Chemical and Material Engineering, Jiangnan University, 1800 Lihu Road, Wuxi 214122, China
Keywords: Polyurethane; Melanin; Phase separation; Mechanical properties
ABSTRACT: Melanin, a kind of well-known multifunctional biomacromolecules that are
widely distributed in natural sources. In this work, Polyurethane (PU)/melanin nanocomposites
with enhanced tensile strength and toughness were successfully fabricated via in situ
polymerization. It was found that the tensile strength (σ), elongation-at-break (εmax) and
toughness (W) were improved from 5.6 MPa, 770% and 33 MJ/m3 for PU to 51.5 MPa, 1880%
and 413 MJ/m3 for PU/melanin (2 wt %) nanocomposite, respectively. Micromorphology
indicated that individualized melanin nanoparticles were specifically linked to the hard domains
of PU chains and fine dispersed in matrix. FTIR, DSC and AFM results suggested melanin
Page 1 of 28
ACS Paragon Plus Environment
Biomacromolecules
123456789101112131415161718192021222324252627282930313233343536373839404142434445464748495051525354555657585960

2
induced an improvement in degree of phase separation, which resulted in remarkable
enhancements in mechanical properties of PU. However, with further increasing content of
melanin, a relatively large-scale phase separation was formed and led to a decrease in
mechanical properties of PU. In addition, interactions between melanin and hard segments of
PU were increased, leading to a higher TgHS. Moreover, the dynamic mechanical properties and
rheological behavior of PU/melanin nanocomposites were further investigated.
Introduction
Polyurethane (PU) is an important polymer material with a liner block copolymer structure
with alternating amorphous soft and semicrystalline hard segments, which is widely demanded in
many fields such as coatings, foams, and elastomers owing to its outstanding biocompatible,
flexibility and easy processibility.1-3
The hard segment consists of diisocyanate and a low
molecular weight chain extender, while the soft segment is composed of polyester or polyether
polyol.4 The thermodynamic incompatibility between the soft and hard segments leads to the
formation of phase separation.5, 6
The hard domains are considered as the “physical cross-
linkers” and reinforcing fillers in PU. The degree of phase separations, which are dependent on
many factors, such as molecular structure, the molar mass distribution of composition, and the
interaction between each segments, makes a great difference in the properties of PU.7, 8
The
stiffness and strength of PU are increased with hard segments loading while the extensibility is
increased with soft segments loading.9-11
Obviously, it is challenging to improve the strength of
PU and simultaneously keep its stronger toughness, or scilicet an enhancement in one usually
causes a sacrifice in the other. In consequence, it is imperative to exploit a simple process to
design PU with excellent properties by controlling its phase separations.12
Page 2 of 28
ACS Paragon Plus Environment
Biomacromolecules
123456789101112131415161718192021222324252627282930313233343536373839404142434445464748495051525354555657585960

3
Polymer nanocomposites have attracted a range of interest due to their extraordinary
properties.13, 14
A serials of nanofillers, including of silica, clay, carbon nanotubes (CNTs),
hydroxyapatite and graphene oxide (GO) have been extensively used to modify PU.3-8
On basis
of clay, PU nanocomposites were prepared via solvent exchange processing.15
It was found that
the morphological changed over a range of large phase separation was caused by introduction of
the clay platelets, showing more interconnected hard phases that led to significant enhancement
of mechanical properties. PU containing polyhedral oligomeric silsesquioxanes (POSS) as side
chain to the hard segments showed extensive phase separation.16
However, the poor adhesion
hard segments often decrease the toughness of PU. Moreover, GO can reinforce PU because of
its unique properties.17, 18
However, for carbon-based nanomaterials, the weak interfacial
interaction between GO and PU was one of the main challenges in application. Tremendous
efforts had also been exploited to functionalized GO sheets to improve their interfacial
interactions, which made the synthesis processes more complicated.17, 19
Recently, PU/cellulose
nanocrystals (CNCs)20
or PU/microfibrillate cellulose (MFC)21
nanocomposites with improved
strength and extensibility were fabricated. During the preparation, the prepolymers terminated
with isocyanate were grafted onto the surface of cellulose, and the covalent bonds induced phase
separation. As known to all, MFC or CNCs were obtained from wood fiber cell wall by
endoglucanases or acid hydrolysis22
in combination with multipass high-pressure
homogenization23
, which meant the applications were more difficult in large scale.
Melanin are well-known multifunctional biomacromolecules that are widely distributed in
nature, and display antibacterial activity, photoprotection, and free radical scavenging
activities.24, 25
However, few exploitation of melanin to enhance polymer materials has been
reported compared with other biomacromolecules such as nanocellulose,26, 27
chitin28
or
Page 3 of 28
ACS Paragon Plus Environment
Biomacromolecules
123456789101112131415161718192021222324252627282930313233343536373839404142434445464748495051525354555657585960

4
collagen.29
The nanoparticle characteristics are usually considered as the most remarkable
features of melanin. Normally, melanin isolated from the cuttlefish has been chosen as a standard
due to their simple separation and high purity. Although the exact knowledge of its structure,
especially at the molecular level, remains poorly documented, many reactive functional groups
(–OH, –NH and –COOH) indeed exist in melanin.30-32
Generally, particles with three or more
reactive vertex groups act as comparatively massive, three-dimensional chemical cross-linkers.
Thus, melanin may be an ideal nanobuilding block due to the versatility in reactive groups may
possess. In our previous studies, strong and robust PVA nanocomposites were prepared with the
addition of melanin nanoparticles. The dramatic enhancement in the mechanical properties of
PVA were achieved by the strong hydrogen bonds interaction between melanin and PVA.24, 25, 33
According to these studies, in this work, PU/melanin nanocomposites were successfully
prepared via in situ polymerization. It was shown that a significant improvement in strength and
toughness of PU was achieved by loading a small amount of melanin. Furthermore, the effect of
melanin on the microphase and macroscopic properties of PUs was investigated.
Experimental Section
Materials
N,N-Dimethylformamide (DMF, 99.8%), 4,4′-Diphenylmethane diisocyanate (MDI, 98%),
and 1,4-butanediol (1,4-BD, 99%) were all purchased from Aladdin (Shanghai, China).
Poly(tetramethylene glycol) (PTMG, average Mn=1000) was obtained from Aldrich. MDI was
heated at 60 ℃ and pressure filtered in N2 atmosphere. After that, pure MDI was achieved
through recrystallization. DMF and 1,4-BD were dehydrated with the molecular sieves for 24 h
Page 4 of 28
ACS Paragon Plus Environment
Biomacromolecules
123456789101112131415161718192021222324252627282930313233343536373839404142434445464748495051525354555657585960

5
and freshly redistilled under vacuum. PTMG was used after 2 h of drying under vacuum at
110 ℃.
Extraction of Natural melanin
Ink sacs were prepared from of Sepia officinalis. Melanin nanoparticles were separated
from the freshly dissected ink sac with centrifuging (18,000 rpm, 15 min). After several times of
washing, a clean melanin nanoparticles dispersion was received. The excess water were removed
under vacuum (50 ℃) for 24 h to obtain dry melanin nanoparticles.
Preparation of PU/melanin Nanocomposites
PU prepolymer was prepared via the reaction of MDI and PTMG in DMF solvent. The
reaction took place at a temperature of 90 ℃, and under a dry N2 for 2 h with mechanical stirring.
Then the reaction was detected using ATR. The disappearance of hydroxyl peak indicated
completion of step 1. Subsequently, the predetermined loading of melanin dispersed in DMF
solvent was incorporated and stirred for another 1 h. Then 1,4-BD was added for reacting with
the residual isocyanate groups (Scheme 1). After that, the products were casted on a Teflon dish,
and drying at 80 ℃ for 24 h to receive the plaque. The plaque were dried for 24 h in vacuum
oven at 80 ℃ to remove the residual DMF. The amount of reactive groups (–OH, –NH and –
COOH) on melanin was 5.62 mmol/g as determined using titration to measure the residual –
NCO of MDI after reacting with a given amount of melanin. PU nanocomposites including 0.5, 1,
2 and 5 wt % melanin were fabricated through changing the loading of melanin and 1,4-BD.
Page 5 of 28
ACS Paragon Plus Environment
Biomacromolecules
123456789101112131415161718192021222324252627282930313233343536373839404142434445464748495051525354555657585960

6
Scheme 1. Synthetic procedure to prepare PU and PU/melanin nanocomposites
Characterizations
The infrared spectra of sample were performed by the attenuated total reflection (ATR,
Nicolet 6700).The spectra were recorded from 600 to 4000 cm-1
with resolution of 4 cm-1
.
To investigate the interactions between PU and melanin nanoparticles, Soxhlet extraction in
which acetone as solvent was used to isolate melanin from the nanocomposites. The residue
(melanin-PU nanohybrids) was dried under vacuum (50 ℃, 24 h). The atomic force microscope
(MuLtimode 8, Bruker Nano, USA) was performed in a peak-force-error mode to characterize
the morphology of melanin and melanin-PU nanohybrids. Furthermore, the AFM phase images
of PU and PU/melanin films were obtained at ambient temperature. Tapping mode AFM was
conducted via Nanosensors PPP-NCH AFM probes (spring constant 35 N/m). Tapping forces
were in the range of 0.6.
Page 6 of 28
ACS Paragon Plus Environment
Biomacromolecules
123456789101112131415161718192021222324252627282930313233343536373839404142434445464748495051525354555657585960

7
The morphologies of melanin nanoparticles, melanin-PU nanohybrids and fracture surfaces
of PU/melanin nanocomposites were observed with scanning electron microscopy (SEM Hitachi
S4800). The ultrathin sections of samples were microtomed at -90 ℃ (70-100 nm in thickness).
The morphology of PU/melanin nanocomposites were observed with TEM (Philips TECNAI
20).
Mechanical properties were performed on Instron 5967 teasting machine. A crosshead
speed of 50 mm/min was applied. Five specimens of each sample were tested.
Dynamic Mechanical Analysis was operated on TA Instruments Q800 DMA. The
specimens were cut into 15×5.3×0.5 mm3 and measured with a heating rate of 3 ℃/min from
-80 to 100 ℃ and the frequency was 1Hz.
The glass transition temperature for soft and hard segments (TgSS and TgHS, respectively)
of PU and PU/melanin nanocomposites were assessed with a differential scanning
calorimetry of DSC 8000 analyzer (PerkinElmer, USA). An empty aluminum crucible was
used as reference. The samples were heated at a rate of 10 ℃/min over the range of -80 to
240 ℃ in N2 atmosphere. TgSS and TgHS were chosen as the inflection point from the DSC
curve.
Dynamic rheological analyses (DRA) were performed by using a DHR-2 rheometer (TA
Instruments, USA). The experiment were carried on 25 mm diameter plate, with 1 mm in gap at
200 ℃. The tests were examined in a frequency-sweep mode with the frequency from 100 to
0.01 Hz in the linear viscoelastic range.
Results and discussion
FTIR
Page 7 of 28
ACS Paragon Plus Environment
Biomacromolecules
123456789101112131415161718192021222324252627282930313233343536373839404142434445464748495051525354555657585960

8
Figure 1 showed FTIR spectroscopy of PU, melanin and PU/melanin nanocomposites. For
PU/melanin nanocomposites, the new absorption peak at about 1646 cm-1
was attributed to
C=O, and another peak at about 1510 cm-1
was attributed to N–H and C–N.21
These results
indicated the reaction between –OH of melanin and –NCO was successfully performed. For all
the spectra of PU and its nanocomposites, the peak observed at about 3300 cm-1
was ascribed to
N-H stretching. In addition, the two peaks located at 1730 and 1708 cm-1
, according to free
carbonyl and hydrogen-bonded carbonyl groups, and the peak intensity ratios of these two peaks
revealed the degree of phase separation. The carbonyl hydrogen-bonding index (R) is calculated
from equation R= A1708/A1730, and the degree of phase separation (DPS) is obtained by formula
DPS= R/( R+1).34
It was clear that R increased with increasing melanin content (Table 1). All
results suggested that melanin had a significant influence on the phase separation of PU.
4000 3500 3000 1500 1000
Tra
ns
mit
tan
ce (
a.u
.)
5 wt%
2 wt%
1 wt%
0.5 wt%
Wavenumber (cm-1)
PU
melanin 1730
17081646
1510
Figure 1. FTIR spectra of PU, melanin and PU/melanin nanocomposites.
Page 8 of 28
ACS Paragon Plus Environment
Biomacromolecules
123456789101112131415161718192021222324252627282930313233343536373839404142434445464748495051525354555657585960

9
Table 1 The carbonyl hydrogen bonding index (R) and the degree of phase separation (DPS)
in PU/melanin nanocomposites.
R (A1708/A1730)a DPS (%)
PU 0.65 39
0.5 wt % 1.29 56
1 wt % 1.77 64
2 wt % 2.36 70
5 wt % 2.84 74
a The carbonyl hydrogen bonding index obtained from A1708/ A1730 in the FTIR curve.
Mechanical properties
Stress-strain curves of nanocomposites were recorded. E1 was the Young's modulus. E2
and E3 were calculated by the slope of the stress–strain curves, as schematized in Figure 2.
Toughness can be calculated by equation (1), i.e.,
W = � �′���
�� (1)
where the σ′ and ε are the stress and strain, respectively. Tensile strength (σ), elongation-at-
break (εmax), Young's modulus (E1) and toughness (W) of the PU were about 5.6±1.5 MPa,
770.2±25.6%, 6.3±0.6 MPa and 33.1±5.6 MJ/m3, respectively, which were in well
accordance with the previous reports (as shown in Table 2).20
With addition of only 0.5 wt %
melanin, σ and εmax were increased to 25.5±3.5 MPa and 2598.1±56.1%, respectively. With
further increasing content of melanin, σ, εmax and E1 of PU/melanin-2 wt % nanocomposite
were enhanced to 51.5±1.6 MPa, 1881.7±51.5% and 21.3±1.5 MPa, respectively, which
were much greater than these of PU. On the other hand, W of nanocomposite reached the
Page 9 of 28
ACS Paragon Plus Environment
Biomacromolecules
123456789101112131415161718192021222324252627282930313233343536373839404142434445464748495051525354555657585960

10
highest value of 484.1±36.6 MJ/m3 with 1 wt % melanin, which was more than 15-fold
higher than that of PU. Additionally, PU/melanin nanocomposites showed three regions in
the stress-strain curves. Region (1) “quasi-linear elastic deformation region” emerged in at
the initial stage. σ and εmax were dominated by PU crystallinity, the content and ordering of
hard segments; Region (2) “moderate-modulus region” governed by the deformation of soft
domains and alignment of hard domains, and Region (3) “strain-hardening region” associated
with the break-up of hard domains and unraveling of the entangled nanoparticles. The strong
interaction allowed the nanocomposite to bear stronger force and shape greater deformation.
With addition of 1, 2 wt % melanin, nanocomposites exhibited an obvious strain-hardening
behavior, showing E3 enhancements, not presented on PU. Strain-hardening suggested the
strong cohesion force between hard segments. Generally, direct blending thermoplastic
matrices and rigid fillers offers improvements in modulus and tensile stress at the expense of
a sacrifice in extensibility. Surprisingly, a small amount of melanin enhanced the modulus
and strength while at the same time dramatically improved the toughness of PU in this work.
0 400 800 1200 1600 2000 2400 28000
10
20
30
40
50
60
(3)
(2)
5 wt%
Strain (%)
Str
es
s (
MP
a)
PU
0.5 wt%
1 wt%
2 wt%
E1
E2
E3
Strain
Str
es
s
strain-hardening
(1)
Page 10 of 28
ACS Paragon Plus Environment
Biomacromolecules
123456789101112131415161718192021222324252627282930313233343536373839404142434445464748495051525354555657585960

11
Figure 2. Tensile testing curves of PU and PU/melanin nanocomposites.
Table 2 Mechanical Properties of PU and PU/melanin Nanocomposites: Tensile strength (σ),
Elongation-at-Break (εmax), Young's Modulus (E1), Modulus 2 (E2), Modulus 3 (E3) and
Toughness (W).
sample σ (MPa) εmax (%) E1 (MPa) E2 (MPa) E3 (MPa) W (MJ/m3)
PU 5.6±1.4 770.2±25.6 6.3±0.6 0.19±0.04 - 33.1±5.6
0.5 wt % 25.5±3.5 2598.1±94.3 17.5±1.2 0.66±0.02 0.89±0.08 406.6±25.5
1 wt % 46.1±2.4 2350.4±56.1 19.2±1.6 0.83±0.01 3.9±0.13 484.1±36.6
2 wt % 51.5±1.6 1881.7±51.5 21.3±1.5 0.91±0.02 5.5±0.20 413.2±27.9
5 wt % 31.2±1.2 1544.4±79.3 26.3±2.0 1.1±0.08 1.79±0.04 280.5±21.3
DSC analysis
As shown in Figure 3, the transition around -34.8 ℃ and 56.2 ℃ were corresponded to
TgSS and TgHS of PU, respectively. With increased melanin content, TgSS was decreased to -
49.2 ℃, and TgHS was increased to 97.2 ℃. Tg is often dependent on the flexibility of PU
chain, the higher Tg, the more immovable chains. The relatively higher TgSS was observed in
PU, which was due to the fact that hard domains were more fine dispersed in PU and had
more restriction on the soft segments mobility. Actually, a lower TgSS is often taken to be
indicative of a greater degree of phase separation in PU.35
PU/melanin nanocomposites
displayed lower TgSS, indicating that the addition of melanin induced phase separation. On
the other hand, with addition of melanin, strong interactions between melanin and hard
segments was formed and brought about more hindrance to the hard segments movements,
leading to higher TgHS enhanced. In conclusion, a decrease of TgSS for PU with melanin
Page 11 of 28
ACS Paragon Plus Environment
Biomacromolecules
123456789101112131415161718192021222324252627282930313233343536373839404142434445464748495051525354555657585960

12
suggested an enhancement for degree of phase separation, and the increase of TgHS implied a
stronger interaction in hard domains by introduction of melanin.
-50 0 50 100 150 2000.5
1.0
1.5
2.0
2.5
3.0
3.5
-35.2
-34.8
-41.6
-47.4
-49.2
TgHS
PU
0.5 wt%
1 wt%
2 wt%
5 wt%
Temperature (℃℃℃℃)
He
at
flo
w (
W/g
)
TgSS
56.2
66.3
79.5
87.6
97.2
Figure 3. DSC curves of PU and PU/melanin nanocomposites.
Dynamic mechanical properties
The storage modulus of pure PU displayed a drastic reduction at its Tg, and maintained
decreasing with an increase of temperature in the rubbery region (as shown in Figure 4).
Interestingly, an excellent improvement in high temperature range was obtained when
melanin was introduced into the PU matrix. With addition of 2 wt % melanin, the modulus of
the nanocomposite was 600% and 830% better than that of pure PU at temperature of 20 and
60 ℃, which further confirmed that the introduction of melanin was able to enhance the
Page 12 of 28
ACS Paragon Plus Environment
Biomacromolecules
123456789101112131415161718192021222324252627282930313233343536373839404142434445464748495051525354555657585960

13
mechanical properties of PU. For pure PU, the tan δ at around -21.6 ℃ attributed to TgSS of
PU. However, TgSS decreased with increasing melanin loading, as was shown in Figure 4 (b).
-80 -60 -40 -20 0 20 40 60 80 10010
0
101
102
103
Increase
PU
0.5 wt%
1 wt%
2 wt%
5 wt%
Temperature (℃℃℃℃)
Sto
rag
e M
od
ulu
s (
MP
a)
a
-80 -60 -40 -20 0 20 40 60
0.0
0.2
0.4
0.6
0.8
1.0
b TPU
0.5 wt%
1 wt%
2 wt%
5 wt%
Temperature (℃℃℃℃)
Ta
n D
elt
a
TgSS
Figure 4. (a) Storage modulus and (b) tan δ of PU and PU/melanin nanocomposites.
Morphological Characterization
Typical scanning electron microscopy (SEM) image showed that melanin nanoparticles
were sphere in shape, with diameters of approximately 150-200 nm (Figure 5a). Through a
Soxhlet extraction process, the residues (melanin-PU nanohybrids) were obtained and SEM
image was seen in Figure 5b. Compared with the original melanin nanoparticles, melanin-PU
nanohybrids exhibited irregular sphere with some dots on the rough surface, which was
owning to the depositing of PU on the melanin surface. These changes in surface morphology
of melanin revealed successful grafted PU chains on the melanin surface. At the same time,
melanin and melanin-PU nanohybrids were also evidenced by AFM images (Figure 5c, d and
e).
Page 13 of 28
ACS Paragon Plus Environment
Biomacromolecules
123456789101112131415161718192021222324252627282930313233343536373839404142434445464748495051525354555657585960

14
Figure 5. SEM images of (a) melanin and (b) melanin-PU nanohybrids, AFM height images
of (c) melanin and (d) melanin-PU nanohybrids, AFM image of (e) melanin-PU nanohybrids
was performed in a peak-force-error mode.
TEM investigation on the microstructures of PU/melanin-2 wt % nanocomposite were
displayed in Figure 6. The shades in Figure 6a corresponded melanin nanoparticles and
melanin were uniformly dispersed in PU with only a little aggregation. What's more, melanin
were deformed into irregular shape, and displayed a black and thick interface (as shown in
Figure 6b). The reasons for the formation of interface were ascribed to the in situ formed
covalent attachment anchored stably at the interface of melanin nanoparticles and PU phase.
Page 14 of 28
ACS Paragon Plus Environment
Biomacromolecules
123456789101112131415161718192021222324252627282930313233343536373839404142434445464748495051525354555657585960

15
Figure 6. TEM images for PU/melanin-2 wt % nanocomposite with different magnifications.
AFM phase images of PU/melanin nanocomposites
Figure 7 showed the AFM phase images of PU and PU/melanin nanocompoaites, the
bright region in the phase-angle images were representative of hard domains (high modulus)
while the dark regions were corresponded to soft domains. Apparently, the phase images
showed that hard domains were diluted in soft phase in pure PU and the size of hard domains
were relatively small. Extensive analysis of AFM phase images revealed that as melanin was
progressively added the bright areas increasingly brightened and grown in size,
demonstrating that improvement of degree of phase separation. As the melanin content
reached to 2 wt %, the hard domains got connected with each other. The observation
suggested hard segments selectively concentrated at surface of melanin, and thus induced a
more distinct phase separation. As mentioned above, the performance of PU was strongly
dependent on the balance between phase separation and phase mixing. When 5 wt % melanin
were incorporated, melanin could aggregate in PU matrix due to the inherent adhesive
Page 15 of 28
ACS Paragon Plus Environment
Biomacromolecules
123456789101112131415161718192021222324252627282930313233343536373839404142434445464748495051525354555657585960

16
property of melanin. As a result, the hard domains on the melanin surface subsequently
aggregated, which led to grow in size and form relatively large phase separation. Therefore,
nanocomposite experienced decreases in performances of PU, as discussed in the mechanical
properties section.
Figure 7. AFM phase images of the PU with different melanin contents: (a) 0; (b) 0.5 wt %; (c)
2 wt % and (d) 5 wt %.
Morphology of PU/melanin nanocomposites
Page 16 of 28
ACS Paragon Plus Environment
Biomacromolecules
123456789101112131415161718192021222324252627282930313233343536373839404142434445464748495051525354555657585960

17
The tensile fracture surfaces of the deformed tensile specimens were depicted in Figure
8. PU showed a continuous and smooth fractured surface. Compared to PU, PU/melanin-0.5
wt % nanocomposite displayed a relatively coarse and irregular fractured morphology, which
indicated the changes of nanocomposite microstructure. Moreover, with the addition of 2 wt
% melanin, the micrograph became significantly rough and massive local matrix deformation
of PU were observed. As shown as in Figure 8d, clear interlocking and entanglement were
found in nanocomposite, indicating a significant reinforcement of mechanical properties.
Melanin induced phase separation and acted as cross-linkers which improved the cohesion
force between hard segments, and suppressed the spread of cracks, hence enhancing the
stiffness and toughness of nanocomposites. Figure 9 illustrated the reinforcement
mechanisms of PU reinforced with melanin nanoparticles.
Page 17 of 28
ACS Paragon Plus Environment
Biomacromolecules
123456789101112131415161718192021222324252627282930313233343536373839404142434445464748495051525354555657585960

18
Figure 8. SEM images showing fracture surfaces of PU/melanin nanocomposites with (a) 0
wt %. (b) 0.5 wt %. (c,d) 2 wt % melanin.
Figure 9. Enhancement mechanisms in PU/melanin nanocomposites.
Additionally, comparison of the mechanical properties of PU nanocomposites reinforced
with melanin, cellulose nanocrystals (CNCs),20
microfibrillated cellulose (MFC),21
nanosilica
(NS)36
, multiwalled carbon nanotubes (MWNTs)37
, carbon nanofibers (CNF),38
nanoclays
(NC),39
laponite,15
single-walled carbon nanotubes (SWNTs),37
graphene nanosheets (GNSs)17
,
and high-structured carbon black (HSCB) were shown in Figure 10. The other approaches for
fabricating the PU nanocomposites always showed enhancement in only one kind of mechanical
properties. For instance, Liff et al.15
demonstrated a high strength (62 MPa) PU/Laponite
nanocomposites via solvent exchange processing, but the εmax showed a little lower. Aihua et
al.20
constructed high strength PU nanocmoposite with addition of CNCs. The tensile strength of
Page 18 of 28
ACS Paragon Plus Environment
Biomacromolecules
123456789101112131415161718192021222324252627282930313233343536373839404142434445464748495051525354555657585960
19
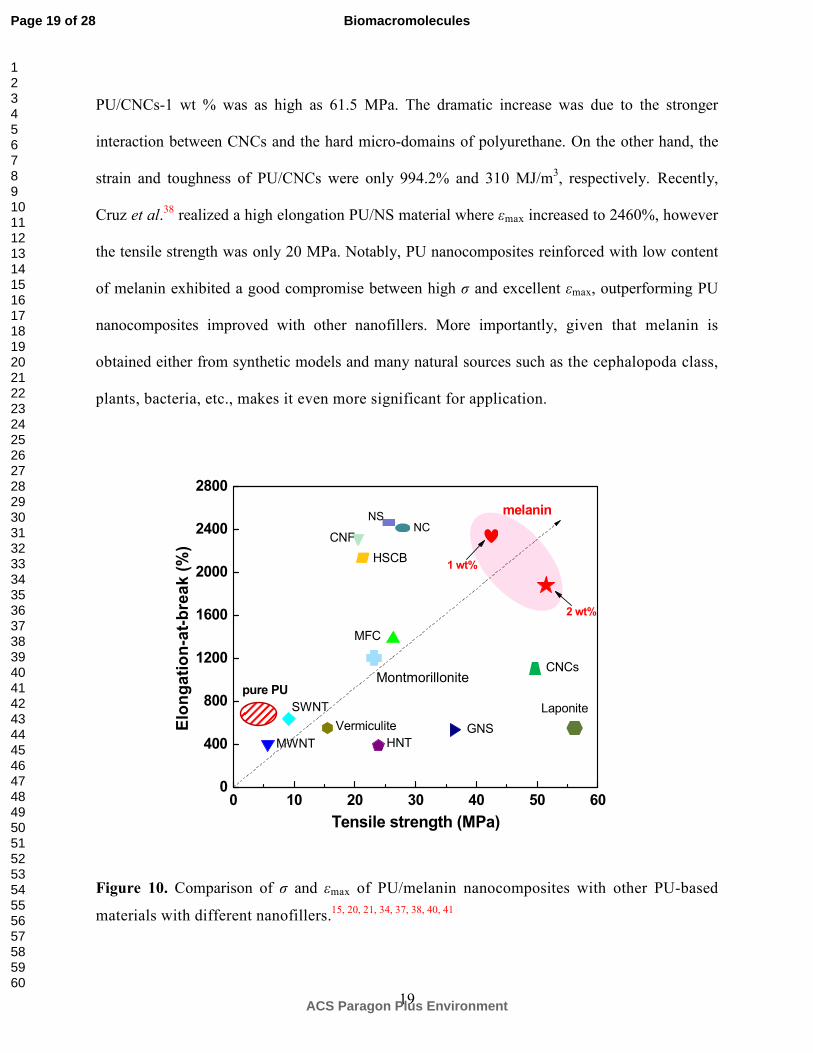
PU/CNCs-1 wt % was as high as 61.5 MPa. The dramatic increase was due to the stronger
interaction between CNCs and the hard micro-domains of polyurethane. On the other hand, the
strain and toughness of PU/CNCs were only 994.2% and 310 MJ/m3, respectively. Recently,
Cruz et al.38
realized a high elongation PU/NS material where εmax increased to 2460%, however
the tensile strength was only 20 MPa. Notably, PU nanocomposites reinforced with low content
of melanin exhibited a good compromise between high σ and excellent εmax, outperforming PU
nanocomposites improved with other nanofillers. More importantly, given that melanin is
obtained either from synthetic models and many natural sources such as the cephalopoda class,
plants, bacteria, etc., makes it even more significant for application.
0 10 20 30 40 50 600
400
800
1200
1600
2000
2400
2800
1 wt%
pure PU
MWNT
Elo
ng
ati
on
-at-
bre
ak
(%
)
Tensile strength (MPa)
melanin
CNCs
MFC
NCNS
CNF
HSCB
LaponiteSWNT
Vermiculite
HNTGNS
Montmorillonite
2 wt%
Figure 10. Comparison of σ and εmax of PU/melanin nanocomposites with other PU-based
materials with different nanofillers.15, 20, 21, 34, 37, 38, 40, 41
Page 19 of 28
ACS Paragon Plus Environment
Biomacromolecules
123456789101112131415161718192021222324252627282930313233343536373839404142434445464748495051525354555657585960

20
Rheological behavior
The storage modulus (G’) and complex viscosity (η*) of PU/melanin nanocomposites were
shown in Figure 11. Commonly, the stronger interactions between fillers and matrix could cause
a reduction of slope for plotting log G´ versus log ω, and an increase of G´ in low frequency
region reflected the improvement in interaction strength. When 5 wt % melanin were added, the
slope of log G´ versus log ω in low frequency region was decreased from 0.91 to 0.12,
simultaneously the slope of log η* versus log ω decreased from -0.03 to -0.88. Obviously,
nanocomposites exhibited a notable solid-like behavior in the terminal region. These phenomena
indicated a slower relaxation process and an increased elasticity of the nanocomposite due to
strong cohesion force between hard segments.
0.01 0.1 1 10 10010
0
101
102
103
104
105
a
Slope= 0.91
PU
0.5 wt%
1 wt%
2 wt%
5 wt%
Frequency (Hz)
Sto
rag
e m
od
ulu
s (
Pa)
Slop= 0.12
0.01 0.1 1 10 10010
1
102
103
104
105
106
PU
0.5 wt%
1 wt%
2 wt%
5 wt%
Slop= -0.88
Co
mp
lex
vis
co
sit
y (
Pa�s
)
Frequency (Hz)
Slop= -0.03
b
Figure 11. (a) Storage modulus (G´) and (b) complex viscosity (η*) of pure PU and PU/melanin
nanocomposites as a function of frequency.
Page 20 of 28
ACS Paragon Plus Environment
Biomacromolecules
123456789101112131415161718192021222324252627282930313233343536373839404142434445464748495051525354555657585960

21
Conclusions
In this work, PU/melanin nanocomposites with high tensile strength and toughness were
successfully prepared in the presence of natural melanin by in situ polymerization. It was
observed that the tensile strength (σ), elongation-at-break (εmax), Young's modulus (E1) and
toughness (W) of PU/melanin nanocomposites were enhanced simultaneously even with a small
amount of melanin. With the addition of 2 wt % melanin, σ, εmax, and W were increased to 51.5
MPa, 1880% and 413 MJ/m3, respectively, which were much higher than these of PU.
According to the preparation, it was found that the individualized melanin nanoparticles were
specifically associated with the hard domains of PU through the chemical reaction between
isocyanate of PU prepolymer and reactive groups (–OH, –NH and –COOH) of melanin
nanoparticles and well dispersed in matrix, which was confirmed by micromorphology. FTIR,
DSC and AFM results suggested melanin induced an improvement in phase separation.
However, with further increasing melanin to 5 wt %, more hard segments concentrated on the
surface of melanin, and formed a relatively large-scale phase separation, resulting in a
decline in mechanical properties. On the other hand, with addition of melanin, the interaction
between melanin and the hard segments was increased, leading to higher TgHS enhanced. DMA
results revealed that at the temperature of 20 and 60℃ the modulus of the nanocomposite (2
wt % melanin) was 600% and 830% higher than these of PU. Moreover, PU nanocomposite
exhibited a notable solid-like behavior at low frequency region from rheological measurement,
which suggested strong cohesion force between hard segments. The study will give us a facile
method to prepare PU with high strength and toughness with addition of a little amount of
melanin.
Notes
Page 21 of 28
ACS Paragon Plus Environment
Biomacromolecules
123456789101112131415161718192021222324252627282930313233343536373839404142434445464748495051525354555657585960

22
The authors declare no competing financial interest.
ACKNOWLEDGMENT
This work was supported by National Natural Science Foundation of China (51373070), the
Research Project of Chinese Ministry of Education (No.113034A) and the Fundamental
Research Funds for the Central Universities (JUSRP51624A).
REFERENCES
1. Liu, Z.; Luo, Y.; Bai, H.; Zhang, Q.; Fu, Q., Remarkably Enhanced Impact Toughness
and Heat Resistance of poly(l-Lactide)/Thermoplastic Polyurethane Blends by Constructing
Stereocomplex Crystallites in the Matrix. Acs Sustainable Chem. Eng. 2015, 4, (1), 111-120.
2. Pan, Y.; Zhan, J.; Pan, H.; Wang, W.; Tang, G.; Song, L.; Yuan, H., Effect of fully bio-
based coatings constructed via layer-by-layer assembly of chitosan and lignosulfonate on the
thermal, flame retardant and mechanical properties of flexible polyurethane foam. Acs
Sustainable Chem. Eng. 2015, 4, (3), 1431-1438.
3. Wang, W.; Pan, H.; Shi, Y.; Yu, B.; Pan, Y.; Liew, K. M.; Song, L.; Hu, Y., Sandwich-
like coating consisting of alternating montmorillonite and β-FeOOH for reducing the fire hazard
of flexible polyurethane foam. Acs Sustainable Chem. Eng. 2015, 3, (12), 3214-3223.
4. Wang, C. B.; Cooper, S. L., Morphology and properties of segmented polyether
polyurethaneureas. Macromolecules 2002, 16, (5), 775-786.
5. Miller, J. A.; Lin, S. B.; Hwang, K. K. S.; Wu, K. S.; Gibson, P. E.; Cooper, S. L.,
Properties of polyether-polyurethane block copolymers: Effects of hard segment length
distribution. Macromolecules 1985, 18, (1), 32-44.
Page 22 of 28
ACS Paragon Plus Environment
Biomacromolecules
123456789101112131415161718192021222324252627282930313233343536373839404142434445464748495051525354555657585960

23
6. Wiggins, M. J.; Macewan, M.; Anderson, J. M.; Hiltner, A., Effect of soft-segment
chemistry on polyurethane biostability during in vitro fatigue loading. J. Biomed. Mater. Res. A
2004, 68, (4), 668–683.
7. Lee, H. S.; Wang, Y. K.; Hsu, S. L., Spectroscopic analysis of phase separation behavior
of model polyurethanes. Macromolecules 1987, 20, (9), 2089-2095.
8. Meuse, C. W.; Yang, X.; Yang, D.; Hsu, S. L., Spectroscopic analysis of ordering and
phase-separation behavior of model polyurethanes in a restricted geometry. Macromolecules
1992, 25, (2), 925-932.
9. Leung, L. M.; Koberstein, J. T., DSC annealing study of microphase separation and
multiple endothermic behavior in polyether-based polyurethane block copolymers.
Macromolecules 1986, 19, (3), 714-720.
10. Martin, D. J.; Meijs, G. F.; Gunatillake, P. A.; Mccarthy, S. J.; Renwick, G. M., The
effect of average soft segment length on morphology and properties of a series of polyurethane
elastomers. II. SAXS-DSC annealing study. J. Appl. Polym. Sci. 1997, 64, (64), 803-817.
11. Martin, D. J.; Meijs, G. F.; Gunatillake, P. A.; Yozghatlian, S. P.; Renwick, G. M., The
influence of composition ratio on the morphology of biomedical polyurethanes. J. Appl. Polym.
Sci. 1999, 71, (6), 937–952.
12. Gisselfält, K.; Helgee, B., Effect of Soft Segment Length and Chain Extender Structure
on Phase Separation and Morphology in Poly(urethane urea)s. Macromol. Mater. Eng. 2003,
288, (3), 265–271.
13. Yoshitsugu, K.; Arimitsu, U.; Masaya, K.; Akane, O.; Toshio, K.; Osami, K., Synthesis
of nylon 6–clay hybrid by montmorillonite intercalated with ϵ-caprolactam. J. Polym. Sci. Pol.
Chem. 1993, 31, (4), 983–986.
Page 23 of 28
ACS Paragon Plus Environment
Biomacromolecules
123456789101112131415161718192021222324252627282930313233343536373839404142434445464748495051525354555657585960

24
14. Paul, P.; Kaushik, A. K.; Arruda, E. M.; Waas, A. M.; Bong Sup, S.; Jiadi, X.;
Himabindu, N.; Pumplin, B. G.; Joerg, L.; Ayyalusamy, R., Ultrastrong and stiff layered polymer
nanocomposites. Science 2007, 318, (5847), 80-83.
15. Liff, S. M.; Kumar, N.; McKinley, G. H., High-performance elastomeric nanocomposites
via solvent-exchange processing. Nat Mater 2007, 6, (1), 76-83.
16. Raftopoulos, K. N.; Pielichowski, K., Segmental dynamics in hybrid polymer/POSS
nanomaterials. Prog. Polym. Sci. 2015, 52, 136-187.
17. Wang, X.; Hu, Y.; Song, L.; Yang, H.; Xing, W.; Lu, H., In situ polymerization of
graphene nanosheets and polyurethane with enhanced mechanical and thermal properties. J.
Mater. Chem. 2011, 21, (21), 4222-4227.
18. Yang, L.; Si, L. P.; Toh, C. L.; Zhang, L.; Ling, H.; Chang, M.; Zhou, D.; Dong, Y.; Lu,
X., Polydopamine-coated graphene as multifunctional nanofillers in polyurethane. Rsc Adv.
2013, 3, (18), 6377-6385.
19. Thakur, S., Bio-based tough hyperbranched polyurethane–graphene oxide
nanocomposites as advanced shape memory materials. Rsc Adv. 2013, 3, (24), 9476-9482.
20. Pei, A.; Malho, J. M.; Ruokolainen, J.; Zhou, Q.; Berglund, L. A., Strong Nanocomposite
Reinforcement Effects in Polyurethane Elastomer with Low Volume Fraction of Cellulose
Nanocrystals. Macromolecules 2011, 44, (11), 4422-4427.
21. Yao, X.; Qi, X.; He, Y.; Tan, D.; Chen, F.; Fu, Q., Simultaneous Reinforcing and
Toughening of Polyurethane via Grafting on the Surface of Microfibrillated Cellulose. Acs Appl.
Mater. Interfaces 2014, 6, (4), 2497-2507.
Page 24 of 28
ACS Paragon Plus Environment
Biomacromolecules
123456789101112131415161718192021222324252627282930313233343536373839404142434445464748495051525354555657585960

25
22. Henriksson, M.; Henriksson, G.; Berglund, L. A.; Lindström, T., An environmentally
friendly method for enzyme-assisted preparation of microfibrillated cellulose (MFC) nanofibers.
Eur. Polym. J. 2007, 43, (8), 3434-3441.
23. Li, J.; Wei, X.; Wang, Q.; Chen, J.; Chang, G.; Kong, L.; Su, J.; Liu, Y., Homogeneous
isolation of nanocellulose from sugarcane bagasse by high pressure homogenization. Carbohydr.
Polym. 2012, 90, (4), 1609-13.
24. Wang, Y.; Li, T.; Ma, P.; Bai, H.; Xie, Y.; Chen, M.; Dong, W., Simultaneous
Enhancements of UV-Shielding Properties and Photostability of Poly(vinyl alcohol) via
Incorporation of Sepia Eumelanin. Acs Sustainable Chem. Eng. 2016, 4, 2252-2258.
25. Dong, W.; Wang, Y.; Huang, C.; Xiang, S.; Ma, P.; Ni, Z.; Chen, M., Enhanced thermal
stability of poly(vinyl alcohol) in presence of melanin. J. Therm. Anal. Calori. 2014, 115, (2),
1661-1668.
26. Li, M. C.; Wu, Q.; Song, K.; Lee, S.; Yan, Q.; Wu, Y., Cellulose Nanoparticles:
Structure–Morphology–Rheology Relationships. Acs Sustainable Chem. Eng. 2015, 3, (5), 821-
832.
27. Yu, H. Y.; Qin, Z. Y.; Yan, C. F.; Yao, J. M., Green Nanocomposites Based on
Functionalized Cellulose Nanocrystals: A Study on the Relationship between Interfacial
Interaction and Property Enhancement. Acs Sustainable Chem. Eng. 2014, 2, (4), 1-16.
28. Morin, A.; Dufresne, A., Nanocomposites of Chitin Whiskers from Riftia Tubes and
Poly(caprolactone). Macromolecules 2002, 35, (6), 2190-2199.
29. Yeo, I.-S.; Oh, J.-E.; Jeong, L.; Lee, T. S.; Lee, S. J.; Park, W. H.; Min, B.-M., Collagen-
Based Biomimetic Nanofibrous Scaffolds: Preparation and Characterization of Collagen/Silk
Fibroin Bicomponent Nanofibrous Structures. Biomacromolecules 2008, 9, (4), 1106-1116.
Page 25 of 28
ACS Paragon Plus Environment
Biomacromolecules
123456789101112131415161718192021222324252627282930313233343536373839404142434445464748495051525354555657585960

26
30. Meredith, P.; Sarna, T., The physical and chemical properties of eumelanin. Pigment Cell
Research 2006, 19, (6), 572-594.
31. Albanese, G.; Bridelli, M.; Deriu, A., Structural dynamics of melanin investigated by
Rayleigh scattering of Mössbauer radiation. Biopolymers 1984, 23, (8), 1481-1498.
32. Magarelli, M.; Passamonti, P.; Renieri, C., Purification, characterization and analysis of
sepia melanin from commercial sepia ink (Sepia Officinalis). Rev. CES Med. Vet. Zootec. 2010,
5, 18-28.
33. Wang, Y., Strong nanocomposite reinforcement effects in poly(vinyl alcohol) with
melanin nanoparticles. Rsc Adv. 2015, 5, (89), 72691-72698.
34. Tien, Y. I.; Wei, K. H., Hydrogen bonding and mechanical properties in segmented
montmorillonite/polyurethane nanocomposites of different hard segment ratios. Polymer 2001,
42, (7), 3213–3221.
35. He, Y.; Zhang, X.; Runt, J., The role of diisocyanate structure on microphase separation
of solution polymerized polyureas. Polymer 2014, 55, (55), 906-913.
36. Bistričić, L.; Baranović, G.; Leskovac, M.; Bajsić, E. G., Hydrogen bonding and
mechanical properties of thin films of polyether-based polyurethane–silica nanocomposites. Eur.
Polym. J. 2010, 46, (10), 1975-1987.
37. Xia, H.; Song, M., Preparation and characterization of polyurethane-carbon nanotube
composites. Soft Matter 2005, 1, (5), 386-394.
38. Cruz, S. M.; Viana, J. C., Structure–Properties Relationships in Thermoplastic
Polyurethane Elastomer Nanocomposites: Interactions between Polymer Phases and Nanofillers.
Macromol. Mater. Eng. 2015, 300, 1152-1162.
Page 26 of 28
ACS Paragon Plus Environment
Biomacromolecules
123456789101112131415161718192021222324252627282930313233343536373839404142434445464748495051525354555657585960

27
39. Maji, P. K.; Guchhait, P. K.; Bhowmick, A. K., Effect of the Microstructure of a
Hyperbranched Polymer and Nanoclay Loading on the Morphology and Properties of Novel
Polyurethane Nanocomposites. Acs Appl. Mater. Interfaces 2009, 1, (2), 289-300.
40. Qian, Y.; Lindsay, C. I.; Macosko, C.; Stein, A., Synthesis and Properties of Vermiculite-
Reinforced Polyurethane Nanocomposites. Acs Appl. Mater. Interfaces 2011, 3, (9), 3709-17.
41. Ouyang, C. F.; Gong, B.; Gao, Q., Nanocomposite Reinforcement Effects in Millable
Polyurethane Elastomer with Low Content of Halloysite Nanotubes. International Conference on
Material Sci. Appl. 2015, 68(4), 668-683.
Page 27 of 28
ACS Paragon Plus Environment
Biomacromolecules
123456789101112131415161718192021222324252627282930313233343536373839404142434445464748495051525354555657585960

28
For Table of Contents Use Only.
Superior Performance of Polyurethane Based on Melanin Nanoparticles
Induced Phase Separation
Yang Wang, Ting Li, Xuefei Wang, Piming Ma, Huiyu Bai, Weifu Dong*, Yi Xie, Mingqing
Chen*
* Corresponding author. Weifu Dong* E-mail: [email protected].
Mingqing Chen* E-mail: [email protected]
PU/melanin nanocomposites with high tensile strength and toughness are successfully prepared
in the presence of natural melanin by in situ polymerization.
GRAPHICAL ABSTRACT FIGURE
Page 28 of 28
ACS Paragon Plus Environment
Biomacromolecules
123456789101112131415161718192021222324252627282930313233343536373839404142434445464748495051525354555657585960
![Melanin Translation[1]](https://static.fdocuments.in/doc/165x107/577d22411a28ab4e1e96f1ae/melanin-translation1.jpg)